dire straits for central bankers - custprd.comcustprd.com/rsch/velocity.pdfdire straits for central...
TRANSCRIPT
P a g e | 1 www.custprd.com
Hong Kong Tokyo
Salt Lake City
Dire Straits for central bankers
Money for nothing brothers in arms are out of ammunition 17th June 2016
Mike Newman
It is a clash of titans between
economic theory and
social reality
Social disruption
7 realities in today’s
markets
Executive Summary Better to sit down. We will be entering some pretty bleak conclusions in this report. The world’s
central banks have hit stall speed. They have lost control and do not have enough altitude to
recover. How bad can things get? There are two things at play here. One is economic (explicitly
monetary) policy. The other is social reality (explicitly hardship). Both have become dysfunctional.
Reckless central bank monetary expansion sold behind the banner of ‘nothing to see here’ has
backfired. Money velocity (or the power of money) across the globe is plummeting to record lows.
While the GFC was easily avoidable the post disaster mop up operation consists of printing our
way out of the disastrous debt pile by inflating it away. Even negative interest rates leave inflation
well below targets. Deflation still prevails. Poverty and post-GFC destitution has reached boiling
point. When people feel robbed of their identity and increasingly their democracy we should not be
surprised to see the rise of nationalism and non mainstream candidates and sadly violence,
especially in Europe. This social disruption should not be ignored because the experimental
financial engineering that was supposed to wiggle us from the bondage of moral hazard has had
the complete opposite effect.
Here are 7 things to ponder;
1) A recent US Federal Reserve survey found that 47% of Americans couldn’t raise $400 in
emergency cash were the need to arise. 5% unemployment rate belies financial
difficulties.
2) A banksurvey in Australia showed 50% of people wouldn’t be able to meet their financial
obligations if unemployed for more than 3 months. Housing price to income ratio almost
twice the level pre-GFC. Private debt: GDP ratio at 160%. Credit rating downgrade
imminent.
3) c.60% of ETF purchases in Japan and c. 100% of sovereign bond purchases are bought
by the Bank of Japan which now owns 38% of outstanding government debt. 15 year
Japanese government bonds now yield -0.004%. Japan’s move to negative rates has
caused a run on sales of mini-vaults as people look to store their own cash.
4) M2/M3 money velocity has hit all time lows in the US, ECB, Australia, China & Japan.
5) Italian banks non performing loans (NPLs) are approaching 20% and as high as 50% in
the south of the country. The ECB is breaching their own covenants to hide the mess.
Belgian Optima Bank has just been shut down for not being able to meet obligations.
Many more?
6) Over 25% of those in the EU live below the poverty line and youth unemployment is c.25%
with long term unemployment now 50%. In Greece those numbers are 36%, 58% and
P a g e | 2 www.custprd.com
Hong Kong Tokyo
Salt Lake City
Money velocity is
falling
Confidence is faltering
Central banks
continue to burn lower
quality
Companies invest when they see the
cycle
sense of déjà vu
Manipulated
markets
History often lies in the
non-consensus
view
History often sides against
the consensus
view
72%.
7) China’s industrial sector among others shows clear signs of recording sales without much
hope of being paid with receivables ballooning in some cases leaping to over 5 years of
reported revenue pointing to a sharp uptick in corporate debt insolvency & NPLs to follow.
Central banks have not only lost the battle with monetary policy they’ve lost the war. Of
course we will hear otherwise in the media and reserve bank press releases. Money velocity
continues to decline despite central banks pumping more into the system on the expectation
growth will come. Of course velocity will mathematically fall when central banks are monetising
debt at the aggressive clip they are. However one word ‘confidence’ is the only thing that keeps
any financial system from collapsing. Sadly we are rapidly approaching the date that central banks
lose that trust. There is plenty of evidence to suggest this is already happening. Confidence relies
on trust. Without it market participants seek refuge wherever they can find it.
Simply put, central bankers continue to pour lower and lower grade lumps of coal into a top fuel
dragster engine (aka the global economy) and still expect it to shatter record times in the quarter-
mile. Sadly the only thing that is set to shatter is the internals of that engine. Declining velocity is
the failed result of trying to create more power from a knackered engine in need of a major
overhaul. The engine will simply suffer a catastrophic failure. It is not a matter of if, but when.
The ECB and BoJ have been explicit in imposing negative rates for the simple idea that punitive
rates will encourage banks to take on riskier lending. Flooding the system with liquidity is not
having the expected impact of priming the economy. Companies and people invest because
they have a clear vision of the future not because rates are low. The BoJ is buying up ETFs at
such a frenetic pace that in time Japanese corporates will become state owned enterprises
eventually.
Markets are supposed to be all about the ‘invisible hand’ but never have we reached a point of so
much proactive manipulation of currency, credit and equity markets. The discount rates pursued
by central banks have only fuelled the overcapacity that prevents us escaping deflation. This déjà
vu in markets reminds me of 2001. There are times I sit back like Michael J. Burry M.D. and
wonder to myself “this isn’t crazy. It’s logical!”
I recall being laughed out of court when I told many of my clients and colleagues in late 2001 that
Greenspan would go down in history as one of the most hated central bankers. The criticism I
copped only exacerbated after pundits labeled him ‘Maestro’ and Her Majesty bestowed him with
a knighthood in 2002. To me it confirmed all this would go to his head and it would be carte
blanche to ‘experiment’ with monetary policy. Investors and politicians alike waited with bated
breath on his next musings. While I never expected markets to implode in 2002, I stuck resolutely
by my criticism of his time at the helm of The Fed because I could clearly visualise the downside
of reckless experiments to see whether the world could be printed out of trouble.
Let us not forget that history has at times proven not to be on the side of conventional wisdom, or
the consensus view, but on the side of those who dissented from them. More significantly, the
media and financial community failed by not being rigorous and questioning enough, resulting in
many anomalies taking too long to be discovered. We have seen so often that the time of
greatest certainty is, in fact, the time to be most sceptical. If we spent more time on biopsies in
journalism, as Adrianna Huffington suggested, there would be far fewer autopsies.
P a g e | 3 www.custprd.com
Hong Kong Tokyo
Salt Lake City
Wild distortion of
asset values
Divergence of asset markets
We never recovered
from the GFC
World Bank trims global
growth again
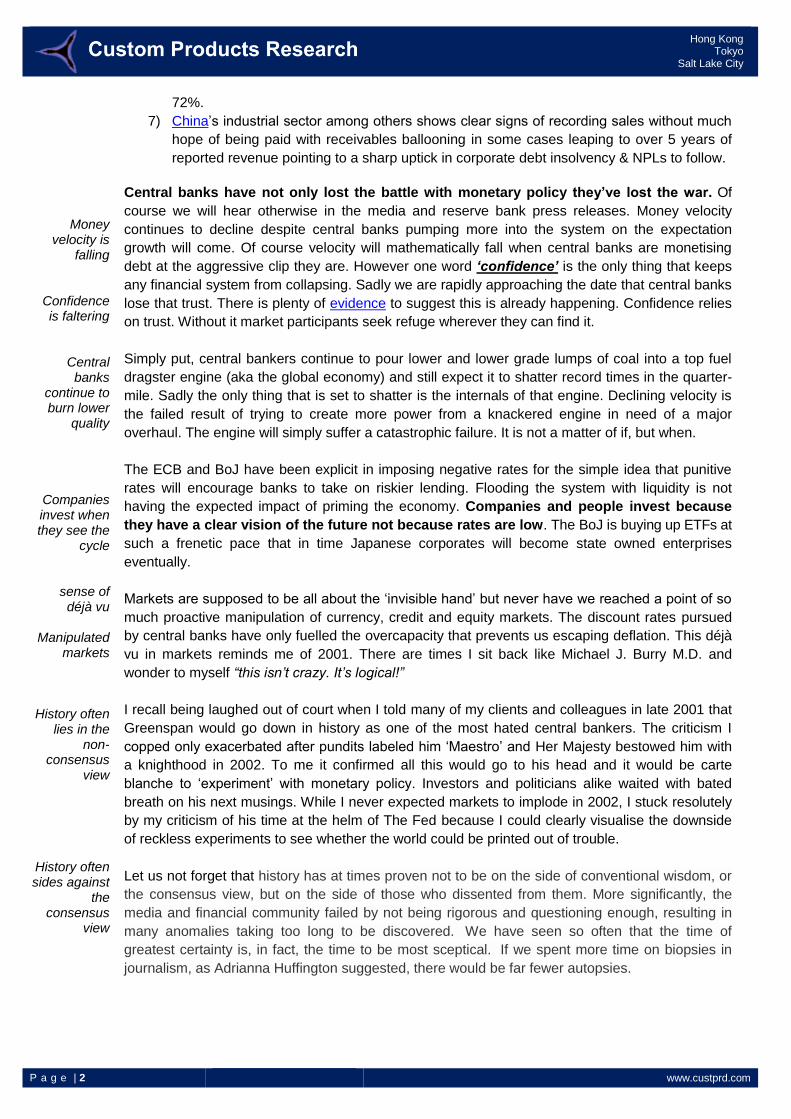
What this excess liquidity has led to is wild distortions in asset values. With over $10 trillion of
sovereign bonds yielding less than zero interest, bond investors are forced to move further out the
yield curve which carries even more risk when taking duration into account. With some equity
markets approaching all time highs the smart money would appear to be to switch into precious
metals, primarily gold. These have been some of the worst performing assets and in a world
where mean reversion is long overdue the relative outperformance should be striking.
How markets have behaved since 2010
Fig.1 we can see the divergence in the performance of asset markets. S&P500 and world equities
have performed while precious metals have slid off the radar. Although they have rebounded in
recent times perhaps reflecting the overbought nature of asset markets.
Fig. 1 : Divergence in asset markets – but mean reversion seems to be returning
Source: Custom Products Research
The world has never really recovered from the Global Financial Crisis (GFC). We only pretend it
has while we graze on a constant diet of cheer-leading social media headlines appealing to the
idea that everything will be ok. The sad reality is the more and more morphine that is injected into
markets the less and less ability there is to create a sustainable recovery independent of life
support.
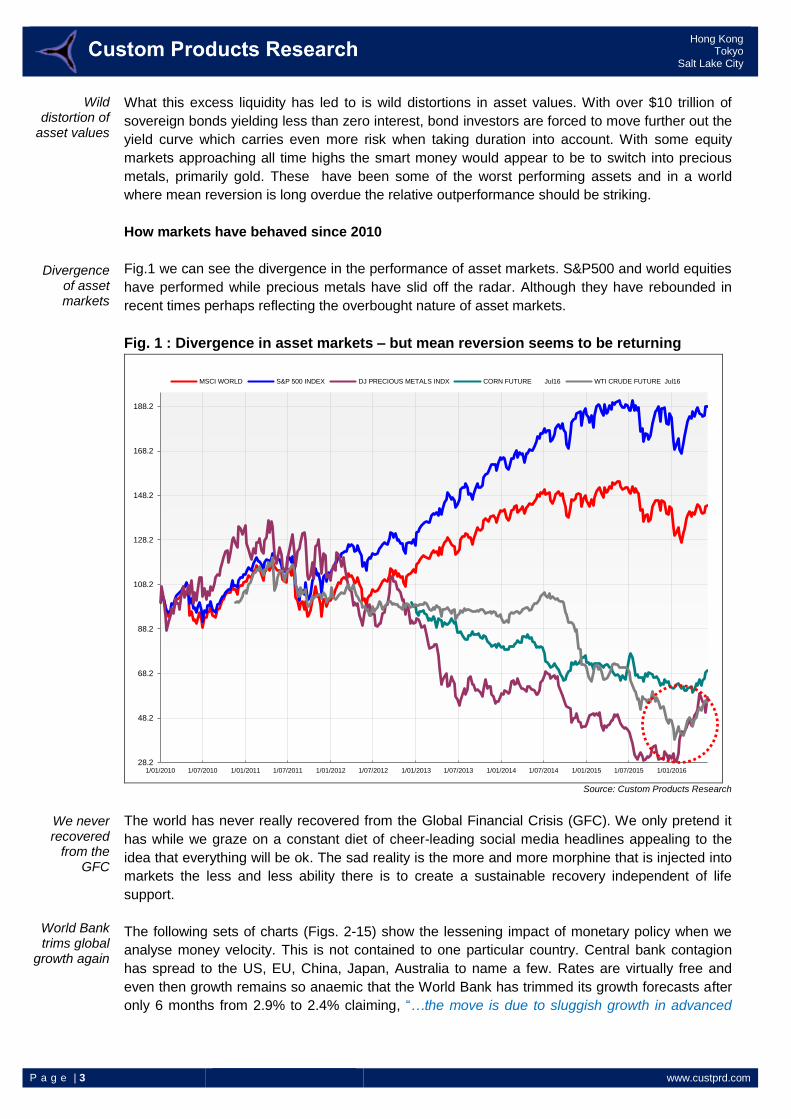
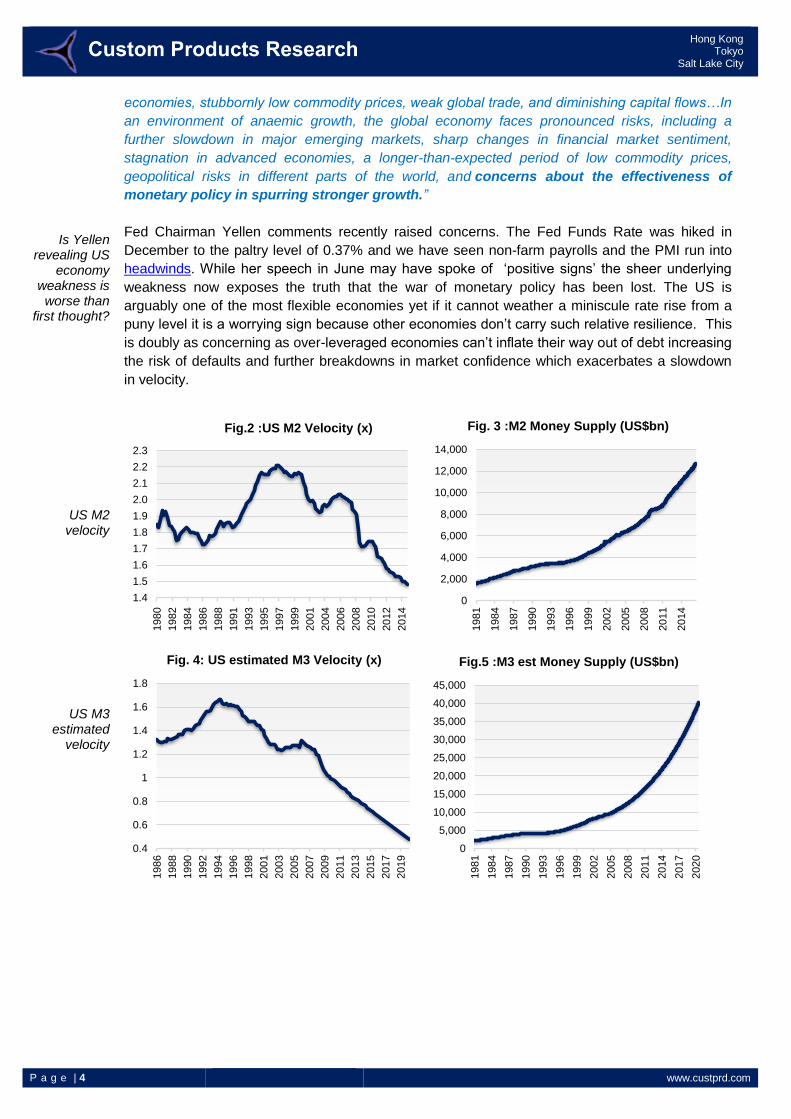
The following sets of charts (Figs. 2-15) show the lessening impact of monetary policy when we
analyse money velocity. This is not contained to one particular country. Central bank contagion
has spread to the US, EU, China, Japan, Australia to name a few. Rates are virtually free and
even then growth remains so anaemic that the World Bank has trimmed its growth forecasts after
only 6 months from 2.9% to 2.4% claiming, “…the move is due to sluggish growth in advanced
28.2
48.2
68.2
88.2
108.2
128.2
148.2
168.2
188.2
1/01/2010 1/07/2010 1/01/2011 1/07/2011 1/01/2012 1/07/2012 1/01/2013 1/07/2013 1/01/2014 1/07/2014 1/01/2015 1/07/2015 1/01/2016
MSCI WORLD S&P 500 INDEX DJ PRECIOUS METALS INDX CORN FUTURE Jul16 WTI CRUDE FUTURE Jul16
P a g e | 4 www.custprd.com
Hong Kong Tokyo
Salt Lake City
Is Yellen revealing US
economy weakness is worse than
first thought?
US M2 velocity
US M3 estimated
velocity
economies, stubbornly low commodity prices, weak global trade, and diminishing capital flows…In
an environment of anaemic growth, the global economy faces pronounced risks, including a
further slowdown in major emerging markets, sharp changes in financial market sentiment,
stagnation in advanced economies, a longer-than-expected period of low commodity prices,
geopolitical risks in different parts of the world, and concerns about the effectiveness of
monetary policy in spurring stronger growth.”
Fed Chairman Yellen comments recently raised concerns. The Fed Funds Rate was hiked in
December to the paltry level of 0.37% and we have seen non-farm payrolls and the PMI run into
headwinds. While her speech in June may have spoke of ‘positive signs’ the sheer underlying
weakness now exposes the truth that the war of monetary policy has been lost. The US is
arguably one of the most flexible economies yet if it cannot weather a miniscule rate rise from a
puny level it is a worrying sign because other economies don’t carry such relative resilience. This
is doubly as concerning as over-leveraged economies can’t inflate their way out of debt increasing
the risk of defaults and further breakdowns in market confidence which exacerbates a slowdown
in velocity.
1.4
1.5
1.6
1.7
1.8
1.9
2.0
2.1
2.2
2.3
1980
1982
1984
1986
1988
1991
1993
1995
1997
1999
2001
2004
2006
2008
2010
2012
2014
Fig.2 :US M2 Velocity (x)
0
2,000
4,000
6,000
8,000
10,000
12,000
14,000
1981
1984
1987
1990
1993
1996
1999
2002
2005
2008
2011
2014
Fig. 3 :M2 Money Supply (US$bn)
0.4
0.6
0.8
1
1.2
1.4
1.6
1.8
1986
1988
1990
1992
1994
1996
1998
2001
2003
2005
2007
2009
2011
2013
2015
2017
2019
Fig. 4: US estimated M3 Velocity (x)
0
5,000
10,000
15,000
20,000
25,000
30,000
35,000
40,000
45,000
1981
1984
1987
1990
1993
1996
1999
2002
2005
2008
2011
2014
2017
2020
Fig.5 :M3 est Money Supply (US$bn)
P a g e | 5 www.custprd.com
Hong Kong Tokyo
Salt Lake City
EU M3 Velocity
UK moderation
working?
UK M3
Aussie M3
Source: Federal Reserve, St Louis Federal Reserve, Bloomberg, Custom Products Research
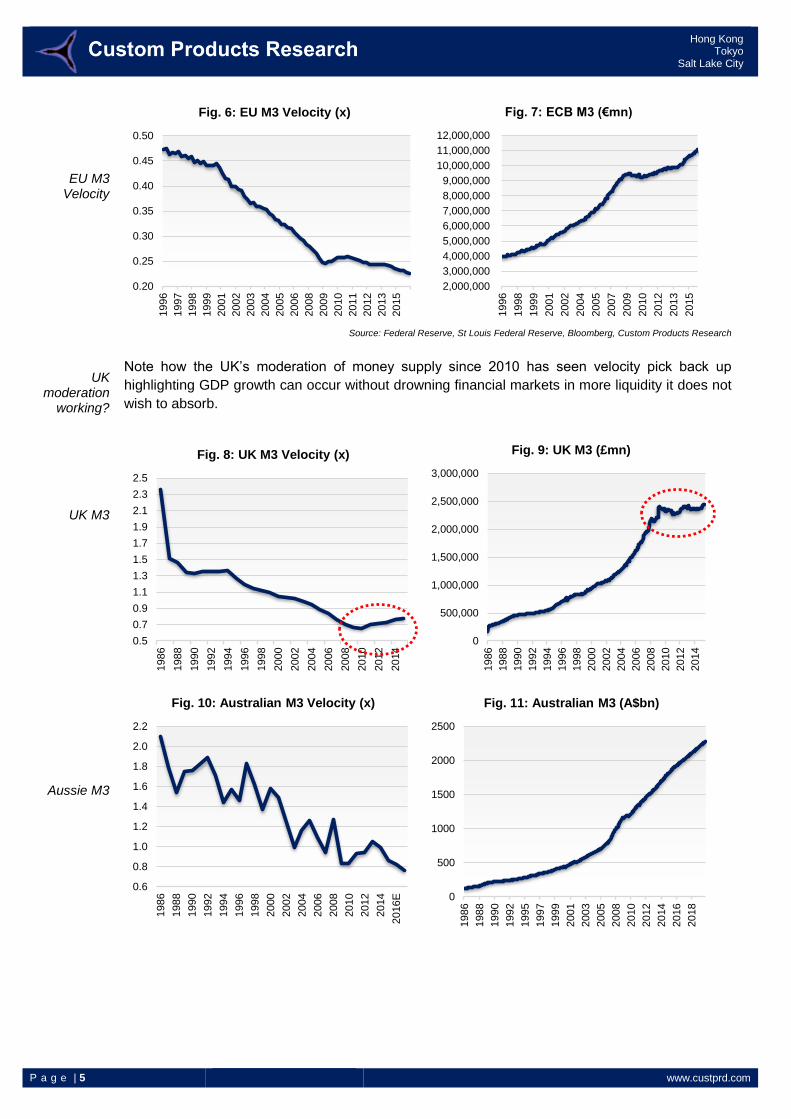
Note how the UK’s moderation of money supply since 2010 has seen velocity pick back up
highlighting GDP growth can occur without drowning financial markets in more liquidity it does not
wish to absorb.
0.20
0.25
0.30
0.35
0.40
0.45
0.50
1996
1997
1998
1999
2001
2002
2003
2004
2005
2006
2008
2009
2010
2011
2012
2013
2015
Fig. 6: EU M3 Velocity (x)
2,000,000
3,000,000
4,000,000
5,000,000
6,000,000
7,000,000
8,000,000
9,000,000
10,000,000
11,000,000
12,000,000
1996
1998
1999
2001
2002
2004
2005
2007
2009
2010
2012
2013
2015
Fig. 7: ECB M3 (€mn)
0.5
0.7
0.9
1.1
1.3
1.5
1.7
1.9
2.1
2.3
2.5
1986
1988
1990
1992
1994
1996
1998
2000
2002
2004
2006
2008
2010
2012
2014
Fig. 8: UK M3 Velocity (x)
0
500,000
1,000,000
1,500,000
2,000,000
2,500,000
3,000,000
1986
1988
1990
1992
1994
1996
1998
2000
2002
2004
2006
2008
2010
2012
2014
Fig. 9: UK M3 (£mn)
0.6
0.8
1.0
1.2
1.4
1.6
1.8
2.0
2.2
1986
1988
1990
1992
1994
1996
1998
2000
2002
2004
2006
2008
2010
2012
2014
2016E
Fig. 10: Australian M3 Velocity (x)
0
500
1000
1500
2000
2500
1986
1988
1990
1992
1995
1997
1999
2001
2003
2005
2008
2010
2012
2014
2016
2018
Fig. 11: Australian M3 (A$bn)
P a g e | 6 www.custprd.com
Hong Kong Tokyo
Salt Lake City
China M3
RMB8 to make RMB1
China debt:GDP
Japan M3
Velocity at record lows
for the lot
Restlessness in the ranks
Source: Federal Reserve, St Louis Federal Reserve, Bloomberg, Custom Products Research
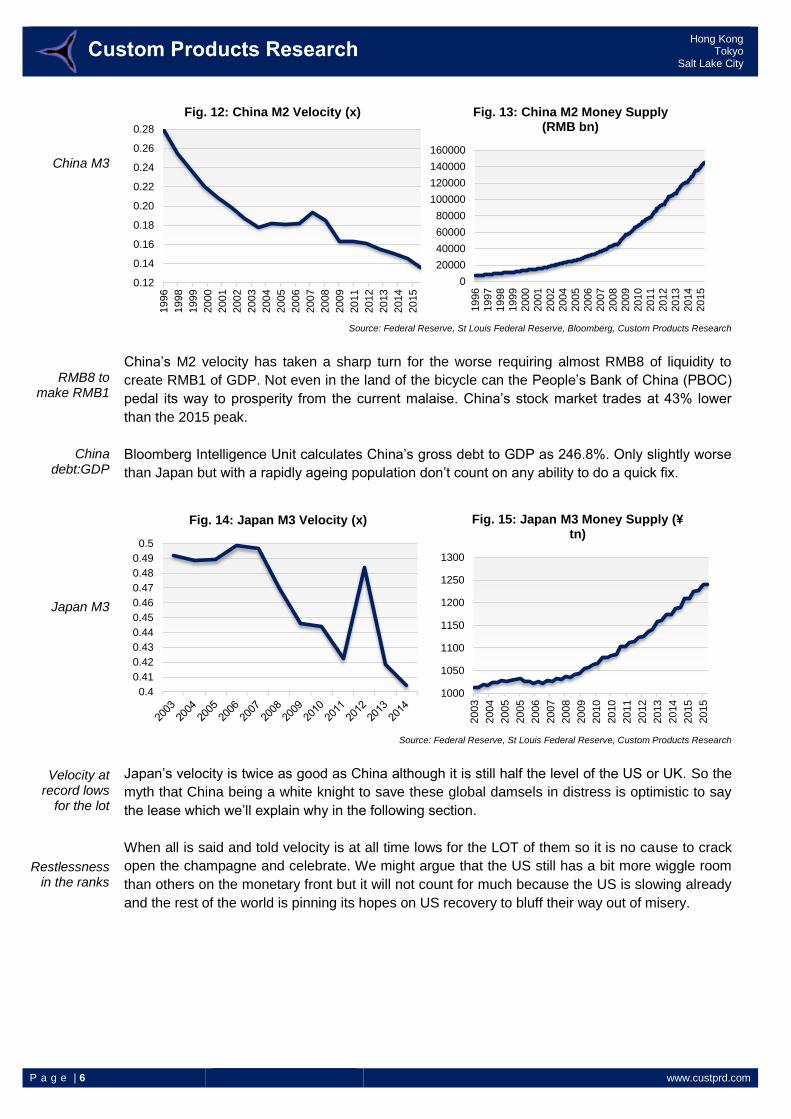
China’s M2 velocity has taken a sharp turn for the worse requiring almost RMB8 of liquidity to
create RMB1 of GDP. Not even in the land of the bicycle can the People’s Bank of China (PBOC)
pedal its way to prosperity from the current malaise. China’s stock market trades at 43% lower
than the 2015 peak.
Bloomberg Intelligence Unit calculates China’s gross debt to GDP as 246.8%. Only slightly worse
than Japan but with a rapidly ageing population don’t count on any ability to do a quick fix.
Source: Federal Reserve, St Louis Federal Reserve, Custom Products Research
Japan’s velocity is twice as good as China although it is still half the level of the US or UK. So the
myth that China being a white knight to save these global damsels in distress is optimistic to say
the lease which we’ll explain why in the following section.
When all is said and told velocity is at all time lows for the LOT of them so it is no cause to crack
open the champagne and celebrate. We might argue that the US still has a bit more wiggle room
than others on the monetary front but it will not count for much because the US is slowing already
and the rest of the world is pinning its hopes on US recovery to bluff their way out of misery.
0.12
0.14
0.16
0.18
0.20
0.22
0.24
0.26
0.28
1996
1998
1999
2000
2001
2002
2003
2004
2005
2006
2007
2008
2009
2011
2012
2013
2014
2015
Fig. 12: China M2 Velocity (x)
0
20000
40000
60000
80000
100000
120000
140000
160000
1996
1997
1998
1999
2000
2001
2002
2004
2005
2006
2007
2008
2009
2010
2011
2012
2013
2014
2015
Fig. 13: China M2 Money Supply (RMB bn)
0.4
0.41
0.42
0.43
0.44
0.45
0.46
0.47
0.48
0.49
0.5
Fig. 14: Japan M3 Velocity (x)
1000
1050
1100
1150
1200
1250
1300
2003
2004
2005
2005
2006
2007
2008
2009
2010
2010
2011
2012
2013
2014
2015
2015
Fig. 15: Japan M3 Money Supply (¥ tn)
P a g e | 7 www.custprd.com
Hong Kong Tokyo
Salt Lake City
Japan owns 38% of its
own sovereign
debt
It isn’t all bad
Sweden’s example was
successful (so far)
except for inflation
Money velocity will keep falling if monetisation continues but be wary of ‘Confidence’
Money velocity will naturally decline if debt monetisation continues at the pace it is. Japan now
owns 38% of its own sovereign debt. It could buy up all the debt threoretically over time.
Sovereign auctions are becoming so parlous that Japan’s largest financial institution, Tokyo
Mitusbishi UFJ Bank, is mulling handing in its primary dealer membership. Although symbolic
there are rumblings some others will follow. It is a sign of eroding confidence and a back handed
slap for the Bank of Japan especially given the typically orderly nature of local financial institutions
to central direction.
Let’s face it, if banks are becoming mere intermediaries between the treasuries and central banks
because private sector demand is all but non existent due to negative rates then there is little
incentive to participate. Now that 15 year Japanese sovereign debt is trading at negative rates, the
problem is that anyone wanting to find positive yield assumes higher duration risk by moving out
the curve to later dated maturities.
It is not all bad. My colleague Rob Rowland wrote with respect to negative interest rates in his
‘BOJ- Saved by (sub) zero’ piece of Feb 2016 that,
“Negative interest rates were first suggested at the end of the 19th century by Silvio Gesell, an
economist and short-lived Bavarian Finance minister. Gesell argued that a stamp tax or ‘negative
interest was necessary to prevent people from hoarding currency in times of financial stress. With
the GFC, Gesell’s work has taken on increased relevance, gaining new converts, advocating
some type of ‘stamp tax’ to encourage lending, spending and an increase in the velocity of money.
The BOJ has now become the fifth major central bank to adopt negative interest rates since the
end of the financial crisis, something inconceivable 10 years ago.”
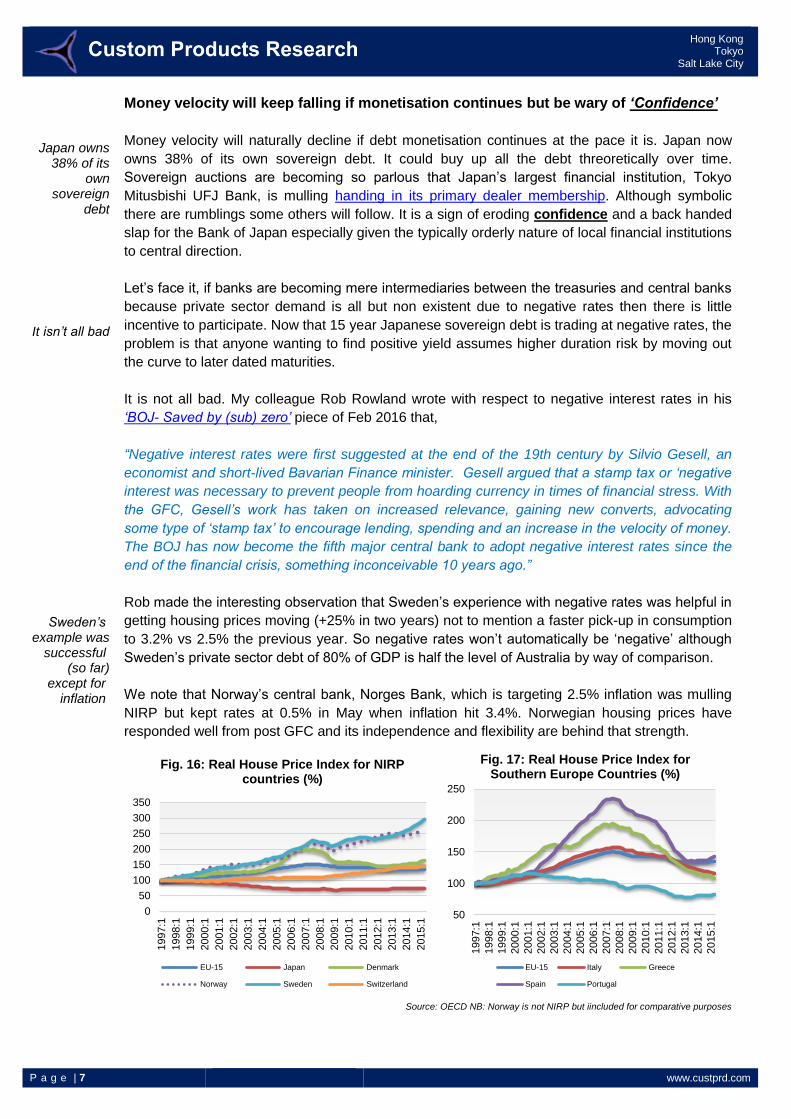
Rob made the interesting observation that Sweden’s experience with negative rates was helpful in
getting housing prices moving (+25% in two years) not to mention a faster pick-up in consumption
to 3.2% vs 2.5% the previous year. So negative rates won’t automatically be ‘negative’ although
Sweden’s private sector debt of 80% of GDP is half the level of Australia by way of comparison.
We note that Norway’s central bank, Norges Bank, which is targeting 2.5% inflation was mulling
NIRP but kept rates at 0.5% in May when inflation hit 3.4%. Norwegian housing prices have
responded well from post GFC and its independence and flexibility are behind that strength.
Source: OECD NB: Norway is not NIRP but iincluded for comparative purposes
0
50
100
150
200
250
300
350
1997:1
1998:1
1999:1
2000:1
2001:1
2002:1
2003:1
2004:1
2005:1
2006:1
2007:1
2008:1
2009:1
2010:1
2011:1
2012:1
2013:1
2014:1
2015:1
Fig. 16: Real House Price Index for NIRP countries (%)
EU-15 Japan Denmark
Norway Sweden Switzerland
50
100
150
200
250
1997:1
1998:1
1999:1
2000:1
2001:1
2002:1
2003:1
2004:1
2005:1
2006:1
2007:1
2008:1
2009:1
2010:1
2011:1
2012:1
2013:1
2014:1
2015:1
Fig. 17: Real House Price Index for Southern Europe Countries (%)
EU-15 Italy Greece
Spain Portugal
P a g e | 8 www.custprd.com
Hong Kong Tokyo
Salt Lake City
Inflation undershoots
2 year bond yields
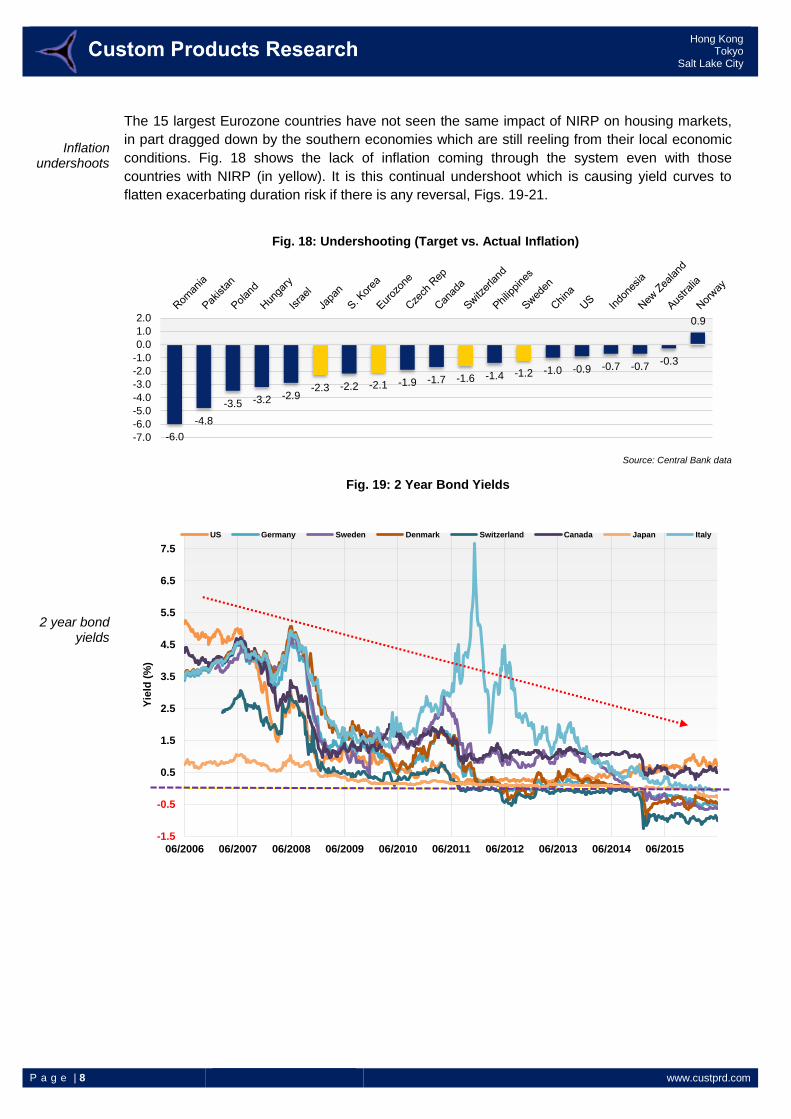
The 15 largest Eurozone countries have not seen the same impact of NIRP on housing markets,
in part dragged down by the southern economies which are still reeling from their local economic
conditions. Fig. 18 shows the lack of inflation coming through the system even with those
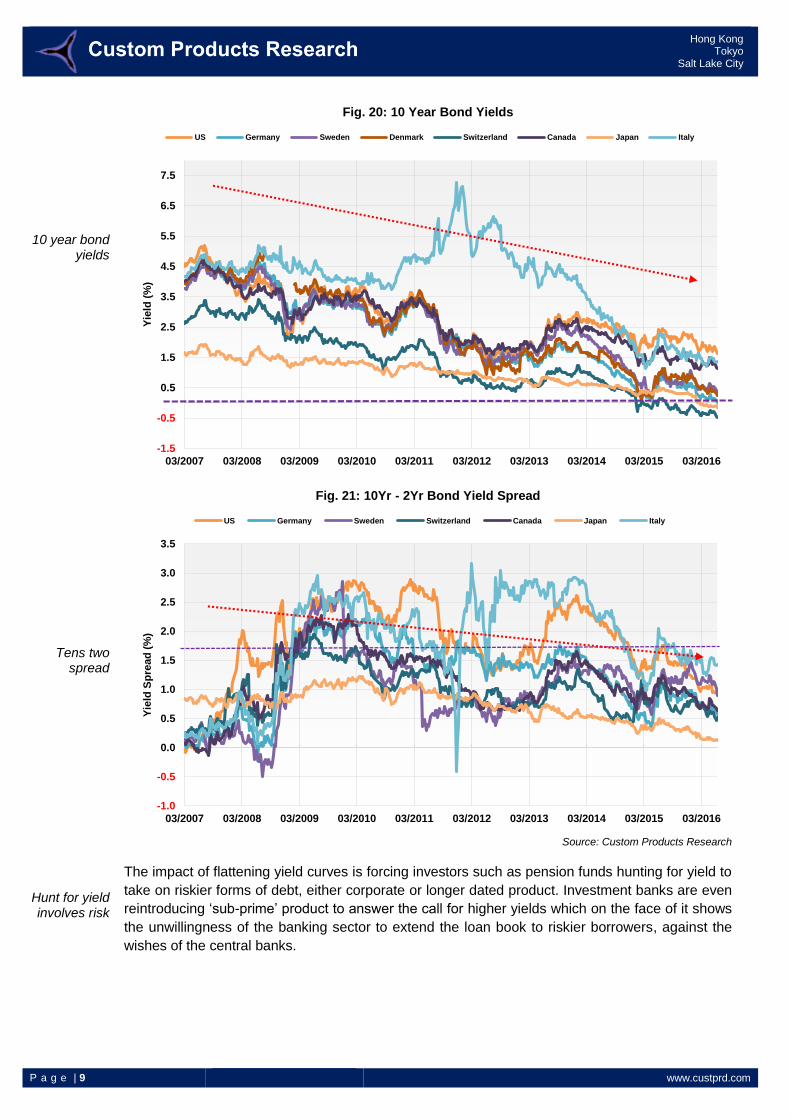
countries with NIRP (in yellow). It is this continual undershoot which is causing yield curves to
flatten exacerbating duration risk if there is any reversal, Figs. 19-21.
Source: Central Bank data
-6.0
-4.8
-3.5 -3.2 -2.9-2.3 -2.2 -2.1 -1.9 -1.7 -1.6 -1.4 -1.2 -1.0 -0.9 -0.7 -0.7
-0.3
0.9
-7.0
-6.0
-5.0
-4.0
-3.0
-2.0
-1.0
0.0
1.0
2.0
Fig. 18: Undershooting (Target vs. Actual Inflation)
-1.5
-0.5
0.5
1.5
2.5
3.5
4.5
5.5
6.5
7.5
06/2006 06/2007 06/2008 06/2009 06/2010 06/2011 06/2012 06/2013 06/2014 06/2015
Yie
ld (
%)
Fig. 19: 2 Year Bond Yields
US Germany Sweden Denmark Switzerland Canada Japan Italy
P a g e | 9 www.custprd.com
Hong Kong Tokyo
Salt Lake City
10 year bond yields
Tens two spread
Hunt for yield involves risk
Source: Custom Products Research
The impact of flattening yield curves is forcing investors such as pension funds hunting for yield to
take on riskier forms of debt, either corporate or longer dated product. Investment banks are even
reintroducing ‘sub-prime’ product to answer the call for higher yields which on the face of it shows
the unwillingness of the banking sector to extend the loan book to riskier borrowers, against the
wishes of the central banks.
-1.5
-0.5
0.5
1.5
2.5
3.5
4.5
5.5
6.5
7.5
03/2007 03/2008 03/2009 03/2010 03/2011 03/2012 03/2013 03/2014 03/2015 03/2016
Yie
ld (
%)
Fig. 20: 10 Year Bond Yields
US Germany Sweden Denmark Switzerland Canada Japan Italy
-1.0
-0.5
0.0
0.5
1.0
1.5
2.0
2.5
3.0
3.5
03/2007 03/2008 03/2009 03/2010 03/2011 03/2012 03/2013 03/2014 03/2015 03/2016
Yie
ld S
pre
ad
(%
)
Fig. 21: 10Yr - 2Yr Bond Yield Spread
US Germany Sweden Switzerland Canada Japan Italy
P a g e | 10 www.custprd.com
Hong Kong Tokyo
Salt Lake City
Banks not wanting to
take on more risk.
A recent Fed survey says
47% of Americans can’t raise $400 in an
emergency
5% UR but 40yr low
participation
Class 8 truck orders
plunging
Bloated inventories
That point is already being demonstrated by the actions of banks. Commerzbank in Germany is
considering parking its excess deposits in its own vaults than have it earn negative returns in the
vaults of the ECB. Munich Re is also of the same view. When the Japanese went to negative
rates, the country ran out of personal use safes such was the demand to avoid punitive rates.
However we must ask ourselves, has this mass monetary priming ended up helping the average
man and woman on the street?
The woe of the average Joe and Joanne…
A recent Federal Reserve survey in the US found only 53 percent of respondents indicate that
they could cover a hypothetical emergency expense costing $400 without selling something or
borrowing money. Thirty-one percent of respondents report going without some form of medical
care in the past year because they could not afford it. So that is 47% who cannot raise $400 in an
emergency. 30 million Americans are registered as having a disability. A recent ME Bank survey
in Australia found only 46 per cent of households were able to save each month. Just 32 per cent
could raise $3000 in an emergency and 50 per cent aren’t confident of meeting their obligations if
unemployed for three months.
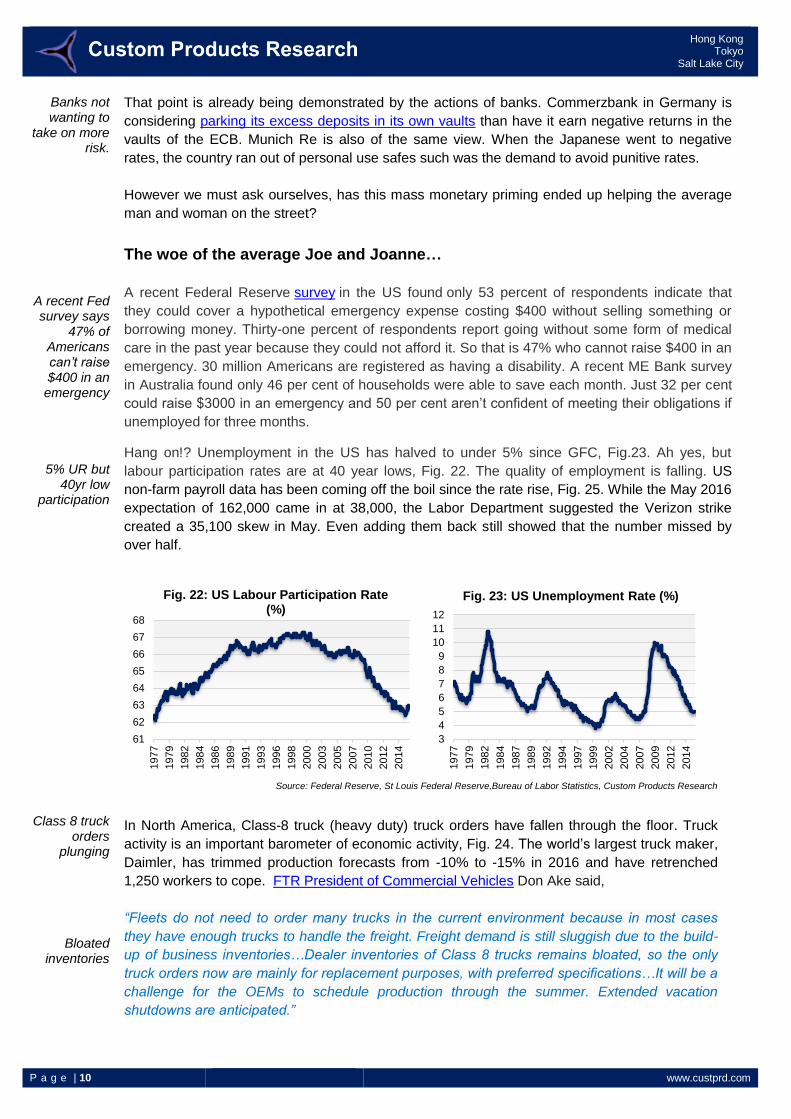
Hang on!? Unemployment in the US has halved to under 5% since GFC, Fig.23. Ah yes, but
labour participation rates are at 40 year lows, Fig. 22. The quality of employment is falling. US
non-farm payroll data has been coming off the boil since the rate rise, Fig. 25. While the May 2016
expectation of 162,000 came in at 38,000, the Labor Department suggested the Verizon strike
created a 35,100 skew in May. Even adding them back still showed that the number missed by
over half.
Source: Federal Reserve, St Louis Federal Reserve,Bureau of Labor Statistics, Custom Products Research
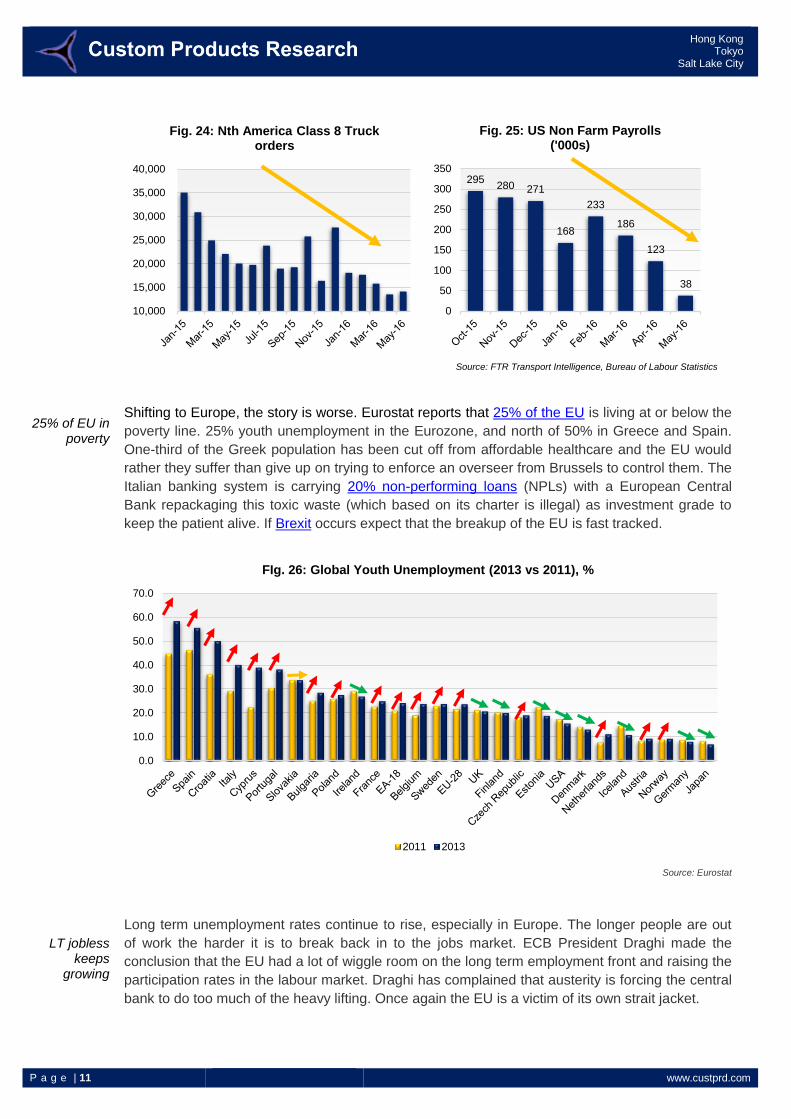
In North America, Class-8 truck (heavy duty) truck orders have fallen through the floor. Truck
activity is an important barometer of economic activity, Fig. 24. The world’s largest truck maker,
Daimler, has trimmed production forecasts from -10% to -15% in 2016 and have retrenched
1,250 workers to cope. FTR President of Commercial Vehicles Don Ake said,
“Fleets do not need to order many trucks in the current environment because in most cases
they have enough trucks to handle the freight. Freight demand is still sluggish due to the build-
up of business inventories…Dealer inventories of Class 8 trucks remains bloated, so the only
truck orders now are mainly for replacement purposes, with preferred specifications…It will be a
challenge for the OEMs to schedule production through the summer. Extended vacation
shutdowns are anticipated.”
61
62
63
64
65
66
67
68
1977
1979
1982
1984
1986
1989
1991
1993
1996
1998
2000
2003
2005
2007
2010
2012
2014
Fig. 22: US Labour Participation Rate (%)
3
4
5
6
7
8
9
10
11
12
1977
1979
1982
1984
1987
1989
1992
1994
1997
1999
2002
2004
2007
2009
2012
2014
Fig. 23: US Unemployment Rate (%)
P a g e | 11 www.custprd.com
Hong Kong Tokyo
Salt Lake City
25% of EU in poverty
LT jobless keeps
growing
Source: FTR Transport Intelligence, Bureau of Labour Statistics
Shifting to Europe, the story is worse. Eurostat reports that 25% of the EU is living at or below the
poverty line. 25% youth unemployment in the Eurozone, and north of 50% in Greece and Spain.
One-third of the Greek population has been cut off from affordable healthcare and the EU would
rather they suffer than give up on trying to enforce an overseer from Brussels to control them. The
Italian banking system is carrying 20% non-performing loans (NPLs) with a European Central
Bank repackaging this toxic waste (which based on its charter is illegal) as investment grade to
keep the patient alive. If Brexit occurs expect that the breakup of the EU is fast tracked.
Source: Eurostat
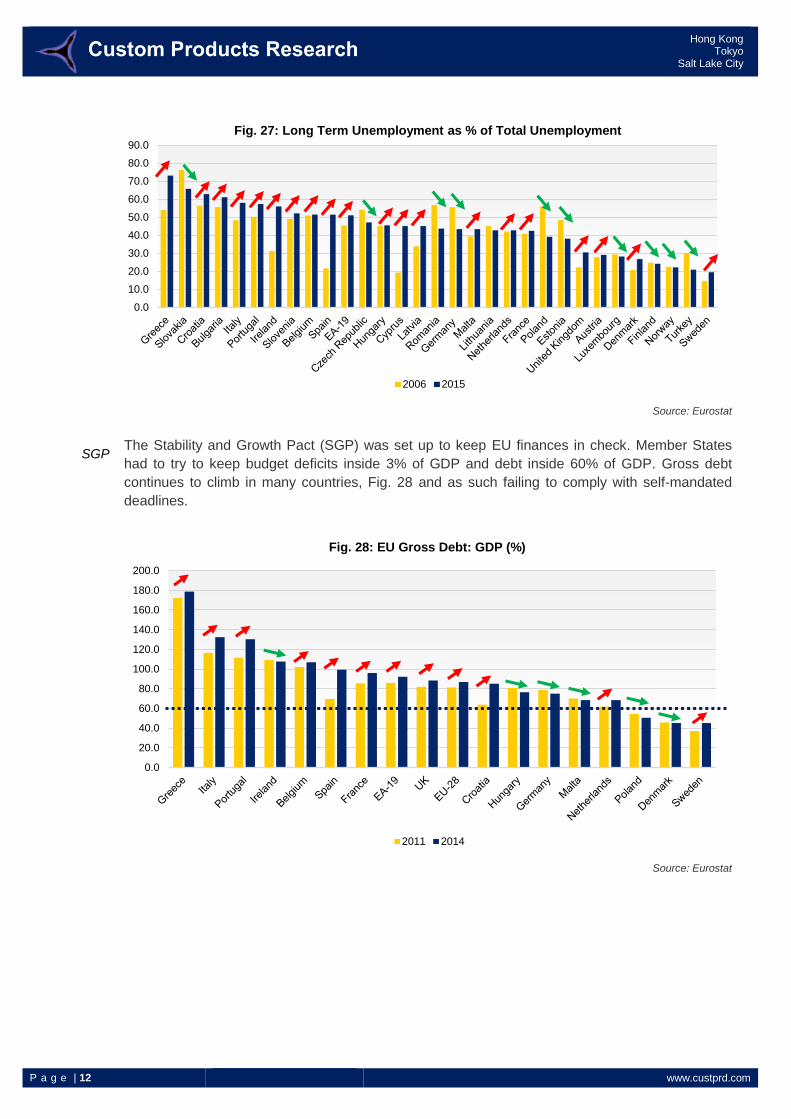
Long term unemployment rates continue to rise, especially in Europe. The longer people are out
of work the harder it is to break back in to the jobs market. ECB President Draghi made the
conclusion that the EU had a lot of wiggle room on the long term employment front and raising the
participation rates in the labour market. Draghi has complained that austerity is forcing the central
bank to do too much of the heavy lifting. Once again the EU is a victim of its own strait jacket.
10,000
15,000
20,000
25,000
30,000
35,000
40,000
Fig. 24: Nth America Class 8 Truck orders
295280 271
168
233
186
123
38
0
50
100
150
200
250
300
350
Fig. 25: US Non Farm Payrolls ('000s)
0.0
10.0
20.0
30.0
40.0
50.0
60.0
70.0
FIg. 26: Global Youth Unemployment (2013 vs 2011), %
2011 2013
P a g e | 12 www.custprd.com
Hong Kong Tokyo
Salt Lake City
SGP
Source: Eurostat
The Stability and Growth Pact (SGP) was set up to keep EU finances in check. Member States
had to try to keep budget deficits inside 3% of GDP and debt inside 60% of GDP. Gross debt
continues to climb in many countries, Fig. 28 and as such failing to comply with self-mandated
deadlines.
Source: Eurostat
0.0
10.0
20.0
30.0
40.0
50.0
60.0
70.0
80.0
90.0
Fig. 27: Long Term Unemployment as % of Total Unemployment
2006 2015
0.0
20.0
40.0
60.0
80.0
100.0
120.0
140.0
160.0
180.0
200.0
Fig. 28: EU Gross Debt: GDP (%)
2011 2014
P a g e | 13 www.custprd.com
Hong Kong Tokyo
Salt Lake City
Global jobless rates
rising
Japanese pensioners
breaking into prison
Source: Eurostat
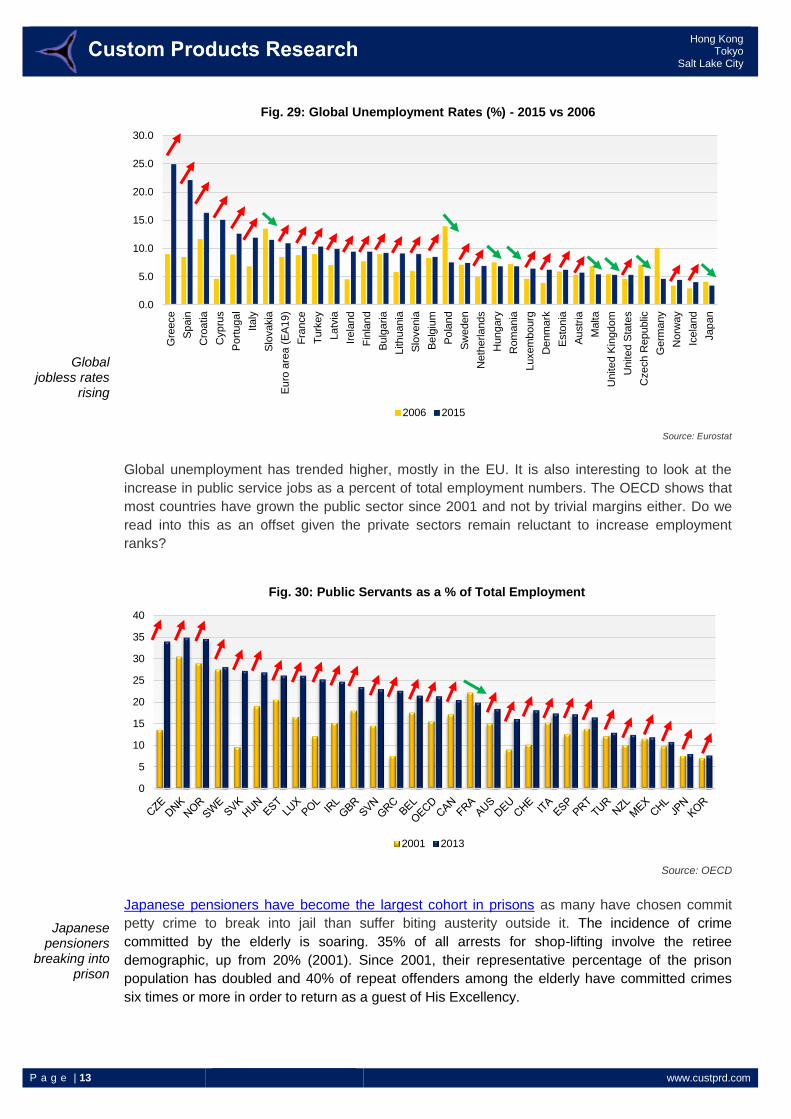
Global unemployment has trended higher, mostly in the EU. It is also interesting to look at the
increase in public service jobs as a percent of total employment numbers. The OECD shows that
most countries have grown the public sector since 2001 and not by trivial margins either. Do we
read into this as an offset given the private sectors remain reluctant to increase employment
ranks?
Source: OECD
Japanese pensioners have become the largest cohort in prisons as many have chosen commit
petty crime to break into jail than suffer biting austerity outside it. The incidence of crime
committed by the elderly is soaring. 35% of all arrests for shop-lifting involve the retiree
demographic, up from 20% (2001). Since 2001, their representative percentage of the prison
population has doubled and 40% of repeat offenders among the elderly have committed crimes
six times or more in order to return as a guest of His Excellency.
0.0
5.0
10.0
15.0
20.0
25.0
30.0
Gre
ece
Sp
ain
Cro
atia
Cyp
rus
Po
rtuga
l
Italy
Slo
vakia
Eu
ro a
rea (
EA
19)
Fra
nce
Tu
rkey
Latv
ia
Irela
nd
Fin
lan
d
Bu
lga
ria
Lith
uania
Slo
venia
Be
lgiu
m
Po
lan
d
Sw
eden
Neth
erla
nds
Hungary
Rom
ania
Luxem
bourg
Denm
ark
Esto
nia
Au
str
ia
Ma
lta
United K
ingdom
United S
tate
s
Cze
ch R
epublic
Germ
any
Norw
ay
Icela
nd
Jap
an
Fig. 29: Global Unemployment Rates (%) - 2015 vs 2006
2006 2015
0
5
10
15
20
25
30
35
40
Fig. 30: Public Servants as a % of Total Employment
2001 2013
P a g e | 14 www.custprd.com
Hong Kong Tokyo
Salt Lake City
Jobs market is not easy as society
ages
Part time growth in
Japan
The smell of fear
Source: National Police Agency
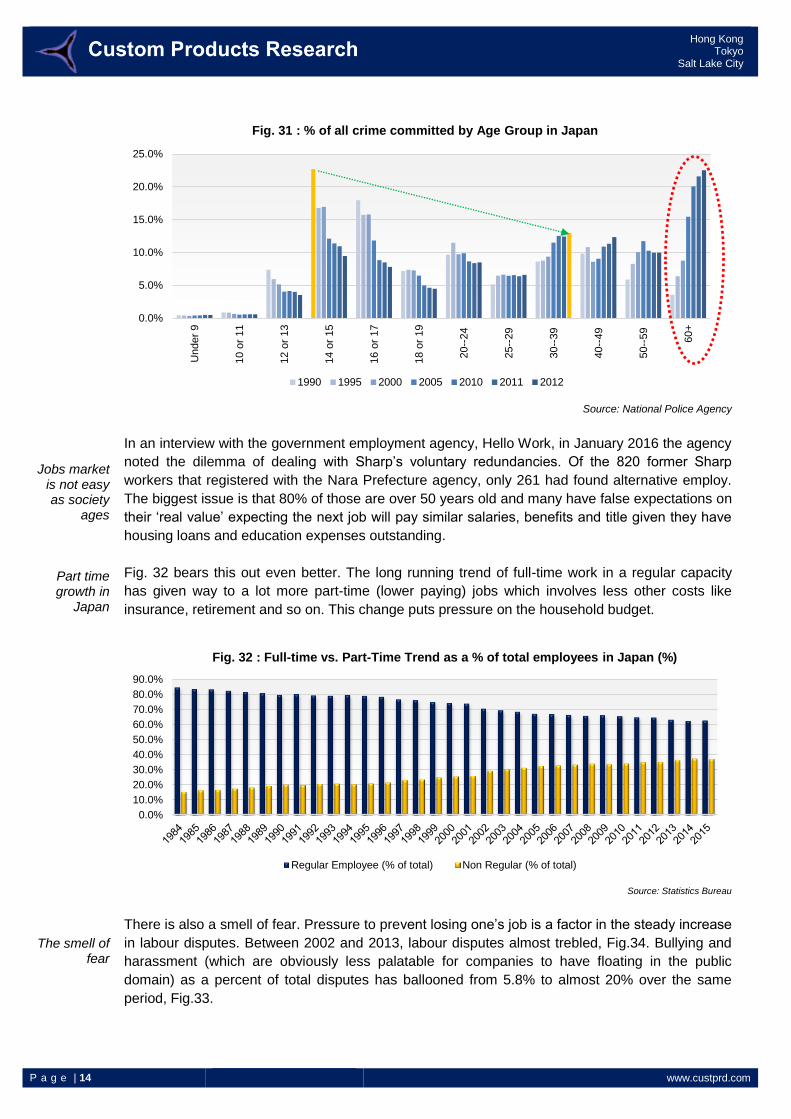
In an interview with the government employment agency, Hello Work, in January 2016 the agency
noted the dilemma of dealing with Sharp’s voluntary redundancies. Of the 820 former Sharp
workers that registered with the Nara Prefecture agency, only 261 had found alternative employ.
The biggest issue is that 80% of those are over 50 years old and many have false expectations on
their ‘real value’ expecting the next job will pay similar salaries, benefits and title given they have
housing loans and education expenses outstanding.
Fig. 32 bears this out even better. The long running trend of full-time work in a regular capacity
has given way to a lot more part-time (lower paying) jobs which involves less other costs like
insurance, retirement and so on. This change puts pressure on the household budget.
Source: Statistics Bureau
There is also a smell of fear. Pressure to prevent losing one’s job is a factor in the steady increase
in labour disputes. Between 2002 and 2013, labour disputes almost trebled, Fig.34. Bullying and
harassment (which are obviously less palatable for companies to have floating in the public
domain) as a percent of total disputes has ballooned from 5.8% to almost 20% over the same
period, Fig.33.
0.0%
5.0%
10.0%
15.0%
20.0%
25.0%
Under
9
10 o
r 11
12 o
r 13
14 o
r 15
16 o
r 17
18 o
r 19
20--
24
25--
29
30--
39
40--
49
50--
59
60+
Fig. 31 : % of all crime committed by Age Group in Japan
1990 1995 2000 2005 2010 2011 2012
0.0%
10.0%
20.0%
30.0%
40.0%
50.0%
60.0%
70.0%
80.0%
90.0%
Fig. 32 : Full-time vs. Part-Time Trend as a % of total employees in Japan (%)
Regular Employee (% of total) Non Regular (% of total)
P a g e | 15 www.custprd.com
Hong Kong Tokyo
Salt Lake City
Leverage has doubled in 16 years
Debt levels ever more
sensitive to rate changes
Source: Japan Institute for Labour Policy & Training
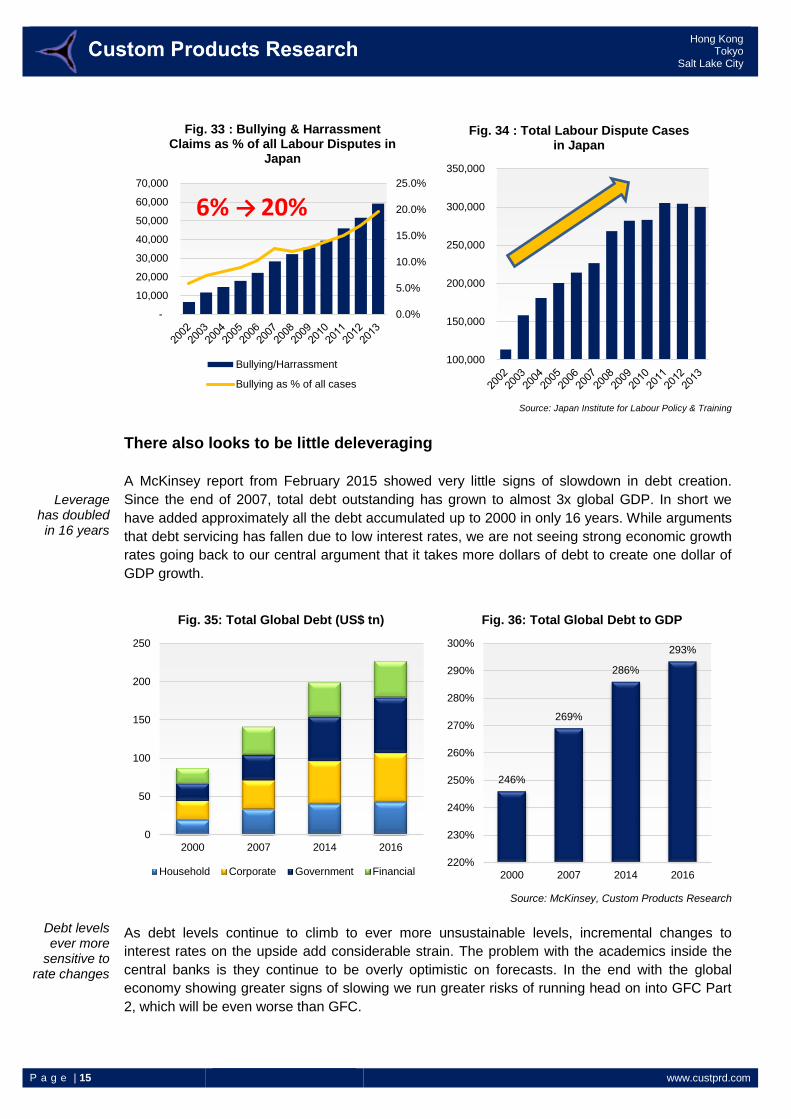
There also looks to be little deleveraging
A McKinsey report from February 2015 showed very little signs of slowdown in debt creation.
Since the end of 2007, total debt outstanding has grown to almost 3x global GDP. In short we
have added approximately all the debt accumulated up to 2000 in only 16 years. While arguments
that debt servicing has fallen due to low interest rates, we are not seeing strong economic growth
rates going back to our central argument that it takes more dollars of debt to create one dollar of
GDP growth.
Source: McKinsey, Custom Products Research
As debt levels continue to climb to ever more unsustainable levels, incremental changes to
interest rates on the upside add considerable strain. The problem with the academics inside the
central banks is they continue to be overly optimistic on forecasts. In the end with the global
economy showing greater signs of slowing we run greater risks of running head on into GFC Part
2, which will be even worse than GFC.
0.0%
5.0%
10.0%
15.0%
20.0%
25.0%
-
10,000
20,000
30,000
40,000
50,000
60,000
70,000
Fig. 33 : Bullying & Harrassment Claims as % of all Labour Disputes in
Japan
Bullying/Harrassment
Bullying as % of all cases
6% → 20%
100,000
150,000
200,000
250,000
300,000
350,000
Fig. 34 : Total Labour Dispute Cases in Japan
0
50
100
150
200
250
2000 2007 2014 2016
Fig. 35: Total Global Debt (US$ tn)
Household Corporate Government Financial
246%
269%
286%
293%
220%
230%
240%
250%
260%
270%
280%
290%
300%
2000 2007 2014 2016
Fig. 36: Total Global Debt to GDP
P a g e | 16 www.custprd.com
Hong Kong Tokyo
Salt Lake City
Overcapacity in China
China’s construction
machinery companies not getting
paid
It is a worry
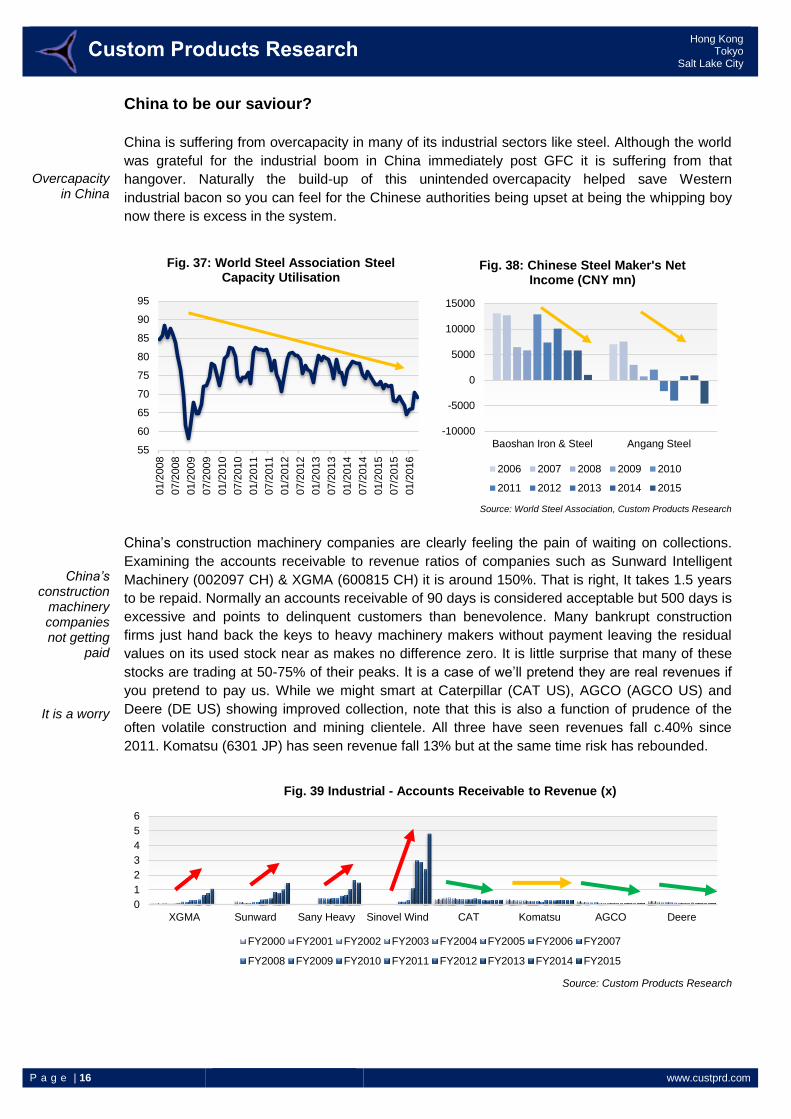
China to be our saviour?
China is suffering from overcapacity in many of its industrial sectors like steel. Although the world
was grateful for the industrial boom in China immediately post GFC it is suffering from that
hangover. Naturally the build-up of this unintended overcapacity helped save Western
industrial bacon so you can feel for the Chinese authorities being upset at being the whipping boy
now there is excess in the system.
Source: World Steel Association, Custom Products Research
China’s construction machinery companies are clearly feeling the pain of waiting on collections.
Examining the accounts receivable to revenue ratios of companies such as Sunward Intelligent
Machinery (002097 CH) & XGMA (600815 CH) it is around 150%. That is right, It takes 1.5 years
to be repaid. Normally an accounts receivable of 90 days is considered acceptable but 500 days is
excessive and points to delinquent customers than benevolence. Many bankrupt construction
firms just hand back the keys to heavy machinery makers without payment leaving the residual
values on its used stock near as makes no difference zero. It is little surprise that many of these
stocks are trading at 50-75% of their peaks. It is a case of we’ll pretend they are real revenues if
you pretend to pay us. While we might smart at Caterpillar (CAT US), AGCO (AGCO US) and
Deere (DE US) showing improved collection, note that this is also a function of prudence of the
often volatile construction and mining clientele. All three have seen revenues fall c.40% since
2011. Komatsu (6301 JP) has seen revenue fall 13% but at the same time risk has rebounded.
Source: Custom Products Research
55
60
65
70
75
80
85
90
95
01/2
008
07/2
008
01/2
009
07/2
009
01/2
010
07/2
010
01/2
011
07/2
011
01/2
012
07/2
012
01/2
013
07/2
013
01/2
014
07/2
014
01/2
015
07/2
015
01/2
016
Fig. 37: World Steel Association Steel Capacity Utilisation
-10000
-5000
0
5000
10000
15000
Baoshan Iron & Steel Angang Steel
Fig. 38: Chinese Steel Maker's Net Income (CNY mn)
2006 2007 2008 2009 2010
2011 2012 2013 2014 2015
0
1
2
3
4
5
6
XGMA Sunward Sany Heavy Sinovel Wind CAT Komatsu AGCO Deere
Fig. 39 Industrial - Accounts Receivable to Revenue (x)
FY2000 FY2001 FY2002 FY2003 FY2004 FY2005 FY2006 FY2007
FY2008 FY2009 FY2010 FY2011 FY2012 FY2013 FY2014 FY2015
P a g e | 17 www.custprd.com
Hong Kong Tokyo
Salt Lake City
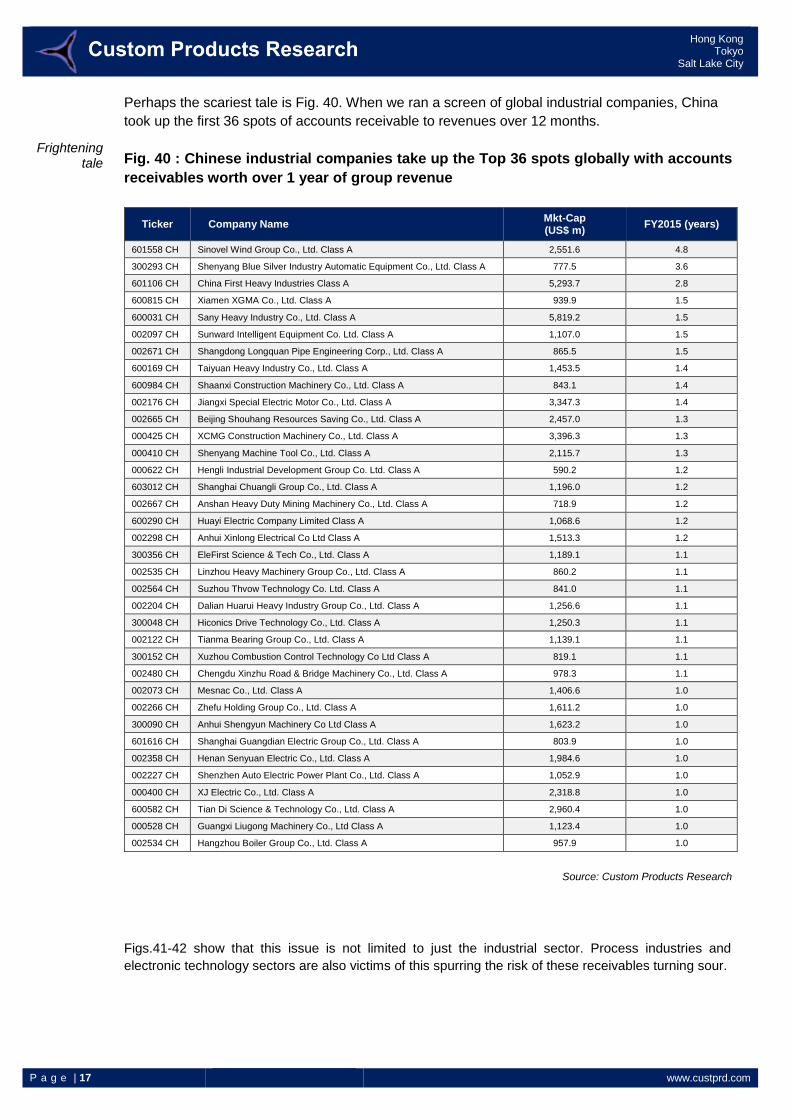
Frightening tale
Perhaps the scariest tale is Fig. 40. When we ran a screen of global industrial companies, China
took up the first 36 spots of accounts receivable to revenues over 12 months.
Fig. 40 : Chinese industrial companies take up the Top 36 spots globally with accounts
receivables worth over 1 year of group revenue
Ticker Company Name Mkt-Cap (US$ m)
FY2015 (years)
601558 CH Sinovel Wind Group Co., Ltd. Class A 2,551.6 4.8
300293 CH Shenyang Blue Silver Industry Automatic Equipment Co., Ltd. Class A 777.5 3.6
601106 CH China First Heavy Industries Class A 5,293.7 2.8
600815 CH Xiamen XGMA Co., Ltd. Class A 939.9 1.5
600031 CH Sany Heavy Industry Co., Ltd. Class A 5,819.2 1.5
002097 CH Sunward Intelligent Equipment Co. Ltd. Class A 1,107.0 1.5
002671 CH Shangdong Longquan Pipe Engineering Corp., Ltd. Class A 865.5 1.5
600169 CH Taiyuan Heavy Industry Co., Ltd. Class A 1,453.5 1.4
600984 CH Shaanxi Construction Machinery Co., Ltd. Class A 843.1 1.4
002176 CH Jiangxi Special Electric Motor Co., Ltd. Class A 3,347.3 1.4
002665 CH Beijing Shouhang Resources Saving Co., Ltd. Class A 2,457.0 1.3
000425 CH XCMG Construction Machinery Co., Ltd. Class A 3,396.3 1.3
000410 CH Shenyang Machine Tool Co., Ltd. Class A 2,115.7 1.3
000622 CH Hengli Industrial Development Group Co. Ltd. Class A 590.2 1.2
603012 CH Shanghai Chuangli Group Co., Ltd. Class A 1,196.0 1.2
002667 CH Anshan Heavy Duty Mining Machinery Co., Ltd. Class A 718.9 1.2
600290 CH Huayi Electric Company Limited Class A 1,068.6 1.2
002298 CH Anhui Xinlong Electrical Co Ltd Class A 1,513.3 1.2
300356 CH EleFirst Science & Tech Co., Ltd. Class A 1,189.1 1.1
002535 CH Linzhou Heavy Machinery Group Co., Ltd. Class A 860.2 1.1
002564 CH Suzhou Thvow Technology Co. Ltd. Class A 841.0 1.1
002204 CH Dalian Huarui Heavy Industry Group Co., Ltd. Class A 1,256.6 1.1
300048 CH Hiconics Drive Technology Co., Ltd. Class A 1,250.3 1.1
002122 CH Tianma Bearing Group Co., Ltd. Class A 1,139.1 1.1
300152 CH Xuzhou Combustion Control Technology Co Ltd Class A 819.1 1.1
002480 CH Chengdu Xinzhu Road & Bridge Machinery Co., Ltd. Class A 978.3 1.1
002073 CH Mesnac Co., Ltd. Class A 1,406.6 1.0
002266 CH Zhefu Holding Group Co., Ltd. Class A 1,611.2 1.0
300090 CH Anhui Shengyun Machinery Co Ltd Class A 1,623.2 1.0
601616 CH Shanghai Guangdian Electric Group Co., Ltd. Class A 803.9 1.0
002358 CH Henan Senyuan Electric Co., Ltd. Class A 1,984.6 1.0
002227 CH Shenzhen Auto Electric Power Plant Co., Ltd. Class A 1,052.9 1.0
000400 CH XJ Electric Co., Ltd. Class A 2,318.8 1.0
600582 CH Tian Di Science & Technology Co., Ltd. Class A 2,960.4 1.0
000528 CH Guangxi Liugong Machinery Co., Ltd Class A 1,123.4 1.0
002534 CH Hangzhou Boiler Group Co., Ltd. Class A 957.9 1.0
Source: Custom Products Research
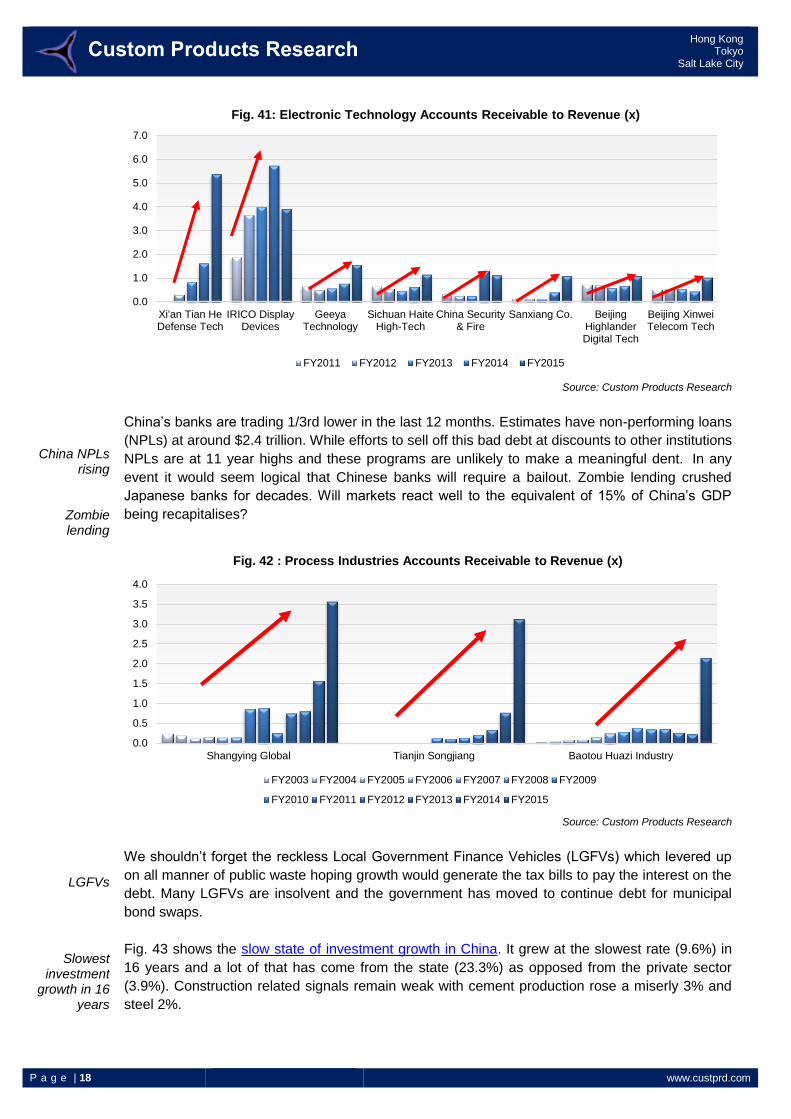
Figs.41-42 show that this issue is not limited to just the industrial sector. Process industries and
electronic technology sectors are also victims of this spurring the risk of these receivables turning sour.
P a g e | 18 www.custprd.com
Hong Kong Tokyo
Salt Lake City
China NPLs rising
Zombie lending
LGFVs
Slowest investment
growth in 16 years
Source: Custom Products Research
China’s banks are trading 1/3rd lower in the last 12 months. Estimates have non-performing loans
(NPLs) at around $2.4 trillion. While efforts to sell off this bad debt at discounts to other institutions
NPLs are at 11 year highs and these programs are unlikely to make a meaningful dent. In any
event it would seem logical that Chinese banks will require a bailout. Zombie lending crushed
Japanese banks for decades. Will markets react well to the equivalent of 15% of China’s GDP
being recapitalises?
Source: Custom Products Research
We shouldn’t forget the reckless Local Government Finance Vehicles (LGFVs) which levered up
on all manner of public waste hoping growth would generate the tax bills to pay the interest on the
debt. Many LGFVs are insolvent and the government has moved to continue debt for municipal
bond swaps.
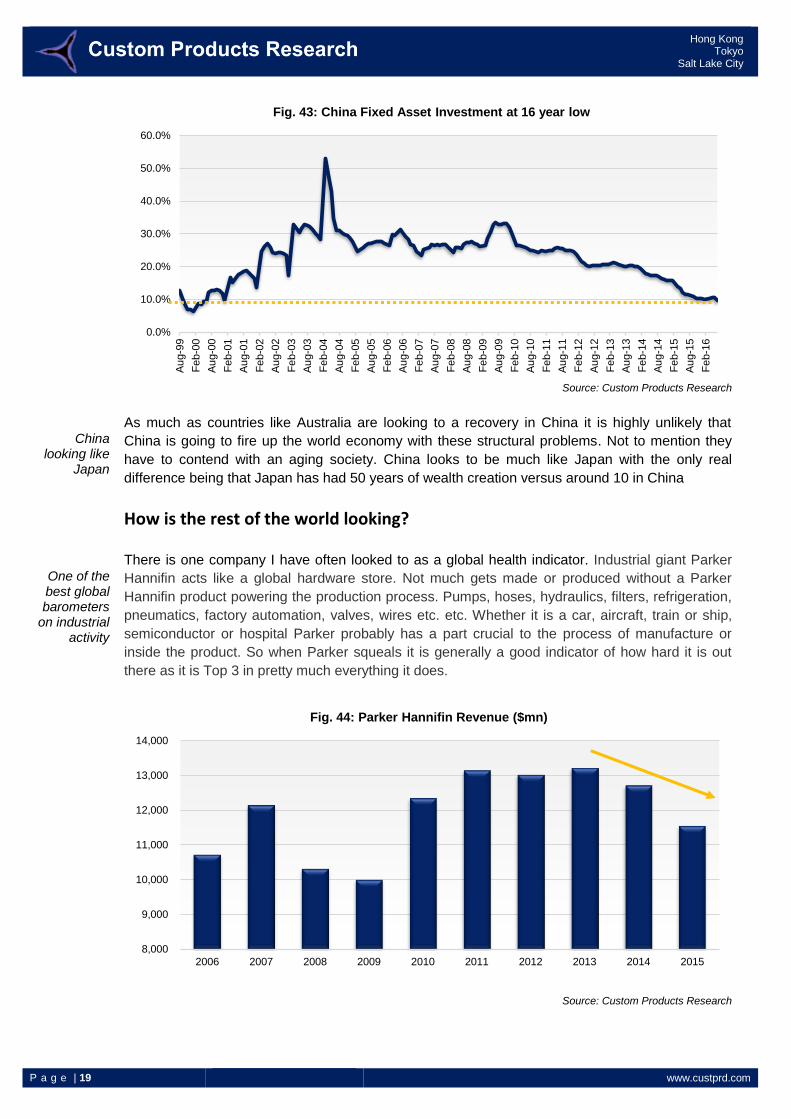
Fig. 43 shows the slow state of investment growth in China. It grew at the slowest rate (9.6%) in
16 years and a lot of that has come from the state (23.3%) as opposed from the private sector
(3.9%). Construction related signals remain weak with cement production rose a miserly 3% and
steel 2%.
0.0
1.0
2.0
3.0
4.0
5.0
6.0
7.0
Xi'an Tian HeDefense Tech
IRICO DisplayDevices
GeeyaTechnology
Sichuan HaiteHigh-Tech
China Security& Fire
Sanxiang Co. BeijingHighlanderDigital Tech
Beijing XinweiTelecom Tech
Fig. 41: Electronic Technology Accounts Receivable to Revenue (x)
FY2011 FY2012 FY2013 FY2014 FY2015
0.0
0.5
1.0
1.5
2.0
2.5
3.0
3.5
4.0
Shangying Global Tianjin Songjiang Baotou Huazi Industry
Fig. 42 : Process Industries Accounts Receivable to Revenue (x)
FY2003 FY2004 FY2005 FY2006 FY2007 FY2008 FY2009
FY2010 FY2011 FY2012 FY2013 FY2014 FY2015
P a g e | 19 www.custprd.com
Hong Kong Tokyo
Salt Lake City
China looking like
Japan
One of the best global barometers
on industrial activity
Source: Custom Products Research
As much as countries like Australia are looking to a recovery in China it is highly unlikely that
China is going to fire up the world economy with these structural problems. Not to mention they
have to contend with an aging society. China looks to be much like Japan with the only real
difference being that Japan has had 50 years of wealth creation versus around 10 in China
How is the rest of the world looking?
There is one company I have often looked to as a global health indicator. Industrial giant Parker
Hannifin acts like a global hardware store. Not much gets made or produced without a Parker
Hannifin product powering the production process. Pumps, hoses, hydraulics, filters, refrigeration,
pneumatics, factory automation, valves, wires etc. etc. Whether it is a car, aircraft, train or ship,
semiconductor or hospital Parker probably has a part crucial to the process of manufacture or
inside the product. So when Parker squeals it is generally a good indicator of how hard it is out
there as it is Top 3 in pretty much everything it does.
Source: Custom Products Research
0.0%
10.0%
20.0%
30.0%
40.0%
50.0%
60.0%
Au
g-9
9
Fe
b-0
0
Au
g-0
0
Fe
b-0
1
Au
g-0
1
Fe
b-0
2
Au
g-0
2
Fe
b-0
3
Au
g-0
3
Fe
b-0
4
Au
g-0
4
Fe
b-0
5
Au
g-0
5
Fe
b-0
6
Au
g-0
6
Fe
b-0
7
Au
g-0
7
Fe
b-0
8
Au
g-0
8
Fe
b-0
9
Au
g-0
9
Fe
b-1
0
Au
g-1
0
Fe
b-1
1
Au
g-1
1
Fe
b-1
2
Au
g-1
2
Fe
b-1
3
Au
g-1
3
Fe
b-1
4
Au
g-1
4
Fe
b-1
5
Au
g-1
5
Fe
b-1
6
Fig. 43: China Fixed Asset Investment at 16 year low
8,000
9,000
10,000
11,000
12,000
13,000
14,000
2006 2007 2008 2009 2010 2011 2012 2013 2014 2015
Fig. 44: Parker Hannifin Revenue ($mn)
P a g e | 20 www.custprd.com
Hong Kong Tokyo
Salt Lake City
Sales down at home and
abroad falling
Orders at home and
abroad falling
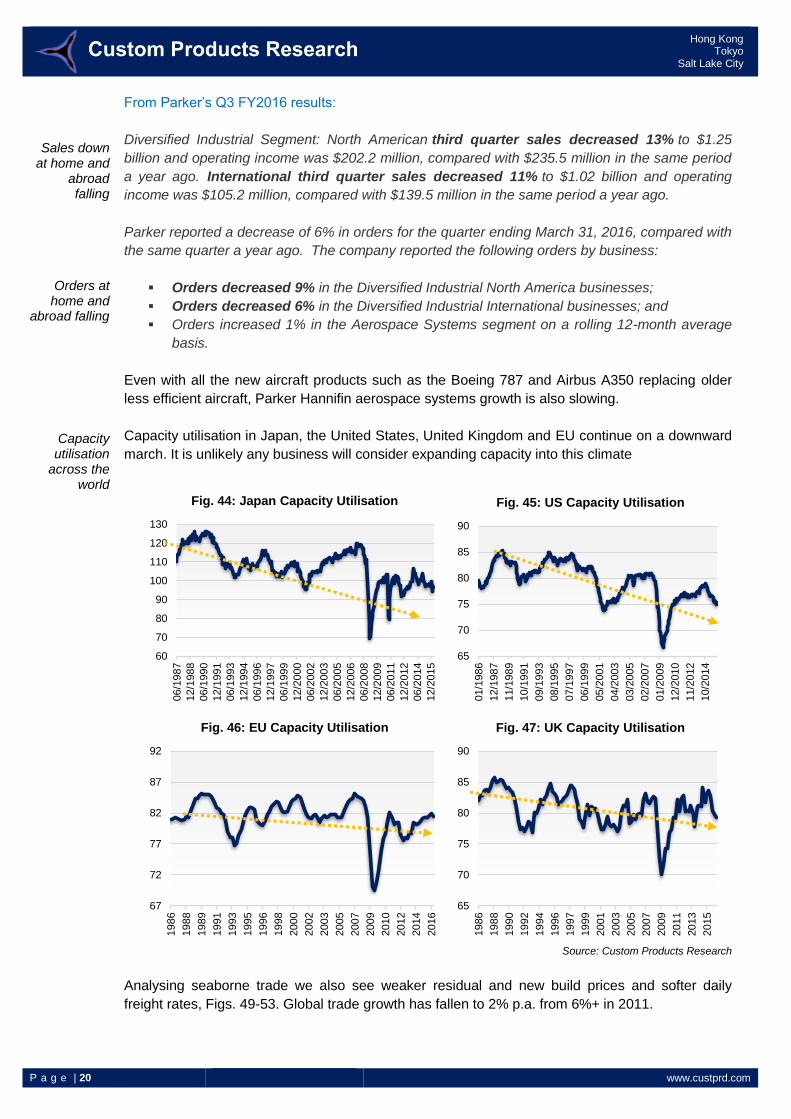
Capacity utilisation
across the world
From Parker’s Q3 FY2016 results:
Diversified Industrial Segment: North American third quarter sales decreased 13% to $1.25
billion and operating income was $202.2 million, compared with $235.5 million in the same period
a year ago. International third quarter sales decreased 11% to $1.02 billion and operating
income was $105.2 million, compared with $139.5 million in the same period a year ago.
Parker reported a decrease of 6% in orders for the quarter ending March 31, 2016, compared with
the same quarter a year ago. The company reported the following orders by business:
Orders decreased 9% in the Diversified Industrial North America businesses;
Orders decreased 6% in the Diversified Industrial International businesses; and
Orders increased 1% in the Aerospace Systems segment on a rolling 12-month average
basis.
Even with all the new aircraft products such as the Boeing 787 and Airbus A350 replacing older
less efficient aircraft, Parker Hannifin aerospace systems growth is also slowing.
Capacity utilisation in Japan, the United States, United Kingdom and EU continue on a downward
march. It is unlikely any business will consider expanding capacity into this climate
Source: Custom Products Research
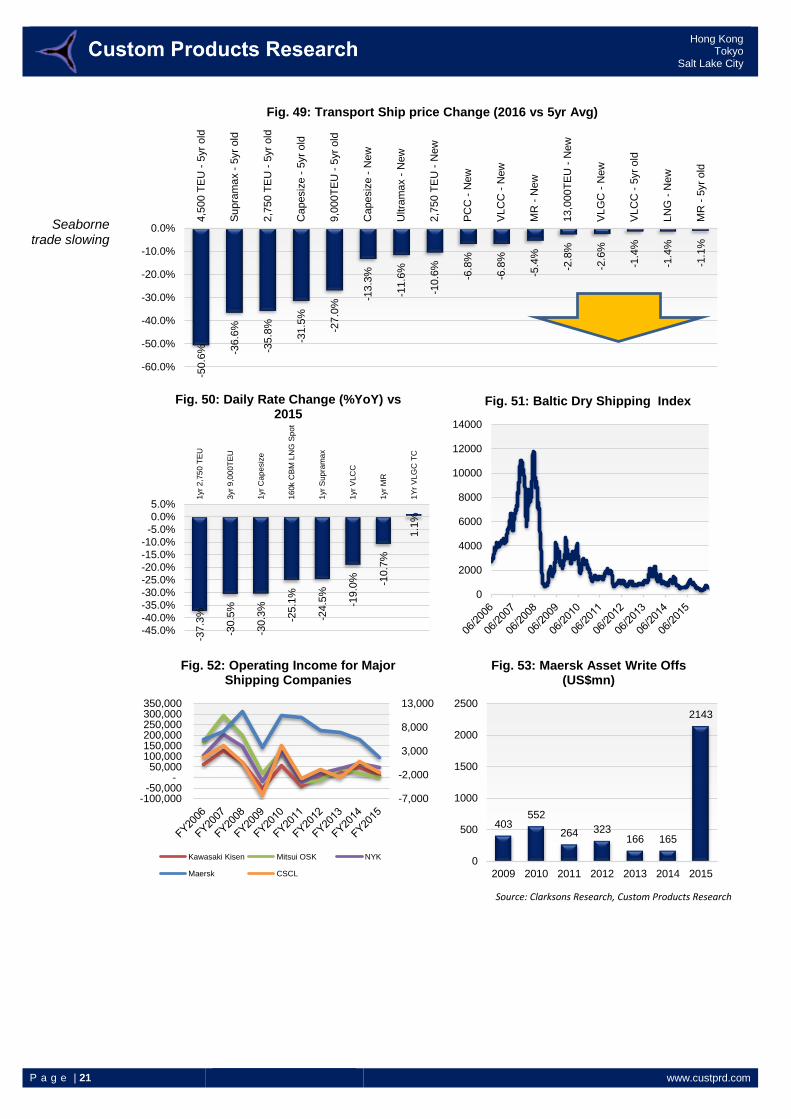
Analysing seaborne trade we also see weaker residual and new build prices and softer daily
freight rates, Figs. 49-53. Global trade growth has fallen to 2% p.a. from 6%+ in 2011.
60
70
80
90
100
110
120
130
06/1
987
12/1
988
06/1
990
12/1
991
06/1
993
12/1
994
06/1
996
12/1
997
06/1
999
12/2
000
06/2
002
12/2
003
06/2
005
12/2
006
06/2
008
12/2
009
06/2
011
12/2
012
06/2
014
12/2
015
Fig. 44: Japan Capacity Utilisation
65
70
75
80
85
90
01/1
986
12/1
987
11/1
989
10/1
991
09/1
993
08/1
995
07/1
997
06/1
999
05/2
001
04/2
003
03/2
005
02/2
007
01/2
009
12/2
010
11/2
012
10/2
014
Fig. 45: US Capacity Utilisation
67
72
77
82
87
92
1986
1988
1989
1991
1993
1995
1996
1998
2000
2002
2003
2005
2007
2009
2010
2012
2014
2016
Fig. 46: EU Capacity Utilisation
65
70
75
80
85
90
1986
1988
1990
1992
1994
1996
1997
1999
2001
2003
2005
2007
2009
2011
2013
2015
Fig. 47: UK Capacity Utilisation
P a g e | 21 www.custprd.com
Hong Kong Tokyo
Salt Lake City
Seaborne trade slowing
Source: Clarksons Research, Custom Products Research
-50.6
% -36.6
%
-35.8
%
-31.5
%
-27.0
%
-13.3
%
-11.6
%
-10.6
%
-6.8
%
-6.8
%
-5.4
%
-2.8
%
-2.6
%
-1.4
%
-1.4
%
-1.1
%
-60.0%
-50.0%
-40.0%
-30.0%
-20.0%
-10.0%
0.0%
4,5
00 T
EU
- 5
yr
old
Su
pra
ma
x -
5yr
old
2,7
50 T
EU
- 5
yr
old
Capesiz
e -
5yr
old
9,0
00T
EU
- 5
yr
old
Capesiz
e -
New
Ultra
max -
New
2,7
50 T
EU
- N
ew
PC
C -
New
VL
CC
- N
ew
MR
- N
ew
13,0
00T
EU
- N
ew
VL
GC
- N
ew
VL
CC
- 5
yr
old
LN
G -
New
MR
- 5
yr
old
Fig. 49: Transport Ship price Change (2016 vs 5yr Avg)
-37.3
%
-30.5
%
-30.3
%
-25.1
%
-24.5
%
-19.0
% -10.7
%
1.1
%
-45.0%
-40.0%
-35.0%
-30.0%
-25.0%
-20.0%
-15.0%
-10.0%
-5.0%
0.0%
5.0%
1yr
2,7
50 T
EU
3yr
9,0
00T
EU
1yr
Ca
pe
siz
e
16
0k C
BM
LN
G S
po
t
1yr
Sup
ram
ax
1yr
VLC
C
1yr
MR
1Y
r V
LG
C T
C
Fig. 50: Daily Rate Change (%YoY) vs 2015
0
2000
4000
6000
8000
10000
12000
14000
Fig. 51: Baltic Dry Shipping Index
-7,000
-2,000
3,000
8,000
13,000
-100,000-50,000
- 50,000
100,000 150,000 200,000 250,000 300,000 350,000
Fig. 52: Operating Income for Major Shipping Companies
Kawasaki Kisen Mitsui OSK NYK
Maersk CSCL
403552
264 323166 165
2143
0
500
1000
1500
2000
2500
2009 2010 2011 2012 2013 2014 2015
Fig. 53: Maersk Asset Write Offs (US$mn)
P a g e | 22 www.custprd.com
Hong Kong Tokyo
Salt Lake City
Gluskin Sheff makes good
point on central banks
Write downs will
accelerate
Already seeing banks
become insolvent?
Central banks should
not be independent
anymore
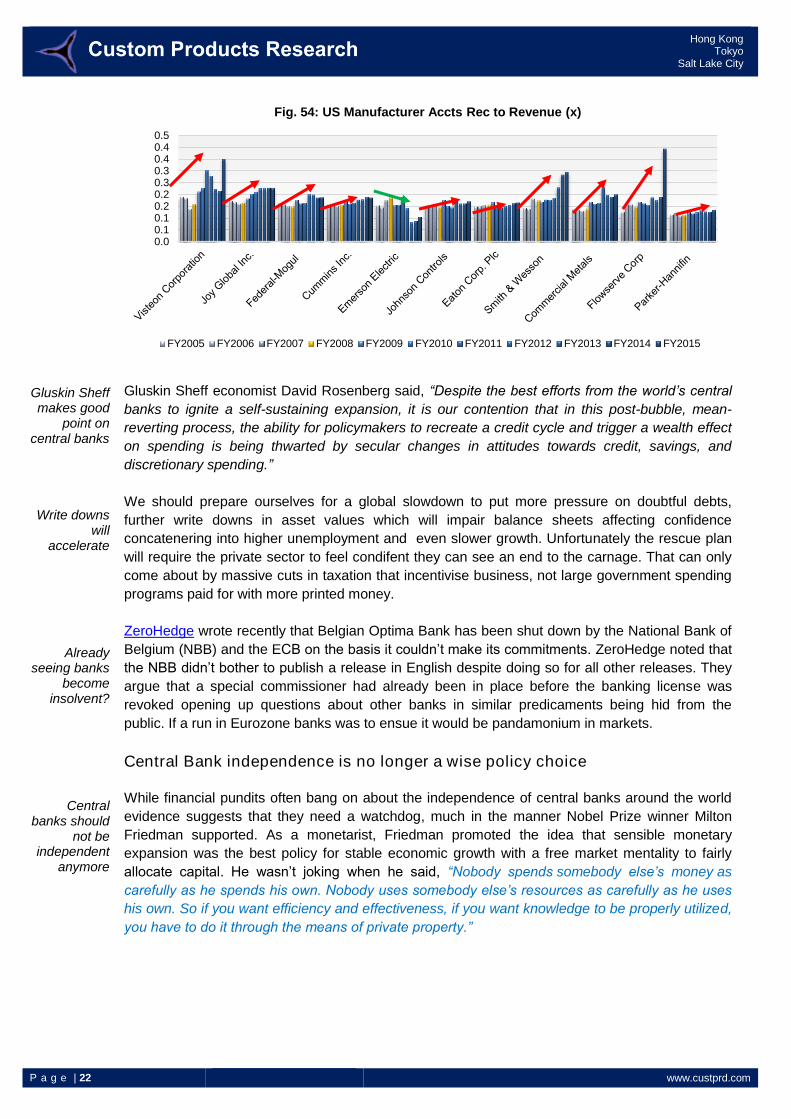
Gluskin Sheff economist David Rosenberg said, “Despite the best efforts from the world’s central
banks to ignite a self-sustaining expansion, it is our contention that in this post-bubble, mean-
reverting process, the ability for policymakers to recreate a credit cycle and trigger a wealth effect
on spending is being thwarted by secular changes in attitudes towards credit, savings, and
discretionary spending.”
We should prepare ourselves for a global slowdown to put more pressure on doubtful debts,
further write downs in asset values which will impair balance sheets affecting confidence
concatenering into higher unemployment and even slower growth. Unfortunately the rescue plan
will require the private sector to feel condifent they can see an end to the carnage. That can only
come about by massive cuts in taxation that incentivise business, not large government spending
programs paid for with more printed money.
ZeroHedge wrote recently that Belgian Optima Bank has been shut down by the National Bank of
Belgium (NBB) and the ECB on the basis it couldn’t make its commitments. ZeroHedge noted that
the NBB didn’t bother to publish a release in English despite doing so for all other releases. They
argue that a special commissioner had already been in place before the banking license was
revoked opening up questions about other banks in similar predicaments being hid from the
public. If a run in Eurozone banks was to ensue it would be pandamonium in markets.
Central Bank independence is no longer a wise policy choice
1. While financial pundits often bang on about the independence of central banks around the world
evidence suggests that they need a watchdog, much in the manner Nobel Prize winner Milton
Friedman supported. As a monetarist, Friedman promoted the idea that sensible monetary
expansion was the best policy for stable economic growth with a free market mentality to fairly
allocate capital. He wasn’t joking when he said, “Nobody spends somebody else’s money as
carefully as he spends his own. Nobody uses somebody else’s resources as carefully as he uses
his own. So if you want efficiency and effectiveness, if you want knowledge to be properly utilized,
you have to do it through the means of private property.”
2.
0.00.10.10.20.20.30.30.40.40.5
Fig. 54: US Manufacturer Accts Rec to Revenue (x)
FY2005 FY2006 FY2007 FY2008 FY2009 FY2010 FY2011 FY2012 FY2013 FY2014 FY2015
P a g e | 23 www.custprd.com
Hong Kong Tokyo
Salt Lake City
The idea of central banks firing central
blanks
Flawed
Japan’s still has a Y40-50tn gap to
fill yearly
Can’t print our way to prosperity
The Nikkei raised the idea of turning the ten quadrillion yen ($10.5 trillion) of sovereign debt into
zero interest rate perpetuals. So what value would Japanese debt have in the future? Remember
that Japanese officials need to raise ¥40-50 trillion every year to fund the budget deficit. If the BoJ
can print this deficit every year then once again the value of the currency would be trashed.
Financial markets cannot overlook that two years worth of GDP being turned into zero even under
the cloak of packaging it as still existing.
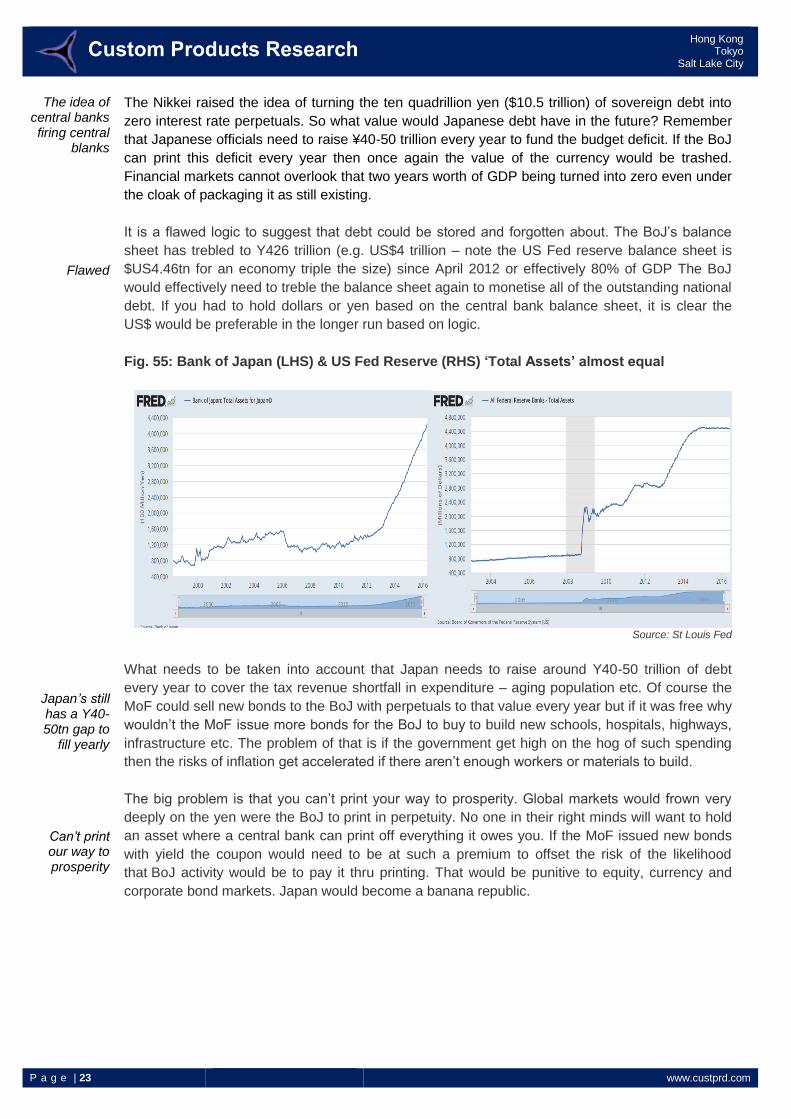
It is a flawed logic to suggest that debt could be stored and forgotten about. The BoJ’s balance
sheet has trebled to Y426 trillion (e.g. US$4 trillion – note the US Fed reserve balance sheet is
$US4.46tn for an economy triple the size) since April 2012 or effectively 80% of GDP The BoJ
would effectively need to treble the balance sheet again to monetise all of the outstanding national
debt. If you had to hold dollars or yen based on the central bank balance sheet, it is clear the
US$ would be preferable in the longer run based on logic.
Fig. 55: Bank of Japan (LHS) & US Fed Reserve (RHS) ‘Total Assets’ almost equal
Source: St Louis Fed
What needs to be taken into account that Japan needs to raise around Y40-50 trillion of debt
every year to cover the tax revenue shortfall in expenditure – aging population etc. Of course the
MoF could sell new bonds to the BoJ with perpetuals to that value every year but if it was free why
wouldn’t the MoF issue more bonds for the BoJ to buy to build new schools, hospitals, highways,
infrastructure etc. The problem of that is if the government get high on the hog of such spending
then the risks of inflation get accelerated if there aren’t enough workers or materials to build.
The big problem is that you can’t print your way to prosperity. Global markets would frown very
deeply on the yen were the BoJ to print in perpetuity. No one in their right minds will want to hold
an asset where a central bank can print off everything it owes you. If the MoF issued new bonds
with yield the coupon would need to be at such a premium to offset the risk of the likelihood
that BoJ activity would be to pay it thru printing. That would be punitive to equity, currency and
corporate bond markets. Japan would become a banana republic.
P a g e | 24 www.custprd.com
Hong Kong Tokyo
Salt Lake City
Aggressive tax reform
required
Markets must be freed up
from state manipulation
Beef up on clamping down on
fraud
Market integrity
depends on it
The lessons of failures the
last time
Whistle blowing
What is required to save the supertanker from sinking?
Aggressive tax reform. Wholesale flat taxes at 10%. Pumping more dollar after dollar has not
resulted in any meaningful economic recovery. We continue to struggle through orchestrated and
misguided fiscal and monetary policy. The private sector must be let loose from the shackles of
over-regulation and if governments want to get their citizens out from under the debt load, taxing
then any more will not work.
Markets must be freed from over-regulation. Although proper policing through regulators would
come from hiring former traders and market participants who can spot inconsistencies (aka fraud)
rather than relying on lawyers who couldn’t find a market anomaly if they fell over it. Regulators
should be self funded from fees charged to market participants enabling them to properly plan
years in advance not having to worry about a cut from Treasury.
Industry associations are behind paying higher user fees. Rick A. Fleming of the SEC’s Investor
Advocate said in August 2014,
“To some, the idea of a “user fee” sounds a lot like a tax. But several industry associations that
represent investment advisers have actually endorsed the concept of user fees. They recognize
that a rogue adviser not only harms investors, but also leaves a stain on the advisory industry, so
they support an increased regulatory presence and are willing to pay for it. Let me repeat that –
they are willing to pay more money to the SEC so that it can conduct more examinations of
advisers.”
Regulators have a vital role to play in preventing fraud. Market integrity depends on it. However
without adequate funding regulators face pressures on many fronts. The SEC was publicly
admonished by Congress for its failure to catch Bernard L. Madoff Investment Securities (BMIS)
LLC despite being presented with evidence multiple times from a whistle-blower pointing to the
Ponzi scheme for over 9 years. It issued the following statement:
“The Office of the Inspector General (OIG) investigation did find, however, that the SEC received
more than ample information in the form of detailed and substantive complaints over the years to
warrant a thorough and comprehensive examination and/or investigation of Bernard Madoff and
BMIS for operating a Ponzi scheme, and that despite three examinations and two investigations
being conducted, a thorough and competent investigation or examination was never performed.”
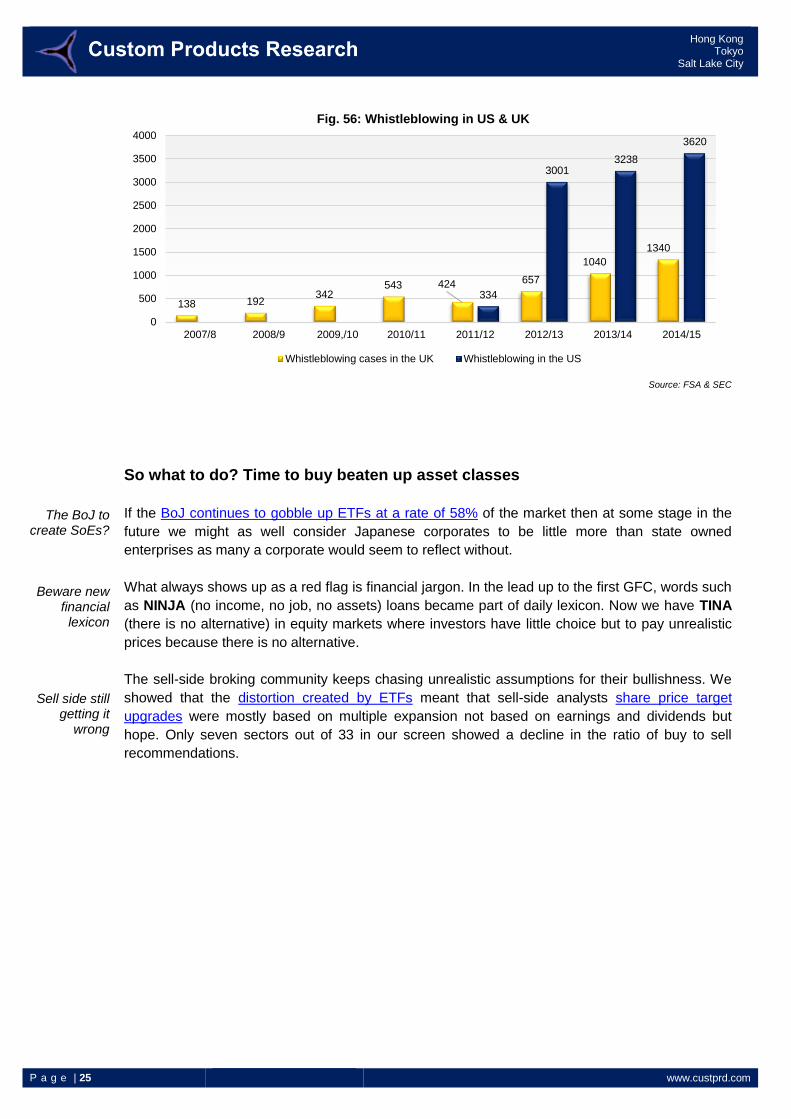
Whistleblowing should be encouraged like the American system which grants people who
legitimately uncover fraud a 10-30% cut of recovered monies. The US has seen a 10 fold increase
in whistleblowing cases since the law was revised in 2011 with one person awarded $30 million.
P a g e | 25 www.custprd.com
Hong Kong Tokyo
Salt Lake City
The BoJ to create SoEs?
Beware new financial lexicon
Sell side still getting it
wrong
Source: FSA & SEC
So what to do? Time to buy beaten up asset classes
If the BoJ continues to gobble up ETFs at a rate of 58% of the market then at some stage in the
future we might as well consider Japanese corporates to be little more than state owned
enterprises as many a corporate would seem to reflect without.
What always shows up as a red flag is financial jargon. In the lead up to the first GFC, words such
as NINJA (no income, no job, no assets) loans became part of daily lexicon. Now we have TINA
(there is no alternative) in equity markets where investors have little choice but to pay unrealistic
prices because there is no alternative.
The sell-side broking community keeps chasing unrealistic assumptions for their bullishness. We
showed that the distortion created by ETFs meant that sell-side analysts share price target
upgrades were mostly based on multiple expansion not based on earnings and dividends but
hope. Only seven sectors out of 33 in our screen showed a decline in the ratio of buy to sell
recommendations.
138 192342
543 424 657
1040
1340
334
30013238
3620
0
500
1000
1500
2000
2500
3000
3500
4000
2007/8 2008/9 2009,/10 2010/11 2011/12 2012/13 2013/14 2014/15
Fig. 56: Whistleblowing in US & UK
Whistleblowing cases in the UK Whistleblowing in the US
P a g e | 26 www.custprd.com
Hong Kong Tokyo
Salt Lake City
Herd mentality
makes for contrarian
indicator
Source: Custom Products Research
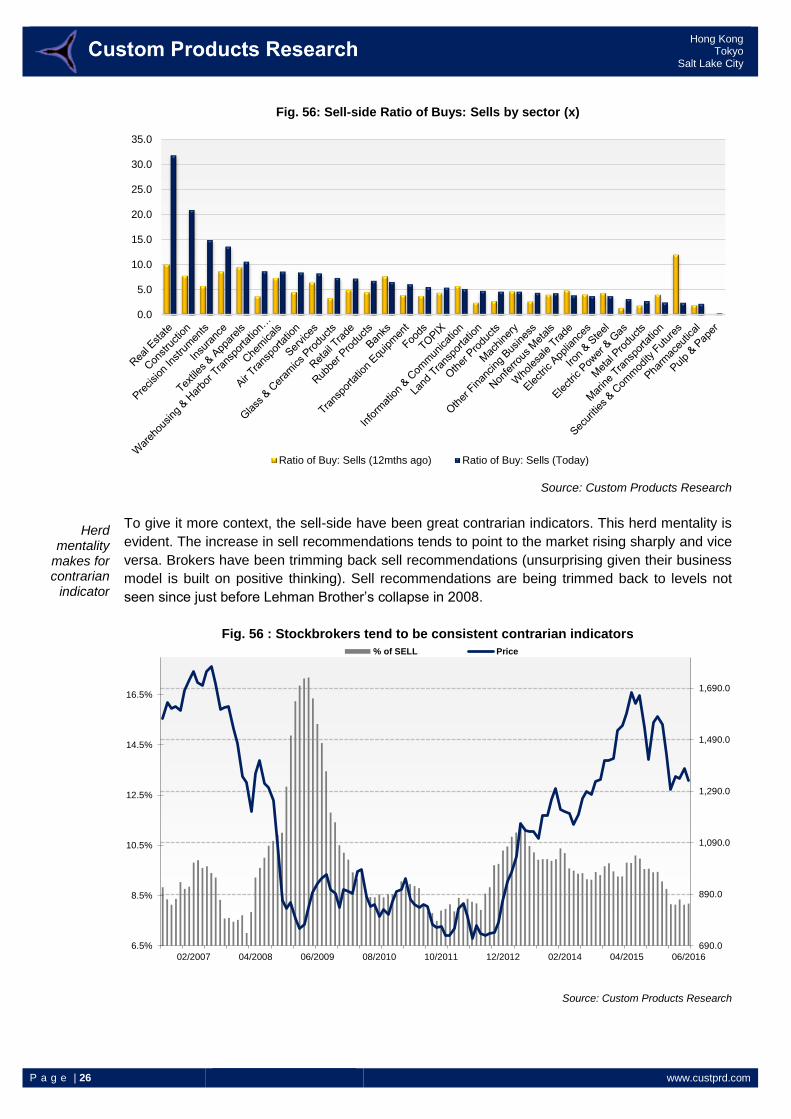
To give it more context, the sell-side have been great contrarian indicators. This herd mentality is
evident. The increase in sell recommendations tends to point to the market rising sharply and vice
versa. Brokers have been trimming back sell recommendations (unsurprising given their business
model is built on positive thinking). Sell recommendations are being trimmed back to levels not
seen since just before Lehman Brother’s collapse in 2008.
Fig. 56 : Stockbrokers tend to be consistent contrarian indicators
Source: Custom Products Research
0.0
5.0
10.0
15.0
20.0
25.0
30.0
35.0
Fig. 56: Sell-side Ratio of Buys: Sells by sector (x)
Ratio of Buy: Sells (12mths ago) Ratio of Buy: Sells (Today)
6.5%
8.5%
10.5%
12.5%
14.5%
16.5%
690.0
890.0
1,090.0
1,290.0
1,490.0
1,690.0
06/201604/201502/201412/201210/201108/201006/200904/200802/2007
% of SELL Price
P a g e | 27 www.custprd.com
Hong Kong Tokyo
Salt Lake City
Market mean reversion
looks imminent
VIX volatility rising
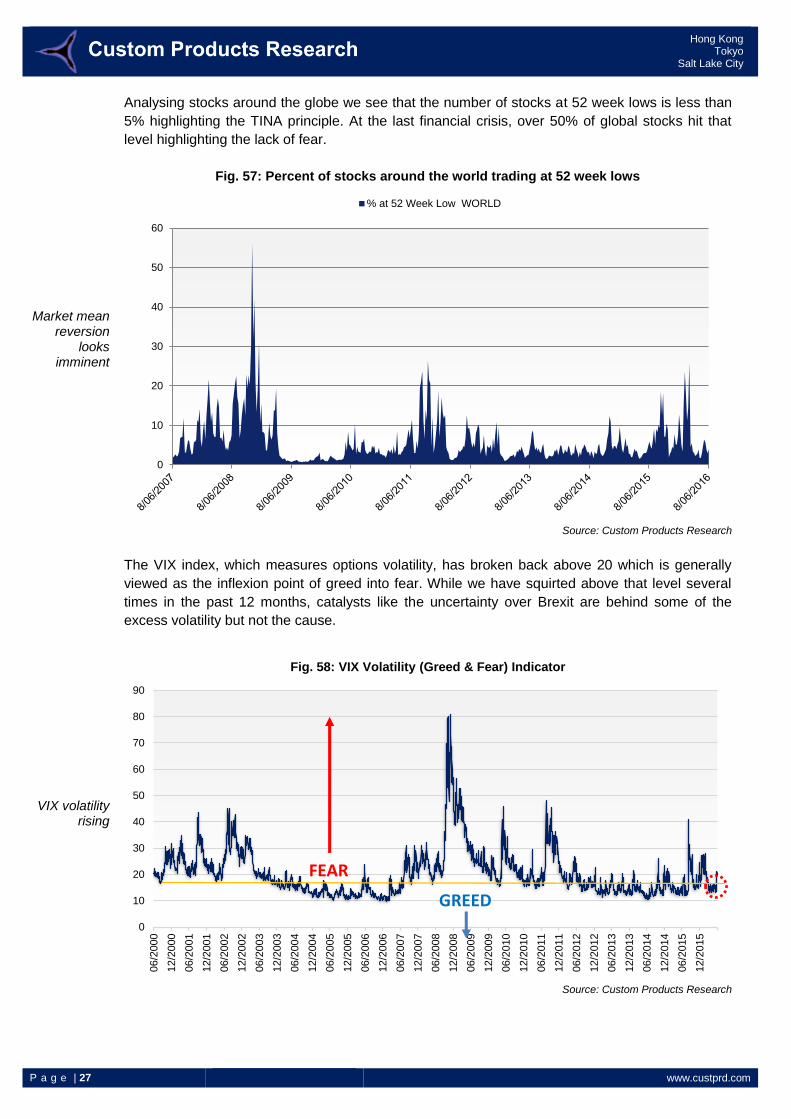
Analysing stocks around the globe we see that the number of stocks at 52 week lows is less than
5% highlighting the TINA principle. At the last financial crisis, over 50% of global stocks hit that
level highlighting the lack of fear.
Fig. 57: Percent of stocks around the world trading at 52 week lows
Source: Custom Products Research
The VIX index, which measures options volatility, has broken back above 20 which is generally
viewed as the inflexion point of greed into fear. While we have squirted above that level several
times in the past 12 months, catalysts like the uncertainty over Brexit are behind some of the
excess volatility but not the cause.
Source: Custom Products Research
0
10
20
30
40
50
60
% at 52 Week Low WORLD
0
10
20
30
40
50
60
70
80
90
06/2
000
12/2
000
06/2
001
12/2
001
06/2
002
12/2
002
06/2
003
12/2
003
06/2
004
12/2
004
06/2
005
12/2
005
06/2
006
12/2
006
06/2
007
12/2
007
06/2
008
12/2
008
06/2
009
12/2
009
06/2
010
12/2
010
06/2
011
12/2
011
06/2
012
12/2
012
06/2
013
12/2
013
06/2
014
12/2
014
06/2
015
12/2
015
Fig. 58: VIX Volatility (Greed & Fear) Indicator
FEAR
GREED
P a g e | 28 www.custprd.com
Hong Kong Tokyo
Salt Lake City
Recession?
Perennial bullishness
has gone too far
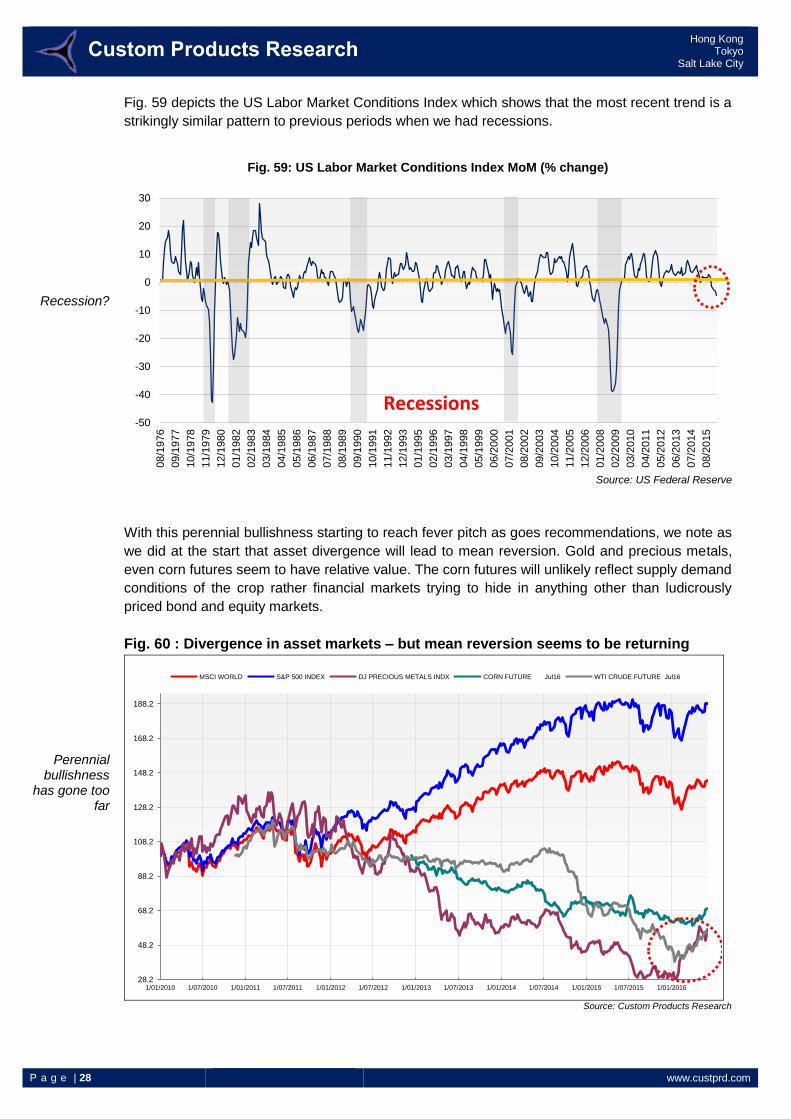
Fig. 59 depicts the US Labor Market Conditions Index which shows that the most recent trend is a
strikingly similar pattern to previous periods when we had recessions.
Source: US Federal Reserve
With this perennial bullishness starting to reach fever pitch as goes recommendations, we note as
we did at the start that asset divergence will lead to mean reversion. Gold and precious metals,
even corn futures seem to have relative value. The corn futures will unlikely reflect supply demand
conditions of the crop rather financial markets trying to hide in anything other than ludicrously
priced bond and equity markets.
Fig. 60 : Divergence in asset markets – but mean reversion seems to be returning
Source: Custom Products Research
-50
-40
-30
-20
-10
0
10
20
30
08/1
976
09/1
977
10/1
978
11/1
979
12/1
980
01/1
982
02/1
983
03/1
984
04/1
985
05/1
986
06/1
987
07/1
988
08/1
989
09/1
990
10/1
991
11/1
992
12/1
993
01/1
995
02/1
996
03/1
997
04/1
998
05/1
999
06/2
000
07/2
001
08/2
002
09/2
003
10/2
004
11/2
005
12/2
006
01/2
008
02/2
009
03/2
010
04/2
011
05/2
012
06/2
013
07/2
014
08/2
015
Fig. 59: US Labor Market Conditions Index MoM (% change)
Recessions
28.2
48.2
68.2
88.2
108.2
128.2
148.2
168.2
188.2
1/01/2010 1/07/2010 1/01/2011 1/07/2011 1/01/2012 1/07/2012 1/01/2013 1/07/2013 1/01/2014 1/07/2014 1/01/2015 1/07/2015 1/01/2016
MSCI WORLD S&P 500 INDEX DJ PRECIOUS METALS INDX CORN FUTURE Jul16 WTI CRUDE FUTURE Jul16
P a g e | 29 www.custprd.com
Hong Kong Tokyo
Salt Lake City
You should be worried
Central banks losing
confidence is a smoking
gun
Velocity of money the
danger
We can’t muddle through
anymore
Payback is arriving
Summary
It is bad out there. No matter which way you look the hallmarks point to a deep recession looming.
What is evident is that the world is as indebted as ever yet the sensitivity to interest rates is
growing larger. Should the economy slowdown at the rate it looks then monetary policy is unlikely
to make any appreciable difference. Central banks are losing control and a loss of confidence will
be catastrophic. For central banks It is the worst possible scenario for them.
If reports about the ECB secretly bailing out local Eurozone banks and installing ‘special
commissioners’ to oversee smooth transitions become more widespread it will only undermine
what little market confidence is left. Central banks are prone to these tactics. M3 reporting was
unceremoniously dumped by then Fed Reserve Chairman Alan Greenspan in 2006 one cynically
suspects was to mask unlimited monetary priming. We estimated (based on historical growth
rates) that the $10 trillion point of 2006 has likely grown to $25 trillion and as velocity continues to
slow, we believe it could hit $40 trillion by 2021.
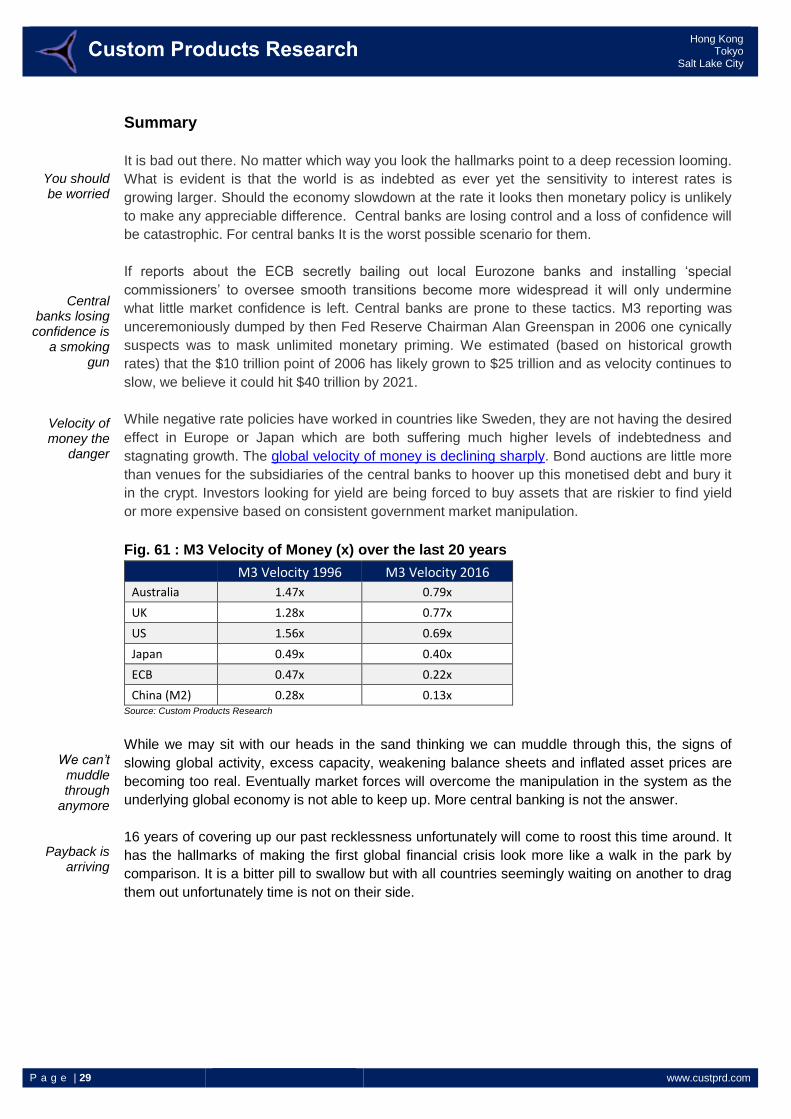
While negative rate policies have worked in countries like Sweden, they are not having the desired
effect in Europe or Japan which are both suffering much higher levels of indebtedness and
stagnating growth. The global velocity of money is declining sharply. Bond auctions are little more
than venues for the subsidiaries of the central banks to hoover up this monetised debt and bury it
in the crypt. Investors looking for yield are being forced to buy assets that are riskier to find yield
or more expensive based on consistent government market manipulation.
Fig. 61 : M3 Velocity of Money (x) over the last 20 years
M3 Velocity 1996 M3 Velocity 2016
Australia 1.47x 0.79x
UK 1.28x 0.77x
US 1.56x 0.69x
Japan 0.49x 0.40x
ECB 0.47x 0.22x
China (M2) 0.28x 0.13x Source: Custom Products Research
While we may sit with our heads in the sand thinking we can muddle through this, the signs of
slowing global activity, excess capacity, weakening balance sheets and inflated asset prices are
becoming too real. Eventually market forces will overcome the manipulation in the system as the
underlying global economy is not able to keep up. More central banking is not the answer.
16 years of covering up our past recklessness unfortunately will come to roost this time around. It
has the hallmarks of making the first global financial crisis look more like a walk in the park by
comparison. It is a bitter pill to swallow but with all countries seemingly waiting on another to drag
them out unfortunately time is not on their side.
P a g e | 30 www.custprd.com
Hong Kong Tokyo
Salt Lake City
Social impacts not
to be under-estimated
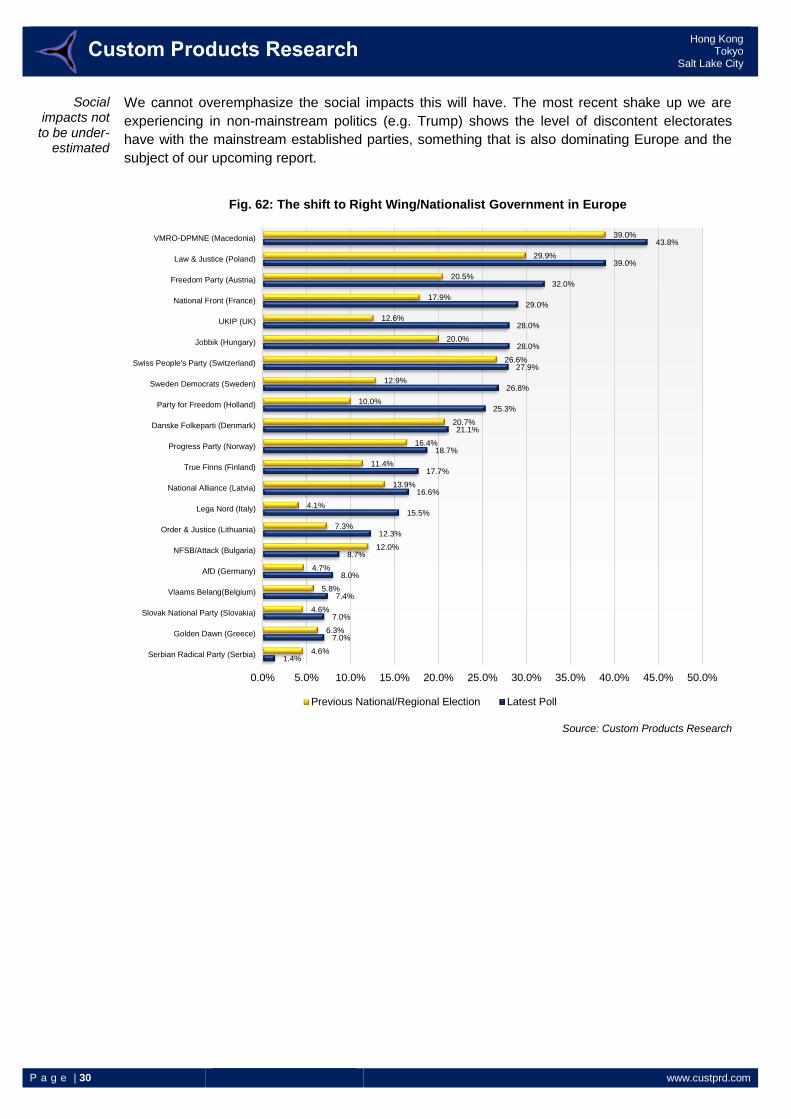
We cannot overemphasize the social impacts this will have. The most recent shake up we are
experiencing in non-mainstream politics (e.g. Trump) shows the level of discontent electorates
have with the mainstream established parties, something that is also dominating Europe and the
subject of our upcoming report.
Source: Custom Products Research
1.4%
7.0%
7.0%
7.4%
8.0%
8.7%
12.3%
15.5%
16.6%
17.7%
18.7%
21.1%
25.3%
26.8%
27.9%
28.0%
28.0%
29.0%
32.0%
39.0%
43.8%
4.6%
6.3%
4.6%
5.8%
4.7%
12.0%
7.3%
4.1%
13.9%
11.4%
16.4%
20.7%
10.0%
12.9%
26.6%
20.0%
12.6%
17.9%
20.5%
29.9%
39.0%
0.0% 5.0% 10.0% 15.0% 20.0% 25.0% 30.0% 35.0% 40.0% 45.0% 50.0%
Serbian Radical Party (Serbia)
Golden Dawn (Greece)
Slovak National Party (Slovakia)
Vlaams Belang(Belgium)
AfD (Germany)
NFSB/Attack (Bulgaria)
Order & Justice (Lithuania)
Lega Nord (Italy)
National Alliance (Latvia)
True Finns (Finland)
Progress Party (Norway)
Danske Folkeparti (Denmark)
Party for Freedom (Holland)
Sweden Democrats (Sweden)
Swiss People's Party (Switzerland)
Jobbik (Hungary)
UKIP (UK)
National Front (France)
Freedom Party (Austria)
Law & Justice (Poland)
VMRO-DPMNE (Macedonia)
Fig. 62: The shift to Right Wing/Nationalist Government in Europe
Previous National/Regional Election Latest Poll
P a g e | 31 www.custprd.com
Hong Kong Tokyo
Salt Lake City
Hong Kong 15/F Langham Place 8 Argyle Street Mong Kok, Kowloon Hong Kong S.A.R.
Tokyo 17/F Roppongi Hills North Tower 6-2-31 Roppongi, Minato-ku, Tokyo Japan 106-0032
Office Locations
Hong Kong Simon Rigney
+852-3958-2394 (HK) +81-3-5786-3712 (Tokyo) [email protected]
Tokyo Robert Rowland
+81-3-5786-3711 [email protected]
Michael Newman
+81-3-5786-3713 [email protected]
Contacts
Salt Lake City Patrick Hansen
+852-8191-6925 (HK) +1-801-230-4796 (SLC) [email protected]
Important Disclosures:
This material was prepared for you and is for your information and use only. This material
should only be distributed to other members of that organization on a need to know basis and
should not be distributed or disseminated to any other person or entity.
This material is for information purposes only and it should not be regarded as an offer to sell or
as a solicitation of an offer to buy the securities or other instruments mentioned in it. This
material is based on current public information that Custom Products Group Limited ("Custom
Products") considers reliable, but we make no representation that it is accurate or complete,
and it should not be relied on as such. No investment opinion or advice is provided, intended,
or solicited. Custom Products offers no warranty, either expressed or implied, regarding the
veracity of data or interpretations of data included in this report. This material is provided with
the understanding that Custom Products is not acting in a fiduciary capacity. Opinions
expressed herein reflect the opinion of Custom Products and are subject to change without
notice.
The products mentioned in this document may not be eligible for sale in some states or
countries, and they may not be suitable for all types of investors. The value of and the income
produced by products may fluctuate, so that an investor may get back less than they invested.
Value and income may be adversely affected by exchange rates, interest rates, or other
factors. Past performance is not necessarily indicative of future results. If a product is income
producing, part of the capital invested may be used to pay that income. © 2015 Custom
Products Group Limited. All rights reserved.
Salt Lake City 299 South Main Street Suite 1300 Salt Lake City, UT United States, 84111