direct displacement-based seismic assessment of … for the effects of cyclic loading and...
TRANSCRIPT

Computers and Concrete, Vol. 21, No. 4 (2018) 355-365
DOI: https://doi.org/10.12989/cac.2018.21.4.355 355
Copyright © 2018 Techno-Press, Ltd. http://www.techno-press.org/?journal=cac&subpage=8 ISSN: 1598-8198 (Print), 1598-818X (Online)
1. Introduction
The performance-based seismic design (PBSD)
methodologies have found more prevalent use in the
seismic design of buildings due to the fact that they
consider not only the building performance requirements,
but also the economic losses resulting from an earthquake.
The PBSD incorporates four specific analysis methods: the
linear static analysis, the linear dynamic analysis, the
pushover analysis (also called the nonlinear static analysis)
and the nonlinear dynamic analysis. The pushover analysis
is more accurate than the linear analysis, while being much
faster than the nonlinear dynamic analysis-a good
compromise for the seismic performance evaluation of
building structures.
In the nonlinear pushover analysis of frame structures,
one-dimensional distributed nonlinearity fiber elements
employing various constitutive relationships represent the
most common approach because of their computational
efficiency and analytical accuracy. Although several
procedures have been proposed, only a small number of
them can account for the effects of cyclic loading and shear-
axial force interaction, both of which are essential for the
seismic performance assessment of frames. Among them
are the formulations proposed by Petrangeli et al. (1999),
Corresponding author, Assistant Professor
E-mail: [email protected] aUndergraduate Student
E-mail: [email protected]
Marini and Spacone (2006), Bairan and Mari (2007), Ceresa
et al. (2009), Guner and Vecchio (2010a, b), and Ferreira et
al. (2015). For the performance-based earthquake
engineering, a computational tool in the form of computer
software is required for the application of the formulations.
The available tools include SAP2000 (CSI 2013),
Ruaumoko (Carr 2007), OpenSees (McKenna et al. 2000),
Seismostruct (Seismosoft 2014), and VecTor5 (Guner and
Vecchio 2008). SAP2000 and Ruaumoko are based on a
lumped-plasticity approach, and requires the input of the
complete shear response of each plastic hinge. Seismostruct
does not have a built-in capability to consider shear effects
in a cyclic load analysis of concrete frames. OpenSees does
not have pre- and post-processing software for practical
applications to aid in the model creation and result
visualization such as crack patterns, deformed shape, and
failure modes. Consequently, the program VecTor5 is used
in this current study.
VecTor5 is a fiber-based, distributed-plasticity finite
element modeling procedure for shear-critical planar
frames. It was previously verified for the static (monotonic
and cyclic) and dynamic (impact, blast and earthquake) load
conditions (Guner and Vecchio 2010a, 2010b, 2011, 2012,
and Guner 2016), and found to accurately simulate
experimental response of frames including strengths,
stiffnesses, ductilities and failure modes under these load
conditions. Parameters such as crack widths, reinforcement
strains and member deformations were also simulated well.
This current study is aimed at further verifying this
procedure’s accuracy and applicability in seismic
performance evaluation by using pushover analyses. This
Direct displacement-based seismic assessment of concrete frames
Chu Peng1a and Serhan Guner2
1Department of Civil Engineering, South China University of Technology, 381 Wushan Road, Tianhe District, Guangzhou, 510641, P. R. China
2Department of Civil and Environmental Engineering, University of Toledo, 2801 W Bancroft St. MS 307, Toledo, Ohio 43606, USA
(Received July 23, 2017, Revised October 12, 2017, Accepted November 15, 2017)
Abstract. Five previously-tested reinforced concrete frames were modelled using a nonlinear finite element analysis procedure
to demonstrate the accurate response simulations for seismically-deficient frames through pushover analyses. The load
capacities, story drifts, and failure modes were simulated. This procedure accounts for the effects of shear failures and the shear-
axial force interaction, and thus is suitable for modeling seismically-deficient frames. It is demonstrated that a comprehensive
analysis method with a capability of simulating material constitutive response and significant second-order mechanisms is
essential in achieving a satisfactory response simulation. It is further shown that such analysis methods are invaluable in
determining the expected seismic response, safety, and failure mode of the frame structures for a performance-based seismic
evaluation. In addition, a new computer program was developed to aid researchers and engineers in the direct displacement-
based seismic design process by assessing whether a frame structure meets the code-based performance requirements by
analyzing the analysis results. As such, the proposed procedure facilitates the performance-based design of new buildings as well
as the numerical assessment and retrofit design of existing buildings. A sample frame analysis was presented to demonstrate the
application and verification of the approach.
Keywords: computational mechanics; computer modeling; seismic evaluation of existing buildings; software
development & applications; structural safety
Chu Peng and Serhan Guner
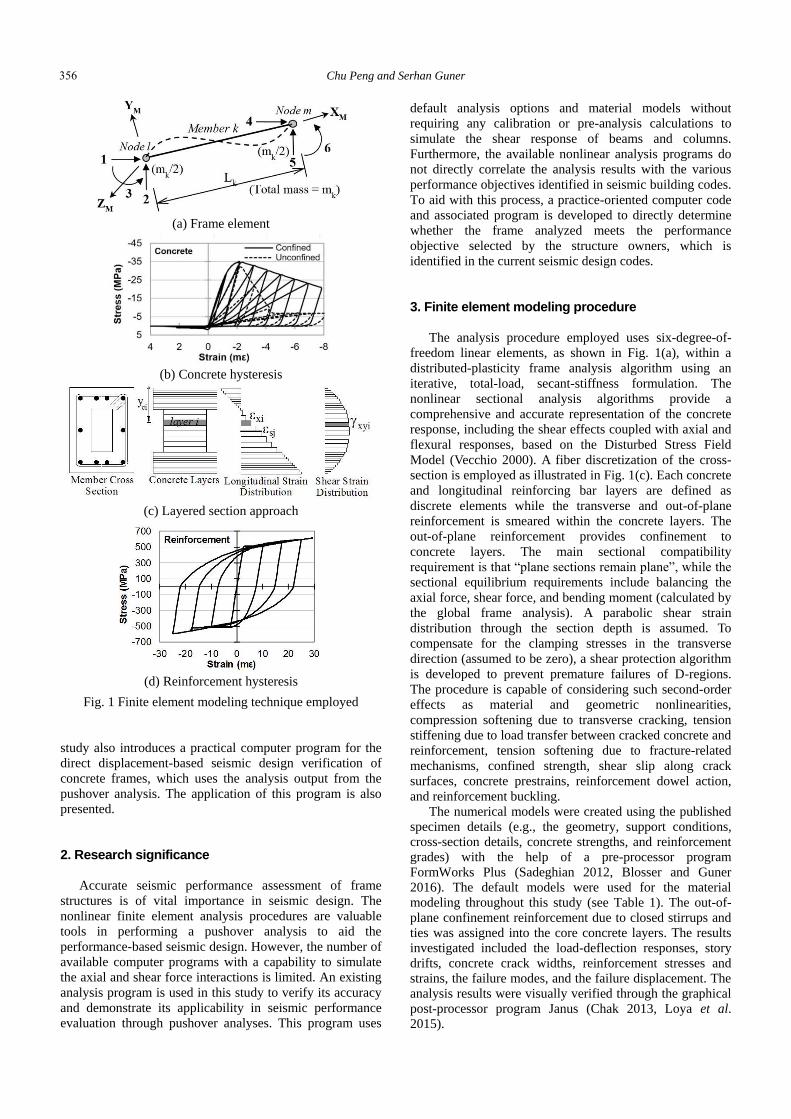
(a) Frame element
(b) Concrete hysteresis
(c) Layered section approach
(d) Reinforcement hysteresis
Fig. 1 Finite element modeling technique employed
study also introduces a practical computer program for the
direct displacement-based seismic design verification of
concrete frames, which uses the analysis output from the
pushover analysis. The application of this program is also
presented.
2. Research significance
Accurate seismic performance assessment of frame
structures is of vital importance in seismic design. The
nonlinear finite element analysis procedures are valuable
tools in performing a pushover analysis to aid the
performance-based seismic design. However, the number of
available computer programs with a capability to simulate
the axial and shear force interactions is limited. An existing
analysis program is used in this study to verify its accuracy
and demonstrate its applicability in seismic performance
evaluation through pushover analyses. This program uses
default analysis options and material models without
requiring any calibration or pre-analysis calculations to
simulate the shear response of beams and columns.
Furthermore, the available nonlinear analysis programs do
not directly correlate the analysis results with the various
performance objectives identified in seismic building codes.
To aid with this process, a practice-oriented computer code
and associated program is developed to directly determine
whether the frame analyzed meets the performance
objective selected by the structure owners, which is
identified in the current seismic design codes.
3. Finite element modeling procedure
The analysis procedure employed uses six-degree-of-
freedom linear elements, as shown in Fig. 1(a), within a
distributed-plasticity frame analysis algorithm using an
iterative, total-load, secant-stiffness formulation. The
nonlinear sectional analysis algorithms provide a
comprehensive and accurate representation of the concrete
response, including the shear effects coupled with axial and
flexural responses, based on the Disturbed Stress Field
Model (Vecchio 2000). A fiber discretization of the cross-
section is employed as illustrated in Fig. 1(c). Each concrete
and longitudinal reinforcing bar layers are defined as
discrete elements while the transverse and out-of-plane
reinforcement is smeared within the concrete layers. The
out-of-plane reinforcement provides confinement to
concrete layers. The main sectional compatibility
requirement is that “plane sections remain plane”, while the
sectional equilibrium requirements include balancing the
axial force, shear force, and bending moment (calculated by
the global frame analysis). A parabolic shear strain
distribution through the section depth is assumed. To
compensate for the clamping stresses in the transverse
direction (assumed to be zero), a shear protection algorithm
is developed to prevent premature failures of D-regions.
The procedure is capable of considering such second-order
effects as material and geometric nonlinearities,
compression softening due to transverse cracking, tension
stiffening due to load transfer between cracked concrete and
reinforcement, tension softening due to fracture-related
mechanisms, confined strength, shear slip along crack
surfaces, concrete prestrains, reinforcement dowel action,
and reinforcement buckling.
The numerical models were created using the published
specimen details (e.g., the geometry, support conditions,
cross-section details, concrete strengths, and reinforcement
grades) with the help of a pre-processor program
FormWorks Plus (Sadeghian 2012, Blosser and Guner
2016). The default models were used for the material
modeling throughout this study (see Table 1). The out-of-
plane confinement reinforcement due to closed stirrups and
ties was assigned into the core concrete layers. The results
investigated included the load-deflection responses, story
drifts, concrete crack widths, reinforcement stresses and
strains, the failure modes, and the failure displacement. The
analysis results were visually verified through the graphical
post-processor program Janus (Chak 2013, Loya et al.
2015).
356

Direct displacement-based seismic assessment of concrete frames
Table 1 Default material behavior models used
Concrete
Behavior Model
Reinforcement
Behavior Model
Compression
Pre-Peak
Hognestad
Parabola Hysteresis
Seckin /
Bauschinger
Compression
Post-Peak
Modified Park-
Kent Dowel Action
Tassios
(Crack Slip)
Compression
Softening Vecchio 1992-A Buckling
Refined Dhakal-
Maekawa
Tension
Stiffening
Modified Bentz
2003
Tension
Softening Considered
Analysis
Options Model
Confined
Strength Kupfer/Richard
Geometric
Nonlinearity Considered
Dilatation Variable Kupfer Shear Analysis
Mode
Parabolic Shear
Strain
Cracking
Criterion Mohr-Coulomb Shear Protection On
Crack Width
Check Limit=Agg/5
Convergence
Limit 1.00001
Hysteresis Nonlinear
(Vecchio)
Maximum No of
Iterations 100
Slip Distortion Vecchio-Lai
Fig. 2 Finite element model of Ghannoum-Moehle frame
(as shown by post-processor Janus)
4. Finite element modelling of RC frames
4.1 Ghannoum and Moehle frame
A 1/3-scale, three-bay, three-story, planar reinforced
concrete frame was tested by Ghannoum and Moehle
(2012). Two columns had ductile design details with small
stirrup spacing, satisfying the ACI 318-08 (2008)
requirements for special moment-resisting frames, while the
other two columns had older-type, non-ductile design
details. The frame was tested on a shake table subjected to
the 1985 Chile earthquake with a scale factor of 1/√3.
The frame was modelled using 349 nodes and 354
members. Three member types were used for the columns
and beams; three additional member types were used to
model the beam-column joints. The default analysis options
and material behaviour models were used with no
(a) Experiment failure mode (Ghannoum and Moehle,
2012)
(b) Analysis (as shown by post-processor Janus)
(c) Crack and rebar legend from Janus
Fig. 3 Comparison of experiment and analysis failure mode
adjustments made. The lead weight blocks were modelled
using point loads, and the pushover loading was applied in a
displacement-controlled mode with the proportions shown
in Fig. 2.
The analytical base shear versus story drift response is
compared with the experimental backbone curve in Fig.
4(a). The analysis captured the experimental load capacity
reasonably well. The slight underestimation may have
resulted from the idealized pushover load distribution or
other factors such as the post-tensioned restraining system
or lead weights bolted to the beams, both of which were not
explicitly modelled in the analysis.
The experimental failure mode involved shear failures
of the non-ductile columns at their bases which were
successfully captured in the analysis (see Fig. 3). For the
ductile columns, both experiment and analytical results
357

Chu Peng and Serhan Guner
(a) Ghannoum-Moehle frame
(b) Wu et al. frame
Fig. 4 Comparison of experiment and analysis results
indicated the formation of significant plastic hinges,
resulting in large rotation near beam-column joints and the
supports.
4.2 Wu et al. frame
A single-story, four-column, 1/3-scale planar frame with
two ductile and two non-ductile columns was tested by Wu
et al. (2008). The frame was loaded with lead packet stacks,
weighing 173.6 kN in total, to represent the weight and
mass associated with higher floors. The earthquake loading
was applied through a shake table.
The frame was modelled using the experimental details,
and analyzed using a pushover analysis as shown in Fig. 5.
Fig. 4(b) shows the calculated and observed base shear
versus roof drift responses. The analysis was able to capture
the load capacity of the frame with predicted-to-observed
ratio of 0.86. The stiffness degradation was also captured
well.
The ductile columns experienced a flexural failure with
significant plastic deformations during the experiment,
which was simulated well in the analysis. The nonductile
columns experienced axial and shear failure in the
experiment. The column members near beam-column joints
showed shear and axial failures in the analysis, confirming
suitability of the numerical simulation procedure in
capturing the failure mode (see Fig. 6).
4.3 Yavari el al. frame
Two 1/2.25-scale, two-bay, two-story reinforced
concrete frame specimens were tested by Yavari et al.
(2013), as shown in Fig. 7. These two specimens are
denoted as MCFS (moderate axial load, confined joints,
flexure-shear failure type), HCFS (high axial load, confined
joints, flexure-shear failure type). Two steel frames were
bolted to the shaking table on either side of the specimens
to brace the specimens in the out-of-plane direction by
means of machined rollers at each beam level. Both of the
Fig. 5 Finite element model of Wu et al. frame (as shown by post-processor Janus)
Ductile Column Non-ductile Column
(a) Experiment (Wu et al. 2008) (b) Analysis (as shown by post-processor Janus)
Fig. 6 Comparison of experiment and analysis failure mode of Wu et al. frame
358

Direct displacement-based seismic assessment of concrete frames
Fig. 7 Finite element model of Yavari et al. frame (as shown
by post-processor Janus)
(a)
(b)
Fig. 8 Comparison of experiment and analysis results
test frames were subjected to the same shake table motion
recorded from the 1999 Chi-Chi earthquake.
The frames were modelled using a similar approach as
discussed previously and analyzed subjected to pushover
loading, as shown in Fig. 7. As seen in Fig. 8, the analytical
and experiment results are quite similar in terms of peak
loads. Yavari et al. (2013) defines the shear failure as 20%
reduction in the shear resistance, accompanied by diagonal
cracking. Based on this criterion, for the MCFS specimen,
(a) Experiment (Yavari et al. 2013)
(b) Analysis (as shown by post-processor)
Fig. 9 Comparison of experiment and analysis failure mode
of MCFS
Vertical and Inclined
Cracks at First-story
Middle Column Base
Beam Flexural
Cracks
(a) Experiment (Yavari et al. 2013)
(b) Analysis (as shown by post-processor)
Fig. 10 Comparison of experiment and analysis failure
mode of HCFS
the experimental failure mode involved a flexural-shear-
axial failure. The middle column first showed flexural
cracks, then a shear failure occurred, followed by an axial
Shear Cracks at
First-story Middle
Column Top
Shear Cracks at
First-story Middle
Column Base
359
Chu Peng and Serhan Guner
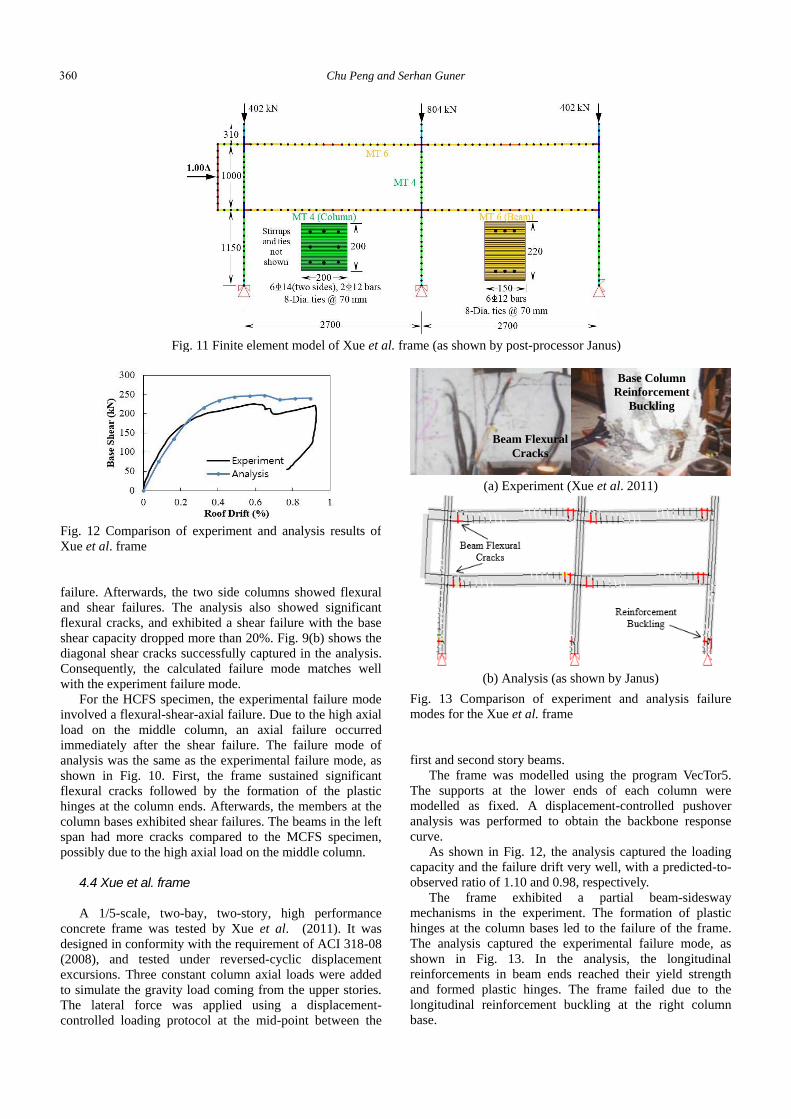
Fig. 12 Comparison of experiment and analysis results of
Xue et al. frame
failure. Afterwards, the two side columns showed flexural
and shear failures. The analysis also showed significant
flexural cracks, and exhibited a shear failure with the base
shear capacity dropped more than 20%. Fig. 9(b) shows the
diagonal shear cracks successfully captured in the analysis.
Consequently, the calculated failure mode matches well
with the experiment failure mode.
For the HCFS specimen, the experimental failure mode
involved a flexural-shear-axial failure. Due to the high axial
load on the middle column, an axial failure occurred
immediately after the shear failure. The failure mode of
analysis was the same as the experimental failure mode, as
shown in Fig. 10. First, the frame sustained significant
flexural cracks followed by the formation of the plastic
hinges at the column ends. Afterwards, the members at the
column bases exhibited shear failures. The beams in the left
span had more cracks compared to the MCFS specimen,
possibly due to the high axial load on the middle column.
4.4 Xue et al. frame
A 1/5-scale, two-bay, two-story, high performance
concrete frame was tested by Xue et al. (2011). It was
designed in conformity with the requirement of ACI 318-08
(2008), and tested under reversed-cyclic displacement
excursions. Three constant column axial loads were added
to simulate the gravity load coming from the upper stories.
The lateral force was applied using a displacement-
controlled loading protocol at the mid-point between the
(a) Experiment (Xue et al. 2011)
(b) Analysis (as shown by Janus)
Fig. 13 Comparison of experiment and analysis failure
modes for the Xue et al. frame
first and second story beams.
The frame was modelled using the program VecTor5.
The supports at the lower ends of each column were
modelled as fixed. A displacement-controlled pushover
analysis was performed to obtain the backbone response
curve.
As shown in Fig. 12, the analysis captured the loading
capacity and the failure drift very well, with a predicted-to-
observed ratio of 1.10 and 0.98, respectively.
The frame exhibited a partial beam-sidesway
mechanisms in the experiment. The formation of plastic
hinges at the column bases led to the failure of the frame.
The analysis captured the experimental failure mode, as
shown in Fig. 13. In the analysis, the longitudinal
reinforcements in beam ends reached their yield strength
and formed plastic hinges. The frame failed due to the
longitudinal reinforcement buckling at the right column
base.
Fig. 11 Finite element model of Xue et al. frame (as shown by post-processor Janus)
Beam Flexural
Cracks
Base Column
Reinforcement
Buckling
360

Direct displacement-based seismic assessment of concrete frames
Table 2 Comparison of experiment and analyses results of
five frames
Frame Peak load (kN) Peak drift* (%)
Analysis Experiment Ratio Analysis Experiment Ratio
Ghannoum 105 122 0.86 4.60 4.18 1.10
Wu 107 124 0.86 4.52 4.37 1.03
MCFS 195 220 0.89 3.89 3.86 1.01
HCFS 205 218 0.94 2.89 2.71 1.07
Xue 249 227 1.10 0.90 0.92 0.98
Mean 0.93 Mean 1.04
COV (%) 10.7 COV (%) 4.6
*Peak drift: drift at frame failure
4.5 Summary of results
The experiment and analysis results of all of the five
frames are summarized in Table 2, which indicates that the
numerical procedure provides satisfactory accuracy in both
the load capacity and interstory drift ratio. The ratio of the
predicted-to-observed peak load for all five frames has a
mean of 0.93 with a coefficient of covariation (COV) of
10.7%. The failure drift ratio was predicted with a mean
value of 1.04 and a COV of 4.6%. These values are well
within the accuracy margins that can be expected from the
nonlinear analysis of concrete frames subjected to their
ultimate collapse conditions. The minor underestimation in
the peak load capacities of four of the frames can be
attributed to several factors including variability in the
material properties and workmanship, challenges in
modelling the exact experimental boundary conditions, and
how the forces are measured during the experimental
program. The slight overestimation in the peak load
capacity of the Xue frame is attributed to the simplified
(i.e., rigidly-connected) modeling of the steel load
application column used in the experimental program. The
analyses were conducted using a laptop computer with a
processor of Intel Core i5-4210M @ 2.60 GHz, RAM of
4.00 GB, and a solid-state drive speed of 200 MB/s. The
longest analysis required a computational time of 9 minutes
and 32 seconds for the Ghannoum-Moehle frame.
5. Overview of the program DDBSD
Priestley (1993, 1998), Priestley and Kowalsky (2000)
and Priestley et al. (2007) pioneered the direct
displacement-based seismic design method. The accuracy
of this approach was verified by analyzing a series of
structures with different structural types and materials using
inelastic-time-history analyses. Extensive design examples
using this approach were demonstrated in Priestley et al.
(2007) to illustrate the reliability of this approach. A
program named DDBSD (Direct Displacement-Based
Seismic Design) was developed to utilize the nonlinear
finite element analysis output and the response spectrum in
ASCE 7-10 (2013) code to verify whether the performance
Fig. 14 Flowchart of the DDBSD program
361

Chu Peng and Serhan Guner
(a) Damping ratio (Priestley et al. 2007)
(b) Acceleration response spectrum (ASCE 7-10 2013)
Fig. 15 Explanation of the parameters used in DDBSD
program
objectives in FEMA 356 (2000) is satisfied or not for a
given frame structure using the direct displacement-based
seismic design method. Although this program is specially
written for the finite element analysis program VecTor5, the
proposed methodology can be applied to any other
nonlinear finite element procedure.
The flowchart of the program DDBSD is presented in
Fig. 14. The program will first require the users to select
performance objectives of the structure to resist earthquake
(i.e., limited objective, basic safety objective, enhanced
objective). Then the program will read the analysis output
files to obtain the yield displacement △y value. The design
displacement △d value is then calculated using the drift
limit ratio recommended by FEMA 356 (2000) times the
structure height. The ratio of the design displacement to the
yield displacement gives the displacement ductility. Using
the displacement ductility, an equivalent viscous damping
ratio is obtained using Fig. 15(a). The design acceleration
response spectrum is then constructed using the user-given
parameters TL, SS and S1, these parameters can be calculated
through the U.S. Seismic Design Maps (2016) by using the
structure location and the site soil classification. After a
series of calculations, the design displacement response
spectrum is obtained, through which the equivalent period
Teq is obtained. Using the equivalent period Teq and the
equivalent mass meq, the required equivalent stiffness Kreq is
obtained. The actual equivalent stiffness Kaeq is obtained
using the load-displacement response of the pushover
analysis. By comparing Kreq and Ka
eq, a decision can be
made regarding whether or not the structure analyzed can
satisfy the performance objectives of the FEMA 356 (2000)
code, which are related to the performance levels (i.e.,
immediate occupancy, life safety and collapse prevention)
and the earthquake hazard levels.
The design displacement response spectrum is obtained
from the design acceleration response spectrum shown in
Fig. 15(b), using Eqs. (1)-(3) from Filiatrault and Folz
(2002).
ACodeDCode Sπ
TS 2
2
4= (1)
DCodeeq
eqςD Sς.
.S
+020
070= (2)
( )DCode
.
rDTr S/TS440
474= (3)
Eq. (1) is used to convert the code design acceleration
response spectrum SACode for a given seismic zone into a
corresponding displacement response spectrum SDCode. Eq.
(2) is used when the viscous damping ratio is different from
5%. Eq. (3) is used when the mean return period Tr is
different from 474 years. Tr is related to the earthquake
hazard levels. Based on FEMA 356 (2000)
recommendation, Tr is 72, 225, 474, 2,475 years for 50%,
20%, 10% and 2% probability of exceedance in fifty years,
respectively.
The program DDBSD calculates the required equivalent
stiffness using Eq. (4) from Priestley et al. (2007).
2
24=
eq
eqreq T
mπK (4)
Teq is the equivalent period and meq is the equivalent
mass. The equivalent period is obtained from the design
displacement response spectrum, using the design
displacement as the vertical coordinate.
The equivalent mass represents the mass of the
equivalent one-degree-of-freedom system, and calculated
using Eq. (5) from Priestley et al. (2007).
∑n
id
ii
eq Δ
Δmm
1== (5)
Actual equivalent stiffness is the value of the design
base shear divided by the design displacement. The design
base shear is obtained from the nonlinear pushover analysis
results.
By comparing the required equivalent stiffness and the
actual equivalent stiffness, the program checks whether the
structure analyzed satisfies the performance objectives of
the FEMA 356 (2000) code. If the actual equivalent
stiffness is greater than or equal to the required equivalent
stiffness, the program indicates that the structure achieves
the required performance objective.
6. Direct displacement-based seismic design example
To demonstrate the application of the DDBSD program,
the analysis results of the Wu et al. frame was used. It was
assumed that the frame is located in Los Angeles, USA, and
constructed in a soil-type D (i.e., stiff soil). The seismic
design check was performed for the basic safety objective
for demonstration purposes, therefore, the life safety and
362

Direct displacement-based seismic assessment of concrete frames
(a) Spectral acceleration in analysis
(b) Spectral displacement in analysis
Fig. 16 Response spectrum
collapse prevention limit states must be achieved under the
earthquake hazard level of 10% and 2% probability of
exceedance in 50 years, respectively. According to the
performance level drift limit recommendation of FEMA 356
(2000), the design displacement for the life safety limit state
is 26.5 mm (2% drift), while it is 53 mm (4% drift) for the
collapse prevention limit state.
The DDBSD program first detects the average
longitudinal reinforcement stresses using the analysis
output, and compares them with the yield stress values to
obtain the corresponding yield displacement. For this frame,
a yield displacement value of 6 mm was obtained. The ratio
of the design displacement to the yield displacement is the
displacement ductility, which is 4.4 for the life safety limit
state and 8.8 for the collapse prevention limit state. The
viscous damping ratios were calculated using Fig. 15(a) to
be 18.9% and 20% for the life safety limit and collapse
prevention limit states, respectively.
For the structure location and the soil type, the TL, SS
and S1 values were obtained using the U.S. Seismic Design
Maps (2016) as 8s, 2.433g, and 0.853g, respectively. The
program DDBSD uses these parameters to calculate the
design acceleration response spectrum per the ASCE 7-10
(2013) code, as shown in Fig. 16(a). For the Wu et al. frame
to satisfy the basic safety objective, the return period is 474
and 2,475 years for the life safety and collapse prevention
limit states, respectively. Using Eqs. (1)-(3), the design
displacement response spectrum was obtained as showed in
Fig. 16(b).
The equivalent periods Teq for the life safety limit state
and the collapse prevention limit state were then obtained
using the design displacement response spectrum, as shown
in Fig. 17(a). The program DDBSD calculates the total
mass using the analysis output files and obtains the
equivalent mass meq using Eq. (5).
(a) Equivalent periods
(b) Design Load
Fig. 17 Response spectrum
Table 3 Summary of the seismic design example
Performance
Level
Damping
Ratio
Teq
(s)
Kreq
(N/mm)
Kaeq
(N/mm)
Kaeq /
Kreq
Life Safety 18.9% 0.337 4254.2 3969.8 0.93
Collapse
Prevention 20% 0.336 2736.6 1683 0.61
The required equivalent stiffness Kreq was calculated
using Eq. (4), which was found to be 4254.2 and 2736.6
N/mm for the life safety and collapse prevention limit
states, respectively. The actual equivalent stiffness Kaeq was
then calculated by dividing the design load by the design
displacement obtained from the pushover analysis curve.
Kaeq was calculated to be 3969.8 and 1683 N/mm for the life
safety and collapse prevention limit states.
Table 3 shows the summary of the direct displacement-
based seismic design checks performed on the Wu et al.
frame. Based on the results, the structure can satisfy neither
the life safety nor the collapse prevention limit state. The
actual equivalent stiffness is 7% smaller than the required
equivalent stiffness for the life safety limit state and 39%
smaller for the collapse prevention limit state. Therefore,
the structure cannot meet the basic safety objective
recommended by FEMA 356 (2000) code.
To validate the results obtained by the DDBSD program,
a nonlinear static procedure (NSP) prescribed in ASCE 41-
13 document was conducted. The NSP is based on the
assumption that the response of the MDOF structure can be
related to that of an equivalent SDOF. For this purpose, the
NSP is a useful tool to the engineering practitioner for the
assessment of the seismic behavior of structures. In the NSP
procedure, the gravity loads are applied followed by a
lateral load pattern that is gradually increased in the
direction under consideration. The investigated Wu et al.
frame was pushed using a single lateral load pattern at the
363
Chu Peng and Serhan Guner
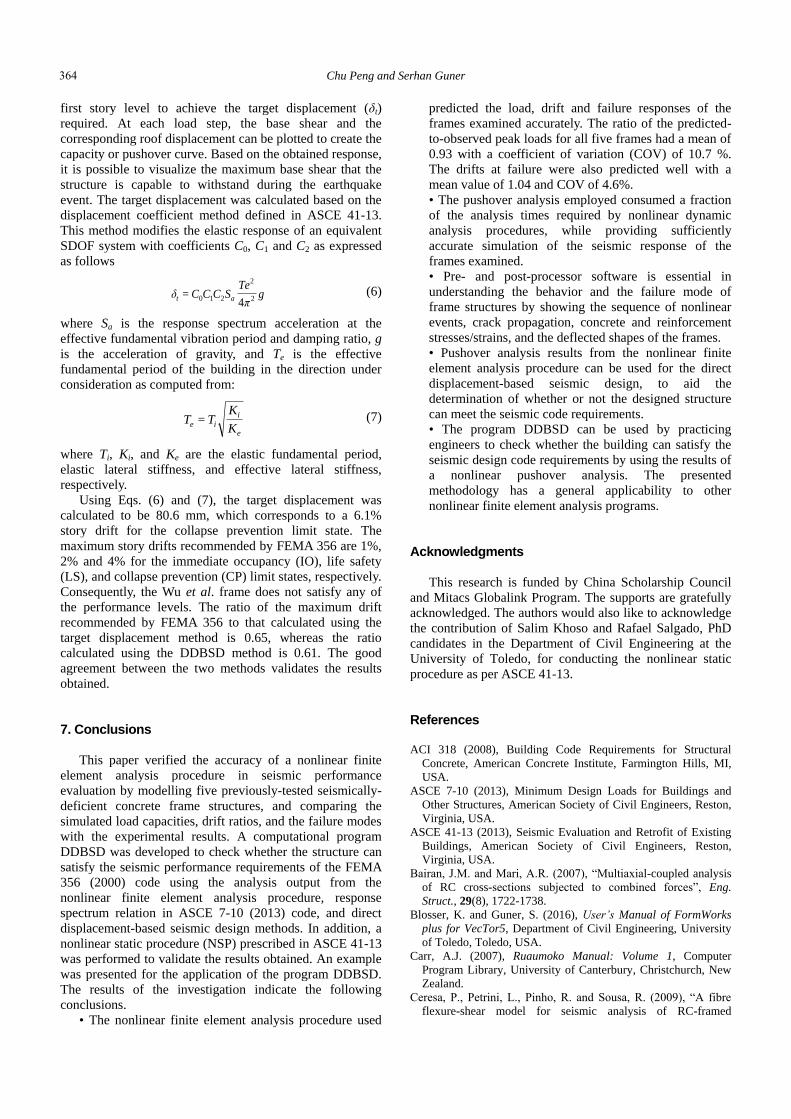
first story level to achieve the target displacement (δt)
required. At each load step, the base shear and the
corresponding roof displacement can be plotted to create the
capacity or pushover curve. Based on the obtained response,
it is possible to visualize the maximum base shear that the
structure is capable to withstand during the earthquake
event. The target displacement was calculated based on the
displacement coefficient method defined in ASCE 41-13.
This method modifies the elastic response of an equivalent
SDOF system with coefficients C0, C1 and C2 as expressed
as follows
gπ
TeSCCCδ at 2
2
2104
= (6)
where Sa is the response spectrum acceleration at the
effective fundamental vibration period and damping ratio, g
is the acceleration of gravity, and Te is the effective
fundamental period of the building in the direction under
consideration as computed from:
e
i
ie K
KTT = (7)
where Ti, Ki, and Ke are the elastic fundamental period,
elastic lateral stiffness, and effective lateral stiffness,
respectively.
Using Eqs. (6) and (7), the target displacement was
calculated to be 80.6 mm, which corresponds to a 6.1%
story drift for the collapse prevention limit state. The
maximum story drifts recommended by FEMA 356 are 1%,
2% and 4% for the immediate occupancy (IO), life safety
(LS), and collapse prevention (CP) limit states, respectively.
Consequently, the Wu et al. frame does not satisfy any of
the performance levels. The ratio of the maximum drift
recommended by FEMA 356 to that calculated using the
target displacement method is 0.65, whereas the ratio
calculated using the DDBSD method is 0.61. The good
agreement between the two methods validates the results
obtained.
7. Conclusions
This paper verified the accuracy of a nonlinear finite
element analysis procedure in seismic performance
evaluation by modelling five previously-tested seismically-
deficient concrete frame structures, and comparing the
simulated load capacities, drift ratios, and the failure modes
with the experimental results. A computational program
DDBSD was developed to check whether the structure can
satisfy the seismic performance requirements of the FEMA
356 (2000) code using the analysis output from the
nonlinear finite element analysis procedure, response
spectrum relation in ASCE 7-10 (2013) code, and direct
displacement-based seismic design methods. In addition, a
nonlinear static procedure (NSP) prescribed in ASCE 41-13
was performed to validate the results obtained. An example
was presented for the application of the program DDBSD.
The results of the investigation indicate the following
conclusions.
• The nonlinear finite element analysis procedure used
predicted the load, drift and failure responses of the
frames examined accurately. The ratio of the predicted-
to-observed peak loads for all five frames had a mean of
0.93 with a coefficient of variation (COV) of 10.7 %.
The drifts at failure were also predicted well with a
mean value of 1.04 and COV of 4.6%.
• The pushover analysis employed consumed a fraction
of the analysis times required by nonlinear dynamic
analysis procedures, while providing sufficiently
accurate simulation of the seismic response of the
frames examined.
• Pre- and post-processor software is essential in
understanding the behavior and the failure mode of
frame structures by showing the sequence of nonlinear
events, crack propagation, concrete and reinforcement
stresses/strains, and the deflected shapes of the frames.
• Pushover analysis results from the nonlinear finite
element analysis procedure can be used for the direct
displacement-based seismic design, to aid the
determination of whether or not the designed structure
can meet the seismic code requirements.
• The program DDBSD can be used by practicing
engineers to check whether the building can satisfy the
seismic design code requirements by using the results of
a nonlinear pushover analysis. The presented
methodology has a general applicability to other
nonlinear finite element analysis programs.
Acknowledgments
This research is funded by China Scholarship Council
and Mitacs Globalink Program. The supports are gratefully
acknowledged. The authors would also like to acknowledge
the contribution of Salim Khoso and Rafael Salgado, PhD
candidates in the Department of Civil Engineering at the
University of Toledo, for conducting the nonlinear static
procedure as per ASCE 41-13.
References ACI 318 (2008), Building Code Requirements for Structural
Concrete, American Concrete Institute, Farmington Hills, MI,
USA.
ASCE 7-10 (2013), Minimum Design Loads for Buildings and
Other Structures, American Society of Civil Engineers, Reston,
Virginia, USA.
ASCE 41-13 (2013), Seismic Evaluation and Retrofit of Existing
Buildings, American Society of Civil Engineers, Reston,
Virginia, USA.
Bairan, J.M. and Mari, A.R. (2007), “Multiaxial-coupled analysis
of RC cross-sections subjected to combined forces”, Eng.
Struct., 29(8), 1722-1738.
Blosser, K. and Guner, S. (2016), User’s Manual of FormWorks
plus for VecTor5, Department of Civil Engineering, University
of Toledo, Toledo, USA.
Carr, A.J. (2007), Ruaumoko Manual: Volume 1, Computer
Program Library, University of Canterbury, Christchurch, New
Zealand.
Ceresa, P., Petrini, L., Pinho, R. and Sousa, R. (2009), “A fibre
flexure-shear model for seismic analysis of RC-framed
364

Direct displacement-based seismic assessment of concrete frames
structures”, Earthq. Eng. Struct. Dyn., 38(5), 565-586.
Chak, I.N. (2013), “Janus: a post-processor for VecTor analysis
software”, M.A.Sc. Dissertation, Department of Civil
Engineering, University of Toronto, Toronto, Canada.
CSI (2013), Analysis Reference Manual for SAP2000® , ETABS®
and SAFE™, Computers and Structures, Inc., Berkeley, CA,
USA.
FEMA 356 (2000), Prestandard and Commentary for the Seismic
Rehabilitation of Buildings, Reston, Virginia.
Ferreira, D., Bairán, J.M. and Marí, A. (2015), “Shear
strengthening of reinforced concrete beams by means of vertical
prestressed reinforcement”, Struct. Infrastr. Eng. Mainten.
Manage. Life-C. Des. Perform., 12(3), 394-410.
Filiatrault, A. and Folz, B. (2002), “Performance-based seismic
design of wood framed buildings”, J. Struct. Eng., 128(1), 39-
47.
Ghannoum, W.M. and Moehle, J.P. (2012), “Shake-table tests of a
concrete frame sustaining column axial failures”, ACI Struct. J.,
109(3), 393-402.
Guner, S. (2016), “Simplified modeling of frame elements
subjected to blast loads”, ACI Struct. J., 113(2), 363-372.
Guner, S. and Vecchio, F.J. (2008), User’s Manual of VecTor5,
Department of Civil Engineering, University of Toronto,
Toronto, Canada.
Guner, S. and Vecchio, F.J. (2010a), “Pushover analysis of shear-
critical frames: formulation”, ACI Struct. J., 107(1), 63-71.
Guner, S. and Vecchio, F.J. (2010b), “Pushover analysis of shear-
critical frames: verification and application”, ACI Struct. J.,
107(1), 72-81.
Guner, S. and Vecchio, F.J. (2011), “Analysis of shear-critical
reinforced concrete plane frame elements under cyclic loading”,
J. Struct. Eng., ASCE, 137(8), 834-843.
Guner, S. and Vecchio, F.J. (2012), “Simplified method for
nonlinear dynamic analysis of shear-critical frames”, ACI
Struct. J., 109(5), 727-737.
Loya, A.S., Lourenço, D.D.S, Guner, S. and Vecchio, F.J. (2015),
User’s Manual of Janus for VecTor5, Department of Civil
Engineering, University of Toledo, Toledo, USA.
Marini, A. and Spacone, E. (2006), “Analysis of reinforced
concrete elements including shear effects”, ACI Struct. J.,
103(5), 645-655.
McKenna, F., Fenves, G.L., Scott, M.H. and Jeremic, B. (2000),
“Open system for earthquake engineering simulation
(OpenSees)”, Pacific Earthquake Engineering Research Center,
Univ. of California, Berkeley, CA, USA.
Petrangeli, M., Pinto, P.E. and Ciampi, V. (1999), “Fiber element
for cyclic bending and shear of RC structures. I: theory”, J. Eng.
Mech., 125(9), 994-1001.
Priestley, M.J.N. (1993), “Myths and fallacies in earthquake
engineering-conflicts between design and reality”, Bull. NZ.
Nat. Soc. Earthq. Eng., 26(3), 329-341.
Priestley, M.J.N. (1998), “Brief comments on elastic flexibility of
reinforced concrete frames, and significance to seismic design”,
Bull. NZ. Nat. Soc. Earthq. Eng., 31(2), 246-259.
Priestley, M.J.N. and Kowalsky, M.J. (2000), “Direct
displacement-based design of concrete buildings”, Bull. NZ.
Nat. Soc. Earthq. Eng., 33(4), 421-444.
Priestley, M.J.N., Calvi, G.M. and Kowalsky, M.J. (2007), Direct
Displacement Based Design of Structures, Istituto Universitario
di Studi Superiori (IUSS) Press, Pavia, Italy.
Sadeghian, V. (2012), “Formworks-plus: improved pre-processor
for Vector analysis software”, M.A.Sc. Dissertation,
Department of Civil Engineering, University of Toronto,
Toronto, Canada.
Seismosoft (2014), Seismostruct User Manual for Version 7.0,
Seismosoft Ltd, Pavia, Italy.
U.S. Seismic Design Maps (2016), United States Geological
Survey (maps), Reston, Virginia, USA.
Vecchio, F.J. (2000), “Disturbed stress field model for reinforced
concrete: formulation”, J. Struct. Eng., 126(9), 1070-1077.
Wu, C.L., Kuo, W.W., Yang, Y.S., Hwang, S.J., Elwood, K.J.,
Loh, C.H. and Moehle, J.P. (2008), “Collapse of a nonductile
concrete frame: shaking table tests”, Earthq. Eng. Struct. Dyn.,
38(2), 205-224.
Xue, W.C., Cheng, B., Zheng, R.G., Li, L. and Li, J. (2011),
“Seismic performance of nonprestressed and prestressed HPC
frames under low reversed cyclic loading”, J. Struct. Eng.,
137(11), 1254-1262.
Yavari, S., Elwood, K.J., Wu, C.L., Lin, S.H., Hwang, S.J. and
Moehle, J.P. (2013), “Shaking table tests on reinforced concrete
frames without seismic detailing”, ACI Struct. J., 110(6), 1001-
1011.
SF
365