direct elicitation of template concentration from...
TRANSCRIPT
Retroflex digital PCR Supporting Information
Mojtahedi, Fouquier d’Hérouël, Huang (2014) 1
Direct elicitation of template concentration from quantification cycle (Cq) distributions in digital PCR Mitra Mojtahedi1, Aymeric Fouquier d’Hérouël2,3 and Sui Huang1,2
1 Department of Biological Sciences, University of Calgary, Calgary, AB T2N 1N4, Canada 2 Institute for Systems Biology, Seattle, WA 98109, USA 3 Luxembourg Centre for Systems Biomedicine, L-4362 Esch-sur-Alzette, Luxembourg

Retroflex digital PCR Supporting Information
Mojtahedi, Fouquier d’Hérouël, Huang (2014) 2
Supplementary Text
Derivation of model equation
Here we outline the reasoning that leads to the probabilistic model of quanti-fication cycles 𝜌! 𝑦; 𝜆, 𝑘!, 𝜀 in the main text. Starting point is the Poisson dis-tribution 𝑝 𝑘!; 𝜆 . When uniformly distributing a volume containing 𝑛 mole-cules over 𝑁 reactions, it describes the probability of finding 𝑘! molecules in any given reaction volume, while 𝜆 = 𝑛/𝑁 are expected:
𝑝 𝑘!; 𝜆 = e!!𝜆!!𝑘!!
.
To afford for a simpler analytical treatment, it is tempting to rewrite the fac-torial as a Gamma function. Doing this in the Poisson distribution, however, to maintain its norm. A correct analytical extension of the above formula is directly given via its cumulative distribution function (CDF), which can be rewritten as the ratio of the (upper) incomplete and complete Gamma func-tions:
𝑃𝑟 𝑘! ≥ 𝑥; 𝜆 =𝛤! 𝑥𝛤 𝑥 =:𝑃! 𝑥 .
For integer 𝑥, this function recovers the usual Poissonian CDF, as can be verified, and is well defined on the same support of [0,∞). The derivative of 𝑃 𝑥 yields a continuous, interpolating version of the Poisson distribution that retains its norm and thus remains a probability distribution:
𝜌! 𝑥 = 𝜕!𝑃! 𝑥
= 𝛤!! ⋅ 𝜕!𝛤! ⋅ 𝛤 − 𝛤! ⋅ 𝜕!𝛤!
= 𝛤!! ⋅ log 𝑡 e!!𝑡!!!d𝑡∞
!⋅ 𝛤 − 𝛤! ⋅ log 𝑡 e!!𝑡!!!d𝑡
∞
!
= 𝛤!! ⋅ log 𝑡 e!!𝑡!!!d𝑡∞
!e!!𝑡!!!d𝑡
∞
!− e!!𝑡!!!d𝑡
∞
!log 𝑡 e!!𝑡!!!d𝑡
∞
!
= 𝛤!! ⋅ e!!∞,∞
!,!𝑠!!! log 𝑡 e!!𝑡!!!d𝑠d𝑡 − e!!
∞,∞
!,!𝑡!!! log 𝑠 e!!𝑠!!!d𝑠d𝑡
= 𝛤!! ⋅ e! !!!∞,∞
!,!𝑠𝑡 !!! log
𝑡𝑠 d𝑡d𝑠 .

Retroflex digital PCR Supporting Information
Mojtahedi, Fouquier d’Hérouël, Huang (2014) 3
To find the probability distribution of amplification cycles, 𝜌! is transformed using the relation imposed by exponential amplification 𝑥(𝑦) = 𝑘!𝜀! , with the quantifica-‐tion threshold 𝑘! = 𝑥(𝐶!). In terms of continuous variables the transformation reads:
𝜌! 𝑦 = 𝜌! 𝑥(𝑦) ⋅𝜕𝑥𝜕𝑦
= log 𝜀𝑘!𝜀!!
𝛤 𝑘!𝜀!! ! d𝑟∞
!
d𝑠!
!
e! !!! 𝑟𝑠 !!!!!!! log𝑟𝑠
=:𝜌! 𝑦; 𝜆, 𝑘!𝜀 .
Supplementary discussion: circular vs linearized plasmids in PCR
There is a discrepancy in recommendations regarding the use of linearized or circular plasmids in quantitative PCR. Circular plasmids have been reported to have negative effect on PCR efficiency relative to linearized plasmids (Lin et al., 2011). Amplification dropout has been observed with non-linearized plasmid molecules, which could be due to delayed onset of amplification at early cycles or reduced amplification efficiency (Bhat, Herrmann, Armishaw, Corbisier, & Emslie, 2009). On the other hand, it has been reported that line-arized plasmids can result in overestimating target copy numbers in dPCR: linearized plasmid template is potentially present in both double stranded (ds) or denatured single stranded (ss) forms; this gives rise to differences in quantification as high as 2-fold, depending on the denaturation state (Sand-ers et al., 2011). Moreover, it has been reported that circular plasmid can survive repeated freeze and thaw and handling of serial dilution in compare with linearized plasmids (Dhanasekaran et al., 2010). This may introduce unaccounted variability in copy number of templates at different dilution se-ries prepared as replicates. As precision in quantification is important to us, we decided to use circular plasmid for this study. We tried to reduce the possible effects of circular plasmid template by measuring the amplification efficiency of circular plas-mid as well as taking into account the late reported quantification cycle (Cq) in our calculation to compensate for possible delay in amplification initiation using circular plasmid. Negative template control allows us to discard possi-ble non-specific amplification reaction. References cited here Bhat, S., Herrmann, J., Armishaw, P., Corbisier, P., & Emslie, K. R. (2009). Single molecule
detection in nanofluidic digital array enables accurate measurement of DNA copy num-
Retroflex digital PCR Supporting Information
Mojtahedi, Fouquier d’Hérouël, Huang (2014) 4
ber. Analytical and bioanalytical chemistry, 394(2), 457–467. Dhanasekaran, S., Doherty, T. M., Kenneth, J., & Group, T. T. S. (2010). Comparison of dif-
ferent standards for real-time PCR-based absolute quantification. Journal of immuno-logical methods, 354(1-2), 34–39.
Lin, C.-H., Chen, Y.-C., & Pan, T.-M. (2011). Quantification bias caused by plasmid DNA conformation in quantitative real-time PCR assay. PLoS ONE, 6(12), e29101.
Sanders, R., Huggett, J. F., Bushell, C. A., Cowen, S., Scott, D. J., & Foy, C. A. (2011). Evalu-ation of digital PCR for absolute DNA quantification. Analytical chemistry, 83(17), 6474–6484.

Retroflex digital PCR Supporting Information
Mojtahedi, Fouquier d’Hérouël, Huang (2014) 5
Table S1: Standard calculation for dPCR analysis
Unit Note Each dPCR array Number of subarrays 48 ---- Number of reactions (through-holes / subarray)
64 ---- Total 3072 (48x64) reactions / array
Per inlet (experimental design) Total volume 5 µl Master mix volume 3 µl Target volume 2 µl Per subarray Number of reactions (through-holes / subarray)
64 ----
Total volume 2.1* µl 64x33nl reaction volume / subarray**
Master mix volume 1.26 µl Target volume 0.84 µl Per through-hole (chamber) Total volume 33 nl As quoted by
manufacturer Master mix volume 20 nl Target volume 13 nl Target volume per
subarray (64 chambers)
Nomenclature:
dPCR array: A 48-subarray dPCR array, where each subarray is partitioned into 64 reaction through-holes
Inlet: Individual well of 384-well plate for sample loading (distinct for each subarray)
* In our experimental design, the reaction volume per subarray is 42% of the reaction volume prepared per inlet (total volume per subarray/total volume per inlet).
**The total volume per subarray is calculated as 2.1µl based on the manufac-turer quoted values of: 33nl reaction chambers and 64 individual reaction chambers (through-holes) per subarray.
Retroflex digital PCR Supporting Information
Mojtahedi, Fouquier d’Hérouël, Huang (2014) 6
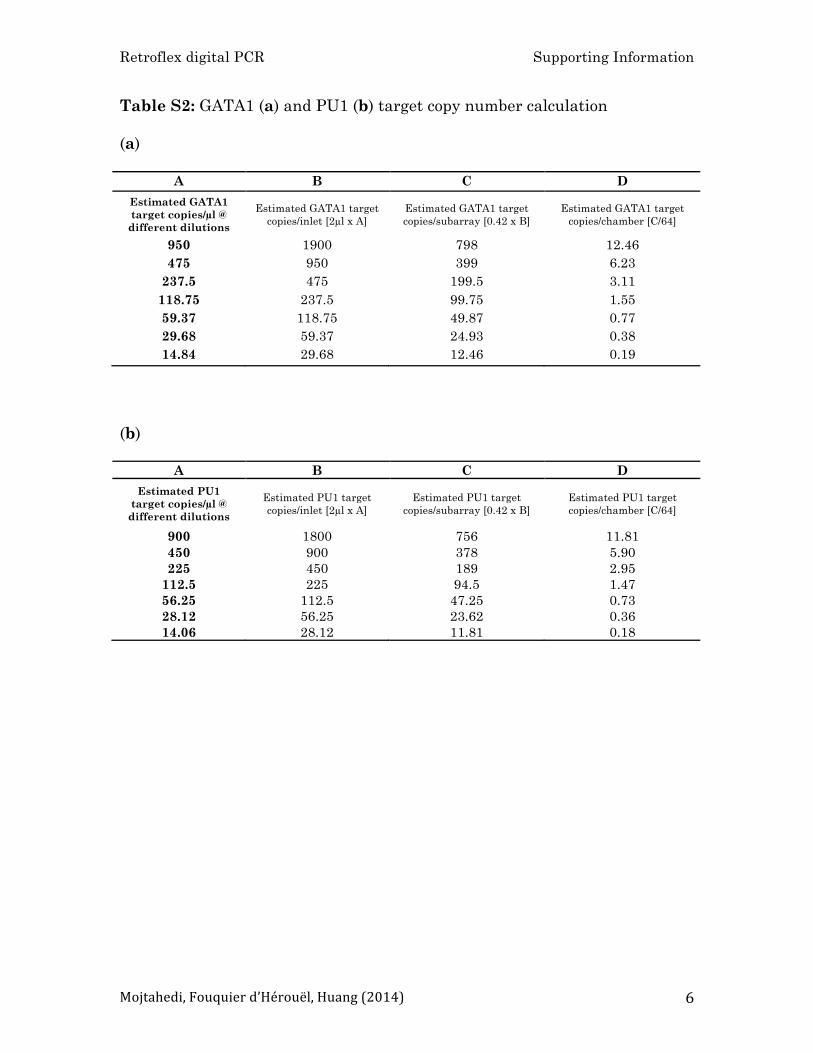
Table S2: GATA1 (a) and PU1 (b) target copy number calculation
(a)
A B C D Estimated GATA1 target copies/µl @
different dilutions
Estimated GATA1 target copies/inlet [2µl x A]
Estimated GATA1 target copies/subarray [0.42 x B]
Estimated GATA1 target copies/chamber [C/64]
950 1900 798 12.46 475 950 399 6.23
237.5 475 199.5 3.11 118.75 237.5 99.75 1.55 59.37 118.75 49.87 0.77 29.68 59.37 24.93 0.38 14.84 29.68 12.46 0.19
(b)
A B C D Estimated PU1
target copies/µl @ different dilutions
Estimated PU1 target copies/inlet [2µl x A]
Estimated PU1 target copies/subarray [0.42 x B]
Estimated PU1 target copies/chamber [C/64]
900 1800 756 11.81 450 900 378 5.90 225 450 189 2.95
112.5 225 94.5 1.47 56.25 112.5 47.25 0.73 28.12 56.25 23.62 0.36 14.06 28.12 11.81 0.18
Retroflex digital PCR Supporting Information
Mojtahedi, Fouquier d’Hérouël, Huang (2014) 7
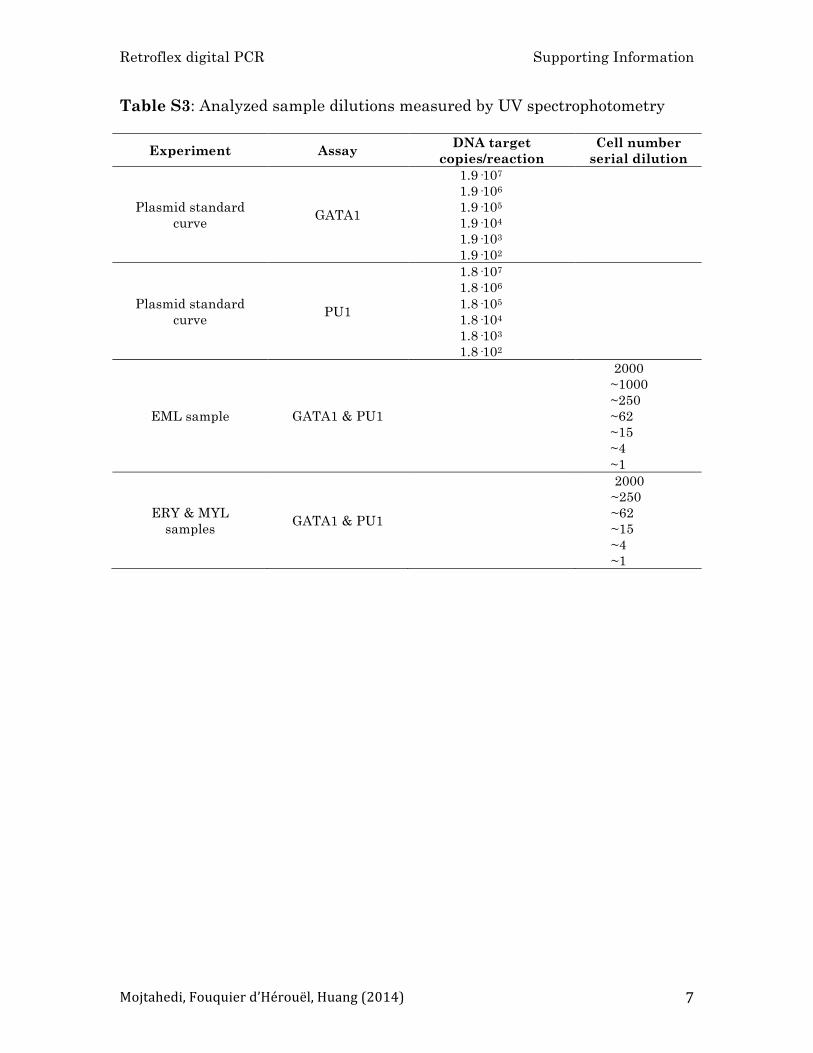
Table S3: Analyzed sample dilutions measured by UV spectrophotometry
Experiment Assay DNA target
copies/reaction Cell number
serial dilution
Plasmid standard curve
GATA1
1.9·107
1.9·106
1.9·105
1.9·104
1.9·103
1.9·102
Plasmid standard curve
PU1
1.8·107
1.8·106
1.8·105
1.8·104
1.8·103
1.8·102
EML sample GATA1 & PU1
2000 ~1000 ~250 ~62 ~15 ~4 ~1
ERY & MYL samples
GATA1 & PU1
2000 ~250 ~62 ~15 ~4 ~1

Retroflex digital PCR Supporting Information
Mojtahedi, Fouquier d’Hérouël, Huang (2014) 8
Table S4: Summary of plasmid dilution experiments
Sample n / 64 rx Subarrays Expected Poisson Retroflex E/P E/R
Water 0 23 0.00 7.10 11.89 0.00 0.00
NTC 0 23 0.00 4.02 30.40 0.00 0.00
GATA1 7 8 23.52 7.05 7.70 3.34 3.06
GATA1 14 8 47.04 13.17 17.41 3.57 2.70
GATA1 29 52 633.36 451.16 505.47 1.40 1.25
GATA1 59 52 1288.56 732.81 818.87 1.76 1.57
GATA1 118 52 2577.12 1456.54 1651.51 1.77 1.56
GATA1 237 63 6271.02 3418.48 3185.08 1.83 1.97
GATA1 475 22 4389.00 1746.44 1824.13 2.51 2.41
GATA1 950 22 8778.00 3988.73 4827.47 2.20 1.82
GATA1 1900 22 17556.00 7482.57 10584.15 2.35 1.66
PU1 7 24 70.56 10.04 25.38 7.03 2.78
PU1 14 24 141.12 36.43 71.17 3.87 1.98
PU1 28 57 670.32 385.78 327.69 1.74 2.05
PU1 45 22 415.80 128.71 176.29 3.23 2.36
PU1 56 57 1340.64 670.58 725.97 2.00 1.85
PU1 90 22 831.60 299.76 403.92 2.77 2.06
PU1 112 57 2681.28 1161.70 1384.03 2.31 1.94
PU1 180 22 1663.20 702.34 978.91 2.37 1.70
PU1 225 57 5386.50 2752.37 3046.68 1.96 1.77
PU1 360 22 3326.40 1275.71 1666.30 2.61 2.00
PU1 450 22 4158.00 1521.54 2656.76 2.73 1.57
PU1 900 22 8316.00 3842.55 6129.92 2.16 1.36
PU1 1800 22 16632.00 6770.40 13603.78 2.46 1.22
Retroflex digital PCR Supporting Information
Mojtahedi, Fouquier d’Hérouël, Huang (2014) 9
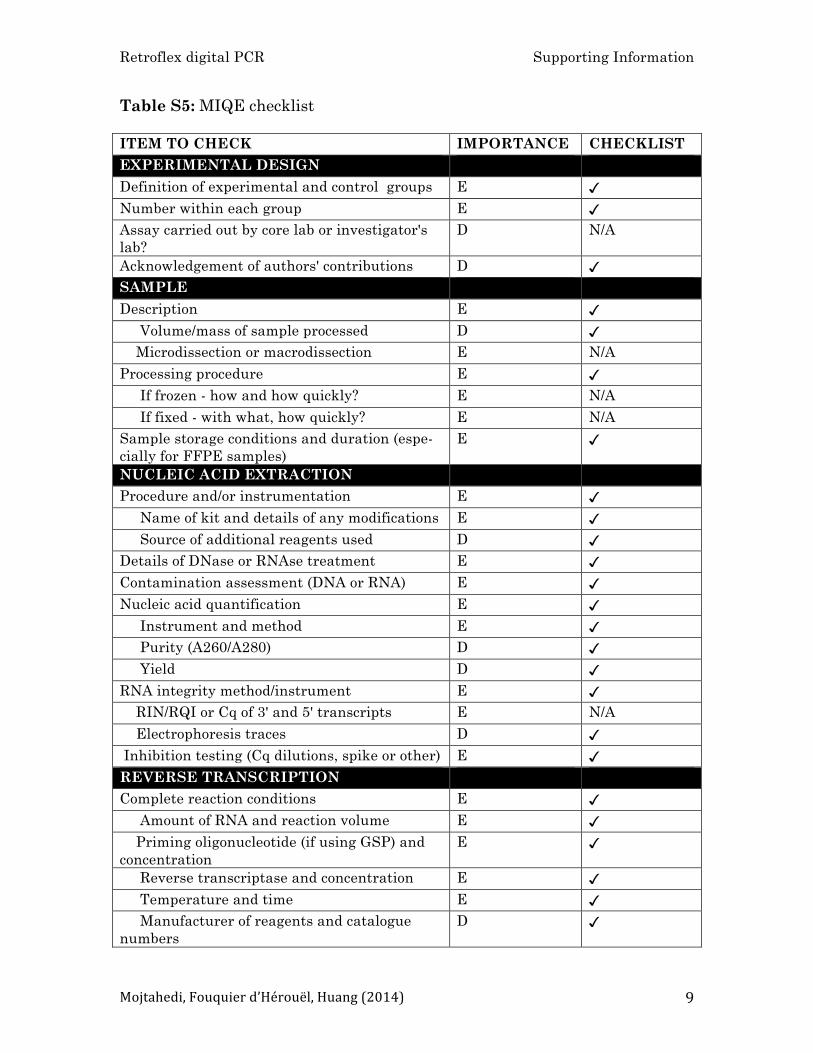
Table S5: MIQE checklist
ITEM TO CHECK IMPORTANCE CHECKLIST EXPERIMENTAL DESIGN Definition of experimental and control groups E ✓ Number within each group E ✓ Assay carried out by core lab or investigator's lab?
D N/A
Acknowledgement of authors' contributions D ✓ SAMPLE Description E ✓ Volume/mass of sample processed D ✓ Microdissection or macrodissection E N/A Processing procedure E ✓ If frozen - how and how quickly? E N/A If fixed - with what, how quickly? E N/A Sample storage conditions and duration (espe-cially for FFPE samples)
E ✓
NUCLEIC ACID EXTRACTION Procedure and/or instrumentation E ✓ Name of kit and details of any modifications E ✓ Source of additional reagents used D ✓ Details of DNase or RNAse treatment E ✓ Contamination assessment (DNA or RNA) E ✓ Nucleic acid quantification E ✓ Instrument and method E ✓ Purity (A260/A280) D ✓ Yield D ✓ RNA integrity method/instrument E ✓ RIN/RQI or Cq of 3' and 5' transcripts E N/A Electrophoresis traces D ✓ Inhibition testing (Cq dilutions, spike or other) E ✓ REVERSE TRANSCRIPTION Complete reaction conditions E ✓ Amount of RNA and reaction volume E ✓ Priming oligonucleotide (if using GSP) and concentration
E ✓
Reverse transcriptase and concentration E ✓ Temperature and time E ✓ Manufacturer of reagents and catalogue numbers
D ✓
Retroflex digital PCR Supporting Information
Mojtahedi, Fouquier d’Hérouël, Huang (2014) 10
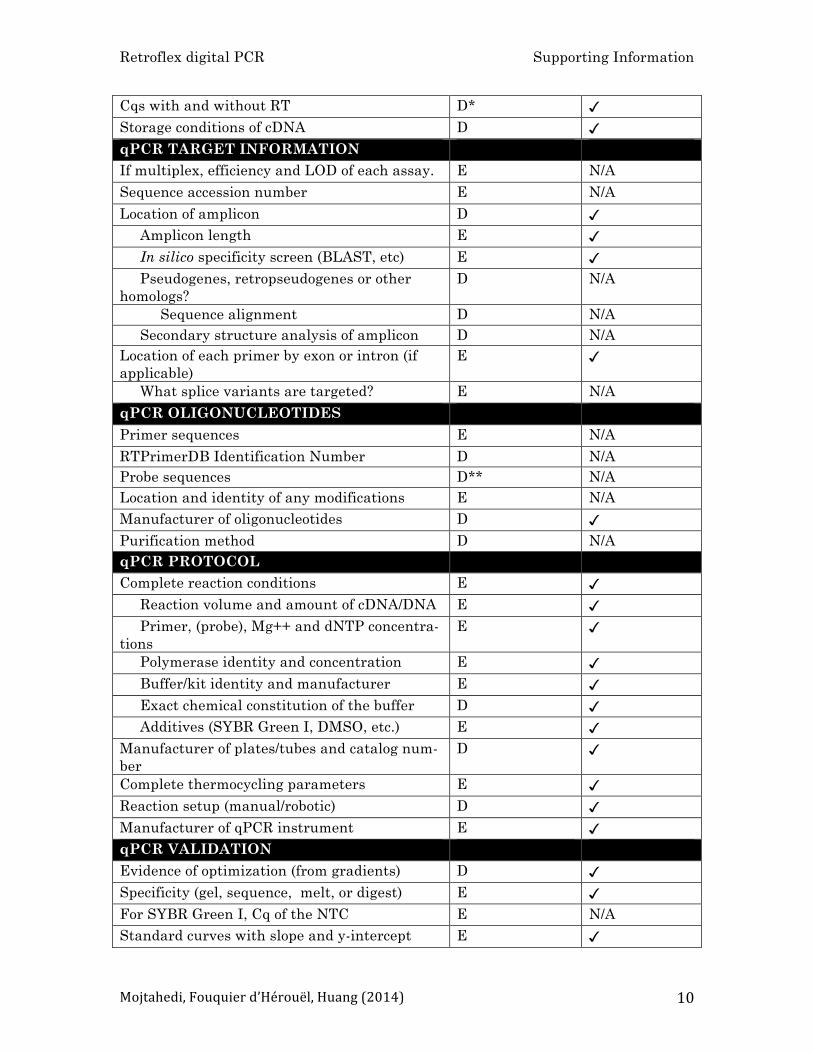
Cqs with and without RT D* ✓ Storage conditions of cDNA D ✓ qPCR TARGET INFORMATION If multiplex, efficiency and LOD of each assay. E N/A Sequence accession number E N/A Location of amplicon D ✓ Amplicon length E ✓ In silico specificity screen (BLAST, etc) E ✓ Pseudogenes, retropseudogenes or other homologs?
D N/A
Sequence alignment D N/A Secondary structure analysis of amplicon D N/A Location of each primer by exon or intron (if applicable)
E ✓
What splice variants are targeted? E N/A qPCR OLIGONUCLEOTIDES Primer sequences E N/A RTPrimerDB Identification Number D N/A Probe sequences D** N/A Location and identity of any modifications E N/A Manufacturer of oligonucleotides D ✓ Purification method D N/A qPCR PROTOCOL Complete reaction conditions E ✓ Reaction volume and amount of cDNA/DNA E ✓ Primer, (probe), Mg++ and dNTP concentra-tions
E ✓
Polymerase identity and concentration E ✓ Buffer/kit identity and manufacturer E ✓ Exact chemical constitution of the buffer D ✓ Additives (SYBR Green I, DMSO, etc.) E ✓ Manufacturer of plates/tubes and catalog num-ber
D ✓
Complete thermocycling parameters E ✓ Reaction setup (manual/robotic) D ✓ Manufacturer of qPCR instrument E ✓ qPCR VALIDATION Evidence of optimization (from gradients) D ✓ Specificity (gel, sequence, melt, or digest) E ✓ For SYBR Green I, Cq of the NTC E N/A Standard curves with slope and y-intercept E ✓

Retroflex digital PCR Supporting Information
Mojtahedi, Fouquier d’Hérouël, Huang (2014) 11
PCR efficiency calculated from slope E ✓ Confidence interval for PCR efficiency or standard error
D ✓
r2 of standard curve E ✓ Linear dynamic range E ✓ Cq variation at lower limit E ✓ Confidence intervals throughout range D ✓ Evidence for limit of detection E ✓ If multiplex, efficiency and LOD of each assay. E N/A DATA ANALYSIS qPCR analysis program (source, version) E ✓ Cq method determination E ✓ Outlier identification and disposition E ✓ Results of NTCs E ✓ Justification of number and choice of reference genes
E N/A
Description of normalization method E N/A Number and concordance of biological repli-cates
D N/A
Number and stage (RT or qPCR) of technical replicates
E ✓
Repeatability (intra-assay variation) E ✓ Reproducibility (inter-assay variation, %CV) D ✓ Power analysis D N/A Statistical methods for result significance E ✓ Software (source, version) E ✓ Cq or raw data submission using RDML D N/A All essential information (E) must be submitted with the manuscript. Desirable information (D) should be submitted if available. If using primers obtained from RTPrimerDB, infor-mation on qPCR target, oligonucleotides, protocols and validation is available from that source. *: Assessing the absence of DNA using a no RT assay is essential when first extracting RNA. Once the sample has been validated as RDNA-free, inclusion of a no-RT control is desirable, but no longer essential. **: Disclosure of the probe sequence is highly desirable and strongly encouraged. However, since not all commercial pre-designed assay vendors provide this information, it cannot be an essential requirement. Use of such assays is advised against.
Retroflex digital PCR Supporting Information
Mojtahedi, Fouquier d’Hérouël, Huang (2014) 12
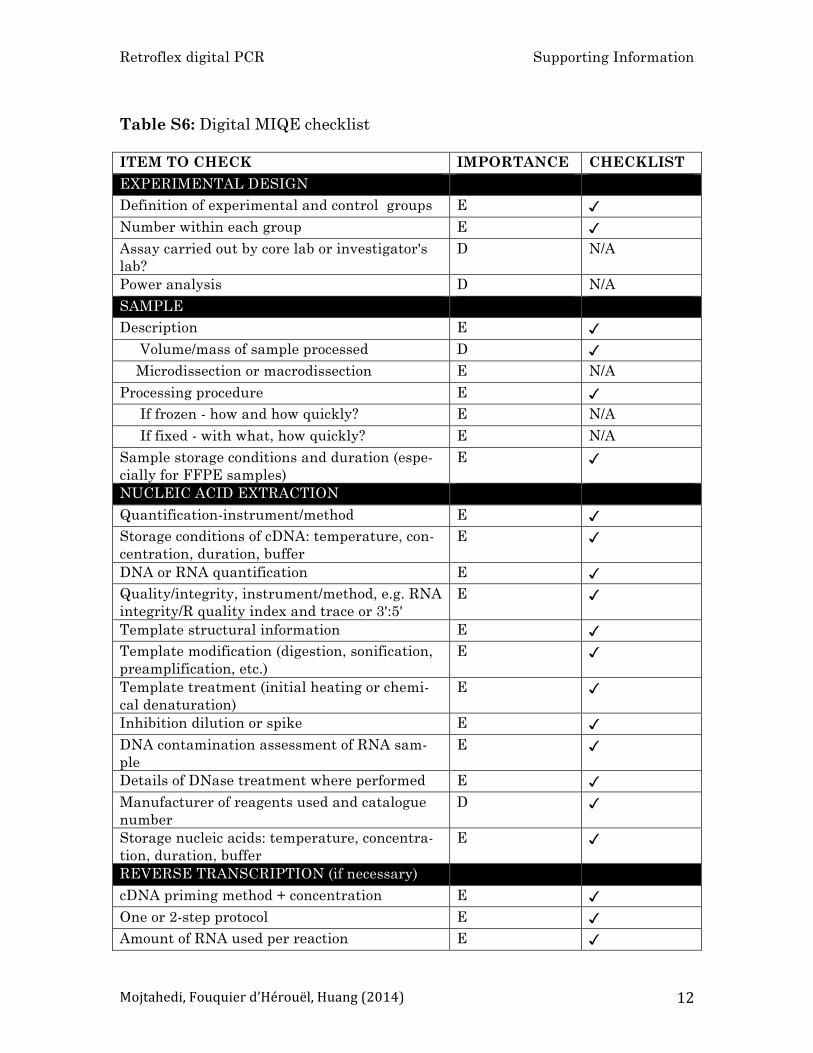
Table S6: Digital MIQE checklist
ITEM TO CHECK IMPORTANCE CHECKLIST EXPERIMENTAL DESIGN Definition of experimental and control groups E ✓ Number within each group E ✓ Assay carried out by core lab or investigator's lab?
D N/A
Power analysis D N/A SAMPLE Description E ✓ Volume/mass of sample processed D ✓ Microdissection or macrodissection E N/A Processing procedure E ✓ If frozen - how and how quickly? E N/A If fixed - with what, how quickly? E N/A Sample storage conditions and duration (espe-cially for FFPE samples)
E ✓
NUCLEIC ACID EXTRACTION Quantification-instrument/method E ✓ Storage conditions of cDNA: temperature, con-centration, duration, buffer
E ✓
DNA or RNA quantification E ✓ Quality/integrity, instrument/method, e.g. RNA integrity/R quality index and trace or 3':5'
E ✓
Template structural information E ✓ Template modification (digestion, sonification, preamplification, etc.)
E ✓
Template treatment (initial heating or chemi-cal denaturation)
E ✓
Inhibition dilution or spike E ✓ DNA contamination assessment of RNA sam-ple
E ✓
Details of DNase treatment where performed E ✓ Manufacturer of reagents used and catalogue number
D ✓
Storage nucleic acids: temperature, concentra-tion, duration, buffer
E ✓
REVERSE TRANSCRIPTION (if necessary) cDNA priming method + concentration E ✓ One or 2-step protocol E ✓ Amount of RNA used per reaction E ✓
Retroflex digital PCR Supporting Information
Mojtahedi, Fouquier d’Hérouël, Huang (2014) 13
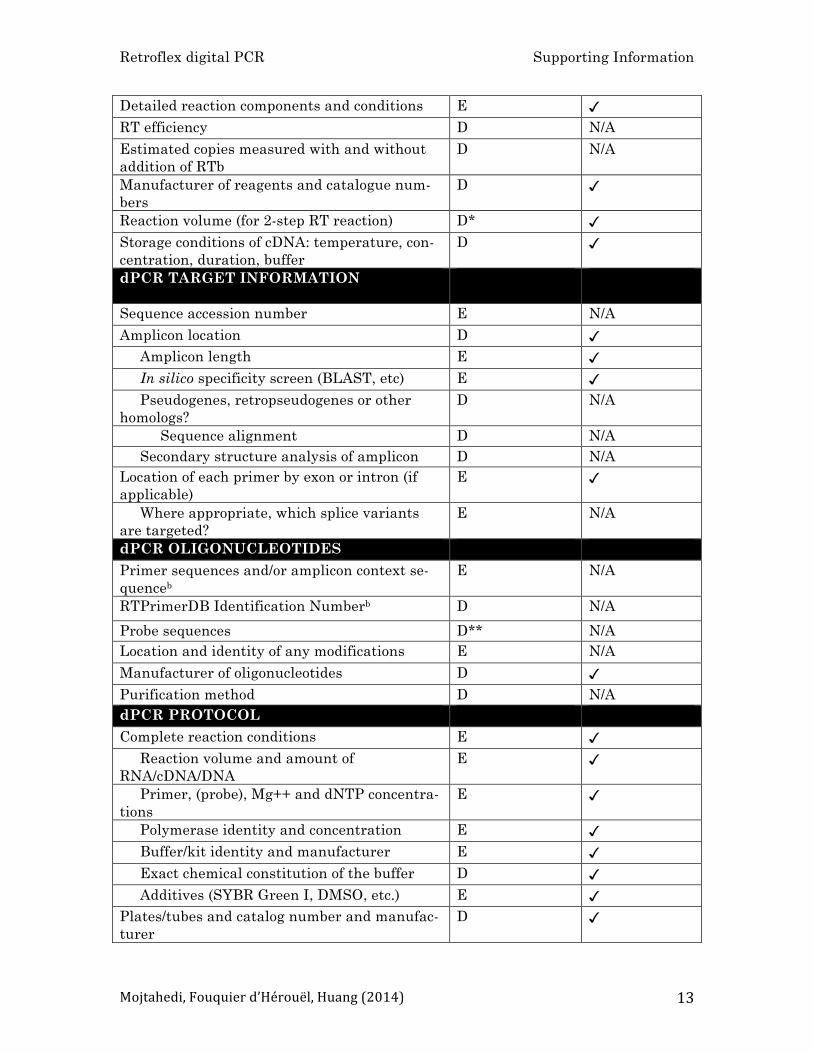
Detailed reaction components and conditions E ✓ RT efficiency D N/A Estimated copies measured with and without addition of RTb
D N/A
Manufacturer of reagents and catalogue num-bers
D ✓
Reaction volume (for 2-step RT reaction) D* ✓ Storage conditions of cDNA: temperature, con-centration, duration, buffer
D ✓
dPCR TARGET INFORMATION
Sequence accession number E N/A
Amplicon location D ✓ Amplicon length E ✓ In silico specificity screen (BLAST, etc) E ✓ Pseudogenes, retropseudogenes or other homologs?
D N/A
Sequence alignment D N/A Secondary structure analysis of amplicon D N/A Location of each primer by exon or intron (if applicable)
E ✓ Where appropriate, which splice variants are targeted?
E N/A
dPCR OLIGONUCLEOTIDES
Primer sequences and/or amplicon context se-quenceb
E N/A
RTPrimerDB Identification Numberb D N/A
Probe sequences D** N/A Location and identity of any modifications E N/A
Manufacturer of oligonucleotides D ✓ Purification method D N/A dPCR PROTOCOL
Complete reaction conditions E ✓ Reaction volume and amount of RNA/cDNA/DNA
E ✓ Primer, (probe), Mg++ and dNTP concentra-tions
E ✓ Polymerase identity and concentration E ✓ Buffer/kit identity and manufacturer E ✓ Exact chemical constitution of the buffer D ✓ Additives (SYBR Green I, DMSO, etc.) E ✓ Plates/tubes and catalog number and manufac-turer
D ✓
Retroflex digital PCR Supporting Information
Mojtahedi, Fouquier d’Hérouël, Huang (2014) 14
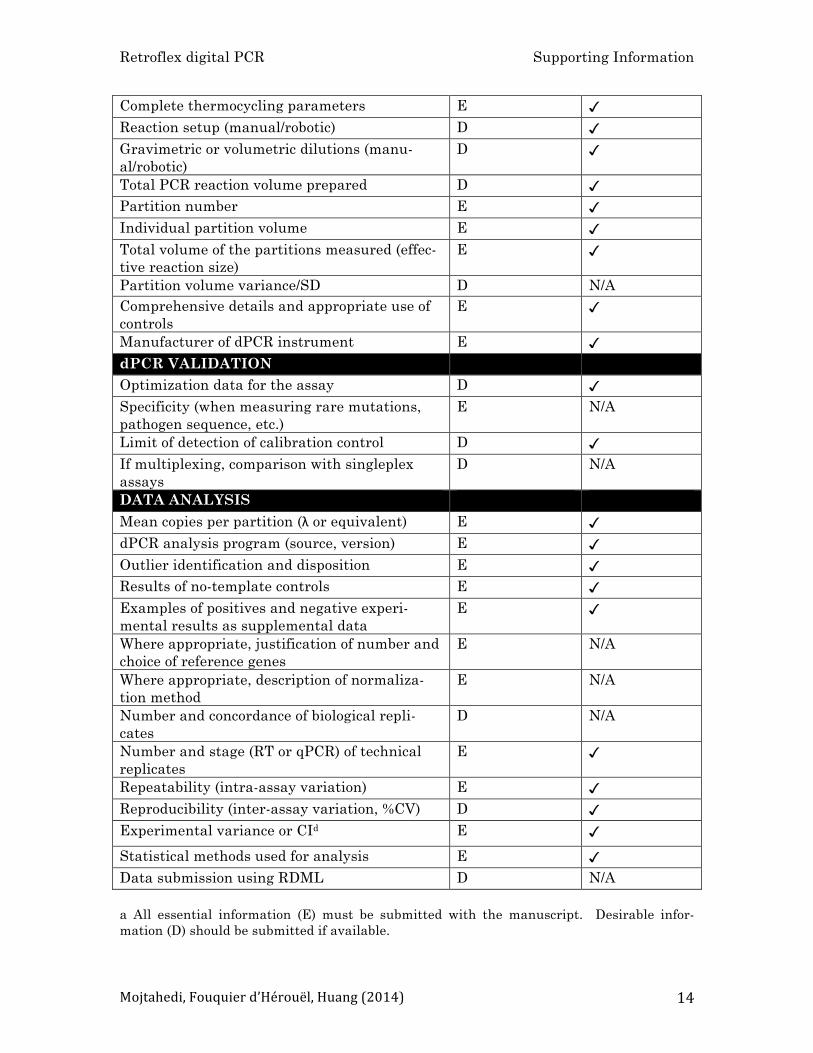
Complete thermocycling parameters E ✓ Reaction setup (manual/robotic) D ✓ Gravimetric or volumetric dilutions (manu-al/robotic)
D ✓ Total PCR reaction volume prepared D ✓ Partition number E ✓ Individual partition volume E ✓ Total volume of the partitions measured (effec-tive reaction size)
E ✓ Partition volume variance/SD D N/A Comprehensive details and appropriate use of controls
E ✓ Manufacturer of dPCR instrument E ✓ dPCR VALIDATION Optimization data for the assay D ✓ Specificity (when measuring rare mutations, pathogen sequence, etc.)
E N/A
Limit of detection of calibration control D ✓ If multiplexing, comparison with singleplex assays
D N/A
DATA ANALYSIS
Mean copies per partition (λ or equivalent) E ✓ dPCR analysis program (source, version) E ✓ Outlier identification and disposition E ✓ Results of no-template controls E ✓ Examples of positives and negative experi-mental results as supplemental data
E ✓ Where appropriate, justification of number and choice of reference genes
E N/A
Where appropriate, description of normaliza-tion method
E N/A
Number and concordance of biological repli-cates
D N/A
Number and stage (RT or qPCR) of technical replicates
E ✓ Repeatability (intra-assay variation) E ✓ Reproducibility (inter-assay variation, %CV) D ✓ Experimental variance or CId E ✓ Statistical methods used for analysis E ✓ Data submission using RDML D N/A a All essential information (E) must be submitted with the manuscript. Desirable infor-mation (D) should be submitted if available.

Retroflex digital PCR Supporting Information
Mojtahedi, Fouquier d’Hérouël, Huang (2014) 15
b Disclosure of the probe sequence is highly desirable and strongly encouraged. However, since not all commercial pre-designed assay vendors provide this information, when it's not available assay context sequences must be submitted c Assessing the absence of DNA using a no RT assay is essential when first extracting RNA. Once the sample has been validated as RDNA-free, inclusion of a no-RT control is desirable, but no longer essential. d When single dPCR experiments are performed, the variation due to counting error alone should be calculated from the binomial (or suitable equivalent) distribution

Retroflex digital PCR Supporting Information
Mojtahedi, Fouquier d’Hérouël, Huang (2014) 16
Figure S1: Control of plasmid linearization on agarose gel. Lane M: 1 kb plus ladder DNA marker. Lane 1: C, circular GATA1-pSPORT1 plasmid sample. Lane 2: L, linear GATA1-pSPORT1 plasmid sample (NotI treated). Lane 3: C, circular Sfpi1-pCMV-pSPORT6 plasmid sample. Lane 4: L, linear Sfpi1-pCMV-pSPORT6 plasmid sample (NotI treated).

Retroflex digital PCR Supporting Information
Mojtahedi, Fouquier d’Hérouël, Huang (2014) 17
Figure S2: Comparison of using low-binding tips and non-stick tubes vs. regular ones in accurate DNA quantification. GATA1 and PU1 plasmids were diluted to approximately 29/28, 59/56 and 112/118 cop-ies/subarray. Error bars given as standard error, n = 11 subarrays. dPCR was performed on plasmid serial dilution samples prepared using low-binding tips and non-stick tubes (grey bar) or regular tips and tubes (open bar). The aver-age positive calls (reactions)/subarray at different nominal GATA1 plasmid input was plotted at different DNA input for GATA1 plasmid (a) and PU1 plasmid (b).
(a)
(b)

Retroflex digital PCR Supporting Information
Mojtahedi, Fouquier d’Hérouël, Huang (2014) 18
Figure S3: Representative output from chip-based real-time dPCR instrument (Applied Biosystems OpenArray). Real-time amplification plots showing amplification curves for positive and negative partitions: repre-sentative amplification plot for positive reactions (a), typical amplification plot for negative template control (b).
(a) (b)

Retroflex digital PCR Supporting Information
Mojtahedi, Fouquier d’Hérouël, Huang (2014) 19
Figure S4: Standard curves between circular and linear (a) GATA1-pSPORT1 (b) Sfpi1-pCMV-pSPORT6 plasmids. Standard curves are lin-ear regression lines between Cq and log10 starting plasmid copy number. All 𝛥𝐶! were calculated as the average of Cq difference across serial dilutions and y-intercepts were not significantly different for GATA1-pSPORT1 plasmid (p=0.63) and Sfpi1-pCMV-pSPORT6 (p=0.69). Note that similar slopes of the standard curves indicate similar amplification efficiencies for circular and linear plasmids. The error bars denote the standard deviations of Cq values among n=4 replicates.
(a)
0
5
10
15
20
25
30
35
2 3 4 5 6 7 8
Quanti(ication cycle (Cq)
Log10 starting GATA1 plasmid copy number
Linear plasmid Circular plasmid
0
5
10
15
20
25
30
35
2 3 4 5 6 7 8
Quanti(ication cycle (Cq)
Log10 starting PU1 plasmid copy number
Linear plasmid Circular plasmid
(b)
Retroflex digital PCR Supporting Information
Mojtahedi, Fouquier d’Hérouël, Huang (2014) 20
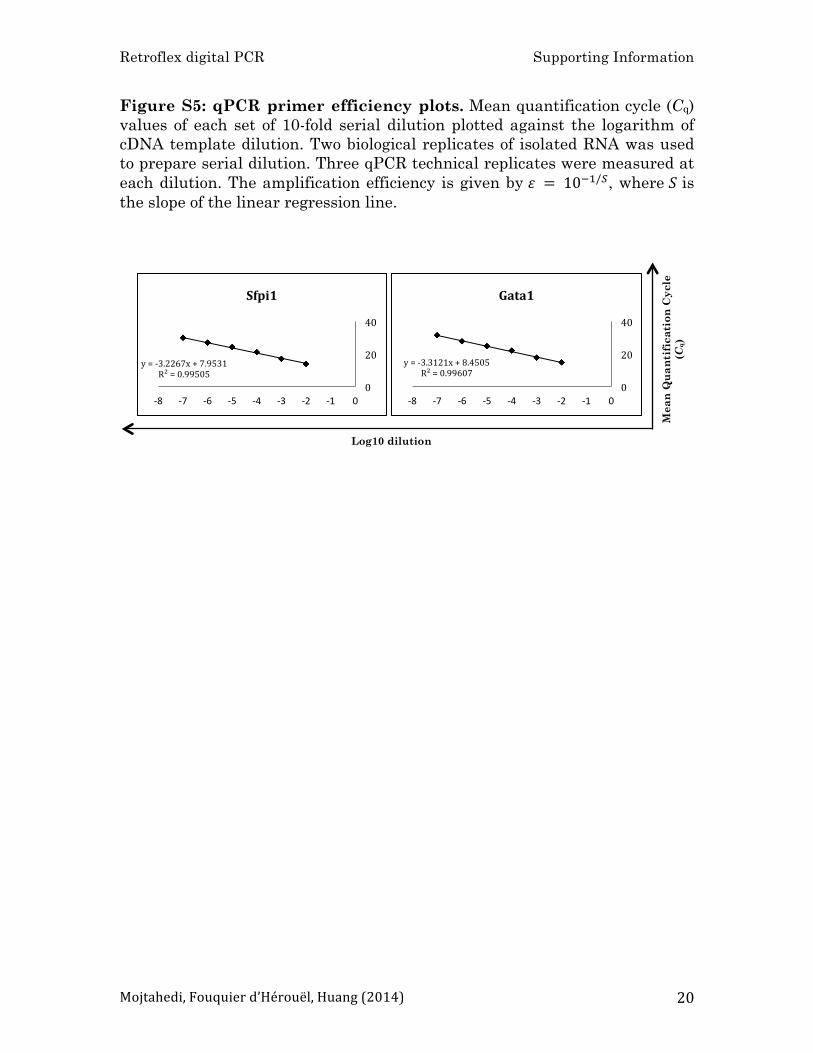
Figure S5: qPCR primer efficiency plots. Mean quantification cycle (Cq) values of each set of 10-fold serial dilution plotted against the logarithm of cDNA template dilution. Two biological replicates of isolated RNA was used to prepare serial dilution. Three qPCR technical replicates were measured at each dilution. The amplification efficiency is given by 𝜀 = 10!!/!, where 𝑆 is the slope of the linear regression line.
Mea
n Q
ua
nti
fica
tio
n C
ycl
e (C
q)
Log10 dilution
y = -‐3.2267x + 7.9531 R² = 0.99505
0
20
40
-‐8 -‐7 -‐6 -‐5 -‐4 -‐3 -‐2 -‐1 0
Sfpi1
y = -‐3.3121x + 8.4505 R² = 0.99607
0
20
40
-‐8 -‐7 -‐6 -‐5 -‐4 -‐3 -‐2 -‐1 0
Gata1
Retroflex digital PCR Supporting Information
Mojtahedi, Fouquier d’Hérouël, Huang (2014) 21
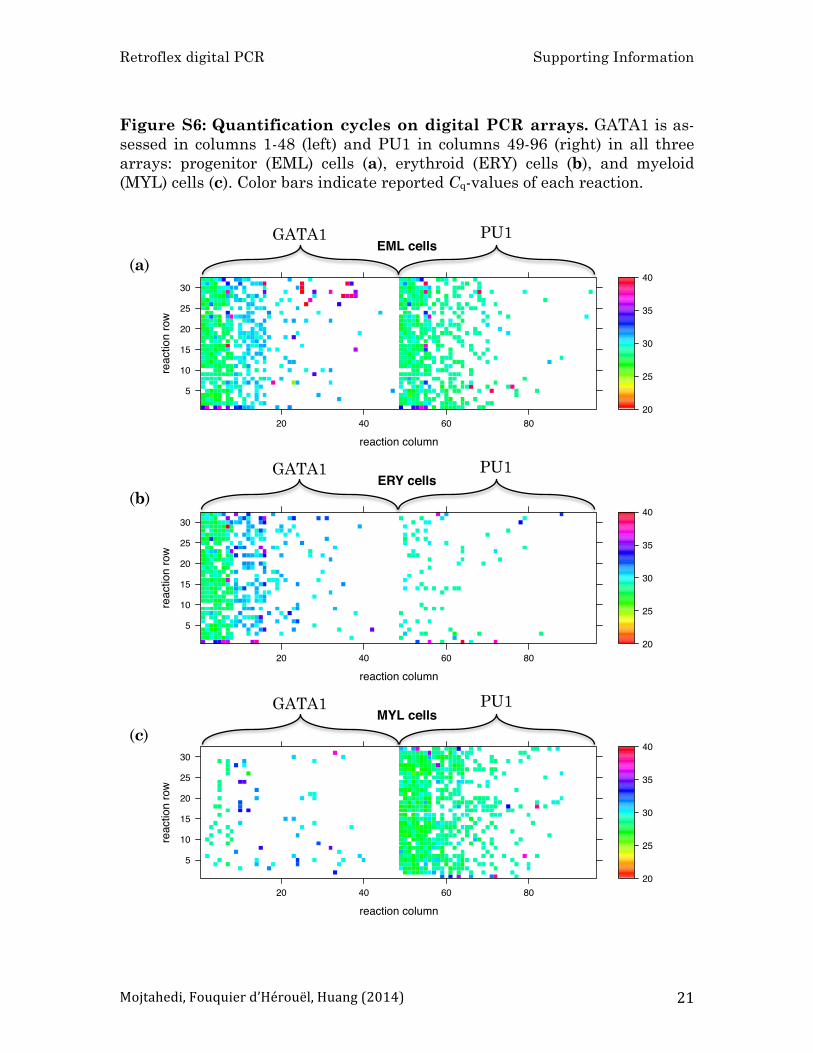
Figure S6: Quantification cycles on digital PCR arrays. GATA1 is as-sessed in columns 1-48 (left) and PU1 in columns 49-96 (right) in all three arrays: progenitor (EML) cells (a), erythroid (ERY) cells (b), and myeloid (MYL) cells (c). Color bars indicate reported Cq-values of each reaction.
EML cells
reaction column
reac
tion
row
5
10
15
20
25
30
20 40 60 8020
25
30
35
40
ERY cells
reaction column
reac
tion
row
5
10
15
20
25
30
20 40 60 8020
25
30
35
40
MYL cells
reaction column
reac
tion
row
5
10
15
20
25
30
20 40 60 8020
25
30
35
40
(a)
(b)
(c)
PU1 GATA1
PU1 GATA1
PU1 GATA1

Retroflex digital PCR Supporting Information
Mojtahedi, Fouquier d’Hérouël, Huang (2014) 22
Figure S7: Selection of Sca-1 high- and low-expression cells by flow cytometry. Histograms of Sca-1 expression profiles in EML and MYL cells on day three of differentiation exhibit bimodality. The boxed regions around the modes were used to define gates from which the high and low Sca-1 ex-pression cells for the pre-amplification assay were sorted.
L-‐Sca1 H-‐Sca1
Cell number
Sca1
L-‐Sca1 H-‐Sca1
Cell number
Sca1
ERY MYL
Retroflex digital PCR Supporting Information
Mojtahedi, Fouquier d’Hérouël, Huang (2014) 23
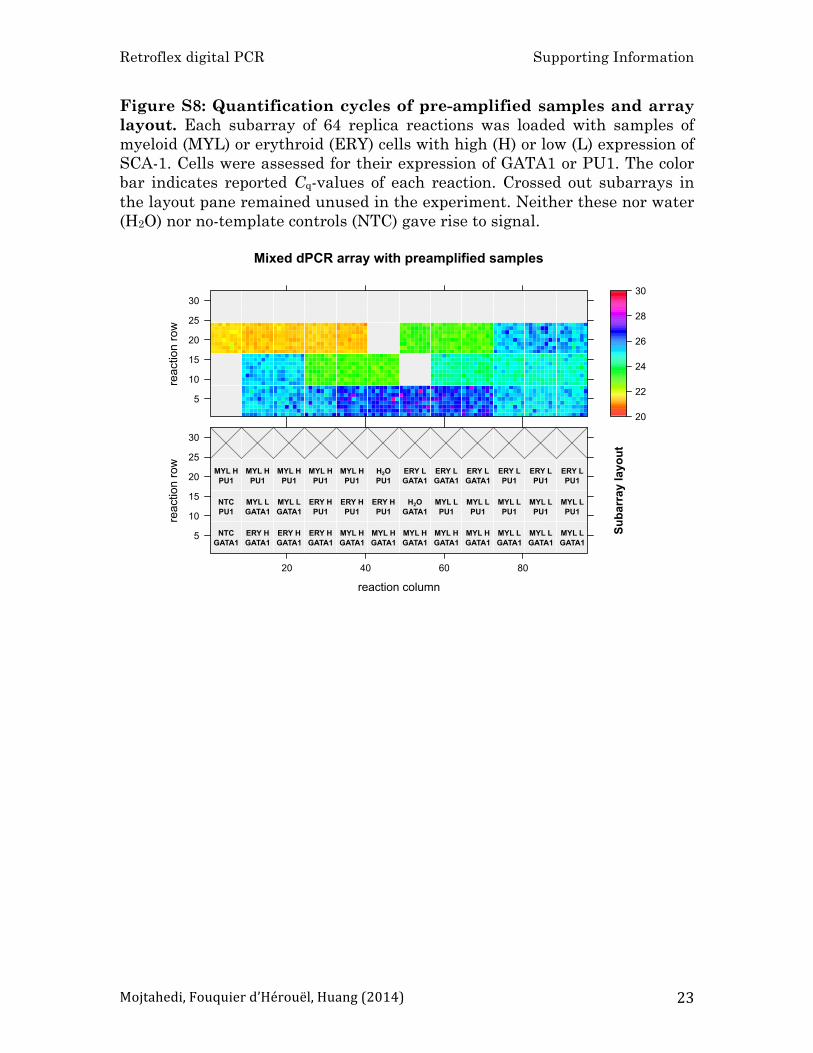
Figure S8: Quantification cycles of pre-amplified samples and array layout. Each subarray of 64 replica reactions was loaded with samples of myeloid (MYL) or erythroid (ERY) cells with high (H) or low (L) expression of SCA-1. Cells were assessed for their expression of GATA1 or PU1. The color bar indicates reported Cq-values of each reaction. Crossed out subarrays in the layout pane remained unused in the experiment. Neither these nor water (H2O) nor no-template controls (NTC) gave rise to signal.
�������������
����������
�
��
��
��
��
��
�� �� �� ��
�������������� ����������������������
����������
�
��
��
��
��
��
��
��
��
��
��
��
������������
��������
��� �����
��� �����
��� �����
��!� �����
��!� �����
��!� �����
��!� �����
��!� �����
��!�!�����
��!�!�����
��!�!�����
����"�
��!�!�����
��!�!�����
��� �"�
��� �"�
��� �"�
#$�����
��!�!�"�
��!�!�"�
��!�!�"�
��!�!�"�
��!�!�"�
��!� �"�
��!� �"�
��!� �"�
��!� �"�
��!� �"�
#$�"�
���!�����
���!�����
���!�����
���!�"�
���!�"�
���!�"�

Retroflex digital PCR Supporting Information
Mojtahedi, Fouquier d’Hérouël, Huang (2014) 24
Figure S9: Distributions of reported Cq-values in pre-amplified sam-ples. Replica reactions shown in Figure S8 give rise to different Cq distribu-tions, which can be used to infer template concentrations using the retroflex method. In each plot the number of underlying data (N) is indicated. The shown distributions were computed using a Gaussian kernel with 0.2 as bandwidth.
�� �� �� �� �� ��
���
���
���
��� �������
� ��
� ������������������
�� �� �� �� �� ��
���
���
��
��� �������
� ��
�� �� �� �� �� ��
���
���
��
��� ������
� ��
������� �� �� �� �� �� ��
���
���
���
��� ������
� ��
�� �� �� �� �� ��
���
���
��� �������
� ���
�� �� �� �� �� ��
���
��
��� �������
� ���
�� �� �� �� �� ��
���
���
���
��� ������
� ���
�� �� �� �� �� ��
���
���
���
��� ������
� ���
���� ��

Retroflex digital PCR Supporting Information
Mojtahedi, Fouquier d’Hérouël, Huang (2014) 25
Figure S10: Relationship between coefficient of variation for positive calls/subarray and nominal template copy number for GATA1 plas-mid serial dilution. Each point corresponds to triplicate experiments at indicated nominal copy number of GATA1 assayed in 704 reactions/replicate. Error bars represent sample standard deviation over the triplicates.