direct measurement of the capillary pressure
TRANSCRIPT
Direct Measurement of the Capillary Pressure Characteristics of Water-Air-Gas
Diffusion Layer Systems for PEM Fuel Cells
Jeff T. Gostick, Marios A. Ioannidis*, Michael W. Fowler and Mark D. Pritzker
University of Waterloo, Department of Chemical Engineering, Waterloo, ON N2L 5N5
* Corresponding Author: [email protected]
The final publication is available at Elsevier via http://dx.doi.org/10.1016/j.elecom.2008.08.008 © 2017. This manuscript version is made available under the CC-BY-NC-ND 4.0 license http://creativecommons.org/licenses/by-nc-nd/4.0/
2
Abstract
A method and apparatus for measuring the relationship between air-water capillary pressure
and water saturation in PEMFC gas diffusion layers is described. Capillary pressure data for
water injection and withdrawal from typical GDL materials are obtained, which demonstrate
permanent hysteresis between water intrusion and water withdrawal. Capillary pressure,
defined as the difference between the water and gas pressures at equilibrium, is positive
during water injection and negative during water withdrawal. The results contribute to the
understanding of liquid water behavior in GDL materials which is necessary for the
development of effective PEMFC water management strategies.
Keywords: capillary pressure, hysteresis, water management.
3
1 Introduction
Further reduction of the mass-transport-induced voltage loss at high current density is
critically needed for broad commercial application of polymer electrolyte membrane fuel cells
(PEMFC) [1]. Membrane electrode assemblies (MEAs), gas diffusion layers (GDLs) and flow
fields must be designed to synergistically provide efficient removal of product liquid water and
improved access of reactant gases to catalytic sites. Notwithstanding recent efforts, the
capillary properties of GDL-water-air systems have not been conclusively established and
their dependence on GDL pore structure and wettability remains unclear.
The capillary pressure of interest in water-air-GDL systems is the difference between the
pressures of the liquid and gas phases, GLC PPP , across the static air-water interfaces
within a GDL. It is fundamentally related to the mean curvature H of the air-water interface
through the well-known Young-Laplace equation [2]:
HnPC 2
(1)
where n
is the unit normal to the surface and is the surface tension. The shape of the
static air-water interface (thus H) is obtained from the solution of Eq.(1) subject to a boundary
condition provided by the equilibrium contact angle . The solid surface is said to be
hydrophobic for o90 (measured through the aqueous phase) and hydrophilic otherwise.
Fibrous GDL materials are treated to various extents with poly(tetrafluoroethylene) (PTFE) to
render their internal surfaces more hydrophobic. The contact angle of water-air interfaces on
internal GDL surfaces has been indirectly estimated to be in the range oo 10188 for
treated and untreated GDLs [3, 4], whereas values of o108 and o86 have been reported for

4
water on smooth PTFE and water on smooth graphite, respectively [5]. At capillary
equilibrium, all air-water interfaces within a GDL have the same mean curvature H. Capillary
equilibrium of water and air within GDL pores can be established over a broad range of water
saturations WS by changing the phase pressure difference GL PP in a step-wise fashion.
The resulting functional relationship WC SP between capillary pressure and water saturation
is not unique [6]. Permanent hysteresis is observed because capillary equilibrium is reached
via a sequence of non-equilibrium interfacial configurations which differ depending on the
history of saturation change [6].
Recent attempts to determine WC SP for water and air in GDLs by different methods have
not been entirely satisfactory. A first attempt by Gostick et al. [7] using the method of standard
porosimetry (MSP) provided capillary pressure data along a path of decreasing water
saturation. Water withdrawal occurred at negative capillary pressures, which was attributed to
the existence of hydrophilic pore networks. Others [8] found that a positive capillary pressure
is required for water injection. Fairweather et al. [9] reported capillary pressure hysteresis
with 0CP for water injection and 0CP for water withdrawal. Contrary to expectation, no
hysteresis was observed in the measurements of Nguyen et al. [10].
In this communication, we report a straightforward method for measuring the water-air
WC SP relationship for GDL materials along any saturation path in the range 10 WS .
Data obtained with this method elucidate the capillary behavior of water-air-GDL systems.
5
2 Experimental Method
This method controls the gas pressure in the sample to impose constant capillary pressure
values and monitors the resulting change in water saturation. The system consists of an
analytical balance (Denver P-314), a syringe pump (Harvard 11-Plus), an absolute pressure
gauge (Omega PX303-030A5V) and a specially designed sample holder.
2.1 Sample Holder
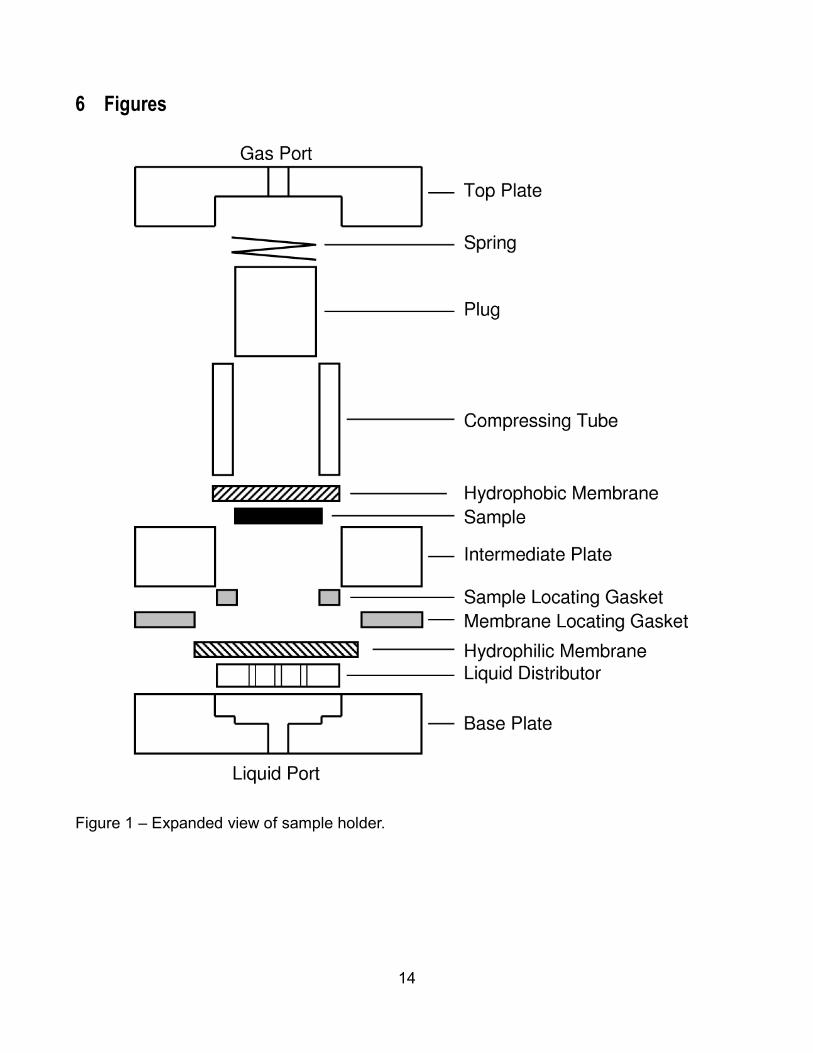
The sample holder shown in Figure 1 was built in-house. The holder features a porous
hydrophobic membrane (Sartorius, 0.45 m PTFE #11806-25) above the sample and a
porous hydrophilic membrane (Millipore, 0.22 m PVDF #GVWP04700) below the sample,
which act as capillary barriers. The hydrophobic membrane above the sample allows air to
escape as water enters the GDL but prevents water from leaving the system after
breakthrough of the sample. The hydrophilic membrane below the sample serves the same
function at highly negative capillary pressures by allowing water, but not air, to exit. A key
feature of this setup is that the sample can be maintained at 000,10CP Pa during
assembly which enables the measurement of capillary curves beginning with the GDL in a
fully dry state, which serves as a reference for tracking the sample saturation. The holder is
designed to hold samples 0.01905 m in diameter. For a typical material, this sample size
corresponds to a pore volume of about 85 L , or 85 mg of water, meaning that an analytical
balance with resolution of 0.1 mg can detect very slight saturation changes.

6
2.2 Sample Mounting
The piping and cavity in the base plate are first primed with de-ionized and de-gassed liquid
water. This is followed by positioning the liquid distributor made of 20 holes of 800 m
diameter. The hydrophilic membrane is laid on top of the liquid distributor along with the
membrane locating gasket. Next the intermediate plate is bolted to the base plate to hold the
hydrophilic membrane tightly in place. At this point, 10,000 Pa of suction is applied to
system through a hose connected to the liquid port. This suction drains free water from the
sample cavity and creates a 10,000 Pa capillary pressure at the surface of the hydrophilic
membrane. The dry GDL is then loaded with the sample locating gasket. Next, the
hydrophobic membrane, compressing cylinder, plug and spring are inserted. The plug
prevents bulging of the hydrophobic membrane at high capillary pressures, which would
create the appearance of extra water volume in the system. The spring applies only a slight
pressure to the plug to prevent GDL compression. Finally, the top plate is bolted to the
intermediate plate to apply a downward force on the compression cylinder to seal the
assembly.
2.3 System Setup
After mounting the sample, a gas pressure of 10,000 Pa is applied to the gas port. This
pressure, combined with the liquid suction at the liquid port, temporarily creates 000,20CP
Pa in the hydrophilic membrane which is still well below its bubble point. After the gas
pressure is established, the liquid suction is relieved and the sample chamber is connected to
the water reservoir on the balance. Since the water reservoir is only slightly below the
sample, the liquid suction is relatively small and so a positive gas pressure must first be
7
applied to maintain the net 000,10CP Pa. This assembly and setup ensures that the GDL
never contacts water with a capillary pressure greater than 10,000 Pa. To verify that the
sample does not take up any water during assembly, the above assembly and setup steps
were repeated several times followed by immediate disassembly and weighing of the
samples.
2.4 Procedure
Following system setup, a syringe pump is connected to the gas port of the sample holder.
The pump compresses and expands the gas above the sample, thereby effecting changes in
capillary pressure. The syringe pump and balance are controlled through an RS-232
interface. After each change in gas volume and therefore capillary pressure, the mass of
liquid on the balance is monitored for change. The system is held at a constant capillary
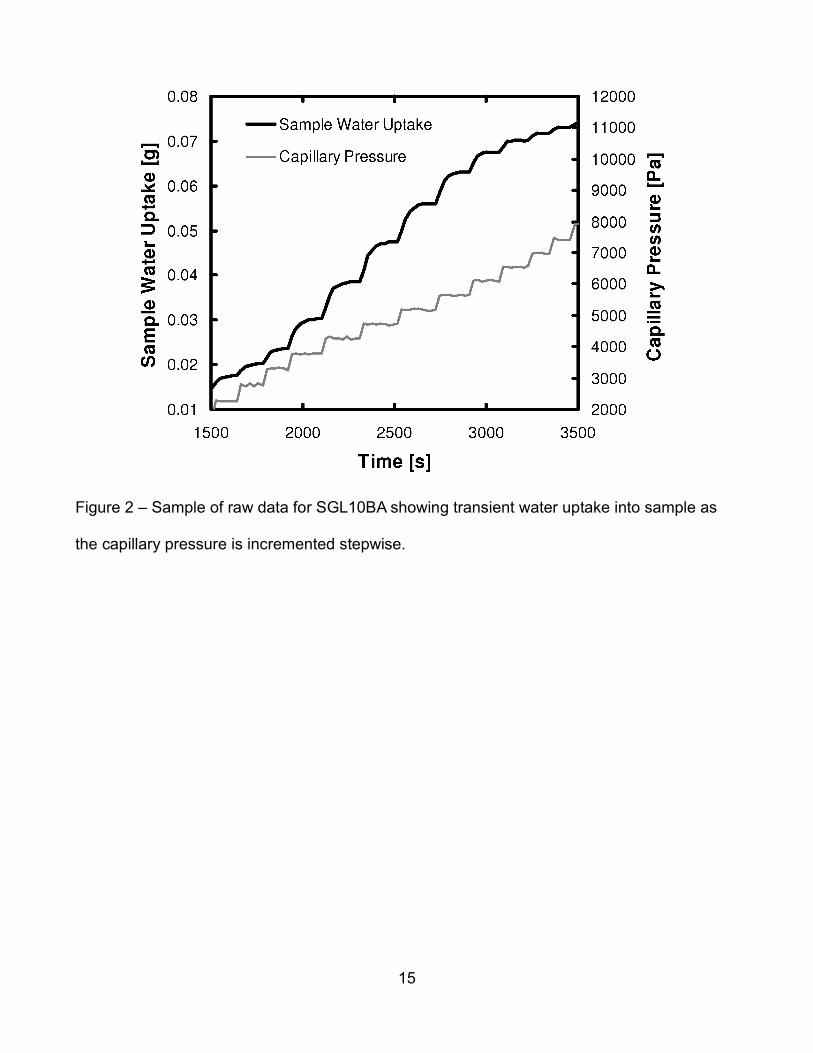
pressure until the water mass reading on the balance is stable. The transient responses of
the water uptake to changes in capillary pressure (see Figure 2) show that it is indeed stable
before each subsequent change in gas pressure.
2.5 Data Analysis
Capillary pressure is controlled by adjusting the gas pressure above the sample and is
determined as follows. The distance h between the liquid reservoir level and the sample
surface is 10 cm, creating a small amount of liquid suction. Also, the barometric pressure
( ATMP ) acts on the surface of the liquid reservoir, but not on the liquid in the sample since the
gas chamber is sealed. The capillary pressure is therefore given by:
8
GATMGLC PPghPPP (2)
Controlling capillary pressure by controlling gas instead of liquid pressure is helpful, since
most liquid pressure sensors exhibit some membrane displacement that could be incorrectly
construed as sample pore volume. Although liquid pressure does vary during periods of
transient water uptake due to viscous effects, it returns to its original value, LP , once the
saturation stabilizes and flow ceases.
Since the sample is initially dry, water uptake by the sample equals water loss from the
reservoir. The water saturation is computed as:
2
1
4d
m
V
VS W
P
WW
(3)
where WV is the volume of water in the sample, PV is the GDL pore volume, Wm is the mass
of water in the sample, is the density of water, d is the sample diameter, is the sample
thickness and is the sample porosity. The thickness of each sample was measured directly
with a micrometer while porosity was found from mercury intrusion porosimetry tests on
samples taken from the same sheet [7]. Evaporative loss of water from the system during the
course of a run (ca. 5 hr) is minimized by covering the top of the beaker, leaving only a small
hole for the tubing and also by maintaining the gas above the sample fully humidified.
Nevertheless, a small correction to Wm is still made by determining the rate of evaporation
( 2.01 g /s) during runs with no GDL sample. In experiments with GDL samples, the time
to reach capillary equilibrium at each point is recorded and then the corresponding
9
evaporative loss is found as the product of equilibration time and evaporation rate.
10
3 Results and Discussion
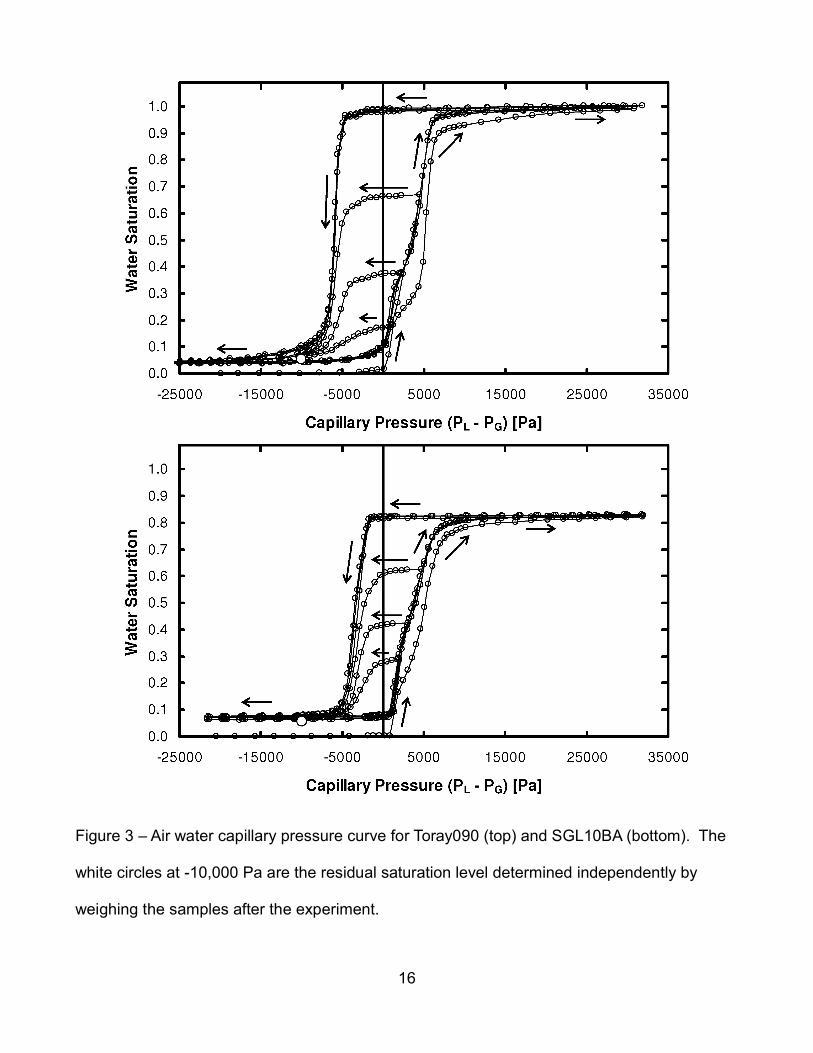
Figure 3 shows the capillary pressure curves for water injection and withdrawal, including
internal hysteresis loops, for Toray090 (0% PTFE, 78.0 , 295 m) and SGL10BA (5%
PTFE, 88.0 , 360 m). No water penetrates the samples before CP reaches positive
values of about 1,000 Pa for Toray090 and about 2,000 Pa for SGL10BA. A saturation
plateau is reached at approximately 10,000 Pa for both samples which extends to 30,000 Pa.
At 000,30CP Pa, Toray090 is fully saturated, whereas SGL10BA exhibits a saturation of
0.84. The inability to completely fill SGL10BA can be attributed to microscopic roughness
caused by binder and PTFE additives. It might, however, be due to errors in the calculation of
PV in Eq.(3) because of uncertainty in or due to inadvertent sample compression during
assembly. The fact that Toray090, which is free of rough binder and PTFE, did reach the
expected saturation suggests that roughness is the likely explanation. Upon reducing the
capillary pressure, WS remains virtually unchanged until negative capillary pressures are
reached. Water begins to withdraw from SGL10BA at 500,1CP Pa and the residual water
saturation ( 07.0WS ) is established at 000,6CP Pa. For Toray090, water withdrawal
begins at 000,5CP Pa and levels off at 04.0WS when 000,15CP Pa. Upon water re-
injection, a different path is followed. Some water imbibes freely into Toray090 at 0CP , but
not into SGL10BA. Subsequent water withdrawal follows the first withdrawal path exactly and
all subsequent injections follow the re-injection path. These findings agree qualitatively with
those of Fairweather et al. [9], but are in stark contrast with those of Nguyen et al. [10]. Water
withdrawal from any WS reached by water injection results in hysteresis, as shown by the
hysteresis loops in Figure 3.
11
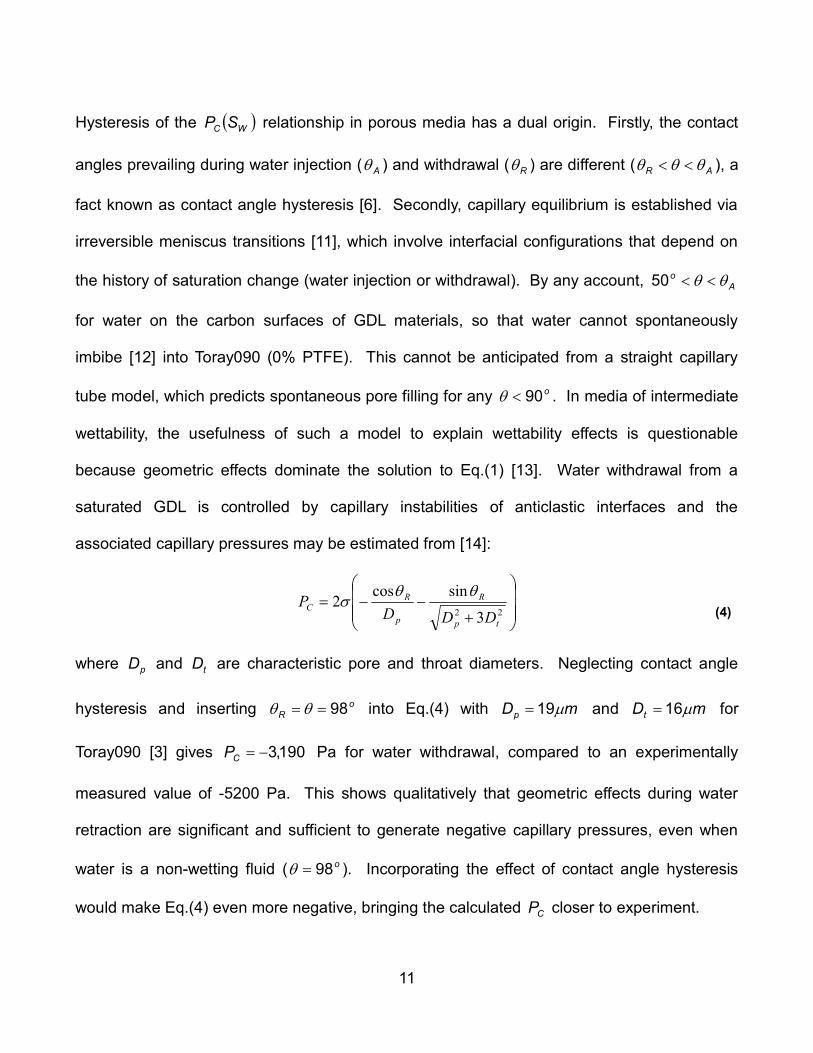
Hysteresis of the WC SP relationship in porous media has a dual origin. Firstly, the contact
angles prevailing during water injection ( A ) and withdrawal ( R ) are different ( AR ), a
fact known as contact angle hysteresis [6]. Secondly, capillary equilibrium is established via
irreversible meniscus transitions [11], which involve interfacial configurations that depend on
the history of saturation change (water injection or withdrawal). By any account, Ao 50
for water on the carbon surfaces of GDL materials, so that water cannot spontaneously
imbibe [12] into Toray090 (0% PTFE). This cannot be anticipated from a straight capillary
tube model, which predicts spontaneous pore filling for any o90 . In media of intermediate
wettability, the usefulness of such a model to explain wettability effects is questionable
because geometric effects dominate the solution to Eq.(1) [13]. Water withdrawal from a
saturated GDL is controlled by capillary instabilities of anticlastic interfaces and the
associated capillary pressures may be estimated from [14]:
22 3
sincos2
tp
R
p
RC
DDDP
(4)
where pD and tD are characteristic pore and throat diameters. Neglecting contact angle
hysteresis and inserting oR 98 into Eq.(4) with mDp 19 and mDt 16 for
Toray090 [3] gives 190,3CP Pa for water withdrawal, compared to an experimentally
measured value of -5200 Pa. This shows qualitatively that geometric effects during water
retraction are significant and sufficient to generate negative capillary pressures, even when
water is a non-wetting fluid ( o98 ). Incorporating the effect of contact angle hysteresis
would make Eq.(4) even more negative, bringing the calculated CP closer to experiment.
12
4 Conclusions
A straightforward and accurate method for measuring air-water capillary pressure curves of
GDL materials along any saturation path in the range 10 WS has been developed.
Results for both Toray090 and SGL10BA confirm significant capillary pressure hysteresis.
Capillary equilibrium along paths of water injection and withdrawal is reached with 0CP and
0CP , respectively, as expected for intermediately-wet materials with narrow pore size
distribution and low pore-to-throat size aspect ratio.

13
5 References
[1] H.A. Gasteiger, S.S. Kocha, B. Sompalli and F.T. Wagner, Appl. Catal. B 56 (2005) 9.
[2] R. Defay, I. Prigogine and A. Bellemans, Surface Tension and Adsorption, Longmans,
1966.
[3] J.T. Gostick, M.A. Ioannidis, M.W. Fowler and M.D. Pritzker, J. Power Sources 173
(2007) 277.
[4] V. Gurau, M.J. Bluemle, E.S. De Castro, Y.M. Tsou, J. Mann and T. Zawodzinski, J.
Power Sources 160 (2003) 1156.
[5] A.W. Adamson, Physical Chemistry of Surfaces, John Wiley & Sons, New York, 1982.
[6] F.A.L. Dullien, Porous Media: Fluid Transport and Pore Structure, Academic Press,
New York, 1992.
[7] J.T. Gostick, M.W. Fowler, M.A. Ioannidis, M.D. Pritzker, Y.M. Volfkovich and A. Sakars,
J. Power Sources 156 (2006) 375.
[8] T. Koido, T. Furusawa and K. Moriyama, J. Power Sources 175 (2008) 127.
[9] J.D. Fairweather, P. Cheung, J. St Pierre and D.T. Schwartz, Electrochem. Commun. 9
(2007) 2340.
[10] T.V. Nguyen, G. Lin, H. Ohn and X. Wang, Electrochem. Solid-State Lett. 11 (2008)
B127.
[11] N.R. Morrow, Ind. Eng. Chem. 62 (1970) 32.
[12] N. Shirtcliffe, G. McHale, M. Newton, F. Pyatt and S. Doerr, Appl. Phys. Lett. 89 (2006)
094101.
[13] W. Anderson, J. Petro. Tech. 39 (1987) 1283.
[14] M.A. Ioannidis, I. Chatzis and A.C. Payatakes, J. Colloid Interface Sci. 143 (1991) 22.
14
6 Figures
Figure 1 – Expanded view of sample holder.
15
Figure 2 – Sample of raw data for SGL10BA showing transient water uptake into sample as
the capillary pressure is incremented stepwise.
16
Figure 3 – Air water capillary pressure curve for Toray090 (top) and SGL10BA (bottom). The
white circles at -10,000 Pa are the residual saturation level determined independently by
weighing the samples after the experiment.