direct reading instruments for aerosolsflaiha.wildapricot.org/resources/documents/conferences/2012...
TRANSCRIPT

DIRECT READING INSTRUMENTS FOR AEROSOLS
Avula Sreenath, Ph.D. TSI Inc. [email protected]
Florida Local Section of AIHA Fall Conference 2012 Jacksonville, FL Sept 21, 2012
Agenda
1. Learning Objectives 2. Introduction 3. Types of Contaminants 4. Sampling strategies – Why/What/Where/When/How 5. Advantages and disadvantages of real-time sampling 6. Instruments based on particle motion and optical detection 7. Instruments based on electrical techniques 8. Instruments based on super-saturation/condensation detection 9. Instruments based on particle interaction with light 10. Instruments based on mass measurement (Optical ) 11. Optical Particle Counters (OPCs) 12. Instruments based on diffusion charging 13. New trends in aerosol monitoring 14. Factors affecting the choice of an instrument
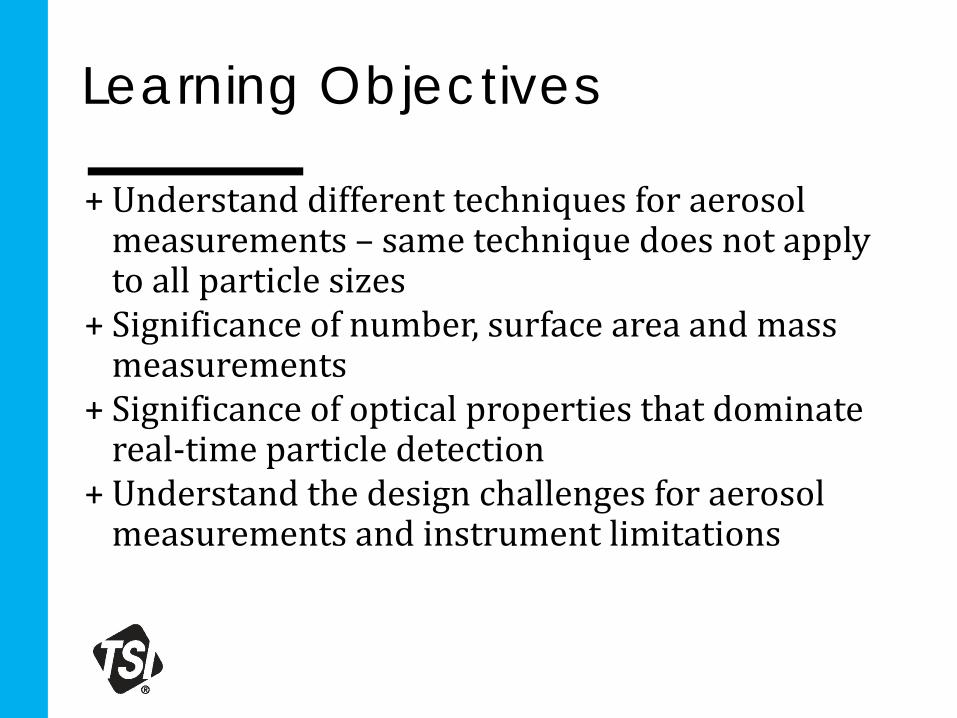
Learning Objectives
+ Understand different techniques for aerosol measurements – same technique does not apply to all particle sizes
+ Significance of number, surface area and mass measurements
+ Significance of optical properties that dominate real-time particle detection
+ Understand the design challenges for aerosol measurements and instrument limitations

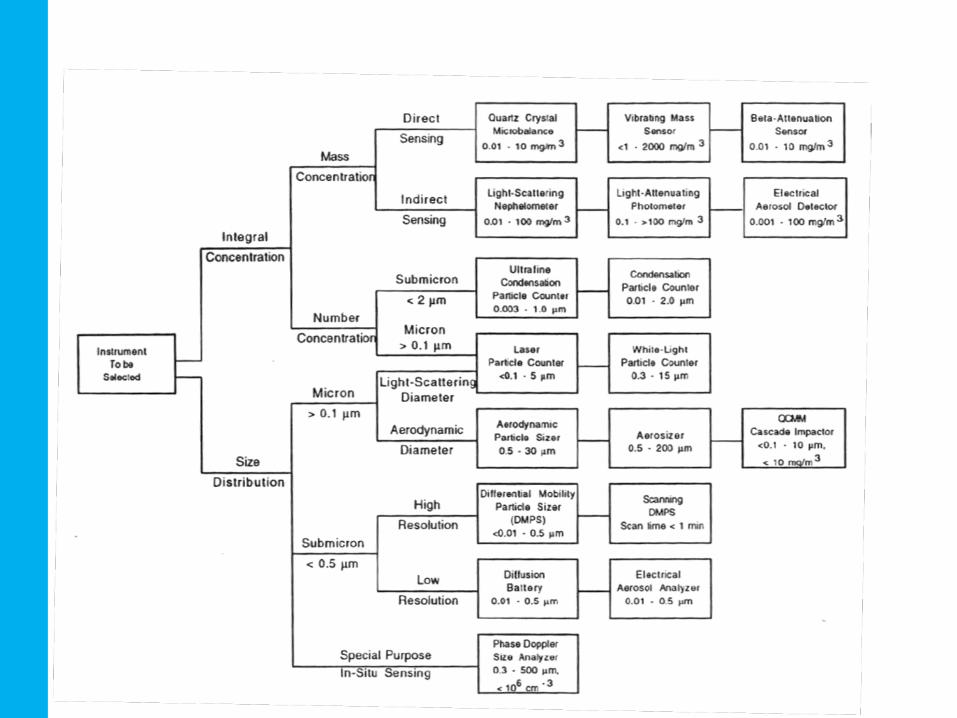
Introduction
Measurement Methodology ◦ Particles – size, shape, material, refractive index and
density ◦ Environments – Workplaces, clean rooms, atmospheric
measurements, pharmaceutical clean rooms, research based measurements ◦ Detection techniques – light scattering, light extinction,
piezo balance, diffusion battery, electrical mobility, condensation etc. ◦ Hardware – Probes, inlet conditioners,
area/portable/personal samplers ◦ Data Integration – Facilities monitoring, perimeter
monitoring, clean room standards, filter checks, wireless communications, particles losses
◦Detection techniques – light scattering, light extinction, piezo balance, diffusion battery, electrical mobility, condensation etc.
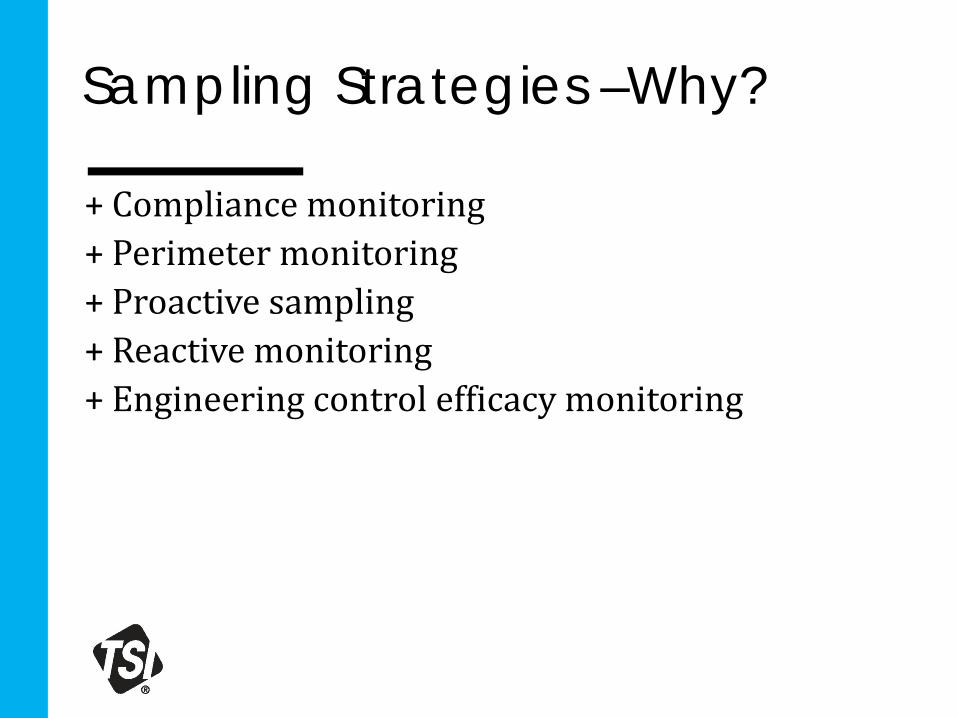
Sampling Strategies –Why?
+ Compliance monitoring + Perimeter monitoring + Proactive sampling + Reactive monitoring + Engineering control efficacy monitoring
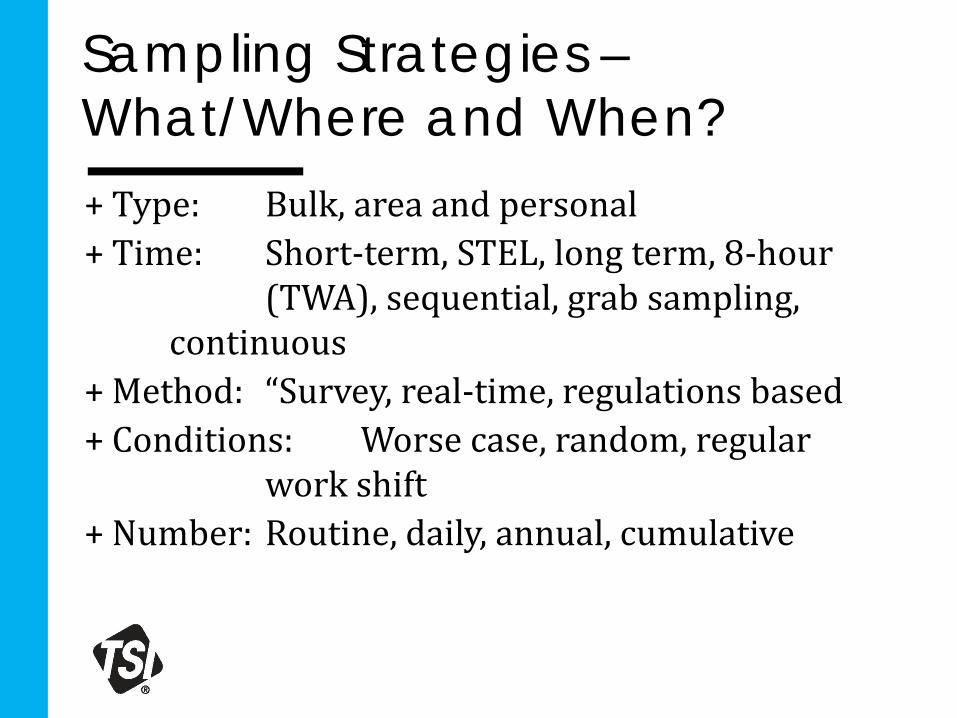
Sampling Strategies – What/Where and When? + Type: Bulk, area and personal + Time: Short-term, STEL, long term, 8-hour
(TWA), sequential, grab sampling, continuous
+ Method: “Survey, real-time, regulations based + Conditions: Worse case, random, regular
work shift + Number: Routine, daily, annual, cumulative
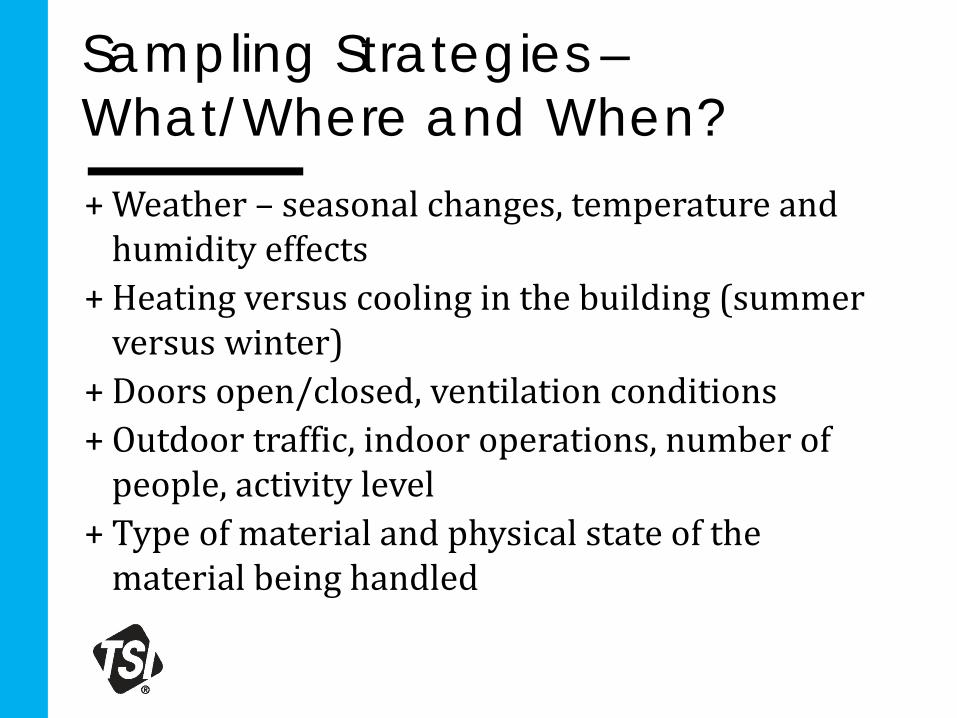
Sampling Strategies – What/Where and When? + Weather – seasonal changes, temperature and
humidity effects + Heating versus cooling in the building (summer
versus winter) + Doors open/closed, ventilation conditions + Outdoor traffic, indoor operations, number of
people, activity level + Type of material and physical state of the
material being handled
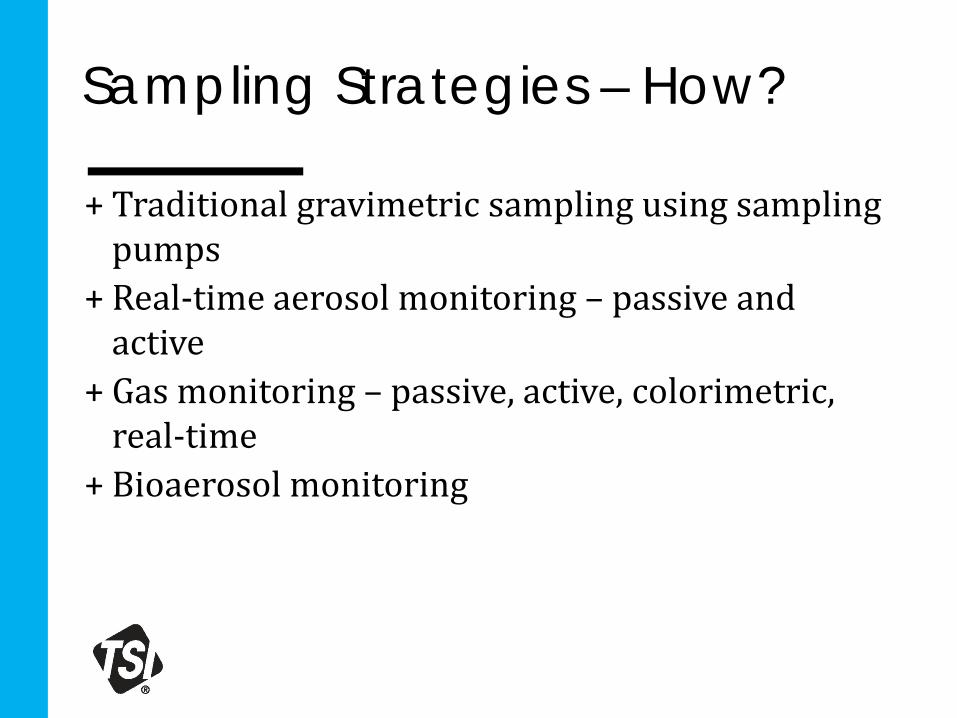
Sampling Strategies – How?
+ Traditional gravimetric sampling using sampling pumps
+ Real-time aerosol monitoring – passive and active
+ Gas monitoring – passive, active, colorimetric, real-time
+ Bioaerosol monitoring
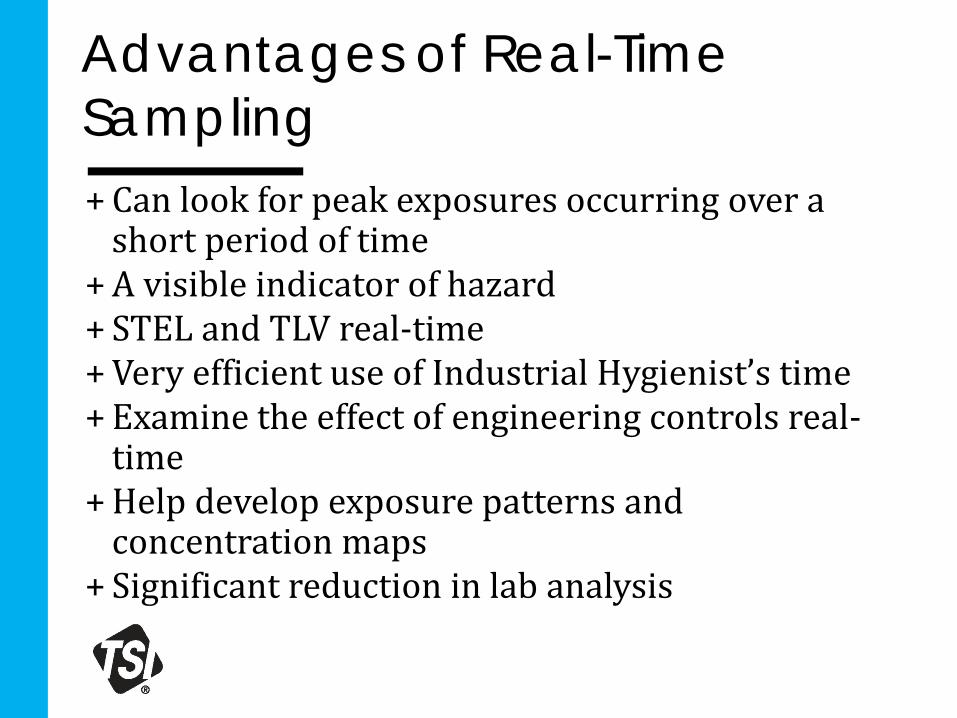
Advantages of Real-Time Sampling + Can look for peak exposures occurring over a
short period of time + A visible indicator of hazard + STEL and TLV real-time + Very efficient use of Industrial Hygienist’s time + Examine the effect of engineering controls real-
time + Help develop exposure patterns and
concentration maps + Significant reduction in lab analysis
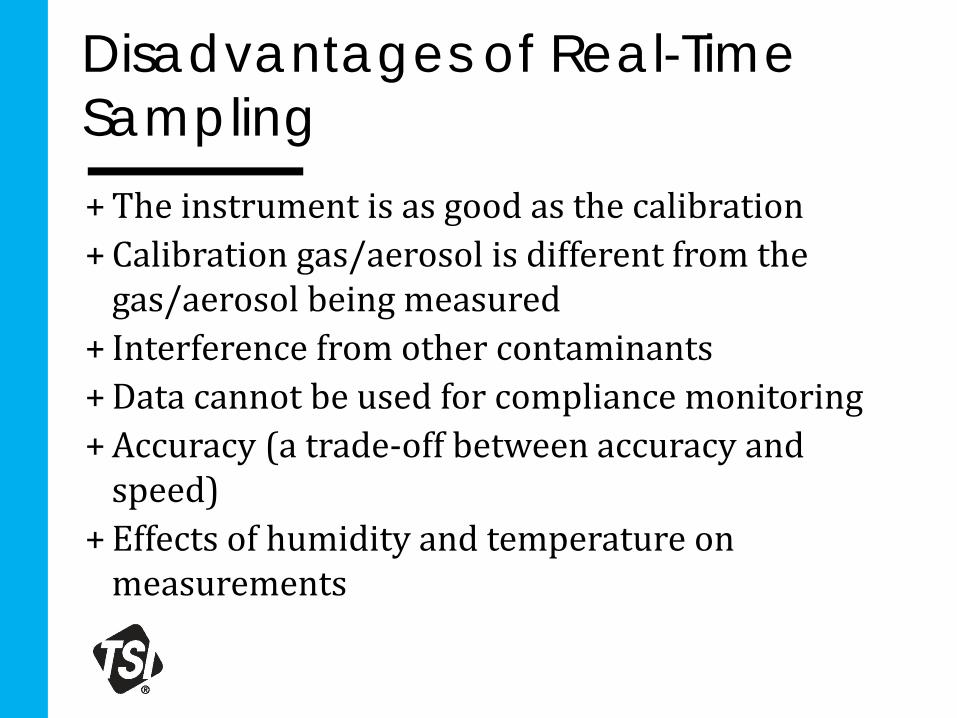
Disadvantages of Real-Time Sampling + The instrument is as good as the calibration + Calibration gas/aerosol is different from the
gas/aerosol being measured + Interference from other contaminants + Data cannot be used for compliance monitoring + Accuracy (a trade-off between accuracy and
speed) + Effects of humidity and temperature on
measurements
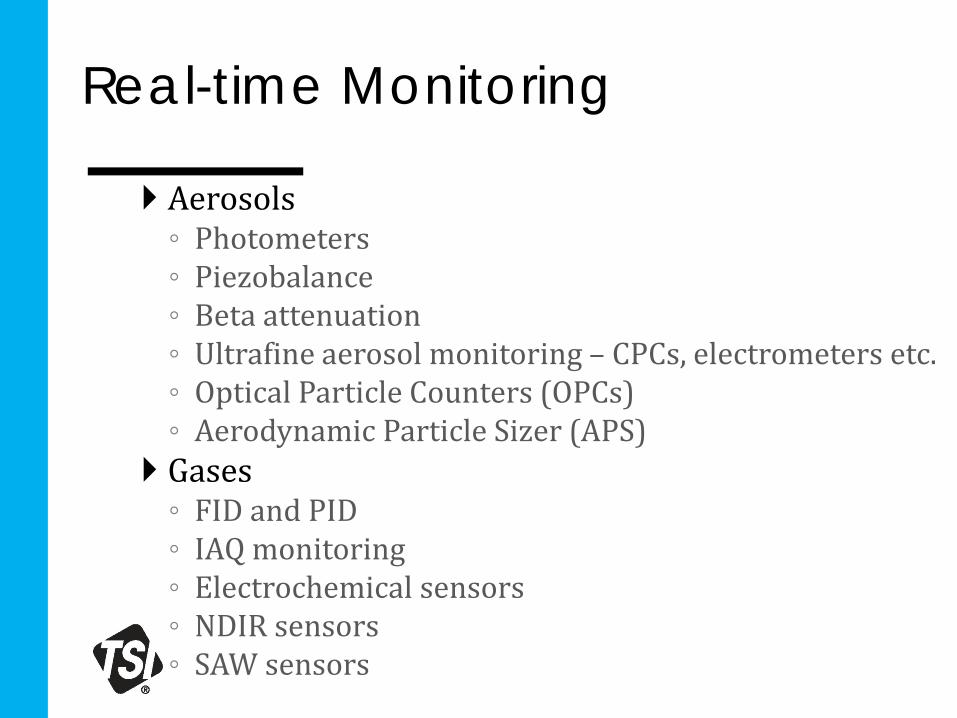
Real-time Monitoring
Aerosols ◦ Photometers ◦ Piezobalance ◦ Beta attenuation ◦ Ultrafine aerosol monitoring – CPCs, electrometers etc. ◦ Optical Particle Counters (OPCs) ◦ Aerodynamic Particle Sizer (APS)
Gases ◦ FID and PID ◦ IAQ monitoring ◦ Electrochemical sensors ◦ NDIR sensors ◦ SAW sensors
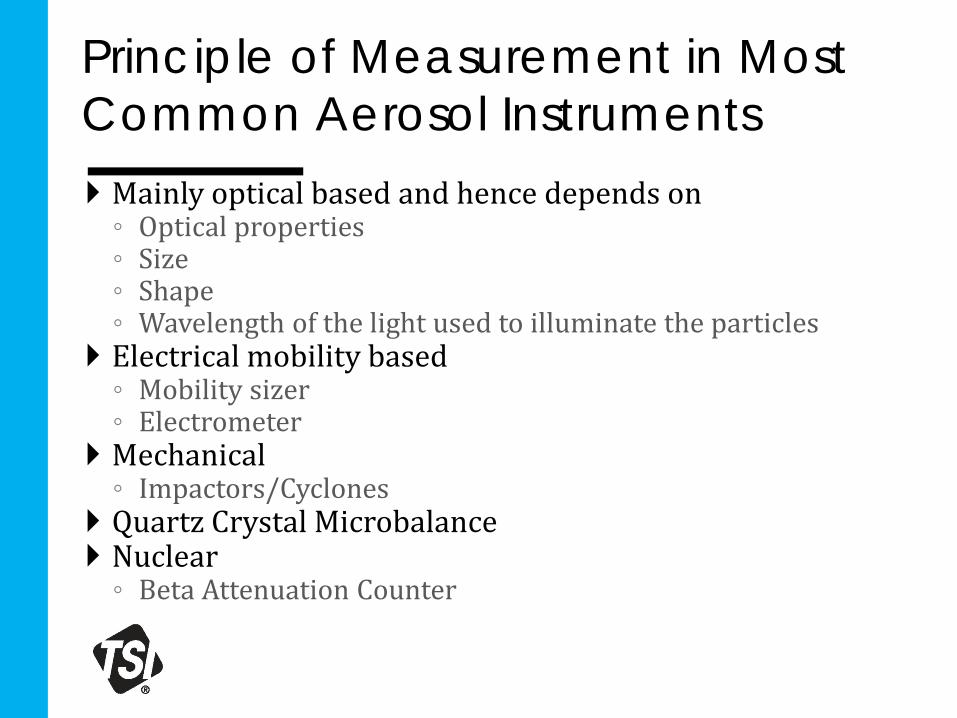
Principle of Measurement in Most Common Aerosol Instruments Mainly optical based and hence depends on ◦ Optical properties ◦ Size ◦ Shape ◦ Wavelength of the light used to illuminate the particles
Electrical mobility based ◦ Mobility sizer ◦ Electrometer
Mechanical ◦ Impactors/Cyclones
Quartz Crystal Microbalance Nuclear ◦ Beta Attenuation Counter
Instruments based on Particle Motion and Optical Detection + Detection based on accelerating particles thro’ a
nozzle and detecting the particles one-by-one using light scattering
+ Particles lag the gas velocity due to inertia + The ‘time-of-flight’ between 2 laser beams
separated by a known distance is measured and converted to aerodynamic diameter
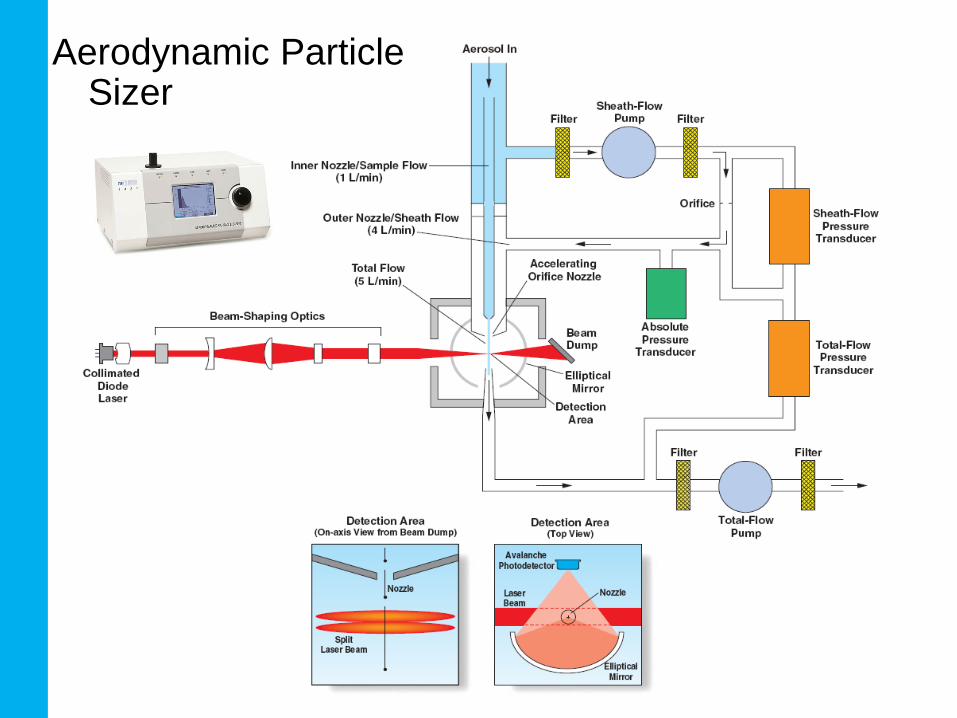
Aerodynamic Particle Sizer
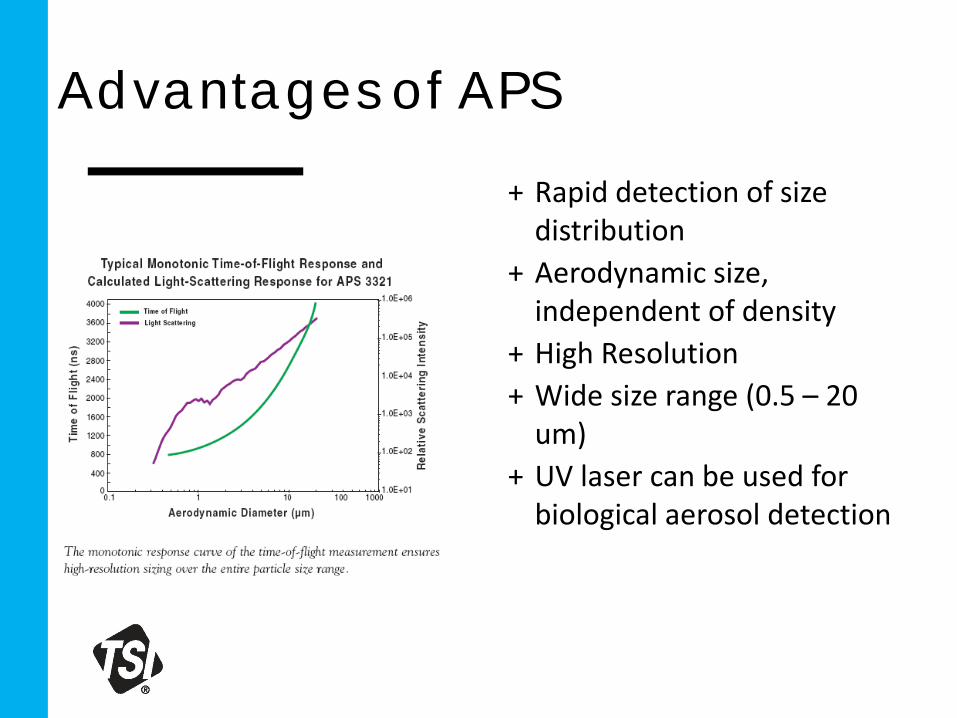
Advantages of APS
+ Rapid detection of size distribution
+ Aerodynamic size, independent of density
+ High Resolution + Wide size range (0.5 – 20
um) + UV laser can be used for
biological aerosol detection
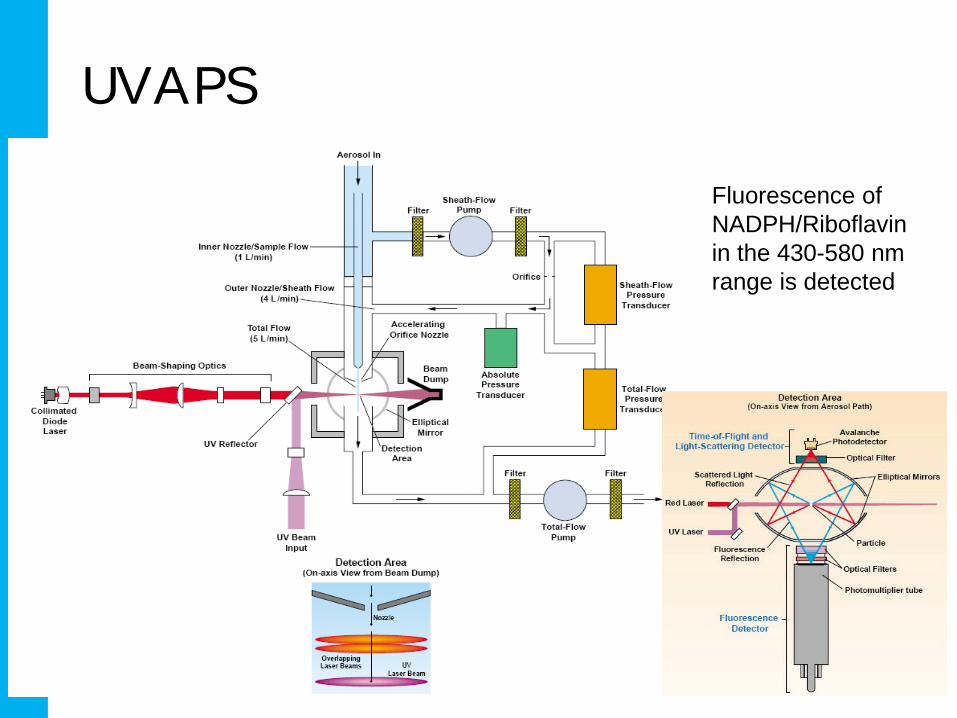
UVAPS
Fluorescence of NADPH/Riboflavin in the 430-580 nm range is detected

Limitations of the APS
+ High acceleration leads to Stokes correction (Rep > 0.1, particle velocity is no longer proportional to Dae and is now a function of shape, density and Dae)
+ Coincidence becomes a problem at high concentrations
+ Distortion of liquid particles in the flow field + Misalignment of particle flow w.r.t. laser beams
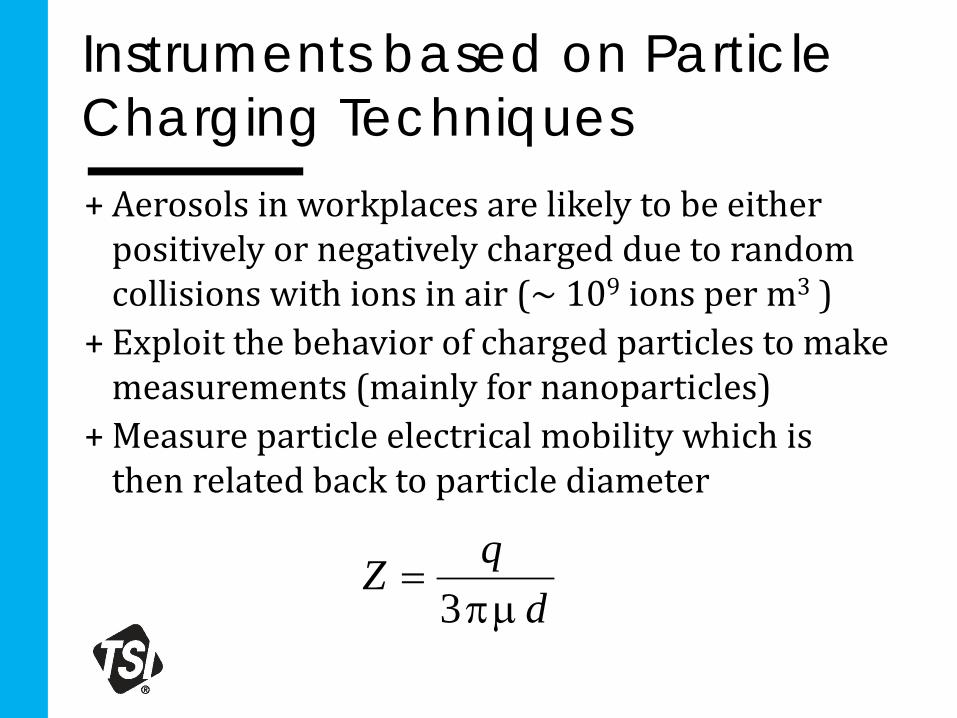
Instruments based on Particle Charging Techniques + Aerosols in workplaces are likely to be either
positively or negatively charged due to random collisions with ions in air (~ 109 ions per m3 )
+ Exploit the behavior of charged particles to make measurements (mainly for nanoparticles)
+ Measure particle electrical mobility which is then related back to particle diameter
dqZµπ
=3
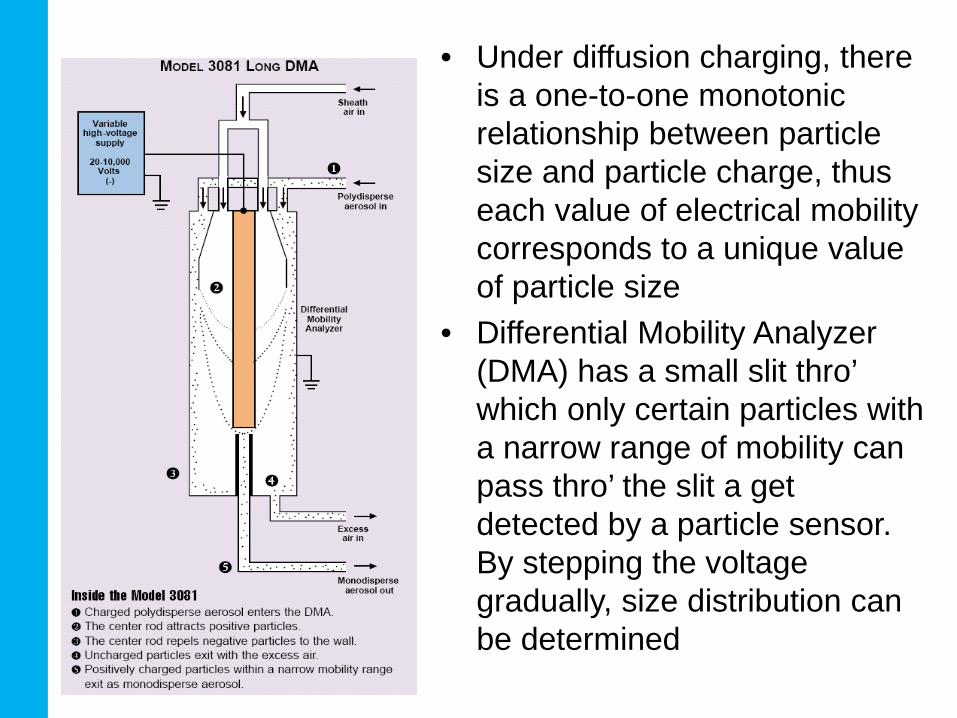
• Under diffusion charging, there is a one-to-one monotonic relationship between particle size and particle charge, thus each value of electrical mobility corresponds to a unique value of particle size
• Differential Mobility Analyzer (DMA) has a small slit thro’ which only certain particles with a narrow range of mobility can pass thro’ the slit a get detected by a particle sensor. By stepping the voltage gradually, size distribution can be determined
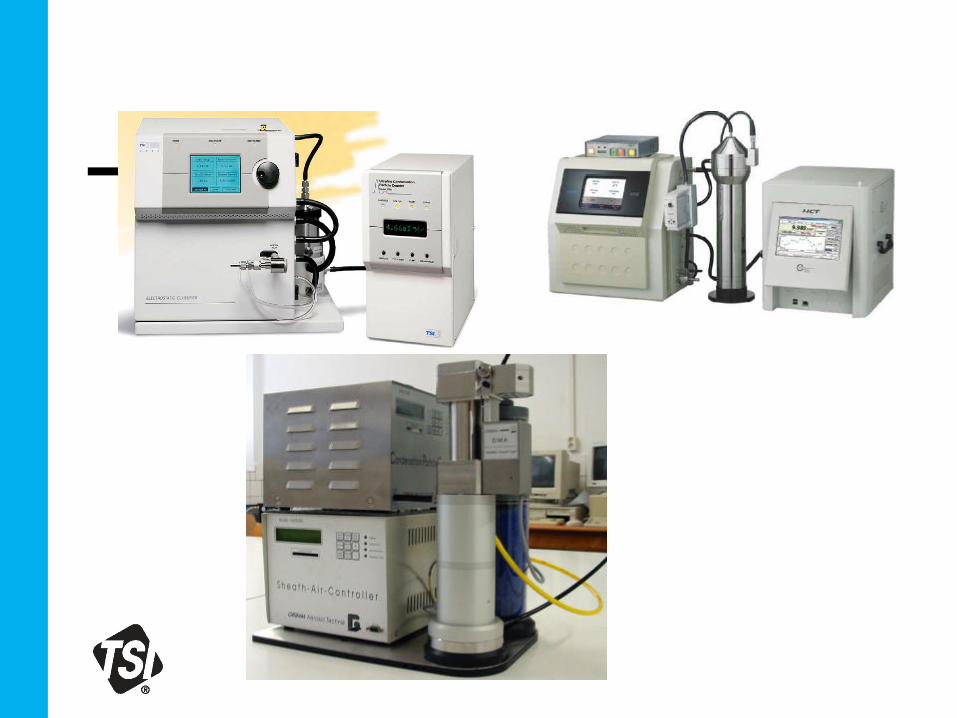
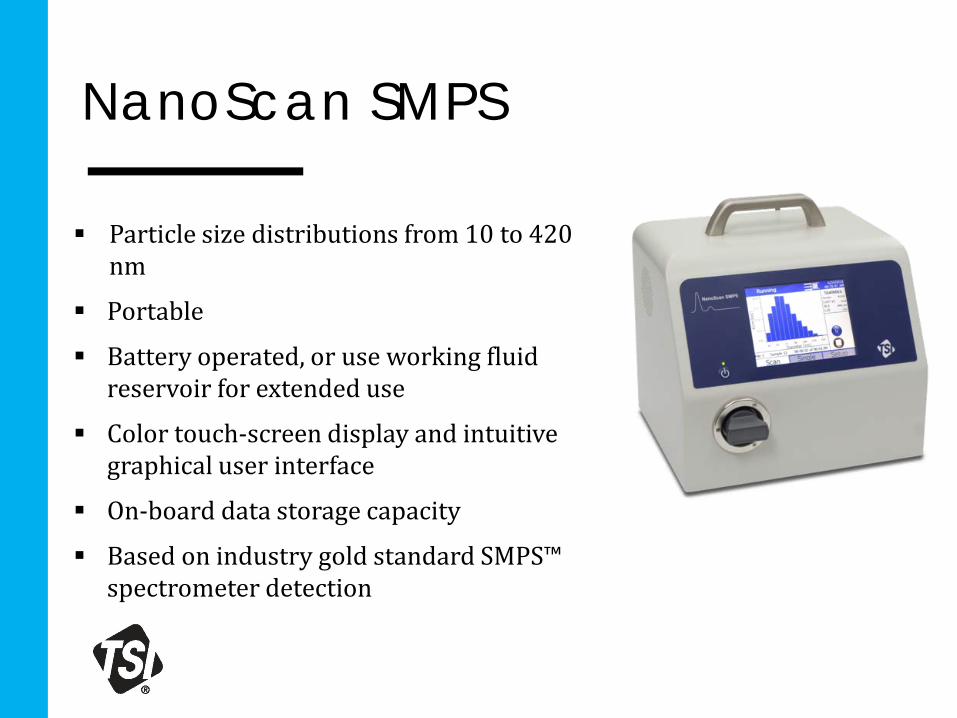
NanoScan SMPS
Particle size distributions from 10 to 420 nm
Portable
Battery operated, or use working fluid reservoir for extended use
Color touch-screen display and intuitive graphical user interface
On-board data storage capacity
Based on industry gold standard SMPS™ spectrometer detection
Instruments Based on Super-Saturation/Condensation Downstream of the DMA/EAA, the particle
detector of choice is a Condensation Nuclei Counter (CNC), or commonly also known as Condensation Particle Counter (CPC)
Principle of Operation – Condensation of alcohol vapor that causes the vapor to condense on particles resulting in formation of very large particles (> 1 µm) which are large enough to be detected using optical techniques
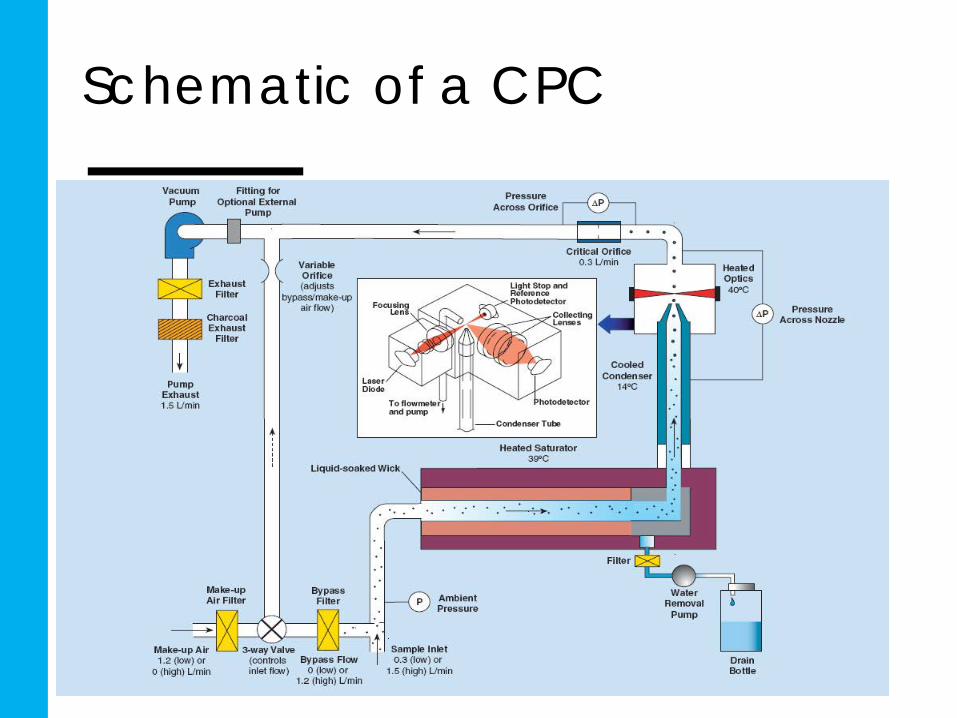
Schematic of a CPC
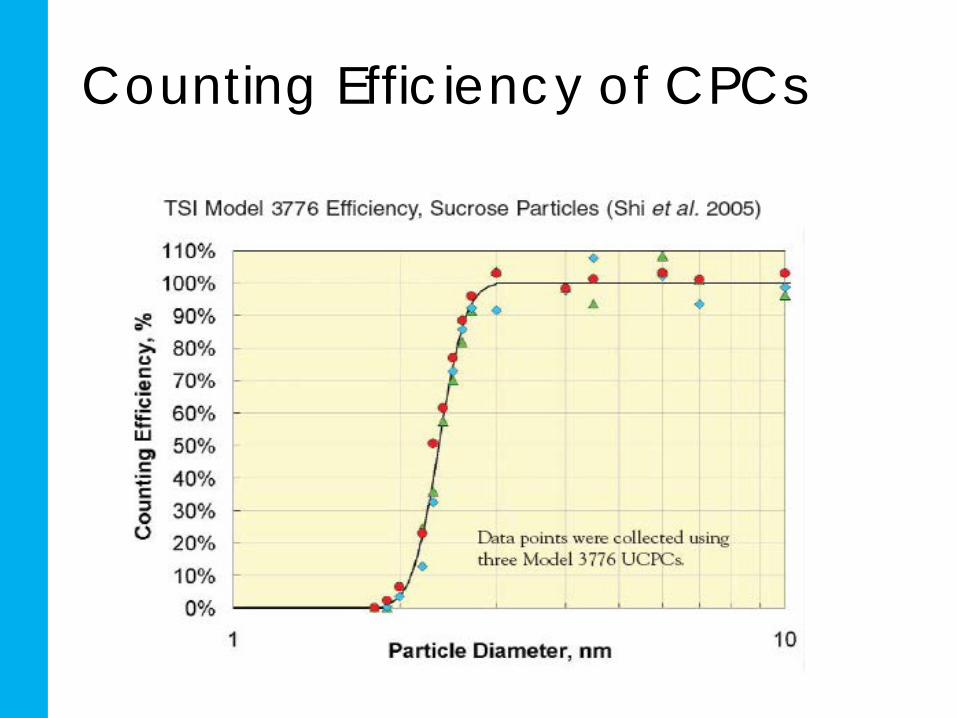
Counting Efficiency of CPCs
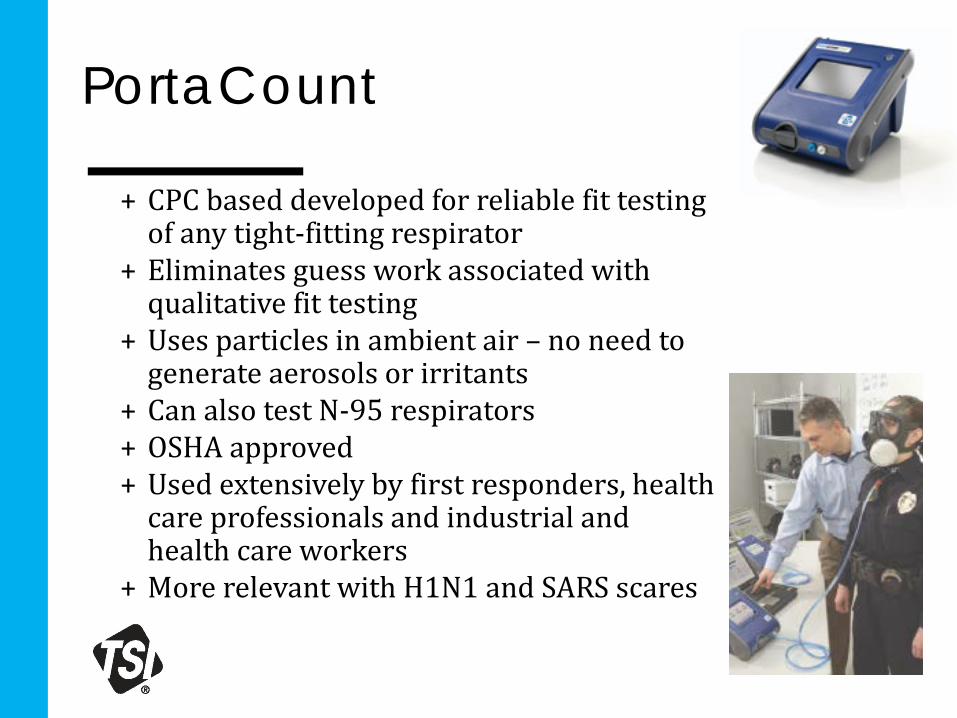
PortaCount
+ CPC based developed for reliable fit testing of any tight-fitting respirator
+ Eliminates guess work associated with qualitative fit testing
+ Uses particles in ambient air – no need to generate aerosols or irritants
+ Can also test N-95 respirators + OSHA approved + Used extensively by first responders, health
care professionals and industrial and health care workers
+ More relevant with H1N1 and SARS scares
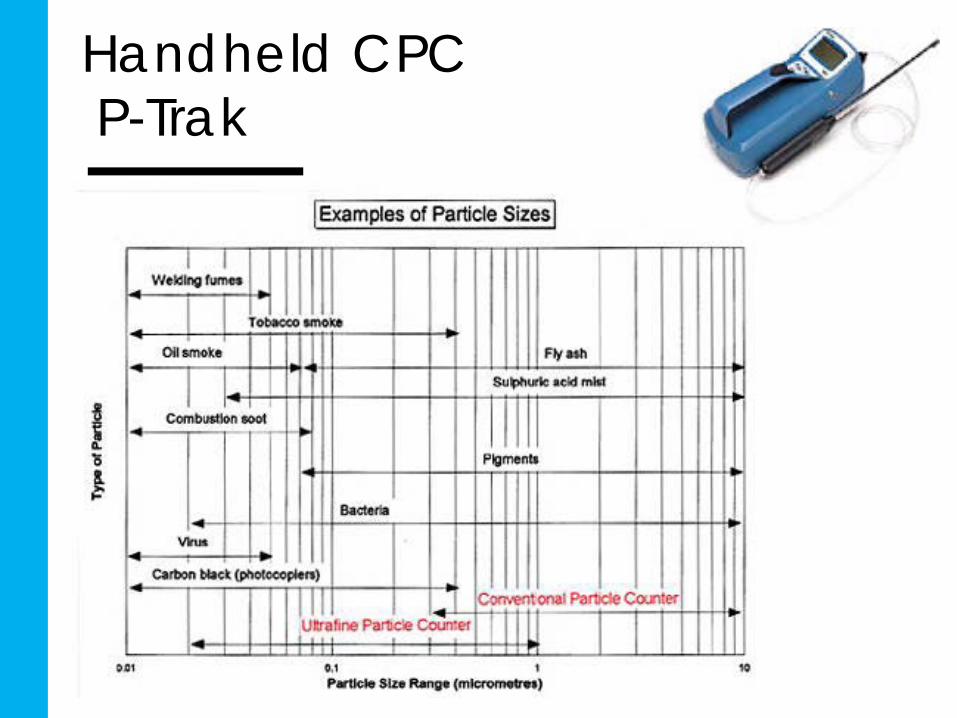
Handheld CPC P-Trak
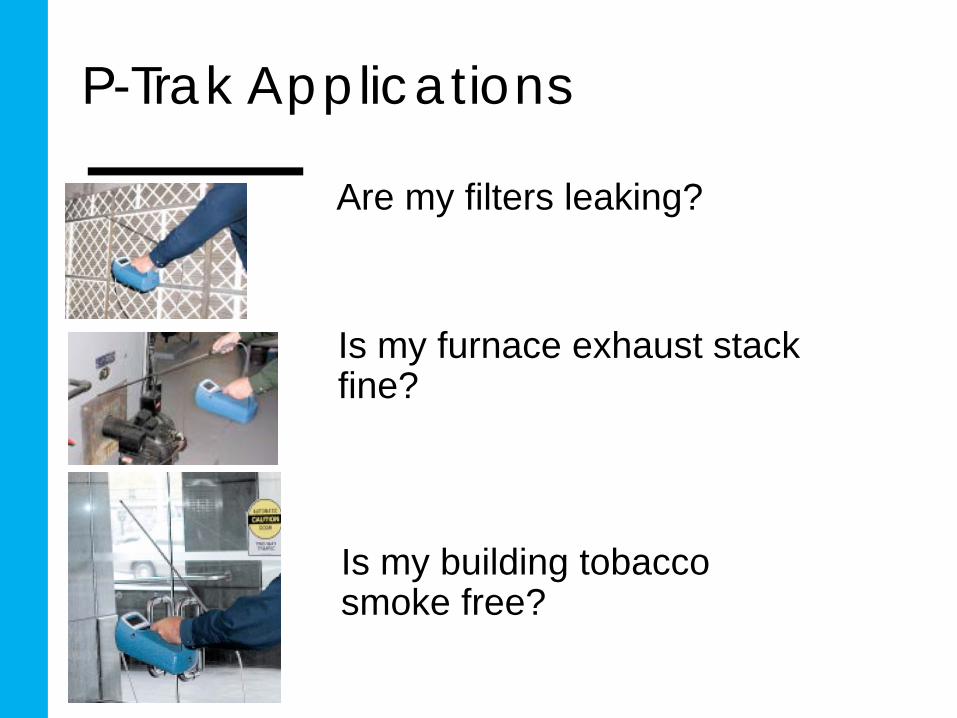
P-Trak Applications
Are my filters leaking?
Is my furnace exhaust stack fine?
Is my building tobacco smoke free?
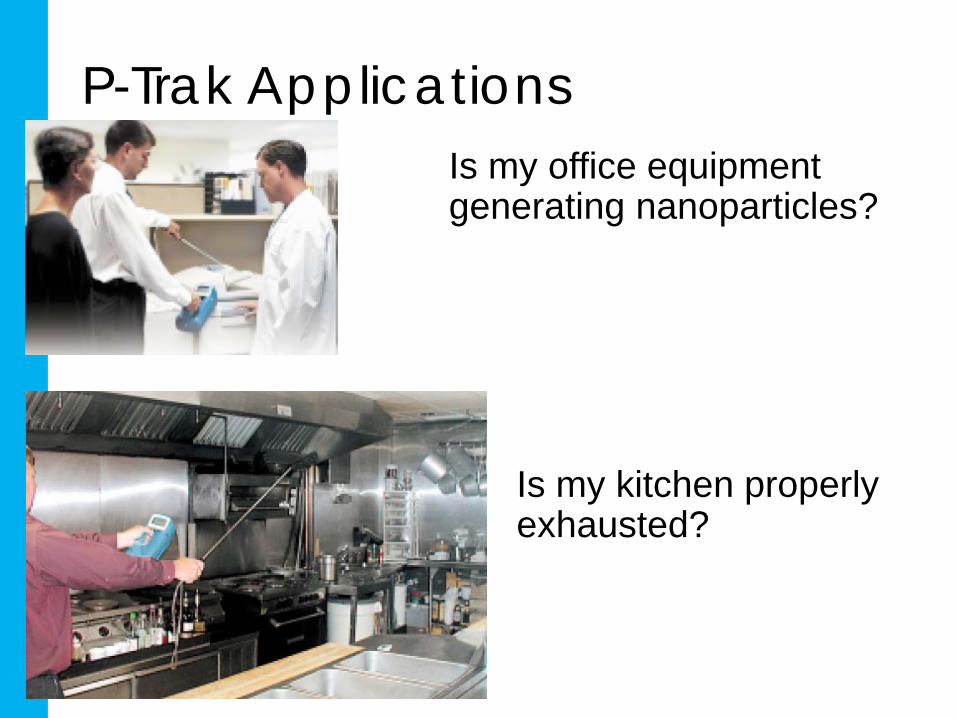
P-Trak Applications Is my office equipment generating nanoparticles?
Is my kitchen properly exhausted?
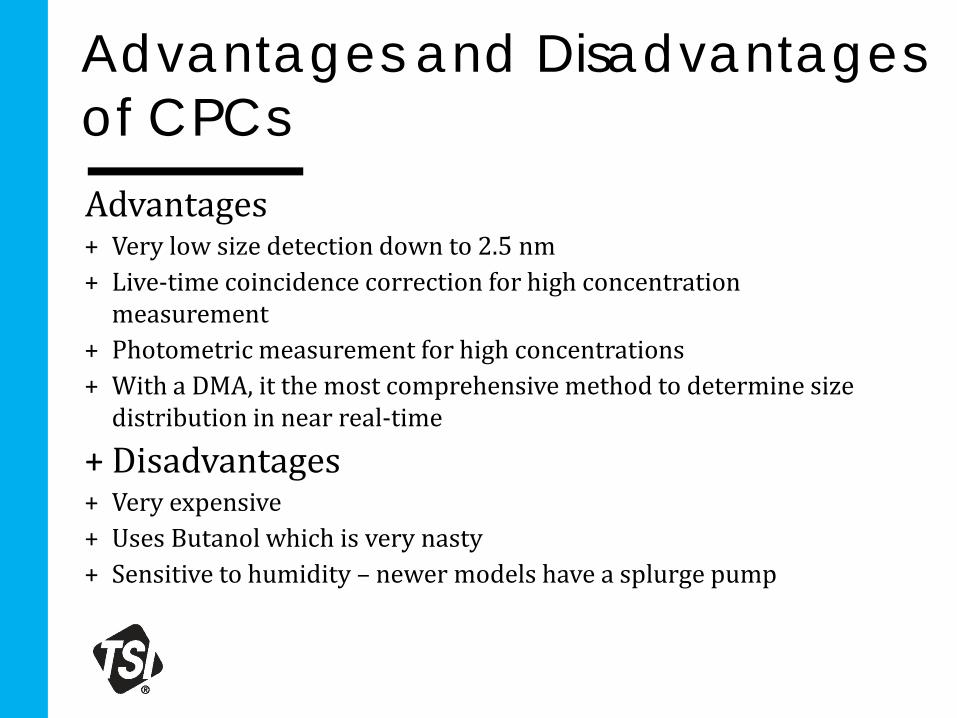
Advantages and Disadvantages of CPCs Advantages + Very low size detection down to 2.5 nm + Live-time coincidence correction for high concentration
measurement + Photometric measurement for high concentrations + With a DMA, it the most comprehensive method to determine size
distribution in near real-time
+ Disadvantages + Very expensive + Uses Butanol which is very nasty + Sensitive to humidity – newer models have a splurge pump

Instruments Based on Optical Properties + Some of the light incident on the particle is reflected, which another
fraction is diffracted, while yet another portion is refracted + Collectively, it is referred to as scattering and the real portion of the
refractive index is related to light scattering + The imaginary component of the refractive index is related to light
absorption + Transparent particles have no imaginary component, while colored
particles have a substantial imaginary component + Refractive index greatly depends on the wavelength of light + Glass beads = 1.5 - 2.0 + Carbon = 2 - i

Photometers
+ Size range – 0.1 – 10 µm + Concentration range – 0.001 – 100 mg/m3
+ Humidity range < 50% RH + Temperature range is 5 – 50 Deg.C + Zero drift - 0.001 mg/m3 in 24 hours + Optics are very simple + Small collecting angle + Sheath flow not required but recommended + Calibrated using a broad size distribution like
Arizona Road Dust
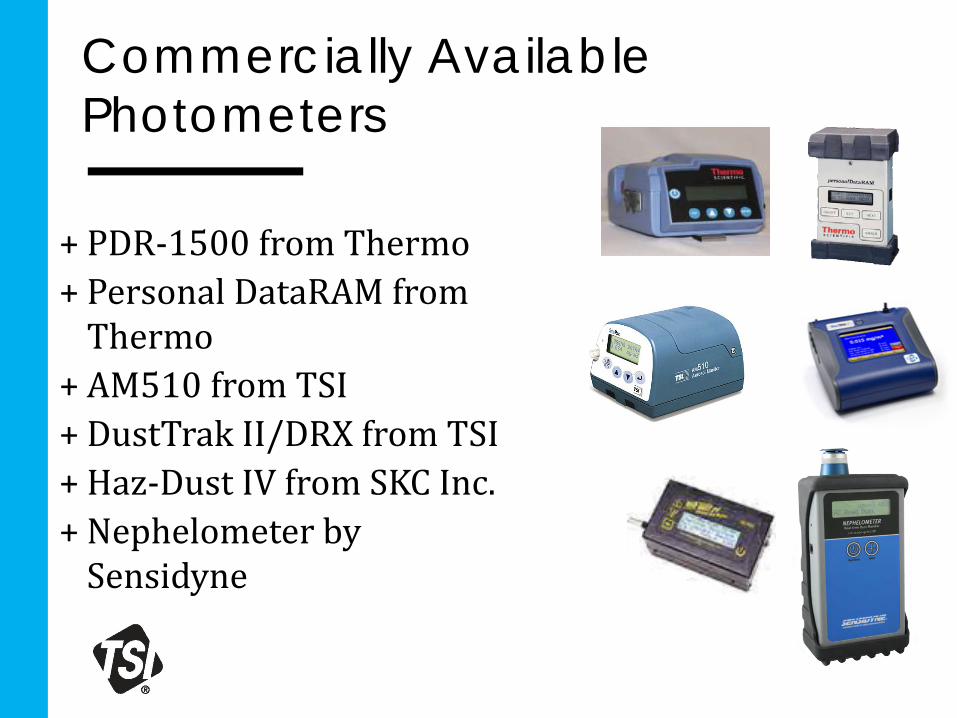
Commercially Available Photometers
+ PDR-1500 from Thermo + Personal DataRAM from
Thermo + AM510 from TSI + DustTrak II/DRX from TSI + Haz-Dust IV from SKC Inc. + Nephelometer by
Sensidyne
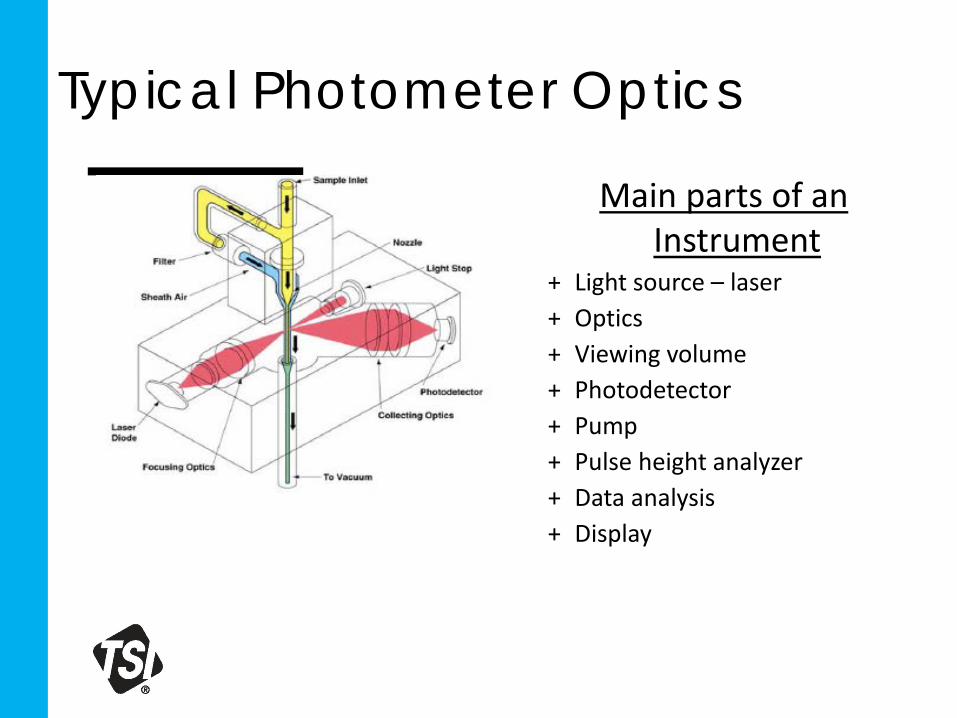
Typical Photometer Optics
Main parts of an Instrument
+ Light source – laser + Optics + Viewing volume + Photodetector + Pump + Pulse height analyzer + Data analysis + Display
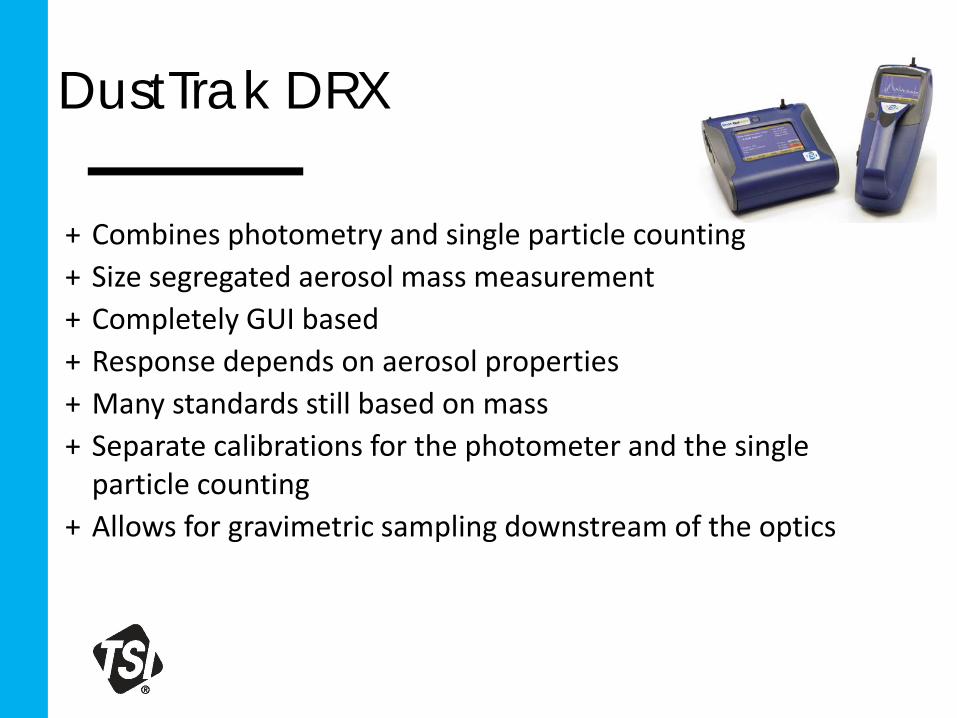
DustTrak DRX
+ Combines photometry and single particle counting + Size segregated aerosol mass measurement + Completely GUI based + Response depends on aerosol properties + Many standards still based on mass + Separate calibrations for the photometer and the single
particle counting + Allows for gravimetric sampling downstream of the optics
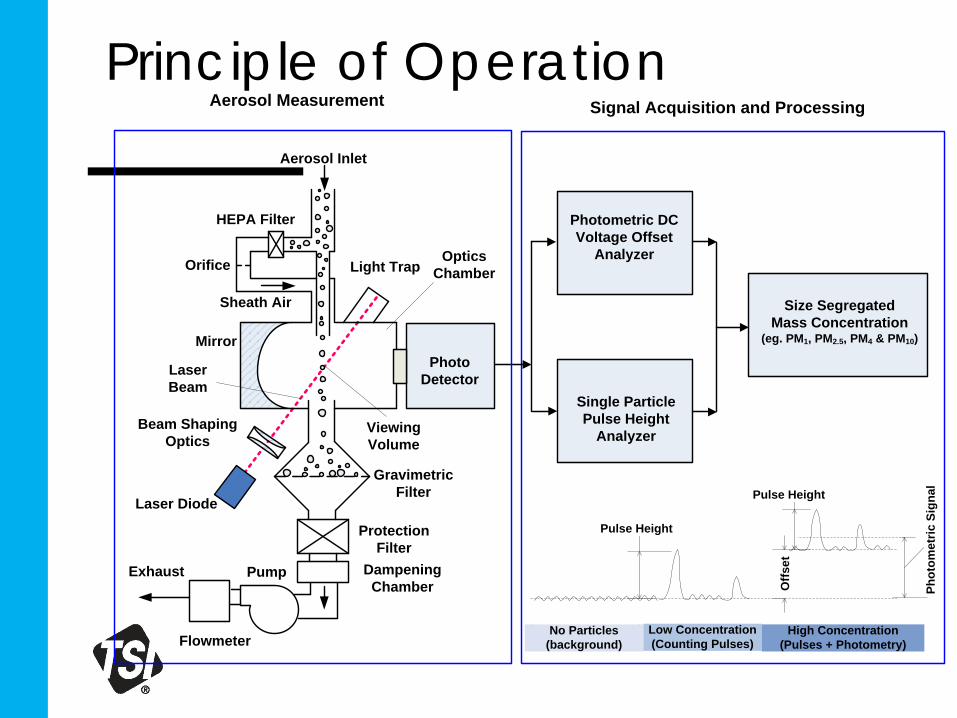
Principle of Operation
PhotoDetector
Laser Diode
Light Trap
Aerosol Inlet
Sheath Air
Exhaust
Mirror
Aerosol Measurement
Flowmeter
Gravimetric Filter
Pump
ProtectionFilter
Beam ShapingOptics
Viewing Volume
Photometric DC Voltage Offset
Analyzer
Single Particle Pulse Height
Analyzer
Size SegregatedMass Concentration
(eg. PM1, PM2.5, PM4 & PM10)
OpticsChamber
Signal Acquisition and Processing
Orifice
HEPA Filter
Dampening Chamber
LaserBeam
Low Concentration(Counting Pulses)
High Concentration(Pulses + Photometry)
Phot
omet
ric S
igna
l
No Particles(background)
Pulse Height
Offs
et
Pulse Height
Optical Particle Counters
Instrument to count individual particles Size range – 0.1 – 20 µm Applicable for very low concentrations No zero drift issues Complicated optics including powerful laser Large collecting angle to gather as much light
from the particle as possible – elliptical mirrors Sheath flow recommended Calibrated using different monodispersed PSL
Limitations of OPCs
Response of the OPC dependent on the refractive index of the particles. Custom calibration is required
Multiple values of diameter for the same scattering intensity
Cannot handle high particle concentrations due to coincidence error caused by presence of more than one particle in the sensing zone
Same size particle sized differently as it passes a different part of the Gaussian beam (Grazing error)
Particle shape can cause errors Optical diameter is not related to aerodynamic diameter Huge error in converting number distribution to mass
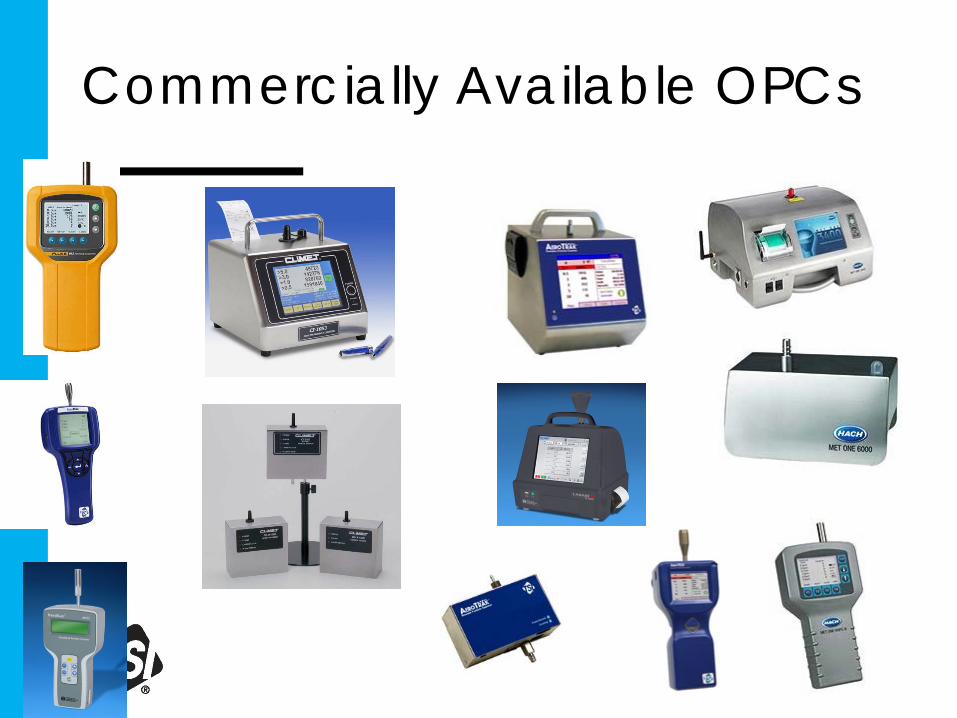
Commercially Available OPCs
Vast array of manufacturers and different market segments. Segments include: ◦ IAQ ◦ Pharma ◦ Clean rooms ◦ IH ◦ Environmental
Wide range of flow rates from 1 lpm to 100 lpm or more
Comes in different shapes and sizes Manufacturers – PMS, Climet, Hach (MetOne), TSI
and Fluke Additional Humidity and temperature probes
available
Commercially Available OPCs

Real Time Bioaerosol Detection BioTrak™
+ 28.3 lpm sample flow rate + Total and viable particulate measurement
• 6 size channels .5, .7, 1, 3, 5, 10 µm + 21501-4 compliant for total particulate + Particle collection on gelatin filter + 400,000 /ft^3 concentration limit + Remote sample tube (up to 10 ft) + Fixed time or fixed volume sampling + Programmable alarm limits + Alarms + Multi lingual display + Data Storage
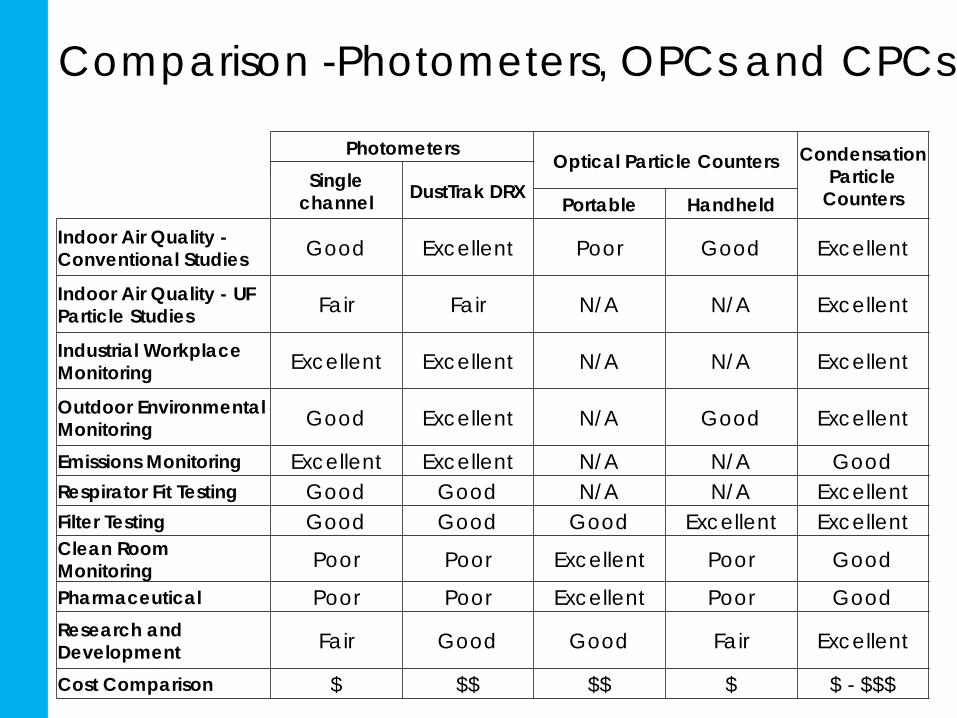
Comparison -Photometers, OPCs and CPCs
Photometers Optical Particle Counters Condensation Particle
Counters Single
channel DustTrak DRX Portable Handheld Indoor Air Quality - Conventional Studies Good Excellent Poor Good Excellent
Indoor Air Quality - UF Particle Studies Fair Fair N/A N/A Excellent
Industrial Workplace Monitoring Excellent Excellent N/A N/A Excellent
Outdoor Environmental Monitoring Good Excellent N/A Good Excellent
Emissions Monitoring Excellent Excellent N/A N/A Good Respirator Fit Testing Good Good N/A N/A Excellent Filter Testing Good Good Good Excellent Excellent Clean Room Monitoring Poor Poor Excellent Poor Good
Pharmaceutical Poor Poor Excellent Poor Good Research and Development Fair Good Good Fair Excellent
Cost Comparison $ $$ $$ $ $ - $$$
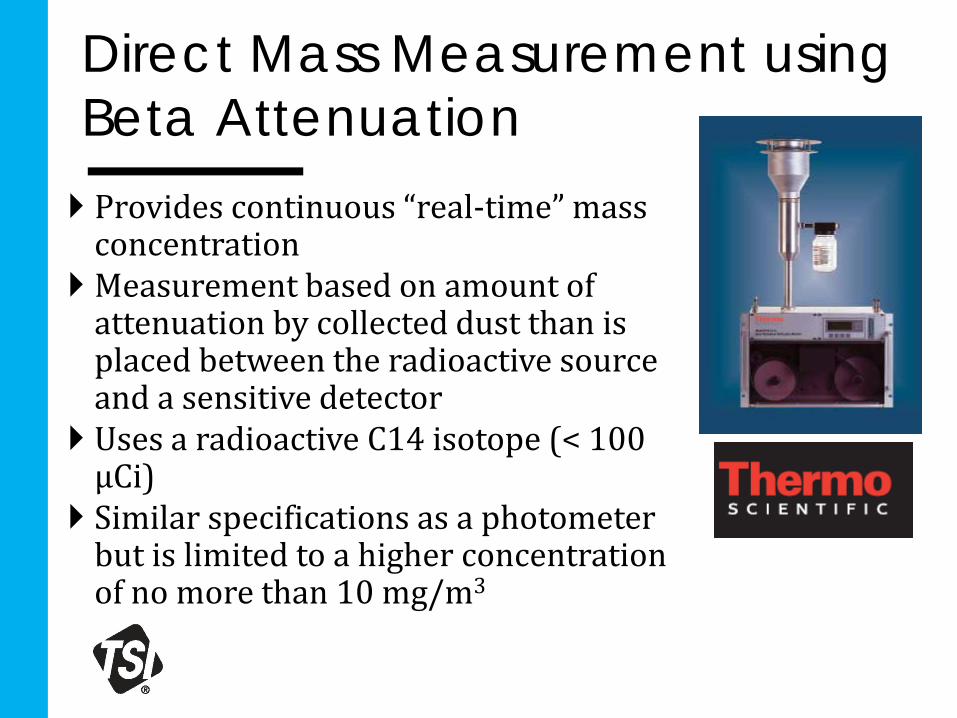
Direct Mass Measurement using Beta Attenuation Provides continuous “real-time” mass
concentration Measurement based on amount of
attenuation by collected dust than is placed between the radioactive source and a sensitive detector
Uses a radioactive C14 isotope (< 100 µCi)
Similar specifications as a photometer but is limited to a higher concentration of no more than 10 mg/m3
Number, Surface area and Mass based Instruments + Number – CPCs, OPCs, + Surface area – EAD, LQ-1DC (Diffusion charging
particle sensor), NSAM, Aeresense, NanoID + Mass – Piezobalance, photometers and OPCs + Why number is becoming significant?
• Nanoparticles do not have mass • Number is a good metric for health effects • New research suggests that surface area a better
metric
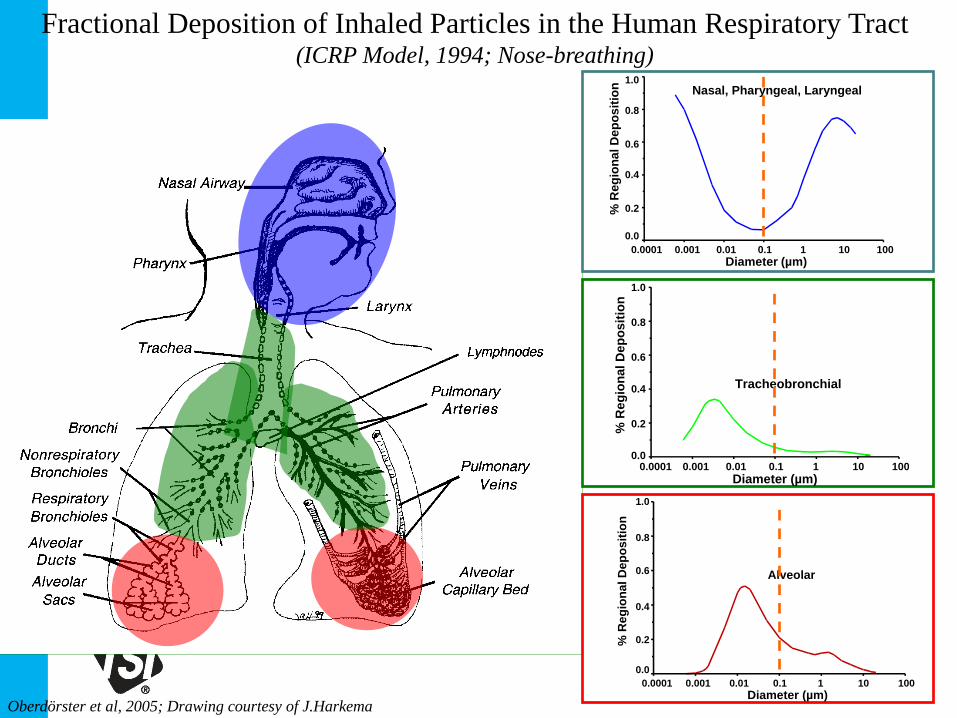
Fractional Deposition of Inhaled Particles in the Human Respiratory Tract (ICRP Model, 1994; Nose-breathing)
0.0001 0.001 0.01 0.1 1 10 1000.0
0.2
0.4
0.6
0.8
1.0
Diameter (µm)
% R
egio
nal D
epos
ition Nasal, Pharyngeal, Laryngeal
0.0001 0.001 0.01 0.1 1 10 1000.0
0.2
0.4
0.6
0.8
1.0
Diameter (µm)
% R
egio
nal D
epos
ition
Tracheobronchial
0.0001 0.001 0.01 0.1 1 10 1000.0
0.2
0.4
0.6
0.8
1.0
Diameter (µm)
% R
egio
nal D
epos
ition
Alveolar
Oberdörster et al, 2005; Drawing courtesy of J.Harkema
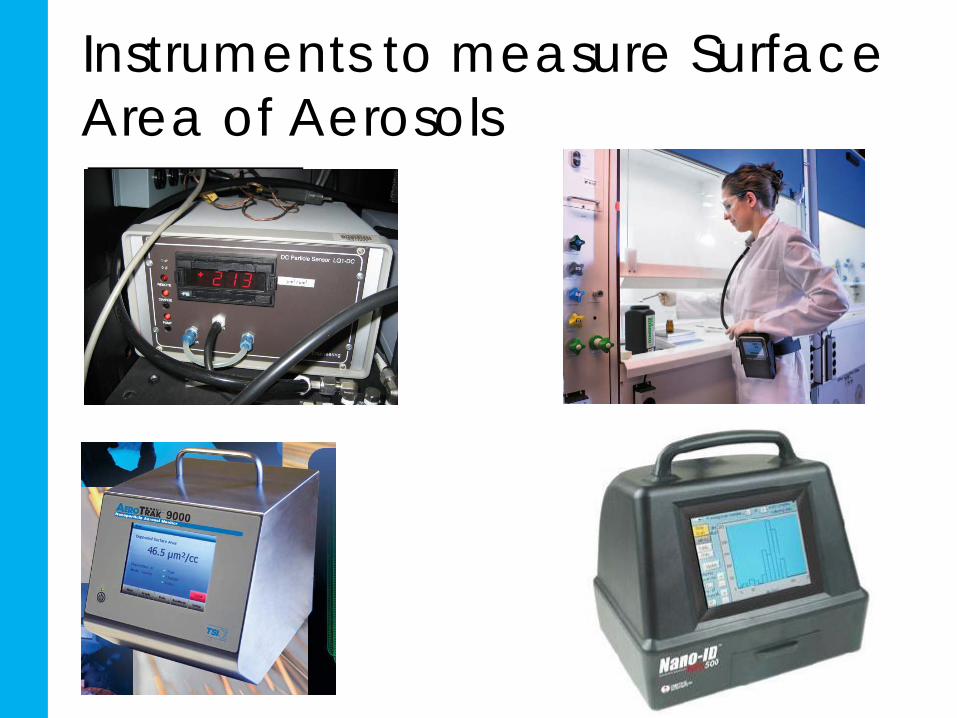
Instruments to measure Surface Area of Aerosols
New Concepts in Aerosol Monitoring
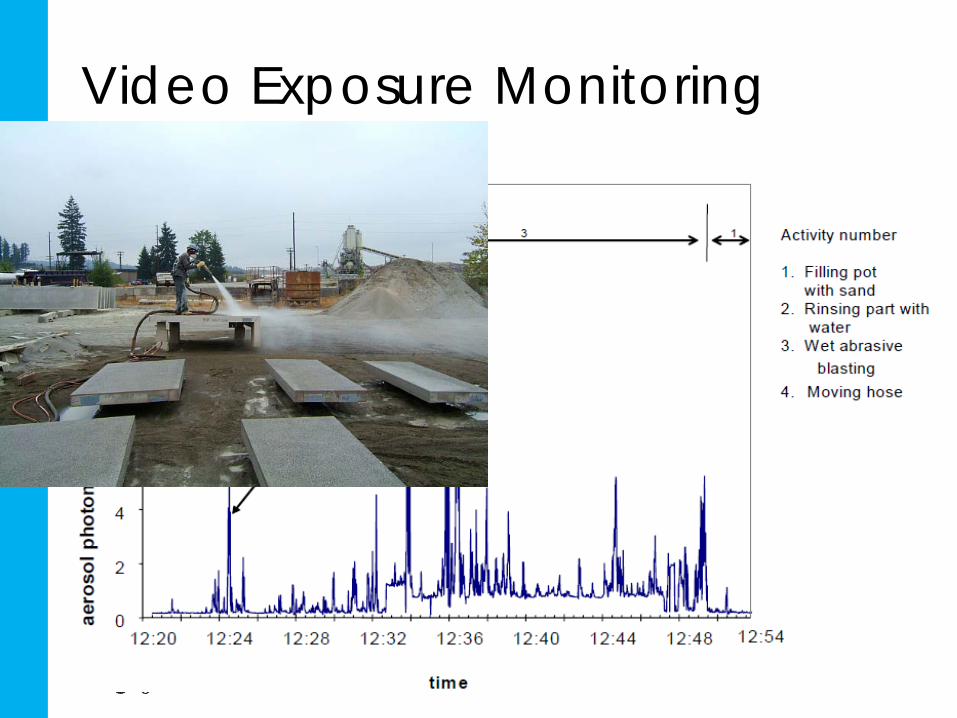
Video Exposure Monitoring
Perimeter or Fence-line Monitoring
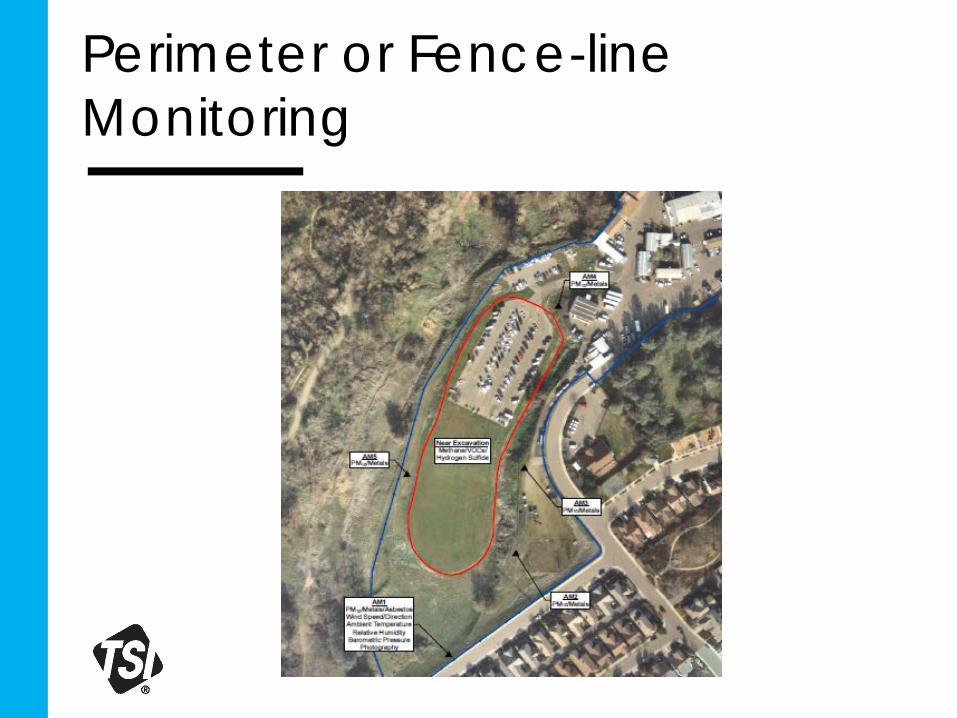
Perimeter or Fence-line Monitoring
Factors that affect the Choice of the Instrument Cost Particle size – inhalable, thoracic or respirable Measurement metric – number, surface area, mass Relative or absolute concentration? Concentration range – workplace versus clean rooms Workplace standards – TLVs versus STELs Is calibration possible? Temperature and humidity Need exposure with respect to time? Dynamic aerosol distributions – welding fumes,
combustion aerosols etc. Understand the trade-offs between accuracy, cost, size
and response time
References
+ Aerosol Measurement, 2 ed. (2005). Wiley Interscience, Edited by Willeke and Baron
+ Aerosol Science for Industrial Hygienists (1995), James H. Vincent, Pergamon Press
+ Prince, J. “Practical Considerations For Air Monitoring With Emphasis On Direct Reading Real Time Monitors”, General Motors of Canada
+ Collingwood, S. and Heitbrink, W.A., (2007), “Field Evaluation of an Engineering Control of Respirable Crystalline Silica Exposures During Mortar Removal”, Journal of Occupational and Environmental Hygiene, Vol 4(11), 875-887. http://dx.doi.org/10.1080/15459620701665720
Questions? [email protected]
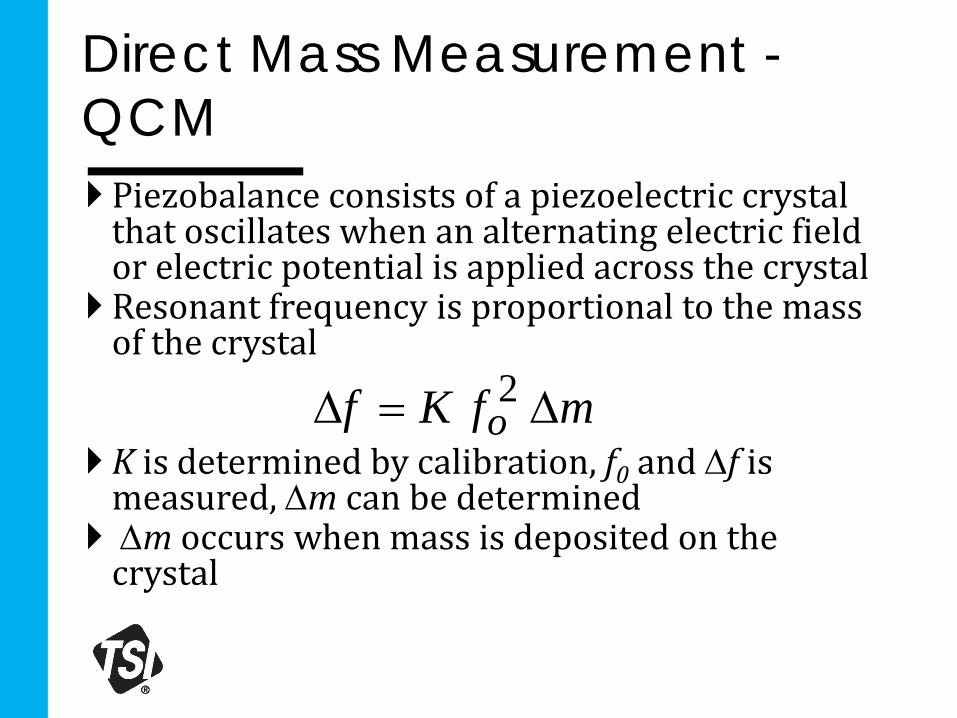
Direct Mass Measurement - QCM Piezobalance consists of a piezoelectric crystal
that oscillates when an alternating electric field or electric potential is applied across the crystal
Resonant frequency is proportional to the mass of the crystal
K is determined by calibration, f0 and ∆f is measured, ∆m can be determined
∆m occurs when mass is deposited on the crystal
mfKf o ∆=∆ 2
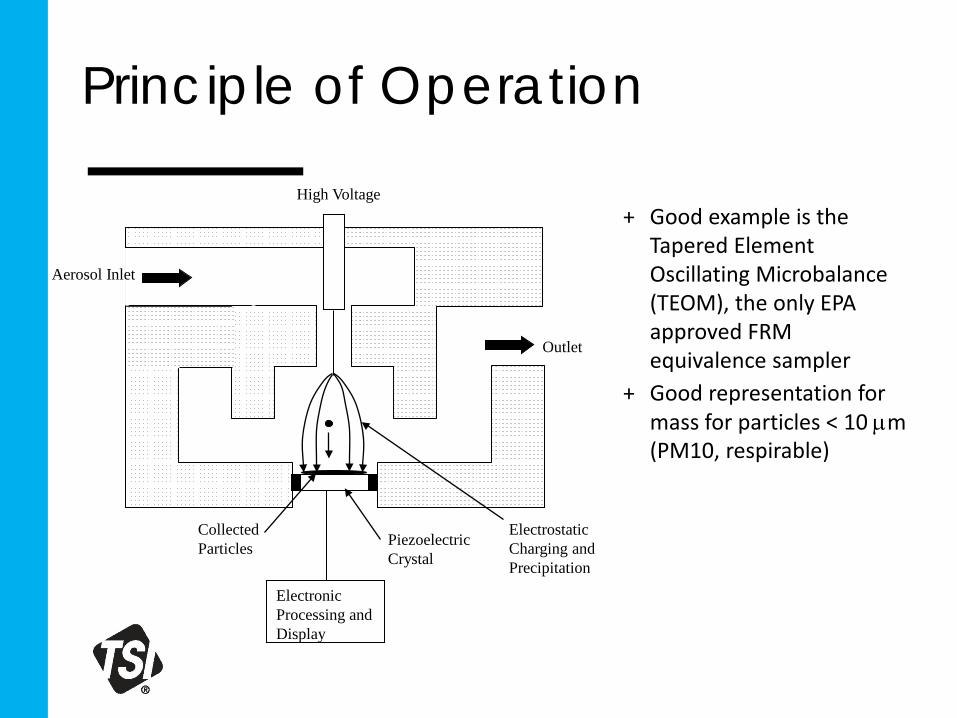
Principle of Operation
+ Good example is the Tapered Element Oscillating Microbalance (TEOM), the only EPA approved FRM equivalence sampler
+ Good representation for mass for particles < 10 µm (PM10, respirable)
Aerosol Inlet
High Voltage
Collected Particles Piezoelectric
Crystal
Outlet
Electrostatic Charging and Precipitation
Electronic Processing and Display
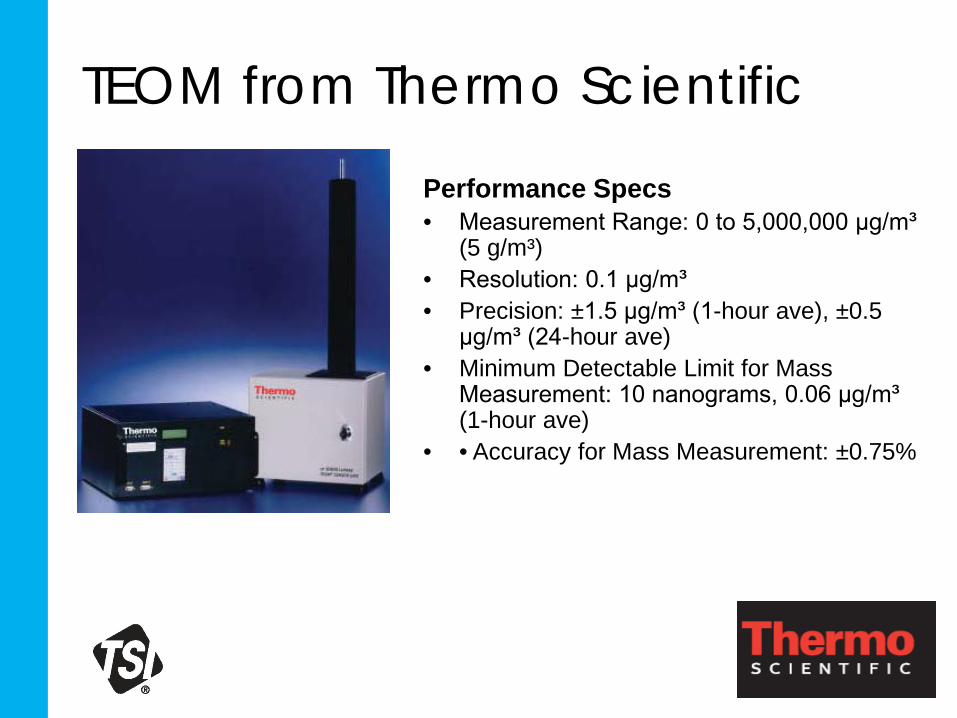
TEOM from Thermo Scientific
Performance Specs • Measurement Range: 0 to 5,000,000 μg/m³
(5 g/m³) • Resolution: 0.1 μg/m³ • Precision: ±1.5 μg/m³ (1-hour ave), ±0.5
μg/m³ (24-hour ave) • Minimum Detectable Limit for Mass
Measurement: 10 nanograms, 0.06 μg/m³ (1-hour ave)
• • Accuracy for Mass Measurement: ±0.75%

Advantages of QCM
+ Direct mass measurement + Response independent of particle size
distribution + FBAR (Film Bulk Acoustic Resonator) and SAW
(surface acoustic wave) sensors are getting very cheap
+ Future is in this technology + Tremendous potential in biological and trace
chemical detection + Lab-on-a-Chip is close to reality
Disadvantages of QCM
+ A reliable indicator of humidity. Response very sensitive to temperature and humidity
+ Linearity between mass deposited and change in resonant frequency lost rapidly with loading
+ Very erroneous for diesel exhaust and other combustion aerosols
+ Improper binding of particles to the crystal + Slow response time