direct testimony and schedules ross l. baumgarten before
TRANSCRIPT

Direct Testimony and Schedules Ross L. Baumgarten
Before the Minnesota Public Utilities Commission State of Minnesota
In the Matter of the Application of Northern States Power Company for Authority to Increase Rates for Electric Service in Minnesota
Docket No. E002/GR-20-723 Exhibit___(RLB-1)
Cost Assignment and Allocation Principles
November 2, 2020

i Docket No. E002/GR-20-723 Baumgarten Direct
Table of Contents
I. Introduction 1
II. Cost Assignment and Allocation 2
A. Cost Assignment and Allocation Framework 3
B. Xcel Energy Services Company Charges 11
C. Allocation Methods and Factors 14
1. General Allocator 16
2. Utility Allocations 25
D. Affiliate Transactions 27
E. Non-Regulated Business Activity Allocations 29
III. Conclusion 32
Schedules
Statement of Qualifications Schedule 1
Service Agreement (Fifth Amendment): XES and NSPM Schedule 2
NSPM’s Cost Assignment and Allocation Manual (CAAM) Schedule 3
XES Allocation Descriptions, Methods and NSPM Percentages Schedule 4
XES Allocation Descriptions, Methods and NSPM Percentages (using allocated FTE Hours)
Schedule 4(a)
XES Allocation Statistics Schedule 5
XES Allocation Statistics (using allocated FTE Hours) Schedule 5(a)
2020 NSPM FTE Hours vs. Number of Employees Schedule 5(b)
XES 2019 FERC Form 60 Schedule 6
Utility Allocation Factors Schedule 7
Administrative Services Agreements Charges Schedule 8
Non-Regulated Business Activity Significance Schedule 9
NSPM 2019 SEC Form 10-K Schedule 10
Non-Regulated Business Activity Allocation Factors Schedule 11
1 Docket No. E002/GR-20-723 Baumgarten Direct
I. INTRODUCTION 1
2
Q. PLEASE STATE YOUR NAME AND OCCUPATION. 3
A. My name is Ross L. Baumgarten. I am employed by Xcel Energy Services Inc. 4
(XES), the service company subsidiary of Xcel Energy, as Manager of Service 5
Company Accounting. 6
7
Q. PLEASE SUMMARIZE YOUR QUALIFICATIONS AND EXPERIENCE. 8
A. As Manager of Service Company Accounting, I am responsible for the general 9
administration of XES, including accounting, billing, allocations, policies and 10
procedures, service agreements, internal audits, external audits and external 11
reporting to state and federal regulatory agencies. A description of my 12
qualifications, duties, and responsibilities is set forth in Exhibit___(RLB-1), 13
Schedule 1. 14
15
Q. WHAT IS THE PURPOSE OF YOUR TESTIMONY? 16
A. In my testimony, I: 17
• Present the Cost Assignment and Allocation Manual (CAAM)18
demonstrating how our cost assignment and allocation methodologies19
and processes ensure that our costs to serve customers are assigned to20
the appropriate entities;21
• Outline the process for allocating XES charges;22
• Identify unique features of the General Allocator and certain other23
allocations for the Northern States Power Company–Minnesota (NSPM)24
jurisdiction, and the adjustment necessary to implement the required25
allocation factor (FTE Hours rather than Number of Employees) for26
interim rates;27

2 Docket No. E002/GR-20-723 Baumgarten Direct
• Request that the Company be permitted to dispense with the FTE Hours1
adjustment for final rates and future cases, as it is unique to Minnesota2
and does not provide a consistent allocation of associated costs across3
our jurisdictions;4
• Explain the Company’s process for allocating costs between its gas and5
electric utilities;6
• Discuss affiliate transactions between the Xcel Energy operating7
companies; and8
• Explain the process for allocating costs to our non-regulated business9
activities.10
11
Q. HOW IS YOUR TESTIMONY ORGANIZED? 12
A. I present the remainder of my testimony in the following sections: 13
• Section II explains our cost assignment and allocation principles and14
processes, and shows they conform to the principles and guidance15
adopted by the Commission.16
• Section III presents a summary of my testimony.17
18
II. COST ASSIGNMENT AND ALLOCATION19
20
Q. PLEASE SUMMARIZE THIS SECTION OF YOUR TESTIMONY. 21
A. In this section, I discuss the framework of our cost allocation and assignment 22
principles, including the Service Agreement between XES and NSPM, and the 23
NSPM CAAM. I then discuss the services provided by XES to NSPM, and 24
how the cost of those services is either directly assigned (direct charge) or 25
allocated (indirect charge) to the Company. I explain the allocation methods 26
used, and quantify the adjustment in this case that results from the use of Total 27

3 Docket No. E002/GR-20-723 Baumgarten Direct
Allocated Labor Hours With Overtime (FTE Hours) in Minnesota instead of 1
the Number of Employees in our General Allocator and certain other 2
allocations. Finally, I discuss how we handle transactions between Xcel Energy 3
operating company affiliates and NSPM’s non-regulated business activities. 4
5
A. Cost Assignment and Allocation Framework 6
Q. PLEASE SUMMARIZE THE COMPANY’S OVERALL PHILOSOPHY FOR RECORDING7
COSTS. 8
A. Our overall philosophy is to record costs for all products and services in a 9
consistent, equitable manner to ensure they are recovered from the customers 10
of the entity responsible for the costs incurred. This philosophy is designed to 11
reasonably apportion fully distributed costs to individual operating companies, 12
like NSPM, and to avoid cross-subsidization between the operating companies 13
and any non-regulated business activities. 14
15
Q. ARE THERE GUIDING PRINCIPLES RELATED TO THIS PHILOSOPHY THAT ARE16
APPLIED BY XCEL ENERGY? 17
A. Yes. To implement this philosophy, our cost assignment and allocation process 18
follows the guiding principles set forth in the Commission’s decision in Docket 19
No. E,G999/CI-90-1008. These principles are applied to both the regulated 20
utility services and non-regulated business activities across Xcel Energy. 21
NSPM’s hierarchical cost allocation principles are as follows: 22
1) Tariffed rates shall be used to value tariffed services provided.23
2) Costs shall be directly assigned to either regulated or non-regulated24
business activities whenever possible.25
3) Costs that cannot be directly assigned are common costs, which shall be26
grouped into homogeneous cost categories. Each cost category shall be27
4 Docket No. E002/GR-20-723 Baumgarten Direct
allocated based upon indirect cost causation. 1
4) When neither direct nor indirect measures of cost causation can be2
found, the cost category shall be allocated based upon a general allocator.3
4
Using this process ensures that all subsidiaries are charged for their appropriate 5
share of costs. Thus, our efforts to appropriately allocate and assign costs are 6
aligned with our customers’ expectations and interests that they pay for only 7
those costs that are part of the services they receive from the Company. 8
9
Q. PLEASE SUMMARIZE THE COMPANY’S APPROACH TO COST ASSIGNMENT AND10
ALLOCATION USING THESE PRINCIPLES. 11
A. In accordance with the Commission’s Order in Docket No. E,G002/CI-90-12
1008, the Company strives to direct charge or assign wherever possible. Direct 13
charges occur when a service being rendered is for the benefit of a specific legal 14
entity only. Allocated, or indirect, charges occur when services cannot be 15
directly assigned to a specific legal entity. 16
17
Q. WHAT IS THE BASIS OF THE ALLOCATED CHARGES? 18
A. We use allocation percentages or ratios to assign non-Company-specific costs. 19
These allocation percentages or ratios are calculated using allocation methods 20
and formulas based on allocation statistics reflecting Company operations, such 21
as the number of customers, dollar amount of revenues, dollar amount of plant 22
assets, megawatt-hours (MWh) of generation, and number of customer bills. I 23
discuss allocations further in Section II. C. below. 24
25
Q. HOW DOES THE COMPANY PUT THESE PRINCIPLES INTO PRACTICE? 26
A. We have a Service Agreement that describes the services provided by XES to 27

5 Docket No. E002/GR-20-723 Baumgarten Direct
NSPM (and the other operating companies and affiliates), as well as a CAAM 1
that identifies the methodologies used to ensure expenditures are appropriately 2
and consistently assigned or allocated: 3
• among utility operations within NSPM (natural gas and electric);4
• among jurisdictions within NSPM (Minnesota, North Dakota, and South5
Dakota); and6
• to the non-regulated business activities operated within NSPM.7
8
The CAAM also helps promote a greater understanding of the Company’s cost 9
assignment and allocation principles by providing detailed reference 10
information for both XES and NSPM personnel. 11
12
Q. ARE THESE DOCUMENTS SUBJECT TO COMMISSION APPROVAL? 13
A. Yes. In its November 20, 2014 Order in Docket No. E,G002/AI-14-234, the 14
Commission approved the Second Amendment to the Service Agreement with 15
certain modifications, and directed the Company to submit an annual filing for 16
review and approval of any proposed changes to its allocation methods. We 17
have subsequently submitted annual filings which have been approved or 18
acknowledged (where approval was not required) by the Commission – most 19
recently by Commission Order dated July 10, 2019 in Docket No. E,G002/AI-20
19-371. The Company filed a Fifth Amendment to the NSPM Service 21
Agreement with the Commission on May 29, 2020 (Docket No. E,G002/AI-22
20-514). Key updates included: 1) changes to recognize the realignment of Risk 23
services as a part of the Internal Audit area due to changes in our executive 24
structure; 2) addition of a definition for Total Assets Ratio including Xcel Energy 25
Inc.’s Per Book Assets; and 3) addition of a new allocation method for advanced 26
metering infrastructure costs. At the time of filing my Direct Testimony, a 27

6 Docket No. E002/GR-20-723 Baumgarten Direct
Commission decision on whether to approve that Amendment is still pending. 1
A copy of the pending Fifth Amendment to the NSPM Service Agreement is 2
provided as Exhibit___(RLB-1), Schedule 2. 3
4
The Company’s first CAAM was approved by the Commission as part of our 5
natural gas rate case in Docket No. G002/GR-04-1511. NSPM’s CAAM, 6
updated effective September 30, 2020, is provided as Exhibit___(RLB-1), 7
Schedule 3. However, the cost assignment and allocation principles applied by 8
NSPM are not new and have been applied in the development of the test year 9
cost of service in all of NSPM’s rate cases since Docket No. G002/GR-04-10
1511. 11
12
Q. DOES THE CAAM REFLECT COST ALLOCATION PRINCIPLES THAT HAVE BEEN13
ADOPTED BY THE COMMISSION?14
A. Yes. The principles reflected in the CAAM are based on the guiding principles 15
set forth in the Commission’s Order in Docket No. CI-90-1008. In our May 16
29, 2020 Petition seeking approval of the most recent amendments to the 17
Service Agreement, the Company re-affirmed its commitment to the cost 18
allocation principles established in Docket No. CI-90-1008, and described how 19
its cost allocation procedures implement and adhere to those principles. 20
21
Q. WHAT WAS THE PURPOSE AND FUNCTION OF THE MOST RECENT UPDATES TO22
THE CAAM? 23
A. The CAAM is updated annually, as well as on an ad-hoc basis, to ensure that 24
the included documentation and methodologies listed within the CAAM remain 25
current. There have been several updates to the CAAM since the Company’s 26
2016 test year rate case filing (Docket No. E002/GR-15-826). The changes 27

7 Docket No. E002/GR-20-723 Baumgarten Direct
between the version filed in 2015 and the current CAAM primarily relate to 1
updates of active legal entities in the Xcel Energy holding company structure 2
and minor text updates for additional clarity and consistency purposes. 3
4
Q. HOW IS THE CAAM USED IN THIS PROCEEDING? 5
A. The 2021 budgeted costs used by Company witness Mr. Benjamin C. Halama 6
to develop the 2021 test year revenue requirement were developed using the 7
principles contained in the current CAAM. Because the Company does not 8
forecast future allocation factors, those same principles in the current CAAM 9
were likewise utilized to develop 2022 and 2023 plan year revenue requirements. 10
11
Q. HAS THE COMPANY PROVIDED A LIST OF, AND DESCRIPTIONS FOR, THE VARIOUS12
ALLOCATION METHODS USED FOR THE TEST YEAR?13
A. Yes. A list of the allocation factors used by XES in its general ledger system for 14
each of our operating companies is provided in Exhibit___(RLB-1), Schedule 15
4. This schedule also includes a description of each method, by Allocating Cost16
Center (ACC), as well as the 2021 test year percentage allocated to NSPM. 17
Exhibit___(RLB-1), Schedule 5 presents a detailed description of the statistics 18
used to calculate the allocation percentages for these methods, as well as the 19
calculation of the NSPM allocation percentages by ACC. The detailed 20
descriptions of the calculation of the allocation ratios can be found in Appendix 21
A of the Service Agreement, included as Schedule 2. 22
23
Q. ARE THESE THE SAME ALLOCATION METHODS THAT ARE APPLIED IN OTHER24
JURISDICTIONS SERVED BY XCEL ENERGY UTILITY OPERATING COMPANIES? 25
A. Yes, with one exception. These allocation methods are the same allocation 26
methods that are in effect and approved in NSPM’s other operating 27

8 Docket No. E002/GR-20-723 Baumgarten Direct
jurisdictions (North Dakota and South Dakota), and in the operating 1
jurisdictions of the other Xcel Energy operating companies: Northern States 2
Power Company–Wisconsin (NSPW), Public Service Company of Colorado 3
(PSCo) and Southwestern Public Service Company (SPS). However, a change 4
to the General Allocator and certain other allocators used for the Minnesota 5
jurisdiction of NSPM was required by the Commission’s March 15, 2011 Order 6
in Docket No. E,G002/AI-10-690. I discuss the impact of using the General 7
Allocator and other allocators specific to Minnesota in Section II.C.1. below. 8
9
Q. HAVE THERE BEEN ANY CHANGES TO THE COMPANY’S ACCOUNTING AND10
ALLOCATION SYSTEMS SINCE THE COMPANY’S 2016 TEST YEAR RATE CASE11
(DOCKET NO. E002/GR-15-826)? 12
A. Yes. The Company implemented its new SAP General Ledger in January of 13
2016, and the Work and Asset Management system in phases in 2016 and 2017. 14
Because it has been several years since these systems were implemented, by the 15
time of this rate case filing the Company has made a number of other filings 16
with the Commission using SAP. 17
18
There were no changes in either the legal entities or functional organizations as 19
part of the implementation of the SAP General Ledger, nor any changes to 20
the calculation of allocation statistics. However, as with any new system, the 21
terminology and process steps may differ somewhat from one system to another. 22
Company witness Ms. Melissa L. Ostrom provides additional updates on the 23
SAP General Ledger in her Direct Testimony. 24

9 Docket No. E002/GR-20-723 Baumgarten Direct
Q. DID THE CONDITIONS ENCOUNTERED THIS YEAR AS A RESULT OF THE SARS1
CORONAVIRUS-2 (COVID-19) PUBLIC HEALTH EMERGENCY HAVE ANY IMPACT2
ON COST ALLOCATIONS? 3
A. No, it did not impact how the Company allocates costs. 4
5
Q. IS THE COST ASSIGNMENT AND ALLOCATION FRAMEWORK SUBJECT TO6
OVERSIGHT BY ANY OTHER REGULATORY AGENCIES? 7
A. Yes. The cost assignment and allocation framework utilized by XES is under 8
the oversight of the Federal Energy Regulatory Commission (FERC) through 9
periodic audits. 10
11
Q. HAS XES GONE THROUGH AN AUDIT BY THE FERC IN WHICH THE COST12
ASSIGNMENT AND ALLOCATION FRAMEWORK WAS REVIEWED? 13
A. Yes. XES underwent a FERC audit that covered the period of January 1, 2014 14
through December 31, 2018. The final audit report was issued on August 29, 15
2019, in FERC Docket No. FA17-4-000. 16
17
Q. WHAT WERE THE FINDINGS AS A RESULT OF THE FERC AUDIT THAT HAVE AN18
IMPACT ON THE TEST YEAR? 19
A. The FERC audit of XES identified two audit findings that impact costs assigned 20
to NSPM, including the 2021 test year. The first finding addressed the 21
allocation of capital software to the Company’s non-utility affiliates. The 22
second finding related to the cost allocation of XES income tax expense. There 23
were no other findings identified in the FERC audit report that impact the test 24
year. 25

10 Docket No. E002/GR-20-723 Baumgarten Direct
Q. PLEASE EXPLAIN THE FIRST FINDING IN MORE DETAIL. 1
A. Historically, capital costs related to software applications have been recorded to 2
the Operating Companies, the primary users of the applications. As other 3
affiliate companies receive indirect benefits of certain corporate software 4
applications, the FERC finding required a retrospective adjustment as well as a 5
prospective change in how software capital costs are recorded, ensuring that all 6
Operating Companies and affiliates that receive direct or indirect benefits 7
receive a portion of the capital charges. 8
9
Q. WHAT CHANGES WERE MADE TO ADDRESS THIS AUDIT FINDING? 10
A. The changes made to address this audit finding are discussed in the Direct 11
Testimony of Mr. Halama. 12
13
Q. PLEASE EXPLAIN THE SECOND FINDING FROM THE FERC AUDIT. 14
A. Historically, XES income tax expense was allocated to Operating Companies 15
which comprise the majority of XES activities that generate income tax expense. 16
FERC found that XES should have allocated income tax expense to all Xcel 17
Energy companies that benefited from XES’ activities that caused XES to incur 18
income tax expense. 19
20
Q. WHAT DID THE COMPANY DO TO ADDRESS THIS TAX EXPENSE-RELATED AUDIT21
FINDING? 22
A. Effective January 1, 2020, XES income tax expense is being allocated to all 23
Operating Companies and affiliates benefiting from XES’s activities that cause 24
XES to incur income tax expense. 25

11 Docket No. E002/GR-20-723 Baumgarten Direct
Q. HAS FERC ISSUED ANY VERIFICATION THAT THE COMPANY HAS ADEQUATELY1
ADDRESSED ITS AUDIT FINDINGS? 2
A. The Company made a filing with FERC on April 29, 2020 (Docket No. FA-17-3
4-001) which provided a refund report for the FERC formula rates after the 4
FERC audit. Additionally, the Company addressed all findings to FERC’s 5
satisfaction subsequent to the audit. 6
7
Q. ARE THERE ANY FURTHER ITEMS RELATED TO THE FERC AUDIT THAT HAVE8
IMPACTED THE 2021 TEST YEAR? 9
A. No. 10
11
B. Xcel Energy Services Company Charges 12
Q. PLEASE DESCRIBE THE SERVICES PROVIDED BY XES. 13
A. Consistent with the CAAM and the Service Agreement, XES cost assignment 14
and allocation processes apportion costs including: 15
• Operations and maintenance (O&M) costs of providing corporate16
services to XES affiliates, such as NSPM. These services typically include17
any managerial, financial, legal, engineering, marketing, auditing,18
statistical, advertising, publicity, tax, research or any other service,19
information or data, which is sold or furnished for a charge;20
• O&M costs for preliminary planning related to capital software projects21
that benefit more than one operating company or other affiliate;22
• Shared facilities O&M costs that are recorded in cost pools referred to in23
SAP as Allocating Cost Centers (ACCs). These costs may include24
(depending on the shared facility), administrative property services labor25
and non-labor costs, utility expenses, maintenance costs for structures26
and systems, a pro-rated share of property taxes (for owned buildings),27

12 Docket No. E002/GR-20-723 Baumgarten Direct
and rent and occupancy expenses (for leased buildings); and 1
• Fleet, Warehousing, and Purchasing O&M costs that are recorded to2
ACCs.3
4
Q. PLEASE PROVIDE AN OVERVIEW OF THE METHODS XES USES TO ASSIGN AND5
ALLOCATE COSTS TO THE COMPANY. 6
A. XES direct assigns costs when the specific operating company or affiliate (or the 7
specific department or business area within the operating company or affiliate) 8
that should be billed can be identified. For example, the XES Controller’s 9
organization can charge NSPM for the work that has been performed to prepare 10
a regulatory filing in Minnesota. Another example is an XES engineer direct 11
charging labor costs related to an electric distribution project directly to the 12
Electric Distribution business area under the Minnesota Electric Jurisdiction. 13
Direct charge internal orders are used to track and directly charge a specific 14
affiliate as well as a specific jurisdiction and/or business area within that affiliate. 15
16
XES allocates costs when a service provided by XES employees cannot be 17
directly assigned to one affiliate. A description of the XES allocation 18
methodology for each service is provided in the Allocation Ratios section of 19
Appendix A of the Service Agreement. To allocate costs that cannot be directly 20
assigned, XES first identifies homogeneous cost pools known as ACC’s that 21
have the same cost driver and then selects the allocation method that has the 22
most cost-causative relationship to the cost driver to allocate the charges within 23
the ACC. Indirect charge internal orders are used to track and assign costs that 24
cannot be directly assigned to the appropriate ACC. For example, the Risk 25
Management department negotiates the corporate umbrella insurance policies 26
that benefit every operating affiliate. Therefore, the costs incurred by Risk 27

13 Docket No. E002/GR-20-723 Baumgarten Direct
Management to negotiate the policies would be considered indirect charges and 1
are allocated proportionally to every operating affiliate. 2
3
Q. WHAT DOES XES DO TO ENSURE THAT XES COSTS ARE RECORDED, ASSIGNED,4
AND ALLOCATED CORRECTLY? 5
A. XES takes the following steps to ensure its costs are correctly recorded, 6
assigned, and allocated: 7
• Makes the policies and procedures regarding the recording of costs8
available on the Xcel Energy internal web site for access by all Xcel9
Energy personnel;10
• Provides mandatory training, delivered through a combination of11
classroom, online/computer-based and individual/one-on-one trainings;12
• Conducts regular reviews of any allocations by Finance and Accounting13
department personnel; and14
• Conducts internal audits of XES policies and procedures and their15
application.16
17
The Company also monitors the accuracy of XES charges through formal and 18
informal review processes, including business area reviews with the operating 19
company Presidents. 20
21
Q. DOES XES REPORT ITS CHARGES TO THE XCEL ENERGY OPERATING22
COMPANIES AND AFFILIATES?23
A. Yes. XES files a FERC Form 60 report on an annual basis. This report shows 24
XES billings to the Xcel Energy operating companies and affiliates, including a 25
list of approved allocation methods. A copy of the 2019 XES FERC Form 60 26
is provided as Exhibit___(RLB-1), Schedule 6. 27

14 Docket No. E002/GR-20-723 Baumgarten Direct
C. Allocation Methods and Factors 1
Q. IN GENERAL, WHAT ARE THE ALLOCATION METHODS USED TO ASSIGN COSTS TO2
AND WITHIN THE COMPANY? 3
A. There are two primary allocation methods: the General Allocator and other 4
Service Company cost allocators and Utility Allocations. I will discuss each of 5
these allocation methods in this section of my testimony. 6
7
Q. WHAT IS THE BASIS OF THESE ALLOCATION METHODS? 8
A. Each allocation method relies on underlying entity statistics relevant to the types 9
of charges that need to be allocated to an Xcel Energy operating company, 10
affiliate, or business area within an operating company. In this way, the 11
Company seeks to align its cost allocation methods with a reasonable 12
representation of cost causation. 13
14
Q. HOW OFTEN ARE THE OPERATING COMPANY AND AFFILIATE STATISTICS USED15
IN THE XES ALLOCATION FACTORS UPDATED? 16
A. The XES allocation ratios and allocation factors are recalculated annually 17
effective for April business based on the prior calendar-year statistics.1 XES 18
will also update the statistics used in the allocation ratios and allocation factors 19
when there is a significant change, such as the addition or deletion of an 20
operating company or affiliate, if material. 21
22
Q. ARE THE ALLOCATION METHODS CONSISTENT ACROSS ALL XCEL ENERGY23
OPERATING COMPANIES? 24
A. No. As I mentioned previously, in Docket No. E,G002/AI-10-690, the 25
1 XES annually updates four allocation statistics and allocation percentages related to the Joint Operating Agreement and trading activities starting with January business. The statistics are based on the prior calendar year.

15 Docket No. E002/GR-20-723 Baumgarten Direct
Commission required that NSPM use a unique allocation method for its 1
General Allocator and certain other allocators. Specifically, instead of using 2
Number of Employees, like we do in other jurisdictions, we use FTE Hours in 3
allocating certain costs to the Minnesota jurisdiction. A list of the allocation 4
factors for XES based on FTE Hours is provided in Exhibit___(RLB-1), 5
Schedule 4(a). As I describe in more detail below, the Company is proposing 6
to discontinue this cumbersome adjustment, unique to NSPM, for purposes of 7
final rates in this proceeding and for future filings. 8
9
Q. HAVE THERE BEEN ANY CHANGES IN THE COMPANY’S USE OF ALLOCATIONS10
SINCE THE COMPANY’S 2016 TEST YEAR RATE CASE (DOCKET NO. E002/GR-11
15-826)? 12
A. Yes. The Company previously utilized an “Allocating Workorders” method, by 13
which the Company used specific workorders to assign certain types of Business 14
Systems-related costs to various functional areas in the operating companies 15
under the prior JDE General Ledger. With the switch to the SAP General 16
Ledger, and as individual projects wrapped or moved to direct charging, 17
Allocating Workorders were phased out and are no longer utilized. 18
19
Q. WHAT DEGREE OF PRECISION DOES THE COMPANY ACHIEVE FOR ITS20
ALLOCATORS? 21
A. The Company has incorporated the use of four decimal places in the 22
development of the relevant allocators since the Commission’s order in Docket 23
No. E,G002/AI-10-690. We have likewise calculated the allocators in this case 24
using four decimal places. We continue to believe that this provides a 25
reasonable degree of precision. 26

16 Docket No. E002/GR-20-723 Baumgarten Direct
1. General Allocator1
Q. PLEASE DESCRIBE THE GENERAL ALLOCATOR. 2
A. The General Allocator is used to allocate common costs when neither direct 3
nor indirect measures of cost causation can be found to operating companies 4
and/or affiliates. The calculation used in all jurisdictions other than Minnesota 5
is comprised of three equally weighted factors: assets, revenues, and Number of 6
Employees. However, in Minnesota this allocator currently uses FTE Hours 7
instead of Number of Employees. 8
9
Q. WHY IS FTE HOURS USED IN PLACE OF NUMBER OF EMPLOYEES IN10
MINNESOTA? 11
A. In a March 2011 Order in Docket No. E,G002/AI-10-690,2 the Commission 12
required the Company to use the FTE Hours in place of Number of Employees. 13
Since that time, in each rate case, the Company has made an adjustment to its 14
allocation methods to reflect the FTE Hours allocation method rather than 15
Number of Employees. 16
17
Q. PLEASE DISCUSS THE FTE HOURS COMPONENT OF THE GENERAL ALLOCATOR18
IN MORE DETAIL. 19
A. The FTE Hours component of the three-factor formula that makes up the 20
General Allocator is calculated as a percentage of the total direct and allocated 21
labor hours for NSPM relative to the total direct and allocated labor hours for 22
all the affiliates receiving allocations through the General Allocator. It is 23
averaged together with total assets and total revenues, the other two allocation 24
2 In the Matter of Northern States Power Company’s Cost Allocation Procedures and General Allocator, Docket No. E,G002/AI-10-690, ORDER REQUIRING CHANGE IN GENERAL ALLOCATOR AND REQUIRING FILINGS (March 15, 2011); ERRATUM NOTICE (March 25, 2011).

17 Docket No. E002/GR-20-723 Baumgarten Direct
factors that make-up the General Allocator. In contrast, all other Xcel Energy 1
operating companies use Number of Employees, rather than FTE Hours, as 2
part of the three-factor formula that makes up the General Allocator. 3
4
Q. IS THE GENERAL ALLOCATOR THE ONLY ALLOCATION METHOD IN WHICH5
NUMBER OF EMPLOYEES WAS REPLACED WITH FTE HOURS TO ALLOCATE6
COSTS TO THE MINNESOTA ELECTRIC JURISDICTION? 7
A. No. FTE Hours is also included in other allocation methods besides the 8
General Allocator, as noted in Exhibit___(RLB-1), Schedule 5(a). The greatest 9
impact, however, is to the General Allocator. 10
11
Q. IF ALLOCATIONS TO THE MINNESOTA JURISDICTION ARE DIFFERENT THAN FOR12
OTHER OPERATING COMPANIES AND NSPM JURISDICTIONS, DOES THE13
COMPANY HAVE TO MANUALLY CALCULATE THE ADJUSTMENT NECESSARY FOR14
THIS CASE? 15
A. Yes. Our systems only allow us to use a single allocation calculation for each 16
allocation method. Because Minnesota is the exception, our systems are set up 17
to allocate costs using Number of Employees rather than FTE Hours. 18
Therefore, it is necessary that we manually make an adjustment to the costs 19
allocated to the Minnesota Electric and Gas Jurisdiction for purposes of this 20
rate case. 21
22
Q. WHAT IS THE COMPANY PROPOSING IN THIS PROCEEDING? 23
A. For final rates in this proceeding, the Company is proposing to discontinue 24
using a unique component in the General Allocator for the FTE Hours just for 25
the Minnesota Electric and Gas Jurisdiction. As I discuss in more detail below, 26
the requirement to use a different allocator in Minnesota makes our allocations 27

18 Docket No. E002/GR-20-723 Baumgarten Direct
inconsistent across jurisdictions and does not provide greater accuracy than 1
allocations based on number of employees. All other jurisdictions we serve use 2
allocations based on number of employees for purposes of setting rates. While 3
both methods utilize prior year statistics in setting current year allocations, an 4
allocation based on the number of employees is less subject to substantial 5
fluctuations. 6
7
Q. HAS THE COMMISSION DISCUSSED THE USE OF THE FTE HOURS COMPONENT8
OF THE GENERAL ALLOCATOR IN ANY ORDERS SINCE THE COMPANY’S 20169
TEST YEAR RATE CASE (DOCKET NO. E002/GR-15-826)? 10
A. Yes. In particular, in Docket No. E002/AI-17-577, the Commission approved 11
the Administrative Services Agreement between XES and Nicollet Projects I, 12
LLC “with the understanding that any difference between the employee ratio 13
and allocated labor hours with overtime allocation methods will be adjusted in 14
future rate-recovery proceedings, in which Xcel will have the burden to show 15
that all cost allocations are consistent with past Commission orders.”3 The 16
Commission did not, however, as part of that order, evaluate the underlying 17
assumptions or mechanics related to the use of this unique component of the 18
Company’s General Allocator for Minnesota. Rather, the Commission’s Order 19
refers to the Department’s comments regarding the continuing applicability of 20
the March 2011 Order. 21
22
Q. WHY IS THE COMPANY PROPOSING TO DISCONTINUE THIS COMPONENT IN THE23
GENERAL ALLOCATOR? 24
A. Because Minnesota is alone among the jurisdictions Xcel Energy serves in 25
3 In the Matter of Xcel Energy’s Petition for Approval of Affiliated Interest Agreements, Docket No. E002/AI-17-577, ORDER APPROVING AFFILIATED INTEREST AGREEMENTS at 7 (June 12, 2018).

19 Docket No. E002/GR-20-723 Baumgarten Direct
requiring use of FTE Hours rather than Number of Employees, a unique 1
adjustment must be developed each time the Company makes a filing using the 2
General Allocator and certain other allocators. Further, the misalignment 3
between Number of Employees and FTE Hours sometimes results in a 4
reduction and sometimes results in an increase in the allocations to the 5
Minnesota operating company, depending on the circumstances at the time of 6
calculation. Finally, the Number of Employees allocation is accepted as a 7
reasonable allocation basis in the other jurisdictions we serve, and discontinuing 8
the calculation would make all jurisdictions consistent while reducing the use of 9
resources for this one allocation method. 10
11
Q. WHY DOES THE COMPANY FEEL THAT THE EMPLOYEE RATIO IS A REASONABLE12
AND APPROPRIATE METHOD TO ALLOCATE COMPANY COSTS? 13
A. The Employee Ratio based on the number of employees by operating company 14
with common officers assigned to Xcel Energy Inc. reasonably apportions fully 15
distributed costs as it provides for a baseline need of support provided to each 16
operating company by the Service Company. Headcount provides for a 17
consistent and stable metric driven by staffing levels to support current 18
operating company needs as well as near-term needs. FTE Hours ratio 19
represents labor hours charged for a historical period that represents specific 20
activities of that period which can result in a variable statistic driven by project-21
based work that can vary from period to period. The use of number of 22
employees provides for a more stable statistic that represents current and future 23
staffing needs, as Xcel Energy does not have a practice of hiring employees to 24
fill short-term need and then lay off the employees once the project is complete. 25
Instead, Company employees are strategically deployed to support projects on 26
an as-needed basis to maximize value for our ratepayers and for the Company. 27

20 Docket No. E002/GR-20-723 Baumgarten Direct
Additionally, in performing the calculation for the FTE Hours adjustment, 1
hours charged to allocators that utilize the number of employee’s ratio are 2
excluded to not skew the FTE Hours results. Excluding labor hours that are 3
allocated by ratios utilizing Number of Employees results in the elimination of 4
18.3 percent of total Service Company labor hours, which includes a significant 5
portion of hours charged by administrative functions including Human 6
Resources, Accounting and Finance, Legal, and Business Systems. As a result 7
of excluding these hours, the FTE Hours calculation does not provide for an 8
accurate reflection of the level of support provided to each operating company 9
by the Service Company. 10
11
Q. HOW DOES THE COMPANY ENSURE THAT NONREGULATED COMPANIES12
RECEIVE A REASONABLE APPORTIONMENT OF ALLOCATED COSTS? 13
A. The General Allocator uses the Employee ratio with number of common 14
officers assigned to Xcel Energy Inc. Assigning common officers to Xcel 15
Energy Inc. ensures that nonregulated companies receive a reasonable 16
apportionment of allocated costs. The Employee ratio with number of 17
common officers assigned to Xcel Energy Inc. as of December 31, 2019 18
included 14 common officers, or 0.1786 percent of total headcount. FTE 19
Hours as calculated for the same period produced 9,977 FTE Hours charged to 20
nonregulated companies, which represents 0.0458 percent of total FTE Hours. 21
The Employee ratio with number of common officers assigned to Xcel Energy 22
Inc. provides for a larger allocation of costs to Xcel Energy’s nonregulated 23
companies than under the FTE Hours method, supporting that a reasonable 24
apportionment of allocated costs would be assigned to nonregulated entities 25
under the Employee ratio with number of common officers assigned to Xcel 26
Energy Inc. method. 27

21 Docket No. E002/GR-20-723 Baumgarten Direct
Q. DID THE COMPANY NONETHELESS CALCULATE THE FTE HOURS ADJUSTMENT1
FOR PURPOSES OF THIS CASE? 2
A. Yes. Consistent with the Commission’s prior orders, including Order Point 3 3
in the Commission’s June 12, 2018 Order in Docket No. E002/AI-17-577,4 for 4
interim rates the Company utilized the FTE Hours adjustment in light of the 5
existing Commission Order. This adjustment is discussed in the Company’s 6
Interim Rate Petition and supporting schedules. Additionally, the Company is 7
providing the allocation percentages resulting in that adjustment in my Direct 8
Testimony and Exhibit___(RLB-1), Schedules 5(a) and 5(b). 9
10
Schedule 5(a) shows the number of direct and allocated labor hours used to 11
calculate the allocation ratios for the 2021 test year. 12
13
Schedule 5(b) shows the calculation of the adjustments to the 2021 test year (for 14
NSPM Total Company), applying the difference between the Number of 15
Employees factor and the FTE Hours factor included in Minnesota’s General 16
Allocator, as well as the other affected ACC allocators. 17
18
Q. PLEASE COMPARE THE FTE HOURS ADJUSTMENT FOR THE 2016 TEST YEAR IN19
THAT RATE CASE AND THE 2021 TEST YEAR IN THIS CASE. 20
A. In our 2016 test year rate case (Docket No. E002/GR-15-826), the FTE Hours 21
adjustment for the 2016 test year was a reduction of $1,474,671 to the cost of 22
service for the Minnesota Electric Jurisdiction. The 2021 test year FTE Hours 23
adjustment would be a reduction to the cost of service of $4,526,699 for the 24
Minnesota Electric Jurisdiction, while the 2022 FTE Hours adjustment would 25
4 “The ASA between XES and Nicollet Projects will be subject to future review in rate recovery proceedings where Xcel will demonstrate that all cost allocations are consistent with past Commission orders.”

22 Docket No. E002/GR-20-723 Baumgarten Direct
be a reduction of $4,576,366. The derivation of these FTE Hours adjustments 1
is set forth in Volume 4, Test Year Workpapers, Interim Adjustment ADJ 7. 2
3
Q. WHY IS THE FTE HOURS ADJUSTMENT FOR THE 2021 TEST YEAR GREATER4
THAN THE ADJUSTMENT IN THE 2016 TEST YEAR? 5
A. The FTE Hours adjustment is influenced by numerous factors which include 6
changes in operating company headcount, direct and indirect hours charged by 7
Service Company employees, and the amount of Service Company costs 8
allocated through ratios utilizing the FTE Hours statistic. The change in the 9
FTE Hours adjustment from the 2016 test year to the 2021 test year results 10
substantially from the fact that the number of NSPM employees decreased from 11
2014 (the last full year prior to our 2015 rate case filing with a 2016 test year) to 12
2019 (the last full year prior to this rate case filing) at a higher rate than the other 13
operating companies, as well as Xcel Energy as a whole, with increased 14
headcount on XES. The increased headcount on XES is primarily due to 15
transfers of employees from the operating companies to facilitate operating 16
company-specific employees working across entities as demand necessitates. 17
This change results in a greater deviation between the FTE Hours allocation 18
percentage and the Number of Employees allocation percentage for this case, 19
and thus a larger adjustment in the 2021 test year compared to 2016. Table 1 20
below provides a comparative summary of the direct FTE Hours calculation by 21
business area as well as indirect FTE Hours from XES for the 2016 and 2021 22
test years. 23

23 Docket No. E002/GR-20-723 Baumgarten Direct
1
2
3
4
5
6
7
8
9
10
11
12
13
14
15
16
17
18
19
Table 1 shows primary decreases in labor hours in the Nuclear Generation, 20
Energy Supply, and Transmission business areas, and a primary increase in Gas 21
Systems. The various reasons behind these business area changes in hours are 22
discussed in the Direct Testimony of Company witnesses Ms. Kimberly A. 23
Randolph and Mr. Peter A. Gardner. 24
25
As shown in Table 1, there is an overall decrease in total FTE hours in the 2021 26
test year compared to 2016. 27
Table 1
FTE Hours by Business Area for the 2016 and 2021 Test Years
(Based on 2014 and 2019 Actual NSPM (Total Company) Results) 2016 Test Year (2014 Actuals)
2021 Test Year (2019 Actuals)
Overtime Hours
Regular Hours
Overtime Hours
Regular Hours
Net Change in Hours
Business Area Chief Executive Officer - 124 - - (124) Corporate Services 3 26,886 2 17,246 (9,641) Distribution Operations 289,138 1,966,747 404,696 1,928,807 77,618 Energy Supply 316,953 1,813,137 200,814 1,395,117 (534,159) Financial Operations 102 101,174 6 97,743 (3,527) Gas Systems 16,807 238,053 56,782 370,043 171,965 General Counsel 86 38,801 6 32,028 (6,853) Nuclear Generation 394,692 2,731,238 213,142 2,054,163 (858,625) Transmission 199,087 949,437 119,552 674,893 (354,079) Utilities & Operations Services 40,863 1,099,850 36,525 1,237,123 132,935
Direct Hours 1,257,731 8,965,447 1,031,525 7,807,163 (1,384,490) Indirect Hours 21,933 882,348 19,302 855,762 (29,217)
Total Hours * 1,279,664 9,847,795 1,050,827 8,662,925 (1,413,707)
* Amounts may not total due to rounding.

24 Docket No. E002/GR-20-723 Baumgarten Direct
Q. HOW DOES THE DECREASE IN TOTAL FTE HOURS IN 2021 COMPARED TO 20161
RESULT IN A GREATER REDUCTION TO THE COST OF SERVICE FOR THE 2021 TEST2
YEAR COMPARED TO 2016? 3
A. To understand how this decrease in total FTE hours is consistent with a greater 4
FTE hours reduction to the cost of service, it is necessary to consider how the 5
FTE hours allocation percentage has changed as compared to the Number of 6
Employees allocation percentage. Table 2 provides a comparative summary of 7
the allocation percentages for the 2016 and 2021 test years. 8
9
10
11
12
13
14
15
16
17
18
19
The greater deviation between the Number of Employees and FTE Hours 20
allocation percentages in the 2021 test year compared to the 2016 test year is 21
largely due to a greater reduction in the number of NSPM employees compared 22
to the other operating companies, which drives a decrease in direct labor hours 23
charged to NSPM. Specifically, the total number of operating company 24
employees decreased by 1,434 with NSPM employees decreasing by 841, 25
representing 59 percent of the total decrease. 26
Table 2
Allocation Percentage Comparison for the 2016 and 2021 Test Years
(Based on 2014 and 2019 Actual Hours and Headcount for
NSPM (Total Company)) 2016 Test Year (2014 Actuals)
2021 Test Year (2019 Actuals)
NSPM All
OpCos NSPM
Percentage NSPM All
OpCos NSPM
Percentage FTE Labor Hours 11,127,459 22,940,934 48.5048% 9,713,752 21,797,888 44.5628% Number of Employees 4,661 9,259 50.3402% 3,820 7,825 48.8179%
Variance (1.8354%) (4.2551%)

25 Docket No. E002/GR-20-723 Baumgarten Direct
As a result, the difference between the two allocation method percentages 1
increased by 2.4197 percent from the 2016 test year to the 2021 test year. This 2
increase is responsible for approximately $2.0 million of the increase in the FTE 3
Hours adjustment to the 2021 test year compared to the 2016 test year with the 4
remaining increase primarily due to an increase in allocated costs. 5
6
Q. DO YOU EXPECT CHANGES IN FTE HOURS IN THE FUTURE? 7
A. Yes. If the FTE Hours adjustment were to continue to be utilized, we would 8
continue to expect changes in FTE Hours each year based on operational needs 9
and specific events in a given year. Overtime hours can change significantly 10
from year to year based on the timing of major overhauls and/or outages at the 11
generating plants, as well as overtime related to major storm events. While the 12
number of employees is also subject to change, the Company already develops 13
its General Allocator on the basis of this factor (along with total assets and total 14
revenues) for its other jurisdictions. Therefore, it would be much more 15
straightforward and more consistent to utilize the same calculations across all 16
jurisdictions. 17
18
2. Utility Allocations19
Q. WHAT IS THE PURPOSE OF COMMON UTILITY ALLOCATIONS? 20
A. Utility O&M allocations are developed to allocate NSPM common (electric and 21
natural gas) utility Administrative and General (A&G) costs charged to FERC 22
accounts 920 through 935 to the electric and natural gas utilities. They are also 23
used to allocate NSPM common (electric and natural gas) utility customer 24
accounting, customer information, and sales costs charged to FERC accounts 25
901 through 917 to the electric and natural gas utilities. 26

26 Docket No. E002/GR-20-723 Baumgarten Direct
Q. WHAT METHOD IS USED TO ALLOCATE NSPM (TOTAL COMPANY)’S COMMON1
CUSTOMER-RELATED UTILITY COSTS BETWEEN THE ELECTRIC AND NATURAL2
GAS UTILITIES?3
A. The method used to allocate common customer-related utility costs between 4
electric and natural gas utilities is the number of customer bills. The method 5
used to allocate the commodity portion of the bad debt between electric and 6
natural gas utilities is associated revenues. 7
8
Q. IS THE METHOD USED TO ALLOCATE NSPM (TOTAL COMPANY)’S COMMON9
A&G-RELATED UTILITY COSTS BETWEEN THE ELECTRIC AND NATURAL GAS10
UTILITIES THE SAME AS WAS USED IN NSPM’S LAST ELECTRIC AND GAS RATE11
CASES? 12
A. Yes. In the 2021 budget, A&G-related FERC accounts 925 and 926 were 13
allocated to the Minnesota electric and natural gas utilities based on labor. 14
However, all other common A&G costs were allocated to the electric and 15
natural gas utilities based on a weighted three-factor formula comprised of 16
revenue, utility plant-in-service, and supervised O&M. (Supervised O&M refers 17
to operations and maintenance costs which are included in FERC account 500 18
through FERC account 917). The three-factor formula measures three distinct 19
aspects of the Company’s operations and results in an appropriate assignment 20
of costs to the electric and natural gas utilities. This is consistent with NSPM’s 21
hierarchical cost allocation principles described earlier in my testimony. Step 4 22
of these principles specifically addresses the use of the General Allocator when 23
no cost causative link exists. 24

27 Docket No. E002/GR-20-723 Baumgarten Direct
Q. HAVE THE 2021 TEST YEAR O&M AND RATE BASE UTILITY ALLOCATION 1
METHODOLOGIES AND ALLOCATION FACTORS BEEN PROVIDED IN YOUR 2
TESTIMONY? 3
A. Yes. The 2021 test year O&M Utility Allocation methodology is explained in 4
Section VI of the CAAM, provided as Schedule 3, and the 2021 test year Utility 5
Allocation factors are further detailed in Exhibit___(RLB-1), Schedule 7. The 6
2020 test year utility rate base allocation methodology is explained in Section VI 7
of the CAAM, and the 2021 test year utility rate base allocation factors are 8
detailed in Mr. Halama’s Direct Testimony. 9
10
D. Affiliate Transactions 11
Q. PLEASE EXPLAIN THE BENEFITS THAT SHARED O&M SERVICES BETWEEN12
NSPM (TOTAL COMPANY) AND THE AFFILIATED UTILITY OPERATING13
COMPANIES PROVIDE TO MINNESOTA ELECTRIC CUSTOMERS. 14
A. The provision of services by NSPM (Total Company) to other legal entities 15
reduces overhead costs related to those services, which further reduces the 16
amount of cost recovered from our customers. In addition, NSPM (Total 17
Company) receives services from other operating companies at cost, which 18
eliminates the need for NSPM (Total Company) itself to develop those services 19
and incur the related overhead costs. 20
21
Q. WHAT TYPES OF O&M CHARGES BETWEEN NSPM (TOTAL COMPANY) AND22
OTHER AFFILIATED UTILITY OPERATING COMPANIES ARE INCLUDED IN THE 23
2021 TEST YEAR BUDGET? 24
A. The allocated O&M charges between NSPM (Total Company) and other Xcel 25
Energy regulated operating companies in the 2021 test year are limited to small 26
amounts of facilities costs and related labor overhead costs, which are discussed 27

28 Docket No. E002/GR-20-723 Baumgarten Direct
in Section V of the CAAM. Exhibit___(RLB-1), Schedule 8 provides a 1
description and the dollar amounts of the charges between NSPM (Total 2
Company) and NSPW (Total Company), PSCo, and SPS. For the 2021 test 3
year, estimated charges from NSPM (Total Company) to NSPW (Total 4
Company) total $0.01 million, and charges from NSPW (Total Company) to 5
NSPM (Total Company) total $0.03 million. All test year charges between 6
NSPM (Total Company) and either SPS and PSCo total less than $0.01 million, 7
as illustrated in Schedule 8. 8
9
Q. ARE THERE ANY OTHER AFFILIATED INTEREST TRANSACTIONS THAT ARE10
RELEVANT TO THIS CASE? 11
A. Yes. I would like to provide additional information related to cost allocations 12
for the Mankato Energy Center transactions (Docket No. E002/AI-19-622) and 13
the Company’s recent amended agreement with Liberty Paper, Inc. (Docket No. 14
E002/M-19-663). 15
16
Q. CAN YOU PROVIDE AN UPDATE RELATED TO THE MANKATO ENERGY CENTER17
TRANSACTIONS (DOCKET NO. E002/AI-19-622)? 18
A. Yes. With the Commission’s decision in Docket Nos. E002/PA-18-702 and 19
E002/GS-15-620, the Company formed a new subsidiary through which it 20
purchased the Mankato Energy Center entities as a non-rate-regulated 21
investment under the existing power purchase agreements and filed the 22
affiliated interest petition with the Commission in Docket No. E002/AI-19-23
622. In its February 7, 2020 Order in the affiliated interest petition docket, the 24
Commission directed the Company to account for allocations in the test year 25
associated with the Company’s ownership of the Mankato Energy Center 26
facilities. 27
29 Docket No. E002/GR-20-723 Baumgarten Direct
In July 2020, the Mankato Energy Center entities were sold to SWGMN 1
Holdings, LLC, a subsidiary wholly owned by Southwest Generation Operating 2
Company, LLC, which also acquired the generator interest in the Company’s 3
existing PPAs. As a result of this sale, there are no costs associated with the 4
Mankato Energy Center facilities to be allocated in the 2021 test year. 5
Additionally, the core terms of the Company’s PPA are not expected to change, 6
and we do not anticipate material changes to amounts allocated to the 7
Minnesota Electric Jurisdiction for the 2021 test year. However, we will provide 8
any updates that may be needed during the course of the proceeding. 9
10
Q. HOW DOES THE LIBERTY PAPER, INC. AMENDED AGREEMENT RELATE TO COST11
ALLOCATIONS IN THIS PROCEEDING? 12
A. When the Commission approved the amended agreement with Liberty Paper, 13
Inc., in its February 21, 2020 Order in Docket No. E002/M-19-663, the 14
Commission included a requirement that, for the duration of steam sales to 15
Liberty Paper, Inc., the Company must demonstrate the reasonableness of the 16
Company’s proposed cost allocations related to the steam sales. The allocation 17
of costs to Liberty Paper, Inc. and the reasonableness of those costs, are 18
discussed in Section III of NSPM’s CAAM, provided as Schedule 3. 19
20
E. Non-Regulated Business Activity Allocations 21
Q. PLEASE IDENTIFY NSPM’S NON-REGULATED BUSINESS ACTIVITIES. 22
A. The Company’s non-regulated business activities include the following, which 23
are further described in Section III of NSPM’s CAAM: 24
• HomeSmart (in-home appliance protection services);25
• ConnectSmart (mover connection services);26
• Customer Owned Street Lighting Maintenance (maintenance services to27

30 Docket No. E002/GR-20-723 Baumgarten Direct
communities for street light systems); 1
• Sherco Steam Sales to Liberty Paper Inc. (steam supplied to meet thermal2
needs); and3
• InfoWise GX Meter (an energy management tool to help businesses4
manage energy usage).5
6
Q. WHAT IS THE AMOUNT OF NSPM (TOTAL COMPANY)’S NON-REGULATED7
BUSINESS ACTIVITIES? 8
A. NSPM (Total Company)’s non-regulated business activities account for 9
approximately 0.66 percent of NSPM (Total Company)’s total 2019 actual 10
revenues and 0.01 percent of NSPM (Total Company)’s 2019 actual operating 11
expenses (excluding purchased fuel, power and gas expenses). 12
Exhibit___(RLB-1), Schedule 9 provides the supporting calculations. The 2019 13
Securities and Exchange Commission (SEC) Form 10-K for NSPM, provided 14
as Exhibit___(RLB-1), Schedule 10, is the source of the statistics used in these 15
calculations, and the applicable pages are referenced in the footnotes of 16
Schedule 9. 17
18
Q. ARE ALLOCATIONS MADE TO NSPM (TOTAL COMPANY)’S NON-REGULATED19
BUSINESS ACTIVITY? 20
A. Yes. Non-regulated business activity allocations ensure that: 1) the costs for 21
services provided to NSPM (Total Company)’s non-regulated business activities 22
are billed representing a fully-distributed cost; and 2) gas and electric utility 23
operations are not subsidizing non-regulated business activities. In addition, 24
NSPM (Total Company) allocates a portion of its corporate costs using the 25
labor-related overhead and the corporate residual allocation presented in 26
Exhibit___(RLB-1), Schedule 11. All allocations made to or by NSPM (Total 27

31 Docket No. E002/GR-20-723 Baumgarten Direct
Company) as a result of these activities related to affiliated interest agreements 1
are reasonable and have not resulted in any customer subsidization of non-2
regulated activities of affiliated companies. 3
4
Q. HAVE THE TEST YEAR NON-REGULATED BUSINESS ACTIVITY ALLOCATION5
METHODOLOGY AND ALLOCATION FACTORS BEEN PROVIDED IN YOUR 6
TESTIMONY? 7
A. Yes. The test year allocation methodology is explained in Section VII of the 8
CAAM, and the test year non-regulated business activity allocation factors are 9
listed in Schedule 11. 10
11
Q. ARE THERE ANY ADDITIONAL COMMISSION ORDERS REGARDING ALLOCATIONS12
THAT YOU HAVE NOT ADDRESSED IN YOUR DIRECT TESTIMONY? 13
A. Yes. In the Commission’s August 3, 2015, Order in Docket No. E002/AI-14-14
759, the Commission required that the Company provide certain information 15
related to Xcel Energy Transmission Development Company, LLC, or Xcel 16
Energy Southwest Transmission Company, LLC. The Company acknowledges 17
the reporting requirements under that Commission Order, but it has nothing to 18
report at this time, as the transmission companies have not undertaken any 19
relevant projects. Consequently, we ask to be released from any further 20
reporting requirements related to these affiliated interests unless or until any 21
such work is undertaken by Xcel Energy Transmission Development Company, 22
LLC, or Xcel Energy Southwest Transmission Company, LLC. 23

32 Docket No. E002/GR-20-723 Baumgarten Direct
III. CONCLUSION1
2
Q. PLEASE SUMMARIZE YOUR TESTIMONY 3
A. Our cost allocation processes are designed to ensure that the costs to provide 4
service to our customers are recorded to the appropriate legal entities. They 5
emphasize the importance of accuracy, facilitate business area accountability, 6
and result in a reasonable, accurate forecast of the costs we expect to incur. 7
8
Q. DOES THIS CONCLUDE YOUR DIRECT TESTIMONY? 9
A. Yes, it does. 10

Northern States Power Company Docket No. E002/GR-20-723 Exhibit___(RLB-1), Schedule 1
Page 1 of 1
Statement of Qualifications
Ross L. Baumgarten
Manager of Service Company Accounting Xcel Energy Services Inc.
I received a Bachelor of Arts in Business Administration, with a major in accounting,
from the University of St. Thomas in 2008.
My current position with XES is Manager, Service Company Accounting. I am
responsible for the general administration of XES, including accounting, billing,
allocations, policies and procedures, service agreements, internal audits, external audits
and external reporting to state and federal regulatory agencies.
I have been employed by XES since December 2013, holding positions in Service
Company Accounting, Transmission Accounting, and External Reporting.
Prior to joining XES, I was employed by Grant Thornton LLP as a senior financial and
operational auditor where I performed financial statement audits and benefit plan audits
for companies in various industries including manufacturing, hospitality, and technology.

1
FIFTH AMENDMENT TO SERVICE AGREEMENT BETWEEN
NORTHERN STATES POWER COMPANY, a Minnesota corporation
AND XCEL ENERGY SERVICES INC.
THIS FIFTH AMENDMENT TO SERVICE AGREEMENT (“Fifth Amendment”) is made and entered into as of the 19th day of May 2020, by and between Northern States Power Company, a Minnesota corporation (“Client Company”) and Xcel Energy Services Inc. (“Service Company”).
WHEREAS, Client Company and Service Company entered into that certain Service Agreement dated as of August 15, 2004 (“Original Service Agreement”);
WHEREAS, the Original Service Agreement has been amended from time to time;
WHEREAS, the Original Service Agreement was most recently amended by a Fourth Amendment to Service Agreement dated as of December 14, 2015 and filed in Compliance with the Minnesota Public Utilities Commission’s November 19, 2015 Order in Docket No. E,G002/AI-15-536 (“Fourth Amendment” and the Original Service Agreement as amended, the “Amended Service Agreement”);
WHEREAS the Amended Service Agreement is subject to the jurisdiction of state utility commissions and the Federal Energy Regulatory Commission;
WHEREAS, additional amendments to the Amended Service Agreement are necessary to recognize new allocation methodologies that are being implemented by the Client Company and Service Company;
WHEREAS, additional amendments to the Amended Service Agreement are necessary to recognize realignment of activities within certain Service Functions of the Service Company;
WHEREAS, Client Company and Service Company mutually desire, by means of this Fifth Amendment, to further amend the Amended Service Agreement as set forth below;
NOW THEREFORE, for and in consideration of the mutual covenants contained in this Fifth Amendment and for other good and valuable consideration, the receipt and sufficiency of which are hereby acknowledged, the parties agree as follows:
1. Appendix A to the Amended Service Agreement is deleted in its entirety andreplaced with the contents of Schedule 1 to this Fifth Amendment.
2. Except as expressly amended by this Fifth Amendment, all other provisions of theAmended Service Agreement remain in full force and effect.
3. This Fifth Amendment to Service Agreement shall be subject to all necessary andprudent regulatory approvals.
[SIGNATURE PAGE FOLLOWS]
Northern States Power Company
Fifth Amendment to the XES and NSPM Service Agreement
Docket No. E002/GR-20-723Exhibit___(RLB-1), Schedule 2
Page 1 of 21

2
IN WITNESS WHEREOF, the parties hereto have executed this Fifth Amendment to Service Agreement to be executed as of the date and year first above written.
XCEL ENERGY SERVICES INC.
BY: Name: Wendy B. Mahling Title: Vice President, Secretary
NORTHERN STATES POWER COMPANY, A MINNESOTA CORPORATION
BY: ______________________________________ Name: Christopher B. Clark Title: President
[SIGNATURE PAGE TO FIFTH AMENDMENT TO SERVICE AGREEMENT]
Northern States Power Company
Fifth Amendment to the XES and NSPM Service Agreement
Docket No. E002/GR-20-723Exhibit___(RLB-1), Schedule 2
Page 2 of 21

1
Appendix A
DESCRIPTION OF SERVICES TO BE PROVIDED BY XCEL ENERGY SERVICES INC. AND DETERMINATION OF CHARGES FOR SUCH SERVICES TO THE
OPERATING COMPANIES AND OTHER AFFILIATES
Description of Services Provided
A description of the services provided by Xcel Energy Services is detailed below. Identifiable costs will be directly assigned to the Operating Companies and other affiliates. For costs that are for services of a general nature and cannot be directly assigned, the method of allocation is described below for each service provided.
a) Executive Management Services*
Description - Represents charges for Xcel Energy Inc. (“Xcel Energy”) executive management and services, including, but not limited to, officers of Xcel Energy.
Method of Allocation - Executive Management Services indirect costs will be allocated based on a three-factor formula that is comprised of the average of the Revenue Ratio, the Employee Ratio and the Total Assets Ratio.
b) Investor Relations*
Description - Provides communications to investors and the financial community. Coordinates the transfer agent and shareholder record keeping functions and plans the annual shareholder meeting.
Method of Allocation - Investor Relations indirect costs will be allocated based on a three-factor formula that is comprised of the average of the Revenue Ratio, the Employee Ratio and the Total Assets Ratio.
c) Internal Audit & Risk*
Description - Reviews internal controls and procedures to ensure assets are safeguarded and transactions are properly authorized and recorded. Evaluates contract risks and trading risks.
Method of Allocation - Internal Audit and Risk indirect costs will be allocated based on a three-factor formula that is comprised of the average of the Revenue Ratio, the Employee Ratio and the Total Assets Ratio, except for:
(1) indirect costs associated with proprietary trading activities, which will be allocated based on the Joint Operating Agreement Peak Hour Megawatt Load Ratio, provided, however, that indirect costs provided jointly for both generation
Northern States Power Company
Fifth Amendment to the XES and NSPM Service Agreement
Docket No. E002/GR-20-723Exhibit___(RLB-1), Schedule 2
Page 3 of 21

2
trading activities and proprietary trading activities will be allocated based on the Joint Operating Agreement Labor Hours Ratio.
d) Legal*
Description - Provides legal services related to labor and employment law, litigation, contracts, rates and regulation, environmental matters, real estate and other legal matters.
Method of Allocation - Legal indirect costs will be allocated based on a three-factor formula that is comprised of the average of the Revenue Ratio, the Employee Ratio and the Total Assets Ratio.
e) Claims Services*
Description - Provides claims services related to casualty, public and company claims.
Method of Allocation - Claims Services indirect costs will be allocated based on a three-factor formula that is comprised of the average of the Revenue Ratio, the Employee Ratio and the Total Assets Ratio.
f) Corporate Communications*
Description - Provides corporate communications, speech writing and coordinates media services. Provides advertising and branding development for the companies within the Xcel Energy system. Manages and tracks all charitable contributions made on behalf of the Xcel Energy system.
Method of Allocation - Corporate Communications indirect costs will be allocated based on a three-factor formula that is comprised of the average of the Revenue Ratio, the Employee Ratio and the Total Assets Ratio.
g) Employee Communications*
Description - Develops and distributes communications to employees.
Method of Allocation - Employee Communications indirect costs will be allocated based on the Employee Ratio.
h) Corporate Strategy & Business Development*
Description - Facilitates development of corporate strategy and prepares strategic plans, monitors corporate performance and evaluates business opportunities. Develops and facilitates process improvements.
Northern States Power Company
Fifth Amendment to the XES and NSPM Service Agreement
Docket No. E002/GR-20-723 Exhibit___(RLB-1), Schedule 2
Page 4 of 21

3
Method of Allocation - Corporate Strategy & Business Development indirect costs will be allocated based on a three-factor formula that is comprised of the average of the Revenue Ratio, the Employee Ratio and the Total Assets Ratio.
i) Government Affairs*
Description - Monitors, reviews and researches government legislation.
Method of Allocation - Government Affairs indirect costs will be allocated based on a three-factor formula that is comprised of the average of the Revenue Ratio, the Employee Ratio and the Total Assets Ratio.
j) Facilities & Real Estate*
Description - Operates and maintains office buildings and service centers. Procures real estate and administers real estate leases. Administers contracts to provide security, housekeeping and maintenance services for such facilities. Procures office furniture and equipment.
Method of Allocation - Facilities & Real Estate indirect costs will be allocated based on the Employee Ratio.
k) Facilities Administrative Services*
Description - Includes but is not limited to the functions of mail delivery, duplicating and records management.
Method of Allocation - Facilities Administrative Services indirect costs will be allocated based on a three-factor formula that is comprised of the average of the Revenue Ratio, the Employee Ratio and the Total Assets Ratio.
l) Supply Chain*
Description - Includes contract negotiations, development and management of supplier relationships and acquisition of goods and services. Also includes inventory planning and forecasting, ordering, accounting and database management. Warehousing services includes receiving, storing, issuing, shipping, returns, and distribution of material and parts.
Method of Allocation - Supply Chain will be direct charged. Any management and oversight of the payment and reporting services activities that cannot be direct charged will be allocated based on the Invoice Transaction Ratio.
m) Supply Chain Special Programs*
Northern States Power Company
Fifth Amendment to the XES and NSPM Service Agreement
Docket No. E002/GR-20-723 Exhibit___(RLB-1), Schedule 2
Page 5 of 21

4
Description - Develops and implements special programs utilized across the company such as procurement cards, travel services, and compliance with corporate MWBE (minority women business expenditures) program goals.
Method of Allocation - Supply Chain Special Programs indirect costs will be allocated based on a three-factor formula that is comprised of the average of the Revenue Ratio, the Employee Ratio and the Total Assets Ratio.
n) Human Resources*
Description - Establishes and administers policies related to employment, compensation and benefits. Maintains Human Resources computer system, the tuition reimbursement plan, and diversity program. Coordinates the bargaining strategy and labor agreements with union employees. Provides technical and professional development training and general Human Resources support services.
Method of Allocation - Human Resources indirect costs will be allocated based on the Employee Ratio.
o) Finance & Treasury*
Description - Coordinates activities related to securities issuance, including maintaining relationships with financial institutions, cash management, investing activities and monitoring the capital markets. Performs financial and economic analysis.
Method of Allocation - Finance & Treasury indirect costs will be allocated based on a three-factor formula that is comprised of the average of the Revenue Ratio, the Employee Ratio and the Total Assets Ratio, except for:
(1) indirect costs associated with proprietary trading activities, which will be allocated based on the Joint Operating Agreement Peak Hour Megawatt Load Ratio, provided, however, that indirect costs provided jointly for both generation trading activities and proprietary trading activities will be allocated based on the Joint Operating Agreement Labor Hours Ratio.
p) Accounting, Financial Reporting & Taxes*
Description - Maintains the books and records. Prepares financial and statistical reports, tax filings and ensures compliance with the applicable laws and regulations. Maintains the accounting systems. Coordinates the budgeting process.
Method of Allocation – Accounting, Financial Reporting & Taxes indirect costs will be allocated based on a three-factor formula that is comprised of the average of the Revenue Ratio, the Employee Ratio and the Total Assets Ratio, except for:
(1) indirect costs associated with proprietary trading activities, which will be
Northern States Power Company
Fifth Amendment to the XES and NSPM Service Agreement
Docket No. E002/GR-20-723Exhibit___(RLB-1), Schedule 2
Page 6 of 21

5
allocated based on the Joint Operating Agreement Peak Hour Megawatt Load Ratio, provided, however, that indirect costs provided jointly for both generation trading activities and proprietary trading activities will be allocated based on the Joint Operating Agreement Labor Hours Ratio.
q) Payment & Reporting*
Description - Processes payments to vendors and prepares statistical reports.
Method of Allocation - Payment & Reporting indirect costs will be allocated based on the Invoice Transaction Ratio.
r) Receipts Processing*
Description - Processes payments received from customers of the Operating Companies and affiliates.
Method of Allocation - Receipts Processing indirect costs will be allocated based on the Customer Bills Ratio.
s) Payroll*
Description - Processes payroll including but not limited to time reporting, calculation of salaries and wages, payroll tax reporting and compliance reports.
Method of Allocation - Payroll indirect costs will be allocated based on the Employee Ratio.
t) Rates & Regulation*
Description - Determines the Operating Companies’ regulatory strategy, revenue requirements and rates for electric and gas customers. Coordinates the regulatory compliance requirements and maintains relationships with the regulatory bodies.
Method of Allocation - Rates & Regulation indirect costs will be allocated based on the Direct Labor Ratio.
u) Energy Supply Engineering and Environmental*
Description - Provides engineering services to the generation business. Establishes policies and procedures for compliance with environmental laws and regulations. Researches emerging environmental issues and monitors compliance with environmental requirements. Oversees environmental cleanup projects.
Method of Allocation - Energy Supply Engineering and Environmental services will be direct charged; administrative support functions that cannot be direct charged will be allocated based on the Total Plant Ratio.
Northern States Power Company
Fifth Amendment to the XES and NSPM Service Agreement
Docket No. E002/GR-20-723 Exhibit___(RLB-1), Schedule 2
Page 7 of 21
6
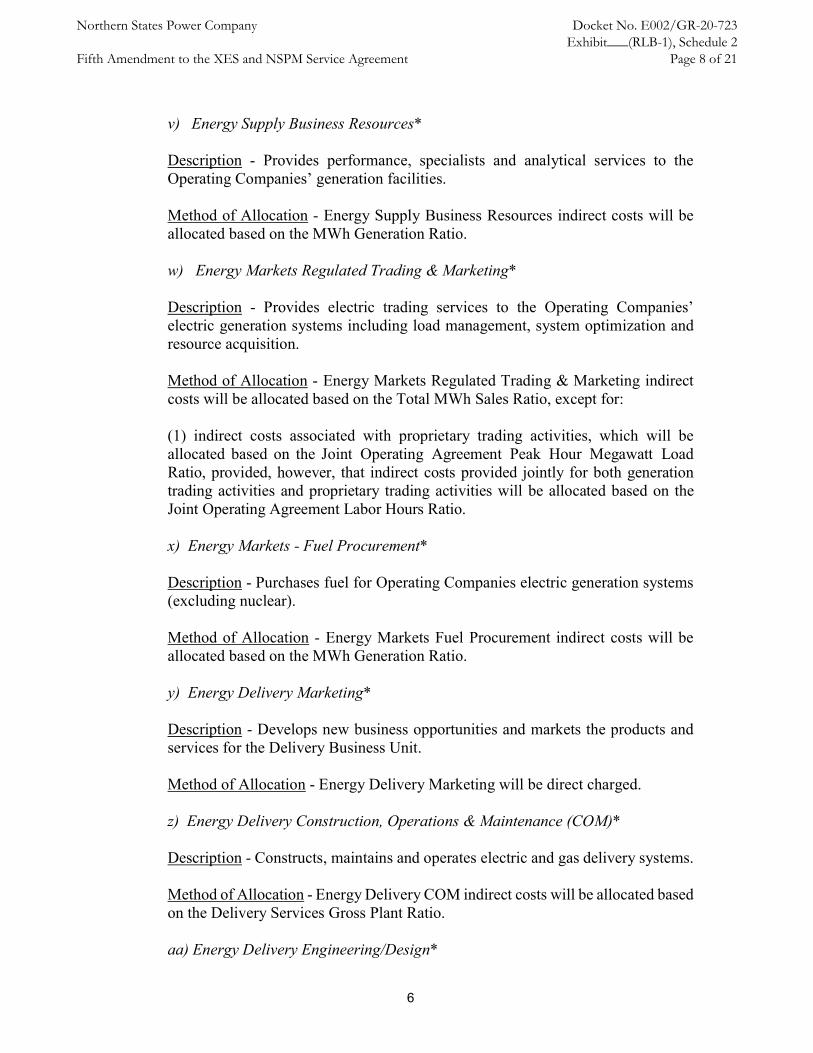
v) Energy Supply Business Resources*
Description - Provides performance, specialists and analytical services to the Operating Companies’ generation facilities.
Method of Allocation - Energy Supply Business Resources indirect costs will be allocated based on the MWh Generation Ratio.
w) Energy Markets Regulated Trading & Marketing*
Description - Provides electric trading services to the Operating Companies’ electric generation systems including load management, system optimization and resource acquisition.
Method of Allocation - Energy Markets Regulated Trading & Marketing indirect costs will be allocated based on the Total MWh Sales Ratio, except for:
(1) indirect costs associated with proprietary trading activities, which will be allocated based on the Joint Operating Agreement Peak Hour Megawatt Load Ratio, provided, however, that indirect costs provided jointly for both generation trading activities and proprietary trading activities will be allocated based on the Joint Operating Agreement Labor Hours Ratio.
x) Energy Markets - Fuel Procurement*
Description - Purchases fuel for Operating Companies electric generation systems (excluding nuclear).
Method of Allocation - Energy Markets Fuel Procurement indirect costs will be allocated based on the MWh Generation Ratio.
y) Energy Delivery Marketing*
Description - Develops new business opportunities and markets the products and services for the Delivery Business Unit.
Method of Allocation - Energy Delivery Marketing will be direct charged.
z) Energy Delivery Construction, Operations & Maintenance (COM)*
Description - Constructs, maintains and operates electric and gas delivery systems.
Method of Allocation - Energy Delivery COM indirect costs will be allocated based on the Delivery Services Gross Plant Ratio.
aa) Energy Delivery Engineering/Design*
Northern States Power Company
Fifth Amendment to the XES and NSPM Service Agreement
Docket No. E002/GR-20-723 Exhibit___(RLB-1), Schedule 2
Page 8 of 21

7
Description - Provides engineering and design services in support of capacity planning, construction, operations and material standards.
Method of Allocation - Energy Delivery Engineering/Design services will be direct charged; administrative support functions that cannot be direct charged will be allocated based on the Delivery Services Gross Plant Ratio.
bb) Marketing & Sales*
Description - Provides marketing and sales services for the Operating Companies and affiliates for their electric and natural gas customers including strategic planning, segment identification, business analysis, sales planning and customer service.
Method of Allocation - Marketing & Sales indirect costs will be allocated based on the Revenue Ratio.
cc) Customer Service*
Description - Provides service activities to retail and wholesale customers. These services include meter reading, customer billing, call center and credit and collections.
Method of Allocation - Customer Service indirect costs will be allocated based on the Customers Ratio. Indirect costs associated with administering low income and certified medical customer assistance programs will be allocated based on a composite of the average of the Special Needs Customer Contacts Ratio and Residential Customers Ratio.
dd) Business Systems*
Description - Provides basic information technology services such as: application management, voice and data network operations and management, customer support services, problem management services, security administration and systems management. In addition, Business Systems acts as a single point of contact for delivery of all technical services to Xcel Energy. They partner with vendors to ensure the delivery of benchmarking, continuous improvement, and leadership around strategic initiatives and key developments in the marketplace.
Method of Allocation - Business Systems indirect costs will be allocated using any of the allocation ratios or combination of ratios.
ee) Aviation Services*
Description - Provides aviation and travel services to employees.
Northern States Power Company
Fifth Amendment to the XES and NSPM Service Agreement
Docket No. E002/GR-20-723 Exhibit___(RLB-1), Schedule 2
Page 9 of 21

8
Method of Allocation - Aviation Services will be allocated based on a three-factor formula that is comprised of the average of the Revenue Ratio, the Employee Ratio, and the Total Assets Ratio.
ff) Fleet*
Description - Oversees the Operating Companies’ Fleet Services Group.
Method of Allocation - Fleet will be direct charged.
*Corporate Governance activities within this Service Function will be allocatedusing the average of the Total Assets Ratio including Xcel Energy Inc.’s Per Book Assets, Revenue Ratio with intercompany dividends assigned to Xcel Energy Inc., and Employee Ratio.
Northern States Power Company
Fifth Amendment to the XES and NSPM Service Agreement
Docket No. E002/GR-20-723Exhibit___(RLB-1), Schedule 2
Page 10 of 21
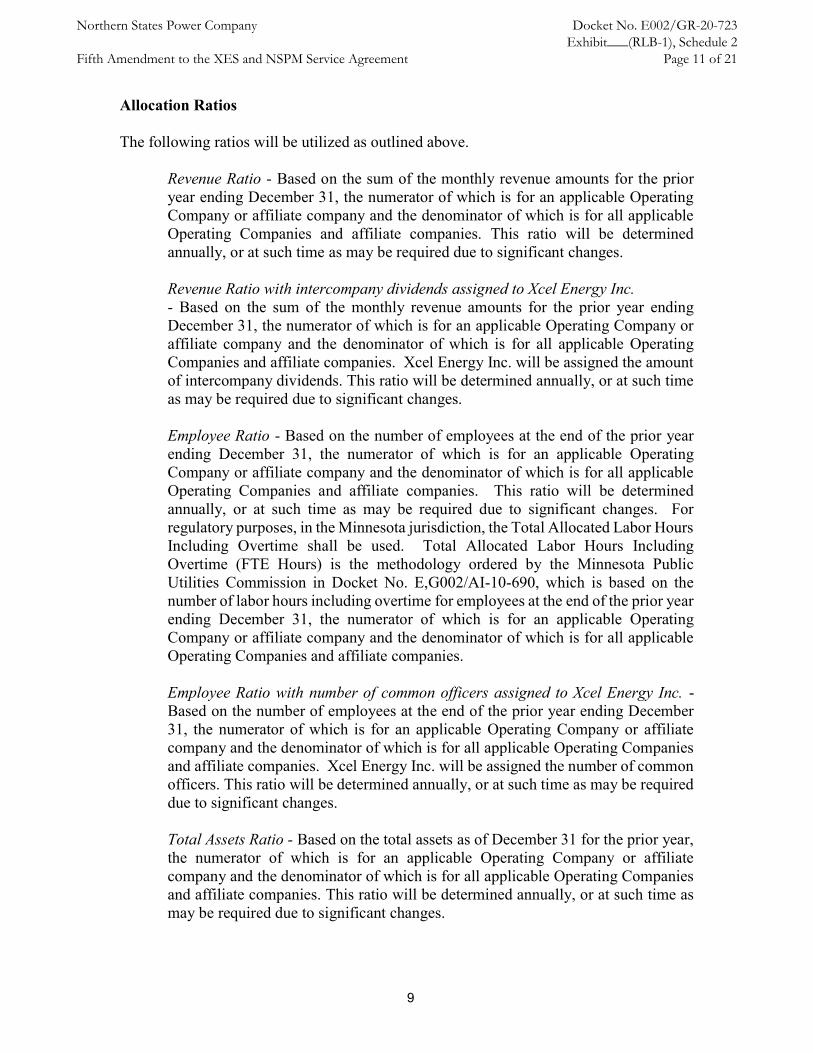
9
Allocation Ratios The following ratios will be utilized as outlined above.
Revenue Ratio - Based on the sum of the monthly revenue amounts for the prior year ending December 31, the numerator of which is for an applicable Operating Company or affiliate company and the denominator of which is for all applicable Operating Companies and affiliate companies. This ratio will be determined annually, or at such time as may be required due to significant changes. Revenue Ratio with intercompany dividends assigned to Xcel Energy Inc. - Based on the sum of the monthly revenue amounts for the prior year ending December 31, the numerator of which is for an applicable Operating Company or affiliate company and the denominator of which is for all applicable Operating Companies and affiliate companies. Xcel Energy Inc. will be assigned the amount of intercompany dividends. This ratio will be determined annually, or at such time as may be required due to significant changes. Employee Ratio - Based on the number of employees at the end of the prior year ending December 31, the numerator of which is for an applicable Operating Company or affiliate company and the denominator of which is for all applicable Operating Companies and affiliate companies. This ratio will be determined annually, or at such time as may be required due to significant changes. For regulatory purposes, in the Minnesota jurisdiction, the Total Allocated Labor Hours Including Overtime shall be used. Total Allocated Labor Hours Including Overtime (FTE Hours) is the methodology ordered by the Minnesota Public Utilities Commission in Docket No. E,G002/AI-10-690, which is based on the number of labor hours including overtime for employees at the end of the prior year ending December 31, the numerator of which is for an applicable Operating Company or affiliate company and the denominator of which is for all applicable Operating Companies and affiliate companies. Employee Ratio with number of common officers assigned to Xcel Energy Inc. - Based on the number of employees at the end of the prior year ending December 31, the numerator of which is for an applicable Operating Company or affiliate company and the denominator of which is for all applicable Operating Companies and affiliate companies. Xcel Energy Inc. will be assigned the number of common officers. This ratio will be determined annually, or at such time as may be required due to significant changes. Total Assets Ratio - Based on the total assets as of December 31 for the prior year, the numerator of which is for an applicable Operating Company or affiliate company and the denominator of which is for all applicable Operating Companies and affiliate companies. This ratio will be determined annually, or at such time as may be required due to significant changes.
Northern States Power Company
Fifth Amendment to the XES and NSPM Service Agreement
Docket No. E002/GR-20-723 Exhibit___(RLB-1), Schedule 2
Page 11 of 21

10
Total Assets Ratio including Xcel Energy Inc’s Per Book Assets - Based on the total assets as of December 31 for the prior year, the numerator of which is for an applicable Operating Company or affiliate company and the denominator of which is for all applicable Operating Companies and affiliate companies. Xcel Energy Inc. will be assigned the per book assets of Xcel Energy Inc. This ratio will be determined annually, or at such time as may be required due to significant changes.
Square Footage Ratio - Based on the total square footage as of December 31 for the prior year. The numerator of which is for an applicable Operating Company or affiliate company and the denominator of which is for all applicable Operating Companies and affiliate companies. This ratio will be determined annually, or at such time as may be required due to significant changes.
Invoice Transaction Ratio - Based on the sum of the monthly number of invoice transactions processed for the prior year ending December 31, the numerator of which is for an applicable Operating Company or affiliate company and the denominator of which is for all applicable Operating Companies and affiliate companies. This ratio will be determined annually or at such time as may be required due to significant changes.
Customer Bills Ratio - Based on the average of the monthly total number of customer bills issued during the prior year ending December 31, the numerator of which is for an applicable Operating Company or affiliate company and the denominator of which is for all applicable Operating Companies and affiliate companies. This ratio will be determined annually, or at such a time as may be required due to significant changes.
MWh Generation Ratio - Based on the sum of the monthly electric MWh generated by type of generator during the prior year ending December 31, the numerator of which is for an applicable Operating Company and the denominator of which is for all applicable Operating Companies. This ratio will be determined annually, or at such time as may be required due to significant changes.
Total MWh Sales Ratio - Based on the sum of the monthly electric MWh hours sold during the prior year ending December 31, the numerator of which is for an applicable Operating Company and the denominator of which is for all applicable Operating Companies. This includes sales to ultimate customers, wholesale customers, and non-requirement sales for resale. This ratio will be determined annually, or at such time as may be required due to significant changes.
Customers Ratio - Based on the average of the monthly total electric customers (and/or gas customers, or residential, business and large commercial and industrial customers, where applicable) for the prior year ending December 31, the numerator of which is for an applicable Operating Company or affiliate company and the denominator of which is for all applicable Operating Companies and affiliate companies. This ratio will be determined annually, or at such time as may be required due to significant changes.
Northern States Power Company
Fifth Amendment to the XES and NSPM Service Agreement
Docket No. E002/GR-20-723Exhibit___(RLB-1), Schedule 2
Page 12 of 21

11
Delivery Services Gross Plant Ratio - Based on transmission and distribution gross, both electric and, for the prior year ending December 31, the numerator of which is an applicable Operating Company and the denominator of which is for all applicable Operating Companies. This ratio will be determined annually, or at such time as may be required due to significant changes. Provided, however, as follows: (1) If the costs being allocated are directly related only to electric transmission, the ratio shall be based on the electric transmission gross plant; (2) If the costs being allocated are directly related only to electric distribution, the ratio shall be based on the electric distribution gross plant; (3) If the costs being allocated are directly related only to gas transmission, the ratio shall be based on the gas transmission gross plant; (4) If the costs being allocated are directly related only to gas distribution, the ratio shall be based on the gas distribution gross plant; (5) If the costs being allocated are directly related only to electric transmission and electric distribution, the ratio shall be based on the sum of the electric transmission gross plant and the electric distribution gross plant; (6) If the costs being allocated are directly related only to electric transmission and gas transmission, the ratio shall be based on the sum of the electric transmission gross plant and the gas transmission gross plant; (7) If the costs being allocated are directly related only to electric transmission and gas distribution, the ratio shall be based on the sum of the electric transmission gross plant and the gas distribution gross plant; (8) If the costs being allocated are directly related only to electric distribution and gas transmission, the ratio shall be based on the sum of the electric distribution gross plant and the gas transmission gross plant; (9) If the costs being allocated are directly related only to electric distribution and gas distribution, the ratio shall be based on the sum of the electric distribution gross plant and the gas distribution gross plant; (10) If the costs being allocated are directly related only to gas transmission and gas distribution, the ratio shall be based on the sum of the gas transmission gross plant and the gas distribution gross plant; (11) If the costs being allocated are directly related only to electric transmission, electric distribution, and gas transmission, the ratio shall be based on the sum of the electric transmission gross plant, the electric distribution gross plant, and the gas transmission gross plant; (12) If the costs being allocated are directly related only to electric transmission, electric distribution, and gas distribution, the ratio shall be based on the sum of the electric transmission gross plant, the electric distribution gross plant, and the gas distribution gross plant; (13) If the costs being allocated are directly related only to electric transmission, gas transmission, and gas distribution, the ratio shall be based on the sum of the electric transmission gross plant, the gas transmission gross plant, and the gas distribution gross plant; (14) If the costs being allocated are directly related only to electric distribution, gas
Northern States Power Company
Fifth Amendment to the XES and NSPM Service Agreement
Docket No. E002/GR-20-723 Exhibit___(RLB-1), Schedule 2
Page 13 of 21

12
transmission, and gas distribution, the ratio shall be based on the sum of the electric distribution plant, the gas transmission gross plant, and the gas distribution gross plant. Meters Ratio - Based on the number of meters at the end of the prior year ending December 31, the numerator of which is for an applicable Operating Company or affiliate company and the denominator of which is for all applicable Operating Companies and affiliate companies. This ratio will be determined annually, or at such a time as may be required due to significant changes. Provided, however, as follows: (1) If the costs being allocated are directly related only to Advanced Metering Infrastructure (“AMI”) enabled meters, the ratio shall be based on the number of AMI enabled meters. Customer Contacts Ratio - Based on the total annual number of customer contacts at the end of the prior year ending December 31, the numerator of which is for an applicable Operating Company or affiliate company and the denominator of which is for all applicable Operating Companies and affiliate companies. This ratio will be determined annually, or at such a time as may be required due to significant changes. If the costs being allocated are directly related only to the support of special needs customers, such as those receiving low income energy assistance and those having certified medical conditions, the Special Needs Customer Contacts Ratio shall be used. Special Needs Customer Contacts Ratio – Based on the number of contacts received by the special needs customer department at the end of the prior year ending December 31, the numerator of which is for an applicable Operating Company or affiliate company and the denominator of which is for all applicable Operating Companies and affiliate companies. This ratio will be determined annually, or at such a time as may be required due to significant changes. Accounts Payable Transactions Ratio - Based on the total annual number of accounts payable transactions by system application at the end of the prior year ending December 31, the numerator of which is for an applicable Operating Company or affiliate company and the denominator of which is for all applicable Operating Companies and affiliate companies. This ratio will be determined annually, or at such a time as may be required due to significant changes. Inventory Transactions Ratio - Based on the total annual number of inventory transactions by system application at the end of the prior year ending December 31, the numerator of which is for an applicable Operating Company or affiliate company and the denominator of which is for all applicable Operating Companies and affiliate companies. This ratio will be determined annually, or at such a time as may be required due to significant changes.
Northern States Power Company
Fifth Amendment to the XES and NSPM Service Agreement
Docket No. E002/GR-20-723 Exhibit___(RLB-1), Schedule 2
Page 14 of 21

13
Work Management Transactions Ratio - Based on the total annual number of work management transactions by system application at the end of the prior year ending December 31, the numerator of which is for an applicable Operating Company or affiliate company and the denominator of which is for all applicable Operating Companies and affiliate companies. This ratio will be determined annually, or at such a time as may be required due to significant changes.
Purchasing Transactions Ratio - Based on the total annual number of purchasing transactions by system application at the end of the prior year ending December 31, the numerator of which is for an applicable Operating Company or affiliate company and the denominator of which is for all applicable Operating Companies and affiliate companies. This ratio will be determined annually, or at such a time as may be required due to significant changes.
Total Plant Ratio - Based on total property, plant and equipment at the end of the prior year ending December 31, the numerator of which is an applicable Operating Company and the denominator of which is for all applicable Operating Companies. This ratio will be determined annually, or at such a time as may be required due to significant changes.
Provided, however, as follows: (1) If the costs being allocated are directly related only to electric production, the ratio shall be based on the total electric production plant; (2) If the costs being allocated are directly related only to electric transmission, the ratio shall be based on the total electric transmission plant; (3) If the costs being allocated are directly related only to electric distribution, the ratio shall be based on the total electric distribution plant; (4) If the costs being allocated are directly related only to gas transmission, the ratio shall be based on the total gas transmission plant; (5) If the costs being allocated are directly related only to gas distribution, the ratio shall be based on the total gas distribution plant; (6) If the costs being allocated are directly related only to intangible plant, the ratio shall be based on the total intangible plant; (7) If the costs being allocated are directly related only to electric production and electric transmission, the ratio shall be based on the sum of the total electric production plant and the total electric transmission plant; (8) If the costs being allocated are directly related only to electric production and electric distribution, the ratio shall be based on the sum of the total electric production plant and the total electric distribution plant; (9) If the costs being allocated are directly related only to electric production and gas transmission, the ratio shall be based on the sum of the total electric production plant and the total gas transmission plant; (10) If the costs being allocated are directly related only to electric production and gas distribution, the ratio shall be based on the sum of the total electric production plant and the total gas distribution plant; (11) If the costs being allocated are directly related only to electric production and
Northern States Power Company
Fifth Amendment to the XES and NSPM Service Agreement
Docket No. E002/GR-20-723Exhibit___(RLB-1), Schedule 2
Page 15 of 21

14
intangible plant, the ratio shall be based on the sum of the total electric production plant and the total intangible plant; (12) If the costs being allocated are directly related only to electric transmission and electric distribution, the ratio shall be based on the sum of the total electric transmission plant and the total electric distribution plant; (13) If the costs being allocated are directly related only to electric transmission and gas transmission, the ratio shall be based on the sum of the total electric transmission plant and the total gas transmission plant; (14) If the costs being allocated are directly related only to electric transmission and gas distribution, the ratio shall be based on the sum of the total electric transmission plant and the total gas distribution plant; (15) If the costs being allocated are directly related only to electric transmission and intangible plant, the ratio shall be based on the sum of the total electric transmission plant and the total intangible plant; (16) If the costs being allocated are directly related only to electric distribution and gas transmission, the ratio shall be based on the sum of the total electric distribution plant and the total gas transmission plant; (17) If the costs being allocated are directly related only to electric distribution and gas distribution, the ratio shall be based on the sum of the total electric distribution plant and the total gas distribution plant; (18) If the costs being allocated are directly related only to electric distribution and intangible plant, the ratio shall be based on the sum of the total electric distribution plant and the total intangible plant; (19) If the costs being allocated are directly related only to gas transmission and gas distribution, the ratio shall be based on the sum of the total gas transmission plant and the total gas distribution plant; (20) If the costs being allocated are directly related only to gas transmission and intangible plant, the ratio shall be based on the sum of the total gas transmission plant and the total intangible plant; (21) If the costs being allocated are directly related only to gas distribution and intangible plant, the ratio shall be based on the sum of the total gas distribution plant and the total intangible plant; (22) If the costs being allocated are directly related only to electric production, electric transmission, and electric distribution, the ratio shall be based on the sum of the total electric production plant, the total electric transmission plant, and the total electric distribution plant; (23) If the costs being allocated are directly related only to electric production, electric transmission, and gas transmission, the ratio shall be based on the sum of the total electric production plant, the total electric transmission plant, and the total gas transmission plant; (24) If the costs being allocated are directly related only to electric production, electric transmission, and gas distribution, the ratio shall be based on the sum of the total electric production plant, the total electric transmission plant, and the total gas distribution plant; (25) If the costs being allocated are directly related only to electric production, electric transmission, and intangible plant, the ratio shall be based on the sum of the total electric production plant, the total electric transmission plant, and the total
Northern States Power Company
Fifth Amendment to the XES and NSPM Service Agreement
Docket No. E002/GR-20-723 Exhibit___(RLB-1), Schedule 2
Page 16 of 21

15
intangible plant; (26) If the costs being allocated are directly related only to electric production, electric distribution, and gas transmission, the ratio shall be based on the sum of the total electric production plant, the total electric distribution plant, and the total gas transmission plant; (27) If the costs being allocated are directly related only to electric production, electric distribution, and gas distribution, the ratio shall be based on the sum of the total electric production plant, the total electric distribution plant, and the total gas distribution plant; (28) If the costs being allocated are directly related only to electric production, electric distribution, and intangible, the ratio shall be based on the sum of the total electric production plant, the total electric distribution plant, and the total intangible plant; (29) If the costs being allocated are directly related only to electric production, gas transmission, and gas distribution, the ratio shall be based on the sum of the total electric production plant, the total gas transmission plant, and the total gas distribution plant; (30) If the costs being allocated are directly related only to electric production, gas transmission, and intangible plant, the ratio shall be based on the sum of the total electric production plant, the total gas transmission plant, and the total intangible plant; (31) If the costs being allocated are directly related only to electric production, gas distribution, and intangible plant, the ratio shall be based on the sum of the total electric production plant, the total gas distribution plant, and the total intangible plant; (32) If the costs being allocated are directly related only to electric transmission, electric distribution, and gas transmission, the ratio shall be based on the sum of the total electric transmission plant, the total electric distribution plant, and the total gas transmission plant; (33) If the costs being allocated are directly related only to electric transmission, electric distribution, and gas distribution, the ratio shall be based on the sum of the total electric transmission plant, the total electric distribution plant, and the total gas distribution plant; (34) If the costs being allocated are directly related only to electric transmission, electric distribution, and intangible plant, the ratio shall be based on the sum of the total electric transmission plant, the total electric distribution plant, and the total intangible plant; (35) If the costs being allocated are directly related only to electric transmission, gas transmission, and gas distribution, the ratio shall be based on the sum of the total electric transmission plant, the total gas transmission plant, and the total gas distribution plant; (36) If the costs being allocated are directly related only to electric transmission, gas transmission, and intangible plant, the ratio shall be based on the sum of the total electric transmission plant, the total gas transmission plant, and the total intangible plant; (37) If the costs being allocated are directly related only to electric transmission, gas distribution, and intangible plant, the ratio shall be based on the sum of the total
Northern States Power Company
Fifth Amendment to the XES and NSPM Service Agreement
Docket No. E002/GR-20-723Exhibit___(RLB-1), Schedule 2
Page 17 of 21

16
electric transmission plant, the total gas distribution plant, and the total intangible plant; (38) If the costs being allocated are directly related only to electric distribution, gas transmission, and intangible plant, the ratio shall be based on the sum of the total electric distribution plant, the total gas transmission plant, and the total intangible plant; (39) If the costs being allocated are directly related only to electric distribution, gas distribution, and intangible plant, the ratio shall be based on the sum of the total electric distribution plant, the total gas distribution plant, and the total intangible plant; (40) If the costs being allocated are directly related only to electric distribution, gas distribution, and gas transmission, the ratio shall be based on the sum of the total electric distribution plant, the total gas distribution plant, and the total gas transmission plant; (41) If the costs being allocated are directly related only to gas transmission, gas distribution, and intangible plant, the ratio shall be based on the sum of the total gas transmission plant, the total gas distribution plant, and the total intangible plant; (42) If the costs being allocated are directly related only to electric production, electric transmission, electric distribution, and gas transmission, the ratio shall be based on the sum of the total electric production plant, the total electric transmission plant, the total electric distribution plant, and the total gas transmission plant; (43) If the costs being allocated are directly related only to electric production, electric transmission, electric distribution, and gas distribution, the ratio shall be based on the sum of the total electric production plant, the total electric transmission plant, the total electric distribution plant, and the total gas distribution plant; (44) If the costs being allocated are directly related only to electric production, electric transmission, electric distribution, and intangible plant, the ratio shall be based on the sum of the total electric production plant, the total electric transmission plant, the total electric distribution plant, and the total intangible plant; (45) If the costs being allocated are directly related only to electric production, electric transmission, gas transmission, and gas distribution, the ratio shall be based on the sum of the total electric production plant, the total electric transmission plant, the total gas transmission plant, and the total gas distribution plant; (46) If the costs being allocated are directly related only to electric production, electric transmission, gas transmission, and intangible plant, the ratio shall be based on the sum of the total electric production plant, the total electric transmission plant, the total gas transmission plant, and the total intangible plant; (47) If the costs being allocated are directly related only to electric production, electric distribution, gas transmission, and gas distribution, the ratio shall be based on the sum of the total electric production plant, the total electric distribution plant, the total gas transmission plant, and the total gas distribution plant; (48) If the costs being allocated are directly related only to electric production, electric distribution, gas transmission, and intangible plant, the ratio shall be based on the sum of the total electric production plant, the total electric distribution plant, the total gas transmission plant, and the total intangible plant; (49) If the costs being allocated are directly related only to electric production, electric distribution, gas distribution, and intangible plant, the ratio shall be based
Northern States Power Company
Fifth Amendment to the XES and NSPM Service Agreement
Docket No. E002/GR-20-723 Exhibit___(RLB-1), Schedule 2
Page 18 of 21

17
on the sum of the total electric production plant, the total electric distribution plant, the total gas distribution plant, and the total intangible plant; (50) If the costs being allocated are directly related only to electric production, gas transmission, gas distribution, and intangible plant, the ratio shall be based on the sum of the total electric production plant, the total gas transmission plant, the total gas distribution plant, and the total intangible plant; (51) If the costs being allocated are directly related only to electric transmission, electric distribution, gas transmission, and gas distribution, the ratio shall be based on the sum of the total electric transmission plant, the total electric distribution plant, the total gas transmission plant, and the total gas distribution plant; (52) If the costs being allocated are directly related only to electric transmission, electric distribution, gas transmission, and intangible plant, the ratio shall be based on the sum of the total electric transmission plant, the total electric distribution plant, the total gas transmission plant, and the total intangible plant; (53) If the costs being allocated are directly related only to electric transmission, electric distribution, gas distribution, and intangible plant, the ratio shall be based on the sum of the total electric transmission plant, the total electric distribution plant, the total gas distribution plant, and the total intangible plant; (54) If the costs being allocated are directly related only to electric transmission, gas transmission, gas distribution, and intangible plant, the ratio shall be based on the sum of the total electric transmission plant, the total gas transmission plant, the total gas distribution plant, and the total intangible plant; (55) If the costs being allocated are directly related only to electric distribution, gas transmission, gas distribution, and intangible plant, the ratio shall be based on the sum of the total electric distribution plant, the total gas transmission plant, the total gas distribution plant, and the total intangible plant; (56) If the costs being allocated are directly related only to electric production, electric transmission, gas distribution, and intangible plant, the ratio shall be based on the sum of the total electric production plant, the total electric transmission plant, the total gas distribution plant, and the total intangible plant; (57) If the costs being allocated are directly related only to electric production, electric transmission, electric distribution, gas distribution, and gas transmission, the ratio shall be based on the sum of the total electric production plant, the total electric transmission plant, the total electric distribution plant, the total gas distribution plant, and the total gas transmission plant; (58) If the costs being allocated are directly related only to electric production, electric transmission, electric distribution, gas transmission, and intangible plant, the ratio shall be based on the sum of the total electric production plant, the total electric transmission plant, the total electric distribution plant, the total gas transmission plant, and the total intangible plant; (59) If the costs being allocated are directly related only to electric production, electric distribution, gas distribution, gas transmission, and intangible plant, the ratio shall be based on the sum of the total electric production plant, the total electric distribution plant, the total gas distribution plant, the total gas transmission plant, and the total intangible plant; (60) If the costs being allocated are directly related only to electric production, electric transmission, gas distribution, gas transmission, and intangible plant, the
Northern States Power Company
Fifth Amendment to the XES and NSPM Service Agreement
Docket No. E002/GR-20-723 Exhibit___(RLB-1), Schedule 2
Page 19 of 21

18
ratio shall be based on the sum of the total electric production plant, the total electric transmission plant, the total gas distribution plant, the total gas transmission plant, and the total intangible plant; (61) If the costs being allocated are directly related only to electric production, electric transmission, electric distribution, gas distribution, and intangible plant, the ratio shall be based on the sum of the total electric production plant, the total electric transmission plant, the total electric distribution plant, the total gas distribution plant, and the total intangible plant; (62) If the costs being allocated are directly related only to electric transmission, electric distribution, gas distribution, gas transmission, and intangible plant, the ratio shall be based on the sum of the total electric transmission plant, the total electric distribution plant, the total gas distribution plant, the total gas transmission plant, and the total intangible plant.
Total Phones Ratio - Based on the number of phones at the end of the prior year ending December 31, the numerator of which is for an applicable Operating Company or affiliate company and the denominator of which is for all applicable Operating Companies and affiliate companies. This ratio will be determined annually, or at such a time as may be required due to significant changes.
Total Radios Ratio - Based on the number of radios at the end of the prior year ending December 31, the numerator of which is for an applicable Operating Company or affiliate company and the denominator of which is for all applicable Operating Companies and affiliate companies. This ratio will be determined annually, or at such a time as may be required due to significant changes.
Total Computers Ratio - Based on the number of computers at the end of the prior year ending December 31, the numerator of which is for an applicable Operating Company or affiliate company and the denominator of which is for all applicable Operating Companies and affiliate companies. This ratio will be determined annually, or at such a time as may be required due to significant changes.
Total Software Applications Users Ratio - Based on the number of users of a specific software application at the end of the prior year ending December 31, the numerator of which is for an applicable Operating Company or affiliate company and the denominator of which is for all applicable Operating Companies and affiliate companies. This ratio will be determined annually, or at such a time as may be required due to significant changes.
Joint Operating Agreement Peak Hour Megawatt Load Ratio - Based on that certain Joint Operating Agreement among Northern States Power Company, a Minnesota corporation, Northern States Power Company, a Wisconsin corporation, Public Service Company of Colorado, Southwestern Public Service Company, and Xcel Energy Services Inc., as agent, dated as of October 1, 2004, as may be amended from time to time, that designates costs to be allocated based on peak hour of megawatt load for previous year ending December 31, the numerator of which is for an applicable Operating Company or affiliate company and the denominator
Northern States Power Company
Fifth Amendment to the XES and NSPM Service Agreement
Docket No. E002/GR-20-723Exhibit___(RLB-1), Schedule 2
Page 20 of 21

19
of which is for all applicable Operating Companies and affiliate companies. This ratio will be determined annually, or at such time as may be required due to significant changes.
Joint Operating Agreement Labor Hours Ratio - Based on that certain Joint Operating Agreement among Northern States Power Company, a Minnesota corporation, Northern States Power Company, a Wisconsin corporation, Public Service Company of Colorado, Southwestern Public Service Company, and Xcel Energy Services Inc., as agent, dated as of October 1, 2004, as may be amended from time to time, that designates costs to be allocated based on labor hours at the end of the prior year ending December 31, the numerator of which is for an applicable Operating Company and the denominator of which is for all applicable Operating Companies. This ratio will be determined annually, or at such time as may be required due to significant changes.
Direct Labor Ratio – Based on fully-loaded direct-charged Rates and Regulation labor dollars charged to individual operating affiliates by the Rates and Regulation service function. The numerator of which is the fully-loaded direct-charged labor dollars to individual operating affiliates by Rates and Regulation service function and the denominator of which is the total fully-loaded direct-charged labor dollars to all affiliates by the Rates and Regulation service function.
Northern States Power Company
Fifth Amendment to the XES and NSPM Service Agreement
Docket No. E002/GR-20-723Exhibit___(RLB-1), Schedule 2
Page 21 of 21

Northern States Power Company
Cost Assignment and Allocation Manual
September 2020
Northern States Power Company
Cost Assignment and Allocation Manual (CAAM)
Docket No. E002/GR-20-723Exhibit___(RLB-1), Schedule 3
Page 1 of 57
Table of Contents
Section
Introduction I Definitions Terms
Corporate Organization II Overview of Company System List of Regulated & Non-regulated Affiliates
Description of Services III Overview Regulated Services Non-regulated Business Activities
Transactions with Affiliates IV Overview Services Provided by NSPM to Affiliates Services Provided by Affiliates to NSPM
Cost Assignment and Allocation Process V Overview Feeder Systems Process Flowchart
Utility Allocations VI Overview Allocators
Non-regulated Business Activity Allocations VII Overview Principles
Jurisdictional Allocations VIII Overview Allocations
Northern States Power Company
Cost Assignment and Allocation Manual (CAAM)
Docket No. E002/GR-20-723 Exhibit___(RLB-1), Schedule 3
Page 2 of 57
I. INTRODUCTION
This Cost Assignment and Allocation Manual (“CAAM”) was developed to specify the procedures that Northern States Power Company, a Minnesota corporation (“NSPM” or the “Company”) follows in assigning and allocating costs among utility departments (electric and gas), among regulated services and non-regulated business activities and among jurisdictions.
NSPM was incorporated in 2000 under the laws of Minnesota and is a wholly owned operating utility subsidiary of Xcel Energy Inc. (“Xcel Energy” or the “Parent”). Xcel Energy was initially established as a registered holding company under the Public Utility Holding Company Act of 1935 (“PUHCA 1935”), with oversight by the Securities and Exchange Commission (“SEC”). On August 8, 2005, the Energy Policy Act of 2005 was signed into law. This repealed PUHCA 1935 and enacted the Public Utility Holding Company Act of 2005 (“PUHCA 2005”), which became effective on February 8, 2006. Responsibility for oversight of public utility holding companies was transferred from the SEC to the Federal Energy Regulatory Commission (“FERC”) as a result of the Energy Policy Act of 2005.
NSPM conducts business in Minnesota, North Dakota, and South Dakota and has electric operations in all three states including the generation, purchase, transmission, distribution, and sale of electricity. NSPM also purchases, transports, distributes, and sells natural gas to retail customers and transports customer-owned natural gas in Minnesota and North Dakota.
NSPM owns the following direct subsidiaries: United Power and Land Company, which holds real estate; and NSP Nuclear Corporation.
As a member of a holding company system, NSPM receives administrative, management, environmental, and other support services from Xcel Energy Services Inc. (“XES” or the “Service Company”), a centralized service company. The Service Company provides services to Xcel Energy and its subsidiaries, at cost, pursuant to service agreements. The service agreement between NSPM and XES, including all amendments to the original Service Agreement, have been submitted to, and approved by, the Minnesota Public Utilities Commission (“Commission”). The cost allocation methodologies under which XES costs are assigned and allocated are set forth in that Commission approved service agreement, and while those allocation methodologies are not the subject of this NSPM CAAM, they are referenced in several sections herein.
The Service Company is referenced in the CAAM for the following reasons:
• The Service Company is listed as an affiliate company in the Transaction with Affiliatessection for the services it provides to NSPM.
• The Service Company and all other companies in the Xcel Energy holding companysystem of companies are included in the Corporate Organization section to provide alisting of all affiliates of NSPM.
• The Service Company is referenced in the Cost Assignment and Allocation Processsection because this section covers processes that may cross multiple legal entities.
Northern States Power Company
Cost Assignment and Allocation Manual (CAAM)
Docket No. E002/GR-20-723 Exhibit___(RLB-1), Schedule 3
Page 3 of 57

The NSPM CAAM contains the following sections:
• Introduction (Section I)• Corporate Organization (Section II)• Description of Services (Section III)• Transactions with Affiliates (Section IV)• Cost Assignment and Allocation Process (Section V)• Utility Allocations (Section VI)• Non-regulated Business Activity Allocations (Sections VII)• Jurisdictional Allocations (Section VIII)
DEFINITIONS
Abbreviations or Acronyms
The following abbreviations or acronyms are used within the CAAM document:
A&G Administrative and general AFUDC Allowance for funds used during construction ACC Allocating cost center CAAM Cost Assignment and Allocation Manual CIP Conservation improvement program Commission Minnesota Public Utilities Commission FERC Federal Energy Regulatory Commission FICA Federal Insurance Contributions Act FUTA Federal Unemployment Tax Act GAAP Generally Accepted Accounting Principals HR Human Resources IT Information Technology NSPM or the Company Norther States Power Company, a Minnesota corporation NSPW Northern States Power Company, a Wisconsin corporation NSP System
O&M
The electric production and transmission system of NSPM and NSPW operated on an integrated basis and managed by NSPM Operating and maintenance
PSCo Public Service Company of Colorado, a Colorado corporation PUCHA 1935 PUCHA 2005 RTU
Public Utility Holding Company Act of 1935 Public Utility Holding Company Act of 2005 Remote terminal unit
SAP SAP general ledger and work and asset management system SCADA Supervisory control and data acquisition SEC Securities and Exchange Commission SKF Statistical key figure SPS Southwestern Public Service Company, a New Mexico corporation SUTA State Unemployment Tax Authority Utility subsidiaries or operating companies UMP
NSPM, NSPW, PSCo, and SPS
Utility money pool Xcel Energy or the Parent Xcel Energy Inc. and its subsidiaries XES or the Service Company Xcel Energy Services Inc.
Northern States Power Company
Cost Assignment and Allocation Manual (CAAM)
Docket No. E002/GR-20-723 Exhibit___(RLB-1), Schedule 3
Page 4 of 57

Terms
The following terms are used within the CAAM document:
Accounts Payable – the payment and reporting department of XES.
A&G – includes activity in FERC accounts 920-935, Administrative and General Expenses.
ACC – an organizational unit that collects cost to be allocated using the allocation ratios or factors included in the SKF.
Assessment – the process used by the accounting system to allocate costs from an ACC to the receiving cost element.
Cost Element – an organizational unit to SAP that is used to track costs in the accounting system as they move through the various processing steps.
Customer Accounting Costs – includes activity in FERC accounts 901-903, Customer Accounts Expenses; FERC accounts 906-910, Customer Service and Informational Expenses; and FERC accounts 911-917, Sales Expenses.
Final Cost Center – final cost center defined by business function, company code, and profit center.
Home Cost Center – captures only labor and payroll postings and maps to HR departments.
Internal Order – internal orders are accounting mechanisms used to track expenses associated with certain projects or functions.
Non-Operations and Maintenance Allocations – allocations designed to apportion expenses recorded in accounts other than O&M to electric, gas, thermal and nonutility. The non-O&M costs apportioned include depreciation, payroll taxes, miscellaneous service revenues, amortization expenses, etc.
O&M – includes activity in FERC accounts 500-935 with the exception of the following FERC accounts: 501, Fuel; 901-903, Customer Accounts Expenses; 906-910, Customer Service and Informational Expenses; 911-917, Sales Expenses; and 920-935, Administrative and General Expenses.
Profit Center – SAP data element that identifies the jurisdiction or joint venture owner of revenues and expenses.
Receiving Cost Element – a cost element that receives costs when a settlement or assessment process is run.
Segment – represents electric, gas, thermal, joint venture, or other and is derived by SAP from profit center and cost center.
Northern States Power Company
Cost Assignment and Allocation Manual (CAAM)
Docket No. E002/GR-20-723 Exhibit___(RLB-1), Schedule 3
Page 5 of 57

SKF – the method by which the allocation ratios and factors are organized in the accounting system and linked to ACCs to facilitate the performance of the assessment process to allocate charges.
Supply Chain – the supply chain department of XES.
Work Breakdown Structure – structure used to group all aspects or phases of a given project or organizational group and render them easily reportable.
Northern States Power Company
Cost Assignment and Allocation Manual (CAAM)
Docket No. E002/GR-20-723 Exhibit___(RLB-1), Schedule 3
Page 6 of 57

II. CORPORATE ORGANIZATION
OVERVIEW OF COMPANY SYSTEM
Xcel Energy Inc., a Minnesota corporation, is a registered holding company. Xcel Energy directly owns the utility subsidiaries that serve electric, natural gas, thermal, and propane customers in eight mid-western and western states including portions of Colorado, Michigan, Minnesota, New Mexico, North Dakota, South Dakota, Texas and Wisconsin. These four utility subsidiaries are Northern States Power Company, a Minnesota corporation (“NSPM”); Northern States Power Company, a Wisconsin corporation (“NSPW”); Public Service Company of Colorado, a Colorado corporation (“PSCo”); and Southwestern Public Service Company, a New Mexico corporation (“SPS”). Along with the utility subsidiaries, the transmission-only subsidiaries, Xcel Energy Southwest Transmission Company, LLC (“XEST”), Xcel Energy Transmission Development Company, LLC (“XETD”), and Xcel Energy West Transmission Company, LLC (“XEWT”); WYCO Development LLC (“WYCO”), a joint venture with CIG to develop and lease natural gas pipelines, storage, and compression facilities; WestGas InterState, Inc. (“WGI”), an interstate natural gas pipeline company comprise the regulated utility operations. Xcel Energy’s significant non-regulated subsidiaries are Eloigne Company; Capital Services, LLC; and Nicollet Holdings Company, LLC.
Xcel Energy owns the following additional direct subsidiaries, some of which are intermediate holding companies with additional subsidiaries: Xcel Energy Wholesale Group Inc., Xcel Energy Markets Holdings Inc., Xcel Energy International Inc., Xcel Energy Ventures Inc., Xcel Energy Retail Holdings Inc., Xcel Energy Communications Group Inc., , Xcel Energy WYCO Inc., Xcel Energy Transmission Holding Company, LLC, Xcel Energy Venture Holdings, Inc., Nicollet Holdings Company, LLC, and Xcel Energy Services Inc. Xcel Energy and its subsidiaries collectively are referred to as Xcel Energy Inc., and many do business under the Xcel Energy name. See the following pages for a complete legal entity organizational listing for Xcel Energy Inc. and its subsidiaries.
LIST OF REGULATED & NON-REGULATED AFFILIATES (as of June 30, 2019)
Xcel Energy Inc. Northern States Power Company, a Minnesota corporation
NSP Nuclear Corporation Private Fuel Storage LLC United Power and Land Company
Northern States Power Company, a Wisconsin corporation Chippewa and Flambeau Improvement Company Clearwater Investments, Inc.
Shoe Factory Holding LLC NSP Lands, Inc. Public Service Company of Colorado, a Colorado corporation**
1480 Welton, Inc. Beeman Irrigating Ditch and Milling Company Consolidated Extension Canal Company
Northern States Power Company
Cost Assignment and Allocation Manual (CAAM)
Docket No. E002/GR-20-723 Exhibit___(RLB-1), Schedule 3
Page 7 of 57

East Boulder Ditch Company Fisher Ditch Company Gardeners Mutual Ditch Company Green and Clear Lakes Company Hillcrest Ditch and Reservoir Company Las Animas Consolidated Canal Company P.S.R. Investments, Inc. United Water Company Southwestern Public Service Company, a New Mexico corporation Nicollet Holdings Company, LLC Capital Services, LLC Nicollet Project Holdings, LLC Nicollet Projects I, LLC Betcher CSG LLC Foreman’s Hill CSG LLC Grimm CSG LLC Heyer CSG LLC Huneke CSG LLC Johnson I CSG LLC Johnson II CSG LLC Krause CSG LLC RJC I CSG LLC RJC II CSG LLC Scandia CSG LLC School Sisters CSG LLC Webster CSG LLC Nicollet Projects II, LLC WestGas InterState, Inc. Xcel Energy Foundation Xcel Energy Communications Group Inc. Seren Innovations, Inc. Xcel Energy International Inc.* Xcel Energy Markets Holdings Inc. e prime, inc.* Young Gas Storage Company Ltd. Xcel Energy Retail Holdings Inc. Xcel Energy Performance Contracting Inc. Reddy Kilowatt Corporation Xcel Energy Services Inc. Xcel Energy Transmission Holding Company, LLC Xcel Energy Southwest Transmission Company, LLC Xcel Energy Transmission Development Company, LLC Xcel Energy Acorn Transmission, LLC Xcel Energy Birch Transmission, LLC Xcel Energy West Transmission Company, LLC Xcel Energy Venture Holdings, Inc. Energy Impact Fund Investment LLC Xcel Energy Investments, LLC
Northern States Power Company
Cost Assignment and Allocation Manual (CAAM)
Docket No. E002/GR-20-723 Exhibit___(RLB-1), Schedule 3
Page 8 of 57

Xcel Energy Ventures Inc. Eloigne Company Bemidji Townhouse LP Chaska Brickstone LP Crown Ridge Apartments LP Cottage Court LP Dakotah Pioneer LP Edenvale Family Housing LP Fairview Ridge LP Farmington Family Housing LP Farmington Townhome LP Hearthstone Village LP J&D 14-93 LP Lauring Green LP Links Lane LP Lyndale Avenue Townhomes LP Mahtomedi Woodland LP Mankato Townhomes LLP Marvin Garden LP Moorhead Townhomes LP Park Rapids Townhomes LP Rochester Townhome LP Rushford Housing LP Safe Haven Homes, LLC Shade Tree Apartments LP Shakopee Boulder Ridge LP Shenandoah Woods LP Sioux Falls Partners LP St. Cloud Housing LP Tower Terrace LP Xcel Energy Wholesale Group Inc.* Quixx Corporation* Quixx Carolina, Inc.* Quixxlin Corp.* Xcel Energy WYCO Inc. WYCO Development, LLC
* Company is being classified in discontinued operations. ** Minority-ownership ditch and water companies have been excluded.
Northern States Power Company
Cost Assignment and Allocation Manual (CAAM)
Docket No. E002/GR-20-723 Exhibit___(RLB-1), Schedule 3
Page 9 of 57

III. DESCRIPTION OF SERVICES
OVERVIEW
This section provides a description of NSPM’s regulated services and non-regulated business activities. Each description identifies the types of costs associated with the service or business activity, and identifies the business area or department which offers the service.
REGULATED SERVICES
ELECTRIC UTILITY
Electric – Residential
Residential electric service represents the provision of electric service to residential customers within the NSPM service territory. Costs associated with this service relate to the generation or purchase and delivery of electricity through Company-owned transmission and distribution facilities, primarily fuel or purchased power costs, facilities O&M and depreciation costs, and A&G costs. These costs reside within the NSPM Electric Utility.
Electric – Commercial and Industrial
Commercial and industrial electric service represents the provision of electric service to commercial and industrial customers within the NSPM service territory. Costs associated with this service relate to the generation or purchase and delivery of electricity through Company-owned transmission and distribution facilities, primarily fuel or purchased power costs, facilities O&M and depreciation costs, and A&G costs. These costs reside within the NSPM Electric Utility.
Electric – Street Lighting
Street lighting electric service represents the provision of electric service to public authorities for lighting streets, highways, parks and other public places, or for traffic or other signal system service through Company-owned or customer-owned lighting equipment. Costs associated with this service relate to the generation or purchase and delivery of electricity through Company-owned transmission and distribution facilities, primarily fuel or purchased power costs, facilities O&M and depreciation costs, and A&G costs. These costs reside within the NSPM Electric Utility.
Electric – Other Sales to Public Authorities
Other sales to public authorities’ electric service represent the provision of electric service to public authorities under special agreements or contracts. Costs associated with this service relate to the generation or purchase and delivery of electricity through Company-owned transmission and distribution facilities, primarily fuel or purchased power costs, facilities O&M and depreciation costs, and A&G costs. These costs reside within the NSPM Electric Utility.
Northern States Power Company
Cost Assignment and Allocation Manual (CAAM)
Docket No. E002/GR-20-723 Exhibit___(RLB-1), Schedule 3
Page 10 of 57

Electric - Resale
Resale electric service represents the provision of electric service to NSPM wholesale customers or public authorities for resale to end-user customers or to power marketers. Costs associated with this service relate to the generation or purchase and delivery of electricity through Company-owned transmission and distribution facilities, or through facilities owned by third parties, primarily fuel or purchased power costs, facilities O&M and depreciation costs, and A&G costs. These costs reside within the NSPM Electric Utility.
Electric - Interdepartmental
Interdepartmental electric service represents the provision of electric service to NSPM company facilities at tariff rates. Costs associated with providing this service relate to the generation or purchase and delivery of electricity through Company-owned transmission and distribution facilities, primarily fuel or purchased power costs, facilities O&M and depreciation costs, and A&G costs. These costs reside within the NSPM Electric Utility.
Off-System Electric Sales
NSPM sells electricity not required to serve its native load to off-system customers. Costs related to this activity can include fuel and purchased power costs. The revenues associated with these sales reside in FERC account 447, Sales for Resale-Electric. The costs related to this activity reside in FERC accounts 501, Fuel-Steam Generation; 555, Purchased Power; and 565, Transmission of Electricity by Others. In addition, the Company may allocate production O&M and transmission costs based on a percentage of overall sales relative to the type of off-system sales. These costs reside within the NSPM Electric Utility.
OTHER ELECTRIC OPERATING REVENUE
Rent from Electric Property
Rent from electric property results from the leasing of NSPM owned utility property not currently utilized for the provision of regulated services to non-affiliated third parties. Costs related to this service are primarily A&G costs associated with customer billings, as well as rental contract renewals. The revenue associated with the rentals resides in FERC account 454, Rent from Electric Property.
Interchange Agreement
The electric production and transmission costs of the entire NSP System are shared by NSP-Minnesota and NSP-Wisconsin. A FERC-approved Interchange Agreement between the two companies provides for the sharing of all generation and transmission costs of the NSP System based upon demand and energy ratios reflecting usage by the respective companies. The costs associated with this agreement reside in FERC account 557, Other Power Supply Expenses; and FERC 565, Transmission of Electricity by Others. The revenues reside in FERC account 456.1, Revenue from Transmission of Electricity of Others.
Joint Operating Agreement
The Joint Operating Agreement is a margin sharing agreement associated with proprietary energy trading activities. Revenues are recorded in FERC 456, Other Electric Revenues.
Northern States Power Company
Cost Assignment and Allocation Manual (CAAM)
Docket No. E002/GR-20-723 Exhibit___(RLB-1), Schedule 3
Page 11 of 57

Miscellaneous Electric Revenue
In addition to the services detailed above, there are various activities that cannot be accounted for elsewhere, such as utility locating services, scrap metal sales, WindSource, customer connections, and refuse derived fuel incentive. These revenues are recorded in FERC account 456, Other Electric Revenues.
GAS UTILITY
Gas - Residential
Residential gas service represents the provision of natural gas service to residential customers within the NSPM service territory. Costs associated with this service relate to the purchase and delivery of gas through Company-owned facilities, primarily purchased gas, facilities O&M and depreciation costs, and A&G costs. These costs reside within the NSPM Gas Utility.
Gas – Commercial and Industrial
Commercial and industrial gas service represents the provision of natural gas service to commercial and industrial customers within the NSPM service territory. Costs associated with this service relate to the purchase and delivery of gas through Company-owned facilities, primarily purchased gas, facilities O&M and depreciation costs, and A&G costs. These costs reside within the NSPM Gas Utility. The table below shows the various rate classes within commercial and industrial gas services.
Rate Class Maximum
Requirements – Daily Therms
Maximum Requirements – Annual Therms
Small commercial Less than 500 Less than 6,000 Large commercial Less than 500 Greater than 6,000 Small demand billed commercial* Less than 500 Large demand billed commercial* Greater than 500
* Upstream demand costs are billed based on the highest one-day usage in the customer’s history.
Gas – Interruptible
Interruptible gas service represents the provision of natural gas service to interruptible customers within the NSPM service territory. Interruptible service is subject to curtailment when either additional upstream pipeline or local distribution capacity is needed to ensure service to firm customers. Costs associated with this service relate to the purchase and delivery of gas through Company-owned facilities, primarily purchased gas, facilities O&M and depreciation costs, and A&G costs. These costs reside within the NSPM Gas Utility. The table below shows the various rate classes within interruptible gas service.
Rate Class Maximum Requirements – Daily Therms
Small interruptible Less than 2,000 Medium interruptible Greater than 2,000 and less than 50,000 Large interruptible Greater than 50,000
Northern States Power Company
Cost Assignment and Allocation Manual (CAAM)
Docket No. E002/GR-20-723 Exhibit___(RLB-1), Schedule 3
Page 12 of 57

Gas – Large Firm Transportation
Large firm gas transportation service represents the provision of gas delivery service on behalf of end-use customers, third-party suppliers or marketers whereby NSPM transports gas owned by others over NSPM’s gas pipeline system. Costs associated with this service primarily include the facilities O&M and depreciation costs and A&G costs. These costs reside within the NSPM Gas Utility.
Gas – Interruptible Transportation
Interruptible gas transportation service represents the provision of gas delivery service on behalf of end-use customers, third-party suppliers or marketers whereby NSPM transports gas owned by others over NSPM’s gas pipeline system. Interruptible transportation gas service is subject to curtailment when either additional upstream pipeline or the local distribution capacity is needed to ensure service to firm customers. Costs associated with this service primarily include the facilities O&M and depreciation costs and A&G costs. These costs reside within the NSPM Gas Utility.
Gas – Negotiated Transportation
Negotiated firm and interruptible gas transportation service (bypass customers) represents the provision of gas delivery service on behalf of end-use customers, third-party suppliers or marketers whereby NSPM transports gas owned by others over NSPM’s gas pipeline system. Interruptible transportation gas service is subject to curtailment when either additional upstream pipeline or the local distribution capacity is needed to ensure service to firm customers. Costs associated with this service primarily include the facilities O&M and depreciation costs and A&G costs. These costs reside within the NSPM Gas Utility.
Gas – Interdepartmental
Interdepartmental gas service represents the provision of natural gas service or gas transportation service to NSPM company facilities at tariff rates. Costs associated with providing this service relate to the purchase and delivery of gas through NSPM owned facilities, primarily purchased gas, facilities O&M and depreciation costs, and A&G costs. These costs reside within the NSPM Gas Utility.
Gas – Limited Firm
Standby gas service represents on-system back-up propane service for interruptible service customers. Costs associated with this service primarily include propane purchases and the facilities O&M. These costs reside within the NSPM Gas Utility.
Gas – Daily Balancing Service
Daily balancing gas service represents a service to transportation customers that allows them to remedy deviations between nominated and delivered gas and gas consumed by the transportation customer. Costs associated with this service primarily include upstream pipeline costs. These costs reside within the NSPM Gas Utility.
Northern States Power Company
Cost Assignment and Allocation Manual (CAAM)
Docket No. E002/GR-20-723 Exhibit___(RLB-1), Schedule 3
Page 13 of 57

OTHER GAS REVENUE
Miscellaneous Gas Revenue
Various services are provided that cannot be accounted for elsewhere such as propane transportation charges and bundled sales. These revenues are recorded in FERC account 495, Other Gas Revenues.
COMMON ELECTRIC AND GAS REVENUE
Late Payments Fees/Miscellaneous Service Revenues
Revenues from the additional charges imposed because of customers failure to pay their bill by specified due date are recorded into FERC account 450, Electric Forfeited Discounts; and FERC account 487, Gas Forfeited Discounts. Miscellaneous customer related revenue, such as service connections and returned check charges, are recorded in FERC account 451, Miscellaneous Electric Service Revenue; and FERC account 488, Miscellaneous Gas Service Revenues.
CIP Incentives
The CIP Incentive is a mechanism established by an April 7, 2000 Order of the Commission that provides utilities with an incentive to increase cost-effective utility investment in conservation improvement programs beyond the spending levels required by Minnesota Statute. The revenues associated with the CIP incentives are identified by unique accounts and are recorded in FERC account 456, Other Electric Revenues; and FERC 495, Other Gas Revenues. An adjustment is made to remove these revenues from our cost of service study and they do not impact our revenue requirements.
ConnectSmart
NSPM provides a service for customers moving into or across the region to set up utility service and other subscription services to their homes (e.g., newspaper, local and long-distance telephone, cable TV, etc.). NSPM, through its call center, receives telephone requests for this service, and sends these requests, for a fee, to AllConnect (a third-party contractor) for the coordination of installation of services. Costs related to this activity include direct charges for labor, materials and outside services associated with the service provided. In addition, payroll taxes, lost time, facilities, workers’ compensation, incentive, pension, and benefit costs are allocated based on labor dollars, and labor-related overhead and a corporate residual overhead are applied to nonregulated business activities. The revenues and costs associated with this service are identified by unique accounts, and are recorded in FERC 417, Revenues from Nonutility Operations; and FERC 417.1, Expenses from Nonutility Operations. For rate making purposes, in the event this service experiences revenues in excess of direct expenses, an adjustment is made to credit the net impact in FERC 456, Other Electric Operating Revenues, to reflect the benefit of this service to the utility customers.
Hazardous Waste Disposal
NSPM has a Hazardous Waste consolidation facility at Chestnut Service Center in Minneapolis, Minnesota. The facility accepts and consolidates hazardous and specially-regulated waste materials from generating assets, service centers, substations, office buildings, and field operations projects in both NSPM and NSPW service territories. This facility ensures the wastes are properly characterized aggregated and consolidated at approved, permanent and appropriately licensed waste disposal facilities. This facility is also the central collection point for any PCB contaminated electrical equipment.
Northern States Power Company
Cost Assignment and Allocation Manual (CAAM)
Docket No. E002/GR-20-723 Exhibit___(RLB-1), Schedule 3
Page 14 of 57
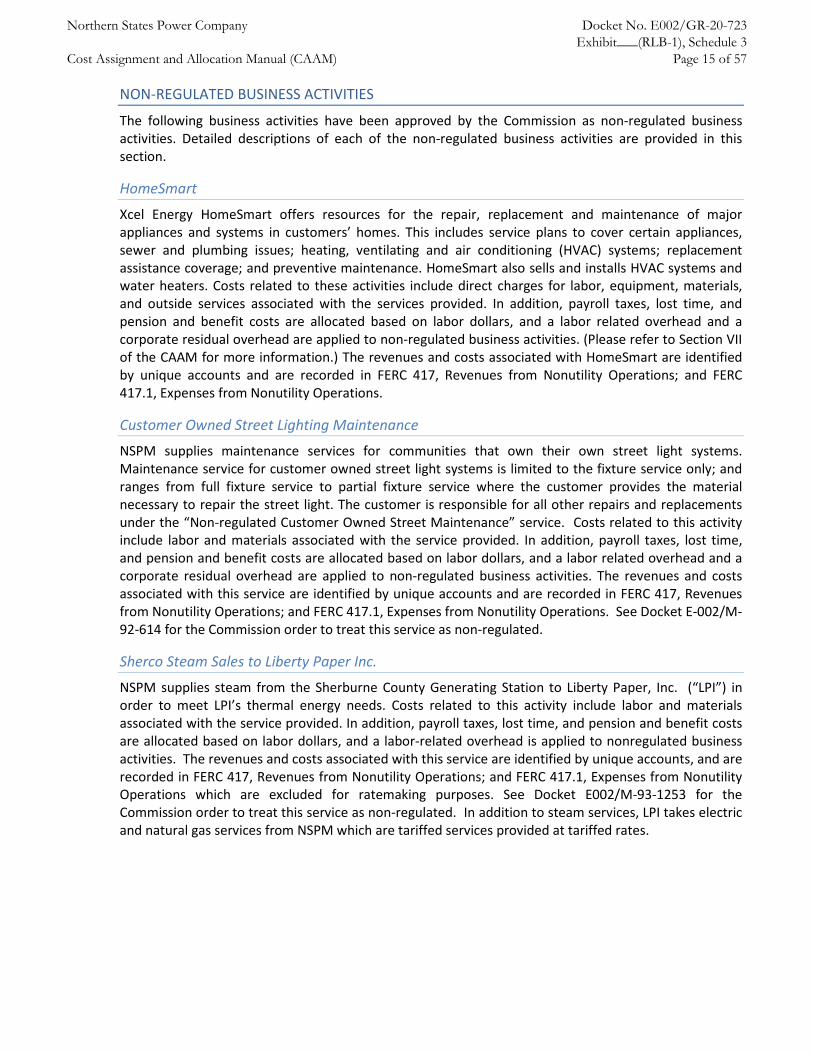
NON-REGULATED BUSINESS ACTIVITIES
The following business activities have been approved by the Commission as non-regulated business activities. Detailed descriptions of each of the non-regulated business activities are provided in this section.
HomeSmart
Xcel Energy HomeSmart offers resources for the repair, replacement and maintenance of major appliances and systems in customers’ homes. This includes service plans to cover certain appliances, sewer and plumbing issues; heating, ventilating and air conditioning (HVAC) systems; replacement assistance coverage; and preventive maintenance. HomeSmart also sells and installs HVAC systems and water heaters. Costs related to these activities include direct charges for labor, equipment, materials, and outside services associated with the services provided. In addition, payroll taxes, lost time, and pension and benefit costs are allocated based on labor dollars, and a labor related overhead and a corporate residual overhead are applied to non-regulated business activities. (Please refer to Section VII of the CAAM for more information.) The revenues and costs associated with HomeSmart are identified by unique accounts and are recorded in FERC 417, Revenues from Nonutility Operations; and FERC 417.1, Expenses from Nonutility Operations.
Customer Owned Street Lighting Maintenance
NSPM supplies maintenance services for communities that own their own street light systems. Maintenance service for customer owned street light systems is limited to the fixture service only; and ranges from full fixture service to partial fixture service where the customer provides the material necessary to repair the street light. The customer is responsible for all other repairs and replacements under the “Non-regulated Customer Owned Street Maintenance” service. Costs related to this activity include labor and materials associated with the service provided. In addition, payroll taxes, lost time, and pension and benefit costs are allocated based on labor dollars, and a labor related overhead and a corporate residual overhead are applied to non-regulated business activities. The revenues and costs associated with this service are identified by unique accounts and are recorded in FERC 417, Revenues from Nonutility Operations; and FERC 417.1, Expenses from Nonutility Operations. See Docket E-002/M-92-614 for the Commission order to treat this service as non-regulated.
Sherco Steam Sales to Liberty Paper Inc.
NSPM supplies steam from the Sherburne County Generating Station to Liberty Paper, Inc. (“LPI”) in order to meet LPI’s thermal energy needs. Costs related to this activity include labor and materials associated with the service provided. In addition, payroll taxes, lost time, and pension and benefit costs are allocated based on labor dollars, and a labor-related overhead is applied to nonregulated business activities. The revenues and costs associated with this service are identified by unique accounts, and are recorded in FERC 417, Revenues from Nonutility Operations; and FERC 417.1, Expenses from Nonutility Operations which are excluded for ratemaking purposes. See Docket E002/M-93-1253 for the Commission order to treat this service as non-regulated. In addition to steam services, LPI takes electric and natural gas services from NSPM which are tariffed services provided at tariffed rates.
Northern States Power Company
Cost Assignment and Allocation Manual (CAAM)
Docket No. E002/GR-20-723 Exhibit___(RLB-1), Schedule 3
Page 15 of 57

InfoWise GX Meter
InfoWise GX Meter is an energy management reporting solution with customized data for businesses to help manage and control their energy use. This product consists of unique interactive reports with detailed information, including both consumption and demand levels, to help the customer pinpoint and analyze their facility’s energy use. By analyzing past energy use, this product can help drive company green strategies while helping customize a strategic business plan for facility managers, as well as deliver a bill estimator tool that keeps track of budgets and identifies cost saving opportunities. Costs related to this activity include direct charges for labor, materials and outside services associated with the service provided. In addition, payroll taxes, lost time, facilities, workers’ compensation, incentive and pension and benefits are allocated based on labor dollars, and a labor-related overhead and a corporate residual overhead are applied to nonregulated business activities. The revenues and costs associated with this service are identified by unique SAP Cost Centers, and are recorded in FERC accounts 417, Revenues from Nonutility Operations, and 417.1, Expenses from Non-utility Operations.
Northern States Power Company
Cost Assignment and Allocation Manual (CAAM)
Docket No. E002/GR-20-723 Exhibit___(RLB-1), Schedule 3
Page 16 of 57

IV. TRANSACTIONS WITH AFFILIATES
OVERVIEW
NSPM directly incurs and pays for the majority of its costs, there are, however, services provided to NSPM by other affiliates within the Xcel Energy system of companies. In addition, NSPM provides a limited amount of operations, maintenance, and management advisory services to its affiliates. NSPM has numerous Affiliated Interest Agreements that have been approved by the Commission. The sections below separately detail the nature and terms of transactions for services and asset transfers provided by NSPM to its affiliates, as well as services and asset transfers provided to NSPM by each of its affiliates. This section includes descriptions of affiliate transactions only and does not include convenience payments. The cost allocation methodologies under which the Service Company costs are assigned and allocated are set forth in the service agreement, and while they are not the subject of this NSPM CAAM, they are included in this section to provide as complete a picture as possible of all affiliate transactions. The NSPM Service Agreement is reviewed and filed annually with the Commission. The last filing was approved in Docket E,G002/AI-19-371 on July 10, 2019. NSPM’s affiliate transactions consist primarily of transactions with the Service Company for administrative, management, accounting, legal, engineering, environmental, and other support services.
Terms of Transactions
Tariff Rate – the price charged to customers under applicable tariffs on file with federal or state regulatory commissions. Tariff rates are used for transactions with affiliates involving the provision of regulated services. Fully Distributed Cost – the term fully distributed cost means that transactions billed include all direct and indirect costs, including overheads. Affiliate transactions billed by NSPM include labor related overheads and a working capital fee when appropriate. This method of assigning and allocating costs to these affiliate transactions ensures that the payments to or by NSPM are reasonable and have not resulted in any ratepayer subsidization. In the table below, fully distributed cost may also refer to a price established in a separate Affiliated Interest Agreement. NSPM applies a labor related overhead to services provided by NSPM to affiliates and also applies a working capital fee on services NSPM provides to non-NSPM company affiliates. Both the labor related overhead and the working capital fees are discussed in Section VII. The remainder of this section is detailed by affiliate. Affiliates may be listed under the “Services Provided by NSPM to Affiliates” section and/or the “Services Provided by Affiliates to NSPM” section. The details relating to the nature, frequency, and terms of the affiliate transactions are itemized for NSPM and each affiliate.
Northern States Power Company
Cost Assignment and Allocation Manual (CAAM)
Docket No. E002/GR-20-723 Exhibit___(RLB-1), Schedule 3
Page 17 of 57

SERVICES PROVIDED BY NSPM TO AFFILIATES
Nature of Transactions Terms
NSPW
O&M – production, decommissioning, and transmission costs associated with the Interchange Agreement (FERC Docket No. ER15-1575-000).
Fully distributed cost
SCADA and Gas Dispatch – sharing of SCADA costs in accordance with Docket G-002/AI-94-831.
Fully distributed cost
Materials and Supplies – materials and supplies, including any associated freight, purchase loadings, and warehouse loadings.
Fully distributed cost
Miscellaneous – miscellaneous other charges, including labor, associated loadings, and lease costs.
Fully distributed cost
PSCo
Materials and Supplies – materials and supplies, including any associated freight, purchase loadings, and warehouse loadings.
Fully distributed cost
Joint Operating Agreement – margin sharing associated with proprietary energy trading activities.
Fully distributed cost
Miscellaneous – miscellaneous other charges, including labor, associated loadings, and lease costs.
Fully distributed cost
SPS
Materials and Supplies – materials and supplies, and any associated freight, purchase loadings, and warehouse loadings.
Fully distributed cost
Joint Operating Agreement – margin sharing associated with proprietary energy trading activities.
Fully distributed cost
Miscellaneous – miscellaneous other charges, including labor and associated loadings and lease costs.
Fully distributed cost
Northern States Power Company
Cost Assignment and Allocation Manual (CAAM)
Docket No. E002/GR-20-723 Exhibit___(RLB-1), Schedule 3
Page 18 of 57

Xcel Energy Inc.
Miscellaneous - miscellaneous other charges, including 401(k) match and a dividend on common stock.
Fully distributed cost
SERVICES PROVIDED BY AFFILIATES TO NSPM
Nature of Transactions Terms
Xcel Energy Services Inc.
Executive Management Services* – represents charges for executive management services, including, but not limited to, officers of Xcel Energy.
Fully distributed cost
Investor Relations* – provides communications to investors and the financial community. Coordinates the transfer agent and shareholder record keeping functions and plans the annual shareholder meeting.
Fully distributed cost
Internal Audit & Risk* – reviews internal controls and procedures to ensure assets are safeguarded and transactions are properly authorized and recorded. Evaluates contract risks and trading risks.
Fully distributed cost
Legal* – provides legal services related to labor and employment law, litigation, contracts, rates and regulation, environmental matters, real estate, and other legal matters.
Fully distributed cost
Claims Services* – provides claims services related to casualty, public, and company claims.
Fully distributed cost
Corporate Communications* – provides corporate communications, speech writing, and coordinates media services. Provides advertising and branding development for the companies within the Xcel Energy system. Manages and tracks all charitable contributions made on behalf of the Xcel Energy system.
Fully distributed cost
Employee Communications* – develops and distributes communications to employees.
Fully distributed cost
Corporate Strategy & Business Development* – facilitates development of corporate strategy and prepares strategic plans, monitors corporate performance, and evaluates
Fully distributed cost
Northern States Power Company
Cost Assignment and Allocation Manual (CAAM)
Docket No. E002/GR-20-723 Exhibit___(RLB-1), Schedule 3
Page 19 of 57

business opportunities. Develops and facilitates process improvements. Government Affairs* – monitors, reviews and researches government legislation.
Fully distributed cost
Facilities & Real Estate* – operates and maintains office buildings and service centers. Procures real estate and administers real estate leases. Administers contracts to provide security, housekeeping and maintenance services for such facilities. Procures office furniture and equipment.
Fully distributed cost
Facilities Administrative Services* – includes but is not limited to the functions of mail delivery, duplicating, and records management.
Fully distributed cost
Supply Chain*– includes contract negotiations, development and management of supplier relationships and acquisition of goods and services. Also includes inventory planning and forecasting, ordering, accounting, and database management. Warehousing services includes receiving, storing, issuing, shipping, returns, and distribution of material and parts.
Fully distributed cost
Supply Chain Special Programs* – develops and implements special programs utilized across Xcel Energy such as procurement cards, travel services, and compliance with corporate MWBE (minority women business expenditures) program goals.
Fully distributed cost
Human Resources* – establishes and administers policies related to employment, compensation, and benefits. Maintains HR computer system, the tuition reimbursement plan, and diversity program. Coordinates the bargaining strategy and labor agreements with union employees. Provides technical and professional development training and general HR support services.
Fully distributed cost
Finance & Treasury* – coordinates activities related to securities issuances, including maintaining relationships with financial institutions, cash management, investing activities, and monitoring the capital markets. Performs financial and economic analysis.
Fully distributed cost
Accounting, Financial Reporting & Taxes* – maintains financial books and records. Prepares financial and statistical reports, tax filings, and ensures compliance with the applicable laws and regulations. Maintains the
Fully distributed cost
Northern States Power Company
Cost Assignment and Allocation Manual (CAAM)
Docket No. E002/GR-20-723 Exhibit___(RLB-1), Schedule 3
Page 20 of 57
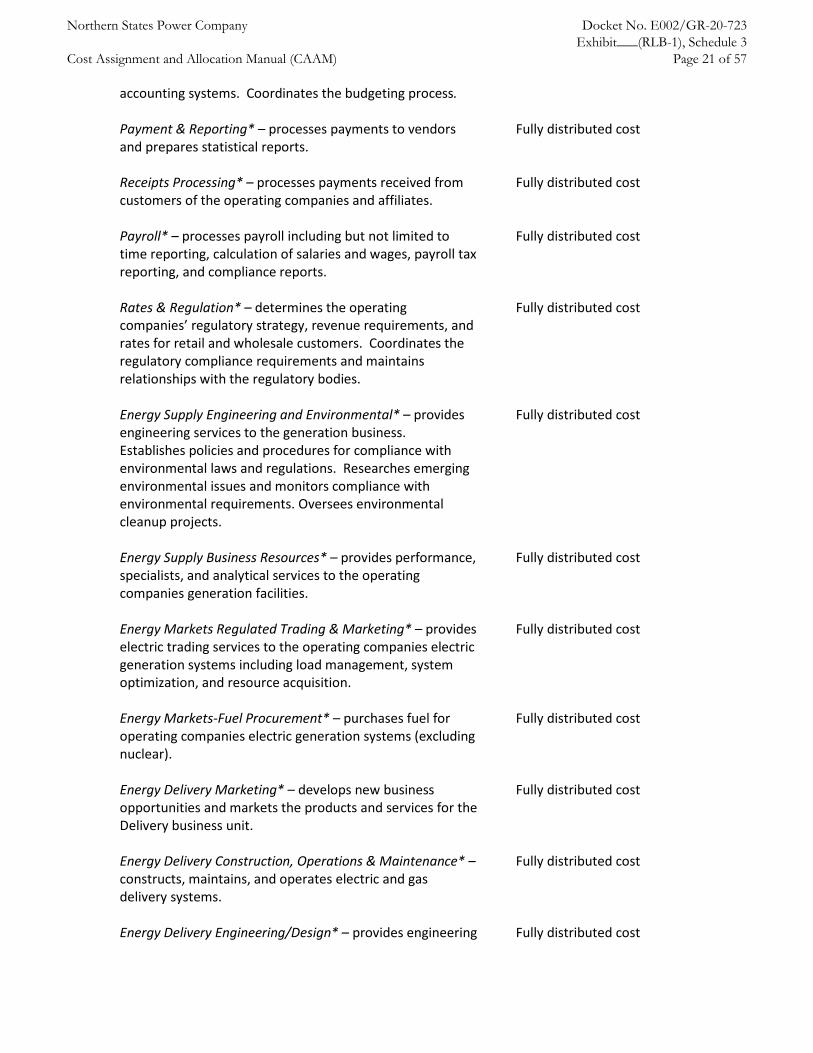
accounting systems. Coordinates the budgeting process.
Payment & Reporting* – processes payments to vendors and prepares statistical reports.
Fully distributed cost
Receipts Processing* – processes payments received from customers of the operating companies and affiliates.
Fully distributed cost
Payroll* – processes payroll including but not limited to time reporting, calculation of salaries and wages, payroll tax reporting, and compliance reports.
Fully distributed cost
Rates & Regulation* – determines the operating companies’ regulatory strategy, revenue requirements, and rates for retail and wholesale customers. Coordinates the regulatory compliance requirements and maintains relationships with the regulatory bodies.
Fully distributed cost
Energy Supply Engineering and Environmental* – provides engineering services to the generation business. Establishes policies and procedures for compliance with environmental laws and regulations. Researches emerging environmental issues and monitors compliance with environmental requirements. Oversees environmental cleanup projects.
Fully distributed cost
Energy Supply Business Resources* – provides performance, specialists, and analytical services to the operating companies generation facilities.
Fully distributed cost
Energy Markets Regulated Trading & Marketing* – provides electric trading services to the operating companies electric generation systems including load management, system optimization, and resource acquisition.
Fully distributed cost
Energy Markets-Fuel Procurement* – purchases fuel for operating companies electric generation systems (excluding nuclear).
Fully distributed cost
Energy Delivery Marketing* – develops new business opportunities and markets the products and services for the Delivery business unit.
Fully distributed cost
Energy Delivery Construction, Operations & Maintenance* – constructs, maintains, and operates electric and gas delivery systems.
Fully distributed cost
Energy Delivery Engineering/Design* – provides engineering Fully distributed cost
Northern States Power Company
Cost Assignment and Allocation Manual (CAAM)
Docket No. E002/GR-20-723 Exhibit___(RLB-1), Schedule 3
Page 21 of 57

and design services in support of capacity planning, construction, operations, and materials standards.
Marketing & Sales* – provides marketing and sales services for the operating companies and affiliates for their electric and natural gas customers including strategic planning, segment identification, business analysis, sales planning, and customer service.
Fully distributed cost
Customer Service* – provides service activities to retail and wholesale customers. These services include meter reading, customer billing, call center, and credit and collections.
Fully distributed cost
Aviation Services* – provides aviation and travel services to employees.
Fully distributed cost
Fleet* – oversees the Utility subsidiaries Fleet Services business unit.
Fully distributed cost
Business Systems* – provides basic information technology services such as: application management, voice and data network operations and management, customer support services, problem management services, security administration, and systems management. In addition, Business Systems acts as a single point of contact for delivery of all information technology services to Xcel Energy. Business Systems partner with vendors to ensure the delivery of benchmarking, continuous improvement, and leadership around strategic initiatives and key developments in the marketplace.
Fully distributed cost
* Corporate Governance activities within this service function will be allocated using the average of the revenue ratio with intercompany dividends assigned to Xcel Energy Inc., full time equivalent hours including overtime, and the total assets ratio including Xcel Energy Inc.’s per book assets.
Northern States Power Company
Cost Assignment and Allocation Manual (CAAM)
Docket No. E002/GR-20-723 Exhibit___(RLB-1), Schedule 3
Page 22 of 57

V. COST ASSIGNMENT AND ALLOCATION PROCESS
OVERVIEW
This section of the CAAM provides an overview of the cost assignment and allocation principles of NSPM and the accounting processes within the monthly accounting close and within the general ledger, including both system generated processes and manual processes, used to assign and allocate costs between the regulated services and the non-regulated business activities of NSPM. Each major step of the accounting process is identified in the following paragraphs and will be explained in conjunction with the process flowchart of this section. Each major step results in costs being either directly assigned or allocated to regulated services and non-regulated business activities. The result of applying these principles is that each company, utility, jurisdiction and non-regulated business activity pays the full cost for any service provided to support their respective operations. Many of the assignment and allocation processes occur in the Service Company or are administered by Service Company personnel. As noted in the Introduction, the Service Company provides services “at cost” to the Utility subsidiaries and affiliate companies. The processes discussed in this section are integral to the financial books and records of NSPM and are included to provide a comprehensive picture.
COST ASSIGNMENT AND ALLOCATION PRINCIPLES
NSPM applies the following cost assignment and allocation principles. The cost assignment and allocation approach is a fully distributed costing method as approved by the Commission in NSPM’s electric and gas rates cases (E002/GR-92-1185, G002/GR-92-1186 and G002/GR-97-1606) and the Commission September 28, 1994 Order in Docket G, E-999/CI-90-1008. The hierarchical cost assignment and allocation principles are:
I. Tariffed rate shall be used to value tariffed services provided. II. Costs shall be directly assigned to either regulated or non-regulated business activities
whenever possible. III. Costs that cannot be directly assigned to either regulated or non-regulated activities or
jurisdictions will be described as common costs. Common costs shall be grouped into homogeneous cost categories designed to facilitate the proper allocation of costs between regulated and non-regulated activities or jurisdictions in accordance with the following principles: a. Cost causation. All activities or jurisdictions that cause the cost to be incurred shall
be allocated a portion of that cost. Direct assignment of a cost is preferred to the extent that the cost can be traced to the specific activity or jurisdiction.
b. Variability. If the fully distributed cost study indicates a direct correlation exists between a change and the incurrence of a cost and cost causation, that cost shall be allocated based upon that relationship.
Northern States Power Company
Cost Assignment and Allocation Manual (CAAM)
Docket No. E002/GR-20-723 Exhibit___(RLB-1), Schedule 3
Page 23 of 57
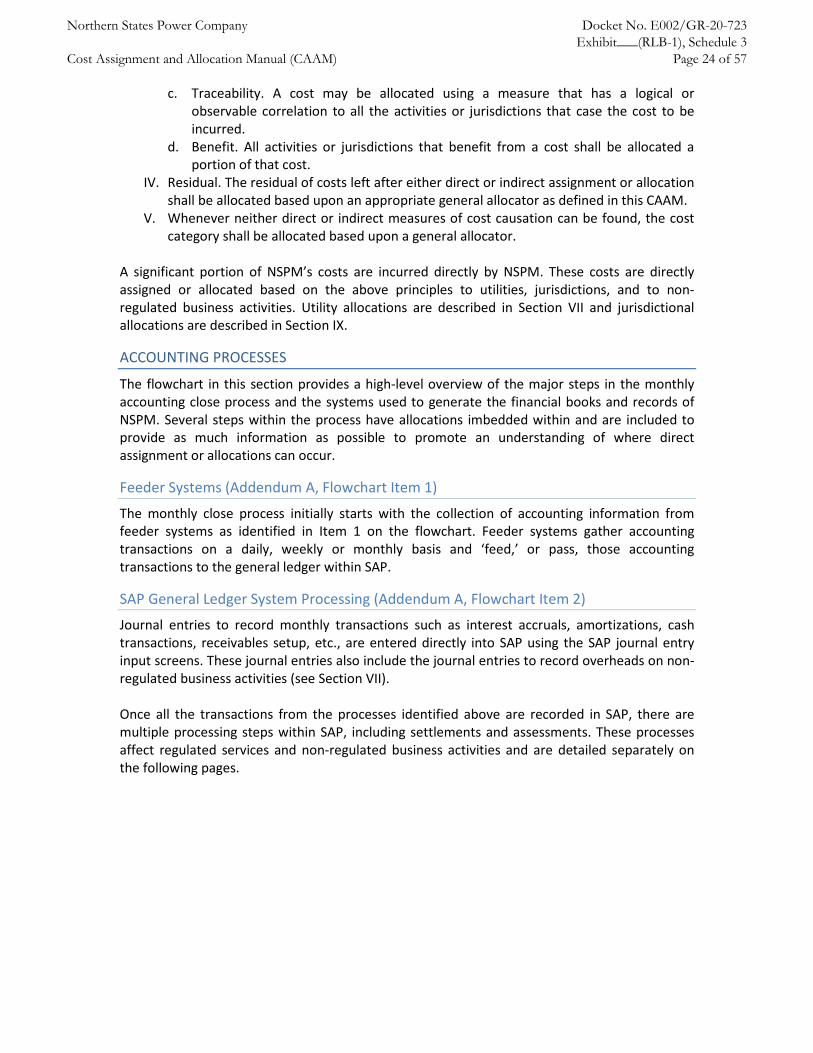
c. Traceability. A cost may be allocated using a measure that has a logical or observable correlation to all the activities or jurisdictions that case the cost to be incurred.
d. Benefit. All activities or jurisdictions that benefit from a cost shall be allocated a portion of that cost.
IV. Residual. The residual of costs left after either direct or indirect assignment or allocation shall be allocated based upon an appropriate general allocator as defined in this CAAM.
V. Whenever neither direct or indirect measures of cost causation can be found, the cost category shall be allocated based upon a general allocator.
A significant portion of NSPM’s costs are incurred directly by NSPM. These costs are directly assigned or allocated based on the above principles to utilities, jurisdictions, and to non-regulated business activities. Utility allocations are described in Section VII and jurisdictional allocations are described in Section IX.
ACCOUNTING PROCESSES
The flowchart in this section provides a high-level overview of the major steps in the monthly accounting close process and the systems used to generate the financial books and records of NSPM. Several steps within the process have allocations imbedded within and are included to provide as much information as possible to promote an understanding of where direct assignment or allocations can occur.
Feeder Systems (Addendum A, Flowchart Item 1)
The monthly close process initially starts with the collection of accounting information from feeder systems as identified in Item 1 on the flowchart. Feeder systems gather accounting transactions on a daily, weekly or monthly basis and ‘feed,’ or pass, those accounting transactions to the general ledger within SAP.
SAP General Ledger System Processing (Addendum A, Flowchart Item 2)
Journal entries to record monthly transactions such as interest accruals, amortizations, cash transactions, receivables setup, etc., are entered directly into SAP using the SAP journal entry input screens. These journal entries also include the journal entries to record overheads on non-regulated business activities (see Section VII). Once all the transactions from the processes identified above are recorded in SAP, there are multiple processing steps within SAP, including settlements and assessments. These processes affect regulated services and non-regulated business activities and are detailed separately on the following pages.
Northern States Power Company
Cost Assignment and Allocation Manual (CAAM)
Docket No. E002/GR-20-723 Exhibit___(RLB-1), Schedule 3
Page 24 of 57

Settlements and Assessments (Addendum A, Flowchart Item 3)
All costs identified as billable are processed using the settlement and/or assessment processes of the SAP system. These processes bill transactions from the legal entity that performed the service to the legal entity that received or is responsible for the service. This process captures:
• Service Company direct and allocated billings of all its costs to affiliated interests; • Direct billings between a utility subsidiary and an affiliated interest other than the
Service Company which are often referred to as intercompany charges or billings; and • Direct billings between business areas within a legal entity.
For example, the settlements process will settle Service Company labor to the affiliated company if the labor is a direct charge or it will send the charges to an ACC if the charge is to be allocated. The assessment process will then clear the ACC by allocating the charges using an approved method of allocation to the legal entities to which the employee is providing services along with the appropriate labor and labor-related overheads. Transactions between affiliates (excluding XES) are direct charges, as are charges from one business area to another business area (for example, charges from the Distribution Operations business area to the Energy Supply business area). After the settlements and assessment processes are completed, all costs reside on the books of the legal entity ultimately responsible for the charge in the appropriate FERC account.
Business View (Addendum A Flowchart Item 4)
The business view of the SAP general ledger provides a GAAP view of the accounting transactions necessary to prepare SEC financial statements and other GAAP financial reports as well as the information necessary for the business areas to manage the business.
FERC Account Data Prior to Utility and Non-Regulated Allocations (Addendum A Flowchart Item 5)
At the same time that the business view is available, the pre-allocated FERC view of the SAP general ledger is available. The following utility allocations and non-regulated allocations are necessary for common costs to be allocated to the gas, electric, and non-regulated businesses.
Northern States Power Company
Cost Assignment and Allocation Manual (CAAM)
Docket No. E002/GR-20-723 Exhibit___(RLB-1), Schedule 3
Page 25 of 57

Utility Allocations and Non-regulated Allocations (Addendum A, Flowchart Item 6)
NSPM’s costs are directly assigned or allocated to electric, gas, or non-regulated business activities whenever possible. When charges can’t be directly assigned, they are charged as common and then allocated to the electric and gas utilities using utility allocations. Common utility costs are grouped into two categories: (1) O&M utility allocations and (2) rate base and non-O&M utility allocations. These allocations are performed monthly within the SAP system and are described in Section VII. In addition to the costs directly assigned to the non-regulated business activities from the Service Company and within NSPM, the non-regulated business activities are charged with a labor related overhead and an allocation of corporate costs. See Section VIII for additional information related to non-regulated business activities. All costs that can be directly assigned or allocated to the electric or gas utility operations or to the non-regulated business activities are appropriately accounted for in the books and records of NSPM before jurisdictional allocations occur. A study is performed annually, and as required for rate case filing purposes, to identify all rate base and non-O&M costs that are common among the jurisdictions of NSPM (Minnesota, North Dakota, and South Dakota). These costs are then allocated among the jurisdictions according to the allocations described in Section IX.
Regulatory Books and Records (Addendum A Flowchart Item 7)
After all the above processes are complete, the result is the FERC financial books and records of NSPM.
Rate Case Cost of Service Study (Addendum A Flowchart Item 8)
The FERC books and records are the starting point for the preparation of a cost of service study that will be used in a gas or electric rate case filing.
Northern States Power Company
Cost Assignment and Allocation Manual (CAAM)
Docket No. E002/GR-20-723 Exhibit___(RLB-1), Schedule 3
Page 26 of 57

ADDENDUM A – PROCESS FLOWCHART
FERC Account Data Prior to Utility and Non-regulated Activity Allocations
Utility Allocations Non-regulated Allocations
Regulatory Books
Feeder Systems
Business View
SAP G/L Processing
Item 1 – Feeder Systems • Labor Distribution • Accounts Payable • Money Pool • Customer Billing • Fixed Asset Ledger
Item 2 – SAP general ledger system processing
Item 3 – Settlements and Assessments • Labor Overheads • Aviation Distribution • Stores/Warehouse Overheads • Purchasing Overheads • Fleet Distribution • Information Technology • Shared Asset Distribution • Facilities Distribution • Engineering & Supervision • Capital A&G
Item 6 – Utility Allocations and Non- regulated allocations
Rate Case Cost of Service Study - RIS
Settlements and Assessments
Item 4 – Business View
Item 5 – FERC account data prior to Utility and Non-regulated activity allocations
Item 7 – Regulated books and records
Item 8 – Rate case cost of service study - Rate Information System (“RIS”)
Northern States Power Company
Cost Assignment and Allocation Manual (CAAM)
Docket No. E002/GR-20-723 Exhibit___(RLB-1), Schedule 3
Page 27 of 57

Feeder and Overhead System Detail
LABOR DISTRIBUTION
Description: Wages and salaries of employees engaged in work on behalf of
regulated services and non-regulated activities are assigned or allocated based on positive time reporting through the labor distribution system. Positive time reporting requires each employee to report the hours worked for each day using one-tenth of an hour or greater increments, while providing for aggregation of time when appropriate. Under this method, employees’ time is reported on the basis of accounting codes related to specific operating utility companies or affiliates and/or functional services.
Provider of Service: Service Company Operating companies or affiliates User of Service: Operating companies or affiliates, including utility operations,
jurisdictions, and non-regulated activities within an operating company.
Method of Allocation: All bi-weekly and semi-monthly employees’ labor expenses are
recorded by company personnel on time sheets and entered into the time reporting system, which feeds into the labor distribution system. The employee submitting the time sheet is responsible for coding the internal order numbers to charge the appropriate operating companies or affiliates, business function (e.g., capital, operations, maintenance, clearing, purchasing and/or warehousing, etc.) and regulated or non-regulated operations.
Time must be completed and submitted for review and approval by
certain cut-off dates established by the Payroll Department. The employee’s supervisor or manager is responsible for reviewing and approving all time entries and verifying that the employee is using the correct accounting.
The labor distribution system used for bi-weekly employees
includes the distribution of actual paid and accrued labor dollars/hours to the internal order number charged based on the hours worked. Accrual of payroll is to facilitate the recording of labor costs on a calendar month basis. This includes any reversal of the prior month’s accrual. The charge of labor dollars for semi-monthly employees to internal order numbers is based on a distribution of the monthly salary of the employee.
Northern States Power Company
Cost Assignment and Allocation Manual (CAAM)
Docket No. E002/GR-20-723 Exhibit___(RLB-1), Schedule 3
Page 28 of 57

LABOR OVERHEADS
Description: Employee labor overhead costs are captured in the following
categories:
Benefit employees: • Non-productive labor costs (vacation, sick, holiday, etc.) • Pension and Insurance (401k match, retirement related
consulting, active healthcare, life and LTD insurance premiums, miscellaneous benefit programs and LTD benefits for former or inactive employees before retirement, as well as the service cost portion of qualified pension, non-qualified pension and retiree healthcare)
• Benefits Non-Service (non-service cost portion of qualified pension, non-qualified pension and retiree healthcare)
• Workers compensation (FAS 112 actuarial cost and insurance premiums)
• Incentives (Incentives are a labor overhead for Service Company, PSCo, and SPS. Incentives for NSPM and NSPW are charged directly to FERC accounts 920 and 517).
• Payroll taxes (FICA, FUTA, SUTA) • Labor and expense of the Human Resource Service Center
Non-Benefit employees: • Payroll taxes (FICA, FUTA, SUTA) • Workers compensation
Provider of Service: Service Company Operating companies or affiliates
User of Service: Operating companies or affiliates, including utility operations, jurisdictions, and non-regulated activities within an operating company.
Method of Allocation: Labor overheads are allocated within a legal entity by calculating a separate loading rate for each cost category identified in the “Description” section above.
For each legal entity and each category, the costs are allocated based on a single-factor formula that is comprised of total estimated costs for the category divided by total estimated productive labor costs. Legal entity specific rates for each category are applied to productive labor charges as appropriate for each resource type. Labor loadings applied to labor charges follow the labor charges. For example, Service Company labor overheads follow Service Company labor and NSPM labor overheads follow NSPM labor.
Northern States Power Company
Cost Assignment and Allocation Manual (CAAM)
Docket No. E002/GR-20-723 Exhibit___(RLB-1), Schedule 3
Page 29 of 57

AVIATION DISTRIBUTION
Description: The Aviation Services department in the Service Company is
responsible for managing and operating the two corporate leased aircraft used by the Xcel Energy. Costs include: pilot salaries including labor overheads, O&M costs, lease costs, and A&G costs associated with managing the Aviation Services department.
Provider of Service: Service Company User of Service: Service Company, operating companies or affiliates, including
utility operations, jurisdictions, and non-regulated activities within an operating company.
Method of Allocation: Aviation costs are allocated using the average of the Revenue Ratio
with intercompany dividends assigned to Xcel Energy Inc., Full Time Equivalent Hours Including Overtime, and the Total Assets Ratio including Xcel Energy Inc.’s per book assets.
Any spousal use of the aircraft must be approved and is billed to
Xcel Energy Inc.
Northern States Power Company
Cost Assignment and Allocation Manual (CAAM)
Docket No. E002/GR-20-723 Exhibit___(RLB-1), Schedule 3
Page 30 of 57

STORES/WAREHOUSE OVERHEAD
Description: Inventory warehousing costs, including labor, supervision,
materials and supplies are allocated through pools to the business areas as an overhead on materials and supplies as materials and supplies are issued from/returned to a storeroom or warehouse.
Provider of Service: Service Company Operating companies User of Service: Operating companies or affiliates, including utility operations,
jurisdictions, and non-regulated activities within an operating company.
Method of Allocation: The overhead costs for inventory items as noted above and
associated adjustments are accumulated within the Supply Chain warehouse ACC’s. These accumulated overhead costs are allocated to material issuances/returns from the storeroom. Costs are collected in ACC’s on the Service Company and Operating Companies; then cleared using a warehouse overhead loading based on a costing sheet, cost element and AP document type criterion.
Northern States Power Company
Cost Assignment and Allocation Manual (CAAM)
Docket No. E002/GR-20-723 Exhibit___(RLB-1), Schedule 3
Page 31 of 57
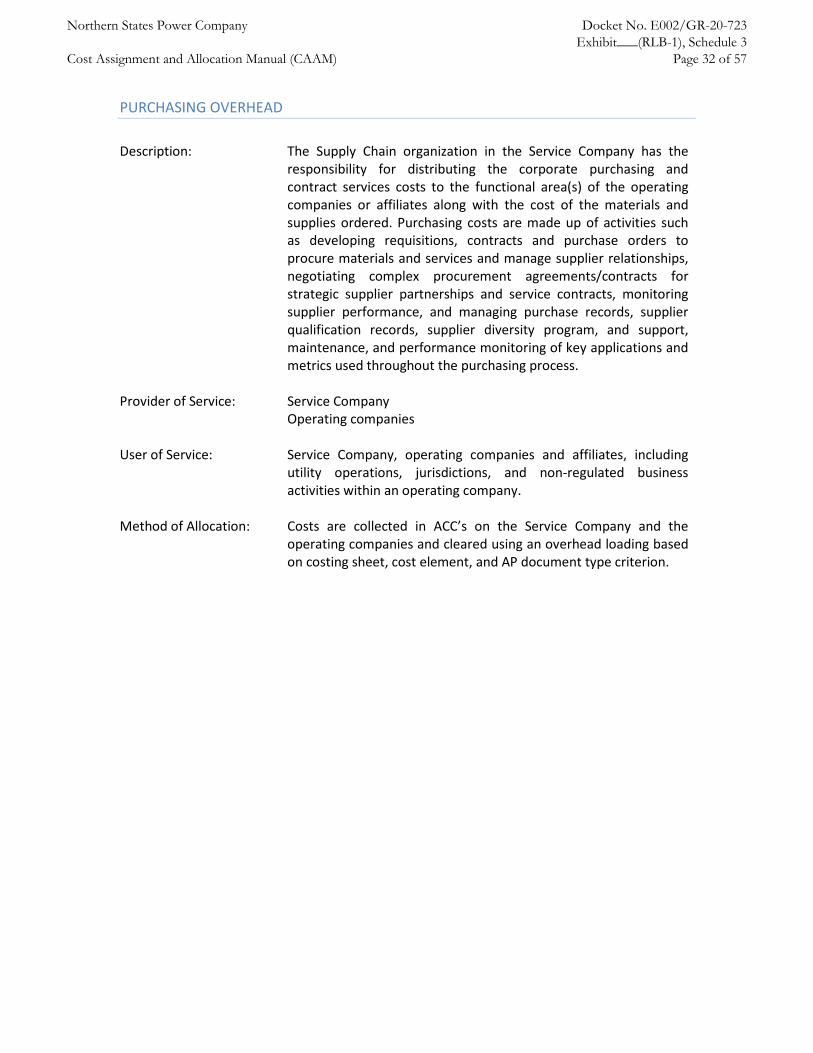
PURCHASING OVERHEAD
Description: The Supply Chain organization in the Service Company has the
responsibility for distributing the corporate purchasing and contract services costs to the functional area(s) of the operating companies or affiliates along with the cost of the materials and supplies ordered. Purchasing costs are made up of activities such as developing requisitions, contracts and purchase orders to procure materials and services and manage supplier relationships, negotiating complex procurement agreements/contracts for strategic supplier partnerships and service contracts, monitoring supplier performance, and managing purchase records, supplier qualification records, supplier diversity program, and support, maintenance, and performance monitoring of key applications and metrics used throughout the purchasing process.
Provider of Service: Service Company Operating companies User of Service: Service Company, operating companies and affiliates, including
utility operations, jurisdictions, and non-regulated business activities within an operating company.
Method of Allocation: Costs are collected in ACC’s on the Service Company and the
operating companies and cleared using an overhead loading based on costing sheet, cost element, and AP document type criterion.
Northern States Power Company
Cost Assignment and Allocation Manual (CAAM)
Docket No. E002/GR-20-723 Exhibit___(RLB-1), Schedule 3
Page 32 of 57

FLEET DISTRIBUTION
Description: The Fleet Services department in the Service Company is responsible for managing the fleet assets owned by the operating companies. Fleet assets are vehicle units that are organized into fleet work centers, which group together vehicles similar in nature for a specific business function within an Operating Company. .
The SAP Work Manager records the utilization of our fleet assets and allocates the cost to the business areas of operating companies and affiliates for the costs of using vehicles or associated equipment using fleet activity rates based on work centers.
Fleet costs included in the calculation of the monthly billing rate include: licensing taxes and fees, lease costs, material and labor costs for maintenance and repair, fuel, labor loadings, and overhead for overall management of the Fleet Services department that includes labor, facilities, insurance, utilities, computers, phones, and office supplies.
Provider of Service: Service Company Operating companies
User of Service: Service Company, operating companies or affiliates, including utility operations, jurisdictions and non-regulated business activities within an operating company.
Method of Allocation: Costs are collected in ACC’s on the Service Company and operating companies which are cleared using an overhead fleet rate based on the weighted vehicle type to the respective business area.
Northern States Power Company
Cost Assignment and Allocation Manual (CAAM)
Docket No. E002/GR-20-723 Exhibit___(RLB-1), Schedule 3
Page 33 of 57

INFORMATION TECHNOLOGY
Description: The Business Systems organization in the Service Company is
responsible for managing the corporate IT assets and services of Xcel Energy. Business Systems bills out O&M and capital costs related to Xcel Energy’s corporate IT equipment and services incurred internally, as well as costs incurred through third party vendors. Costs include system O&M, desktop services, phone service, servers, infrastructure costs, software, software licensing, system design and implementation, labor and labor overheads, etc.
Provider of Service: Service Company User of Service: Service Company, operating companies, or affiliates, including
utility operations, jurisdictions and non-regulated activities within an operating company.
Method of Allocation: IT costs are charged through several different methods. Costs are charged directly to the operating companies, affiliates,
jurisdictions or non-regulated activities on the invoice, timesheet, expense report or other source document to the company(ies) benefiting from the service whenever possible.
If costs cannot be charged directly to an operating company,
affiliate, jurisdiction or non-regulated activity, the costs are charged to the appropriate Service Company indirect ACC that will assign the costs using a cost causative method to the companies benefiting from the system, application, or service.
For costs that can be identified as benefiting a particular service
function, those services would be charged to a Service Company indirect ACC using the approved allocation factor for that business area.
If an indirect ACC cannot be identified that would assign costs in a
cost causative method, a new indirect ACC will be created. However, if the project will be in-serviced within one year and if O&M costs will be less than $250,000 in total for the project, an internal order will be used to assign costs using a cost causative method to the companies benefiting from the system, application, or service.
Northern States Power Company
Cost Assignment and Allocation Manual (CAAM)
Docket No. E002/GR-20-723 Exhibit___(RLB-1), Schedule 3
Page 34 of 57

ACCOUNTS PAYABLE
Description: The Payment and Reporting Department (Accounts Payable), in the Service Company, processes several types of documents for payment on behalf of the operating companies and affiliates. Accounts Payable uses SAP to process invoice payments associated with purchase orders, contracts, requests for payment (non-purchase orders, non-contract invoices) and employee payments, including per diem charges, suggestion system award payments and employee expense reimbursements.
The charges for goods, materials and services, which post directly to the general ledger of each operating company and affiliate, differ for each type of document.
Provider of Service: Service Company
User of Service: Service Company, operating companies and affiliates, including utility operations, jurisdictions, and non-regulated activities within an operating company.
Method of Allocation: Within each operating company and affiliate, charges are directly assigned whenever possible. Charges may be distributed to multiple business functions or business areas based on the accounting code(s) on each document. If necessary, costs may be allocated using any surrogate measure that has a logical or observable correlation to the charges in the quantities sold, the services that caused the cost to be incurred or that benefited from the cost. The following are examples of some of the logical or observable correlations used to allocate costs contained on Accounts Payable documents:
• Quantity (units, count, etc.)• Measurement or size (length, space, columnar inch, etc.)• Volume (barrels, gallons, liters, etc.)• Weight (ounce, pound, ton, etc.)• Hours (hours of professional or contract services)• Labor dollars (charge is in the same proportion as the labor
hours of the department)• Number of customers, meters, employees, etc.• Revenue dollars• Plant in service• Square footage
Northern States Power Company
Cost Assignment and Allocation Manual (CAAM)
Docket No. E002/GR-20-723 Exhibit___(RLB-1), Schedule 3
Page 35 of 57

SHARED ASSETS DISTRIBUTION
Description: Shared assets are defined as capitalized assets that are owned by one legal entity but are used for the benefit of multiple entities. This would include land structures and improvements, office furniture and equipment, computer and communication equipment, and some software systems that are used by employees in the performance of their jobs.
Provider of Service: Operating companies or affiliates
User of Service: Service Company, operating companies and affiliates
Method of Allocation: All allocations are billed through the Service Company and charged to a Service Company internal order that will assign the costs using a cost causative method to the companies benefiting shared assets. For IT related assets, the costs will be charged to the system application or service internal order. For facility assets, the costs will be charged to the respective Service Company facilities ACC that will assign the costs following employee labor.
Northern States Power Company
Cost Assignment and Allocation Manual (CAAM)
Docket No. E002/GR-20-723 Exhibit___(RLB-1), Schedule 3
Page 36 of 57

FACILITIES DISTRIBUTION
Description: Facilities costs are assigned or allocated to the functional areas of operating companies and other affiliates who benefit from the use of the facilities. Depending on whether a building is used by one utility company or is a “shared” building, i.e., building used by employees of more than one operating company or affiliate, facility costs may include:
Single-utility facility: The administrative property services labor and non-labor costs, utility expenses, maintenance costs for structures and systems, pro-rated share of property taxes (for owned buildings), and the rent and occupancy expenses (for leased buildings).
Shared facility: Administrative property services labor and non-labor costs, utilities expenses, and the maintenance costs for structures and systems are captured. If the building is leased, the rent is included. If the building is owned, the carrying costs of the shared assets, such as the depreciation and a return on rate base, are included in the facilities’ cost.
The Property Services department is responsible for the owned and leased facility.
Provider of Service: Service Company or operating companies
User of Service: Service Company, operating companies, and affiliates
Method of Allocation: Costs for a single-utility facility are accumulated in the ACC of the company benefitting from the use of the building and are then allocated to functional FERC rent accounts based on the most recent quarter’s labor charges.
Costs related to a shared facility, i.e., buildings used by employees of more than one operating company or affiliate, are first accumulated in ACC’s specific to the shared facility and then distributed to each operating company and affiliate based upon the most recent quarter’s labor for the specific employees located in each facility. Once costs are assigned to the appropriate company, they are then allocated to the functional FERC rent accounts based on the most recent quarter’s labor charges.
Northern States Power Company
Cost Assignment and Allocation Manual (CAAM)
Docket No. E002/GR-20-723 Exhibit___(RLB-1), Schedule 3
Page 37 of 57
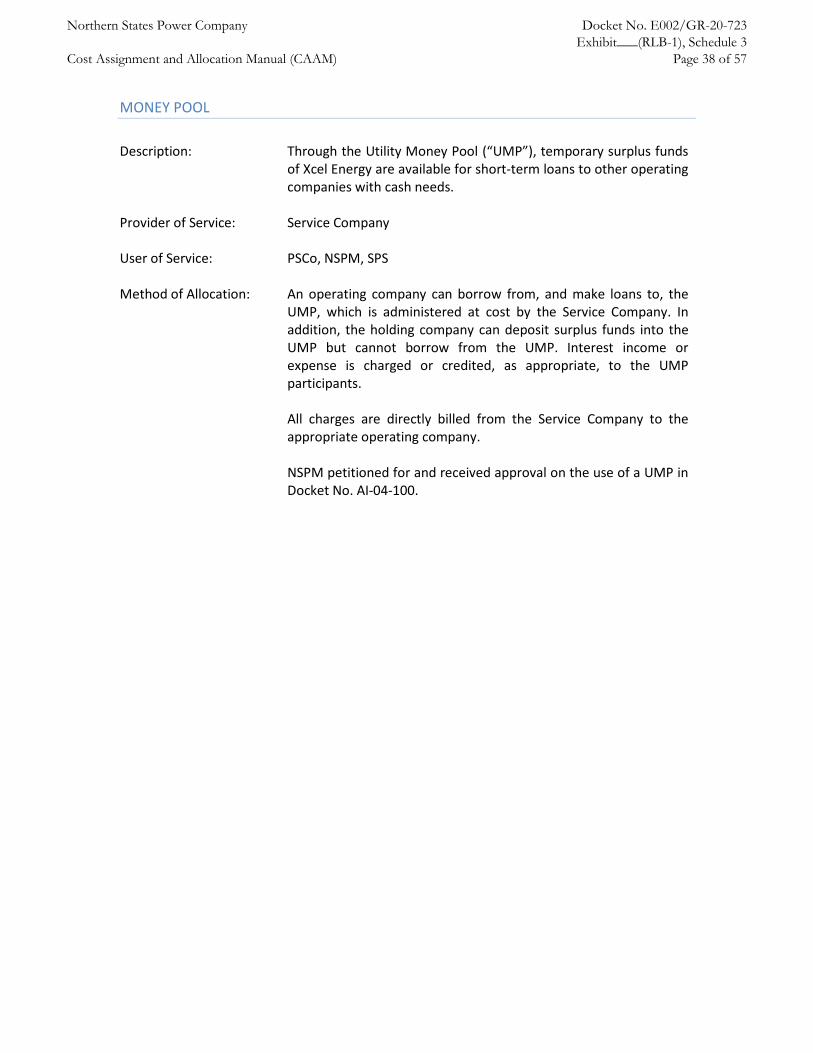
MONEY POOL
Description: Through the Utility Money Pool (“UMP”), temporary surplus funds of Xcel Energy are available for short-term loans to other operating companies with cash needs.
Provider of Service: Service Company
User of Service: PSCo, NSPM, SPS
Method of Allocation: An operating company can borrow from, and make loans to, the UMP, which is administered at cost by the Service Company. In addition, the holding company can deposit surplus funds into the UMP but cannot borrow from the UMP. Interest income or expense is charged or credited, as appropriate, to the UMP participants.
All charges are directly billed from the Service Company to the appropriate operating company.
NSPM petitioned for and received approval on the use of a UMP in Docket No. AI-04-100.
Northern States Power Company
Cost Assignment and Allocation Manual (CAAM)
Docket No. E002/GR-20-723 Exhibit___(RLB-1), Schedule 3
Page 38 of 57

CUSTOMER BILLING
Description: NSPM bills customers for electric, gas, propane, and miscellaneous
non-regulated activities through the customer billing system. Provider of Service: Operating companies User of Service: Operating companies, including utility operations, jurisdictions,
and non-regulated activities. Method of Allocation: Costs related to customer billing are direct charged to specific
operating companies whenever possible. When costs cannot be directly assigned to a specific operating
company, they are allocated based on the number of customers. Non-regulated activities that use the customer billing system are
allocated a customer accounting overhead based on revenue dollars. See Section VII.
Northern States Power Company
Cost Assignment and Allocation Manual (CAAM)
Docket No. E002/GR-20-723 Exhibit___(RLB-1), Schedule 3
Page 39 of 57

ENGINEERING AND SUPERVISION (“E&S”) OVERHEAD
Description: E&S costs are capitalized as construction overheads. E&S overheads are applied where it is not practical to direct charge the pay and expense of the engineers, surveyors, draftsmen, inspectors, first line management, and their assistants to construction. NSPM uses the E&S overhead allocation to charge these expenses to capital projects.
Provider of Service: Operating companies and Service Company
User of Service: Operating companies.
Method of Allocation: Costs related to E&S are gathered in an ACC separately by functional class and utility (production, transmission, and distribution). The ACC’s are fully allocated on a monthly basis to clear the balances to zero. These costs are sent to the fixed asset ledger and then are allocated to each eligible capital internal order based on current month charges and the calculated rate.
The fixed asset ledger tracks all capital projects and work order expenditures for Xcel Energy on a life-to-date basis. Once expenditures are recorded on the books of the appropriate legal entity, the fixed asset ledger system generates the overhead allocations, and if appropriate, AFUDC, which are then applied to the individual internal orders. In addition, the fixed asset ledger calculates monthly depreciation by legal entity and handles the transfer of work orders from FERC account 107, Construction Work in Progress; to FERC account 106, Completed Construction-Not Unitized; to FERC account 101, Utility Plant in Service. The transfer of non-utility costs is within FERC account 121, Non-Utility Property using sub accounts.
Northern States Power Company
Cost Assignment and Allocation Manual (CAAM)
Docket No. E002/GR-20-723 Exhibit___(RLB-1), Schedule 3
Page 40 of 57

CAPITAL A&G
Description: A&G costs are capitalized as construction overheads. The overhead relates to all the personnel in the administrative office that work on construction to assure its continued operation but are not direct to any one project. A prime example is the payroll analyst whose responsibility it is to assure the construction labor receives its payroll checks. Because it is inefficient for these employees to direct charge all the work orders an overhead process is used to facilitate charging the capital work orders.
Provider of Service: Operating companies and Service Company
User of Service: Operating companies.
Method of Allocation: Each operating company performs an A&G study every other year to review the time employees in certain administrative departments spend on capital work. A percent of payroll for these employees, based on the A&G study results is charged to an overhead allocating cost center, one-twelfth each month. The overhead cost center is allocated to each work order based on current month charges.
Northern States Power Company
Cost Assignment and Allocation Manual (CAAM)
Docket No. E002/GR-20-723 Exhibit___(RLB-1), Schedule 3
Page 41 of 57

VI. UTILITY ALLOCATIONS
OVERVIEW
NSPM’s costs are directly assigned or allocated to electric, gas, or non-regulated activities whenever possible or charged as common and then allocated to the electric and gas utilities using utility allocations. Common utility costs are grouped into two categories: (1) O&M utility allocations and (2) rate base and non-O&M utility allocations. The O&M utility allocations are processed monthly within SAP and are explained below. The common rate base and non-O&M utility allocations are completed as part of an annual study and for rate case filing purposes which are explained below.
O&M UTILITY ALLOCATIONS
Introduction
Common O&M utility allocations are applied to common costs that are recorded in A&G (FERC accounts 920-935), customer accounting, and customer information and sales (FERC accounts 901-917). Table A in this section lists the NSPM allocation methodology applied to each FERC account or range of FERC accounts.
Methodology
NSPM uses the following methods to allocate common O&M costs. These methods were developed to achieve the most cost causative relationship that each FERC account or range of FERC accounts has with electric and gas utility operations. The allocators used are as follows:
Customer Allocator
The customer allocator is used to allocate common utility costs in FERC accounts 901-903, and the non-commodity bad debt portion of FERC 904 and 905-917 among electric and gas operations. The allocation is based on the customer bill counts for the electric and gas utilities. The allocator used in the current year is developed based on the previous years’ actual customer bill count.
Revenue Allocator
The revenue allocator is used to allocate common utility costs for commodity bad debt, recorded in FERC account 904, among electric and gas operations. The allocation is based on a rolling four-year average of actual electric and gas revenues. The allocator in the current year is developed based on the four previous years’ actual operating revenues from the corporate income statement.
Three-Factor Allocator
The three-factor allocator is used to allocate common utility costs in FERC account ranges 920-924 and 927-935 among electric and gas utilities. The allocation is based on the weighted average of operating revenue, plant in service, and supervised O&M. The allocator used in the current year is developed based on the previous years’ actual operating revenue, plant in service and supervised O&M.
Northern States Power Company
Cost Assignment and Allocation Manual (CAAM)
Docket No. E002/GR-20-723 Exhibit___(RLB-1), Schedule 3
Page 42 of 57

Labor Allocator
The labor allocator is used to allocate common utility costs in FERC accounts 925-926 to the electric and gas departments. The allocation is based on operating labor for the electric and gas utilities. The allocator used in the current year is developed based on the previous years’ actual operating labor.
RATE BASE AND NON-O&M UTILITY ALLOCATIONS
Introduction
A study is performed annually, and for rate case filing purposes, to identify all rate base and non-O&M costs that are common among the utility operations of NSPM in order to allocate them to the electric and gas utilities.
Methodology
NSPM uses the following methodology to allocate common rate base and non-O&M costs. These allocation factors were developed to achieve the most cost causative methodology based on the pool of costs being allocated. Table B in this section lists the methodology applied to specific pools of costs. The allocators used are as follows:
Three-Factor Allocator
The allocation is based on the weighted average of operating revenue, plant in service, and supervised O&M. The allocator used in the current year is developed based on the previous years’ actual operating revenue, plant in service and supervised O&M.
Computer Software Study
A composite allocator is used to allocate common computer software rate base (plant) and non-O&M (plant related) costs among electric and gas utilities. Software assets and related costs are presented in a cost of service study using a single amount. A study of all computer software is done to determine how each individual software asset that is part of the single amount should be allocated. All individual allocations are summarized to create a single composite allocation that is then applied to the summarized computer software plant and plant related costs.
Transportation Study
Individual allocators are used to allocate common transportation rate base (plant) and non-O&M (plant related) costs among electric and gas utilities. Transportation assets are reviewed to determine where vehicles are used and allocation factors are developed.
Northern States Power Company
Cost Assignment and Allocation Manual (CAAM)
Docket No. E002/GR-20-723 Exhibit___(RLB-1), Schedule 3
Page 43 of 57

Table A – O&M Utility Allocations
FERC Account
Allocation Method Basis for Allocation Selection
901-917 (excluding commodity bad debt in FERC 904)
Customer Allocator
Customer bill counts are a reasonable methodology to use to allocate common customer accounting and customer information and sales costs recorded in FERC accounts 901-917 because these costs are customer related costs, e.g., credit and collection, customer accounting, bad debt, etc.
904 (commodity bad debt portion)
Revenue Allocator A revenue allocator is a reasonable methodology to allocate commodity bad debt because these costs have a cost- causative relationship to uncollectible utility revenues.
920-924 Three-factor Allocator
A three-factor allocation is reasonable because there is no single allocator that could provide a cost-causative link. A three-factor allocator that measures three distinct aspects of the Company and results in an overall fair assignment of costs to the electric and gas utilities is used and is based on equally weighting operating revenue, plant in service and supervised O&M.
925-926 Labor Allocator A labor allocation is reasonable because the costs recorded in these accounts are injuries and damages and pension and benefit costs. These costs have a cost-causative relationship with labor.
927-935 Three-factor Allocator
A three-factor allocation is reasonable because there is no single allocator that could provide a cost causative link. A three-factor allocator that measures three distinct aspects of the Company and results in an overall fair assignment of costs to the electric and gas utilities is used and is based on equally weighting operating revenue, plant in service and supervised O&M.
Northern States Power Company
Cost Assignment and Allocation Manual (CAAM)
Docket No. E002/GR-20-723 Exhibit___(RLB-1), Schedule 3
Page 44 of 57

Table B – Rate Base and Non-O&M Utility Allocations
Utility Functional Class Pool of Costs Allocation Methodology
Electric Direct Assignment Gas Direct Assignment Common 26/Common Intangible
Plant Computer Software Computer Software Study
Common 31/Common General Plant General Furniture & Equipment Three-Factor Allocation Common 31/Common General Plant Electric Distribution – Mass – MN Direct Assignment to Electric Common 31/Common General Plant Electric Distribution – ND Direct Assignment to Electric Common 31/Common General Plant Electric Distribution – MN Direct Assignment to Electric Common 31/Common General Plant Electric Distribution Vaults Direct Assignment to Electric Common 31/Common General Plant Allen S King Plant Direct Assignment to Electric Common 31/Common General Plant Electric Transmission Line – MN Direct Assignment to Electric Common 31/Common General Plant Electric Transmission Substation –
MN Direct Assignment to Electric
Common 31/Common General Plant Gas Distribution – MN Direct Assignment to Gas Common 31/Common General Plant General Tools and Other
Equipment Three-Factor Allocation
Common 31/Common General Plant Office, Service & Other Bldgs – MN Three-Factor Allocation Common 31/Common General Plant Office, Service & Other Bldgs – ND Three-Factor Allocation Common 31/Common General Plant Office, Service & Other Bldgs – SD Three-Factor Allocation Common 31/Common General Plant Software – Minnesota Three-Factor Allocation Common 31/Common General Plant Transportation Equipment – MN Transportation Study Common 31/Common General Plant Transportation Equipment – MN Transportation Study Common 31/Common General Plant Transportation Equipment – SD Transportation Study Common 31/Common General Plant Prairie Island Direct Assignment to Electric Common 31/Common General Plant Inver Hills – Prod Other Direct Assignment to Electric Common 31/Common General Plant Big Oaks Rec Area Three-Factor Allocation Common 31/Common General Plant Black Dog Direct Assignment to Electric Common 31/Common General Plant High Bridge Direct Assignment to Electric Common 31/Common General Plant Riverside Direct Assignment to Electric Common 31/Common General Plant Sherco Direct Assignment to Electric Common 31/Common General Plant Gas Prod – Wescott – MN Direct Assignment to Gas Common 31/Common General Plant General Tools and Other
Equipment Three-Factor Allocation
Common 31/Common General Plant General Plant – MN Three-Factor Allocation Common 31/Common General Plant General Plant – SD Three-Factor Allocation Common 31/Common General Plant General Plant – ND Three-Factor Allocation
Northern States Power Company
Cost Assignment and Allocation Manual (CAAM)
Docket No. E002/GR-20-723 Exhibit___(RLB-1), Schedule 3
Page 45 of 57

VII. NON-REGULATED ACTIVITY ALLOCATIONS
INTRODUCTION
The purpose of this section is to detail the methods of assigning and allocating costs between the regulated services and the non-regulated activities of NSPM.
NSPM follows the same approach for all types of costs for its fully distributed costing method. As discussed earlier in the CAAM, NSPM’s method was approved by the Commission in its electric and gas rate cases (E002-GR-92-1185, G002-GR-92-1186 and G002/GR-97-1606) and the Commission’s September 28, 1994 Order in Docket No. G,E-999/CI-90-1008.
The Commission established the following hierarchical cost assignment and allocation principles in Docket No. G,E-999/CI-90- 1008:
1. Tariffed rate shall be used to value tariffed services provided to non-regulated activities.2. Costs shall be directly assigned to either regulated or non-regulated activities whenever
possible.3. Costs that cannot be directly assigned are common costs, which shall be grouped into
homogenous cost categories. Each cost category shall be allocated based on directanalysis of the origin of the costs whenever possible. If direct analysis is not possible,common costs shall be allocated based upon an indirect cost causation.
4. Whenever neither direct or indirect measures of cost causation can be found, the costcategory shall be allocated based upon a general allocator.
This process accomplishes the proper separation of costs between NSPM’s regulated utility business and non-regulated activities. Each activity that could be considered as being outside of NSPM’s electric and gas business is reviewed for regulated/non-regulated treatment. If the activity is approved to be treated as a non-regulated operation, the non-regulated cost allocation process is followed.
There are limited situations where an activity that would be in the public interest could not be pursued if a fully distributed costing approach was followed. In such circumstances, NSPM has filed, and will continue to file, any deviation from a fully distributed costing process on a project-specific basis. Any existing exceptions have been filed and approved by the Commission.
Evaluation Process
NSPM’s approach to fully distributed costing includes the following steps of analysis: business profile, direct charging, labor overheads, cost causation allocation, labor related overhead, and corporate residual allocation. Non-NSPM affiliates are charged a working capital fee as discussed in Section IV.
Business Profile
The allocation process begins by reviewing each non-regulated activity for the services NSPM’s utility business will be providing to the non-regulated activity.
Northern States Power Company
Cost Assignment and Allocation Manual (CAAM)
Docket No. E002/GR-20-723 Exhibit___(RLB-1), Schedule 3
Page 46 of 57

Direct Charging (Addresses Principle #2)
Cross charges between NSPM service providers and non-regulated activities are reviewed with the business. Any process, project, or service performed for the direct benefit of a non-regulated activity is directly charged to the non-regulated activity. The business area providing service to the non-regulated activity communicates the anticipated level of service and how much the service will cost. Labor charges are directly assigned to the non-regulated activity within the budgeting process, generally based on historical charges and taking into consideration known changes. The non-labor charges are directly charged. This process enables charging for all service that will be provided.
Cost Causation Allocations (Addresses Principle #3)
If no direct charge has been established for a service expected to be provided, a cost causation allocation is developed. Direct charging is preferred. However, if a service is expected to be provided and was not budgeted as a direct charge, an estimate of the cost of the service is made and allocated to the non-regulated business. An example of this would be, when a service is being provided, but it is at such a minimal level that it would be very difficult or cost prohibitive to charge on a direct basis.
Overhead Costs (Addresses Principle #4)
The overhead allocation factors capture indirect costs associated with providing services to non-regulated activities. NSPM currently uses a labor overhead rate developed by reviewing the expenses incurred in support of employee related activities (such as employee programs, employee relations, training, employment, compensation and benefits program development costs, diversity, safety), office equipment needs, and supervision of the service provider. The labor overhead is applied to fully loaded labor. The labor related overhead is applied to non-regulated services wholly contained within NSPM and affiliate or third party transactions.
For non-regulated services wholly contained within NSPM, a portion of NSPM’s corporation costs are allocated based on a two-factor formula that takes into consideration the relative size of the non-regulated business by using number of employees and revenues.
Working Capital Fee (Addresses Principle #3)
The working capital fee is applied to non-NSPM affiliates. The fee is based on the current Prime Rate and is reviewed and updated quarterly. This fee is to compensate the regulated business for the cost of working capital used by affiliates.
Northern States Power Company
Cost Assignment and Allocation Manual (CAAM)
Docket No. E002/GR-20-723 Exhibit___(RLB-1), Schedule 3
Page 47 of 57

VIII. JURISDICTIONAL ALLOCATIONS
INTRODUCTION
NSPM’s methods for assigning and allocating common O&M costs, plant and plant related, and other rate base investment to jurisdictions is intended to distribute costs in a manner that most closely reflects the benefit received from the expenditure. Accurately stating the assigned and allocated costs of the Company, as they relate to causation of the costs, is a fundamental part of creating a fair distribution of those costs to jurisdiction. NSPM uses three methods to assign and allocate O&M expense, plant and plant related, and other rate base investment to jurisdiction:
1. direct assignment based on FERC account and location, 2. allocate based on cost causation, and 3. allocate based on a default allocator.
Determination of the assignment and allocation of costs to jurisdiction is an annual process designed to identify the jurisdiction(s) that receive the benefit from the cost or investment. During the review, the three methods stated above are used to ensure that the appropriate jurisdiction(s) is assigned or allocated the cost. It is NSPM’s primary goal to direct assign or allocate based on cost causation as often as possible, and allocate based on a default as little as possible. The first step in assigning costs and investments to a jurisdiction is to identify all costs that can be directly assigned to a jurisdiction (Minnesota, North Dakota or South Dakota), based on the location where work is being performed. For O&M expense, the SAP general ledger account has a location indicator (Profit Center) and a FERC account number associated with it and these are used to determine the appropriate jurisdiction(s) for assigning costs. The individual business areas determine and maintain the appropriate values for these codes based on the type of work being performed and which customers benefit from it. For plant investment data, the PowerPlan system’s functional class ID, state code and the function that it is serving are used to determine the appropriate jurisdictions to assign costs for plant, plant related and other rate base costs.
Northern States Power Company
Cost Assignment and Allocation Manual (CAAM)
Docket No. E002/GR-20-723 Exhibit___(RLB-1), Schedule 3
Page 48 of 57

Direct Assignment Based on FERC Account and Location
The first method NSPM uses is to direct assign costs whenever possible. For example, the distribution portion of an electric substation (that which is assigned to a distribution FERC account function) and is located in the Twin Cities metro area can be directly assigned to the Minnesota jurisdiction based on location as it directly serves only customers in Minnesota. In addition, all gas transmission and distribution property are directly assigned to the jurisdiction based on where the property is located as defined within the PowerPlan system. The Capital Asset Accounting organization maintains the capitalized property data.
An O&M example of direct assignment (expense) would be either electric or gas special meter reading done in the Twin Cities metro area (assigned to a distribution FERC account). The meters read are for customers in the State of Minnesota; therefore, the related costs are directly assigned to the Minnesota jurisdiction.
All regulatory expenses specific to a jurisdiction are directly assigned to that jurisdiction. For example, indirect assessments charged to NSPM, from the Minnesota Department of Commerce and the Commission, are directly assigned to the Minnesota jurisdiction.
Allocation Based on Cost Causal Relationship
The second method NSPM uses identifies all investments and costs that can be assigned to jurisdiction based on a causal relationship, and allocates these costs using the most cost causal allocation method. Examples of electric and gas analyses are as follows:
Electric
NSPM operates an integrated electric transmission system that transports electricity to NSPM’s distribution system that in turn, supplies electricity to all of NSPM’s customers. The transmission system is built to meet the demand created by serving its customers and, therefore, NSPM uses a coincident peak transmission demand taken from twelve consecutive months that constitute a calendar year method, to allocate transmission investment to all of its jurisdictions. All of the expense and plant investment, assigned to transmission function, exists to support NSPM’s infrastructure, is fixed in nature and is assigned to jurisdiction based on transmission demand.
The cost causation allocators used for electric production expense or plant investment is a twelve-month coincident peak demand or energy, depending on the type of expense or plant investment. If the expense is variable in nature, energy is used to make the assignment to jurisdiction. If it is determined that the expense or plant investment exists to support NSPM’s infrastructure and is fixed in nature, the demand allocator is used to make the assignment to jurisdiction.
Northern States Power Company
Cost Assignment and Allocation Manual (CAAM)
Docket No. E002/GR-20-723 Exhibit___(RLB-1), Schedule 3
Page 49 of 57

Gas
From a supply standpoint, for example, NSPM operates its gas distribution system as a single unit. NSPM purchases natural gas, pipeline delivery capacity, and transmission of gas purchased to meet its customers’ requirements on a system-wide basis. In addition, NSPM also operates propane-air (LPG) peak shaving facilities and liquefied natural gas (LNG) peaking facilities to meet firm demand in excess of natural gas daily pipeline entitlement for the benefit of the entire NSPM system. Because these types of costs support the entire operating company system, it is not possible to direct assign them to a specific jurisdiction. For this example, the O&M production and storage functions are allocated to jurisdiction based on the type of expense within the FERC account number. The transmission function is allocated based on the gas load dispatch allocator that is a combination of the design day firm demand allocator and total annual throughput. For plant investment, all production and storage facilities are allocated based on the gas design day allocator related to the design day firm demand.
Electric & Gas
Cost and investment in support of NSPM’s distribution, customer accounting, and customer information & sales are more easily identified by state based on the location or where the work is being performed, or they can be allocated to jurisdiction using customers as a basis. In cases where services are provided and serve all regional customers, a regional allocator is developed which reflects the number of customers served in Minnesota and North Dakota or Minnesota and South Dakota, depending on the region. This represents a causal relationship between costs incurred in those regions and the assignment of costs to jurisdiction. Locating services performed in the Fargo area is an example of these types of costs. Locating services are performed for customers on both sides of the Minnesota/North Dakota border and are, therefore allocated to jurisdiction based on the number of year-end average customers in the North Dakota Region, which includes Fargo, Moorhead, Grand Forks, East Grand Forks and Minot.
Allocation Based on a Default Allocator
Allocation of common and general investment or A&G expense: costs and investment that cannot be assigned to jurisdiction using either direct assignment or allocation based on cost causation as described above are allocated to jurisdiction using a default allocator.
Common and General Plant Investment
The default allocator for electric plant investment is determined by the function that it serves. Common and general plant that serves production uses a twelve-month coincident peak demand allocator to allocate costs to jurisdiction. Plant serving transmission uses a twelve-month coincident peak transmission demand allocator to allocate costs to jurisdiction. For plant serving distribution, the number of year-end average customers is used to allocate costs to jurisdiction.
For Gas plant a default allocator is also determined by the function that it serves. For general and common plant, a year-end average customer allocator is used as the default. If the investment function has been determined to be gas production related, then the default jurisdictional allocator used in the production allocator is gas design day.
Northern States Power Company
Cost Assignment and Allocation Manual (CAAM)
Docket No. E002/GR-20-723 Exhibit___(RLB-1), Schedule 3
Page 50 of 57

Administrative and General Expenses
When assigning or allocating A&G expenses to jurisdiction, a cost causative allocator is used if a functional relationship is easily established. In other instances, Electric A&G costs are allocated to jurisdiction using an equally weighted two-factor allocator based on electric plant in service and electric O&M expense (excluding A&G). The two factor allocator is developed by first calculating a three part historical ratio of plant investment directly serving production, transmission or distribution and a three part historical ratio of O&M expenses assigned to FERC accounts that are either production, transmission or directly serve customers (distribution, customer accounting, customer information or sales). These two ratios are then averaged to develop an equally weighted production, transmission and distribution ratio. This resulting three part ratio is then multiplied times the jurisdictional O&M default allocation ratios. The electric production portion is allocated to jurisdiction using a twelve-month coincident peak demand allocator; the transmission portion using the transmission demand allocator; and the customer portion is allocated using twelve-month end-of-year customers. The final step is to add the three sets of jurisdictional ratios together to form the two factor jurisdictional allocator used to allocate electric A&G costs supporting corporate functions.
Gas A&G expenses are allocated to jurisdiction using the appropriate customer allocation as a default allocator, based on the SAP account location indicator (profit center).
A more detailed description of each allocation type and method of allocation, including examples of why the allocation was chosen to assign costs to jurisdiction is included below. Table C in this section lists the methodology applied to specific pools of costs.
ALLOCATION METHODS
GAS & ELECTRIC
Allocation: Direct Assigned
This allocation type is used to assign all expenses that are determined to be directly assignable to a jurisdiction (Minnesota, North Dakota, and South Dakota).
Allocation: Direct Assigned: State of Minnesota This allocation type is used for all expenses that are determined to be for the direct benefit or in direct support of the Minnesota jurisdiction. The types of costs direct assigned include: direct and indirect assessments related to one of Minnesota’s regulatory bodies, legal department expense budgeted in support of Minnesota, economic development activities in the state of Minnesota, facilities expenses in support of the distribution business unit in the state of Minnesota, delivery system operation and maintenance costs in the Twin Cities metro area, Northwest and Southeast regions and automated energy system (AES) expenses.
Northern States Power Company
Cost Assignment and Allocation Manual (CAAM)
Docket No. E002/GR-20-723 Exhibit___(RLB-1), Schedule 3
Page 51 of 57
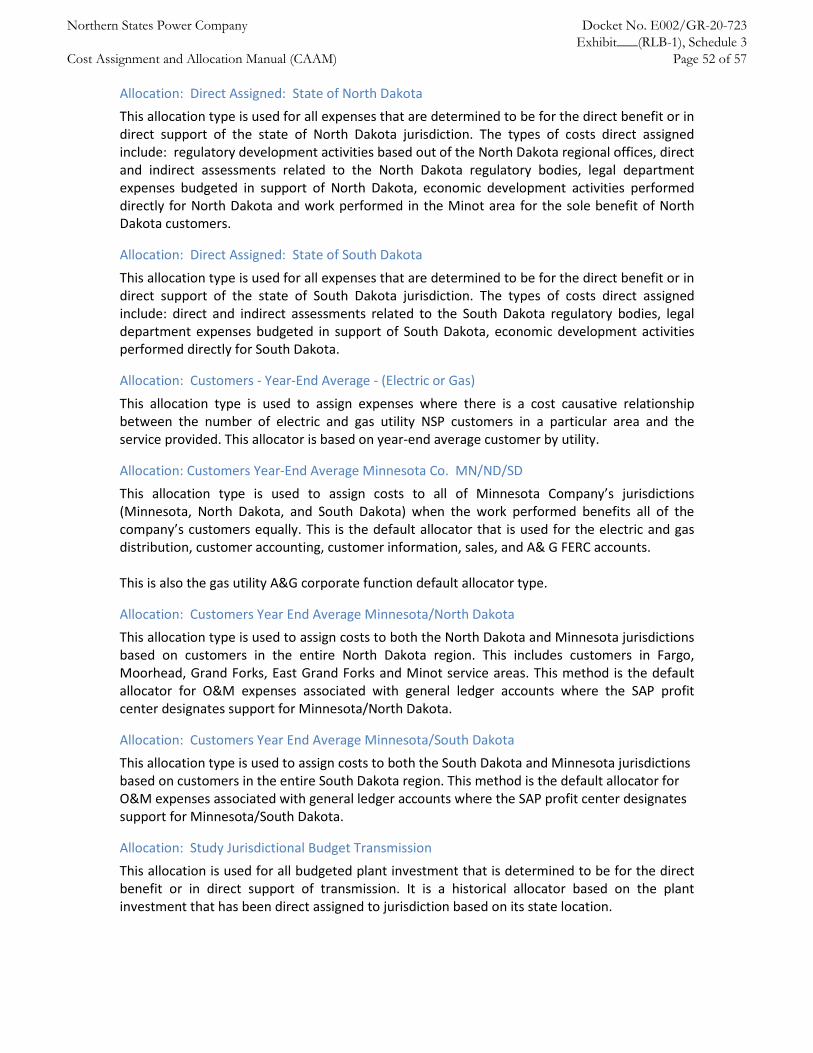
Allocation: Direct Assigned: State of North Dakota This allocation type is used for all expenses that are determined to be for the direct benefit or in direct support of the state of North Dakota jurisdiction. The types of costs direct assigned include: regulatory development activities based out of the North Dakota regional offices, direct and indirect assessments related to the North Dakota regulatory bodies, legal department expenses budgeted in support of North Dakota, economic development activities performed directly for North Dakota and work performed in the Minot area for the sole benefit of North Dakota customers.
Allocation: Direct Assigned: State of South Dakota This allocation type is used for all expenses that are determined to be for the direct benefit or in direct support of the state of South Dakota jurisdiction. The types of costs direct assigned include: direct and indirect assessments related to the South Dakota regulatory bodies, legal department expenses budgeted in support of South Dakota, economic development activities performed directly for South Dakota.
Allocation: Customers - Year-End Average - (Electric or Gas) This allocation type is used to assign expenses where there is a cost causative relationship between the number of electric and gas utility NSP customers in a particular area and the service provided. This allocator is based on year-end average customer by utility.
Allocation: Customers Year-End Average Minnesota Co. MN/ND/SD This allocation type is used to assign costs to all of Minnesota Company’s jurisdictions (Minnesota, North Dakota, and South Dakota) when the work performed benefits all of the company’s customers equally. This is the default allocator that is used for the electric and gas distribution, customer accounting, customer information, sales, and A& G FERC accounts.
This is also the gas utility A&G corporate function default allocator type.
Allocation: Customers Year End Average Minnesota/North Dakota This allocation type is used to assign costs to both the North Dakota and Minnesota jurisdictions based on customers in the entire North Dakota region. This includes customers in Fargo, Moorhead, Grand Forks, East Grand Forks and Minot service areas. This method is the default allocator for O&M expenses associated with general ledger accounts where the SAP profit center designates support for Minnesota/North Dakota.
Allocation: Customers Year End Average Minnesota/South Dakota This allocation type is used to assign costs to both the South Dakota and Minnesota jurisdictions based on customers in the entire South Dakota region. This method is the default allocator for O&M expenses associated with general ledger accounts where the SAP profit center designates support for Minnesota/South Dakota.
Allocation: Study Jurisdictional Budget Transmission This allocation is used for all budgeted plant investment that is determined to be for the direct benefit or in direct support of transmission. It is a historical allocator based on the plant investment that has been direct assigned to jurisdiction based on its state location.
Northern States Power Company
Cost Assignment and Allocation Manual (CAAM)
Docket No. E002/GR-20-723 Exhibit___(RLB-1), Schedule 3
Page 52 of 57

Allocation: Study Jurisdictional Budget Distribution This allocation is used for all budgeted plant investment that is determined to be for the direct benefit or in direct support of Distribution. It is a historical allocator based on the plant investment that has been direct assigned to jurisdiction based on its state location.
ELECTRIC UTILITY ONLY
Allocation: Energy Fuel and fuel-related items are assigned to jurisdiction based on the energy allocator because of the direct correlation of customer sales and the level of fuel consumed. These items include all fuel, purchased energy, interchange agreement energy, and variable production expenses.
Allocation: Demand Prod (Coincident Peak) The 12 coincident peak (CP) demand production allocator is used to assign fixed capacity related expenses, plant, and plant related items to jurisdiction. Other expenses allocated to jurisdiction based on demand include: fixed production expenses, purchased power demand expense, interchange agreement demand charges and regulatory expenses not directly related to one of NSPM’s jurisdictions. Also, any A&G costs that are directly in support of production are allocated using this method.
Allocation: Demand Tran (Coincident Peak) The 12 CP demand transmission allocator is used to assign transmission FERC Accounts in support of NSPM’s jurisdictions. Also, any A&G costs that are directly in support of transmission are allocated using this method.
Allocation: Two-Factor Allocator (A&G Only) Expressed as an equally weighted factor based on electric plant in service and electric O&M expense (excluding A&G); the two-factor allocator is used to allocate electric A&G costs when there is not a direct or cost causative method available. Generally, all corporate electric A&G costs are allocated using this method.
Northern States Power Company
Cost Assignment and Allocation Manual (CAAM)
Docket No. E002/GR-20-723 Exhibit___(RLB-1), Schedule 3
Page 53 of 57

GAS UTILITY ONLY
Allocation: Retail Revenues Cost of Gas Recovery - Demand, Commodity and Purchased Gas Adjustment True-up Study Retail revenues include components for the recovery of costs associated with product and delivery of product to the service area. Such costs include capacity or entitlement costs, pipeline transportation costs, commodity costs and costs of alternative gas (LPG or LNG) supplied during times of firm peak demand. Regulations provide for the automatic adjustment of billing rates for price changes and the annual true up of the cost of gas incurred. Demand, commodity, and purchased gas adjustment are components of the retail revenues cost of gas recovery study. The portion of total NSPM cost of gas included in retail revenues that the Minnesota jurisdiction represents is also applied to total Minnesota company cost of gas expense accounts to achieve revenue neutrality for revenue requirements consideration.
Allocation: Design Demand Day Expressed as a percentage, design demand day is the ratio of the Minnesota jurisdiction firm peak demand volume to the total NSPM firm peak demand volume that could occur on the distribution system on a day considered to be the most severe weather conditions that can be experienced.
Allocation: Load Dispatch Expressed as a percentage, load dispatch is a combination of the Minnesota jurisdiction design demand day and the Minnesota jurisdiction total retail sales and transportation throughput each weighted equally.
Allocation: Limited Firm and Standby Services Study Expressed as a percentage, limited firm and standby services, in revenues, is the ratio of Minnesota jurisdiction availability charges and volumetric charges to the total NSPM system; in costs, it is the ratio of Minnesota jurisdiction volumetric product costs to the total NSPM program product costs.
Northern States Power Company
Cost Assignment and Allocation Manual (CAAM)
Docket No. E002/GR-20-723 Exhibit___(RLB-1), Schedule 3
Page 54 of 57

Table C
Allocation to Jurisdiction
Selection Criteria *
Sub-Business Unit Plant Function Functional Class ID /
Description Location Functional Use Utility Jurisdiction Allocation Methodology
Budget
Production Production 1 / Electric Steam Production Plant Electric MN/ND/SD/WHSL Electric - Demand Prod
(Coincident Peak)
Production Production 2 /Electric Nuclear Production Plant Electric MN/ND/SD/WHSL Electric - Demand Prod
(Coincident Peak)
Production Production 3 / Electric Hydro Production Plant Electric MN/ND/SD/WHSL Electric - Demand Prod
(Coincident Peak)
Production Production 4 / Electric Other Production Plant Electric MN/ND/SD/WHSL Electric - Demand Prod
(Coincident Peak)
Production Production 4 / Electric Other Production Plant-Wind Electric MN/ND/SD/WHSL Electric - Energy
Production Production 22 / Nuclear Fuel Electric MN/ND/SD/WHSL Electric - Demand Prod (Coincident Peak)
Production Common & General 24 / Electric Intangible Plant Electric MN/ND/SD/WHSL Electric - Demand Prod
(Coincident Peak)
Production Common & General 26 / Common Intangible Plant Electric MN/ND/SD/WHSL Electric - Demand Prod
(Coincident Peak)
Production Common & General 29 / Electric General Plant Electric MN/ND/SD/WHSL Electric - Demand Prod
(Coincident Peak)
Production Common & General 31 / Common General Plant Electric MN/ND/SD/WHSL Electric - Demand Prod
(Coincident Peak)
Production Production 23 / Decommissioning FERC MN Electric MN/ND/SD/WHSL Electric - Demand Prod (Coincident Peak)
Production Production 23 / Decommissioning Minnesota Electric MN Direct Assigned - State of Minnesota
Production Production 23 / Decommissioning North Dakota Electric ND Direct Assigned - State of North Dakota
Production Production 23 / Decommissioning South Dakota Electric SD Direct Assigned - State of South Dakota
Production Production 23 / Decommissioning Wisconsin Electric WI Direct Assigned - Wisconsin Electric Transmission Transmission 5 / Electric Transmission Plant Electric MN/ND/SD/WHSL Electric - Demand Tran
(Coincident Peak) Electric Transmission Transmission 5 / Transmission Direct
Assignment Minnesota DRCT Electric MN Direct Assigned – State of Minnesota
Electric Distribution Transmission 5 / Transmission Serving
Distribution Minnesota Electric MN Direct Assigned - State of Minnesota
Electric Distribution Transmission 5 / Transmission Serving
Distribution North Dakota Electric ND Direct Assigned - State of North Dakota
Electric Distribution Transmission 5 / Transmission Serving
Distribution South Dakota Electric SD Direct Assigned - State of South Dakota
Production Transmission 5 / Transmission Generation Step-up
BSLD, PEAK Electric MN/ND/SD/WHSL Electric - Demand Prod
(Coincident Peak)
Electric Transmission
Common & General 24 / Electric Intangible Plant Electric MN/ND/SD/WHSL Electric - Demand Tran
(Coincident Peak)
Electric Transmission
Common & General 26 / Common Intangible Plant Electric MN/ND/SD/WHSL Electric - Demand Tran
(Coincident Peak)
Northern States Power Company
Cost Assignment and Allocation Manual (CAAM)
Docket No. E002/GR-20-723Exhibit___(RLB-1), Schedule 3
Page 55 of 57

Selection Criteria *
Sub-Business Unit Plant Function Functional Class ID /
Description Location Functional Use Utility Jurisdiction Allocation Methodology
Budget
Electric Transmission
Common & General 29 / Electric General Plant Electric MN/ND/SD/WH
SL Electric - Demand Tran (Coincident Peak)
Electric Transmission
Common & General 31 / Common General Plant Electric MN/ND/SD/WH
SL Electric - Demand Tran (Coincident Peak)
Electric Distribution Distribution 6 / Electric Distribution Plant Minnesota Electric MN Direct Assigned - State of
Minnesota Electric Distribution Distribution 6 / Electric Distribution Plant North Dakota Electric ND Direct Assigned - State of North
Dakota Electric Distribution Distribution 6 / Electric Distribution Plant South Dakota Electric SD Direct Assigned - State of South
Dakota Electric Distribution Distribution 6 / Electric Distribution Plant Wholesale Electric WHSL Direct Assigned - Wholesale Full
Requirements
Production Distribution 6 / Distribution Generation Step-up PEAK Electric MN/ND/SD/WH
SL Electric - Demand Prod (Coincident Peak)
Electric Transmission Distribution 6 / Distribution Serving
Transmission TBULK Electric MN/ND/SD/WHSL
Electric - Demand Tran (Coincident Peak)
Electric Distribution
Common & General 24 / Electric Intangible Plant Electric MN/ND/SD/WH
SL
Customer Year End Average - Electric Minnesota Company MN/ND/SD/WHSL
Electric Distribution
Common & General 26 / Common Intangible Plant Electric MN/ND/SD/WH
SL
Customer Year End Average - Electric Minnesota Company MN/ND/SD/WHSL
Electric Distribution
Common & General 29 / Electric General Plant Electric MN/ND/SD/WH
SL
Customer Year End Average - Electric Minnesota Company MN/ND/SD/WHSL
Electric Distribution
Common & General 31 / Common General Plant Electric MN/ND/SD/WH
SL
Customer Year End Average - Electric Minnesota Company MN/ND/SD/WHSL
Gas Production 7 / Gas Manufactured Production Plant Gas MN/ND Gas - Design Demand Day
Gas Storage 9 / Gas Underground Storage Plant Gas MN/ND Gas - Design Demand Day
Gas Transmission 10 / Gas Transmission Plant Gas MN Direct Assigned – State Of Minnesota
Gas Transmission 10 / Gas Transmission Plant Gas ND Direct Assigned – State of North Dakota
Gas Distribution 11 / Gas Distribution Plant Gas MN Direct Assigned – State of Minnesota
Gas Distribution 11 / Gas Distribution Plant Gas ND Direct Assigned – State of North Dakota
Gas Common & General 25 / Gas Intangible Plant Gas MN/ND Gas - Design Demand Day
Gas Common & General 26 / Common Intangible Plant Gas MN/ND Gas - Design Demand Day
Gas Common & General 30 / Gas General Plant Gas MN/ND Gas - Design Demand Day
Gas Common & General 31 / Common General Plant Gas MN/ND Gas - Design Demand Day
Northern States Power Company
Cost Assignment and Allocation Manual (CAAM)
Docket No. E002/GR-20-723Exhibit___(RLB-1), Schedule 3
Page 56 of 57

Selection Criteria *
Sub-Business Unit Plant Function Functional Class ID /
Description Location Functional Use Utility Jurisdiction Allocation Methodology
Budget
Gas Common & General 25 / Gas Intangible Plant Gas MN/ND Customer Year End Average - Gas
Minnesota Company MN/ND
Gas Common & General 26 / Common Intangible Plant Gas MN/ND Customer Year End Average - Gas
Minnesota Company MN/ND
Gas Common & General 30 / Gas General Plant Gas MN/ND Customer Year End Average - Gas
Minnesota Company MN/ND
Gas Common & General 31 / Common General Plant Gas MN/ND Customer Year End Average - Gas
Minnesota Company MN/ND
Gas Common & General 34 / Gas Other Storage Plant Gas MN/ND Gas - Design Demand Day
* All items under the Selection Criteria must be met before this allocation takes place.
Northern States Power Company
Cost Assignment and Allocation Manual (CAAM)
Docket No. E002/GR-20-723Exhibit___(RLB-1), Schedule 3
Page 57 of 57
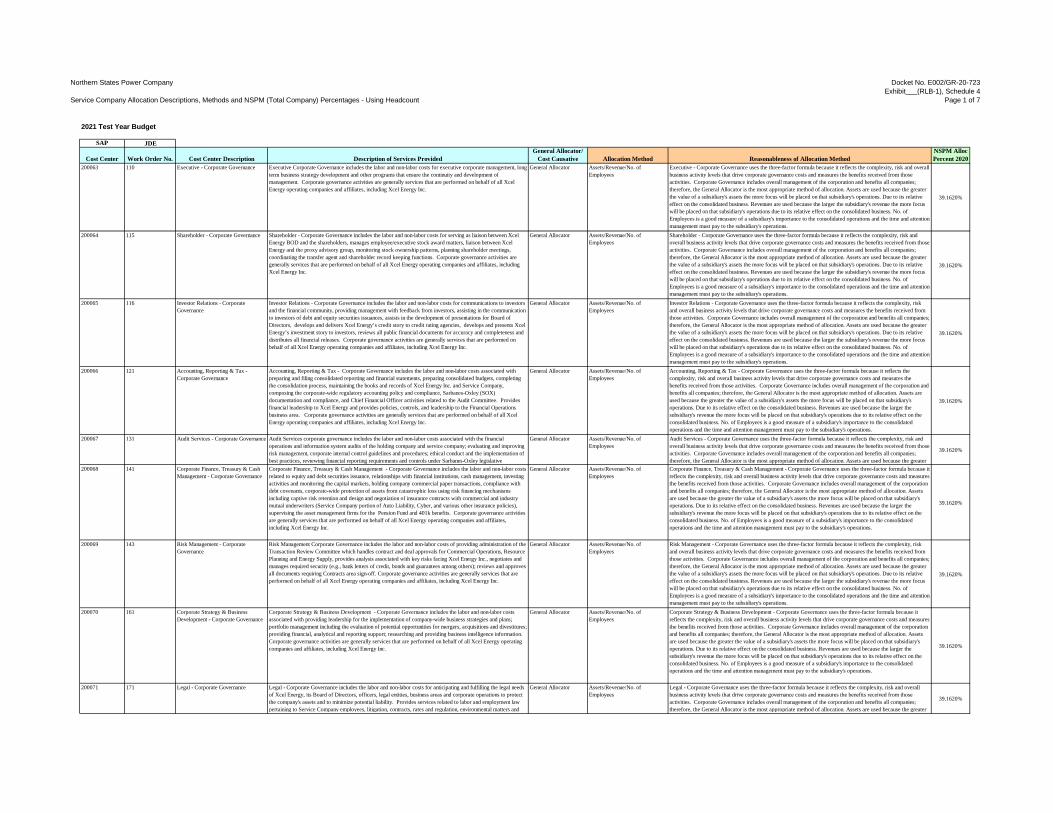
Northern States Power Company
Service Company Allocation Descriptions, Methods and NSPM (Total Company) Percentages - Using Headcount
Docket No. E002/GR-20-723Exhibit___(RLB-1), Schedule 4
Page 1 of 7
2021 Test Year Budget
SAP JDE
Cost Center Work Order No. Cost Center Description Description of Services ProvidedGeneral Allocator/
Cost Causative Allocation Method Reasonableness of Allocation MethodNSPM Alloc Percent 2020
200063 110 Executive - Corporate Governance Executive Corporate Governance includes the labor and non-labor costs for executive corporate management, long-term business strategy development and other programs that ensure the continuity and development of management. Corporate governance activities are generally services that are performed on behalf of all Xcel Energy operating companies and affiliates, including Xcel Energy Inc.
General Allocator Assets/Revenue/No. of Employees
Executive - Corporate Governance uses the three-factor formula because it reflects the complexity, risk and overall business activity levels that drive corporate governance costs and measures the benefits received from those activities. Corporate Governance includes overall management of the corporation and benefits all companies; therefore, the General Allocator is the most appropriate method of allocation. Assets are used because the greater the value of a subsidiary's assets the more focus will be placed on that subsidiary's operations. Due to its relative effect on the consolidated business. Revenues are used because the larger the subsidiary's revenue the more focus will be placed on that subsidiary's operations due to its relative effect on the consolidated business. No. of Employees is a good measure of a subsidiary's importance to the consolidated operations and the time and attention management must pay to the subsidiary's operations.
39.1620%
200064 115 Shareholder - Corporate Governance Shareholder - Corporate Governance includes the labor and non-labor costs for serving as liaison between Xcel Energy BOD and the shareholders, manages employee/executive stock award matters, liaison between Xcel Energy and the proxy advisory group, monitoring stock ownership patterns, planning shareholder meetings, coordinating the transfer agent and shareholder record keeping functions. Corporate governance activities are generally services that are performed on behalf of all Xcel Energy operating companies and affiliates, including Xcel Energy Inc.
General Allocator Assets/Revenue/No. of Employees
Shareholder - Corporate Governance uses the three-factor formula because it reflects the complexity, risk and overall business activity levels that drive corporate governance costs and measures the benefits received from those activities. Corporate Governance includes overall management of the corporation and benefits all companies; therefore, the General Allocator is the most appropriate method of allocation. Assets are used because the greater the value of a subsidiary's assets the more focus will be placed on that subsidiary's operations. Due to its relative effect on the consolidated business. Revenues are used because the larger the subsidiary's revenue the more focus will be placed on that subsidiary's operations due to its relative effect on the consolidated business. No. of Employees is a good measure of a subsidiary's importance to the consolidated operations and the time and attention management must pay to the subsidiary's operations.
39.1620%
200065 116 Investor Relations - Corporate Governance
Investor Relations - Corporate Governance includes the labor and non-labor costs for communications to investors and the financial community, providing management with feedback from investors, assisting in the communication to investors of debt and equity securities issuances, assists in the development of presentations for Board of Directors, develops and delivers Xcel Energy’s credit story to credit rating agencies, develops and presents Xcel Energy’s investment story to investors, reviews all public financial documents for accuracy and completeness and distributes all financial releases. Corporate governance activities are generally services that are performed on behalf of all Xcel Energy operating companies and affiliates, including Xcel Energy Inc.
General Allocator Assets/Revenue/No. of Employees
Investor Relations - Corporate Governance uses the three-factor formula because it reflects the complexity, risk and overall business activity levels that drive corporate governance costs and measures the benefits received from those activities. Corporate Governance includes overall management of the corporation and benefits all companies; therefore, the General Allocator is the most appropriate method of allocation. Assets are used because the greater the value of a subsidiary's assets the more focus will be placed on that subsidiary's operations. Due to its relative effect on the consolidated business. Revenues are used because the larger the subsidiary's revenue the more focus will be placed on that subsidiary's operations due to its relative effect on the consolidated business. No. of Employees is a good measure of a subsidiary's importance to the consolidated operations and the time and attention management must pay to the subsidiary's operations.
39.1620%
200066 121 Accounting, Reporting & Tax - Corporate Governance
Accounting, Reporting & Tax - Corporate Governance includes the labor and non-labor costs associated with preparing and filing consolidated reporting and financial statements, preparing consolidated budgets, completing the consolidation process, maintaining the books and records of Xcel Energy Inc. and Service Company, composing the corporate-wide regulatory accounting policy and compliance, Sarbanes-Oxley (SOX) documentation and compliance, and Chief Financial Officer activities related to the Audit Committee. Provides financial leadership to Xcel Energy and provides policies, controls, and leadership to the Financial Operations business area. Corporate governance activities are generally services that are performed on behalf of all Xcel Energy operating companies and affiliates, including Xcel Energy Inc.
General Allocator Assets/Revenue/No. of Employees
Accounting, Reporting & Tax - Corporate Governance uses the three-factor formula because it reflects the complexity, risk and overall business activity levels that drive corporate governance costs and measures the benefits received from those activities. Corporate Governance includes overall management of the corporation and benefits all companies; therefore, the General Allocator is the most appropriate method of allocation. Assets are used because the greater the value of a subsidiary's assets the more focus will be placed on that subsidiary's operations. Due to its relative effect on the consolidated business. Revenues are used because the larger the subsidiary's revenue the more focus will be placed on that subsidiary's operations due to its relative effect on the consolidated business. No. of Employees is a good measure of a subsidiary's importance to the consolidated operations and the time and attention management must pay to the subsidiary's operations.
39.1620%
200067 131 Audit Services - Corporate Governance Audit Services corporate governance includes the labor and non-labor costs associated with the financial operations and information system audits of the holding company and service company; evaluating and improving risk management, corporate internal control guidelines and procedures; ethical conduct and the implementation of best practices, reviewing financial reporting requirements and controls under Sarbanes-Oxley legislative
General Allocator Assets/Revenue/No. of Employees
Audit Services - Corporate Governance uses the three-factor formula because it reflects the complexity, risk and overall business activity levels that drive corporate governance costs and measures the benefits received from those activities. Corporate Governance includes overall management of the corporation and benefits all companies; therefore, the General Allocator is the most appropriate method of allocation. Assets are used because the greater
39.1620%
200068 141 Corporate Finance, Treasury & Cash Management - Corporate Governance
Corporate Finance, Treasury & Cash Management - Corporate Governance includes the labor and non-labor costs related to equity and debt securities issuance, relationships with financial institutions, cash management, investing activities and monitoring the capital markets, holding company commercial paper transactions, compliance with debt covenants, corporate-wide protection of assets from catastrophic loss using risk financing mechanisms including captive risk retention and design and negotiation of insurance contracts with commercial and industry mutual underwriters (Service Company portion of Auto Liability, Cyber, and various other insurance policies), supervising the asset management firms for the Pension Fund and 401k benefits. Corporate governance activities are generally services that are performed on behalf of all Xcel Energy operating companies and affiliates, including Xcel Energy Inc.
General Allocator Assets/Revenue/No. of Employees
Corporate Finance, Treasury & Cash Management - Corporate Governance uses the three-factor formula because it reflects the complexity, risk and overall business activity levels that drive corporate governance costs and measures the benefits received from those activities. Corporate Governance includes overall management of the corporation and benefits all companies; therefore, the General Allocator is the most appropriate method of allocation. Assets are used because the greater the value of a subsidiary's assets the more focus will be placed on that subsidiary's operations. Due to its relative effect on the consolidated business. Revenues are used because the larger the subsidiary's revenue the more focus will be placed on that subsidiary's operations due to its relative effect on the consolidated business. No. of Employees is a good measure of a subsidiary's importance to the consolidated operations and the time and attention management must pay to the subsidiary's operations.
39.1620%
200069 143 Risk Management - Corporate Governance
Risk Management Corporate Governance includes the labor and non-labor costs of providing administration of the Transaction Review Committee which handles contract and deal approvals for Commercial Operations, Resource Planning and Energy Supply, provides analysis associated with key risks facing Xcel Energy Inc., negotiates and manages required security (e.g., bank letters of credit, bonds and guarantees among others); reviews and approves all documents requiring Contracts area sign-off. Corporate governance activities are generally services that are performed on behalf of all Xcel Energy operating companies and affiliates, including Xcel Energy Inc.
General Allocator Assets/Revenue/No. of Employees
Risk Management - Corporate Governance uses the three-factor formula because it reflects the complexity, risk and overall business activity levels that drive corporate governance costs and measures the benefits received from those activities. Corporate Governance includes overall management of the corporation and benefits all companies; therefore, the General Allocator is the most appropriate method of allocation. Assets are used because the greater the value of a subsidiary's assets the more focus will be placed on that subsidiary's operations. Due to its relative effect on the consolidated business. Revenues are used because the larger the subsidiary's revenue the more focus will be placed on that subsidiary's operations due to its relative effect on the consolidated business. No. of Employees is a good measure of a subsidiary's importance to the consolidated operations and the time and attention management must pay to the subsidiary's operations.
39.1620%
200070 161 Corporate Strategy & Business Development - Corporate Governance
Corporate Strategy & Business Development - Corporate Governance includes the labor and non-labor costs associated with providing leadership for the implementation of company-wide business strategies and plans; portfolio management including the evaluation of potential opportunities for mergers, acquisitions and divestitures; providing financial, analytical and reporting support; researching and providing business intelligence information. Corporate governance activities are generally services that are performed on behalf of all Xcel Energy operating companies and affiliates, including Xcel Energy Inc.
General Allocator Assets/Revenue/No. of Employees
Corporate Strategy & Business Development - Corporate Governance uses the three-factor formula because it reflects the complexity, risk and overall business activity levels that drive corporate governance costs and measures the benefits received from those activities. Corporate Governance includes overall management of the corporation and benefits all companies; therefore, the General Allocator is the most appropriate method of allocation. Assets are used because the greater the value of a subsidiary's assets the more focus will be placed on that subsidiary's operations. Due to its relative effect on the consolidated business. Revenues are used because the larger the subsidiary's revenue the more focus will be placed on that subsidiary's operations due to its relative effect on the consolidated business. No. of Employees is a good measure of a subsidiary's importance to the consolidated operations and the time and attention management must pay to the subsidiary's operations.
39.1620%
200071 171 Legal - Corporate Governance Legal - Corporate Governance includes the labor and non-labor costs for anticipating and fulfilling the legal needs of Xcel Energy, its Board of Directors, officers, legal entities, business areas and corporate operations to protect the company's assets and to minimize potential liability. Provides services related to labor and employment law pertaining to Service Company employees, litigation, contracts, rates and regulation, environmental matters and
General Allocator Assets/Revenue/No. of Employees
Legal - Corporate Governance uses the three-factor formula because it reflects the complexity, risk and overall business activity levels that drive corporate governance costs and measures the benefits received from those activities. Corporate Governance includes overall management of the corporation and benefits all companies; therefore, the General Allocator is the most appropriate method of allocation. Assets are used because the greater
39.1620%

Northern States Power Company
Service Company Allocation Descriptions, Methods and NSPM (Total Company) Percentages - Using Headcount
Docket No. E002/GR-20-723Exhibit___(RLB-1), Schedule 4
Page 2 of 7
2021 Test Year Budget
SAP JDE
Cost Center Work Order No. Cost Center Description Description of Services ProvidedGeneral Allocator/
Cost Causative Allocation Method Reasonableness of Allocation MethodNSPM Alloc Percent 2020
200072 180 Communications - Corporate Governance
Communications - Corporate Governance includes the labor and non-labor costs to assist and ensure Executive Management, Investor Relations and others communicate appropriately with shareholders, the public, and other key stakeholder audiences. Key projects include: development and production of the annual report and other communications to investors; speeches, videos, and major presentations delivered by top executives; and speeches, displays, video and presentations for the company's annual meeting of shareholders. Media Relations contributes to building Xcel Energy's reputation by developing media and public relations strategies for major company initiatives and issues; responding to news media inquiries; working pro-actively with the media to forward story ideas and information about company events, policies and actions, and providing media training for company spokespersons. Media Relations also plays a key role in crisis communications and emergency preparedness efforts. Corporate governance activities are generally services that are performed on behalf of all Xcel Energy operating companies and affiliates, including Xcel Energy Inc.
General Allocator Assets/Revenue/No. of Employees
Communications - Corporate Governance uses the three-factor formula because it reflects the complexity, risk and overall business activity levels that drive corporate governance costs and measures the benefits received from those activities. Corporate Governance includes overall management of the corporation and benefits all companies; therefore, the General Allocator is the most appropriate method of allocation. Assets are used because the greater the value of a subsidiary's assets the more focus will be placed on that subsidiary's operations. Due to its relative effect on the consolidated business. Revenues are used because the larger the subsidiary's revenue the more focus will be placed on that subsidiary's operations due to its relative effect on the consolidated business. No. of Employees is a good measure of a subsidiary's importance to the consolidated operations and the time and attention management must pay to the subsidiary's operations.
39.1620%
200073 189 Human Resources - Corporate Governance
Human Resources - Corporate Governance includes the labor and non-labor costs for executive officers' and Service Company employees' compensation plans, corporate HR policies, executive policy benefit plans, payroll services for Service Company and the employees' handbook. Corporate governance activities are generally services that are performed on behalf of all Xcel Energy operating companies and affiliates, including Xcel Energy Inc.
General Allocator Assets/Revenue/No. of Employees
Human Resources - Corporate Governance uses the three-factor formula because it reflects the complexity, risk and overall business activity levels that drive corporate governance costs and measures the benefits received from those activities. Corporate Governance includes overall management of the corporation and benefits all companies; therefore, the General Allocator is the most appropriate method of allocation. Assets are used because the greater the value of a subsidiary's assets the more focus will be placed on that subsidiary's operations. Due to its relative effect on the consolidated business. Revenues are used because the larger the subsidiary's revenue the more focus will be placed on that subsidiary's operations due to its relative effect on the consolidated business. No. of Employees is a good measure of a subsidiary's importance to the consolidated operations and the time and attention management must pay to the subsidiary's operations.
39.1620%
200074 529; 549; 551; 561 Corporate Systems – Corporate Governance
Corporate Systems – Corporate Governance includes the labor and non-labor costs for enterprise-wide corporate systems.
General Allocator Assets/Revenue/No. of Employees
Corporate Systems - Corporate Governance uses the three-factor formula because it reflects the complexity, risk and overall business activity levels that drive corporate governance costs and measures the benefits received from those activities. Corporate Governance includes overall management of the corporation and benefits all companies; therefore, the General Allocator is the most appropriate method of allocation. Assets are used because the greater the value of a subsidiary's assets the more focus will be placed on that subsidiary's operations. Due to its relative effect on the consolidated business. Revenues are used because the larger the subsidiary's revenue the more focus will be placed on that subsidiary's operations due to its relative effect on the consolidated business. No. of Employees is a good measure of a subsidiary's importance to the consolidated operations and the time and attention management must pay to the subsidiary's operations.
39.1620%
200075 114 Board of Directors - Corporate Governance
Board of Directors - Corporate Governance includes the labor and non-labor costs related to the Board of Directors (BOD). BOD costs may include Directors fees, retirement expenses and replacement fees; Board/Committee meetings and BOD related consulting. Corporate governance activities are generally services that are performed on behalf of all Xcel Energy operating companies and affiliates, including Xcel Energy Inc.
General Allocator Assets/Revenue/No. of Employees
Board of Directors - Corporate Governance uses the three-factor formula because it reflects the complexity, risk and overall business activity levels that drive corporate governance costs and measures the benefits received from those activities. Corporate Governance includes overall management of the corporation and benefits all companies; therefore, the General Allocator is the most appropriate method of allocation. Assets are used because the greater
39.1620%
200076 182 Xcel Foundation Xcel Foundation services includes the labor and non-labor costs associated with the management and administration of the Xcel Energy Foundation.
General Allocator Assets/Revenue/No. of Employees
Xcel Foundation services that could not be directly charged to a specific legal entity and are corporate in nature. Because these services are comprised of a broad spectrum of activities, no measurable method of cost causative allocation was found to allocate these costs therefore the three-factor formula was used. These services are allocated to a subset of companies based on who benefits from the services.
39.2509%
200077 184 Branding Branding services includes the labor and non-labor costs for brand advertising and management of community affairs programs such as employee volunteerism, educational programs and community events, the company's investment in major sponsorships such as the Xcel Energy Center as well as ensuring that such sponsorships and related activities support the company's brand, mission and values.
General Allocator Assets/Revenue/No. of Employees
Branding services that could not be directly charged to a specific legal entity and are corporate in nature. Because these services are comprised of a broad spectrum of activities, no measurable method of cost causative allocation was found to allocate these costs therefore the three-factor formula was used. These services are allocated to a subset of companies based on who benefits from the services.
39.2509%
200078 410 Governmental Affairs Governmental Affairs includes the labor and non-labor costs associated with the interpretation of laws regulations and environmental policy to ensure compliance and cost effectiveness for Xcel Energy customers and stockholders Internal legislative policy development and issues management, appraise management and internal customers of political and policy trends and developments, develop and maintain relationships with regulatory officials and staff.
General Allocator Assets/Revenue/No. of Employees
Governmental Affairs services that could not be directly charged to a specific legal entity and are corporate in nature. Because these services are comprised of a broad spectrum of activities, no measurable method of cost causative allocation was found to allocate these costs therefore the three-factor formula was used. These services are allocated to a subset of companies based on who benefits from the services.
39.2771%
200079 409 Federal Lobbying Federal Lobbying services includes the labor and non-labor costs for federal and state lobbying activities and the federal Political Action Committee (PAC).
General Allocator Assets/Revenue/No. of Employees
Federal Lobbying services that could not be directly charged to a specific legal entity and are corporate in nature. Because these services are comprised of a broad spectrum of activities, no measurable method of cost causative allocation was found to allocate these costs therefore the three-factor formula was used. These services are provided to a subset of companies based on who benefits from the services. These costs are recorded in FERC
39.2771%
200080 135 Capital Asset Accounting Capital Asset Accounting includes the labor and non-labor costs associated with operating and non-operating company capital asset accounting, budgeting, regulatory reporting, business area support for utility areas, and operating company budgeting support.
General Allocator Assets/Revenue/No. of Employees
Capital Asset Accounting services that could not be directly charged to a specific legal entity and are corporate in nature. Because these services are comprised of a broad spectrum of activities, no measurable method of cost causative allocation was found to allocate these costs therefore the three-factor formula was used. These services are allocated to a subset of companies based on who benefits from the services.
44.1288%
200081 120 Accounting, Reporting & Taxes Accounting, Reporting & Taxes services includes the labor and non-labor costs for preparation of operating and non-operating financial statements, tax returns and reporting, performing accounting for the employee benefit plans, ensuring compliance with applicable laws and regulations of the operating and non-operating companies; composing the corporate-wide regulatory accounting policy, and coordinating the budgeting process with the operating and non-operating companies.
General Allocator Assets/Revenue/No. of Employees
Accounting Reporting & Taxes services that could not be directly charged to a specific legal entity and are corporate in nature. Because these services are comprised of a broad spectrum of activities, no measurable method of cost causative allocation was found to allocate these costs therefore the three-factor formula was used. These services are allocated to a subset of companies based on who benefits from the services.
44.2197%
200082 130 Audit Services Audit Services includes the labor and non-labor costs for auditing operating and non-operating companies, evaluating and improving risk management, ethical conduct and the implementation of best practices for operating and non-operating companies, conducting financial operations and information system audits, performing audits and reviews for compliance with regulatory and legal requirements and contracts with vendors and other parties; establishing and reviewing internal controls for operating and non-operating companies, establishing and reviewing SOX compliance requirements/control testing and evaluating contract risks for the operating and non-operating companies.
General Allocator Assets/Revenue/No. of Employees
Audit Services that could not be directly charged to a specific legal entity and are corporate in nature. Because these services are comprised of a broad spectrum of activities, no measurable method of cost causative allocation was found to allocate these costs therefore the three-factor formula was used. These services are allocated to a subset of companies based on who benefits from the services. 44.2197%
200083 140 Corporate Finance, Treasury & Cash Management
Corporate Finance, Treasury & Cash Management services includes the labor and non-labor costs related to equity and debt securities issuance, cash management, relationships with financial institutions, compliance with debt covenants, Service Company portion of General and Excess liability insurance, and management of the Pension Fund and 401k benefits for operating companies.
General Allocator Assets/Revenue/No. of Employees
Corporate Finance, Treasury & Cash Management services that could not be directly charged to a specific legal entity and are corporate in nature. Because these services are comprised of a broad spectrum of activities, no measurable method of cost causative allocation was found to allocate these costs therefore the three-factor formula was used. These services are allocated to a subset of companies based on who benefits from the services.
44.2197%

Northern States Power Company
Service Company Allocation Descriptions, Methods and NSPM (Total Company) Percentages - Using Headcount
Docket No. E002/GR-20-723Exhibit___(RLB-1), Schedule 4
Page 3 of 7
2021 Test Year Budget
SAP JDE
Cost Center Work Order No. Cost Center Description Description of Services ProvidedGeneral Allocator/
Cost Causative Allocation Method Reasonableness of Allocation MethodNSPM Alloc Percent 2020
200084 142 Risk Management Risk Management develops and negotiates security agreements with counterparties; reviews high-risk vendor creditworthiness for the Environmental Services group; supports wind generation, solar carbon offsets, emission allowances, bundled energy and RECs, biomass and other renewable energy purchase agreements; participates in industry contracts working groups; representing Xcel Energy operating utilities; performs production cost modeling and analysis for corporate budgeting; analyzing value and risks of structured purchases and generation system modifications; performs long range system modeling to evaluate large capacity acquisition alternatives; provides central coordination of annual capital funding process for Distribution and maintains and administers the Risk Registry database, evaluates and prioritizes specific risk mitigations for Distribution assets; develops strategies for Distribution infrastructure including building and implementing stochastic models for asset life-cycle analysis and other ad hoc asset specific requests; creates retail and system load and energy forecasts providing regular updates to senior management and analyses of key drivers; provides data support and analyses for financial disclosures; and provides analyses and reporting of current sales and peak demand levels relative to forecasts.
General Allocator Assets/Revenue/No. of Employees
Risk Management services that could not be directly charged to a specific legal entity and are corporate in nature. Because these services are comprised of a broad spectrum of activities, no measurable method of cost causative allocation was found to allocate these costs therefore the three-factor formula was used. These services are allocated to a subset of companies based on who benefits from the services.
44.2197%
200086 170 Legal & Claims Services Legal & Claims Services includes the labor and non-labor costs for operating and non-operating legal services related to: labor and employment law, litigation, rates and regulation, environmental matters, real estate, contracts, and claims services related to casualty, public, and company claims.
General Allocator Assets/Revenue/No. of Employees
Legal & Claims Services that could not be directly charged to a specific legal entity and are corporate in nature. Because these services are comprised of a broad spectrum of activities, no measurable method of cost causative allocation was found to allocate these costs therefore the three-factor formula was used. These services are allocated to a subset of companies based on who benefits from the services.
44.2197%
200087 123 Accounting, Reporting & Tax - Regulated
Accounting, Reporting & Tax - Regulated includes the labor and non-labor costs associated with operating company revenue accounting, budgeting, regulatory reporting, sales and use taxes, business area support for utility areas, operating company budgeting support, and capital asset accounting.
General Allocator Assets/Revenue/No. of Employees
Accounting, Reporting & Tax - Regulated services that could not be directly charged to a specific legal entity and are corporate in nature. Because these services are comprised of a broad spectrum of activities, no measurable method of cost causative allocation was found to allocate these costs therefore the three-factor formula was used. These services are allocated to regulated companies based on who benefits from the services.
44.2315%
200088 127; 133 Accounting, Reporting, Tax & Audit Services - Regulated Electric
Accounting, Reporting, Tax & Audit Services - Regulated Electric includes the labor and non-labor costs associated specifically with operating company electric utility revenue accounting, budgeting, regulatory reporting, sales and use taxes, business area support for utility areas, operating company budgeting support, capital asset accounting auditing operating companies , evaluating and improving risk management, ethical conduct and the implementation of best practices for operating companies electric utility, conducting financial operations and information system audits, performing audits and reviews for compliance with regulatory and legal requirements and contracts with vendors and other parties; establishing and reviewing internal controls for operating companies electric utility, establishing and reviewing SOX compliance requirements/control testing and evaluating contract risks for the operating companies electric utility. Additionally, costs for electric association dues including Edision Electric Institute (EEI).
General Allocator Assets/Revenue/No. of Employees
Accounting, Reporting, Tax & Audit Services - Regulated Electric services that could not be directly charged to a specific legal entity and are corporate in nature. Because these services are comprised of a broad spectrum of activities, no measurable method of cost causative allocation was found to allocate these costs therefore the three-factor formula was used. These services are allocated to regulated companies with electric operations who benefits from the services.
44.2315%
200089 132 Audit Services - OpCo's & TransCo’s Audit Services - OpCo's & TransCo’s includes the labor and non-labor costs for auditing operating companies, evaluating and improving risk management, ethical conduct and the implementation of best practices for operating companies, conducting financial operations and information system audits, performing audits and reviews for compliance with regulatory and legal requirements and contracts with vendors and other parties; establishing and reviewing internal controls for operating companies, establishing and reviewing SOX compliance requirements/control testing and evaluating contract risks for the operating companies.
General Allocator Assets/Revenue/No. of Employees
Audit Services - OpCo's & TransCo’s services that could not be directly charged to a specific legal entity and are corporate in nature. Because these services are comprised of a broad spectrum of activities, no measurable method of cost causative allocation was found to allocate these costs therefore the three-factor formula was used. These services are allocated to the operating companies and Transmission-only companies who benefit from the services. 44.2315%
200090 146 Risk Management - OpCo's & TransCo’s
Risk Management - OpCo's & TransCo’s includes the labor and non-labor costs of oversight and administrative of operating company risk management work, working with counterparties to establish enabling agreements with operating companies, risk management reports including all operating companies (such as CDAD - Contract Development, Approval & Delegation or TRC- Transaction Review Committee Reporting).
General Allocator Assets/Revenue/No. of Employees
Risk Management - OpCo's & TransCo’s services that could not be directly charged to a specific legal entity are corporate in nature. Because these services are comprised of a broad spectrum of activities, no measurable method of cost causative allocation was found to allocate these costs therefore the three-factor formula was used. These services are allocated to the operating companies and Transmission-only companies who benefit from the services.
44.2315%
200091 147 Captive Insurance Captive Insurance - The Property Loss Control Engineers services includes the labor and non-labor costs for each primary Operating Company(s) as well as all of Energy Supply Services. Having an expertise in an area, they lend support to each other and members of Energy Supply, and the Utilities Group, throughout the corporation. Fire Protection, Transformer Maintenance, Turbine Characteristics, Policies and Procedures are some of the areas in which expertise has been developed. This expertise is then shared on a regular basis to the benefit of all OpCo's and it is further shared at periodic Engineering meetings hosted by Hazard Insurance, which bring together Engineers from the OpCo's, the Property Loss Control Engineers and Insurance Company representatives to promote Loss Control.
General Allocator Assets/Revenue/No. of Employees
Captive Insurance services that could not be directly charged to a specific legal entity and are corporate in nature. Because these services are comprised of a broad spectrum of activities, no measurable method of cost causative allocation was found to allocate these costs therefore the three-factor formula was used. These services are allocated to a subset of companies who benefit from the services.
44.2315%
200092 162 Corporate Strategy & Business Development
Corporate Strategy & Business Development services include the labor and non-labor costs associated with providing leadership for the implementation of company-wide business strategies and plans; portfolio management including the evaluation of potential opportunities for mergers, acquisitions and divestitures; providing financial, analytical and reporting support; researching and providing business intelligence information.
General Allocator Assets/Revenue/No. of Employees
Corporate Strategy & Business Development services that could not be directly charged to a specific legal entity and are corporate in nature. Because these services are comprised of a broad spectrum of activities, no measurable method of cost causative allocation was found to allocate these costs therefore the three-factor formula was used. These services are allocated to a subset of companies who benefit from the services.
44.2315%
200093 174 Legal - OpCo's & TransCo’s Legal - OpCo's & TransCo’s services include the labor and non-labor costs for operating companies legal services related to: labor and employment law, litigation, rates and regulation, environmental matters, real estate and contracts.
General Allocator Assets/Revenue/No. of Employees
Legal - OpCo's & TransCo’s services that could not be directly charged to a specific legal entity and are corporate in nature. Because these services are comprised of a broad spectrum of activities, no measurable method of cost causative allocation was found to allocate these costs therefore the three-factor formula was used. These services are allocated to the operating companies and Transmission-only companies who benefit from the services.
44.2315%
200094 416 Supply Chain Supply Chain includes the labor and non-labor costs for operating companies diversity program expenses as well as various dues for specific sponsored agencies (Chamber of Commerce, social service dues, etc.)
General Allocator Assets/Revenue/No. of Employees
Supply chain services that could not be directly charged to a specific legal entity and are corporate in nature. Because these services are comprised of a broad spectrum of activities, no measurable method of cost causative allocation was found to allocate these costs therefore the three-factor formula was used. These services are allocated to the operating companies who benefit from the services.
44.2315%
200095 430 Energy Supply Asset Management Energy Supply Asset Management services includes the labor and non-labor costs of providing management support to the Energy Supply organization, maximizing business value of the Energy Supply information systems, developing the business plan, optimizing plant inventory, and leading the development of asset management strategy and implementation.
General Allocator Assets/Revenue/No. of Employees
Energy Supply Asset Management services that could not be directly charged to a specific legal entity and are corporate in nature. Because these services are comprised of a broad spectrum of activities, no measurable method of cost causative allocation was found to allocate these costs therefore the three-factor formula was used. These services are allocated to a subset of companies based on who benefits from the services.
44.2315%
200096 431 Energy Markets - Business Services Energy Markets Business Services includes the labor and non-labor costs for financial analysis, budgeting and administrative support, managerial reporting and business planning and process initiatives, independent daily forward valuation and risk measurement of commodity transactions and system fuel and purchase power requirements to meet system loads, as well as proprietary or trading transactions; creates retail system load and energy forecasts providing regular updates to senior management and analyses of key drivers, reviews and provides comments to dealmakers on non-standard agreements and associated confirmation agreements in the areas of coal supply, gas supply, wood fuel, rail, trucking, structured power purchases and nuclear/uranium concentrates and services; provides analyses for electric/gas hedge studies and sensitivities; creates load management forecast, jurisdictional peak demand forecasts, and cost of service studies for energy trading and marketing.
General Allocator Assets/Revenue/No. of Employees
Energy Markets - Business Services that could not be directly charged to a specific legal entity and are corporate in nature. Because these services are comprised of a broad spectrum of activities, no measurable method of cost causative allocation was found to allocate these costs therefore the three-factor formula was used. These services are allocated to a subset of companies based on who benefits from the services.
44.2315%

Northern States Power Company
Service Company Allocation Descriptions, Methods and NSPM (Total Company) Percentages - Using Headcount
Docket No. E002/GR-20-723Exhibit___(RLB-1), Schedule 4
Page 4 of 7
2021 Test Year Budget
SAP JDE
Cost Center Work Order No. Cost Center Description Description of Services ProvidedGeneral Allocator/
Cost Causative Allocation Method Reasonableness of Allocation MethodNSPM Alloc Percent 2020
200097 533; 535; 539; 542 Accounting and Finance Software Applications Maintenance
Accounting and Finance Software Applications Maintenance services include the labor and non-labor operating costs for the application development and maintenance of the software applications used for accounting and finance business functions.
General Allocator Assets/Revenue/No. of Employees
Accounting and Finance Software Applications Maintenance - The Business Systems expenses related to maintenance of this system that could not be directly charged to a specific legal entity and are corporate in nature. Because these services are comprised of a broad spectrum of activities, no measurable method of cost causative allocation was found to allocate these costs therefore the three-factor formula was used. These services are allocated to a subset of companies based on who benefits from the services.
44.2315%
200098 468 Electric Transmission FERC 566 Electric Transmission FERC 566 services include Transmission electric labor and non-labor costs associated with accounting, budgeting, regulatory reporting, and capital asset accounting.
General Allocator Assets/Revenue/No. of Employees
Electric Transmission FERC 566 charges that cannot be directly charged to a specific legal entity and are corporate in nature. The three-factor formula is used because these charges are comprised of a broad spectrum of activities and no measurable method of cost causative allocation was found. 44.2315%
200099 469 Electric Distribution FERC 588 Electric Distribution FERC 588 services include electric Distribution labor and non-labor costs associated with accounting, budgeting, regulatory reporting, and capital asset accounting.
General Allocator Assets/Revenue/No. of Employees
Electric Distribution FERC 588 charges that cannot be directly charged to a specific legal entity and are corporate in nature. The three-factor formula is used because these charges are comprised of a broad spectrum of activities and no measurable method of cost causative allocation was found.
44.2315%
200100 134 Accounting, Reporting, Tax & Audit Services – Regulated Gas
Accounting, Reporting, Tax & Audit Services – Regulated Gas includes the labor and non-labor costs associated specifically with gas utility revenue accounting, budgeting, regulatory reporting, sales and use taxes, business area support for utility areas, capital asset accounting, auditing, evaluating and improving risk management, ethical conduct and the implementation of best practices for operating companies gas utility, conducting financial operations and information system audits, performing audits and reviews for compliance with regulatory and legal requirements and contracts with vendors and other parties; establishing and reviewing internal controls for operating companies gas utility, establishing and reviewing SOX compliance requirements/control testing and evaluating contract risks for the operating companies gas utility. Additionally, costs for gas association dues including American Gas Association (AGA).
General Allocator Assets/Revenue/No. of Employees
Accounting, Reporting, Tax & Audit Services – Regulated Gas services that could not be directly charged to a specific legal entity and are corporate in nature. Because these services are comprised of a broad spectrum of activities, no measurable method of cost causative allocation was found to allocate these costs therefore the three-factor formula was used. These services are allocated to the operating companies gas utility who benefit from the services. 51.8728%
200101 164 Legal Gas Legal Gas services include the labor and non-labor costs for operating companies gas utility legal services related to: labor and employment law, litigation, rates and regulation, environmental matters, real estate and contracts. This is primarily used by the General Counsel area.
General Allocator Assets/Revenue/No. of Employees
Legal Gas services that could not be directly charged to a specific legal entity and are corporate in nature. Because these services are comprised of a broad spectrum of activities, no measurable method of cost causative allocation was found to allocate these costs therefore the three-factor formula was used. These services are allocated to the operating companies who benefit from the services.
51.8728%
200102 470 Gas Distribution FERC 880 Gas Distribution FERC 880 services include gas Distribution labor and non-labor costs associated with accounting, budgeting, regulatory reporting, and capital asset accounting.
General Allocator Assets/Revenue/No. of Employees
Gas Distribution FERC 880 charges that cannot be directly charged to a specific legal entity and are corporate in nature. The three-factor formula is used because these charges are comprised of a broad spectrum of activities and no measurable method of cost causative allocation was found. 51.8728%
200105 125 Accounting & Reporting - NSPM & NSPW
Accounting & Reporting - NSPM & NSPW includes the labor and non-labor costs associated with NSPM & NSPW accounting, budgeting, regulatory reporting, sales and use taxes, business area support for utility areas, operating company budgeting support, and capital asset accounting.
General Allocator Assets/Revenue/No. of Employees
Accounting & Reporting - NSPM & NSPW services that could not be directly charged to a specific legal entity and are corporate in nature. Because these services are comprised of a broad spectrum of activities, no measurable method of cost causative allocation was found to allocate these costs therefore the three-factor formula was used. These services are allocated to NSPM & NSPW who benefit from the services.
86.8054%
200106 126 Accounting & Reporting Electric - NSPM & NSPW
Accounting & Reporting Electric - NSPM & NSPW includes the labor and non-labor costs associated with NSPM & NSPW accounting, budgeting, regulatory reporting, sales and use taxes, business area support for utility areas, operating company budgeting support, and capital asset accounting specific to the electric utility.
General Allocator Assets/Revenue/No. of Employees
Accounting & Reporting Electric - NSPM & NSPW services that could not be directly charged to a specific legal entity are corporate in nature. Because these services are comprised of a broad spectrum of activities, no measurable method of cost causative allocation was found to allocate these costs therefore the three-factor formula was used. These services are allocated to NSPM & NSPW electric utility who benefit from the services.
86.8054%
200107 172 Legal - NSPM & NSPW Legal - NSPM & NSPW services include the labor and non-labor costs for legal services related to: labor and employment law, litigation, rates and regulation, environmental matters, real estate and contracts specific to NSPM & NSPW. This is primarily used by the General Counsel area.
General Allocator Assets/Revenue/No. of Employees
Legal - NSPM & NSPW services that could not be directly charged to a specific legal entity are corporate in nature. Because these services are comprised of a broad spectrum of activities, no measurable method of cost causative allocation was found to allocate these costs therefore the three-factor formula was used. These services are allocated to NSPM & NSPW who benefit from the services.
86.8054%
200108 N/A Advanced Metering Infrastructure (AMI)
Advanced Metering Infrastructure (AMI) includes the labor and non-labor costs associated with AMI. Cost Causative No. of AMI Enabled Meters Advanced Metering Infrastructure (AMI) using No. of AMI Enabled Meters to allocate costs is reasonable because there is a cost causative relationship with the companies with AMI enabled meters. 40.9918%
200111 544 Enterprise Application Integration (EAI)
Enterprise Application Integration (EAI) includes the labor and non-labor costs associated with the management of information systems infrastructure and working with IT Project Managers to ensure that new systems are positioned to function as successfully as possible in terms of overall performance and communication with other systems.
Cost Causative Average of a Select Set of Software Allocators
Enterprise Application Integration (EAI) using average of selected software systems to allocate costs is reasonable because EAI is primarily the server costs supporting the selected software applications and benefits the companies using the software applications. 39.7177%
200112 562 Mainframe Charges Mainframe Charges include labor and non-labor costs related to mainframe expenses for development, maintenance, and licensing. The Mainframe is comprised of three applications: Time, Gas Management System, and Monitoring Device Management System applications. This is used primarily by the Business Systems Organization.
Cost Causative Average of a Select Set of Software Allocators
Mainframe Charges expenses cannot be directly charged to a specific legal entity as the system is used by multiple entities. Using an average of selected software systems to allocate costs is reasonable because Mainframe primarily supports these selected software systems. 28.1006%
200115 514 Miscellaneous Applications Miscellaneous Applications includes the labor and non-labor costs associated with the management of information systems infrastructure and working with IT project managers to ensure that new systems are positioned to function as successfully as possible in terms of overall performance and communication with other systems.
Cost Causative Average of All Software Percentages
Miscellaneous Applications using average of all software systems to allocate costs is reasonable because Miscellaneous Applications is primarily the server costs supporting the software applications and benefits the companies using the software applications. 36.3529%
200116 441 Distribution Electric Supervision & Engineering (S&E) FERC 580
Distribution Electric Supervision & Engineering (S&E) FERC 580 services includes the labor and expenses incurred in the general supervision and direction of the operation of the electric distribution system.
Cost Causative Electric Distribution Plant Distribution Electric Supervision & Engineering (S&E) FERC 580 using the electric distribution plant to allocate the costs is reasonable because there is a cost causative relationship with the operations supported by electric distribution.
35.1704%
200117 453 Distribution Electric Metering FERC 586
Distribution Electric Metering FERC 586 services include labor, materials used, and expenses incurred in the operation of customer meters and associated equipment (e.g. electric distribution meters standards and development, meter purchases, etc.
Cost Causative Electric Distribution Plant Distribution Electric Metering FERC 586 using electric distribution plant to allocate meter costs is reasonable because there is a cost causative relationship with the electric distribution plant and meter operations supported by electric distribution.
35.1704%
200118 527 Distribution Electric Load Dispatching/EMS FERC 581
Distribution Electric Load Dispatching/EMS FERC 581 services include labor, materials used, and expenses incurred in load dispatching operations pertaining to the distribution of electricity. This includes Energy Management Systems (EMS) which provides supervisory control and data acquisition (SCADA) of substation devices through Remote Terminal Units (RTU's).
Cost Causative Electric Distribution Plant Distribution Electric Load Dispatching/EMS FERC 581 using electric distribution plant to allocate costs is reasonable because there is a cost causative relationship with the operations supported by load dispatching/EMS-distribution. 35.1704%
200119 506; 507; 559 Distribution Electric & Gas Miscellaneous FERC 588 & 880
Distribution Electric & Gas Miscellaneous FERC 588 & 880 services include labor, materials used, and expenses incurred in distribution system operation not provided for elsewhere. This includes software system labor and non-labor costs for the maintenance that support the electric and gas distribution to our customers as well as non-capital engineering & supervision costs.
Cost Causative Electric Distribution Plant/ Gas Distribution Plant
Distribution Electric & Gas Miscellaneous FERC 588 & 880 using a ratio of electric distribution plant/gas distribution plant to allocate costs is reasonable because there is a cost causative relationship between the work performed by operations and distribution plant. 32.9253%
200120 536 Distribution Electric & Gas Miscellaneous NSPM & PSCo FERC 588 & 880
Distribution Electric & Gas Miscellaneous NSPM & PSCo FERC 588 & 880 includes the labor and non-labor operating costs for the application used to design distribution electric and gas service. This includes the application development and maintenance costs, and licensing fees.
Cost Causative Electric Distribution Plant/ Gas Distribution Plant
Distribution Electric & Gas Miscellaneous NSPM & PSCo FERC 588 & 880 using a ratio of electric distribution plant/gas distribution plant to allocate costs is reasonable because the costs are directly related to designing of the NSPM and PSCo electric and gas distribution systems.
39.5073%
200121 474 Distribution Electric & Gas and Transmission Gas Miscellaneous FERC 588, 880, & 859
Distribution Electric & Gas and Transmission Gas Miscellaneous FERC 588, 880, & 859 services include gas distribution, gas transmission, and electric distribution labor and non-labor costs associated with accounting, budgeting, and regulatory reporting.
Cost Causative Electric Distribution Plant/ Gas Transmission Plant/ Gas Distribution Plant
Distribution Electric & Gas and Transmission Gas Miscellaneous FERC 588, 880, & 859 charges that cannot be directly charged to a specific business unit and are corporate in nature. Using a ratio of electric distribution plant/gas transmission plant/gas distribution plant to allocate Utility Group costs is reasonable because there is a cost causative relationship with operations supported by Utilities Group.
31.3180%
200122 442 Transmission Electric Supervision & Engineering (S&E) FERC 560
Transmission Electric Supervision & Engineering (S&E) FERC 560 services include labor and expenses incurred in the general supervision and direction of the operation of the electric transmission system as a whole.
Cost Causative Electric Transmission Plant Transmission Electric Supervision & Engineering (S&E) FERC 560 using electric transmission plant to allocate costs is reasonable because there is a cost causative relationship with the operations supported by transmission electric.
33.5462%

Northern States Power Company
Service Company Allocation Descriptions, Methods and NSPM (Total Company) Percentages - Using Headcount
Docket No. E002/GR-20-723Exhibit___(RLB-1), Schedule 4
Page 5 of 7
2021 Test Year Budget
SAP JDE
Cost Center Work Order No. Cost Center Description Description of Services ProvidedGeneral Allocator/
Cost Causative Allocation Method Reasonableness of Allocation MethodNSPM Alloc Percent 2020
200123 451 Transmission Electric Reliability, Planning, & Standards Development FERC 561.5
Transmission Electric FERC 561.5 services include labor, materials used, and expenses incurred for the system planning of the interconnected bulk electric transmission systems within a planning authority area. Activities include transmission reliability, planning and standards development related to transmission assets and reliability needs and transmission customers’ requirements and requests (e.g. developing and maintaining transmission system models, applying methodologies and tools for analysis and simulation of systems, notification of any planned transmission changes and impacts, etc.).
Cost Causative Electric Transmission Plant Transmission Electric Reliability, Planning, & Standards Development FERC 561.5 using electric transmission plant to allocate costs is reasonable because there is a cost causative relationship with the operations supported by transmission electric.
33.5462%
200124 526 Transmission Electric Load Dispatch-Monitor and Operate Transmission System FERC 561.2
Transmission Electric Load Dispatch-Monitor and Operate Transmission System FERC 561.2 services include labor, materials used, and expenses incurred to monitor, assess and operate the power system and individual transmission facilities in real-time to maintain safe and reliable operation of the transmission system. This also includes the expense incurred to manage transmission facilities to maintain system reliability and to monitor the real-time flows and direct actions according to regional plans and tariffs as necessary.
Cost Causative Electric Transmission Plant Transmission Electric Load Dispatch-Monitor and Operate Transmission System FERC 561.2 using electric transmission plant to allocate costs is reasonable because there is a direct causal relationship with the operations supported by EMS-transmission.
33.5462%
200125 449 Transmission Electric Supervision & Engineering (S&E) NSPM & NSPW FERC 560
Transmission Electric Supervision & Engineering (S&E) NSPM & NSPW FERC 560 services include labor and expenses incurred in the general supervision and direction of the operation of the electric transmission system as a whole. This allocation is used when NSPM and NSPW are the only jurisdictions benefiting from the services.
Cost Causative Electric Transmission Plant Transmission Electric Supervision & Engineering (S&E) NSPM & NSPW FERC 560 using electric transmission plant to allocate costs is reasonable because there is a direct causal relationship with the operations supported by transmission electric. 73.7152%
200126 423; 440; 525 Utilities Group Administrative & General (A&G) FERC 921
Utilities Group Administrative & General (A&G) FERC 921 services includes the labor and non-labor costs for utilities group leadership, management and support services for the Distribution, Transmission, transportation and supply chain areas.
Cost Causative Electric Transmission Plant/ Electric Distribution Plant/ Gas Transmission Plant/Gas Distribution Plant
Utilities Group Administrative & General (A&G) FERC 921 using delivery gross plant to allocate costs is reasonable because these costs are directly related to the electric and gas delivery systems.
32.1625%
200127 443 Distribution Gas Supervision & Engineering (S&E) FERC 870
Distribution Gas Supervision & Engineering (S&E) FERC 870 services include labor and expenses incurred in the general supervision and direction of gas distribution system operations.
Cost Causative Gas Distribution Plant Distribution Gas Supervision & Engineering (S&E) FERC 870 using gas distribution plant to allocate costs is reasonable because there is a cost causative relationship with the operations supported by distribution gas. 27.0963%
200128 445 Distribution Gas Miscellaneous FERC 880
Distribution Gas Miscellaneous FERC 880 services include the cost of distribution maps and records, distribution office expenses, and the cost of miscellaneous labor and materials used, and expenses incurred in gas distribution systems. Additionally, the labor and non-labor costs for non-capital engineering and supervision.
Cost Causative Gas Distribution Plant Distribution Gas Miscellaneous FERC 880 using gas distribution plant to allocate costs is reasonable because there is a cost causative relationship with the operations supported by Distribution Gas.
27.0963%
200129 454 Distribution Gas Meters and House Regulators FERC 878
Distribution Gas Meters and House Regulators FERC 878 services include the cost of labor, materials used and expenses incurred in connection with removing, resetting, changing, testing, and servicing customer meters and house regulators.
Cost Causative Gas Distribution Plant Distribution Gas Meters and House Regulators FERC 878 using gas distribution plant to allocate meter costs is reasonable because there is a cost causative relationship with the gas distribution plant and meter operations supported by gas distribution.
27.0963%
200130 444 Transmission Gas Supervision & Engineering (S&E) FERC 850
Transmission Gas Supervision & Engineering (S&E) FERC 850 services include the cost of labor and expenses incurred in the general supervision and direction of the operation of transmission facilities.
Cost Causative Gas Transmission Plant Transmission Gas Supervision & Engineering (S&E) FERC 850 using gas transmission plant to allocate costs is reasonable because there is a cost causative relationship with the operations supported by transmission gas. 9.4475%
200131 531 Distribution & Transmission Gas System Control and Load Dispatching FERC 851 & 871
Distribution & Transmission Gas System Control and Load Dispatching FERC 851 & 871 include the cost of labor, materials used, and expenses incurred in dispatching and controlling the supply and flow of gas through the gas distribution and transmission systems. Additionally, costs include the labor and non-labor costs for the application development and maintenance of the Gas SCADA system.
Cost Causative Gas Transmission Plant/ Gas Distribution Plant
Distribution & Transmission Gas System Control and Load Dispatching FERC 851 & 871 using a ratio of gas transmission plant/gas distribution plant to allocate costs is reasonable because the costs are directly related to the monitoring of gas distribution and transmission. 23.4068%
200132 413 Payment & Reporting Payment & Reporting services includes the labor and non-labor costs associated with processing payments to vendors, providing audit research and reconciliation support for Accounts Payable transactions, preparing statistical and 1099 reporting, and administering the purchase card programs.
Cost Causative Invoice Transactions Payment & Reporting using invoice transactions to allocate costs is reasonable because the costs are directly related to invoices processed. 25.5026%
200133 128 Proprietary Trading - Back Office Proprietary Trading - Back Office includes the labor and non-labor costs associated with the accounting support and vice president oversight of proprietary trading activities. This allocator should be primarily used by Accounting and Finance, or others providing Administrative & General (A&G) activities when the trading deal doesn’t involve Xcel Energy Utility generating resources, which is also considered non-asset-based trading activity.
Cost Causative Joint Operating Agreement Peak Hour Megawatt Load Ratio
Proprietary Trading - Back Office uses the Joint Operating Agreement Peak Hour Megawatt Load Ratio for cost allocations as it is required for the Proprietary Trading services under the JOA.
36.6755%
200134 144 Proprietary Trading - Front/Mid Office FERC 557
Proprietary Trading - Front/Mid Office FERC 557 includes the labor and non-labor costs associated with proprietary trading activities which are short term transactions undertaken in the wholesale electric markets where electricity is purchased for the purpose of selling it. Also included are supporting activities: evaluating the credit worthiness of counterparties, reviewing contracts to ensure that regulations are being complied with, evaluating profitability and appropriateness of trades to ensure they are in the best interest of shareholders and rate payers, and ensuring that trades identified as proprietary appropriately fall into that category.
General Allocator Joint Operating Agreement Peak Hour Megawatt Load Ratio
Proprietary Trading - Front/Mid Office FERC 557 uses the Joint Operating Agreement Peak Hour Megawatt Load Ratio for cost allocations as it is required for the Proprietary Trading services under the JOA.
44.0811%
200135 414 Energy Supply Business Resources Energy Supply Business Resources services includes the labor and non-labor costs of performance analysis, specialists and analytical services provided to the operating companies' generation facilities.
Cost Causative MWH Generation Energy Supply Business Resources using MWH generation to allocate costs is reasonable because the costs are directly related to the support of electric generation facilities. 36.1231%
200136 415 Energy Markets - Fuel Energy Markets - Fuel includes the labor and non-labor costs for planning and implementing power supply portfolios to provide reliable service to native load and to capitalize on market opportunities including purchasing fuel for the operating companies' electric generation system (excluding nuclear) and resource planning and acquisition including purchase power and account management.
Cost Causative MWH Generation Energy Markets - Fuel using MWH generation to allocate costs is reasonable because the costs are directly related to the purchase of fuel for generation.
36.1231%
200137 455 Energy Supply Miscellaneous Power Expense FERC 506, 539, & 549
Energy Supply Miscellaneous Power Expense FERC 506, 539, & 549 services include Energy Supply operations performance services labor and non-labor costs for non-management employees with the following accountabilities: Develop / suggest / implement improvements for multiple power plants, standardize best practices and process improvements across multiple power plants, establish operations and maintenance policies and procedures for multiple power plants.
Cost Causative MWH Generation Energy Supply Miscellaneous Power Expense FERC 506, 539, & 549 using MWH generation to allocate costs is reasonable because the costs are directly related to the support of electric generation facilities.
36.1231%
200138 458 Energy Supply Operation Supervision & Engineering (S&E) FERC 500, 535, & 546
Energy Supply Operation Supervision & Engineering (S&E) FERC 500, 535, & 546 services include labor and expenses incurred in the general supervision and direction of the operation of steam powered generation stations, hydraulic power generating stations, and other power generating stations.
Cost Causative MWH Generation Energy Supply Operation Supervision & Engineering (S&E) FERC 500, 535, & 546 using MWH generation to allocate costs is reasonable because the costs are directly related to the support of electric generation facilities. 36.1231%
200139 461 Energy Supply Maintenance Supervision & Engineering (S&E) FERC 510, 541, & 551
Energy Supply Maintenance Supervision & Engineering (S&E) FERC 510, 541, & 551 services which include management and performance labor and non-labor costs for the following accountabilities: Researching, reviewing, recommending and facilitating the selection of technological alternatives for improved plant and environmental performance. Manage uniform project management process (policies). Planning for physical plant modifications, which includes consolidation and management of short-term and long-term plans for physical plant modifications. Develop and execute innovative technology projects such as: biomass, solar, wind. Implement enterprise project management (EPM) and planning tools. Establish uniform technology, design & equipment standards.
Cost Causative MWH Generation Energy Supply Maintenance Supervision & Engineering (S&E) FERC 510, 541, & 551 using MWH generation to allocate costs is reasonable because the costs are directly related to the support of electric generation facilities.
36.1231%
200143 456 Energy Supply Miscellaneous Power Expense NSPM & NSPW FERC 506, 539, & 549
Energy Supply Miscellaneous Power Expense NSPM & NSPW FERC 506, 539, & 549 services include Energy Supply operations performance services labor and non-labor costs for non-management employees with the following accountabilities: Develop / suggest / implement improvements for multiple power plants, standardize best practices and process improvements across multiple power plants, establish operations and maintenance policies and procedures for multiple power plants. This allocation is used when NSPM & NSPW jurisdictions are benefiting from the services.
Cost Causative MWH Generation Energy Supply Miscellaneous Power Expense NSPM & NSPW FERC 506, 539, & 549 using MWH generation to allocate costs is reasonable because the costs are directly related to the support of electric generation facilities.
94.1412%
200144 459 Energy Supply Operation Supervision & Engineering (S&E) NSPM & NSPW FERC 500, 535, & 546
Energy Supply Operation Supervision & Engineering (S&E) NSPM & NSPW FERC 500, 535, & 546 services include labor and expenses incurred in the general supervision and direction of the operation of steam powered generation stations, hydraulic power generating stations, and other power generating stations. This allocation is used when NSPM & NSPW jurisdictions are benefiting from the services.
Cost Causative MWH Generation Energy Supply Operation Supervision & Engineering (S&E) NSPM & NSPW FERC 500, 535, & 546 using MWH generation to allocate costs is reasonable because the costs are directly related to the support of electric generation facilities. 94.1412%

Northern States Power Company
Service Company Allocation Descriptions, Methods and NSPM (Total Company) Percentages - Using Headcount
Docket No. E002/GR-20-723Exhibit___(RLB-1), Schedule 4
Page 6 of 7
2021 Test Year Budget
SAP JDE
Cost Center Work Order No. Cost Center Description Description of Services ProvidedGeneral Allocator/
Cost Causative Allocation Method Reasonableness of Allocation MethodNSPM Alloc Percent 2020
200145 462 Energy Supply Maintenance Supervision & Engineering (S&E) NSPM & NSPW FERC 510, 541, & 551
Energy Supply Maintenance Supervision & Engineering (S&E) NSPM & NSPW FERC 510, 541, & 551 services which include management and performance labor and non-labor costs for the following accountabilities: Researching, reviewing, recommending and facilitating the selection of technological alternatives for improved plant and environmental performance. Manage uniform project management process (policies). Planning for physical plant modifications, which includes consolidation and management of short-term and long-term plans for physical plant modifications. Develop and execute innovative technology projects such as: biomass, solar, wind. Implement enterprise project management (EPM) and planning tools. Establish uniform technology, design & equipment standards. This allocation is used when NSPM & NSPW jurisdictions are benefiting from the services.
Cost Causative MWH Generation Energy Supply Maintenance Supervision & Engineering (S&E) NSPM & NSPW FERC 510, 541, & 551 using MWH generation to allocate costs is reasonable because the costs are directly related to the support of electric generation facilities.
94.1412%
200146 429 Energy Markets - Regulated Trading Energy Markets - Regulated Trading services include the labor and non-labor costs of providing electric trading services to the operating companies' electric generation systems, including load management, system optimization and origination.
Cost Causative MWH Hours Sold Energy Markets - Regulated Trading using MWH hours sold to allocate costs is reasonable because there is a cost causative relationship between regulated trading activities and the MWH hours sold. 36.2782%
200147 554 Business Objects Business Objects includes the labor and non-labor costs for the application that provides critical reporting from data universes and tables.
Cost Causative No. of Business Objects Users Business Objects using No. of Business Object users to allocate costs is reasonable because the costs are directly related to users who can access the application. 52.3185%
200148 500; 524 Business Systems Business Systems services includes the costs of providing assistance to computer users across the company. Specifically computer technology risk, software maintenance on applications Distributed to all users (e.g. Microsoft PC tools), governance and project management over all IT projects, fixed management fees with outside vendors, business analytics costs, corrective and preventative maintenance, security, data backup and recovery, help desk, and amortization of outside vendor fees and costs that are not specific to an application that has a specific allocator.
Cost Causative No. of Computers Business Systems using No. of computers to allocate costs is reasonable because there is a cost causative relationship between the No. of computers and the cost to support them.
50.4433%
200149 534 Customer & Enterprise Solutions (CES)
Customer & Enterprise Solutions (CES) includes the labor and non-labor costs for the leadership of the Customer & Enterprise Solutions organization and their administrative support staff.
Cost Causative No. of Computers/ No. of Customers/ No. of Employees
Customer & Enterprise Solutions (CES) using a ratio of No. of Computers/Customers/Employees to allocate costs is reasonable because there is a cost causative relationship with the operations supported by CES. 44.8700%
200150 520 Interactive Voice Response (IVR) Interactive Voice Response (IVR) includes the labor and non-labor costs for the application development and maintenance of the Interactive Voice Response system which interacts with a customer calling Xcel Energy call centers. It is intended to help service customers without invoking a call center agent. If the call needs to be handled by an agent, account information and the reason for the call is determined which helps route the call to the appropriate agent.
Cost Causative No. of Contacts Interactive Voice Response (IVR) using No. of contacts to allocate costs is reasonable because this system is used to take and route customer calls and benefits customers using the call centers.
34.2896%
200151 447 Customer Billing FERC 903 Customer Billing FERC 903 includes the labor and non-labor costs related to the delivery of billing statements, letters and notices to Xcel customers including postage and outside services costs, oversight and administration of customer billing area, research of billing exceptions, providing escalated customer service assistance with regard to billing issues resolution, and process remittances and receivables. This allocation is used when all four jurisdictions are benefiting from the services.
Cost Causative No. of Customer Bills Customer Billing FERC 903 using No. of customer bills to allocate costs is reasonable because the costs are directly related to customer billing activities.
39.2309%
200152 436 Customer Care FERC 902 Customer Care FERC 902 services includes the labor and non-labor costs for meter reading of retail and wholesale customers and determining consumption for billing purposes as well as executing field collections.
Cost Causative No. of Customers Customer Care FERC 902 using No. of customers to allocate costs is reasonable because the costs are directly related to customers. 35.2992%
200153 185 Customer Safety Advertising & Information Costs
Customer Safety Advertising & Information costs services includes the labor and non-labor costs associated with public safety advertising, information and education.
Cost Causative No. of Customers Customer Safety Advertising & Information Costs using No. of customers to allocate costs is reasonable because the costs are directly related to customers. 35.3489%
200154 403 Customer Service Information Technology (IT) FERC 903
Customer Service Information Technology (IT) FERC 903 services includes the labor and non-labor costs for IT applications related customer billing to customers, call center support and credit and collections.
Cost Causative No. of Customers Customer Service Information Technology (IT) FERC 903 using No. of customers to allocate costs is reasonable because the costs are directly related to customers. 35.3489%
200155 435 Customer Care FERC 903 Customer Care FERC 903 services includes the labor and non-labor costs for contact centers, remittance processing, credit and collections, customer resource management, and contact center training. This allocation is used when all four jurisdictions are benefiting from the services such as responding to residential customer inquiries regarding billings and outages, handling inbound credit calls, outbound collections calls, managing accounts receivables, training call center staffs, developing contact center call forecasts.
Cost Causative No. of Customers Customer Care FERC 903 using No. of customers to allocate costs is reasonable because the costs are directly related to customers.
35.3489%
200156 437 Customer Care FERC 901 Customer Care FERC 901 services includes the labor and non-labor costs for the leadership of the customer care organization and their administrative support staff such as consulting costs to support overall Customer Care organizational operations.
Cost Causative No. of Customers Customer Care FERC 901 using No. of customers to costs is reasonable because the costs are directly related to customers. 35.3489%
200159 405 Customer Service Information Technology (IT) NSPM & NSPW FERC 903
Customer Service Information Technology (IT) NSPM & NSPW FERC 903 services includes the labor and non-labor costs for IT applications related customer billing to customers, call center support and credit and collections. This allocation is used when NSPM & NSPW jurisdictions are benefiting from the services.
Cost Causative No. of Customers Customer Service Information Technology (IT) NSPM & NSPW FERC 903 using No. of customers to allocate costs is reasonable because the costs are directly related to customers. 84.2278%
200160 439 Customer Care NSPM & NSPW FERC 903
Customer Care NSPM & NSPW FERC 903 services includes the labor and non-labor costs for contact centers, and credit and collections, such as responding to commercial customers inquiries at the Business Solution Center. This is primarily used by the Customer Care organization when NSPM & NSPW jurisdictions are benefiting from the services.
Cost Causative No. of Customers Customer Care NSPM & NSPW FERC 903 using No. of customers to allocate costs is reasonable because the costs are directly related to customers.
84.2278%
200161 446 Customer Care Low Income Assistance FERC 908
Customer Care Low Income Assistance FERC 908 services includes the labor and non-labor costs associated with the low income energy customer program such as answering calls from customers for referral to low income assistance agencies, providing information to the agencies in order to process applications for assistance, take pledges/commitments from agencies and process payments from agencies.
Cost Causative No. of Residential Customers Customer Care Low Income Assistance FERC 908 using No. of residential customers to allocate costs is reasonable because the costs are directly related to customers.
42.1903%
200162 519 Call Logging and Quality Management (CL/QM) FERC 903
Call Logging and Quality Management (CL/QM) FERC 903 includes the labor and non-labor operating costs for the application development and maintenance of the Call Logging and Quality Management system which is used to monitor and record calls for contact center training and leadership teams.
Cost Causative No. of Customers/ No. of Contacts
Call Logging and Quality Management (CL/QM) FERC 903 using a ratio of no. of customers/no. of contacts to allocated costs is reasonable because the system benefits current and potential customers using the call centers. 34.8192%
200163 181 Employee Communications Employee Communications includes the labor and non-labor costs for the development and enhancement of employee awareness and understanding of the company's strategies, priorities, decisions and performance objectives. It develops and produces regular communication vehicles, including TODAY (daily news bulleting on intranet); XTRA (monthly print publication for all employees and retirees); All Managers E-mail (real-time communication for employees who supervise and manage others); Focus on Financials for all employees; targeted communications for specific business areas, such as Human Resources, and employee meetings.
Cost Causative No. of Employees Employee Communications using No. of Employees to allocate costs is reasonable because the costs are directly related to employees.
48.7308%
200164 198 Payroll Payroll services include the labor and non-labor costs for processing payroll including consolidation of time collection, calculation of salaries and wages, administration of employee deductions, account Distribution and reconciliation, allocation and accounting for employment taxes and compliance reports.
Cost Causative No. of Employees Payroll using No. of Employees to allocate costs is reasonable because the costs are directly related to employees.48.7308%
200165 515; 521; 552 Employee Management Systems Employee Management Systems includes the labor and non-labor costs for the Security Operations Center (SOC), Time capture and processing for payroll and accounting and Human Resources software. These applications and services provide services for the whole company related to enterprise security, including physical access, security monitoring and investigations, payroll and time accounting and employee information databases.
Cost Causative No. of Employees Employee Management Systems using No. of Employees to allocate costs is reasonable because the costs are directly related to employees.
48.7308%
200166 190; 197; 199 Human Resources (Diversity/Safety/Employee Relations)
Human Resources (Diversity/Safety/Employee Relations) includes the labor and non-labor costs for work performed for operating and affiliate company employees, such as diversity programs, providing workforce relations resources for labor agreements, arbitration, and training. Manage, design, and implement Corporate Safety initiatives. Staffing administration for non-bargaining positions and provides Affirmative Action plans (development) and government audit management (compliance).
Cost Causative No. of Employees Human Resources (Diversity/Safety/Emp Relations) using No. of Employees to allocate Human Resources costs is reasonable because the costs are directly related to employees.
48.8179%
200167 508; 550 e-Business The e-Business system includes the labor and non-labor costs associated with the corporate electronic business infrastructure.
Cost Causative No. of Employees e-Business using No. of Employees to allocate costs is reasonable because the costs benefit employees.48.8179%
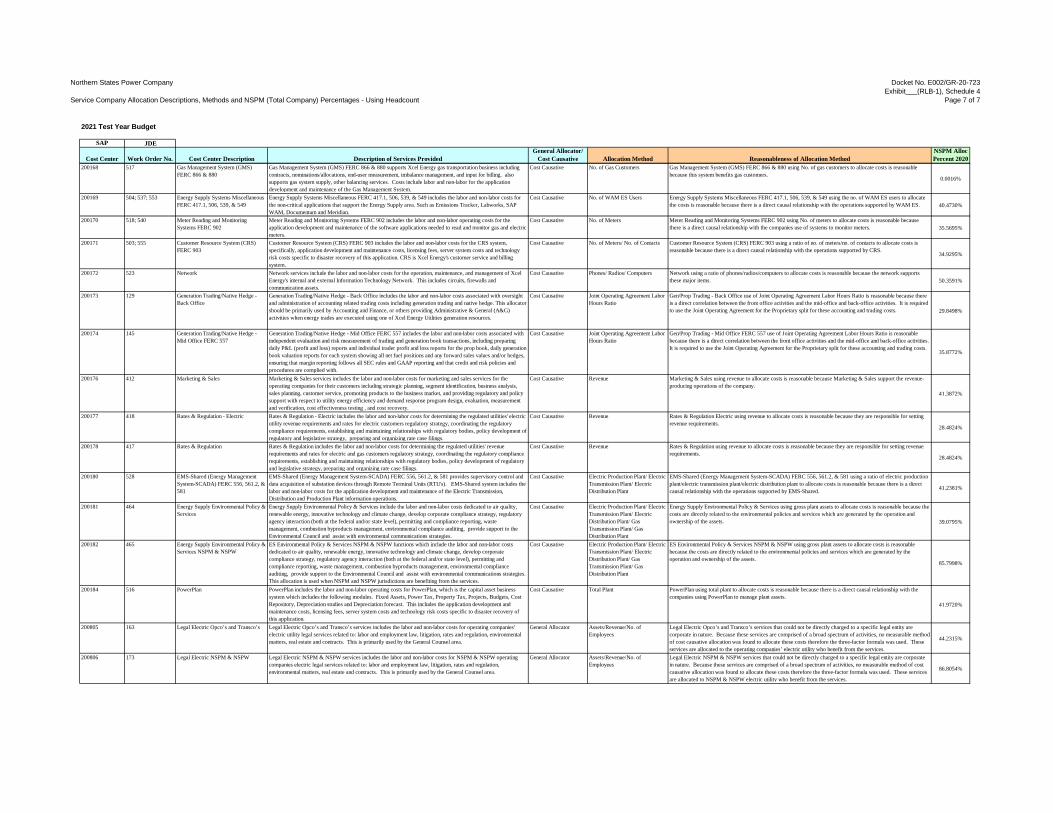
Northern States Power Company
Service Company Allocation Descriptions, Methods and NSPM (Total Company) Percentages - Using Headcount
Docket No. E002/GR-20-723Exhibit___(RLB-1), Schedule 4
Page 7 of 7
2021 Test Year Budget
SAP JDE
Cost Center Work Order No. Cost Center Description Description of Services ProvidedGeneral Allocator/
Cost Causative Allocation Method Reasonableness of Allocation MethodNSPM Alloc Percent 2020
200168 517 Gas Management System (GMS) FERC 866 & 880
Gas Management System (GMS) FERC 866 & 880 supports Xcel Energy gas transportation business including contracts, nominations/allocations, end-user measurement, imbalance management, and input for billing. also supports gas system supply, other balancing services. Costs include labor and non-labor for the application development and maintenance of the Gas Management System.
Cost Causative No. of Gas Customers Gas Management System (GMS) FERC 866 & 880 using No. of gas customers to allocate costs is reasonable because this system benefits gas customers.
0.0016%
200169 504; 537; 553 Energy Supply Systems Miscellaneous FERC 417.1, 506, 539, & 549
Energy Supply Systems Miscellaneous FERC 417.1, 506, 539, & 549 includes the labor and non-labor costs for the non-critical applications that support the Energy Supply area. Such as Emissions Tracker, Labworks, SAP WAM, Documentum and Meridian.
Cost Causative No. of WAM ES Users Energy Supply Systems Miscellaneous FERC 417.1, 506, 539, & 549 using the no. of WAM ES users to allocate the costs is reasonable because there is a direct causal relationship with the operations supported by WAM ES. 40.4730%
200170 518; 540 Meter Reading and Monitoring Systems FERC 902
Meter Reading and Monitoring Systems FERC 902 includes the labor and non-labor operating costs for the application development and maintenance of the software applications needed to read and monitor gas and electric meters.
Cost Causative No. of Meters Meter Reading and Monitoring Systems FERC 902 using No. of meters to allocate costs is reasonable because there is a direct causal relationship with the companies use of systems to monitor meters. 35.5695%
200171 503; 555 Customer Resource System (CRS) FERC 903
Customer Resource System (CRS) FERC 903 includes the labor and non-labor costs for the CRS system, specifically, application development and maintenance costs, licensing fees, server system costs and technology risk costs specific to disaster recovery of this application. CRS is Xcel Energy's customer service and billing system.
Cost Causative No. of Meters/ No. of Contacts Customer Resource System (CRS) FERC 903 using a ratio of no. of meters/no. of contacts to allocate costs is reasonable because there is a direct causal relationship with the operations supported by CRS.
34.9295%
200172 523 Network Network services include the labor and non-labor costs for the operation, maintenance, and management of Xcel Energy's internal and external Information Technology Network. This includes circuits, firewalls and communication assets.
Cost Causative Phones/ Radios/ Computers Network using a ratio of phones/radios/computers to allocate costs is reasonable because the network supports these major items. 50.3591%
200173 129 Generation Trading/Native Hedge - Back Office
Generation Trading/Native Hedge - Back Office includes the labor and non-labor costs associated with oversight and administration of accounting related trading costs including generation trading and native hedge. This allocator should be primarily used by Accounting and Finance, or others providing Administrative & General (A&G) activities when energy trades are executed using one of Xcel Energy Utilities generation resources.
Cost Causative Joint Operating Agreement Labor Hours Ratio
Gen/Prop Trading - Back Office use of Joint Operating Agreement Labor Hours Ratio is reasonable because there is a direct correlation between the front office activities and the mid-office and back-office activities. It is required to use the Joint Operating Agreement for the Proprietary split for these accounting and trading costs. 29.8498%
200174 145 Generation Trading/Native Hedge - Mid Office FERC 557
Generation Trading/Native Hedge - Mid Office FERC 557 includes the labor and non-labor costs associated with independent evaluation and risk measurement of trading and generation book transactions, including preparing daily P&L (profit and loss) reports and individual trader profit and loss reports for the prop book, daily generation book valuation reports for each system showing all net fuel positions and any forward sales values and/or hedges, ensuring that margin reporting follows all SEC rules and GAAP reporting and that credit and risk policies and procedures are complied with.
Cost Causative Joint Operating Agreement Labor Hours Ratio
Gen/Prop Trading - Mid Office FERC 557 use of Joint Operating Agreement Labor Hours Ratio is reasonable because there is a direct correlation between the front office activities and the mid-office and back-office activities. It is required to use the Joint Operating Agreement for the Proprietary split for these accounting and trading costs.
35.8772%
200176 412 Marketing & Sales Marketing & Sales services includes the labor and non-labor costs for marketing and sales services for the operating companies for their customers including strategic planning, segment identification, business analysis, sales planning, customer service, promoting products to the business market, and providing regulatory and policy support with respect to utility energy efficiency and demand response program design, evaluation, measurement and verification, cost effectiveness testing , and cost recovery.
Cost Causative Revenue Marketing & Sales using revenue to allocate costs is reasonable because Marketing & Sales support the revenue-producing operations of the company.
41.3872%
200177 418 Rates & Regulation - Electric Rates & Regulation - Electric includes the labor and non-labor costs for determining the regulated utilities' electric utility revenue requirements and rates for electric customers regulatory strategy, coordinating the regulatory compliance requirements, establishing and maintaining relationships with regulatory bodies, policy development of regulatory and legislative strategy, preparing and organizing rate case filings.
Cost Causative Revenue Rates & Regulation Electric using revenue to allocate costs is reasonable because they are responsible for setting revenue requirements.
28.4824%
200178 417 Rates & Regulation Rates & Regulation includes the labor and non-labor costs for determining the regulated utilities' revenue requirements and rates for electric and gas customers regulatory strategy, coordinating the regulatory compliance requirements, establishing and maintaining relationships with regulatory bodies, policy development of regulatory and legislative strategy, preparing and organizing rate case filings.
Cost Causative Revenue Rates & Regulation using revenue to allocate costs is reasonable because they are responsible for setting revenue requirements.
28.4824%
200180 528 EMS-Shared (Energy Management System-SCADA) FERC 556, 561.2, & 581
EMS-Shared (Energy Management System-SCADA) FERC 556, 561.2, & 581 provides supervisory control and data acquisition of substation devices through Remote Terminal Units (RTU's). EMS-Shared system includes the labor and non-labor costs for the application development and maintenance of the Electric Transmission, Distribution and Production Plant information operations.
Cost Causative Electric Production Plant/ Electric Transmission Plant/ Electric Distribution Plant
EMS-Shared (Energy Management System-SCADA) FERC 556, 561.2, & 581 using a ratio of electric production plant/electric transmission plant/electric distribution plant to allocate costs is reasonable because there is a direct causal relationship with the operations supported by EMS-Shared. 41.2381%
200181 464 Energy Supply Environmental Policy & Services
Energy Supply Environmental Policy & Services include the labor and non-labor costs dedicated to air quality, renewable energy, innovative technology and climate change, develop corporate compliance strategy, regulatory agency interaction (both at the federal and/or state level), permitting and compliance reporting, waste management, combustion byproducts management, environmental compliance auditing, provide support to the Environmental Council and assist with environmental communications strategies.
Cost Causative Electric Production Plant/ Electric Transmission Plant/ Electric Distribution Plant/ Gas Transmission Plant/ Gas Distribution Plant
Energy Supply Environmental Policy & Services using gross plant assets to allocate costs is reasonable because the costs are directly related to the environmental policies and services which are generated by the operation and ownership of the assets. 39.0795%
200182 465 Energy Supply Environmental Policy & Services NSPM & NSPW
ES Environmental Policy & Services NSPM & NSPW functions which include the labor and non-labor costs dedicated to air quality, renewable energy, innovative technology and climate change, develop corporate compliance strategy, regulatory agency interaction (both at the federal and/or state level), permitting and compliance reporting, waste management, combustion byproducts management, environmental compliance auditing, provide support to the Environmental Council and assist with environmental communications strategies. This allocation is used when NSPM and NSPW jurisdictions are benefiting from the services.
Cost Causative Electric Production Plant/ Electric Transmission Plant/ Electric Distribution Plant/ Gas Transmission Plant/ Gas Distribution Plant
ES Environmental Policy & Services NSPM & NSPW using gross plant assets to allocate costs is reasonable because the costs are directly related to the environmental policies and services which are generated by the operation and ownership of the assets.
85.7998%
200184 516 PowerPlan PowerPlan includes the labor and non-labor operating costs for PowerPlan, which is the capital asset business system which includes the following modules. Fixed Assets, Power Tax, Property Tax, Projects, Budgets, Cost Repository, Depreciation studies and Depreciation forecast. This includes the application development and maintenance costs, licensing fees, server system costs and technology risk costs specific to disaster recovery of this application.
Cost Causative Total Plant PowerPlan using total plant to allocate costs is reasonable because there is a direct causal relationship with the companies using PowerPlan to manage plant assets.
41.9720%
200805 163 Legal Electric Opco’s and Transco’s Legal Electric Opco’s and Transco’s services includes the labor and non-labor costs for operating companies’ electric utility legal services related to: labor and employment law, litigation, rates and regulation, environmental matters, real estate and contracts. This is primarily used by the General Counsel area.
General Allocator Assets/Revenue/No. of Employees
Legal Electric Opco’s and Transco’s services that could not be directly charged to a specific legal entity are corporate in nature. Because these services are comprised of a broad spectrum of activities, no measurable method of cost causative allocation was found to allocate these costs therefore the three-factor formula was used. These services are allocated to the operating companies’ electric utility who benefit from the services.
44.2315%
200806 173 Legal Electric NSPM & NSPW Legal Electric NSPM & NSPW services includes the labor and non-labor costs for NSPM & NSPW operating companies electric legal services related to: labor and employment law, litigation, rates and regulation, environmental matters, real estate and contracts. This is primarily used by the General Counsel area.
General Allocator Assets/Revenue/No. of Employees
Legal Electric NSPM & NSPW services that could not be directly charged to a specific legal entity are corporate in nature. Because these services are comprised of a broad spectrum of activities, no measurable method of cost causative allocation was found to allocate these costs therefore the three-factor formula was used. These services are allocated to NSPM & NSPW electric utility who benefit from the services.
86.8054%

Northern States Power Company
Service Company Allocation Descriptions, Methods and NSPM (Total Company) Percentages - Using FTE Hours
Docket No. E002/GR-20-723Exhibit___(RLB-1), Schedule 4a
Page 1 of 7
2021 Test Year Budget
SAP JDE
Cost Center Work Order No. Cost Center Description Description of Services ProvidedGeneral Allocator/
Cost Causative Allocation Method Reasonableness of Allocation MethodNSPM Alloc Percent 2020
200063 110 Executive - Corporate Governance Executive Corporate Governance includes the labor and non-labor costs for executive corporate management, long-term business strategy development and other programs that ensure the continuity and development of management. Corporate governance activities are generally services that are performed on behalf of all Xcel Energy operating companies and affiliates, including Xcel Energy Inc.
General Allocator Assets/Revenue/FTE Hours Executive - Corporate Governance uses the three-factor formula because it reflects the complexity, risk and overall business activity levels that drive corporate governance costs and measures the benefits received from those activities. Corporate Governance includes overall management of the corporation and benefits all companies; therefore, the General Allocator is the most appropriate method of allocation. Assets are used because the greater the value of a subsidiary's assets the more focus will be placed on that subsidiary's operations. Due to its relative effect on the consolidated business. Revenues are used because the larger the subsidiary's revenue the more focus will be placed on that subsidiary's operations due to its relative effect on the consolidated business. FTE Hours is a good measure of a subsidiary's importance to the consolidated operations and the time and attention management must pay to the subsidiary's operations.
37.7744%
200064 115 Shareholder - Corporate Governance Shareholder - Corporate Governance includes the labor and non-labor costs for serving as liaison between Xcel Energy BOD and the shareholders, manages employee/executive stock award matters, liaison between Xcel Energy and the proxy advisory group, monitoring stock ownership patterns, planning shareholder meetings, coordinating the transfer agent and shareholder record keeping functions. Corporate governance activities are generally services that are performed on behalf of all Xcel Energy operating companies and affiliates, including Xcel Energy Inc.
General Allocator Assets/Revenue/FTE Hours Shareholder - Corporate Governance uses the three-factor formula because it reflects the complexity, risk and overall business activity levels that drive corporate governance costs and measures the benefits received from those activities. Corporate Governance includes overall management of the corporation and benefits all companies; therefore, the General Allocator is the most appropriate method of allocation. Assets are used because the greater the value of a subsidiary's assets the more focus will be placed on that subsidiary's operations. Due to its relative effect on the consolidated business. Revenues are used because the larger the subsidiary's revenue the more focus will be placed on that subsidiary's operations due to its relative effect on the consolidated business. FTE Hours is a good measure of a subsidiary's importance to the consolidated operations and the time and attention management must pay to the subsidiary's operations.
37.7744%
200065 116 Investor Relations - Corporate Governance
Investor Relations - Corporate Governance includes the labor and non-labor costs for communications to investors and the financial community, providing management with feedback from investors, assisting in the communication to investors of debt and equity securities issuances, assists in the development of presentations for Board of Directors, develops and delivers Xcel Energy’s credit story to credit rating agencies, develops and presents Xcel Energy’s investment story to investors, reviews all public financial documents for accuracy and completeness and distributes all financial releases. Corporate governance activities are generally services that are performed on behalf of all Xcel Energy operating companies and affiliates, including Xcel Energy Inc.
General Allocator Assets/Revenue/FTE Hours Investor Relations - Corporate Governance uses the three-factor formula because it reflects the complexity, risk and overall business activity levels that drive corporate governance costs and measures the benefits received from those activities. Corporate Governance includes overall management of the corporation and benefits all companies; therefore, the General Allocator is the most appropriate method of allocation. Assets are used because the greater the value of a subsidiary's assets the more focus will be placed on that subsidiary's operations. Due to its relative effect on the consolidated business. Revenues are used because the larger the subsidiary's revenue the more focus will be placed on that subsidiary's operations due to its relative effect on the consolidated business. FTE Hours is a good measure of a subsidiary's importance to the consolidated operations and the time and attention management must pay to the subsidiary's operations.
37.7744%
200066 121 Accounting, Reporting & Tax - Corporate Governance
Accounting, Reporting & Tax - Corporate Governance includes the labor and non-labor costs associated with preparing and filing consolidated reporting and financial statements, preparing consolidated budgets, completing the consolidation process, maintaining the books and records of Xcel Energy Inc. and Service Company, composing the corporate-wide regulatory accounting policy and compliance, Sarbanes-Oxley (SOX) documentation and compliance, and Chief Financial Officer activities related to the Audit Committee. Provides financial leadership to Xcel Energy and provides policies, controls, and leadership to the Financial Operations business area. Corporate governance activities are generally services that are performed on behalf of all Xcel Energy operating companies and affiliates, including Xcel Energy Inc.
General Allocator Assets/Revenue/FTE Hours Accounting, Reporting & Tax - Corporate Governance uses the three-factor formula because it reflects the complexity, risk and overall business activity levels that drive corporate governance costs and measures the benefits received from those activities. Corporate Governance includes overall management of the corporation and benefits all companies; therefore, the General Allocator is the most appropriate method of allocation. Assets are used because the greater the value of a subsidiary's assets the more focus will be placed on that subsidiary's operations. Due to its relative effect on the consolidated business. Revenues are used because the larger the subsidiary's revenue the more focus will be placed on that subsidiary's operations due to its relative effect on the consolidated business. FTE Hours is a good measure of a subsidiary's importance to the consolidated operations and the time and attention management must pay to the subsidiary's operations.
37.7744%
200067 131 Audit Services - Corporate Governance Audit Services corporate governance includes the labor and non-labor costs associated with the financial operations and information system audits of the holding company and service company; evaluating and improving risk management, corporate internal control guidelines and procedures; ethical conduct and the implementation of best practices, reviewing financial reporting requirements and controls under Sarbanes-Oxley legislative
General Allocator Assets/Revenue/FTE Hours Audit Services - Corporate Governance uses the three-factor formula because it reflects the complexity, risk and overall business activity levels that drive corporate governance costs and measures the benefits received from those activities. Corporate Governance includes overall management of the corporation and benefits all companies; therefore, the General Allocator is the most appropriate method of allocation. Assets are used because the greater
37.7744%
200068 141 Corporate Finance, Treasury & Cash Management - Corporate Governance
Corporate Finance, Treasury & Cash Management - Corporate Governance includes the labor and non-labor costs related to equity and debt securities issuance, relationships with financial institutions, cash management, investing activities and monitoring the capital markets, holding company commercial paper transactions, compliance with debt covenants, corporate-wide protection of assets from catastrophic loss using risk financing mechanisms including captive risk retention and design and negotiation of insurance contracts with commercial and industry mutual underwriters (Service Company portion of Auto Liability, Cyber, and various other insurance policies), supervising the asset management firms for the Pension Fund and 401k benefits. Corporate governance activities are generally services that are performed on behalf of all Xcel Energy operating companies and affiliates, including Xcel Energy Inc.
General Allocator Assets/Revenue/FTE Hours Corporate Finance, Treasury & Cash Management - Corporate Governance uses the three-factor formula because it reflects the complexity, risk and overall business activity levels that drive corporate governance costs and measures the benefits received from those activities. Corporate Governance includes overall management of the corporation and benefits all companies; therefore, the General Allocator is the most appropriate method of allocation. Assets are used because the greater the value of a subsidiary's assets the more focus will be placed on that subsidiary's operations. Due to its relative effect on the consolidated business. Revenues are used because the larger the subsidiary's revenue the more focus will be placed on that subsidiary's operations due to its relative effect on the consolidated business. FTE Hours is a good measure of a subsidiary's importance to the consolidated operations and the time and attention management must pay to the subsidiary's operations.
37.7744%
200069 143 Risk Management - Corporate Governance
Risk Management Corporate Governance includes the labor and non-labor costs of providing administration of the Transaction Review Committee which handles contract and deal approvals for Commercial Operations, Resource Planning and Energy Supply, provides analysis associated with key risks facing Xcel Energy Inc., negotiates and manages required security (e.g., bank letters of credit, bonds and guarantees among others); reviews and approves all documents requiring Contracts area sign-off. Corporate governance activities are generally services that are performed on behalf of all Xcel Energy operating companies and affiliates, including Xcel Energy Inc.
General Allocator Assets/Revenue/FTE Hours Risk Management - Corporate Governance uses the three-factor formula because it reflects the complexity, risk and overall business activity levels that drive corporate governance costs and measures the benefits received from those activities. Corporate Governance includes overall management of the corporation and benefits all companies; therefore, the General Allocator is the most appropriate method of allocation. Assets are used because the greater the value of a subsidiary's assets the more focus will be placed on that subsidiary's operations. Due to its relative effect on the consolidated business. Revenues are used because the larger the subsidiary's revenue the more focus will be placed on that subsidiary's operations due to its relative effect on the consolidated business. FTE Hours is a good measure of a subsidiary's importance to the consolidated operations and the time and attention management must pay to the subsidiary's operations.
37.7744%
200070 161 Corporate Strategy & Business Development - Corporate Governance
Corporate Strategy & Business Development - Corporate Governance includes the labor and non-labor costs associated with providing leadership for the implementation of company-wide business strategies and plans; portfolio management including the evaluation of potential opportunities for mergers, acquisitions and divestitures; providing financial, analytical and reporting support; researching and providing business intelligence information. Corporate governance activities are generally services that are performed on behalf of all Xcel Energy operating companies and affiliates, including Xcel Energy Inc.
General Allocator Assets/Revenue/FTE Hours Corporate Strategy & Business Development - Corporate Governance uses the three-factor formula because it reflects the complexity, risk and overall business activity levels that drive corporate governance costs and measures the benefits received from those activities. Corporate Governance includes overall management of the corporation and benefits all companies; therefore, the General Allocator is the most appropriate method of allocation. Assets are used because the greater the value of a subsidiary's assets the more focus will be placed on that subsidiary's operations. Due to its relative effect on the consolidated business. Revenues are used because the larger the subsidiary's revenue the more focus will be placed on that subsidiary's operations due to its relative effect on the consolidated business. FTE Hours is a good measure of a subsidiary's importance to the consolidated operations and the time and attention management must pay to the subsidiary's operations.
37.7744%
200071 171 Legal - Corporate Governance Legal - Corporate Governance includes the labor and non-labor costs for anticipating and fulfilling the legal needs of Xcel Energy, its Board of Directors, officers, legal entities, business areas and corporate operations to protect the company's assets and to minimize potential liability. Provides services related to labor and employment law pertaining to Service Company employees, litigation, contracts, rates and regulation, environmental matters and
General Allocator Assets/Revenue/FTE Hours Legal - Corporate Governance uses the three-factor formula because it reflects the complexity, risk and overall business activity levels that drive corporate governance costs and measures the benefits received from those activities. Corporate Governance includes overall management of the corporation and benefits all companies; therefore, the General Allocator is the most appropriate method of allocation. Assets are used because the greater
37.7744%

Northern States Power Company
Service Company Allocation Descriptions, Methods and NSPM (Total Company) Percentages - Using FTE Hours
Docket No. E002/GR-20-723Exhibit___(RLB-1), Schedule 4a
Page 2 of 7
2021 Test Year Budget
SAP JDE
Cost Center Work Order No. Cost Center Description Description of Services ProvidedGeneral Allocator/
Cost Causative Allocation Method Reasonableness of Allocation MethodNSPM Alloc Percent 2020
200072 180 Communications - Corporate Governance
Communications - Corporate Governance includes the labor and non-labor costs to assist and ensure Executive Management, Investor Relations and others communicate appropriately with shareholders, the public, and other key stakeholder audiences. Key projects include: development and production of the annual report and other communications to investors; speeches, videos, and major presentations delivered by top executives; and speeches, displays, video and presentations for the company's annual meeting of shareholders. Media Relations contributes to building Xcel Energy's reputation by developing media and public relations strategies for major company initiatives and issues; responding to news media inquiries; working pro-actively with the media to forward story ideas and information about company events, policies and actions, and providing media training for company spokespersons. Media Relations also plays a key role in crisis communications and emergency preparedness efforts. Corporate governance activities are generally services that are performed on behalf of all Xcel Energy operating companies and affiliates, including Xcel Energy Inc.
General Allocator Assets/Revenue/FTE Hours Communications - Corporate Governance uses the three-factor formula because it reflects the complexity, risk and overall business activity levels that drive corporate governance costs and measures the benefits received from those activities. Corporate Governance includes overall management of the corporation and benefits all companies; therefore, the General Allocator is the most appropriate method of allocation. Assets are used because the greater the value of a subsidiary's assets the more focus will be placed on that subsidiary's operations. Due to its relative effect on the consolidated business. Revenues are used because the larger the subsidiary's revenue the more focus will be placed on that subsidiary's operations due to its relative effect on the consolidated business. FTE Hours is a good measure of a subsidiary's importance to the consolidated operations and the time and attention management must pay to the subsidiary's operations.
37.7744%
200073 189 Human Resources - Corporate Governance
Human Resources - Corporate Governance includes the labor and non-labor costs for executive officers' and Service Company employees' compensation plans, corporate HR policies, executive policy benefit plans, payroll services for Service Company and the employees' handbook. Corporate governance activities are generally services that are performed on behalf of all Xcel Energy operating companies and affiliates, including Xcel Energy Inc.
General Allocator Assets/Revenue/FTE Hours Human Resources - Corporate Governance uses the three-factor formula because it reflects the complexity, risk and overall business activity levels that drive corporate governance costs and measures the benefits received from those activities. Corporate Governance includes overall management of the corporation and benefits all companies; therefore, the General Allocator is the most appropriate method of allocation. Assets are used because the greater the value of a subsidiary's assets the more focus will be placed on that subsidiary's operations. Due to its relative effect on the consolidated business. Revenues are used because the larger the subsidiary's revenue the more focus will be placed on that subsidiary's operations due to its relative effect on the consolidated business. FTE Hours is a good measure of a subsidiary's importance to the consolidated operations and the time and attention management must pay to the subsidiary's operations.
37.7744%
200074 529; 549; 551; 561 Corporate Systems – Corporate Governance
Corporate Systems – Corporate Governance includes the labor and non-labor costs for enterprise-wide corporate systems.
General Allocator Assets/Revenue/FTE Hours Corporate Systems - Corporate Governance uses the three-factor formula because it reflects the complexity, risk and overall business activity levels that drive corporate governance costs and measures the benefits received from those activities. Corporate Governance includes overall management of the corporation and benefits all companies; therefore, the General Allocator is the most appropriate method of allocation. Assets are used because the greater the value of a subsidiary's assets the more focus will be placed on that subsidiary's operations. Due to its relative effect on the consolidated business. Revenues are used because the larger the subsidiary's revenue the more focus will be placed on that subsidiary's operations due to its relative effect on the consolidated business. FTE Hours is a good measure of a subsidiary's importance to the consolidated operations and the time and attention management must pay to the subsidiary's operations.
37.7744%
200075 114 Board of Directors - Corporate Governance
Board of Directors - Corporate Governance includes the labor and non-labor costs related to the Board of Directors (BOD). BOD costs may include Directors fees, retirement expenses and replacement fees; Board/Committee meetings and BOD related consulting. Corporate governance activities are generally services that are performed on behalf of all Xcel Energy operating companies and affiliates, including Xcel Energy Inc.
General Allocator Assets/Revenue/FTE Hours Board of Directors - Corporate Governance uses the three-factor formula because it reflects the complexity, risk and overall business activity levels that drive corporate governance costs and measures the benefits received from those activities. Corporate Governance includes overall management of the corporation and benefits all companies; therefore, the General Allocator is the most appropriate method of allocation. Assets are used because the greater
37.7744%
200076 182 Xcel Foundation Xcel Foundation services includes the labor and non-labor costs associated with the management and administration of the Xcel Energy Foundation.
General Allocator Assets/Revenue/FTE Hours Xcel Foundation services that could not be directly charged to a specific legal entity and are corporate in nature. Because these services are comprised of a broad spectrum of activities, no measurable method of cost causative allocation was found to allocate these costs therefore the three-factor formula was used. These services are allocated to a subset of companies based on who benefits from the services.
37.8677%
200077 184 Branding Branding services includes the labor and non-labor costs for brand advertising and management of community affairs programs such as employee volunteerism, educational programs and community events, the company's investment in major sponsorships such as the Xcel Energy Center as well as ensuring that such sponsorships and related activities support the company's brand, mission and values.
General Allocator Assets/Revenue/FTE Hours Branding services that could not be directly charged to a specific legal entity and are corporate in nature. Because these services are comprised of a broad spectrum of activities, no measurable method of cost causative allocation was found to allocate these costs therefore the three-factor formula was used. These services are allocated to a subset of companies based on who benefits from the services.
37.8677%
200078 410 Governmental Affairs Governmental Affairs includes the labor and non-labor costs associated with the interpretation of laws regulations and environmental policy to ensure compliance and cost effectiveness for Xcel Energy customers and stockholders Internal legislative policy development and issues management, appraise management and internal customers of political and policy trends and developments, develop and maintain relationships with regulatory officials and staff.
General Allocator Assets/Revenue/FTE Hours Governmental Affairs services that could not be directly charged to a specific legal entity and are corporate in nature. Because these services are comprised of a broad spectrum of activities, no measurable method of cost causative allocation was found to allocate these costs therefore the three-factor formula was used. These services are allocated to a subset of companies based on who benefits from the services.
37.8941%
200079 409 Federal Lobbying Federal Lobbying services includes the labor and non-labor costs for federal and state lobbying activities and the federal Political Action Committee (PAC).
General Allocator Assets/Revenue/FTE Hours Federal Lobbying services that could not be directly charged to a specific legal entity and are corporate in nature. Because these services are comprised of a broad spectrum of activities, no measurable method of cost causative allocation was found to allocate these costs therefore the three-factor formula was used. These services are provided to a subset of companies based on who benefits from the services. These costs are recorded in FERC
37.8941%
200080 135 Capital Asset Accounting Capital Asset Accounting includes the labor and non-labor costs associated with operating and non-operating company capital asset accounting, budgeting, regulatory reporting, business area support for utility areas, and operating company budgeting support.
General Allocator Assets/Revenue/FTE Hours Capital Asset Accounting services that could not be directly charged to a specific legal entity and are corporate in nature. Because these services are comprised of a broad spectrum of activities, no measurable method of cost causative allocation was found to allocate these costs therefore the three-factor formula was used. These services are allocated to a subset of companies based on who benefits from the services.
42.7132%
200081 120 Accounting, Reporting & Taxes Accounting, Reporting & Taxes services includes the labor and non-labor costs for preparation of operating and non-operating financial statements, tax returns and reporting, performing accounting for the employee benefit plans, ensuring compliance with applicable laws and regulations of the operating and non-operating companies; composing the corporate-wide regulatory accounting policy, and coordinating the budgeting process with the operating and non-operating companies.
General Allocator Assets/Revenue/FTE Hours Accounting Reporting & Taxes services that could not be directly charged to a specific legal entity and are corporate in nature. Because these services are comprised of a broad spectrum of activities, no measurable method of cost causative allocation was found to allocate these costs therefore the three-factor formula was used. These services are allocated to a subset of companies based on who benefits from the services.
42.8080%
200082 130 Audit Services Audit Services includes the labor and non-labor costs for auditing operating and non-operating companies, evaluating and improving risk management, ethical conduct and the implementation of best practices for operating and non-operating companies, conducting financial operations and information system audits, performing audits and reviews for compliance with regulatory and legal requirements and contracts with vendors and other parties; establishing and reviewing internal controls for operating and non-operating companies, establishing and reviewing SOX compliance requirements/control testing and evaluating contract risks for the operating and non-operating companies.
General Allocator Assets/Revenue/FTE Hours Audit Services that could not be directly charged to a specific legal entity and are corporate in nature. Because these services are comprised of a broad spectrum of activities, no measurable method of cost causative allocation was found to allocate these costs therefore the three-factor formula was used. These services are allocated to a subset of companies based on who benefits from the services. 42.8080%
200083 140 Corporate Finance, Treasury & Cash Management
Corporate Finance, Treasury & Cash Management services includes the labor and non-labor costs related to equity and debt securities issuance, cash management, relationships with financial institutions, compliance with debt covenants, Service Company portion of General and Excess liability insurance, and management of the Pension Fund and 401k benefits for operating companies.
General Allocator Assets/Revenue/FTE Hours Corporate Finance, Treasury & Cash Management services that could not be directly charged to a specific legal entity and are corporate in nature. Because these services are comprised of a broad spectrum of activities, no measurable method of cost causative allocation was found to allocate these costs therefore the three-factor formula was used. These services are allocated to a subset of companies based on who benefits from the services.
42.8080%
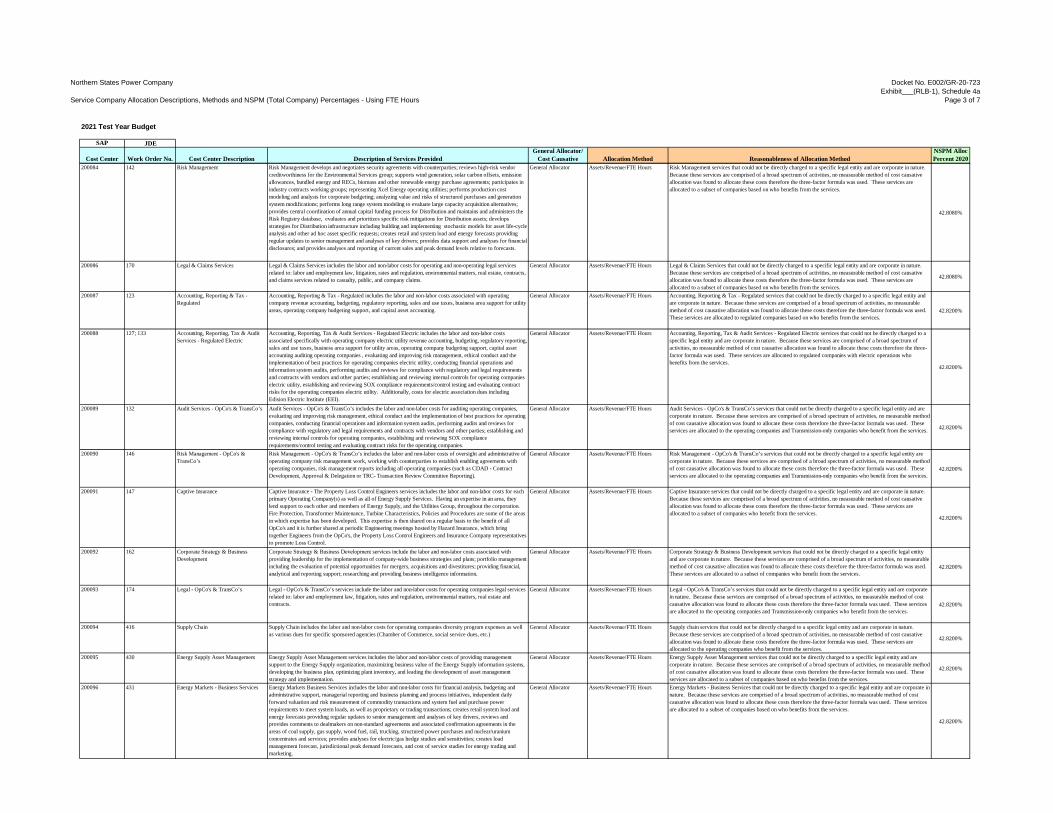
Northern States Power Company
Service Company Allocation Descriptions, Methods and NSPM (Total Company) Percentages - Using FTE Hours
Docket No. E002/GR-20-723Exhibit___(RLB-1), Schedule 4a
Page 3 of 7
2021 Test Year Budget
SAP JDE
Cost Center Work Order No. Cost Center Description Description of Services ProvidedGeneral Allocator/
Cost Causative Allocation Method Reasonableness of Allocation MethodNSPM Alloc Percent 2020
200084 142 Risk Management Risk Management develops and negotiates security agreements with counterparties; reviews high-risk vendor creditworthiness for the Environmental Services group; supports wind generation, solar carbon offsets, emission allowances, bundled energy and RECs, biomass and other renewable energy purchase agreements; participates in industry contracts working groups; representing Xcel Energy operating utilities; performs production cost modeling and analysis for corporate budgeting; analyzing value and risks of structured purchases and generation system modifications; performs long range system modeling to evaluate large capacity acquisition alternatives; provides central coordination of annual capital funding process for Distribution and maintains and administers the Risk Registry database, evaluates and prioritizes specific risk mitigations for Distribution assets; develops strategies for Distribution infrastructure including building and implementing stochastic models for asset life-cycle analysis and other ad hoc asset specific requests; creates retail and system load and energy forecasts providing regular updates to senior management and analyses of key drivers; provides data support and analyses for financial disclosures; and provides analyses and reporting of current sales and peak demand levels relative to forecasts.
General Allocator Assets/Revenue/FTE Hours Risk Management services that could not be directly charged to a specific legal entity and are corporate in nature. Because these services are comprised of a broad spectrum of activities, no measurable method of cost causative allocation was found to allocate these costs therefore the three-factor formula was used. These services are allocated to a subset of companies based on who benefits from the services.
42.8080%
200086 170 Legal & Claims Services Legal & Claims Services includes the labor and non-labor costs for operating and non-operating legal services related to: labor and employment law, litigation, rates and regulation, environmental matters, real estate, contracts, and claims services related to casualty, public, and company claims.
General Allocator Assets/Revenue/FTE Hours Legal & Claims Services that could not be directly charged to a specific legal entity and are corporate in nature. Because these services are comprised of a broad spectrum of activities, no measurable method of cost causative allocation was found to allocate these costs therefore the three-factor formula was used. These services are allocated to a subset of companies based on who benefits from the services.
42.8080%
200087 123 Accounting, Reporting & Tax - Regulated
Accounting, Reporting & Tax - Regulated includes the labor and non-labor costs associated with operating company revenue accounting, budgeting, regulatory reporting, sales and use taxes, business area support for utility areas, operating company budgeting support, and capital asset accounting.
General Allocator Assets/Revenue/FTE Hours Accounting, Reporting & Tax - Regulated services that could not be directly charged to a specific legal entity and are corporate in nature. Because these services are comprised of a broad spectrum of activities, no measurable method of cost causative allocation was found to allocate these costs therefore the three-factor formula was used. These services are allocated to regulated companies based on who benefits from the services.
42.8200%
200088 127; 133 Accounting, Reporting, Tax & Audit Services - Regulated Electric
Accounting, Reporting, Tax & Audit Services - Regulated Electric includes the labor and non-labor costs associated specifically with operating company electric utility revenue accounting, budgeting, regulatory reporting, sales and use taxes, business area support for utility areas, operating company budgeting support, capital asset accounting auditing operating companies , evaluating and improving risk management, ethical conduct and the implementation of best practices for operating companies electric utility, conducting financial operations and information system audits, performing audits and reviews for compliance with regulatory and legal requirements and contracts with vendors and other parties; establishing and reviewing internal controls for operating companies electric utility, establishing and reviewing SOX compliance requirements/control testing and evaluating contract risks for the operating companies electric utility. Additionally, costs for electric association dues including Edision Electric Institute (EEI).
General Allocator Assets/Revenue/FTE Hours Accounting, Reporting, Tax & Audit Services - Regulated Electric services that could not be directly charged to a specific legal entity and are corporate in nature. Because these services are comprised of a broad spectrum of activities, no measurable method of cost causative allocation was found to allocate these costs therefore the three-factor formula was used. These services are allocated to regulated companies with electric operations who benefits from the services.
42.8200%
200089 132 Audit Services - OpCo's & TransCo’s Audit Services - OpCo's & TransCo’s includes the labor and non-labor costs for auditing operating companies, evaluating and improving risk management, ethical conduct and the implementation of best practices for operating companies, conducting financial operations and information system audits, performing audits and reviews for compliance with regulatory and legal requirements and contracts with vendors and other parties; establishing and reviewing internal controls for operating companies, establishing and reviewing SOX compliance requirements/control testing and evaluating contract risks for the operating companies.
General Allocator Assets/Revenue/FTE Hours Audit Services - OpCo's & TransCo’s services that could not be directly charged to a specific legal entity and are corporate in nature. Because these services are comprised of a broad spectrum of activities, no measurable method of cost causative allocation was found to allocate these costs therefore the three-factor formula was used. These services are allocated to the operating companies and Transmission-only companies who benefit from the services. 42.8200%
200090 146 Risk Management - OpCo's & TransCo’s
Risk Management - OpCo's & TransCo’s includes the labor and non-labor costs of oversight and administrative of operating company risk management work, working with counterparties to establish enabling agreements with operating companies, risk management reports including all operating companies (such as CDAD - Contract Development, Approval & Delegation or TRC- Transaction Review Committee Reporting).
General Allocator Assets/Revenue/FTE Hours Risk Management - OpCo's & TransCo’s services that could not be directly charged to a specific legal entity are corporate in nature. Because these services are comprised of a broad spectrum of activities, no measurable method of cost causative allocation was found to allocate these costs therefore the three-factor formula was used. These services are allocated to the operating companies and Transmission-only companies who benefit from the services.
42.8200%
200091 147 Captive Insurance Captive Insurance - The Property Loss Control Engineers services includes the labor and non-labor costs for each primary Operating Company(s) as well as all of Energy Supply Services. Having an expertise in an area, they lend support to each other and members of Energy Supply, and the Utilities Group, throughout the corporation. Fire Protection, Transformer Maintenance, Turbine Characteristics, Policies and Procedures are some of the areas in which expertise has been developed. This expertise is then shared on a regular basis to the benefit of all OpCo's and it is further shared at periodic Engineering meetings hosted by Hazard Insurance, which bring together Engineers from the OpCo's, the Property Loss Control Engineers and Insurance Company representatives to promote Loss Control.
General Allocator Assets/Revenue/FTE Hours Captive Insurance services that could not be directly charged to a specific legal entity and are corporate in nature. Because these services are comprised of a broad spectrum of activities, no measurable method of cost causative allocation was found to allocate these costs therefore the three-factor formula was used. These services are allocated to a subset of companies who benefit from the services.
42.8200%
200092 162 Corporate Strategy & Business Development
Corporate Strategy & Business Development services include the labor and non-labor costs associated with providing leadership for the implementation of company-wide business strategies and plans; portfolio management including the evaluation of potential opportunities for mergers, acquisitions and divestitures; providing financial, analytical and reporting support; researching and providing business intelligence information.
General Allocator Assets/Revenue/FTE Hours Corporate Strategy & Business Development services that could not be directly charged to a specific legal entity and are corporate in nature. Because these services are comprised of a broad spectrum of activities, no measurable method of cost causative allocation was found to allocate these costs therefore the three-factor formula was used. These services are allocated to a subset of companies who benefit from the services.
42.8200%
200093 174 Legal - OpCo's & TransCo’s Legal - OpCo's & TransCo’s services include the labor and non-labor costs for operating companies legal services related to: labor and employment law, litigation, rates and regulation, environmental matters, real estate and contracts.
General Allocator Assets/Revenue/FTE Hours Legal - OpCo's & TransCo’s services that could not be directly charged to a specific legal entity and are corporate in nature. Because these services are comprised of a broad spectrum of activities, no measurable method of cost causative allocation was found to allocate these costs therefore the three-factor formula was used. These services are allocated to the operating companies and Transmission-only companies who benefit from the services.
42.8200%
200094 416 Supply Chain Supply Chain includes the labor and non-labor costs for operating companies diversity program expenses as well as various dues for specific sponsored agencies (Chamber of Commerce, social service dues, etc.)
General Allocator Assets/Revenue/FTE Hours Supply chain services that could not be directly charged to a specific legal entity and are corporate in nature. Because these services are comprised of a broad spectrum of activities, no measurable method of cost causative allocation was found to allocate these costs therefore the three-factor formula was used. These services are allocated to the operating companies who benefit from the services.
42.8200%
200095 430 Energy Supply Asset Management Energy Supply Asset Management services includes the labor and non-labor costs of providing management support to the Energy Supply organization, maximizing business value of the Energy Supply information systems, developing the business plan, optimizing plant inventory, and leading the development of asset management strategy and implementation.
General Allocator Assets/Revenue/FTE Hours Energy Supply Asset Management services that could not be directly charged to a specific legal entity and are corporate in nature. Because these services are comprised of a broad spectrum of activities, no measurable method of cost causative allocation was found to allocate these costs therefore the three-factor formula was used. These services are allocated to a subset of companies based on who benefits from the services.
42.8200%
200096 431 Energy Markets - Business Services Energy Markets Business Services includes the labor and non-labor costs for financial analysis, budgeting and administrative support, managerial reporting and business planning and process initiatives, independent daily forward valuation and risk measurement of commodity transactions and system fuel and purchase power requirements to meet system loads, as well as proprietary or trading transactions; creates retail system load and energy forecasts providing regular updates to senior management and analyses of key drivers, reviews and provides comments to dealmakers on non-standard agreements and associated confirmation agreements in the areas of coal supply, gas supply, wood fuel, rail, trucking, structured power purchases and nuclear/uranium concentrates and services; provides analyses for electric/gas hedge studies and sensitivities; creates load management forecast, jurisdictional peak demand forecasts, and cost of service studies for energy trading and marketing.
General Allocator Assets/Revenue/FTE Hours Energy Markets - Business Services that could not be directly charged to a specific legal entity and are corporate in nature. Because these services are comprised of a broad spectrum of activities, no measurable method of cost causative allocation was found to allocate these costs therefore the three-factor formula was used. These services are allocated to a subset of companies based on who benefits from the services.
42.8200%

Northern States Power Company
Service Company Allocation Descriptions, Methods and NSPM (Total Company) Percentages - Using FTE Hours
Docket No. E002/GR-20-723Exhibit___(RLB-1), Schedule 4a
Page 4 of 7
2021 Test Year Budget
SAP JDE
Cost Center Work Order No. Cost Center Description Description of Services ProvidedGeneral Allocator/
Cost Causative Allocation Method Reasonableness of Allocation MethodNSPM Alloc Percent 2020
200097 533; 535; 539; 542 Accounting and Finance Software Applications Maintenance
Accounting and Finance Software Applications Maintenance services include the labor and non-labor operating costs for the application development and maintenance of the software applications used for accounting and finance business functions.
General Allocator Assets/Revenue/FTE Hours Accounting and Finance Software Applications Maintenance - The Business Systems expenses related to maintenance of this system that could not be directly charged to a specific legal entity and are corporate in nature. Because these services are comprised of a broad spectrum of activities, no measurable method of cost causative allocation was found to allocate these costs therefore the three-factor formula was used. These services are allocated to a subset of companies based on who benefits from the services.
42.8200%
200098 468 Electric Transmission FERC 566 Electric Transmission FERC 566 services include Transmission electric labor and non-labor costs associated with accounting, budgeting, regulatory reporting, and capital asset accounting.
General Allocator Assets/Revenue/FTE Hours Electric Transmission FERC 566 charges that cannot be directly charged to a specific legal entity and are corporate in nature. The three-factor formula is used because these charges are comprised of a broad spectrum of activities and no measurable method of cost causative allocation was found. 42.8200%
200099 469 Electric Distribution FERC 588 Electric Distribution FERC 588 services include electric Distribution labor and non-labor costs associated with accounting, budgeting, regulatory reporting, and capital asset accounting.
General Allocator Assets/Revenue/FTE Hours Electric Distribution FERC 588 charges that cannot be directly charged to a specific legal entity and are corporate in nature. The three-factor formula is used because these charges are comprised of a broad spectrum of activities and no measurable method of cost causative allocation was found.
42.8200%
200100 134 Accounting, Reporting, Tax & Audit Services – Regulated Gas
Accounting, Reporting, Tax & Audit Services – Regulated Gas includes the labor and non-labor costs associated specifically with gas utility revenue accounting, budgeting, regulatory reporting, sales and use taxes, business area support for utility areas, capital asset accounting, auditing, evaluating and improving risk management, ethical conduct and the implementation of best practices for operating companies gas utility, conducting financial operations and information system audits, performing audits and reviews for compliance with regulatory and legal requirements and contracts with vendors and other parties; establishing and reviewing internal controls for operating companies gas utility, establishing and reviewing SOX compliance requirements/control testing and evaluating contract risks for the operating companies gas utility. Additionally, costs for gas association dues including American Gas Association (AGA).
General Allocator Assets/Revenue/FTE Hours Accounting, Reporting, Tax & Audit Services – Regulated Gas services that could not be directly charged to a specific legal entity and are corporate in nature. Because these services are comprised of a broad spectrum of activities, no measurable method of cost causative allocation was found to allocate these costs therefore the three-factor formula was used. These services are allocated to the operating companies gas utility who benefit from the services. 50.2478%
200101 164 Legal Gas Legal Gas services include the labor and non-labor costs for operating companies gas utility legal services related to: labor and employment law, litigation, rates and regulation, environmental matters, real estate and contracts. This is primarily used by the General Counsel area.
General Allocator Assets/Revenue/FTE Hours Legal Gas services that could not be directly charged to a specific legal entity and are corporate in nature. Because these services are comprised of a broad spectrum of activities, no measurable method of cost causative allocation was found to allocate these costs therefore the three-factor formula was used. These services are allocated to the operating companies who benefit from the services.
50.2478%
200102 470 Gas Distribution FERC 880 Gas Distribution FERC 880 services include gas Distribution labor and non-labor costs associated with accounting, budgeting, regulatory reporting, and capital asset accounting.
General Allocator Assets/Revenue/FTE Hours Gas Distribution FERC 880 charges that cannot be directly charged to a specific legal entity and are corporate in nature. The three-factor formula is used because these charges are comprised of a broad spectrum of activities and no measurable method of cost causative allocation was found. 50.2478%
200105 125 Accounting & Reporting - NSPM & NSPW
Accounting & Reporting - NSPM & NSPW includes the labor and non-labor costs associated with NSPM & NSPW accounting, budgeting, regulatory reporting, sales and use taxes, business area support for utility areas, operating company budgeting support, and capital asset accounting.
General Allocator Assets/Revenue/FTE Hours Accounting & Reporting - NSPM & NSPW services that could not be directly charged to a specific legal entity and are corporate in nature. Because these services are comprised of a broad spectrum of activities, no measurable method of cost causative allocation was found to allocate these costs therefore the three-factor formula was used. These services are allocated to NSPM & NSPW who benefit from the services.
86.1406%
200106 126 Accounting & Reporting Electric - NSPM & NSPW
Accounting & Reporting Electric - NSPM & NSPW includes the labor and non-labor costs associated with NSPM & NSPW accounting, budgeting, regulatory reporting, sales and use taxes, business area support for utility areas, operating company budgeting support, and capital asset accounting specific to the electric utility.
General Allocator Assets/Revenue/FTE Hours Accounting & Reporting Electric - NSPM & NSPW services that could not be directly charged to a specific legal entity are corporate in nature. Because these services are comprised of a broad spectrum of activities, no measurable method of cost causative allocation was found to allocate these costs therefore the three-factor formula was used. These services are allocated to NSPM & NSPW electric utility who benefit from the services.
86.1406%
200107 172 Legal - NSPM & NSPW Legal - NSPM & NSPW services include the labor and non-labor costs for legal services related to: labor and employment law, litigation, rates and regulation, environmental matters, real estate and contracts specific to NSPM & NSPW. This is primarily used by the General Counsel area.
General Allocator Assets/Revenue/FTE Hours Legal - NSPM & NSPW services that could not be directly charged to a specific legal entity are corporate in nature. Because these services are comprised of a broad spectrum of activities, no measurable method of cost causative allocation was found to allocate these costs therefore the three-factor formula was used. These services are allocated to NSPM & NSPW who benefit from the services.
86.1406%
200108 N/A Advanced Metering Infrastructure (AMI)
Advanced Metering Infrastructure (AMI) includes the labor and non-labor costs associated with AMI. Cost Causative No. of AMI Enabled Meters Advanced Metering Infrastructure (AMI) using No. of AMI Enabled Meters to allocate costs is reasonable because there is a cost causative relationship with the companies with AMI enabled meters. 40.9918%
200111 544 Enterprise Application Integration (EAI)
Enterprise Application Integration (EAI) includes the labor and non-labor costs associated with the management of information systems infrastructure and working with IT Project Managers to ensure that new systems are positioned to function as successfully as possible in terms of overall performance and communication with other systems.
Cost Causative Average of a Select Set of Software Allocators
Enterprise Application Integration (EAI) using average of selected software systems to allocate costs is reasonable because EAI is primarily the server costs supporting the selected software applications and benefits the companies using the software applications. 38.8575%
200112 562 Mainframe Charges Mainframe Charges include labor and non-labor costs related to mainframe expenses for development, maintenance, and licensing. The Mainframe is comprised of three applications: Time, Gas Management System, and Monitoring Device Management System applications. This is used primarily by the Business Systems Organization.
Cost Causative Average of a Select Set of Software Allocators
Mainframe Charges expenses cannot be directly charged to a specific legal entity as the system is used by multiple entities. Using an average of selected software systems to allocate costs is reasonable because Mainframe primarily supports these selected software systems. 26.7176%
200115 514 Miscellaneous Applications Miscellaneous Applications includes the labor and non-labor costs associated with the management of information systems infrastructure and working with IT project managers to ensure that new systems are positioned to function as successfully as possible in terms of overall performance and communication with other systems.
Cost Causative Average of All Software Percentages
Miscellaneous Applications using average of all software systems to allocate costs is reasonable because Miscellaneous Applications is primarily the server costs supporting the software applications and benefits the companies using the software applications. 35.8186%
200116 441 Distribution Electric Supervision & Engineering (S&E) FERC 580
Distribution Electric Supervision & Engineering (S&E) FERC 580 services includes the labor and expenses incurred in the general supervision and direction of the operation of the electric distribution system.
Cost Causative Electric Distribution Plant Distribution Electric Supervision & Engineering (S&E) FERC 580 using the electric distribution plant to allocate the costs is reasonable because there is a cost causative relationship with the operations supported by electric distribution.
35.1704%
200117 453 Distribution Electric Metering FERC 586
Distribution Electric Metering FERC 586 services include labor, materials used, and expenses incurred in the operation of customer meters and associated equipment (e.g. electric distribution meters standards and development, meter purchases, etc.
Cost Causative Electric Distribution Plant Distribution Electric Metering FERC 586 using electric distribution plant to allocate meter costs is reasonable because there is a cost causative relationship with the electric distribution plant and meter operations supported by electric distribution.
35.1704%
200118 527 Distribution Electric Load Dispatching/EMS FERC 581
Distribution Electric Load Dispatching/EMS FERC 581 services include labor, materials used, and expenses incurred in load dispatching operations pertaining to the distribution of electricity. This includes Energy Management Systems (EMS) which provides supervisory control and data acquisition (SCADA) of substation devices through Remote Terminal Units (RTU's).
Cost Causative Electric Distribution Plant Distribution Electric Load Dispatching/EMS FERC 581 using electric distribution plant to allocate costs is reasonable because there is a cost causative relationship with the operations supported by load dispatching/EMS-distribution. 35.1704%
200119 506; 507; 559 Distribution Electric & Gas Miscellaneous FERC 588 & 880
Distribution Electric & Gas Miscellaneous FERC 588 & 880 services include labor, materials used, and expenses incurred in distribution system operation not provided for elsewhere. This includes software system labor and non-labor costs for the maintenance that support the electric and gas distribution to our customers as well as non-capital engineering & supervision costs.
Cost Causative Electric Distribution Plant/ Gas Distribution Plant
Distribution Electric & Gas Miscellaneous FERC 588 & 880 using a ratio of electric distribution plant/gas distribution plant to allocate costs is reasonable because there is a cost causative relationship between the work performed by operations and distribution plant. 32.9253%
200120 536 Distribution Electric & Gas Miscellaneous NSPM & PSCo FERC 588 & 880
Distribution Electric & Gas Miscellaneous NSPM & PSCo FERC 588 & 880 includes the labor and non-labor operating costs for the application used to design distribution electric and gas service. This includes the application development and maintenance costs, and licensing fees.
Cost Causative Electric Distribution Plant/ Gas Distribution Plant
Distribution Electric & Gas Miscellaneous NSPM & PSCo FERC 588 & 880 using a ratio of electric distribution plant/gas distribution plant to allocate costs is reasonable because the costs are directly related to designing of the NSPM and PSCo electric and gas distribution systems.
39.5073%
200121 474 Distribution Electric & Gas and Transmission Gas Miscellaneous FERC 588, 880, & 859
Distribution Electric & Gas and Transmission Gas Miscellaneous FERC 588, 880, & 859 services include gas distribution, gas transmission, and electric distribution labor and non-labor costs associated with accounting, budgeting, and regulatory reporting.
Cost Causative Electric Distribution Plant/ Gas Transmission Plant/ Gas Distribution Plant
Distribution Electric & Gas and Transmission Gas Miscellaneous FERC 588, 880, & 859 charges that cannot be directly charged to a specific business unit and are corporate in nature. Using a ratio of electric distribution plant/gas transmission plant/gas distribution plant to allocate Utility Group costs is reasonable because there is a cost causative relationship with operations supported by Utilities Group.
31.3180%
200122 442 Transmission Electric Supervision & Engineering (S&E) FERC 560
Transmission Electric Supervision & Engineering (S&E) FERC 560 services include labor and expenses incurred in the general supervision and direction of the operation of the electric transmission system as a whole.
Cost Causative Electric Transmission Plant Transmission Electric Supervision & Engineering (S&E) FERC 560 using electric transmission plant to allocate costs is reasonable because there is a cost causative relationship with the operations supported by transmission electric.
33.5462%

Northern States Power Company
Service Company Allocation Descriptions, Methods and NSPM (Total Company) Percentages - Using FTE Hours
Docket No. E002/GR-20-723Exhibit___(RLB-1), Schedule 4a
Page 5 of 7
2021 Test Year Budget
SAP JDE
Cost Center Work Order No. Cost Center Description Description of Services ProvidedGeneral Allocator/
Cost Causative Allocation Method Reasonableness of Allocation MethodNSPM Alloc Percent 2020
200123 451 Transmission Electric Reliability, Planning, & Standards Development FERC 561.5
Transmission Electric FERC 561.5 services include labor, materials used, and expenses incurred for the system planning of the interconnected bulk electric transmission systems within a planning authority area. Activities include transmission reliability, planning and standards development related to transmission assets and reliability needs and transmission customers’ requirements and requests (e.g. developing and maintaining transmission system models, applying methodologies and tools for analysis and simulation of systems, notification of any planned transmission changes and impacts, etc.).
Cost Causative Electric Transmission Plant Transmission Electric Reliability, Planning, & Standards Development FERC 561.5 using electric transmission plant to allocate costs is reasonable because there is a cost causative relationship with the operations supported by transmission electric.
33.5462%
200124 526 Transmission Electric Load Dispatch-Monitor and Operate Transmission System FERC 561.2
Transmission Electric Load Dispatch-Monitor and Operate Transmission System FERC 561.2 services include labor, materials used, and expenses incurred to monitor, assess and operate the power system and individual transmission facilities in real-time to maintain safe and reliable operation of the transmission system. This also includes the expense incurred to manage transmission facilities to maintain system reliability and to monitor the real-time flows and direct actions according to regional plans and tariffs as necessary.
Cost Causative Electric Transmission Plant Transmission Electric Load Dispatch-Monitor and Operate Transmission System FERC 561.2 using electric transmission plant to allocate costs is reasonable because there is a direct causal relationship with the operations supported by EMS-transmission.
33.5462%
200125 449 Transmission Electric Supervision & Engineering (S&E) NSPM & NSPW FERC 560
Transmission Electric Supervision & Engineering (S&E) NSPM & NSPW FERC 560 services include labor and expenses incurred in the general supervision and direction of the operation of the electric transmission system as a whole. This allocation is used when NSPM and NSPW are the only jurisdictions benefiting from the services.
Cost Causative Electric Transmission Plant Transmission Electric Supervision & Engineering (S&E) NSPM & NSPW FERC 560 using electric transmission plant to allocate costs is reasonable because there is a direct causal relationship with the operations supported by transmission electric. 73.7152%
200126 423; 440; 525 Utilities Group Administrative & General (A&G) FERC 921
Utilities Group Administrative & General (A&G) FERC 921 services includes the labor and non-labor costs for utilities group leadership, management and support services for the Distribution, Transmission, transportation and supply chain areas.
Cost Causative Electric Transmission Plant/ Electric Distribution Plant/ Gas Transmission Plant/Gas Distribution Plant
Utilities Group Administrative & General (A&G) FERC 921 using delivery gross plant to allocate costs is reasonable because these costs are directly related to the electric and gas delivery systems.
32.1625%
200127 443 Distribution Gas Supervision & Engineering (S&E) FERC 870
Distribution Gas Supervision & Engineering (S&E) FERC 870 services include labor and expenses incurred in the general supervision and direction of gas distribution system operations.
Cost Causative Gas Distribution Plant Distribution Gas Supervision & Engineering (S&E) FERC 870 using gas distribution plant to allocate costs is reasonable because there is a cost causative relationship with the operations supported by distribution gas. 27.0963%
200128 445 Distribution Gas Miscellaneous FERC 880
Distribution Gas Miscellaneous FERC 880 services include the cost of distribution maps and records, distribution office expenses, and the cost of miscellaneous labor and materials used, and expenses incurred in gas distribution systems. Additionally, the labor and non-labor costs for non-capital engineering and supervision.
Cost Causative Gas Distribution Plant Distribution Gas Miscellaneous FERC 880 using gas distribution plant to allocate costs is reasonable because there is a cost causative relationship with the operations supported by Distribution Gas.
27.0963%
200129 454 Distribution Gas Meters and House Regulators FERC 878
Distribution Gas Meters and House Regulators FERC 878 services include the cost of labor, materials used and expenses incurred in connection with removing, resetting, changing, testing, and servicing customer meters and house regulators.
Cost Causative Gas Distribution Plant Distribution Gas Meters and House Regulators FERC 878 using gas distribution plant to allocate meter costs is reasonable because there is a cost causative relationship with the gas distribution plant and meter operations supported by gas distribution.
27.0963%
200130 444 Transmission Gas Supervision & Engineering (S&E) FERC 850
Transmission Gas Supervision & Engineering (S&E) FERC 850 services include the cost of labor and expenses incurred in the general supervision and direction of the operation of transmission facilities.
Cost Causative Gas Transmission Plant Transmission Gas Supervision & Engineering (S&E) FERC 850 using gas transmission plant to allocate costs is reasonable because there is a cost causative relationship with the operations supported by transmission gas. 9.4475%
200131 531 Distribution & Transmission Gas System Control and Load Dispatching FERC 851 & 871
Distribution & Transmission Gas System Control and Load Dispatching FERC 851 & 871 include the cost of labor, materials used, and expenses incurred in dispatching and controlling the supply and flow of gas through the gas distribution and transmission systems. Additionally, costs include the labor and non-labor costs for the application development and maintenance of the Gas SCADA system.
Cost Causative Gas Transmission Plant/ Gas Distribution Plant
Distribution & Transmission Gas System Control and Load Dispatching FERC 851 & 871 using a ratio of gas transmission plant/gas distribution plant to allocate costs is reasonable because the costs are directly related to the monitoring of gas distribution and transmission. 23.4068%
200132 413 Payment & Reporting Payment & Reporting services includes the labor and non-labor costs associated with processing payments to vendors, providing audit research and reconciliation support for Accounts Payable transactions, preparing statistical and 1099 reporting, and administering the purchase card programs.
Cost Causative Invoice Transactions Payment & Reporting using invoice transactions to allocate costs is reasonable because the costs are directly related to invoices processed. 25.5026%
200133 128 Proprietary Trading - Back Office Proprietary Trading - Back Office includes the labor and non-labor costs associated with the accounting support and vice president oversight of proprietary trading activities. This allocator should be primarily used by Accounting and Finance, or others providing Administrative & General (A&G) activities when the trading deal doesn’t involve Xcel Energy Utility generating resources, which is also considered non-asset-based trading activity.
Cost Causative Joint Operating Agreement Peak Hour Megawatt Load Ratio
Proprietary Trading - Back Office uses the Joint Operating Agreement Peak Hour Megawatt Load Ratio for cost allocations as it is required for the Proprietary Trading services under the JOA.
36.6755%
200134 144 Proprietary Trading - Front/Mid Office FERC 557
Proprietary Trading - Front/Mid Office FERC 557 includes the labor and non-labor costs associated with proprietary trading activities which are short term transactions undertaken in the wholesale electric markets where electricity is purchased for the purpose of selling it. Also included are supporting activities: evaluating the credit worthiness of counterparties, reviewing contracts to ensure that regulations are being complied with, evaluating profitability and appropriateness of trades to ensure they are in the best interest of shareholders and rate payers, and ensuring that trades identified as proprietary appropriately fall into that category.
General Allocator Joint Operating Agreement Peak Hour Megawatt Load Ratio
Proprietary Trading - Front/Mid Office FERC 557 uses the Joint Operating Agreement Peak Hour Megawatt Load Ratio for cost allocations as it is required for the Proprietary Trading services under the JOA.
44.0811%
200135 414 Energy Supply Business Resources Energy Supply Business Resources services includes the labor and non-labor costs of performance analysis, specialists and analytical services provided to the operating companies' generation facilities.
Cost Causative MWH Generation Energy Supply Business Resources using MWH generation to allocate costs is reasonable because the costs are directly related to the support of electric generation facilities. 36.1231%
200136 415 Energy Markets - Fuel Energy Markets - Fuel includes the labor and non-labor costs for planning and implementing power supply portfolios to provide reliable service to native load and to capitalize on market opportunities including purchasing fuel for the operating companies' electric generation system (excluding nuclear) and resource planning and acquisition including purchase power and account management.
Cost Causative MWH Generation Energy Markets - Fuel using MWH generation to allocate costs is reasonable because the costs are directly related to the purchase of fuel for generation.
36.1231%
200137 455 Energy Supply Miscellaneous Power Expense FERC 506, 539, & 549
Energy Supply Miscellaneous Power Expense FERC 506, 539, & 549 services include Energy Supply operations performance services labor and non-labor costs for non-management employees with the following accountabilities: Develop / suggest / implement improvements for multiple power plants, standardize best practices and process improvements across multiple power plants, establish operations and maintenance policies and procedures for multiple power plants.
Cost Causative MWH Generation Energy Supply Miscellaneous Power Expense FERC 506, 539, & 549 using MWH generation to allocate costs is reasonable because the costs are directly related to the support of electric generation facilities.
36.1231%
200138 458 Energy Supply Operation Supervision & Engineering (S&E) FERC 500, 535, & 546
Energy Supply Operation Supervision & Engineering (S&E) FERC 500, 535, & 546 services include labor and expenses incurred in the general supervision and direction of the operation of steam powered generation stations, hydraulic power generating stations, and other power generating stations.
Cost Causative MWH Generation Energy Supply Operation Supervision & Engineering (S&E) FERC 500, 535, & 546 using MWH generation to allocate costs is reasonable because the costs are directly related to the support of electric generation facilities. 36.1231%
200139 461 Energy Supply Maintenance Supervision & Engineering (S&E) FERC 510, 541, & 551
Energy Supply Maintenance Supervision & Engineering (S&E) FERC 510, 541, & 551 services which include management and performance labor and non-labor costs for the following accountabilities: Researching, reviewing, recommending and facilitating the selection of technological alternatives for improved plant and environmental performance. Manage uniform project management process (policies). Planning for physical plant modifications, which includes consolidation and management of short-term and long-term plans for physical plant modifications. Develop and execute innovative technology projects such as: biomass, solar, wind. Implement enterprise project management (EPM) and planning tools. Establish uniform technology, design & equipment standards.
Cost Causative MWH Generation Energy Supply Maintenance Supervision & Engineering (S&E) FERC 510, 541, & 551 using MWH generation to allocate costs is reasonable because the costs are directly related to the support of electric generation facilities.
36.1231%
200143 456 Energy Supply Miscellaneous Power Expense NSPM & NSPW FERC 506, 539, & 549
Energy Supply Miscellaneous Power Expense NSPM & NSPW FERC 506, 539, & 549 services include Energy Supply operations performance services labor and non-labor costs for non-management employees with the following accountabilities: Develop / suggest / implement improvements for multiple power plants, standardize best practices and process improvements across multiple power plants, establish operations and maintenance policies and procedures for multiple power plants. This allocation is used when NSPM & NSPW jurisdictions are benefiting from the services.
Cost Causative MWH Generation Energy Supply Miscellaneous Power Expense NSPM & NSPW FERC 506, 539, & 549 using MWH generation to allocate costs is reasonable because the costs are directly related to the support of electric generation facilities.
94.1412%
200144 459 Energy Supply Operation Supervision & Engineering (S&E) NSPM & NSPW FERC 500, 535, & 546
Energy Supply Operation Supervision & Engineering (S&E) NSPM & NSPW FERC 500, 535, & 546 services include labor and expenses incurred in the general supervision and direction of the operation of steam powered generation stations, hydraulic power generating stations, and other power generating stations. This allocation is used when NSPM & NSPW jurisdictions are benefiting from the services.
Cost Causative MWH Generation Energy Supply Operation Supervision & Engineering (S&E) NSPM & NSPW FERC 500, 535, & 546 using MWH generation to allocate costs is reasonable because the costs are directly related to the support of electric generation facilities. 94.1412%

Northern States Power Company
Service Company Allocation Descriptions, Methods and NSPM (Total Company) Percentages - Using FTE Hours
Docket No. E002/GR-20-723Exhibit___(RLB-1), Schedule 4a
Page 6 of 7
2021 Test Year Budget
SAP JDE
Cost Center Work Order No. Cost Center Description Description of Services ProvidedGeneral Allocator/
Cost Causative Allocation Method Reasonableness of Allocation MethodNSPM Alloc Percent 2020
200145 462 Energy Supply Maintenance Supervision & Engineering (S&E) NSPM & NSPW FERC 510, 541, & 551
Energy Supply Maintenance Supervision & Engineering (S&E) NSPM & NSPW FERC 510, 541, & 551 services which include management and performance labor and non-labor costs for the following accountabilities: Researching, reviewing, recommending and facilitating the selection of technological alternatives for improved plant and environmental performance. Manage uniform project management process (policies). Planning for physical plant modifications, which includes consolidation and management of short-term and long-term plans for physical plant modifications. Develop and execute innovative technology projects such as: biomass, solar, wind. Implement enterprise project management (EPM) and planning tools. Establish uniform technology, design & equipment standards. This allocation is used when NSPM & NSPW jurisdictions are benefiting from the services.
Cost Causative MWH Generation Energy Supply Maintenance Supervision & Engineering (S&E) NSPM & NSPW FERC 510, 541, & 551 using MWH generation to allocate costs is reasonable because the costs are directly related to the support of electric generation facilities.
94.1412%
200146 429 Energy Markets - Regulated Trading Energy Markets - Regulated Trading services include the labor and non-labor costs of providing electric trading services to the operating companies' electric generation systems, including load management, system optimization and origination.
Cost Causative MWH Hours Sold Energy Markets - Regulated Trading using MWH hours sold to allocate costs is reasonable because there is a cost causative relationship between regulated trading activities and the MWH hours sold. 36.2782%
200147 554 Business Objects Business Objects includes the labor and non-labor costs for the application that provides critical reporting from data universes and tables.
Cost Causative No. of Business Objects Users Business Objects using No. of Business Object users to allocate costs is reasonable because the costs are directly related to users who can access the application. 52.3185%
200148 500; 524 Business Systems Business Systems services includes the costs of providing assistance to computer users across the company. Specifically computer technology risk, software maintenance on applications Distributed to all users (e.g. Microsoft PC tools), governance and project management over all IT projects, fixed management fees with outside vendors, business analytics costs, corrective and preventative maintenance, security, data backup and recovery, help desk, and amortization of outside vendor fees and costs that are not specific to an application that has a specific allocator.
Cost Causative No. of Computers Business Systems using No. of computers to allocate costs is reasonable because there is a cost causative relationship between the No. of computers and the cost to support them.
50.4433%
200149 534 Customer & Enterprise Solutions (CES)
Customer & Enterprise Solutions (CES) includes the labor and non-labor costs for the leadership of the Customer & Enterprise Solutions organization and their administrative support staff.
Cost Causative No. of Computers/ No. of Customers/ FTE Hours
Customer & Enterprise Solutions (CES) using a ratio of No. of Computers/Customers/Employees to allocate costs is reasonable because there is a cost causative relationship with the operations supported by CES. 43.4585%
200150 520 Interactive Voice Response (IVR) Interactive Voice Response (IVR) includes the labor and non-labor costs for the application development and maintenance of the Interactive Voice Response system which interacts with a customer calling Xcel Energy call centers. It is intended to help service customers without invoking a call center agent. If the call needs to be handled by an agent, account information and the reason for the call is determined which helps route the call to the appropriate agent.
Cost Causative No. of Contacts Interactive Voice Response (IVR) using No. of contacts to allocate costs is reasonable because this system is used to take and route customer calls and benefits customers using the call centers.
34.2896%
200151 447 Customer Billing FERC 903 Customer Billing FERC 903 includes the labor and non-labor costs related to the delivery of billing statements, letters and notices to Xcel customers including postage and outside services costs, oversight and administration of customer billing area, research of billing exceptions, providing escalated customer service assistance with regard to billing issues resolution, and process remittances and receivables. This allocation is used when all four jurisdictions are benefiting from the services.
Cost Causative No. of Customer Bills Customer Billing FERC 903 using No. of customer bills to allocate costs is reasonable because the costs are directly related to customer billing activities.
39.2309%
200152 436 Customer Care FERC 902 Customer Care FERC 902 services includes the labor and non-labor costs for meter reading of retail and wholesale customers and determining consumption for billing purposes as well as executing field collections.
Cost Causative No. of Customers Customer Care FERC 902 using No. of customers to allocate costs is reasonable because the costs are directly related to customers. 35.2992%
200153 185 Customer Safety Advertising & Information Costs
Customer Safety Advertising & Information costs services includes the labor and non-labor costs associated with public safety advertising, information and education.
Cost Causative No. of Customers Customer Safety Advertising & Information Costs using No. of customers to allocate costs is reasonable because the costs are directly related to customers. 35.3489%
200154 403 Customer Service Information Technology (IT) FERC 903
Customer Service Information Technology (IT) FERC 903 services includes the labor and non-labor costs for IT applications related customer billing to customers, call center support and credit and collections.
Cost Causative No. of Customers Customer Service Information Technology (IT) FERC 903 using No. of customers to allocate costs is reasonable because the costs are directly related to customers. 35.3489%
200155 435 Customer Care FERC 903 Customer Care FERC 903 services includes the labor and non-labor costs for contact centers, remittance processing, credit and collections, customer resource management, and contact center training. This allocation is used when all four jurisdictions are benefiting from the services such as responding to residential customer inquiries regarding billings and outages, handling inbound credit calls, outbound collections calls, managing accounts receivables, training call center staffs, developing contact center call forecasts.
Cost Causative No. of Customers Customer Care FERC 903 using No. of customers to allocate costs is reasonable because the costs are directly related to customers.
35.3489%
200156 437 Customer Care FERC 901 Customer Care FERC 901 services includes the labor and non-labor costs for the leadership of the customer care organization and their administrative support staff such as consulting costs to support overall Customer Care organizational operations.
Cost Causative No. of Customers Customer Care FERC 901 using No. of customers to costs is reasonable because the costs are directly related to customers. 35.3489%
200159 405 Customer Service Information Technology (IT) NSPM & NSPW FERC 903
Customer Service Information Technology (IT) NSPM & NSPW FERC 903 services includes the labor and non-labor costs for IT applications related customer billing to customers, call center support and credit and collections. This allocation is used when NSPM & NSPW jurisdictions are benefiting from the services.
Cost Causative No. of Customers Customer Service Information Technology (IT) NSPM & NSPW FERC 903 using No. of customers to allocate costs is reasonable because the costs are directly related to customers. 84.2278%
200160 439 Customer Care NSPM & NSPW FERC 903
Customer Care NSPM & NSPW FERC 903 services includes the labor and non-labor costs for contact centers, and credit and collections, such as responding to commercial customers inquiries at the Business Solution Center. This is primarily used by the Customer Care organization when NSPM & NSPW jurisdictions are benefiting from the services.
Cost Causative No. of Customers Customer Care NSPM & NSPW FERC 903 using No. of customers to allocate costs is reasonable because the costs are directly related to customers.
84.2278%
200161 446 Customer Care Low Income Assistance FERC 908
Customer Care Low Income Assistance FERC 908 services includes the labor and non-labor costs associated with the low income energy customer program such as answering calls from customers for referral to low income assistance agencies, providing information to the agencies in order to process applications for assistance, take pledges/commitments from agencies and process payments from agencies.
Cost Causative No. of Residential Customers Customer Care Low Income Assistance FERC 908 using No. of residential customers to allocate costs is reasonable because the costs are directly related to customers.
42.1903%
200162 519 Call Logging and Quality Management (CL/QM) FERC 903
Call Logging and Quality Management (CL/QM) FERC 903 includes the labor and non-labor operating costs for the application development and maintenance of the Call Logging and Quality Management system which is used to monitor and record calls for contact center training and leadership teams.
Cost Causative No. of Customers/ No. of Contacts
Call Logging and Quality Management (CL/QM) FERC 903 using a ratio of no. of customers/no. of contacts to allocated costs is reasonable because the system benefits current and potential customers using the call centers. 34.8192%
200163 181 Employee Communications Employee Communications includes the labor and non-labor costs for the development and enhancement of employee awareness and understanding of the company's strategies, priorities, decisions and performance objectives. It develops and produces regular communication vehicles, including TODAY (daily news bulleting on intranet); XTRA (monthly print publication for all employees and retirees); All Managers E-mail (real-time communication for employees who supervise and manage others); Focus on Financials for all employees; targeted communications for specific business areas, such as Human Resources, and employee meetings.
Cost Causative FTE Hours Employee Communications using FTE Hours to allocate costs is reasonable because the costs are directly related to employees.
44.5819%
200164 198 Payroll Payroll services include the labor and non-labor costs for processing payroll including consolidation of time collection, calculation of salaries and wages, administration of employee deductions, account Distribution and reconciliation, allocation and accounting for employment taxes and compliance reports.
Cost Causative FTE Hours Payroll using FTE Hours to allocate costs is reasonable because the costs are directly related to employees.44.5819%
200165 515; 521; 552 Employee Management Systems Employee Management Systems includes the labor and non-labor costs for the Security Operations Center (SOC), Time capture and processing for payroll and accounting and Human Resources software. These applications and services provide services for the whole company related to enterprise security, including physical access, security monitoring and investigations, payroll and time accounting and employee information databases.
Cost Causative FTE Hours Employee Management Systems using FTE Hours to allocate costs is reasonable because the costs are directly related to employees.
44.5819%
200166 190; 197; 199 Human Resources (Diversity/Safety/Employee Relations)
Human Resources (Diversity/Safety/Employee Relations) includes the labor and non-labor costs for work performed for operating and affiliate company employees, such as diversity programs, providing workforce relations resources for labor agreements, arbitration, and training. Manage, design, and implement Corporate Safety initiatives. Staffing administration for non-bargaining positions and provides Affirmative Action plans (development) and government audit management (compliance).
Cost Causative FTE Hours Human Resources (Diversity/Safety/Emp Relations) using FTE Hours to allocate Human Resources costs is reasonable because the costs are directly related to employees.
44.5832%
200167 508; 550 e-Business The e-Business system includes the labor and non-labor costs associated with the corporate electronic business infrastructure.
Cost Causative FTE Hours e-Business using FTE Hours to allocate costs is reasonable because the costs benefit employees.44.5832%

Northern States Power Company
Service Company Allocation Descriptions, Methods and NSPM (Total Company) Percentages - Using FTE Hours
Docket No. E002/GR-20-723Exhibit___(RLB-1), Schedule 4a
Page 7 of 7
2021 Test Year Budget
SAP JDE
Cost Center Work Order No. Cost Center Description Description of Services ProvidedGeneral Allocator/
Cost Causative Allocation Method Reasonableness of Allocation MethodNSPM Alloc Percent 2020
200168 517 Gas Management System (GMS) FERC 866 & 880
Gas Management System (GMS) FERC 866 & 880 supports Xcel Energy gas transportation business including contracts, nominations/allocations, end-user measurement, imbalance management, and input for billing. also supports gas system supply, other balancing services. Costs include labor and non-labor for the application development and maintenance of the Gas Management System.
Cost Causative No. of Gas Customers Gas Management System (GMS) FERC 866 & 880 using No. of gas customers to allocate costs is reasonable because this system benefits gas customers.
0.0016%
200169 504; 537; 553 Energy Supply Systems Miscellaneous FERC 417.1, 506, 539, & 549
Energy Supply Systems Miscellaneous FERC 417.1, 506, 539, & 549 includes the labor and non-labor costs for the non-critical applications that support the Energy Supply area. Such as Emissions Tracker, Labworks, SAP WAM, Documentum and Meridian.
Cost Causative No. of WAM ES Users Energy Supply Systems Miscellaneous FERC 417.1, 506, 539, & 549 using the no. of WAM ES users to allocate the costs is reasonable because there is a direct causal relationship with the operations supported by WAM ES. 40.4730%
200170 518; 540 Meter Reading and Monitoring Systems FERC 902
Meter Reading and Monitoring Systems FERC 902 includes the labor and non-labor operating costs for the application development and maintenance of the software applications needed to read and monitor gas and electric meters.
Cost Causative No. of Meters Meter Reading and Monitoring Systems FERC 902 using No. of meters to allocate costs is reasonable because there is a direct causal relationship with the companies use of systems to monitor meters. 35.5695%
200171 503; 555 Customer Resource System (CRS) FERC 903
Customer Resource System (CRS) FERC 903 includes the labor and non-labor costs for the CRS system, specifically, application development and maintenance costs, licensing fees, server system costs and technology risk costs specific to disaster recovery of this application. CRS is Xcel Energy's customer service and billing system.
Cost Causative No. of Meters/ No. of Contacts Customer Resource System (CRS) FERC 903 using a ratio of no. of meters/no. of contacts to allocate costs is reasonable because there is a direct causal relationship with the operations supported by CRS.
34.9295%
200172 523 Network Network services include the labor and non-labor costs for the operation, maintenance, and management of Xcel Energy's internal and external Information Technology Network. This includes circuits, firewalls and communication assets.
Cost Causative Phones/ Radios/ Computers Network using a ratio of phones/radios/computers to allocate costs is reasonable because the network supports these major items. 50.3591%
200173 129 Generation Trading/Native Hedge - Back Office
Generation Trading/Native Hedge - Back Office includes the labor and non-labor costs associated with oversight and administration of accounting related trading costs including generation trading and native hedge. This allocator should be primarily used by Accounting and Finance, or others providing Administrative & General (A&G) activities when energy trades are executed using one of Xcel Energy Utilities generation resources.
Cost Causative Joint Operating Agreement Labor Hours Ratio
Gen/Prop Trading - Back Office use of Joint Operating Agreement Labor Hours Ratio is reasonable because there is a direct correlation between the front office activities and the mid-office and back-office activities. It is required to use the Joint Operating Agreement for the Proprietary split for these accounting and trading costs. 29.8498%
200174 145 Generation Trading/Native Hedge - Mid Office FERC 557
Generation Trading/Native Hedge - Mid Office FERC 557 includes the labor and non-labor costs associated with independent evaluation and risk measurement of trading and generation book transactions, including preparing daily P&L (profit and loss) reports and individual trader profit and loss reports for the prop book, daily generation book valuation reports for each system showing all net fuel positions and any forward sales values and/or hedges, ensuring that margin reporting follows all SEC rules and GAAP reporting and that credit and risk policies and procedures are complied with.
Cost Causative Joint Operating Agreement Labor Hours Ratio
Gen/Prop Trading - Mid Office FERC 557 use of Joint Operating Agreement Labor Hours Ratio is reasonable because there is a direct correlation between the front office activities and the mid-office and back-office activities. It is required to use the Joint Operating Agreement for the Proprietary split for these accounting and trading costs.
35.8772%
200176 412 Marketing & Sales Marketing & Sales services includes the labor and non-labor costs for marketing and sales services for the operating companies for their customers including strategic planning, segment identification, business analysis, sales planning, customer service, promoting products to the business market, and providing regulatory and policy support with respect to utility energy efficiency and demand response program design, evaluation, measurement and verification, cost effectiveness testing , and cost recovery.
Cost Causative Revenue Marketing & Sales using revenue to allocate costs is reasonable because Marketing & Sales support the revenue-producing operations of the company.
41.3872%
200177 418 Rates & Regulation - Electric Rates & Regulation - Electric includes the labor and non-labor costs for determining the regulated utilities' electric utility revenue requirements and rates for electric customers regulatory strategy, coordinating the regulatory compliance requirements, establishing and maintaining relationships with regulatory bodies, policy development of regulatory and legislative strategy, preparing and organizing rate case filings.
Cost Causative Revenue Rates & Regulation Electric using revenue to allocate costs is reasonable because they are responsible for setting revenue requirements.
28.4824%
200178 417 Rates & Regulation Rates & Regulation includes the labor and non-labor costs for determining the regulated utilities' revenue requirements and rates for electric and gas customers regulatory strategy, coordinating the regulatory compliance requirements, establishing and maintaining relationships with regulatory bodies, policy development of regulatory and legislative strategy, preparing and organizing rate case filings.
Cost Causative Revenue Rates & Regulation using revenue to allocate costs is reasonable because they are responsible for setting revenue requirements.
28.4824%
200180 528 EMS-Shared (Energy Management System-SCADA) FERC 556, 561.2, & 581
EMS-Shared (Energy Management System-SCADA) FERC 556, 561.2, & 581 provides supervisory control and data acquisition of substation devices through Remote Terminal Units (RTU's). EMS-Shared system includes the labor and non-labor costs for the application development and maintenance of the Electric Transmission, Distribution and Production Plant information operations.
Cost Causative Electric Production Plant/ Electric Transmission Plant/ Electric Distribution Plant
EMS-Shared (Energy Management System-SCADA) FERC 556, 561.2, & 581 using a ratio of electric production plant/electric transmission plant/electric distribution plant to allocate costs is reasonable because there is a direct causal relationship with the operations supported by EMS-Shared. 41.2381%
200181 464 Energy Supply Environmental Policy & Services
Energy Supply Environmental Policy & Services include the labor and non-labor costs dedicated to air quality, renewable energy, innovative technology and climate change, develop corporate compliance strategy, regulatory agency interaction (both at the federal and/or state level), permitting and compliance reporting, waste management, combustion byproducts management, environmental compliance auditing, provide support to the Environmental Council and assist with environmental communications strategies.
Cost Causative Electric Production Plant/ Electric Transmission Plant/ Electric Distribution Plant/ Gas Transmission Plant/ Gas Distribution Plant
Energy Supply Environmental Policy & Services using gross plant assets to allocate costs is reasonable because the costs are directly related to the environmental policies and services which are generated by the operation and ownership of the assets. 39.0795%
200182 465 Energy Supply Environmental Policy & Services NSPM & NSPW
ES Environmental Policy & Services NSPM & NSPW functions which include the labor and non-labor costs dedicated to air quality, renewable energy, innovative technology and climate change, develop corporate compliance strategy, regulatory agency interaction (both at the federal and/or state level), permitting and compliance reporting, waste management, combustion byproducts management, environmental compliance auditing, provide support to the Environmental Council and assist with environmental communications strategies. This allocation is used when NSPM and NSPW jurisdictions are benefiting from the services.
Cost Causative Electric Production Plant/ Electric Transmission Plant/ Electric Distribution Plant/ Gas Transmission Plant/ Gas Distribution Plant
ES Environmental Policy & Services NSPM & NSPW using gross plant assets to allocate costs is reasonable because the costs are directly related to the environmental policies and services which are generated by the operation and ownership of the assets.
85.7998%
200184 516 PowerPlan PowerPlan includes the labor and non-labor operating costs for PowerPlan, which is the capital asset business system which includes the following modules. Fixed Assets, Power Tax, Property Tax, Projects, Budgets, Cost Repository, Depreciation studies and Depreciation forecast. This includes the application development and maintenance costs, licensing fees, server system costs and technology risk costs specific to disaster recovery of this application.
Cost Causative Total Plant PowerPlan using total plant to allocate costs is reasonable because there is a direct causal relationship with the companies using PowerPlan to manage plant assets.
41.9720%
200805 163 Legal Electric Opco’s and Transco’s Legal Electric Opco’s and Transco’s services includes the labor and non-labor costs for operating companies’ electric utility legal services related to: labor and employment law, litigation, rates and regulation, environmental matters, real estate and contracts. This is primarily used by the General Counsel area.
General Allocator Assets/Revenue/FTE Hours Legal Electric Opco’s and Transco’s services that could not be directly charged to a specific legal entity are corporate in nature. Because these services are comprised of a broad spectrum of activities, no measurable method of cost causative allocation was found to allocate these costs therefore the three-factor formula was used. These services are allocated to the operating companies’ electric utility who benefit from the services.
42.8200%
200806 173 Legal Electric NSPM & NSPW Legal Electric NSPM & NSPW services includes the labor and non-labor costs for NSPM & NSPW operating companies electric legal services related to: labor and employment law, litigation, rates and regulation, environmental matters, real estate and contracts. This is primarily used by the General Counsel area.
General Allocator Assets/Revenue/FTE Hours Legal Electric NSPM & NSPW services that could not be directly charged to a specific legal entity are corporate in nature. Because these services are comprised of a broad spectrum of activities, no measurable method of cost causative allocation was found to allocate these costs therefore the three-factor formula was used. These services are allocated to NSPM & NSPW electric utility who benefit from the services.
86.1406%

Northern States Power Company
XES Allocation Statistics2021 Test Year Budget
200063 Docket No. E002/GR-20-723Exhibit___(RLB-1), Schedule 5
Page 1 of 117
Executive - Corporate GovernanceSAP ACC 200063 (110)SCB001
Legal Entity CompanyFinal Cost
Center FERCLETFERC
Account Total Assets
$000's % Total
Revenues % No. of
Employee %Allocation
%NSPM 0010 301367 F.03.01.200063.9210 9210 22,468,670$ 31.3818% 5,240,697$ 37.3735% 3,820 48.7307% 39.1620%NSPW 0011 301368 F.03.02.200063.9210 9210 2,887,050 4.0323% 981,344 6.9984% 542 6.9141% 5.9816%PSCo 0012 301369 F.03.03.200063.9210 9210 19,541,229 27.2931% 4,614,346 32.9068% 2,315 29.5318% 29.9106%SPS 0013 301370 F.03.04.200063.9210 9210 7,982,885 11.1496% 1,826,207 13.0234% 1,148 14.6447% 12.9393%Eloigne 0015 300009 F.03.05.200063.9210 9210 127,927 0.1787% 9,991 0.0712% - 0.0000% 0.0833%Reddy Kilowatt 0017 300010 F.03.06.200063.9210 9210 2,901 0.0041% - 0.0000% - 0.0000% 0.0014%United Power & Land 0019 300012 F.03.07.200063.9210 9210 1,131 0.0016% 24 0.0002% - 0.0000% 0.0006%Xcel Energy 0023 300014 F.03.08.200063.9210 9210 18,048,786 25.2086% 1,341,300 9.5654% 14 0.1786% 11.6508%1480 Welton 0029 300020 F.03.09.200063.9210 9210 12,090 0.0169% 4,452 0.0317% - 0.0000% 0.0162%Xcel Energy WYCO Inc. 0038 300025 F.03.10.200063.9210 9210 177,375 0.2477% - 0.0000% - 0.0000% 0.0826%PSR Investments 0041 300026 F.03.11.200063.9210 9210 9,445 0.0132% - 0.0000% - 0.0000% 0.0044%WGI 0043 300027 F.03.12.200063.9210 9210 929 0.0013% 147 0.0010% - 0.0000% 0.0008%Xcel Energy Performance Contracting 0051 300029 F.03.13.200063.9210 9210 468 0.0007% - 0.0000% - 0.0000% 0.0002%Chippewa Flambeau 0057 300031 F.03.14.200063.9210 9210 944 0.0013% 641 0.0046% - 0.0000% 0.0020%Clearwater 0058 300032 F.03.15.200063.9210 9210 3,032 0.0042% 249 0.0018% - 0.0000% 0.0020%NSP Lands 0059 300033 F.03.16.200063.9210 9210 49 0.0001% - 0.0000% - 0.0000% 0.0000%Xcel Energy Transmission Holding Co 0075 300039 F.03.17.200063.9210 9210 242 0.0003% - 0.0000% - 0.0000% 0.0001%Xcel Energy Transmission Development Co 0076 300040 F.03.18.200063.9210 9210 94 0.0001% - 0.0000% - 0.0000% 0.0000%Xcel Energy Southwest Transmission Co 0077 300041 F.03.19.200063.9210 9210 151 0.0002% - 0.0000% - 0.0000% 0.0001%Energy Impact Fund Investments LLC 0086 302160 F.03.20.200063.9210 9210 44,127 0.0616% - 0.0000% - 0.0000% 0.0205%Nicollet Projects I LLC 0088 302162 F.03.21.200063.9210 9210 72,927 0.1019% 3,087 0.0220% - 0.0000% 0.0413%Capital Services, LLC 0089 302163 F.03.22.200063.9210 9210 214,824 0.3000% - 0.0000% - 0.0000% 0.1000%Xcel Energy Investments LLC 0092 302240 F.03.23.200063.9210 9210 472 0.0007% - 0.0000% - 0.0000% 0.0002%Total 71,597,748$ 100.0000% 14,022,485$ 100.0000% 7,839 100.0000% 100.0000%
Allocation Changes: Prepared By Reviewed By Approved By Eff. Date
Updated Statistics
Erika Moeller Audra Lake Ross Baumgarten 4/1/2020

Northern States Power Company
XES Allocation Statistics2021 Test Year Budget
200064 Docket No. E002/GR-20-723Exhibit___(RLB-1), Schedule 5
Page 2 of 117
Shareholder - Corporate GovernanceSAP ACC 200064 (115)SCB002
Legal Entity CompanyFinal Cost FERCLET
FERC Account
Total Assets $000's %
Total Revenues %
No. of Employee % Allocation %
NSPM 0010 301367 F.03.01.200064.9210 9210 22,468,670$ 31.3818% 5,240,697$ 37.3735% 3,820 48.7307% 39.1620%NSPW 0011 301397 F.03.02.200064.9210 9210 2,887,050 4.0323% 981,344 6.9984% 542 6.9141% 5.9816%PSCo 0012 301398 F.03.03.200064.9210 9210 19,541,229 27.2931% 4,614,346 32.9068% 2,315 29.5318% 29.9106%SPS 0013 301399 F.03.04.200064.9210 9210 7,982,885 11.1496% 1,826,207 13.0234% 1,148 14.6447% 12.9393%Eloigne 0015 300009 F.03.05.200064.9210 9210 127,927 0.1787% 9,991 0.0712% - 0.0000% 0.0833%Reddy Kilowatt 0017 300010 F.03.06.200064.9210 9210 2,901 0.0041% - 0.0000% - 0.0000% 0.0014%United Power & Land 0019 300012 F.03.07.200064.9210 9210 1,131 0.0016% 24 0.0002% - 0.0000% 0.0006%Xcel Energy 0023 300014 F.03.08.200064.9210 9210 18,048,786 25.2086% 1,341,300 9.5654% 14 0.1786% 11.6508%1480 Welton 0029 300020 F.03.09.200064.9210 9210 12,090 0.0169% 4,452 0.0317% - 0.0000% 0.0162%Xcel Energy WYCO Inc. 0038 300025 F.03.10.200064.9210 9210 177,375 0.2477% - 0.0000% - 0.0000% 0.0826%PSR Investments 0041 300026 F.03.11.200064.9210 9210 9,445 0.0132% - 0.0000% - 0.0000% 0.0044%WGI 0043 300027 F.03.12.200064.9210 9210 929 0.0013% 147 0.0010% - 0.0000% 0.0008%Xcel Energy Performance Contracting 0051 300029 F.03.13.200064.9210 9210 468 0.0007% - 0.0000% - 0.0000% 0.0002%Chippewa Flambeau 0057 300031 F.03.14.200064.9210 9210 944 0.0013% 641 0.0046% - 0.0000% 0.0020%Clearwater 0058 300032 F.03.15.200064.9210 9210 3,032 0.0042% 249 0.0018% - 0.0000% 0.0020%NSP Lands 0059 300033 F.03.16.200064.9210 9210 49 0.0001% - 0.0000% - 0.0000% 0.0000%Xcel Energy Transmission Holding Co 0075 300039 F.03.17.200064.9210 9210 242 0.0003% - 0.0000% - 0.0000% 0.0001%Xcel Energy Transmission Development Co 0076 300040 F.03.18.200064.9210 9210 94 0.0001% - 0.0000% - 0.0000% 0.0000%Xcel Energy Southwest Transmission Co 0077 300041 F.03.19.200064.9210 9210 151 0.0002% - 0.0000% - 0.0000% 0.0001%Energy Impact Fund Investments LLC 0086 302160 F.03.20.200064.9210 9210 44,127 0.0616% - 0.0000% - 0.0000% 0.0205%Nicollet Projects I LLC 0088 302162 F.03.21.200064.9210 9210 72,927 0.1019% 3,087 0.0220% - 0.0000% 0.0413%Capital Services, LLC 0089 302163 F.03.22.200064.9210 9210 214,824 0.3000% - 0.0000% - 0.0000% 0.1000%Xcel Energy Investments LLC 0092 302240 F.03.23.200064.9210 9210 472 0.0007% - 0.0000% - 0.0000% 0.0002%Total 71,597,748$ 100.0000% 14,022,485$ 100.0000% 7,839 100.0000% 100.0000%
Allocation Changes: Prepared By Reviewed By Approved By Eff. Date
Updated Statistics
Erika Moeller Audra Lake Ross Baumgarten 4/1/2020

Northern States Power Company
XES Allocation Statistics2021 Test Year Budget
200065 Docket No. E002/GR-20-723Exhibit___(RLB-1), Schedule 5
Page 3 of 117
Investor Relations - Corporate GovernanceSAP ACC 200065 (116)SCB003
Legal Entity CompanyFinal Cost FERCLET
FERC Account
Total Assets $000's %
Total Revenues %
No. of Employee %
Allocation %
NSPM 0010 301467 F.03.01.200065.9210 9210 22,468,670$ 31.3818% 5,240,697$ 37.3735% 3,820 48.7307% 39.1620%NSPW 0011 301471 F.03.02.200065.9210 9210 2,887,050 4.0323% 981,344 6.9984% 542 6.9141% 5.9816%PSCo 0012 301475 F.03.03.200065.9210 9210 19,541,229 27.2931% 4,614,346 32.9068% 2,315 29.5318% 29.9106%SPS 0013 301476 F.03.04.200065.9210 9210 7,982,885 11.1496% 1,826,207 13.0234% 1,148 14.6447% 12.9393%Eloigne 0015 300009 F.03.05.200065.9210 9210 127,927 0.1787% 9,991 0.0712% - 0.0000% 0.0833%Reddy Kilowatt 0017 300010 F.03.06.200065.9210 9210 2,901 0.0041% - 0.0000% - 0.0000% 0.0014%United Power & Land 0019 300012 F.03.07.200065.9210 9210 1,131 0.0016% 24 0.0002% - 0.0000% 0.0006%Xcel Energy 0023 300014 F.03.08.200065.9210 9210 18,048,786 25.2086% 1,341,300 9.5654% 14 0.1786% 11.6508%1480 Welton 0029 300020 F.03.09.200065.9210 9210 12,090 0.0169% 4,452 0.0317% - 0.0000% 0.0162%Xcel Energy WYCO Inc. 0038 300025 F.03.10.200065.9210 9210 177,375 0.2477% - 0.0000% - 0.0000% 0.0826%PSR Investments 0041 300026 F.03.11.200065.9210 9210 9,445 0.0132% - 0.0000% - 0.0000% 0.0044%WGI 0043 300027 F.03.12.200065.9210 9210 929 0.0013% 147 0.0010% - 0.0000% 0.0008%Xcel Energy Performance Contracting 0051 300029 F.03.13.200065.9210 9210 468 0.0007% - 0.0000% - 0.0000% 0.0002%Chippewa Flambeau 0057 300031 F.03.14.200065.9210 9210 944 0.0013% 641 0.0046% - 0.0000% 0.0020%Clearwater 0058 300032 F.03.15.200065.9210 9210 3,032 0.0042% 249 0.0018% - 0.0000% 0.0020%NSP Lands 0059 300033 F.03.16.200065.9210 9210 49 0.0001% - 0.0000% - 0.0000% 0.0000%Xcel Energy Transmission Holding Co 0075 300039 F.03.17.200065.9210 9210 242 0.0003% - 0.0000% - 0.0000% 0.0001%Xcel Energy Transmission Development Co 0076 300040 F.03.18.200065.9210 9210 94 0.0001% - 0.0000% - 0.0000% 0.0000%Xcel Energy Southwest Transmission Co 0077 300041 F.03.19.200065.9210 9210 151 0.0002% - 0.0000% - 0.0000% 0.0001%Energy Impact Fund Investments LLC 0086 302160 F.03.20.200065.9210 9210 44,127 0.0616% - 0.0000% - 0.0000% 0.0205%Nicollet Projects I LLC 0088 302162 F.03.21.200065.9210 9210 72,927 0.1019% 3,087 0.0220% - 0.0000% 0.0413%Capital Services, LLC 0089 302163 F.03.22.200065.9210 9210 214,824 0.3000% - 0.0000% - 0.0000% 0.1000%Xcel Energy Investments LLC 0092 302240 F.03.23.200065.9210 9210 472 0.0007% - 0.0000% - 0.0000% 0.0002%Total 71,597,748$ 100.0000% 14,022,485$ 100.0000% 7,839 100.0000% 100.0000%
Allocation Changes: Prepared By Reviewed By Approved By Eff. Date
Updated Statistics
Erika Moeller Audra Lake Ross Baumgarten 4/1/2020

Northern States Power Company
XES Allocation Statistics2021 Test Year Budget
200066 Docket No. E002/GR-20-723Exhibit___(RLB-1), Schedule 5
Page 4 of 117
Accounting, Reporting & Tax - Corporate GovernanceSAP ACC 200066 (121)SCB004
Legal Entity CompanyFinal Cost FERCLET
FERC Account
Total Assets $000's %
Total Revenues %
No. of Employee %
Allocation %
NSPM 0010 301683 F.03.01.200066.9210 9210 22,468,670$ 31.3818% 5,240,697$ 37.3735% 3,820 48.7307% 39.1620%NSPW 0011 301684 F.03.02.200066.9210 9210 2,887,050 4.0323% 981,344 6.9984% 542 6.9141% 5.9816%PSCo 0012 301685 F.03.03.200066.9210 9210 19,541,229 27.2931% 4,614,346 32.9068% 2,315 29.5318% 29.9106%SPS 0013 301476 F.03.04.200066.9210 9210 7,982,885 11.1496% 1,826,207 13.0234% 1,148 14.6447% 12.9393%Eloigne 0015 300009 F.03.05.200066.9210 9210 127,927 0.1787% 9,991 0.0712% - 0.0000% 0.0833%Reddy Kilowatt 0017 300010 F.03.06.200066.9210 9210 2,901 0.0041% - 0.0000% - 0.0000% 0.0014%United Power & Land 0019 300012 F.03.07.200066.9210 9210 1,131 0.0016% 24 0.0002% - 0.0000% 0.0006%Xcel Energy 0023 300014 F.03.08.200066.9210 9210 18,048,786 25.2086% 1,341,300 9.5654% 14 0.1786% 11.6508%1480 Welton 0029 300020 F.03.09.200066.9210 9210 12,090 0.0169% 4,452 0.0317% - 0.0000% 0.0162%Xcel Energy WYCO Inc. 0038 300025 F.03.10.200066.9210 9210 177,375 0.2477% - 0.0000% - 0.0000% 0.0826%PSR Investments 0041 300026 F.03.11.200066.9210 9210 9,445 0.0132% - 0.0000% - 0.0000% 0.0044%WGI 0043 300027 F.03.12.200066.9210 9210 929 0.0013% 147 0.0010% - 0.0000% 0.0008%Xcel Energy Performance Contracting 0051 300029 F.03.13.200066.9210 9210 468 0.0007% - 0.0000% - 0.0000% 0.0002%Chippewa Flambeau 0057 300031 F.03.14.200066.9210 9210 944 0.0013% 641 0.0046% - 0.0000% 0.0020%Clearwater 0058 300032 F.03.15.200066.9210 9210 3,032 0.0042% 249 0.0018% - 0.0000% 0.0020%NSP Lands 0059 300033 F.03.16.200066.9210 9210 49 0.0001% - 0.0000% - 0.0000% 0.0000%Xcel Energy Transmission Holding Co 0075 300039 F.03.17.200066.9210 9210 242 0.0003% - 0.0000% - 0.0000% 0.0001%Xcel Energy Transmission Development Co 0076 300040 F.03.18.200066.9210 9210 94 0.0001% - 0.0000% - 0.0000% 0.0000%Xcel Energy Southwest Transmission Co 0077 300041 F.03.19.200066.9210 9210 151 0.0002% - 0.0000% - 0.0000% 0.0001%Energy Impact Fund Investments LLC 0086 302160 F.03.20.200066.9210 9210 44,127 0.0616% - 0.0000% - 0.0000% 0.0205%Nicollet Projects I LLC 0088 302162 F.03.21.200066.9210 9210 72,927 0.1019% 3,087 0.0220% - 0.0000% 0.0413%Capital Services, LLC 0089 302163 F.03.22.200066.9210 9210 214,824 0.3000% - 0.0000% - 0.0000% 0.1000%Xcel Energy Investments LLC 0092 302240 F.03.23.200066.9210 9210 472 0.0007% - 0.0000% - 0.0000% 0.0002%Total 71,597,748$ 100.0000% 14,022,485$ 100.0000% 7,839 100.0000% 100.0000%
Allocation Changes: Prepared By Reviewed By Approved By Eff. Date
Updated Statistics
Erika Moeller Audra Lake Ross Baumgarten 4/1/2020

Northern States Power Company
XES Allocation Statistics2021 Test Year Budget
200067 Docket No. E002/GR-20-723Exhibit___(RLB-1), Schedule 5
Page 5 of 117
Audit Services - Corporate GovernanceSAP ACC 200067 (131)SCB005
Legal Entity CompanyFinal Cost FERCLET
FERC Account
Total Assets $000's %
Total Revenues %
No. of Employee %
Allocation %
NSPM 0010 301425 F.03.01.200067.9210 9210 22,468,670$ 31.3818% 5,240,697$ 37.3735% 3,820 48.7307% 39.1620%NSPW 0011 301426 F.03.02.200067.9210 9210 2,887,050 4.0323% 981,344 6.9984% 542 6.9141% 5.9816%PSCo 0012 301427 F.03.03.200067.9210 9210 19,541,229 27.2931% 4,614,346 32.9068% 2,315 29.5318% 29.9106%SPS 0013 301428 F.03.04.200067.9210 9210 7,982,885 11.1496% 1,826,207 13.0234% 1,148 14.6447% 12.9393%Eloigne 0015 300009 F.03.05.200067.9210 9210 127,927 0.1787% 9,991 0.0712% - 0.0000% 0.0833%Reddy Kilowatt 0017 300010 F.03.06.200067.9210 9210 2,901 0.0041% - 0.0000% - 0.0000% 0.0014%United Power & Land 0019 300012 F.03.07.200067.9210 9210 1,131 0.0016% 24 0.0002% - 0.0000% 0.0006%Xcel Energy 0023 300014 F.03.08.200067.9210 9210 18,048,786 25.2086% 1,341,300 9.5654% 14 0.1786% 11.6508%1480 Welton 0029 300020 F.03.09.200067.9210 9210 12,090 0.0169% 4,452 0.0317% - 0.0000% 0.0162%Xcel Energy WYCO Inc. 0038 300025 F.03.10.200067.9210 9210 177,375 0.2477% - 0.0000% - 0.0000% 0.0826%PSR Investments 0041 300026 F.03.11.200067.9210 9210 9,445 0.0132% - 0.0000% - 0.0000% 0.0044%WGI 0043 300027 F.03.12.200067.9210 9210 929 0.0013% 147 0.0010% - 0.0000% 0.0008%Xcel Energy Performance Contracting 0051 300029 F.03.13.200067.9210 9210 468 0.0007% - 0.0000% - 0.0000% 0.0002%Chippewa Flambeau 0057 300031 F.03.14.200067.9210 9210 944 0.0013% 641 0.0046% - 0.0000% 0.0020%Clearwater 0058 300032 F.03.15.200067.9210 9210 3,032 0.0042% 249 0.0018% - 0.0000% 0.0020%NSP Lands 0059 300033 F.03.16.200067.9210 9210 49 0.0001% - 0.0000% - 0.0000% 0.0000%Xcel Energy Transmission Holding Co 0075 300039 F.03.17.200067.9210 9210 242 0.0003% - 0.0000% - 0.0000% 0.0001%Xcel Energy Transmission Development Co 0076 300040 F.03.18.200067.9210 9210 94 0.0001% - 0.0000% - 0.0000% 0.0000%Xcel Energy Southwest Transmission Co 0077 300041 F.03.19.200067.9210 9210 151 0.0002% - 0.0000% - 0.0000% 0.0001%Energy Impact Fund Investments LLC 0086 302160 F.03.20.200067.9210 9210 44,127 0.0616% - 0.0000% - 0.0000% 0.0205%Nicollet Projects I LLC 0088 302162 F.03.21.200067.9210 9210 72,927 0.1019% 3,087 0.0220% - 0.0000% 0.0413%Capital Services, LLC 0089 302163 F.03.22.200067.9210 9210 214,824 0.3000% - 0.0000% - 0.0000% 0.1000%Xcel Energy Investments LLC 0092 302240 F.03.23.200067.9210 9210 472 0.0007% - 0.0000% - 0.0000% 0.0002%Total 71,597,748$ 100.0000% 14,022,485$ 100.0000% 7,839 100.0000% 100.0000%
Allocation Changes: Prepared By Reviewed By Approved By Eff. Date
Updated Statistics
Erika Moeller Audra Lake Ross Baumgarten 4/1/2020

Northern States Power Company
XES Allocation Statistics2021 Test Year Budget
200068 Docket No. E002/GR-20-723Exhibit___(RLB-1), Schedule 5
Page 6 of 117
Corporate Finance, Treasury & Cash Management - Corporate GovernanceSAP ACC 200068 (141)SCB006
Legal Entity CompanyFinal Cost FERCLET
FERC Account
Total Assets $000's %
Total Revenues %
No. of Employee %
Allocation %
NSPM 0010 301441 F.03.01.200068.9210 9210 22,468,670$ 31.3818% 5,240,697$ 37.3735% 3,820 48.7307% 39.1620%NSPW 0011 301442 F.03.02.200068.9210 9210 2,887,050 4.0323% 981,344 6.9984% 542 6.9141% 5.9816%PSCo 0012 301443 F.03.03.200068.9210 9210 19,541,229 27.2931% 4,614,346 32.9068% 2,315 29.5318% 29.9106%SPS 0013 301444 F.03.04.200068.9210 9210 7,982,885 11.1496% 1,826,207 13.0234% 1,148 14.6447% 12.9393%Eloigne 0015 300009 F.03.05.200068.9210 9210 127,927 0.1787% 9,991 0.0712% - 0.0000% 0.0833%Reddy Kilowatt 0017 300010 F.03.06.200068.9210 9210 2,901 0.0041% - 0.0000% - 0.0000% 0.0014%United Power & Land 0019 300012 F.03.07.200068.9210 9210 1,131 0.0016% 24 0.0002% - 0.0000% 0.0006%Xcel Energy 0023 300014 F.03.08.200068.9210 9210 18,048,786 25.2086% 1,341,300 9.5654% 14 0.1786% 11.6508%1480 Welton 0029 300020 F.03.09.200068.9210 9210 12,090 0.0169% 4,452 0.0317% - 0.0000% 0.0162%Xcel Energy WYCO Inc. 0038 300025 F.03.10.200068.9210 9210 177,375 0.2477% - 0.0000% - 0.0000% 0.0826%PSR Investments 0041 300026 F.03.11.200068.9210 9210 9,445 0.0132% - 0.0000% - 0.0000% 0.0044%WGI 0043 300027 F.03.12.200068.9210 9210 929 0.0013% 147 0.0010% - 0.0000% 0.0008%Xcel Energy Performance Contracting 0051 300029 F.03.13.200068.9210 9210 468 0.0007% - 0.0000% - 0.0000% 0.0002%Chippewa Flambeau 0057 300031 F.03.14.200068.9210 9210 944 0.0013% 641 0.0046% - 0.0000% 0.0020%Clearwater 0058 300032 F.03.15.200068.9210 9210 3,032 0.0042% 249 0.0018% - 0.0000% 0.0020%NSP Lands 0059 300033 F.03.16.200068.9210 9210 49 0.0001% - 0.0000% - 0.0000% 0.0000%Xcel Energy Transmission Holding Co 0075 300039 F.03.17.200068.9210 9210 242 0.0003% - 0.0000% - 0.0000% 0.0001%Xcel Energy Transmission Development Co 0076 300040 F.03.18.200068.9210 9210 94 0.0001% - 0.0000% - 0.0000% 0.0000%Xcel Energy Southwest Transmission Co 0077 300041 F.03.19.200068.9210 9210 151 0.0002% - 0.0000% - 0.0000% 0.0001%Energy Impact Fund Investments LLC 0086 302160 F.03.20.200068.9210 9210 44,127 0.0616% - 0.0000% - 0.0000% 0.0205%Nicollet Projects I LLC 0088 302162 F.03.21.200068.9210 9210 72,927 0.1019% 3,087 0.0220% - 0.0000% 0.0413%Capital Services, LLC 0089 302163 F.03.22.200068.9210 9210 214,824 0.3000% - 0.0000% - 0.0000% 0.1000%Xcel Energy Investments LLC 0092 302240 F.03.23.200068.9210 9210 472 0.0007% - 0.0000% - 0.0000% 0.0002%Total 71,597,748$ 100.0000% 14,022,485$ 100.0000% 7,839 100.0000% 100.0000%
Allocation Changes: Prepared By Reviewed By Approved By Eff. Date
Updated Statistics
Erika Moeller Audra Lake Ross Baumgarten 4/1/2020

Northern States Power Company
XES Allocation Statistics2021 Test Year Budget
200069 Docket No. E002/GR-20-723Exhibit___(RLB-1), Schedule 5
Page 7 of 117
Risk Management - Corporate GovernanceSAP ACC 200069 (143)SCB007
Legal Entity CompanyFinal Cost FERCLET
FERC Account
Total Assets $000's %
Total Revenues %
No. of Employee %
Allocation %
NSPM 0010 301477 F.03.01.200069.9210 9210 22,468,670$ 31.3818% 5,240,697$ 37.3735% 3,820 48.7307% 39.1620%NSPW 0011 301478 F.03.02.200069.9210 9210 2,887,050 4.0323% 981,344 6.9984% 542 6.9141% 5.9816%PSCo 0012 301479 F.03.03.200069.9210 9210 19,541,229 27.2931% 4,614,346 32.9068% 2,315 29.5318% 29.9106%SPS 0013 301480 F.03.04.200069.9210 9210 7,982,885 11.1496% 1,826,207 13.0234% 1,148 14.6447% 12.9393%Eloigne 0015 300009 F.03.05.200069.9210 9210 127,927 0.1787% 9,991 0.0712% - 0.0000% 0.0833%Reddy Kilowatt 0017 300010 F.03.06.200069.9210 9210 2,901 0.0041% - 0.0000% - 0.0000% 0.0014%United Power & Land 0019 300012 F.03.07.200069.9210 9210 1,131 0.0016% 24 0.0002% - 0.0000% 0.0006%Xcel Energy 0023 300014 F.03.08.200069.9210 9210 18,048,786 25.2086% 1,341,300 9.5654% 14 0.1786% 11.6508%1480 Welton 0029 300020 F.03.09.200069.9210 9210 12,090 0.0169% 4,452 0.0317% - 0.0000% 0.0162%Xcel Energy WYCO Inc. 0038 300025 F.03.10.200069.9210 9210 177,375 0.2477% - 0.0000% - 0.0000% 0.0826%PSR Investments 0041 300026 F.03.11.200069.9210 9210 9,445 0.0132% - 0.0000% - 0.0000% 0.0044%WGI 0043 300027 F.03.12.200069.9210 9210 929 0.0013% 147 0.0010% - 0.0000% 0.0008%Xcel Energy Performance Contracting 0051 300029 F.03.13.200069.9210 9210 468 0.0007% - 0.0000% - 0.0000% 0.0002%Chippewa Flambeau 0057 300031 F.03.14.200069.9210 9210 944 0.0013% 641 0.0046% - 0.0000% 0.0020%Clearwater 0058 300032 F.03.15.200069.9210 9210 3,032 0.0042% 249 0.0018% - 0.0000% 0.0020%NSP Lands 0059 300033 F.03.16.200069.9210 9210 49 0.0001% - 0.0000% - 0.0000% 0.0000%Xcel Energy Transmission Holding Co 0075 300039 F.03.17.200069.9210 9210 242 0.0003% - 0.0000% - 0.0000% 0.0001%Xcel Energy Transmission Development Co 0076 300040 F.03.18.200069.9210 9210 94 0.0001% - 0.0000% - 0.0000% 0.0000%Xcel Energy Southwest Transmission Co 0077 300041 F.03.19.200069.9210 9210 151 0.0002% - 0.0000% - 0.0000% 0.0001%Energy Impact Fund Investments LLC 0086 302160 F.03.20.200069.9210 9210 44,127 0.0616% - 0.0000% - 0.0000% 0.0205%Nicollet Projects I LLC 0088 302162 F.03.21.200069.9210 9210 72,927 0.1019% 3,087 0.0220% - 0.0000% 0.0413%Capital Services, LLC 0089 302163 F.03.22.200069.9210 9210 214,824 0.3000% - 0.0000% - 0.0000% 0.1000%Xcel Energy Investments LLC 0092 302240 F.03.23.200069.9210 9210 472 0.0007% - 0.0000% - 0.0000% 0.0002%Total 71,597,748$ 100.0000% 14,022,485$ 100.0000% 7,839 100.0000% 100.0000%
Allocation Changes: Prepared By Reviewed By Approved By Eff. Date
Updated Statistics
Erika Moeller Audra Lake Ross Baumgarten 4/1/2020
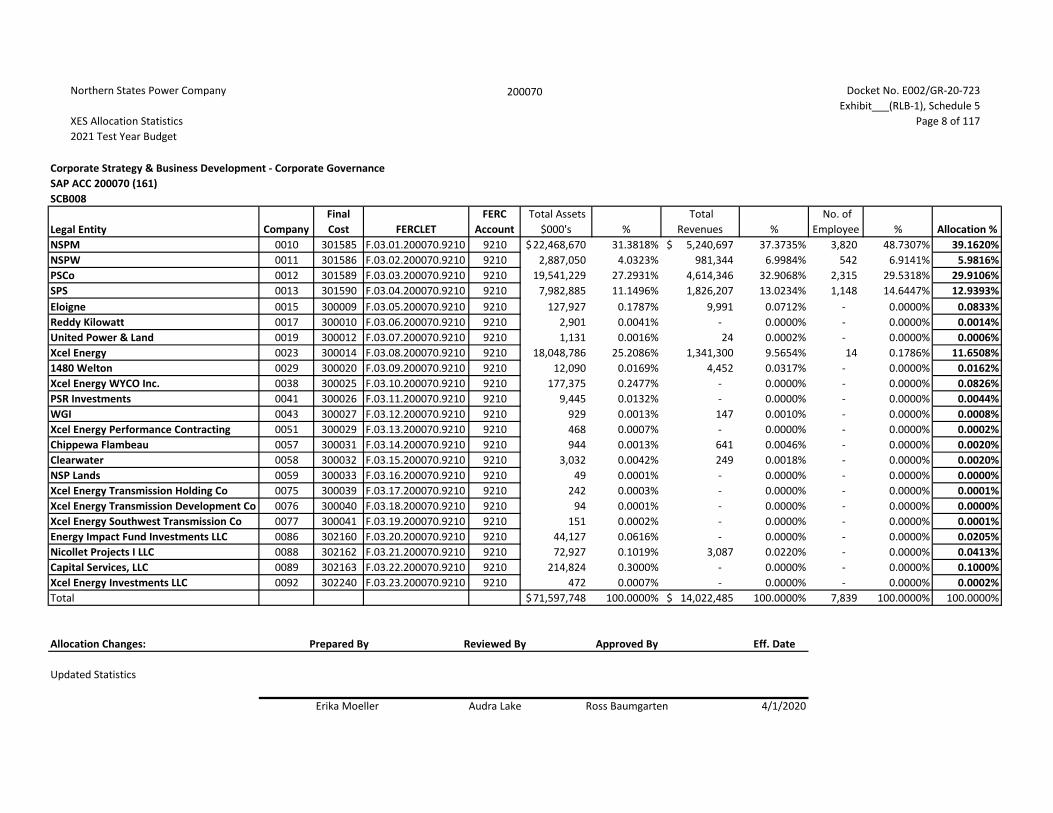
Northern States Power Company
XES Allocation Statistics2021 Test Year Budget
200070 Docket No. E002/GR-20-723Exhibit___(RLB-1), Schedule 5
Page 8 of 117
Corporate Strategy & Business Development - Corporate GovernanceSAP ACC 200070 (161)SCB008
Legal Entity CompanyFinal Cost FERCLET
FERC Account
Total Assets $000's %
Total Revenues %
No. of Employee % Allocation %
NSPM 0010 301585 F.03.01.200070.9210 9210 22,468,670$ 31.3818% 5,240,697$ 37.3735% 3,820 48.7307% 39.1620%NSPW 0011 301586 F.03.02.200070.9210 9210 2,887,050 4.0323% 981,344 6.9984% 542 6.9141% 5.9816%PSCo 0012 301589 F.03.03.200070.9210 9210 19,541,229 27.2931% 4,614,346 32.9068% 2,315 29.5318% 29.9106%SPS 0013 301590 F.03.04.200070.9210 9210 7,982,885 11.1496% 1,826,207 13.0234% 1,148 14.6447% 12.9393%Eloigne 0015 300009 F.03.05.200070.9210 9210 127,927 0.1787% 9,991 0.0712% - 0.0000% 0.0833%Reddy Kilowatt 0017 300010 F.03.06.200070.9210 9210 2,901 0.0041% - 0.0000% - 0.0000% 0.0014%United Power & Land 0019 300012 F.03.07.200070.9210 9210 1,131 0.0016% 24 0.0002% - 0.0000% 0.0006%Xcel Energy 0023 300014 F.03.08.200070.9210 9210 18,048,786 25.2086% 1,341,300 9.5654% 14 0.1786% 11.6508%1480 Welton 0029 300020 F.03.09.200070.9210 9210 12,090 0.0169% 4,452 0.0317% - 0.0000% 0.0162%Xcel Energy WYCO Inc. 0038 300025 F.03.10.200070.9210 9210 177,375 0.2477% - 0.0000% - 0.0000% 0.0826%PSR Investments 0041 300026 F.03.11.200070.9210 9210 9,445 0.0132% - 0.0000% - 0.0000% 0.0044%WGI 0043 300027 F.03.12.200070.9210 9210 929 0.0013% 147 0.0010% - 0.0000% 0.0008%Xcel Energy Performance Contracting 0051 300029 F.03.13.200070.9210 9210 468 0.0007% - 0.0000% - 0.0000% 0.0002%Chippewa Flambeau 0057 300031 F.03.14.200070.9210 9210 944 0.0013% 641 0.0046% - 0.0000% 0.0020%Clearwater 0058 300032 F.03.15.200070.9210 9210 3,032 0.0042% 249 0.0018% - 0.0000% 0.0020%NSP Lands 0059 300033 F.03.16.200070.9210 9210 49 0.0001% - 0.0000% - 0.0000% 0.0000%Xcel Energy Transmission Holding Co 0075 300039 F.03.17.200070.9210 9210 242 0.0003% - 0.0000% - 0.0000% 0.0001%Xcel Energy Transmission Development Co 0076 300040 F.03.18.200070.9210 9210 94 0.0001% - 0.0000% - 0.0000% 0.0000%Xcel Energy Southwest Transmission Co 0077 300041 F.03.19.200070.9210 9210 151 0.0002% - 0.0000% - 0.0000% 0.0001%Energy Impact Fund Investments LLC 0086 302160 F.03.20.200070.9210 9210 44,127 0.0616% - 0.0000% - 0.0000% 0.0205%Nicollet Projects I LLC 0088 302162 F.03.21.200070.9210 9210 72,927 0.1019% 3,087 0.0220% - 0.0000% 0.0413%Capital Services, LLC 0089 302163 F.03.22.200070.9210 9210 214,824 0.3000% - 0.0000% - 0.0000% 0.1000%Xcel Energy Investments LLC 0092 302240 F.03.23.200070.9210 9210 472 0.0007% - 0.0000% - 0.0000% 0.0002%Total 71,597,748$ 100.0000% 14,022,485$ 100.0000% 7,839 100.0000% 100.0000%
Allocation Changes: Prepared By Reviewed By Approved By Eff. Date
Updated Statistics
Erika Moeller Audra Lake Ross Baumgarten 4/1/2020

Northern States Power Company
XES Allocation Statistics2021 Test Year Budget
200071 Docket No. E002/GR-20-723Exhibit___(RLB-1), Schedule 5
Page 9 of 117
Legal - Corporate GovernanceSAP ACC 200071 (171)SCB009
Legal Entity CompanyFinal Cost FERCLET
FERC Account
Total Assets $000's %
Total Revenues %
No. of Employee % Allocation %
NSPM 0010 301563 F.03.01.200071.9210 9210 22,468,670$ 31.3818% 5,240,697$ 37.3735% 3,820 48.7307% 39.1620%NSPW 0011 302044 F.03.02.200071.9210 9210 2,887,050 4.0323% 981,344 6.9984% 542 6.9141% 5.9816%PSCo 0012 300388 F.03.03.200071.9210 9210 19,541,229 27.2931% 4,614,346 32.9068% 2,315 29.5318% 29.9106%SPS 0013 300390 F.03.04.200071.9210 9210 7,982,885 11.1496% 1,826,207 13.0234% 1,148 14.6447% 12.9393%Eloigne 0015 300009 F.03.05.200071.9210 9210 127,927 0.1787% 9,991 0.0712% - 0.0000% 0.0833%Reddy Kilowatt 0017 300010 F.03.06.200071.9210 9210 2,901 0.0041% - 0.0000% - 0.0000% 0.0014%United Power & Land 0019 300012 F.03.07.200071.9210 9210 1,131 0.0016% 24 0.0002% - 0.0000% 0.0006%Xcel Energy 0023 300014 F.03.08.200071.9210 9210 18,048,786 25.2086% 1,341,300 9.5654% 14 0.1786% 11.6508%1480 Welton 0029 300020 F.03.09.200071.9210 9210 12,090 0.0169% 4,452 0.0317% - 0.0000% 0.0162%Xcel Energy WYCO Inc. 0038 300025 F.03.10.200071.9210 9210 177,375 0.2477% - 0.0000% - 0.0000% 0.0826%PSR Investments 0041 300026 F.03.11.200071.9210 9210 9,445 0.0132% - 0.0000% - 0.0000% 0.0044%WGI 0043 300027 F.03.12.200071.9210 9210 929 0.0013% 147 0.0010% - 0.0000% 0.0008%Xcel Energy Performance Contracting 0051 300029 F.03.13.200071.9210 9210 468 0.0007% - 0.0000% - 0.0000% 0.0002%Chippewa Flambeau 0057 300031 F.03.14.200071.9210 9210 944 0.0013% 641 0.0046% - 0.0000% 0.0020%Clearwater 0058 300032 F.03.15.200071.9210 9210 3,032 0.0042% 249 0.0018% - 0.0000% 0.0020%NSP Lands 0059 300033 F.03.16.200071.9210 9210 49 0.0001% - 0.0000% - 0.0000% 0.0000%Xcel Energy Transmission Holding Co 0075 300039 F.03.17.200071.9210 9210 242 0.0003% - 0.0000% - 0.0000% 0.0001%Xcel Energy Transmission Development Co 0076 300040 F.03.18.200071.9210 9210 94 0.0001% - 0.0000% - 0.0000% 0.0000%Xcel Energy Southwest Transmission Co 0077 300041 F.03.19.200071.9210 9210 151 0.0002% - 0.0000% - 0.0000% 0.0001%Energy Impact Fund Investments LLC 0086 302160 F.03.20.200071.9210 9210 44,127 0.0616% - 0.0000% - 0.0000% 0.0205%Nicollet Projects I LLC 0088 302162 F.03.21.200071.9210 9210 72,927 0.1019% 3,087 0.0220% - 0.0000% 0.0413%Capital Services, LLC 0089 302163 F.03.22.200071.9210 9210 214,824 0.3000% - 0.0000% - 0.0000% 0.1000%Xcel Energy Investments LLC 0092 302240 F.03.23.200071.9210 9210 472 0.0007% - 0.0000% - 0.0000% 0.0002%Total 71,597,748$ 100.0000% 14,022,485$ 100.0000% 7,839 100.0000% 100.0000%
Allocation Changes: Prepared By Reviewed By Approved By Eff. Date
Updated Statistics
Erika Moeller Audra Lake Ross Baumgarten 4/1/2020

Northern States Power Company
XES Allocation Statistics2021 Test Year Budget
200072 Docket No. E002/GR-20-723Exhibit___(RLB-1), Schedule 5
Page 10 of 117
Communications - Corporate GovernanceSAP ACC 200072 (180)SCB010
Legal Entity CompanyFinal Cost FERCLET
FERC Account
Total Assets $000's %
Total Revenues %
No. of Employee % Allocation %
NSPM 0010 300788 F.03.01.200072.9210 9210 22,468,670$ 31.3818% 5,240,697$ 37.3735% 3,820 48.7307% 39.1620%NSPW 0011 300791 F.03.02.200072.9210 9210 2,887,050 4.0323% 981,344 6.9984% 542 6.9141% 5.9816%PSCo 0012 300794 F.03.03.200072.9210 9210 19,541,229 27.2931% 4,614,346 32.9068% 2,315 29.5318% 29.9106%SPS 0013 300795 F.03.04.200072.9210 9210 7,982,885 11.1496% 1,826,207 13.0234% 1,148 14.6447% 12.9393%Eloigne 0015 300009 F.03.05.200072.9210 9210 127,927 0.1787% 9,991 0.0712% - 0.0000% 0.0833%Reddy Kilowatt 0017 300010 F.03.06.200072.9210 9210 2,901 0.0041% - 0.0000% - 0.0000% 0.0014%United Power & Land 0019 300012 F.03.07.200072.9210 9210 1,131 0.0016% 24 0.0002% - 0.0000% 0.0006%Xcel Energy 0023 300014 F.03.08.200072.9210 9210 18,048,786 25.2086% 1,341,300 9.5654% 14 0.1786% 11.6508%1480 Welton 0029 300020 F.03.09.200072.9210 9210 12,090 0.0169% 4,452 0.0317% - 0.0000% 0.0162%Xcel Energy WYCO Inc. 0038 300025 F.03.10.200072.9210 9210 177,375 0.2477% - 0.0000% - 0.0000% 0.0826%PSR Investments 0041 300026 F.03.11.200072.9210 9210 9,445 0.0132% - 0.0000% - 0.0000% 0.0044%WGI 0043 300027 F.03.12.200072.9210 9210 929 0.0013% 147 0.0010% - 0.0000% 0.0008%Xcel Energy Performance Contracting 0051 300029 F.03.13.200072.9210 9210 468 0.0007% - 0.0000% - 0.0000% 0.0002%Chippewa Flambeau 0057 300031 F.03.14.200072.9210 9210 944 0.0013% 641 0.0046% - 0.0000% 0.0020%Clearwater 0058 300032 F.03.15.200072.9210 9210 3,032 0.0042% 249 0.0018% - 0.0000% 0.0020%NSP Lands 0059 300033 F.03.16.200072.9210 9210 49 0.0001% - 0.0000% - 0.0000% 0.0000%Xcel Energy Transmission Holding Co 0075 300039 F.03.17.200072.9210 9210 242 0.0003% - 0.0000% - 0.0000% 0.0001%Xcel Energy Transmission Development Co 0076 300040 F.03.18.200072.9210 9210 94 0.0001% - 0.0000% - 0.0000% 0.0000%Xcel Energy Southwest Transmission Co 0077 300041 F.03.19.200072.9210 9210 151 0.0002% - 0.0000% - 0.0000% 0.0001%Energy Impact Fund Investments LLC 0086 302160 F.03.20.200072.9210 9210 44,127 0.0616% - 0.0000% - 0.0000% 0.0205%Nicollet Projects I LLC 0088 302162 F.03.21.200072.9210 9210 72,927 0.1019% 3,087 0.0220% - 0.0000% 0.0413%Capital Services, LLC 0089 302163 F.03.22.200072.9210 9210 214,824 0.3000% - 0.0000% - 0.0000% 0.1000%Xcel Energy Investments LLC 0092 302240 F.03.23.200072.9210 9210 472 0.0007% - 0.0000% - 0.0000% 0.0002%Total 71,597,748$ 100.0000% 14,022,485$ 100.0000% 7,839 100.0000% 100.0000%
Allocation Changes: Prepared By Reviewed By Approved By Eff. Date
Updated Statistics
Erika Moeller Audra Lake Ross Baumgarten 4/1/2020

Northern States Power Company
XES Allocation Statistics2021 Test Year Budget
200073 Docket No. E002/GR-20-723Exhibit___(RLB-1), Schedule 5
Page 11 of 117
Human Resources - Corporate GovernanceSAP ACC 200073 (189)SCB011
Legal Entity CompanyFinal Cost FERCLET
FERC Account
Total Assets $000's %
Total Revenues %
No. of Employee % Allocation %
NSPM 0010 300416 F.03.01.200073.9210 9210 22,468,670$ 31.3818% 5,240,697$ 37.3735% 3,820 48.7307% 39.1620%NSPW 0011 300419 F.03.02.200073.9210 9210 2,887,050 4.0323% 981,344 6.9984% 542 6.9141% 5.9816%PSCo 0012 300422 F.03.03.200073.9210 9210 19,541,229 27.2931% 4,614,346 32.9068% 2,315 29.5318% 29.9106%SPS 0013 300423 F.03.04.200073.9210 9210 7,982,885 11.1496% 1,826,207 13.0234% 1,148 14.6447% 12.9393%Eloigne 0015 300009 F.03.05.200073.9210 9210 127,927 0.1787% 9,991 0.0712% - 0.0000% 0.0833%Reddy Kilowatt 0017 300010 F.03.06.200073.9210 9210 2,901 0.0041% - 0.0000% - 0.0000% 0.0014%United Power & Land 0019 300012 F.03.07.200073.9210 9210 1,131 0.0016% 24 0.0002% - 0.0000% 0.0006%Xcel Energy 0023 300014 F.03.08.200073.9210 9210 18,048,786 25.2086% 1,341,300 9.5654% 14 0.1786% 11.6508%1480 Welton 0029 300020 F.03.09.200073.9210 9210 12,090 0.0169% 4,452 0.0317% - 0.0000% 0.0162%Xcel Energy WYCO Inc. 0038 300025 F.03.10.200073.9210 9210 177,375 0.2477% - 0.0000% - 0.0000% 0.0826%PSR Investments 0041 300026 F.03.11.200073.9210 9210 9,445 0.0132% - 0.0000% - 0.0000% 0.0044%WGI 0043 300027 F.03.12.200073.9210 9210 929 0.0013% 147 0.0010% - 0.0000% 0.0008%Xcel Energy Performance Contracting 0051 300029 F.03.13.200073.9210 9210 468 0.0007% - 0.0000% - 0.0000% 0.0002%Chippewa Flambeau 0057 300031 F.03.14.200073.9210 9210 944 0.0013% 641 0.0046% - 0.0000% 0.0020%Clearwater 0058 300032 F.03.15.200073.9210 9210 3,032 0.0042% 249 0.0018% - 0.0000% 0.0020%NSP Lands 0059 300033 F.03.16.200073.9210 9210 49 0.0001% - 0.0000% - 0.0000% 0.0000%Xcel Energy Transmission Holding Co 0075 300039 F.03.17.200073.9210 9210 242 0.0003% - 0.0000% - 0.0000% 0.0001%Xcel Energy Transmission Development Co 0076 300040 F.03.18.200073.9210 9210 94 0.0001% - 0.0000% - 0.0000% 0.0000%Xcel Energy Southwest Transmission Co 0077 300041 F.03.19.200073.9210 9210 151 0.0002% - 0.0000% - 0.0000% 0.0001%Energy Impact Fund Investments LLC 0086 302160 F.03.20.200073.9210 9210 44,127 0.0616% - 0.0000% - 0.0000% 0.0205%Nicollet Projects I LLC 0088 302162 F.03.21.200073.9210 9210 72,927 0.1019% 3,087 0.0220% - 0.0000% 0.0413%Capital Services, LLC 0089 302163 F.03.22.200073.9210 9210 214,824 0.3000% - 0.0000% - 0.0000% 0.1000%Xcel Energy Investments LLC 0092 302240 F.03.23.200073.9210 9210 472 0.0007% - 0.0000% - 0.0000% 0.0002%Total 71,597,748$ 100.0000% 14,022,485$ 100.0000% 7,839 100.0000% 100.0000%
Allocation Changes: Prepared By Reviewed By Approved By Eff. Date
Updated Statistics
Erika Moeller Audra Lake Ross Baumgarten 4/1/2020

Northern States Power Company
XES Allocation Statistics2021 Test Year Budget
200074 Docket No. E002/GR-20-723Exhibit___(RLB-1), Schedule 5
Page 12 of 117
Corporate Systems – Corporate GovernanceSAP ACC 200074 (563, 505, 529, 549, 551, 561)SCB012
Legal Entity CompanyFinal Cost FERCLET
FERC Account
Total Assets $000's %
Total Revenues %
No. of Employee %
Allocation %
NSPM 0010 301673 F.03.01.200074.9210 9210 22,468,670$ 31.3818% 5,240,697$ 37.3735% 3,820 48.7307% 39.1620%NSPW 0011 301674 F.03.02.200074.9210 9210 2,887,050 4.0323% 981,344 6.9984% 542 6.9141% 5.9816%PSCo 0012 301675 F.03.03.200074.9210 9210 19,541,229 27.2931% 4,614,346 32.9068% 2,315 29.5318% 29.9106%SPS 0013 301676 F.03.04.200074.9210 9210 7,982,885 11.1496% 1,826,207 13.0234% 1,148 14.6447% 12.9393%Eloigne 0015 300009 F.03.05.200074.9210 9210 127,927 0.1787% 9,991 0.0712% - 0.0000% 0.0833%Reddy Kilowatt 0017 300010 F.03.06.200074.9210 9210 2,901 0.0041% - 0.0000% - 0.0000% 0.0014%United Power & Land 0019 300012 F.03.07.200074.9210 9210 1,131 0.0016% 24 0.0002% - 0.0000% 0.0006%Xcel Energy 0023 300014 F.03.08.200074.9210 9210 18,048,786 25.2086% 1,341,300 9.5654% 14 0.1786% 11.6508%1480 Welton 0029 300020 F.03.09.200074.9210 9210 12,090 0.0169% 4,452 0.0317% - 0.0000% 0.0162%Xcel Energy WYCO Inc. 0038 300025 F.03.10.200074.9210 9210 177,375 0.2477% - 0.0000% - 0.0000% 0.0826%PSR Investment 0041 300026 F.03.11.200074.9210 9210 9,445 0.0132% - 0.0000% - 0.0000% 0.0044%WGI 0043 300027 F.03.12.200074.9210 9210 929 0.0013% 147 0.0010% - 0.0000% 0.0008%Xcel Energy Performance Contracting 0051 300029 F.03.13.200074.9210 9210 468 0.0007% - 0.0000% - 0.0000% 0.0002%Chippewa Flambeau 0057 300031 F.03.14.200074.9210 9210 944 0.0013% 641 0.0046% - 0.0000% 0.0020%Clearwater 0058 300032 F.03.15.200074.9210 9210 3,032 0.0042% 249 0.0018% - 0.0000% 0.0020%NSP Lands 0059 300033 F.03.16.200074.9210 9210 49 0.0001% - 0.0000% - 0.0000% 0.0000%Xcel Energy Transmission Holding Co 0075 300039 F.03.17.200074.9210 9210 242 0.0003% - 0.0000% - 0.0000% 0.0001%Xcel Energy Transmission Development Co 0076 300040 F.03.18.200074.9210 9210 94 0.0001% - 0.0000% - 0.0000% 0.0000%Xcel Energy Southwest Transmission Co 0077 300041 F.03.19.200074.9210 9210 151 0.0002% - 0.0000% - 0.0000% 0.0001%Energy Impact Fund Investments LLC 0086 302160 F.03.20.200074.9210 9210 44,127 0.0616% - 0.0000% - 0.0000% 0.0205%Nicollet Projects I LLC 0088 302162 F.03.21.200074.9210 9210 72,927 0.1019% 3,087 0.0220% - 0.0000% 0.0413%Capital Services, LLC 0089 302163 F.03.22.200074.9210 9210 214,824 0.3000% - 0.0000% - 0.0000% 0.1000%Xcel Energy Investments LLC 0092 302240 F.03.23.200074.9210 9210 472 0.0007% - 0.0000% - 0.0000% 0.0002%Total 71,597,748$ 100.0000% 14,022,485$ 100.0000% 7,839 100.0000% 100.0000%
Allocation Changes: Prepared By Reviewed By Approved By Eff. Date
Updated Statistics
Erika Moeller Audra Lake Ross Baumgarten 4/1/2020

Northern States Power Company
XES Allocation Statistics2021 Test Year Budget
200075 Docket No. E002/GR-20-723Exhibit___(RLB-1), Schedule 5
Page 13 of 117
Board of Directors - Corporate GovernanceSAP ACC 200075 (114)SCB013
Legal Entity CompanyFinal Cost FERCLET
FERC Account
Total Assets $000's %
Total Revenues %
No. of Employee % Allocation %
NSPM 0010 300500 F.03.01.200075.9302 9302 22,468,670$ 31.3818% 5,240,697$ 37.3735% 3,820 48.7307% 39.1620%NSPW 0011 300504 F.03.02.200075.9302 9302 2,887,050 4.0323% 981,344 6.9984% 542 6.9141% 5.9816%PSCo 0012 300509 F.03.03.200075.9302 9302 19,541,229 27.2931% 4,614,346 32.9068% 2,315 29.5318% 29.9106%SPS 0013 300511 F.03.04.200075.9302 9302 7,982,885 11.1496% 1,826,207 13.0234% 1,148 14.6447% 12.9393%Eloigne 0015 300009 F.03.05.200075.9302 9302 127,927 0.1787% 9,991 0.0712% - 0.0000% 0.0833%Reddy Kilowatt 0017 300010 F.03.06.200075.9302 9302 2,901 0.0041% - 0.0000% - 0.0000% 0.0014%United Power & Land 0019 300012 F.03.07.200075.9302 9302 1,131 0.0016% 24 0.0002% - 0.0000% 0.0006%Xcel Energy 0023 300014 F.03.08.200075.9302 9302 18,048,786 25.2086% 1,341,300 9.5654% 14 0.1786% 11.6508%1480 Welton 0029 300020 F.03.09.200075.9302 9302 12,090 0.0169% 4,452 0.0317% - 0.0000% 0.0162%Xcel Energy WYCO Inc. 0038 300025 F.03.10.200075.9302 9302 177,375 0.2477% - 0.0000% - 0.0000% 0.0826%PSR Investments 0041 300026 F.03.11.200075.9302 9302 9,445 0.0132% - 0.0000% - 0.0000% 0.0044%WGI 0043 300027 F.03.12.200075.9302 9302 929 0.0013% 147 0.0010% - 0.0000% 0.0008%Xcel Energy Performance Contracting 0051 300029 F.03.13.200075.9302 9302 468 0.0007% - 0.0000% - 0.0000% 0.0002%Chippewa Flambeau 0057 300031 F.03.14.200075.9302 9302 944 0.0013% 641 0.0046% - 0.0000% 0.0020%Clearwater 0058 300032 F.03.15.200075.9302 9302 3,032 0.0042% 249 0.0018% - 0.0000% 0.0020%NSP Lands 0059 300033 F.03.16.200075.9302 9302 49 0.0001% - 0.0000% - 0.0000% 0.0000%Xcel Energy Transmission Holding Co 0075 300039 F.03.17.200075.9302 9302 242 0.0003% - 0.0000% - 0.0000% 0.0001%Xcel Energy Transmission Development Co 0076 300040 F.03.18.200075.9302 9302 94 0.0001% - 0.0000% - 0.0000% 0.0000%Xcel Energy Southwest Transmission Co 0077 300041 F.03.19.200075.9302 9302 151 0.0002% - 0.0000% - 0.0000% 0.0001%Energy Impact Fund Investments LLC 0086 302160 F.03.20.200075.9302 9302 44,127 0.0616% - 0.0000% - 0.0000% 0.0205%Nicollet Projects I LLC 0088 302162 F.03.21.200075.9302 9302 72,927 0.1019% 3,087 0.0220% - 0.0000% 0.0413%Capital Services, LLC 0089 302163 F.03.22.200075.9302 9302 214,824 0.3000% - 0.0000% - 0.0000% 0.1000%Xcel Energy Investments LLC 0092 302240 F.03.23.200075.9302 9302 472 0.0007% - 0.0000% - 0.0000% 0.0002%Total 71,597,748$ 100.0000% 14,022,485$ 100.0000% 7,839 100.0000% 100.0000%
Allocation Changes: Prepared By Reviewed By Approved By Eff. Date
Updated Statistics
Erika Moeller Audra Lake Ross Baumgarten 4/1/2020

Northern States Power Company
XES Allocation Statistics2021 Test Year Budget
200076 Docket No. E002/GR-20-723Exhibit___(RLB-1), Schedule 5
Page 14 of 117
Xcel FoundationSAP ACC 200076 (182)SCB014
Legal Entity CompanyFinal Cost FERCLET
FERC Account
Total Assets $000's %
Total Revenues %
No. of Employee % Allocation %
NSPM 0010 301601 F.03.01.200076.9210 9210 22,468,670$ 31.5986% 5,240,697$ 37.4231% 3,820 48.7307% 39.2509%NSPW 0011 302044 F.03.02.200076.9210 9210 2,887,050 4.0602% 981,344 7.0077% 542 6.9141% 5.9940%PSCo 0012 301382 F.03.03.200076.9210 9210 19,541,229 27.4816% 4,614,346 32.9504% 2,315 29.5318% 29.9880%SPS 0013 301680 F.03.04.200076.9210 9210 7,982,885 11.2267% 1,826,207 13.0407% 1,148 14.6447% 12.9707%Xcel Energy 0023 300014 F.03.08.200076.9210 9210 18,048,786 25.3828% 1,341,300 9.5781% 14 0.1786% 11.7131%Xcel Energy WYCO Inc. 0038 300025 F.03.10.200076.9210 9210 177,375 0.2494% - 0.0000% - 0.0000% 0.0831%Xcel Energy Transmission Holding Co 0075 300039 F.03.17.200076.9210 9210 242 0.0003% - 0.0000% - 0.0000% 0.0001%Xcel Energy Transmission Development Co 0076 300040 F.03.18.200076.9210 9210 94 0.0001% - 0.0000% - 0.0000% 0.0000%Xcel Energy Southwest Transmission Co 0077 300041 F.03.19.200076.9210 9210 151 0.0002% - 0.0000% - 0.0000% 0.0001%Total 71,106,482$ 100.0000% 14,003,894$ 100.0000% 7,839 100.0000% 100.0000%
Allocation Changes: Prepared By Reviewed By Approved By Eff. Date
Updated Statistics
Erika Moeller Audra Lake Ross Baumgarten 4/1/2020

Northern States Power Company
XES Allocation Statistics2021 Test Year Budget
200077 Docket No. E002/GR-20-723Exhibit___(RLB-1), Schedule 5
Page 15 of 117
BrandingSAP ACC 200077 (184)SCB015
Legal Entity CompanyFinal Cost FERCLET
FERC Account
Total Assets $000's %
Total Revenues %
No. of Employee % Allocation %
NSPM 0010 300788 F.03.01.200077.9210 9210 22,468,670$ 31.5986% 5,240,697$ 37.4231% 3,820 48.7307% 39.2509%NSPW 0011 300791 F.03.02.200077.9210 9210 2,887,050 4.0602% 981,344 7.0077% 542 6.9141% 5.9940%PSCo 0012 300794 F.03.03.200077.9210 9210 19,541,229 27.4816% 4,614,346 32.9504% 2,315 29.5318% 29.9880%SPS 0013 300795 F.03.04.200077.9210 9210 7,982,885 11.2267% 1,826,207 13.0407% 1,148 14.6447% 12.9707%Xcel Energy 0023 300014 F.03.08.200077.9210 9210 18,048,786 25.3828% 1,341,300 9.5781% 14 0.1786% 11.7131%Xcel Energy WYCO Inc. 0038 300025 F.03.10.200077.9210 9210 177,375 0.2494% - 0.0000% - 0.0000% 0.0831%Xcel Energy Transmission Holding Co 0075 300039 F.03.17.200077.9210 9210 242 0.0003% - 0.0000% - 0.0000% 0.0001%Xcel Energy Transmission Development Co 0076 300040 F.03.18.200077.9210 9210 94 0.0001% - 0.0000% - 0.0000% 0.0000%Xcel Energy Southwest Transmission Co 0077 300041 F.03.19.200077.9210 9210 151 0.0002% - 0.0000% - 0.0000% 0.0001%Total 71,106,482$ 100.0000% 14,003,894$ 100.0000% 7,839 100.0000% 100.0000%
Allocation Changes: Prepared By Reviewed By Approved By Eff. Date
Updated Statistics
Erika Moeller Audra Lake Ross Baumgarten 4/1/2020

Northern States Power Company
XES Allocation Statistics2021 Test Year Budget
200078 Docket No. E002/GR-20-723Exhibit___(RLB-1), Schedule 5
Page 16 of 117
Governmental AffairsSAP ACC 200078 (410)SCB016
Legal Entity CompanyFinal Cost FERCLET
FERC Account
Total Assets $000's %
Total Revenues %
No. of Employee % Allocation %
NSPM 0010 300641 F.03.01.200078.9210 9210 22,468,670$ 31.6776% 5,240,697$ 37.4231% 3,820 48.7307% 39.2771%NSPW 0011 300681 F.03.02.200078.9210 9210 2,887,050 4.0703% 981,344 7.0077% 542 6.9141% 5.9974%PSCo 0012 300697 F.03.03.200078.9210 9210 19,541,229 27.5504% 4,614,346 32.9504% 2,315 29.5318% 30.0109%SPS 0013 300773 F.03.04.200078.9210 9210 7,982,885 11.2547% 1,826,207 13.0407% 1,148 14.6447% 12.9801%Xcel Energy 0023 300014 F.03.08.200078.9210 9210 18,048,786 25.4462% 1,341,300 9.5781% 14 0.1786% 11.7343%Xcel Energy Transmission Holding Co 0075 300039 F.03.17.200078.9210 9210 242 0.0003% - 0.0000% - 0.0000% 0.0001%Xcel Energy Transmission Development Co 0076 300040 F.03.18.200078.9210 9210 94 0.0001% - 0.0000% - 0.0000% 0.0000%Xcel Energy Southwest Transmission Co 0077 300041 F.03.19.200078.9210 9210 151 0.0002% - 0.0000% - 0.0000% 0.0001%Total 70,929,107$ 100.0000% 14,003,894$ 100.0000% 7,839 100.0000% 100.0000%
Allocation Changes: Prepared By Reviewed By Approved By Eff. Date
Updated Statistics
Erika Moeller Audra Lake Ross Baumgarten 4/1/2020

Northern States Power Company
XES Allocation Statistics2021 Test Year Budget
200079 Docket No. E002/GR-20-723Exhibit___(RLB-1), Schedule 5
Page 17 of 117
Federal LobbyingSAP ACC 200079 (409)SCB017
Legal Entity CompanyFinal Cost FERCLET
FERC Account
Total Assets $000's %
Total Revenues %
No. of Employee % Allocation %
NSPM 0010 302054 F.03.01.200079.4264 4264 22,468,670$ 31.6776% 5,240,697$ 37.4231% 3,820 48.7307% 39.2771%NSPW 0011 302055 F.03.02.200079.4264 4264 2,887,050 4.0703% 981,344 7.0077% 542 6.9141% 5.9974%PSCo 0012 300698 F.03.03.200079.4264 4264 19,541,229 27.5504% 4,614,346 32.9504% 2,315 29.5318% 30.0109%SPS 0013 300821 F.03.04.200079.4264 4264 7,982,885 11.2547% 1,826,207 13.0407% 1,148 14.6447% 12.9801%Xcel Energy 0023 300014 F.03.08.200079.4264 4264 18,048,786 25.4462% 1,341,300 9.5781% 14 0.1786% 11.7343%Xcel Energy Transmission Holding Co 0075 300039 F.03.17.200079.4264 4264 242 0.0003% - 0.0000% - 0.0000% 0.0001%Xcel Energy Transmission Development Co 0076 300040 F.03.18.200079.4264 4264 94 0.0001% - 0.0000% - 0.0000% 0.0000%Xcel Energy Southwest Transmission Co 0077 300041 F.03.19.200079.4264 4264 151 0.0002% - 0.0000% - 0.0000% 0.0001%Total 70,929,107$ 100.0000% 14,003,894$ 100.0000% 7,839 100.0000% 100.0000%
Allocation Changes: Prepared By Reviewed By Approved By Eff. Date
Updated Statistics
Erika Moeller Audra Lake Ross Baumgarten 4/1/2020

Northern States Power Company
XES Allocation Statistics2021 Test Year Budget
200080 Docket No. E002/GR-20-723Exhibit___(RLB-1), Schedule 5
Page 18 of 117
Capital Asset AccountingSAP ACC 200080 (135)SCB018
Legal Entity Company
Cost
Center FERCLETFERC
Account Total Assets
$000's %
Revenues
$000's %
Employee
s % Allocation %NSPM 0010 301683 F.03.01.200080.9210 9210 22,468,670$ 42.2315% 5,240,697$ 41.3374% 3,820 48.8179% 44.1288%NSPW 0011 301684 F.03.02.200080.9210 9210 2,887,050 5.4264% 981,344 7.7406% 542 6.9265% 6.6979%PSCo 0012 301685 F.03.03.200080.9210 9210 19,541,229 36.7291% 4,614,346 36.3969% 2,315 29.5847% 34.2369%SPS 0013 301476 F.03.04.200080.9210 9210 7,982,885 15.0044% 1,826,207 14.4047% 1,148 14.6709% 14.6933%Eloigne 0015 300009 F.03.05.200080.9210 9210 127,927 0.2404% 9,991 0.0788% - 0.0000% 0.1064%Reddy Kilowatt 0017 300010 F.03.06.200080.9210 9210 2,901 0.0055% - 0.0000% - 0.0000% 0.0018%United Power & Land 0019 300012 F.03.07.200080.9210 9210 1,131 0.0021% 24 0.0002% - 0.0000% 0.0008%1480 Welton 0029 300020 F.03.09.200080.9210 9210 12,090 0.0227% 4,452 0.0351% - 0.0000% 0.0193%Xcel Energy WYCO Inc. 0038 300025 F.03.10.200080.9210 9210 177,375 0.3334% - 0.0000% - 0.0000% 0.1111%WGI 0043 300027 F.03.12.200080.9210 9210 929 0.0017% 147 0.0012% - 0.0000% 0.0010%Chippewa Flambeau 0057 300031 F.03.14.200080.9210 9210 944 0.0018% 641 0.0051% - 0.0000% 0.0023%Xcel Energy Transmission Holding Co 0075 300039 F.03.17.200080.9210 9210 242 0.0005% - 0.0000% - 0.0000% 0.0002%Xcel Energy Transmission Development Co 0076 300040 F.03.18.200080.9210 9210 94 0.0002% - 0.0000% - 0.0000% 0.0001%Xcel Energy Southwest Transmission Co 0077 300041 F.03.19.200080.9210 9210 151 0.0003% - 0.0000% - 0.0000% 0.0001%Total 53,203,618$ 100.0000% 12,677,849$ 100.0000% 7,825 100.0000% 100.0000%
Allocation Changes: Prepared By Reviewed By Approved By Eff. Date
Updated Statistics
Erika Moeller Audra Lake Ross Baumgarten 4/1/2020

Northern States Power Company
XES Allocation Statistics2021 Test Year Budget
200081 Docket No. E002/GR-20-723Exhibit___(RLB-1), Schedule 5
Page 19 of 117
Accounting, Reporting & TaxesSAP ACC 200081 (120)SCB019
Legal Entity Company
Cost
Center FERCLETFERC
Account Total Assets
$000's %
Revenues
$000's %
Employee
s % Allocation %NSPM 0010 301683 F.03.01.200081.9210 9210 22,468,670$ 42.4693% 5,240,697$ 41.3722% 3,820 48.8179% 44.2197%NSPW 0011 301684 F.03.02.200081.9210 9210 2,887,050 5.4570% 981,344 7.7471% 542 6.9265% 6.7102%PSCo 0012 301685 F.03.03.200081.9210 9210 19,541,229 36.9360% 4,614,346 36.4275% 2,315 29.5847% 34.3161%SPS 0013 301476 F.03.04.200081.9210 9210 7,982,885 15.0889% 1,826,207 14.4168% 1,148 14.6709% 14.7255%Reddy Kilowatt 0017 300010 F.03.06.200081.9210 9210 2,901 0.0055% - 0.0000% - 0.0000% 0.0018%1480 Welton 0029 300020 F.03.09.200081.9210 9210 12,090 0.0229% 4,452 0.0351% - 0.0000% 0.0193%PSR Investments 0041 300026 F.03.11.200081.9210 9210 9,445 0.0179% - 0.0000% - 0.0000% 0.0060%WGI 0043 300027 F.03.12.200081.9210 9210 929 0.0018% 147 0.0012% - 0.0000% 0.0010%Xcel Energy Transmission Holding Co 0075 300039 F.03.17.200081.9210 9210 242 0.0005% - 0.0000% - 0.0000% 0.0002%Xcel Energy Transmission Development Co 0076 300040 F.03.18.200081.9210 9210 94 0.0002% - 0.0000% - 0.0000% 0.0001%Xcel Energy Southwest Transmission Co 0077 300041 F.03.19.200081.9210 9210 151 0.0003% - 0.0000% - 0.0000% 0.0001%Total 52,905,686$ 100.0000% 12,667,193$ 100.0000% 7,825 100.0000% 100.0000%
Allocation Changes: Prepared By Reviewed By Approved By Eff. Date
Updated Statistics
Erika Moeller Audra Lake Ross Baumgarten 4/1/2020

Northern States Power Company
XES Allocation Statistics2021 Test Year Budget
200082 Docket No. E002/GR-20-723Exhibit___(RLB-1), Schedule 5
Page 20 of 117
Audit ServicesSAP ACC 200082 (130)SCB020
Legal Entity CompanyFinal Cost FERCLET
FERC Account
Total Assets $000's %
Total Revenues %
No. of Employee % Allocation %
NSPM 0010 301425 F.03.01.200082.9210 9210 22,468,670$ 42.4693% 5,240,697$ 41.3722% 3,820 48.8179% 44.2197%NSPW 0011 301426 F.03.02.200082.9210 9210 2,887,050 5.4570% 981,344 7.7471% 542 6.9265% 6.7102%PSCo 0012 301427 F.03.03.200082.9210 9210 19,541,229 36.9360% 4,614,346 36.4275% 2,315 29.5847% 34.3161%SPS 0013 301428 F.03.04.200082.9210 9210 7,982,885 15.0889% 1,826,207 14.4168% 1,148 14.6709% 14.7255%Reddy Kilowatt 0017 300010 F.03.06.200082.9210 9210 2,901 0.0055% - 0.0000% - 0.0000% 0.0018%1480 Welton 0029 300020 F.03.09.200082.9210 9210 12,090 0.0229% 4,452 0.0351% - 0.0000% 0.0193%PSR Investments 0041 300026 F.03.11.200082.9210 9210 9,445 0.0179% - 0.0000% - 0.0000% 0.0060%WGI 0043 300027 F.03.12.200082.9210 9210 929 0.0018% 147 0.0012% - 0.0000% 0.0010%Xcel Energy Transmission Holding Co 0075 300039 F.03.17.200082.9210 9210 242 0.0005% - 0.0000% - 0.0000% 0.0002%Xcel Energy Transmission Development Co 0076 300040 F.03.18.200082.9210 9210 94 0.0002% - 0.0000% - 0.0000% 0.0001%Xcel Energy Southwest Transmission Co 0077 300041 F.03.19.200082.9210 9210 151 0.0003% - 0.0000% - 0.0000% 0.0001%Total 52,905,686$ 100.0000% 12,667,193$ 100.0000% 7,825 100.0000% 100.0000%
Allocation Changes: Prepared By Reviewed By Approved By Eff. Date
Updated Statistics
Erika Moeller Audra Lake Ross Baumgarten 4/1/2020

Northern States Power Company
XES Allocation Statistics2021 Test Year Budget
200083 Docket No. E002/GR-20-723Exhibit___(RLB-1), Schedule 5
Page 21 of 117
Corporate Finance, Treasury & Cash ManagementSAP ACC 200083 (140)SCB021
Legal Entity CompanyFinal Cost FERCLET
FERC Account
Total Assets $000's %
Total Revenues %
No. of Employee % Allocation %
NSPM 0010 301441 F.03.01.200083.9210 9210 22,468,670$ 42.4693% 5,240,697$ 41.3722% 3,820 48.8179% 44.2197%NSPW 0011 301442 F.03.02.200083.9210 9210 2,887,050 5.4570% 981,344 7.7471% 542 6.9265% 6.7102%PSCo 0012 301443 F.03.03.200083.9210 9210 19,541,229 36.9360% 4,614,346 36.4275% 2,315 29.5847% 34.3161%SPS 0013 301444 F.03.04.200083.9210 9210 7,982,885 15.0889% 1,826,207 14.4168% 1,148 14.6709% 14.7255%Reddy Kilowatt 0017 300010 F.03.06.200083.9210 9210 2,901 0.0055% - 0.0000% - 0.0000% 0.0018%1480 Welton 0029 300020 F.03.09.200083.9210 9210 12,090 0.0229% 4,452 0.0351% - 0.0000% 0.0193%PSR Investments 0041 300026 F.03.11.200083.9210 9210 9,445 0.0179% - 0.0000% - 0.0000% 0.0060%WGI 0043 300027 F.03.12.200083.9210 9210 929 0.0018% 147 0.0012% - 0.0000% 0.0010%Xcel Energy Transmission Holding Co 0075 300039 F.03.17.200083.9210 9210 242 0.0005% - 0.0000% - 0.0000% 0.0002%Xcel Energy Transmission Development Co 0076 300040 F.03.18.200083.9210 9210 94 0.0002% - 0.0000% - 0.0000% 0.0001%Xcel Energy Southwest Transmission Co 0077 300041 F.03.19.200083.9210 9210 151 0.0003% - 0.0000% - 0.0000% 0.0001%Total 52,905,686$ 100.0000% 12,667,193$ 100.0000% 7,825 100.0000% 100.0000%
Allocation Changes: Prepared By Reviewed By Approved By Eff. Date
Updated Statistics
Erika Moeller Audra Lake Ross Baumgarten 4/1/2020

Northern States Power Company
XES Allocation Statistics2021 Test Year Budget
200084 Docket No. E002/GR-20-723Exhibit___(RLB-1), Schedule 5
Page 22 of 117
Risk ManagementSAP ACC 200084 (142)SCB022
Legal Entity CompanyFinal Cost FERCLET
FERC Account
Total Assets $000's %
Total Revenues %
No. of Employee % Allocation %
NSPM 0010 301477 F.03.01.200084.9210 9210 22,468,670$ 42.4693% 5,240,697$ 41.3722% 3,820 48.8179% 44.2197%NSPW 0011 301478 F.03.02.200084.9210 9210 2,887,050 5.4570% 981,344 7.7471% 542 6.9265% 6.7102%PSCo 0012 301479 F.03.03.200084.9210 9210 19,541,229 36.9360% 4,614,346 36.4275% 2,315 29.5847% 34.3161%SPS 0013 301480 F.03.04.200084.9210 9210 7,982,885 15.0889% 1,826,207 14.4168% 1,148 14.6709% 14.7255%Reddy Kilowatt 0017 300010 F.03.06.200084.9210 9210 2,901 0.0055% - 0.0000% - 0.0000% 0.0018%1480 Welton 0029 300020 F.03.09.200084.9210 9210 12,090 0.0229% 4,452 0.0351% - 0.0000% 0.0193%PSR Investments 0041 300026 F.03.11.200084.9210 9210 9,445 0.0179% - 0.0000% - 0.0000% 0.0060%WGI 0043 300027 F.03.12.200084.9210 9210 929 0.0018% 147 0.0012% - 0.0000% 0.0010%Xcel Energy Transmission Holding Co 0075 300039 F.03.17.200084.9210 9210 242 0.0005% - 0.0000% - 0.0000% 0.0002%Xcel Energy Transmission Development Co 0076 300040 F.03.18.200084.9210 9210 94 0.0002% - 0.0000% - 0.0000% 0.0001%Xcel Energy Southwest Transmission Co 0077 300041 F.03.19.200084.9210 9210 151 0.0003% - 0.0000% - 0.0000% 0.0001%Total 52,905,686$ 100.0000% 12,667,193$ 100.0000% 7,825 100.0000% 100.0000%
Allocation Changes: Prepared By Reviewed By Approved By Eff. Date
Updated Statistics
Erika Moeller Audra Lake Ross Baumgarten 4/1/2020

Northern States Power Company
XES Allocation Statistics2021 Test Year Budget
200086 Docket No. E002/GR-20-723Exhibit___(RLB-1), Schedule 5
Page 23 of 117
Legal & Claims ServicesSAP ACC 200086 (170)SCB024
Legal Entity CompanyFinal Cost FERCLET
FERC Account
Total Assets $000's %
Total Revenues %
No. of Employee % Allocation %
NSPM 0010 301563 F.03.01.200086.9210 9210 22,468,670$ 42.4693% 5,240,697$ 41.3722% 3,820 48.8179% 44.2197%NSPW 0011 302044 F.03.02.200086.9210 9210 2,887,050 5.4570% 981,344 7.7471% 542 6.9265% 6.7102%PSCo 0012 300388 F.03.03.200086.9210 9210 19,541,229 36.9360% 4,614,346 36.4275% 2,315 29.5847% 34.3161%SPS 0013 300390 F.03.04.200086.9210 9210 7,982,885 15.0889% 1,826,207 14.4168% 1,148 14.6709% 14.7255%Reddy Kilowatt 0017 300010 F.03.06.200086.9210 9210 2,901 0.0055% - 0.0000% - 0.0000% 0.0018%1480 Welton 0029 300020 F.03.09.200086.9210 9210 12,090 0.0229% 4,452 0.0351% - 0.0000% 0.0193%PSR Investments 0041 300026 F.03.11.200086.9210 9210 9,445 0.0179% - 0.0000% - 0.0000% 0.0060%WGI 0043 300027 F.03.12.200086.9210 9210 929 0.0018% 147 0.0012% - 0.0000% 0.0010%Xcel Energy Transmission Holding Co 0075 300039 F.03.17.200086.9210 9210 242 0.0005% - 0.0000% - 0.0000% 0.0002%Xcel Energy Transmission Development Co 0076 300040 F.03.18.200086.9210 9210 94 0.0002% - 0.0000% - 0.0000% 0.0001%Xcel Energy Southwest Transmission Co 0077 300041 F.03.19.200086.9210 9210 151 0.0003% - 0.0000% - 0.0000% 0.0001%Total 52,905,686$ 100.0000% 12,667,193$ 100.0000% 7,825 100.0000% 100.0000%
Allocation Changes: Prepared By Reviewed By Approved By Eff. Date
Updated Statistics
Erika Moeller Audra Lake Ross Baumgarten 4/1/2020

Northern States Power Company
XES Allocation Statistics2021 Test Year Budget
200087 Docket No. E002/GR-20-723Exhibit___(RLB-1), Schedule 5
Page 24 of 117
Accounting, Reporting & Tax - RegulatedSAP ACC 200087 (123)SCB025
Legal Entity CompanyFinal Cost FERCLET
FERC Account
Total Assets $000's %
Total Revenues %
No. of Employee % Allocation %
NSPM 0010 301683 F.03.01.200087.9210 9210 22,468,670$ 42.4897% 5,240,697$ 41.3872% 3,820 48.8179% 44.2315%NSPW 0011 301684 F.03.02.200087.9210 9210 2,887,050 5.4596% 981,344 7.7499% 542 6.9265% 6.7120%PSCo 0012 301685 F.03.03.200087.9210 9210 19,541,229 36.9537% 4,614,346 36.4408% 2,315 29.5847% 34.3264%SPS 0013 301476 F.03.04.200087.9210 9210 7,982,885 15.0961% 1,826,207 14.4221% 1,148 14.6709% 14.7297%Xcel Energy Transmission Holding Co 0075 300039 F.03.17.200087.9210 9210 242 0.0005% - 0.0000% - 0.0000% 0.0002%Xcel Energy Transmission Development Co 0076 300040 F.03.18.200087.9210 9210 94 0.0002% - 0.0000% - 0.0000% 0.0001%Xcel Energy Southwest Transmission Co 0077 300041 F.03.19.200087.9210 9210 151 0.0003% - 0.0000% - 0.0000% 0.0001%Total 52,880,321$ 100.0000% 12,662,594$ 100.0000% 7,825 100.0000% 100.0000%
Allocation Changes: Prepared By Reviewed By Approved By Eff. Date
Updated Statistics
Erika Moeller Audra Lake Ross Baumgarten 4/1/2020

Northern States Power Company
XES Allocation Statistics2021 Test Year Budget
200088 Docket No. E002/GR-20-723Exhibit___(RLB-1), Schedule 5
Page 25 of 117
Accounting, Reporting, Tax & Audit Services - Regulated ElectricSAP ACC 200088 (127, 133)SCB026
Legal Entity CompanyFinal Cost FERCLET
FERC Account
Total Assets $000's %
Total Revenues %
No. of Employee % Allocation %
NSPM 0010 300498 F.03.01.200088.9210 9210 22,468,670$ 42.4897% 5,240,697$ 41.3872% 3,820 48.8179% 44.2315%NSPW 0011 300502 F.03.02.200088.9210 9210 2,887,050 5.4596% 981,344 7.7499% 542 6.9265% 6.7120%PSCo 0012 300506 F.03.03.200088.9210 9210 19,541,229 36.9537% 4,614,346 36.4408% 2,315 29.5847% 34.3264%SPS 0013 300511 F.03.04.200088.9210 9210 7,982,885 15.0961% 1,826,207 14.4221% 1,148 14.6709% 14.7297%Xcel Energy Transmission Holding Co 0075 300039 F.03.17.200088.9210 9210 242 0.0005% - 0.0000% - 0.0000% 0.0002%Xcel Energy Transmission Development Co 0076 300040 F.03.18.200088.9210 9210 94 0.0002% - 0.0000% - 0.0000% 0.0001%Xcel Energy Southwest Transmission Co 0077 300041 F.03.19.200088.9210 9210 151 0.0003% - 0.0000% - 0.0000% 0.0001%Total 52,880,321$ 100.0000% 12,662,594$ 100.0000% 7,825 100.0000% 100.0000%
Allocation Changes: Prepared By Reviewed By Approved By Eff. Date
Updated Statistics
Erika Moeller Audra Lake Ross Baumgarten 4/1/2020

Northern States Power Company
XES Allocation Statistics2021 Test Year Budget
200089 Docket No. E002/GR-20-723Exhibit___(RLB-1), Schedule 5
Page 26 of 117
Audit Services - OpCo's & TransCo’sSAP ACC 200089 (132)SCB027
Legal Entity CompanyFinal Cost FERCLET
FERC Account
Total Assets $000's %
Total Revenues %
No. of Employee % Allocation %
NSPM 0010 301425 F.03.01.200089.9210 9210 22,468,670$ 42.4897% 5,240,697$ 41.3872% 3,820 48.8179% 44.2315%NSPW 0011 301426 F.03.02.200089.9210 9210 2,887,050 5.4596% 981,344 7.7499% 542 6.9265% 6.7120%PSCo 0012 301427 F.03.03.200089.9210 9210 19,541,229 36.9537% 4,614,346 36.4408% 2,315 29.5847% 34.3264%SPS 0013 301428 F.03.04.200089.9210 9210 7,982,885 15.0961% 1,826,207 14.4221% 1,148 14.6709% 14.7297%Xcel Energy Transmission Holding Co 0075 300039 F.03.17.200089.9210 9210 242 0.0005% - 0.0000% - 0.0000% 0.0002%Xcel Energy Transmission Development Co 0076 300040 F.03.18.200089.9210 9210 94 0.0002% - 0.0000% - 0.0000% 0.0001%Xcel Energy Southwest Transmission Co 0077 300041 F.03.19.200089.9210 9210 151 0.0003% - 0.0000% - 0.0000% 0.0001%Total 52,880,321$ 100.0000% 12,662,594$ 100.0000% 7,825 100.0000% 100.0000%
Allocation Changes: Prepared By Reviewed By Approved By Eff. Date
Updated Statistics
Erika Moeller Audra Lake Ross Baumgarten 4/1/2020

Northern States Power Company
XES Allocation Statistics2021 Test Year Budget
200090 Docket No. E002/GR-20-723Exhibit___(RLB-1), Schedule 5
Page 27 of 117
Risk Management - OpCo's & TransCo’sSAP ACC 200090 (146)SCB028
Legal Entity CompanyFinal Cost FERCLET
FERC Account
Total Assets $000's %
Total Revenues %
No. of Employee % Allocation %
NSPM 0010 301477 F.03.01.200090.9210 9210 22,468,670$ 42.4897% 5,240,697$ 41.3872% 3,820 48.8179% 44.2315%NSPW 0011 301478 F.03.02.200090.9210 9210 2,887,050 5.4596% 981,344 7.7499% 542 6.9265% 6.7120%PSCo 0012 301479 F.03.03.200090.9210 9210 19,541,229 36.9537% 4,614,346 36.4408% 2,315 29.5847% 34.3264%SPS 0013 301480 F.03.04.200090.9210 9210 7,982,885 15.0961% 1,826,207 14.4221% 1,148 14.6709% 14.7297%Xcel Energy Transmission Holding Co 0075 300039 F.03.17.200090.9210 9210 242 0.0005% - 0.0000% - 0.0000% 0.0002%Xcel Energy Transmission Development Co 0076 300040 F.03.18.200090.9210 9210 94 0.0002% - 0.0000% - 0.0000% 0.0001%Xcel Energy Southwest Transmission Co 0077 300041 F.03.19.200090.9210 9210 151 0.0003% - 0.0000% - 0.0000% 0.0001%Total 52,880,321$ 100.0000% 12,662,594$ 100.0000% 7,825 100.0000% 100.0000%
Allocation Changes: Prepared By Reviewed By Approved By Eff. Date
Updated Statistics
Erika Moeller Audra Lake Ross Baumgarten 4/1/2020

Northern States Power Company
XES Allocation Statistics2021 Test Year Budget
200091 Docket No. E002/GR-20-723Exhibit___(RLB-1), Schedule 5
Page 28 of 117
Captive InsuranceSAP ACC 200091 (147)SCB029
Legal Entity CompanyFinal Cost FERCLET
FERC Account
Total Assets $000's %
Total Revenues %
No. of Employee % Allocation %
NSPM 0010 301477 F.03.01.200091.9210 9210 22,468,670$ 42.4897% 5,240,697$ 41.3872% 3,820 48.8179% 44.2315%NSPW 0011 301478 F.03.02.200091.9210 9210 2,887,050 5.4596% 981,344 7.7499% 542 6.9265% 6.7120%PSCo 0012 301479 F.03.03.200091.9210 9210 19,541,229 36.9537% 4,614,346 36.4408% 2,315 29.5847% 34.3264%SPS 0013 301480 F.03.04.200091.9210 9210 7,982,885 15.0961% 1,826,207 14.4221% 1,148 14.6709% 14.7297%Xcel Energy Transmission Holding Co 0075 300039 F.03.17.200091.9210 9210 242 0.0005% - 0.0000% - 0.0000% 0.0002%Xcel Energy Transmission Development Co 0076 300040 F.03.18.200091.9210 9210 94 0.0002% - 0.0000% - 0.0000% 0.0001%Xcel Energy Southwest Transmission Co 0077 300041 F.03.19.200091.9210 9210 151 0.0003% - 0.0000% - 0.0000% 0.0001%Total 52,880,321$ 100.0000% 12,662,594$ 100.0000% 7,825 100.0000% 100.0000%
Allocation Changes: Prepared By Reviewed By Approved By Eff. Date
Updated Statistics
Erika Moeller Audra Lake Ross Baumgarten 4/1/2020

Northern States Power Company
XES Allocation Statistics2021 Test Year Budget
200092 Docket No. E002/GR-20-723Exhibit___(RLB-1), Schedule 5
Page 29 of 117
Corporate Strategy & Business Development SAP ACC 200092 (162)SCB030
Legal Entity CompanyFinal Cost FERCLET
FERC Account
Total Assets $000's %
Total Revenues %
No. of Employee %
Allocation %
NSPM 0010 301585 F.03.01.200092.9210 9210 22,468,670$ 42.4897% 5,240,697$ 41.3872% 3,820 48.8179% 44.2315%NSPW 0011 301586 F.03.02.200092.9210 9210 2,887,050 5.4596% 981,344 7.7499% 542 6.9265% 6.7120%PSCo 0012 301589 F.03.03.200092.9210 9210 19,541,229 36.9537% 4,614,346 36.4408% 2,315 29.5847% 34.3264%SPS 0013 301590 F.03.04.200092.9210 9210 7,982,885 15.0961% 1,826,207 14.4221% 1,148 14.6709% 14.7297%Xcel Energy Transmission Holding Co 0075 300039 F.03.17.200092.9210 9210 242 0.0005% - 0.0000% - 0.0000% 0.0002%Xcel Energy Transmission Development Co 0076 300040 F.03.18.200092.9210 9210 94 0.0002% - 0.0000% - 0.0000% 0.0001%Xcel Energy Southwest Transmission Co 0077 300041 F.03.19.200092.9210 9210 151 0.0003% - 0.0000% - 0.0000% 0.0001%Total 52,880,321$ 100.0000% 12,662,594$ 100.0000% 7,825 100.0000% 100.0000%
Allocation Changes: Prepared By Reviewed By Approved By Eff. Date
Updated Statistics
Erika Moeller Audra Lake Ross Baumgarten 4/1/2020

Northern States Power Company
XES Allocation Statistics2021 Test Year Budget
200093 Docket No. E002/GR-20-723Exhibit___(RLB-1), Schedule 5
Page 30 of 117
Legal - OpCo's & TransCo’sSAP ACC 200093 (174)SCB031
Legal Entity CompanyFinal Cost FERCLET
FERC Account
Total Assets $000's %
Total Revenues %
No. of Employee % Allocation %
NSPM 0010 301563 F.03.01.200093.9210 9210 22,468,670$ 42.4897% 5,240,697$ 41.3872% 3,820 48.8179% 44.2315%NSPW 0011 302044 F.03.02.200093.9210 9210 2,887,050 5.4596% 981,344 7.7499% 542 6.9265% 6.7120%PSCo 0012 300388 F.03.03.200093.9210 9210 19,541,229 36.9537% 4,614,346 36.4408% 2,315 29.5847% 34.3264%SPS 0013 300390 F.03.04.200093.9210 9210 7,982,885 15.0961% 1,826,207 14.4221% 1,148 14.6709% 14.7297%Xcel Energy Transmission Holding Co 0075 300039 F.03.17.200093.9210 9210 242 0.0005% - 0.0000% - 0.0000% 0.0002%Xcel Energy Transmission Development Co 0076 300040 F.03.18.200093.9210 9210 94 0.0002% - 0.0000% - 0.0000% 0.0001%Xcel Energy Southwest Transmission Co 0077 300041 F.03.19.200093.9210 9210 151 0.0003% - 0.0000% - 0.0000% 0.0001%Total 52,880,321$ 100.0000% 12,662,594$ 100.0000% 7,825 100.0000% 100.0000%
Allocation Changes: Prepared By Reviewed By Approved By Eff. Date
Updated Statistics
Erika Moeller Audra Lake Ross Baumgarten 4/1/2020

Northern States Power Company
XES Allocation Statistics2021 Test Year Budget
200094 Docket No. E002/GR-20-723Exhibit___(RLB-1), Schedule 5
Page 31 of 117
Supply ChainSAP ACC 200094 (416)SCB032
Legal Entity CompanyFinal Cost FERCLET
FERC Account
Total Assets $000's %
Total Revenues %
No. of Employee % Allocation %
NSPM 0010 300709 F.03.01.200094.9210 9210 22,468,670$ 42.4897% 5,240,697$ 41.3872% 3,820 48.8179% 44.2315%NSPW 0011 300712 F.03.02.200094.9210 9210 2,887,050 5.4596% 981,344 7.7499% 542 6.9265% 6.7120%PSCo 0012 300715 F.03.03.200094.9210 9210 19,541,229 36.9537% 4,614,346 36.4408% 2,315 29.5847% 34.3264%SPS 0013 300716 F.03.04.200094.9210 9210 7,982,885 15.0961% 1,826,207 14.4221% 1,148 14.6709% 14.7297%Xcel Energy Transmission Holding Co 0075 300039 F.03.17.200094.9210 9210 242 0.0005% - 0.0000% - 0.0000% 0.0002%Xcel Energy Transmission Development Co 0076 300040 F.03.18.200094.9210 9210 94 0.0002% - 0.0000% - 0.0000% 0.0001%Xcel Energy Southwest Transmission Co 0077 300041 F.03.19.200094.9210 9210 151 0.0003% - 0.0000% - 0.0000% 0.0001%Total 52,880,321$ 100.0000% 12,662,594$ 100.0000% 7,825 100.0000% 100.0000%
Allocation Changes: Prepared By Reviewed By Approved By Eff. Date
Updated Statistics
Erika Moeller Audra Lake Ross Baumgarten 4/1/2020
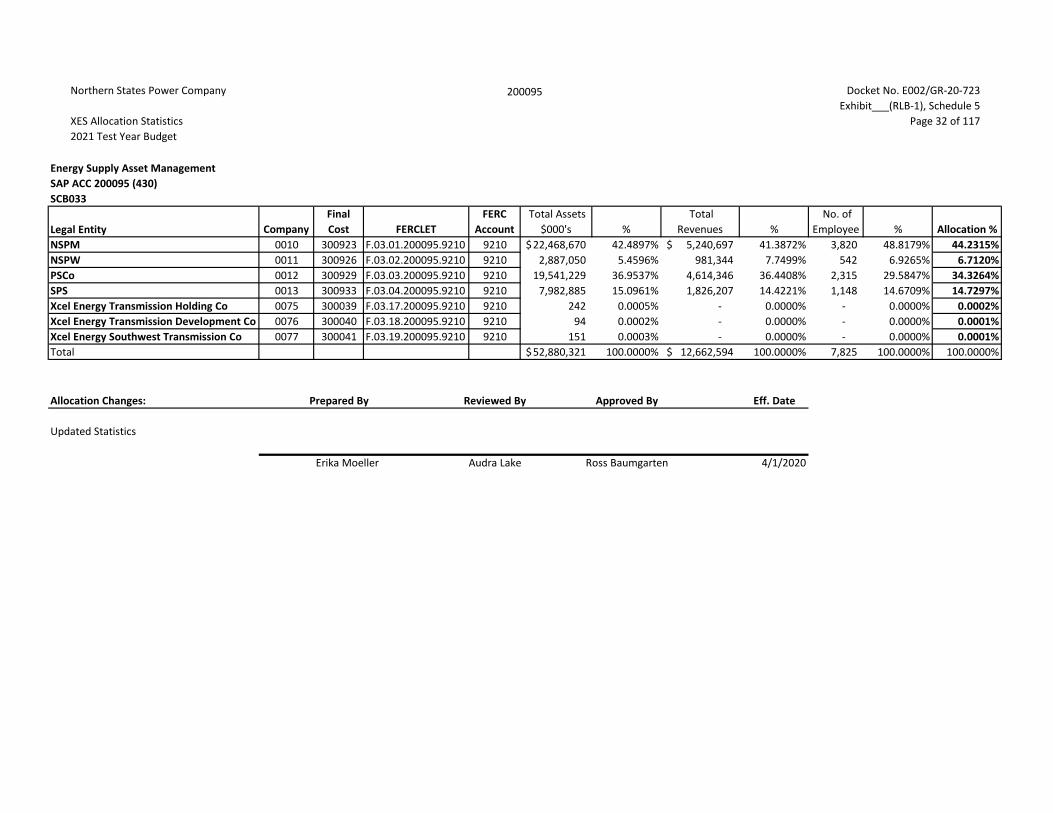
Northern States Power Company
XES Allocation Statistics2021 Test Year Budget
200095 Docket No. E002/GR-20-723Exhibit___(RLB-1), Schedule 5
Page 32 of 117
Energy Supply Asset ManagementSAP ACC 200095 (430)SCB033
Legal Entity CompanyFinal Cost FERCLET
FERC Account
Total Assets $000's %
Total Revenues %
No. of Employee % Allocation %
NSPM 0010 300923 F.03.01.200095.9210 9210 22,468,670$ 42.4897% 5,240,697$ 41.3872% 3,820 48.8179% 44.2315%NSPW 0011 300926 F.03.02.200095.9210 9210 2,887,050 5.4596% 981,344 7.7499% 542 6.9265% 6.7120%PSCo 0012 300929 F.03.03.200095.9210 9210 19,541,229 36.9537% 4,614,346 36.4408% 2,315 29.5847% 34.3264%SPS 0013 300933 F.03.04.200095.9210 9210 7,982,885 15.0961% 1,826,207 14.4221% 1,148 14.6709% 14.7297%Xcel Energy Transmission Holding Co 0075 300039 F.03.17.200095.9210 9210 242 0.0005% - 0.0000% - 0.0000% 0.0002%Xcel Energy Transmission Development Co 0076 300040 F.03.18.200095.9210 9210 94 0.0002% - 0.0000% - 0.0000% 0.0001%Xcel Energy Southwest Transmission Co 0077 300041 F.03.19.200095.9210 9210 151 0.0003% - 0.0000% - 0.0000% 0.0001%Total 52,880,321$ 100.0000% 12,662,594$ 100.0000% 7,825 100.0000% 100.0000%
Allocation Changes: Prepared By Reviewed By Approved By Eff. Date
Updated Statistics
Erika Moeller Audra Lake Ross Baumgarten 4/1/2020

Northern States Power Company
XES Allocation Statistics2021 Test Year Budget
200096 Docket No. E002/GR-20-723Exhibit___(RLB-1), Schedule 5
Page 33 of 117
Energy Markets - Business ServicesSAP ACC 200096 (431)SCB034
Legal Entity CompanyFinal Cost FERCLET
FERC Account
Total Assets $000's %
Total Revenues %
No. of Employee % Allocation %
NSPM 0010 301667 F.03.01.200096.9210 9210 22,468,670$ 42.4897% 5,240,697$ 41.3872% 3,820 48.8179% 44.2315%NSPW 0011 301527 F.03.02.200096.9210 9210 2,887,050 5.4596% 981,344 7.7499% 542 6.9265% 6.7120%PSCo 0012 301463 F.03.03.200096.9210 9210 19,541,229 36.9537% 4,614,346 36.4408% 2,315 29.5847% 34.3264%SPS 0013 301464 F.03.04.200096.9210 9210 7,982,885 15.0961% 1,826,207 14.4221% 1,148 14.6709% 14.7297%Xcel Energy Transmission Holding Co 0075 300039 F.03.17.200096.9210 9210 242 0.0005% - 0.0000% - 0.0000% 0.0002%Xcel Energy Transmission Development Co 0076 300040 F.03.18.200096.9210 9210 94 0.0002% - 0.0000% - 0.0000% 0.0001%Xcel Energy Southwest Transmission Co 0077 300041 F.03.19.200096.9210 9210 151 0.0003% - 0.0000% - 0.0000% 0.0001%Total 52,880,321$ 100.0000% 12,662,594$ 100.0000% 7,825 100.0000% 100.0000%
Allocation Changes: Prepared By Reviewed By Approved By Eff. Date
Updated Statistics
Erika Moeller Audra Lake Ross Baumgarten 4/1/2020

Northern States Power Company
XES Allocation Statistics2021 Test Year Budget
200097 Docket No. E002/GR-20-723Exhibit___(RLB-1), Schedule 5
Page 34 of 117
Accounting and Finance Software Applications MaintenanceSAP ACC 200097 (533, 535, 539, 542)SCB035
Legal Entity CompanyFinal Cost FERCLET
FERC Account
Total Assets $000's %
Total Revenues %
No. of Employee % Allocation %
NSPM 0010 301673 F.03.01.200097.9210 9210 22,468,670$ 42.4897% 5,240,697$ 41.3872% 3,820 48.8179% 44.2315%NSPW 0011 301674 F.03.02.200097.9210 9210 2,887,050 5.4596% 981,344 7.7499% 542 6.9265% 6.7120%PSCo 0012 301675 F.03.03.200097.9210 9210 19,541,229 36.9537% 4,614,346 36.4408% 2,315 29.5847% 34.3264%SPS 0013 301676 F.03.04.200097.9210 9210 7,982,885 15.0961% 1,826,207 14.4221% 1,148 14.6709% 14.7297%Xcel Energy Transmission Holding Co 0075 300039 F.03.17.200097.9210 9210 242 0.0005% - 0.0000% - 0.0000% 0.0002%Xcel Energy Transmission Development Co 0076 300040 F.03.18.200097.9210 9210 94 0.0002% - 0.0000% - 0.0000% 0.0001%Xcel Energy Southwest Transmission Co 0077 300041 F.03.19.200097.9210 9210 151 0.0003% - 0.0000% - 0.0000% 0.0001%Total 52,880,321$ 100.0000% 12,662,594$ 100.0000% 7,825 100.0000% 100.0000%
Allocation Changes: Prepared By Reviewed By Approved By Eff. Date
Updated Statistics
Erika Moeller Audra Lake Ross Baumgarten 4/1/2020
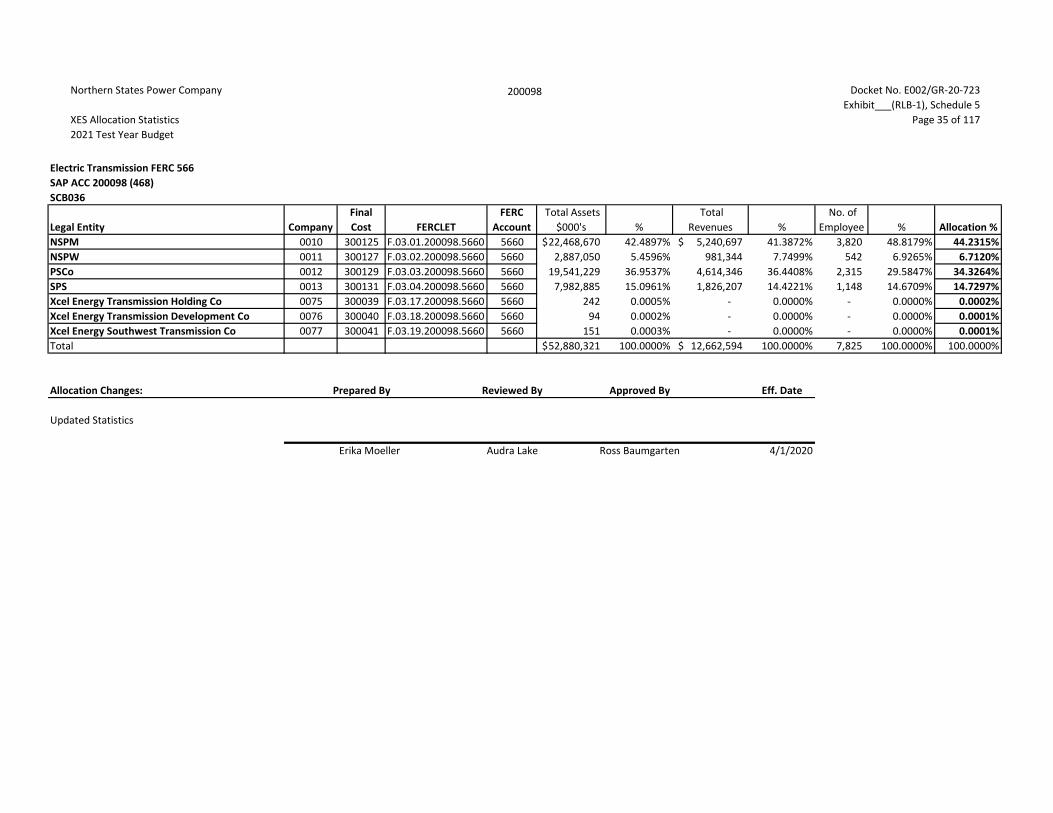
Northern States Power Company
XES Allocation Statistics2021 Test Year Budget
200098 Docket No. E002/GR-20-723Exhibit___(RLB-1), Schedule 5
Page 35 of 117
Electric Transmission FERC 566SAP ACC 200098 (468)SCB036
Legal Entity CompanyFinal Cost FERCLET
FERC Account
Total Assets $000's %
Total Revenues %
No. of Employee % Allocation %
NSPM 0010 300125 F.03.01.200098.5660 5660 22,468,670$ 42.4897% 5,240,697$ 41.3872% 3,820 48.8179% 44.2315%NSPW 0011 300127 F.03.02.200098.5660 5660 2,887,050 5.4596% 981,344 7.7499% 542 6.9265% 6.7120%PSCo 0012 300129 F.03.03.200098.5660 5660 19,541,229 36.9537% 4,614,346 36.4408% 2,315 29.5847% 34.3264%SPS 0013 300131 F.03.04.200098.5660 5660 7,982,885 15.0961% 1,826,207 14.4221% 1,148 14.6709% 14.7297%Xcel Energy Transmission Holding Co 0075 300039 F.03.17.200098.5660 5660 242 0.0005% - 0.0000% - 0.0000% 0.0002%Xcel Energy Transmission Development Co 0076 300040 F.03.18.200098.5660 5660 94 0.0002% - 0.0000% - 0.0000% 0.0001%Xcel Energy Southwest Transmission Co 0077 300041 F.03.19.200098.5660 5660 151 0.0003% - 0.0000% - 0.0000% 0.0001%Total 52,880,321$ 100.0000% 12,662,594$ 100.0000% 7,825 100.0000% 100.0000%
Allocation Changes: Prepared By Reviewed By Approved By Eff. Date
Updated Statistics
Erika Moeller Audra Lake Ross Baumgarten 4/1/2020

Northern States Power Company
XES Allocation Statistics2021 Test Year Budget
200099 Docket No. E002/GR-20-723Exhibit___(RLB-1), Schedule 5
Page 36 of 117
Electric Distribution FERC 588SAP ACC 200099 (469)SCB037
Legal Entity CompanyFinal Cost FERCLET
FERC Account
Total Assets $000's %
Total Revenues %
No. of Employee % Allocation %
NSPM 0010 302058 F.03.01.200099.5880 5880 22,468,670$ 42.4897% 5,240,697$ 41.3872% 3,820 48.8179% 44.2315%NSPW 0011 300174 F.03.02.200099.5880 5880 2,887,050 5.4596% 981,344 7.7499% 542 6.9265% 6.7120%PSCo 0012 300360 F.03.03.200099.5880 5880 19,541,229 36.9537% 4,614,346 36.4408% 2,315 29.5847% 34.3264%SPS 0013 300370 F.03.04.200099.5880 5880 7,982,885 15.0961% 1,826,207 14.4221% 1,148 14.6709% 14.7297%Xcel Energy Transmission Holding Co 0075 300039 F.03.17.200099.5880 5880 242 0.0005% - 0.0000% - 0.0000% 0.0002%Xcel Energy Transmission Development Co 0076 300040 F.03.18.200099.5880 5880 94 0.0002% - 0.0000% - 0.0000% 0.0001%Xcel Energy Southwest Transmission Co 0077 300041 F.03.19.200099.5880 5880 151 0.0003% - 0.0000% - 0.0000% 0.0001%Total 52,880,321$ 100.0000% 12,662,594$ 100.0000% 7,825 100.0000% 100.0000%
Allocation Changes: Prepared By Reviewed By Approved By Eff. Date
Updated Statistics
Erika Moeller Audra Lake Ross Baumgarten 4/1/2020

Northern States Power Company
XES Allocation Statistics2021 Test Year Budget
200100 Docket No. E002/GR-20-723Exhibit___(RLB-1), Schedule 5
Page 37 of 117
Accounting, Reporting, Tax & Audit Services – Regulated GasSAP ACC 200100 (134)SCB038
Legal Entity CompanyFinal Cost FERCLET
FERC Account
Total Assets $000's %
Total Revenues %
No. of Employee %
Allocation %
NSPM 0010 300499 F.03.01.200100.9210 9210 22,468,670$ 50.0450% 5,240,697$ 48.3620% 3,820 57.2113% 51.8728%NSPW 0011 300503 F.03.02.200100.9210 9210 2,887,050 6.4304% 981,344 9.0560% 542 8.1174% 7.8679%PSCo 0012 300507 F.03.03.200100.9210 9210 19,541,229 43.5246% 4,614,346 42.5820% 2,315 34.6713% 40.2593%Total 44,896,949$ 100.0000% 10,836,387$ 100.0000% 6,677 100.0000% 100.0000%
Allocation Changes: Prepared By Reviewed By Approved By Eff. Date
Updated Statistics
Erika Moeller Audra Lake Ross Baumgarten 4/1/2020

Northern States Power Company
XES Allocation Statistics2021 Test Year Budget
200101 Docket No. E002/GR-20-723Exhibit___(RLB-1), Schedule 5
Page 38 of 117
Legal GasSAP ACC 200101 (164)SCB039
Legal Entity CompanyFinal Cost FERCLET
FERC Account
Total Assets $000's %
Total Revenues %
No. of Employee % Allocation %
NSPM 0010 301562 F.03.01.200101.9210 9210 22,468,670$ 50.0450% 5,240,697$ 48.3620% 3,820 57.2113% 51.8728%NSPW 0011 300382 F.03.02.200101.9210 9210 2,887,050 6.4304% 981,344 9.0560% 542 8.1174% 7.8679%PSCo 0012 300386 F.03.03.200101.9210 9210 19,541,229 43.5246% 4,614,346 42.5820% 2,315 34.6713% 40.2593%Total 44,896,949$ 100.0000% 10,836,387$ 100.0000% 6,677 100.0000% 100.0000%
Allocation Changes: Prepared By Reviewed By Approved By Eff. Date
Updated Statistics
Erika Moeller Audra Lake Ross Baumgarten 4/1/2020
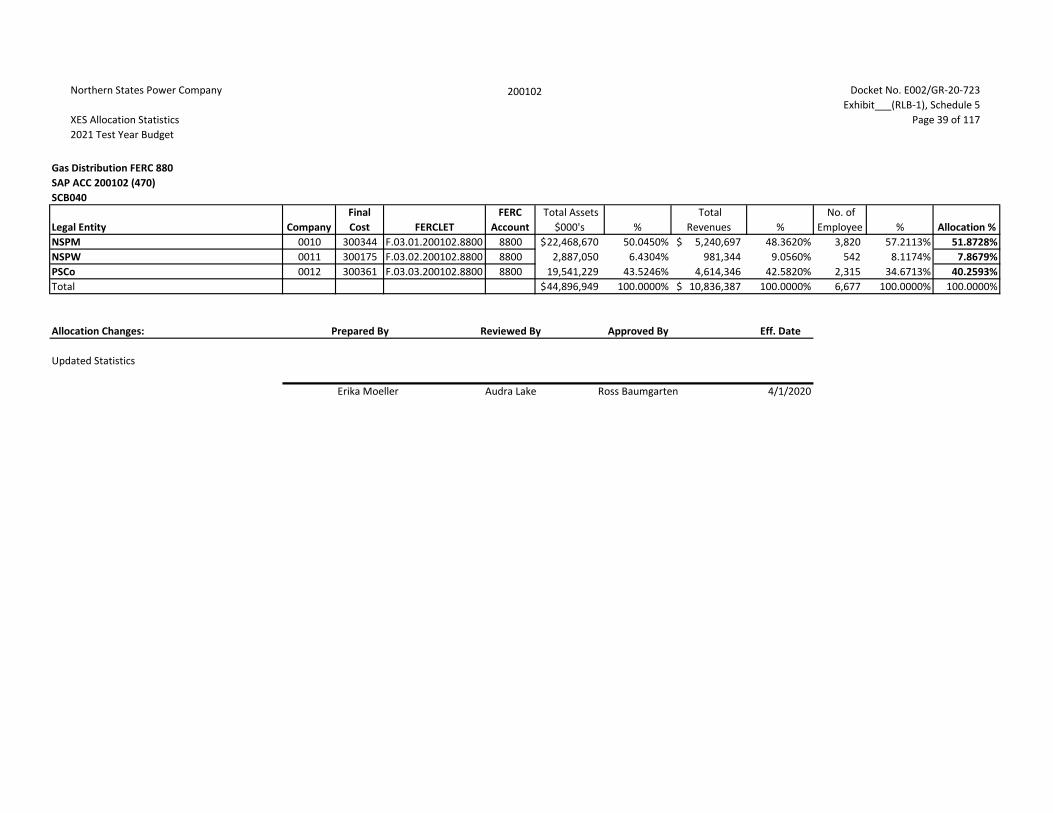
Northern States Power Company
XES Allocation Statistics2021 Test Year Budget
200102 Docket No. E002/GR-20-723Exhibit___(RLB-1), Schedule 5
Page 39 of 117
Gas Distribution FERC 880SAP ACC 200102 (470)SCB040
Legal Entity CompanyFinal Cost FERCLET
FERC Account
Total Assets $000's %
Total Revenues %
No. of Employee % Allocation %
NSPM 0010 300344 F.03.01.200102.8800 8800 22,468,670$ 50.0450% 5,240,697$ 48.3620% 3,820 57.2113% 51.8728%NSPW 0011 300175 F.03.02.200102.8800 8800 2,887,050 6.4304% 981,344 9.0560% 542 8.1174% 7.8679%PSCo 0012 300361 F.03.03.200102.8800 8800 19,541,229 43.5246% 4,614,346 42.5820% 2,315 34.6713% 40.2593%Total 44,896,949$ 100.0000% 10,836,387$ 100.0000% 6,677 100.0000% 100.0000%
Allocation Changes: Prepared By Reviewed By Approved By Eff. Date
Updated Statistics
Erika Moeller Audra Lake Ross Baumgarten 4/1/2020

Northern States Power Company
XES Allocation Statistics2021 Test Year Budget
200103 Docket No. E002/GR-20-723Exhibit___(RLB-1), Schedule 5
Page 40 of 117
Electric Distribution PSCo & SPS FERC 588SAP ACC 200103 (472)SCB041
Legal Entity CompanyFinal Cost FERCLET
FERC Account
Total Assets $000's %
Total Revenues %
No. of Employee %
Allocation %
PSCo 0012 300360 F.03.03.200103.5880 5880 19,541,229$ 70.9968% 4,614,346$ 71.6452% 2,315 66.8496% 69.8305%SPS 0013 300370 F.03.04.200103.5880 5880 7,982,885 29.0032% 1,826,207 28.3548% 1,148 33.1504% 30.1695%Total 27,524,114$ 100.0000% 6,440,553$ 100.0000% 3,463 100.0000% 100.0000%
Allocation Changes: Prepared By Reviewed By Approved By Eff. Date
Updated Statistics
Erika Moeller Audra Lake Ross Baumgarten 4/1/2020

Northern States Power Company
XES Allocation Statistics2021 Test Year Budget
200104 Docket No. E002/GR-20-723Exhibit___(RLB-1), Schedule 5
Page 41 of 117
Accounting & Reporting – PSCo & SPSSAP ACC 200104 (124)SCB042
Legal Entity CompanyFinal Cost FERCLET
FERC Account
Total Assets $000's %
Total Revenues %
No. of Employee %
Allocation %
PSCo 0012 301685 F.03.03.200104.9210 9210 19,541,229$ 70.9968% 4,614,346$ 71.6452% 2,315 66.8496% 69.8305%SPS 0013 301476 F.03.04.200104.9210 9210 7,982,885 29.0032% 1,826,207 28.3548% 1,148 33.1504% 30.1695%Total 27,524,114$ 100.0000% 6,440,553$ 100.0000% 3,463 100.0000% 100.0000%
Allocation Changes: Prepared By Reviewed By Approved By Eff. Date
Updated Statistics
Erika Moeller Audra Lake Ross Baumgarten 4/1/2020

Northern States Power Company
XES Allocation Statistics2021 Test Year Budget
200105 Docket No. E002/GR-20-723Exhibit___(RLB-1), Schedule 5
Page 42 of 117
Accounting & Reporting - NSPM & NSPWSAP ACC 200105 (125)SCB043
Legal Entity CompanyFinal Cost FERCLET
FERC Account
Total Assets $000's %
Total Revenues %
No. of Employee %
Allocation %
NSPM 0010 301683 F.03.01.200105.9210 9210 22,468,670$ 88.6138% 5,240,697$ 84.2279% 3,820 87.5745% 86.8054%NSPW 0011 301684 F.03.02.200105.9210 9210 2,887,050 11.3862% 981,344 15.7721% 542 12.4255% 13.1946%Total 25,355,720$ 100.0000% 6,222,041$ 100.0000% 4,362 100.0000% 100.0000%
Allocation Changes: Prepared By Reviewed By Approved By Eff. Date
Updated Statistics
Erika Moeller Audra Lake Ross Baumgarten 4/1/2020
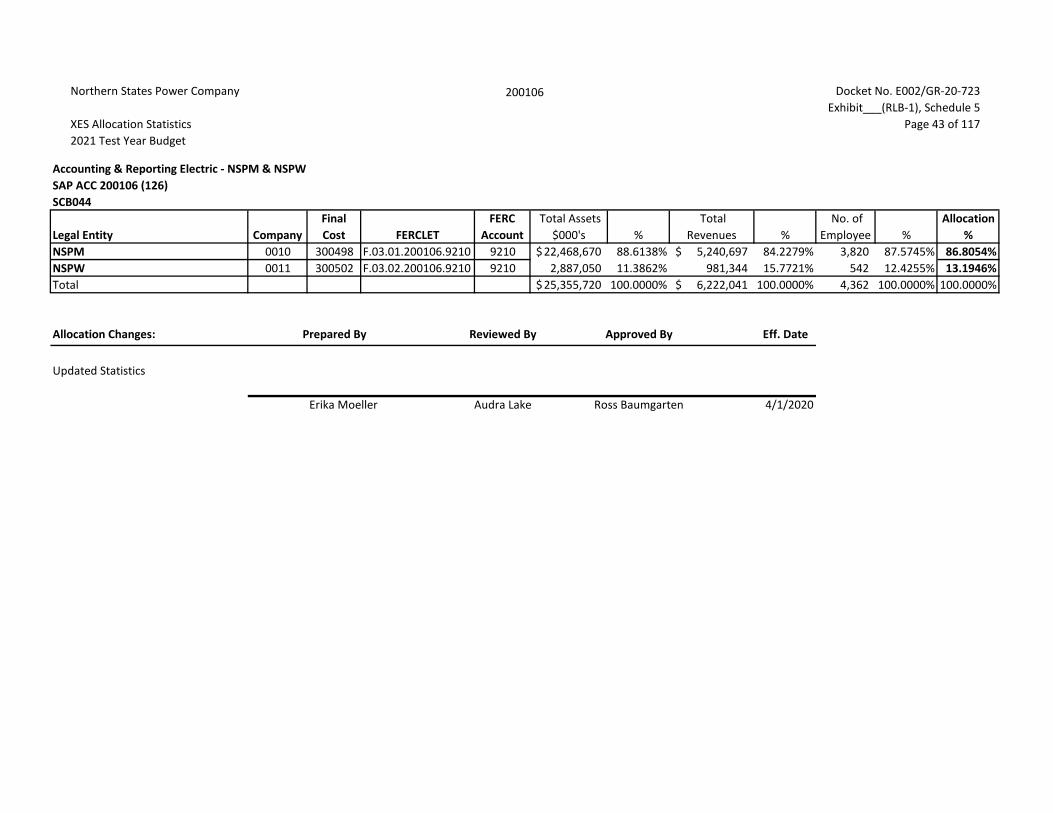
Northern States Power Company
XES Allocation Statistics2021 Test Year Budget
200106 Docket No. E002/GR-20-723Exhibit___(RLB-1), Schedule 5
Page 43 of 117
Accounting & Reporting Electric - NSPM & NSPWSAP ACC 200106 (126)SCB044
Legal Entity CompanyFinal Cost FERCLET
FERC Account
Total Assets $000's %
Total Revenues %
No. of Employee %
Allocation %
NSPM 0010 300498 F.03.01.200106.9210 9210 22,468,670$ 88.6138% 5,240,697$ 84.2279% 3,820 87.5745% 86.8054%NSPW 0011 300502 F.03.02.200106.9210 9210 2,887,050 11.3862% 981,344 15.7721% 542 12.4255% 13.1946%Total 25,355,720$ 100.0000% 6,222,041$ 100.0000% 4,362 100.0000% 100.0000%
Allocation Changes: Prepared By Reviewed By Approved By Eff. Date
Updated Statistics
Erika Moeller Audra Lake Ross Baumgarten 4/1/2020

Northern States Power Company
XES Allocation Statistics2021 Test Year Budget
200107 Docket No. E002/GR-20-723Exhibit___(RLB-1), Schedule 5
Page 44 of 117
Legal - NSPM & NSPWSAP ACC 200107 (172)SCB045
Legal Entity CompanyFinal Cost FERCLET
FERC Account
Total Assets $000's %
Total Revenues %
No. of Employee %
Allocation %
NSPM 0010 301563 F.03.01.200107.9210 9210 22,468,670$ 88.6138% 5,240,697$ 84.2279% 3,820 87.5745% 86.8054%NSPW 0011 302044 F.03.02.200107.9210 9210 2,887,050 11.3862% 981,344 15.7721% 542 12.4255% 13.1946%Total 25,355,720$ 100.0000% 6,222,041$ 100.0000% 4,362 100.0000% 100.0000%
Allocation Changes: Prepared By Reviewed By Approved By Eff. Date
Updated Statistics
Erika Moeller Audra Lake Ross Baumgarten 4/1/2020

Northern States Power Company
XES Allocation Statistics2021 Test Year Budget
200108 Docket No. E002/GR-20-723Exhibit___(RLB-1), Schedule 5
Page 45 of 117
Advanced Metering Infrastructure (AMI)SAP ACC 200108SCB108
Legal Entity CompanyFinal Cost
Center FERCLETFERC
AccountNo. of AMI
Meters Allocation %NSPM 0010 301660 F.03.01.200108.9020 9020 9,035 40.9918%PSCo 0012 300506 F.03.03.200108.9020 9020 13,006 59.0082%Total 22,041 100.0000%
Allocation Changes: Prepared By Reviewed By Eff. Date
Updated Statistics
Erika Moeller Ross Baumgarten 1/1/2020

Northern States Power Company
XES Allocation Statistics2021 Test Year Budget
200111 Docket No. E002/GR-20-723Exhibit___(RLB-1), Schedule 5
Page 46 of 117
Enterprise Application Integration (EAI)SAP ACC 200111 (544)SCB049 200074 200097 200119 200120 200131 200147 200150 200165 200167 200169 200170 200171 200184
Legal Entity CompanyFinal Cost
Center FERCLETFERC
AccountGeneral
Ledger Avg %CBS-ALS-CFM
Avg %GIS-OMS
Avg %Design Tool
Avg %Gas SCADA
Avg %Business Obj
Avg % IVR Avg %PeopleSoft-TIME Avg %
HR Systems Avg %
Maximo Avg %
MDMS-MRAS Avg % CRS Avg %
PowerPlan Avg % Allocation %
NSPM 0010 300344 F.03.01.200111.8510 8510 1.9750% 0.1519% 39.7177%NSPM 0010 300344 F.03.01.200111.8710 8710 21.4318% 1.6486%NSPM 0010 300344 F.03.01.200111.8800 8800 7.5343% 9.0405% 1.2750%NSPM 0010 302058 F.03.01.200111.5880 5880 25.3910% 30.4668% 4.2968%NSPM 0010 300575 F.03.01.200111.9030 9030 34.2896% 34.9295% 5.3245%NSPM 0010 300585 F.03.01.200111.9020 9020 35.5695% 2.7361%NSPM 0010 301404 F.03.01.200111.5390 5390 0.1868% 0.0144%NSPM 0010 301403 F.03.01.200111.5060 5060 29.6386% 2.2799%NSPM 0010 301405 F.03.01.200111.5490 5490 10.6476% 0.8190%NSPM 0010 301673 F.03.01.200111.9210 9210 39.1620% 44.2315% 52.3185% 48.7308% 48.8179% 41.9720% 21.1715%NSPW 0011 300175 F.03.02.200111.8710 8710 5.3866% 0.4144% 6.1935%NSPW 0011 300175 F.03.02.200111.8800 8800 1.8936% 0.1457%NSPW 0011 300174 F.03.02.200111.5880 5880 6.0351% 0.4642%NSPW 0011 301575 F.03.02.200111.9030 9030 6.4411% 6.5486% 0.9992%NSPW 0011 301567 F.03.02.200111.9020 9020 6.6560% 0.5120%NSPW 0011 301674 F.03.02.200111.9210 9210 5.9816% 6.7120% 6.6929% 6.9141% 6.9265% 6.2325% 3.0354%NSPW 0011 301073 F.03.02.200111.5490 5490 0.4981% 0.0383%NSPW 0011 301682 F.03.02.200111.5060 5060 3.9851% 0.3065%NSPW 0011 301073 F.03.02.200111.5390 5390 3.6115% 0.2778%PSCo 0012 300361 F.03.03.200111.8710 8710 52.2766% 4.0213% 41.6552%PSCo 0012 300074 F.03.03.200111.8510 8510 18.9300% 1.4562%PSCo 0012 300360 F.03.03.200111.5880 5880 32.0369% 38.4411% 5.4214%PSCo 0012 300581 F.03.03.200111.9030 9030 43.4090% 47.2395% 6.9730%PSCo 0012 300361 F.03.03.200111.8800 8800 18.3778% 22.0516% 3.1100%PSCo 0012 300591 F.03.03.200111.9020 9020 51.0700% 3.9285%PSCo 0012 301675 F.03.03.200111.9210 9210 29.9106% 34.3264% 29.0026% 29.5318% 29.5847% 36.6215% 14.5367%PSCo 0012 301132 F.03.99.200111.4171 4171 0.7472% 0.0575%PSCo 0012 300929 F.03.03.200111.5060 5060 24.7821% 1.9063%PSCo 0012 301145 F.03.99.200111.5060 5060 0.6227% 0.0479%PSCo 0012 300967 F.03.03.200111.5390 5390 1.7435% 0.1341%PSCo 0012 300929 F.03.03.200111.5490 5490 0.8095% 0.0623%SPS 0013 300370 F.03.04.200111.5880 5880 8.7313% 0.6716% 11.4962%SPS 0013 300592 F.03.04.200111.9020 9020 6.7045% 0.5157%SPS 0013 300582 F.03.04.200111.9030 9030 15.8603% 11.2824% 2.0879%SPS 0013 301676 F.03.04.200111.9210 9210 12.9393% 14.7297% 11.9860% 14.6447% 14.6709% 15.1740% 6.4727%SPS 0013 300933 F.03.04.200111.5060 5060 22.7273% 1.7483%Eloigne 0015 300009 F.03.05.200111.9210 9210 0.0833% 0.0064% 0.0064%Reddy Kilowatt 0017 300010 F.03.06.200111.9210 9210 0.0014% 0.0001% 0.0001%United Power & Land 0019 300012 F.03.07.200111.9210 9210 0.0006% 0.0000% 0.0000%Xcel Energy 0023 300014 F.03.08.200111.9210 9210 11.6508% 0.1786% 0.9100% 0.9100%1480 Welton 0029 300020 F.03.09.200111.9210 9210 0.0162% 0.0012% 0.0012%Xcel Energy WYCO Inc. 0038 300025 F.03.10.200111.9210 9210 0.0826% 0.0064% 0.0064%PSR Investment 0041 300026 F.03.11.200111.9210 9210 0.0044% 0.0003% 0.0003%WGI 0043 300027 F.03.12.200111.9210 9210 0.0008% 0.0001% 0.0001%Xcel Energy Performance Contracting 0051 300029 F.03.13.200111.9210 9210 0.0002% 0.0000% 0.0000%Chippewa Flambeau 0057 300031 F.03.14.200111.9210 9210 0.0020% 0.0002% 0.0002%Clearwater 0058 300032 F.03.15.200111.9210 9210 0.0020% 0.0002% 0.0002%NSP Lands 0059 300033 F.03.16.200111.9210 9210 0.0000% 0.0000% 0.0000%Xcel Energy Transmission Holding Co 0075 300039 F.03.17.200111.9210 9210 0.0001% 0.0002% 0.0000% 0.0000%Xcel Energy Transmission Development Co 0076 300040 F.03.18.200111.9210 9210 0.0000% 0.0001% 0.0000% 0.0000%Xcel Energy Southwest Transmission Co 0077 300041 F.03.19.200111.9210 9210 0.0001% 0.0001% 0.0000% 0.0000%Energy Impact Fund Investments LLC 0086 302160 F.03.20.200111.9210 9210 0.0205% 0.0016% 0.0016%Nicollet Projects I LLC 0088 302162 F.03.21.200111.9210 9210 0.0413% 0.0032% 0.0032%Capital Services, LLC 0089 302163 F.03.22.200111.9210 9210 0.1000% 0.0077% 0.0077%Xcel Energy Investments LLC 0092 302240 F.03.23.200111.9210 9210 0.0002% 0.0000% 0.0000%Total 100.0000% 100.0000% 100.0000% 100.0000% 100.0000% 100.0000% 100.0000% 100.0000% 100.0000% 100.0000% 100.0000% 100.0000% 100.0000% 100.0000% 100.0000%
Allocation Changes: Prepared By Reviewed By Approved By Eff. Date
Updated Statistics
Erika Moeller Audra Lake Ross Baumgarten 4/1/2020

Northern States Power Company
XES Allocation Statistics2021 Test Year Budget
200112 Docket No. E002/GR-20-723Exhibit___(RLB-1), Schedule 5
Page 47 of 117
Mainframe ChargesSAP ACC 200112 (562)SCB050 200165 200168 200170
Legal Entity CompanyFinal Cost FERCLET
FERC Account
TIME/PTRS Avg % GMS Avg %
MDMSAvg % Allocation %
NSPM 0010 300344 F.03.01.200112.8660 8660 0.0016% 0.0005% 28.1006%NSPM 0010 300585 F.03.01.200112.9020 9020 35.5695% 11.8565%NSPM 0010 301673 F.03.01.200112.9210 9210 48.7308% 16.2436%NSPW 0011 301567 F.03.02.200112.9020 9020 6.6560% 2.2187% 7.0420%NSPW 0011 301674 F.03.02.200112.9210 9210 6.9141% 2.3047%NSPW 0011 300175 F.03.02.200112.8800 8800 7.5558% 2.5186%PSCo 0012 300074 F.03.03.200112.8660 8660 0.5170% 0.1723% 57.6815%PSCo 0012 301675 F.03.03.200112.9210 9210 29.5318% 9.8439%PSCo 0012 300591 F.03.03.200112.9020 9020 51.0700% 17.0233%PSCo 0012 300361 F.03.03.200112.8800 8800 91.9256% 30.6420%SPS 0013 300592 F.03.04.200112.9020 9020 6.7045% 2.2348% 7.1164%SPS 0013 301676 F.03.04.200112.9210 9210 14.6447% 4.8816%Xcel Energy 0023 300014 F.03.08.200112.9210 9210 0.1786% 0.0595% 0.0595%Total 100.0000% 100.0000% 100.0000% 100.0000% 100.0000%
Allocation Changes: Prepared By Reviewed By Approved By Eff. Date
Updated Statistics
Erika Moeller Audra Lake Ross Baumgarten 4/1/2020

Northern States Power Company
XES Allocation Statistics2021 Test Year Budget
200115 Docket No. E002/GR-20-723Exhibit___(RLB-1), Schedule 5
Page 48 of 117
Miscellaneous ApplicationsSAP ACC 200115 (514)SCB053 200074 200097 200119 200120 200131 200148 200165 200168 200169 200170 200171 200180 200184
Legal Entity CompanyFinal Cost
Center FERCLETFERC
AccountGeneral
Ledger Avg CBS-ALS-
CFM Avg %GIS-OMS Avg
%Design Tool
Avg %Gas SCADA
Avg %Bus Sys Avg
%PeopleSoft-TIME Avg % GMS Avg %
Maximo Avg %
MDMS-MRAS Avg % CRS Avg %
EMS-Shared Avg %
PowerPlan Avg % Allocation %
NSPM 0010 300344 F.03.01.200115.8660 8660 0.0016% 0.0001% 36.3529%NSPM 0010 300344 F.03.01.200115.8510 8510 1.9750% 0.1519%NSPM 0010 300344 F.03.01.200115.8710 8710 21.4318% 1.6486%NSPM 0010 300575 F.03.01.200115.9030 9030 34.9295% 2.6869%NSPM 0010 300585 F.03.01.200115.9020 9020 35.5695% 2.7361%NSPM 0010 300344 F.03.01.200115.8800 8800 7.5343% 9.0405% 1.2750%NSPM 0010 302058 F.03.01.200115.5880 5880 25.3910% 30.4668% 4.2968%NSPM 0010 301404 F.03.01.200115.5390 5390 0.1868% 0.0144%NSPM 0010 300734 F.03.01.200115.5560 5560 1.0134% 0.0780%NSPM 0010 300125 F.03.01.200115.5612 5612 30.8378% 2.3721%NSPM 0010 300125 F.03.01.200115.5810 5810 9.3869% 0.7221%NSPM 0010 301673 F.03.01.200115.9210 9210 39.1620% 44.2315% 50.4433% 48.7308% 41.9720% 17.2720%NSPM 0010 301403 F.03.01.200115.5060 5060 29.6386% 2.2799%NSPM 0010 301405 F.03.01.200115.5490 5490 10.6476% 0.8190%NSPW 0011 300175 F.03.02.200115.8710 8710 5.3866% 0.4144% 6.2390%NSPW 0011 301575 F.03.02.200115.9030 9030 6.5486% 0.5037%NSPW 0011 301567 F.03.02.200115.9020 9020 6.6560% 0.5120%NSPW 0011 300174 F.03.02.200115.5880 5880 6.0351% 0.4642%NSPW 0011 300175 F.03.02.200115.8800 8800 1.8936% 7.5558% 0.7269%NSPW 0011 301674 F.03.02.200115.9210 9210 5.9816% 6.7120% 6.4799% 6.9141% 6.2325% 2.4862%NSPW 0011 301073 F.03.02.200115.5490 5490 0.4981% 0.0383%NSPW 0011 300737 F.03.02.200115.5560 5560 0.1505% 0.0116%NSPW 0011 300127 F.03.02.200115.5612 5612 4.7405% 0.3647%NSPW 0011 300127 F.03.02.200115.5810 5810 1.7257% 0.1327%NSPW 0011 301682 F.03.02.200115.5060 5060 3.9851% 0.3065%NSPW 0011 301073 F.03.02.200115.5390 5390 3.6115% 0.2778%PSCo 0012 300074 F.03.03.200115.8660 8660 0.5170% 0.0398% 45.8149%PSCo 0012 300361 F.03.03.200115.8710 8710 52.2766% 4.0213%PSCo 0012 300074 F.03.03.200115.8510 8510 18.9300% 1.4562%PSCo 0012 300581 F.03.03.200115.9030 9030 47.2395% 3.6338%PSCo 0012 300591 F.03.03.200115.9020 9020 51.0700% 3.9285%PSCo 0012 300360 F.03.03.200115.5880 5880 32.0369% 38.4411% 5.4214%PSCo 0012 300361 F.03.03.200115.8800 8800 18.3778% 22.0516% 91.9256% 10.1812%PSCo 0012 301675 F.03.03.200115.9210 9210 29.9106% 34.3264% 29.9283% 29.5318% 36.6215% 12.3322%PSCo 0012 301132 F.03.99.200115.4171 4171 0.7472% 0.0575%PSCo 0012 300929 F.03.03.200115.5060 5060 24.7821% 1.9063%PSCo 0012 300738 F.03.03.200115.5560 5560 0.7246% 0.0557%PSCo 0012 300129 F.03.03.200115.5612 5612 10.2489% 0.7884%PSCo 0012 300129 F.03.03.200115.5810 5810 22.7285% 1.7483%PSCo 0012 301145 F.03.99.200115.5060 5060 0.6227% 0.0479%PSCo 0012 300967 F.03.03.200115.5390 5390 1.7435% 0.1341%PSCo 0012 300929 F.03.03.200115.5490 5490 0.8095% 0.0623%SPS 0013 300592 F.03.04.200115.9020 9020 6.7045% 0.5157% 10.6558%SPS 0013 300582 F.03.04.200115.9030 9030 11.2824% 0.8679%SPS 0013 300370 F.03.04.200115.5880 5880 8.7313% 0.6716%SPS 0013 301676 F.03.04.200115.9210 9210 12.9393% 14.7297% 13.1485% 14.6447% 15.1740% 5.4336%SPS 0013 300933 F.03.04.200115.5060 5060 22.7273% 1.7483%SPS 0013 300741 F.03.04.200115.5560 5560 0.4301% 0.0331%SPS 0013 300131 F.03.04.200115.5612 5612 13.2027% 1.0156%SPS 0013 300131 F.03.04.200115.5810 5810 4.8104% 0.3700%Eloigne 0015 300009 F.03.05.200115.9210 9210 0.0833% 0.0064% 0.0064%Reddy Kilowatt 0017 300010 F.03.06.200115.9210 9210 0.0014% 0.0001% 0.0001%United Power & Land 0019 300012 F.03.07.200115.9210 9210 0.0006% 0.0000% 0.0000%Xcel Energy 0023 300014 F.03.08.200115.9210 9210 11.6508% 0.1786% 0.9100% 0.9100%1480 Welton 0029 300020 F.03.09.200115.9210 9210 0.0162% 0.0012% 0.0012%Xcel Energy WYCO Inc. 0038 300025 F.03.10.200115.9210 9210 0.0826% 0.0064% 0.0064%PSR Investment 0041 300026 F.03.11.200115.9210 9210 0.0044% 0.0003% 0.0003%WGI 0043 300027 F.03.12.200115.9210 9210 0.0008% 0.0001% 0.0001%Xcel Energy Performance Contracting 0051 300029 F.03.13.200115.9210 9210 0.0002% 0.0000% 0.0000%Chippewa Flambeau 0057 300031 F.03.14.200115.9210 9210 0.0020% 0.0002% 0.0002%Clearwater 0058 300032 F.03.15.200115.9210 9210 0.0020% 0.0002% 0.0002%NSP Lands 0059 300033 F.03.16.200115.9210 9210 0.0000% 0.0000% 0.0000%Xcel Energy Transmission Holding Co 0075 300039 F.03.17.200115.9210 9210 0.0001% 0.0002% 0.0000% 0.0000%Xcel Energy Transmission Development Co 0076 300040 F.03.18.200115.9210 9210 0.0000% 0.0001% 0.0000% 0.0000%Xcel Energy Southwest Transmission Co 0077 300041 F.03.19.200115.9210 9210 0.0001% 0.0001% 0.0000% 0.0000%Energy Impact Fund Investments LLC 0086 302160 F.03.20.200115.9210 9210 0.0205% 0.0016% 0.0016%Nicollet Projects I LLC 0088 302162 F.03.21.200115.9210 9210 0.0413% 0.0032% 0.0032%Capital Services, LLC 0089 302163 F.03.22.200115.9210 9210 0.1000% 0.0077% 0.0077%Xcel Energy Investments LLC 0092 302240 F.03.23.200115.9210 9210 0.0002% 0.0000% 0.0000%Total 100.0000% 100.0000% 100.0000% 100.0000% 100.0000% 100.0000% 100.0000% 100.0000% 100.0000% 100.0000% 100.0000% 100.0000% 100.0000% 100.0000% 100.0000%
Allocation Changes: Prepared By Reviewed By Approved By Eff. Date
Updated Statistics
Erika Moeller Audra Lake Ross Baumgarten 4/1/2020

Northern States Power Company
XES Allocation Statistics2021 Test Year Budget
200116 Docket No. E002/GR-20-723Exhibit___(RLB-1), Schedule 5
Page 49 of 117
Distribution Electric Supervision & Engineering (S&E) FERC 580SAP ACC 200116 (441)SCB054
Legal Entity CompanyFinal Cost FERCLET
FERC Account
Gross Electric Dist Plant $000
Allocation %
NSPM 0010 302058 F.03.01.200116.5800 5800 4,369,944$ 35.1704%NSPW 0011 300174 F.03.02.200116.5800 5800 1,038,681 8.3596%PSCo 0012 300360 F.03.03.200116.5800 5800 5,513,721 44.3758%SPS 0013 300370 F.03.04.200116.5800 5800 1,502,709 12.0942%Total 12,425,055$ 100.0000%
Allocation Changes: Prepared By Reviewed By Approved By Eff. Date
Updated Statistics
Erika Moeller Audra Lake Ross Baumgarten 4/1/2020

Northern States Power Company
XES Allocation Statistics2021 Test Year Budget
200117 Docket No. E002/GR-20-723Exhibit___(RLB-1), Schedule 5
Page 50 of 117
Distribution Electric Metering FERC 586SAP ACC 200117 (453)SCB055
Legal Entity CompanyFinal Cost FERCLET
FERC Account
Gross Electric Dist Plant $000
Allocation %
NSPM 0010 302058 F.03.01.200117.5860 5860 4,369,944$ 35.1704%NSPW 0011 300174 F.03.02.200117.5860 5860 1,038,681 8.3596%PSCo 0012 300360 F.03.03.200117.5860 5860 5,513,721 44.3758%SPS 0013 300370 F.03.04.200117.5860 5860 1,502,709 12.0942%Total 12,425,055$ 100.0000%
Allocation Changes: Prepared By Reviewed By Approved By Eff. Date
Updated Statistics
Erika Moeller Audra Lake Ross Baumgarten 4/1/2020
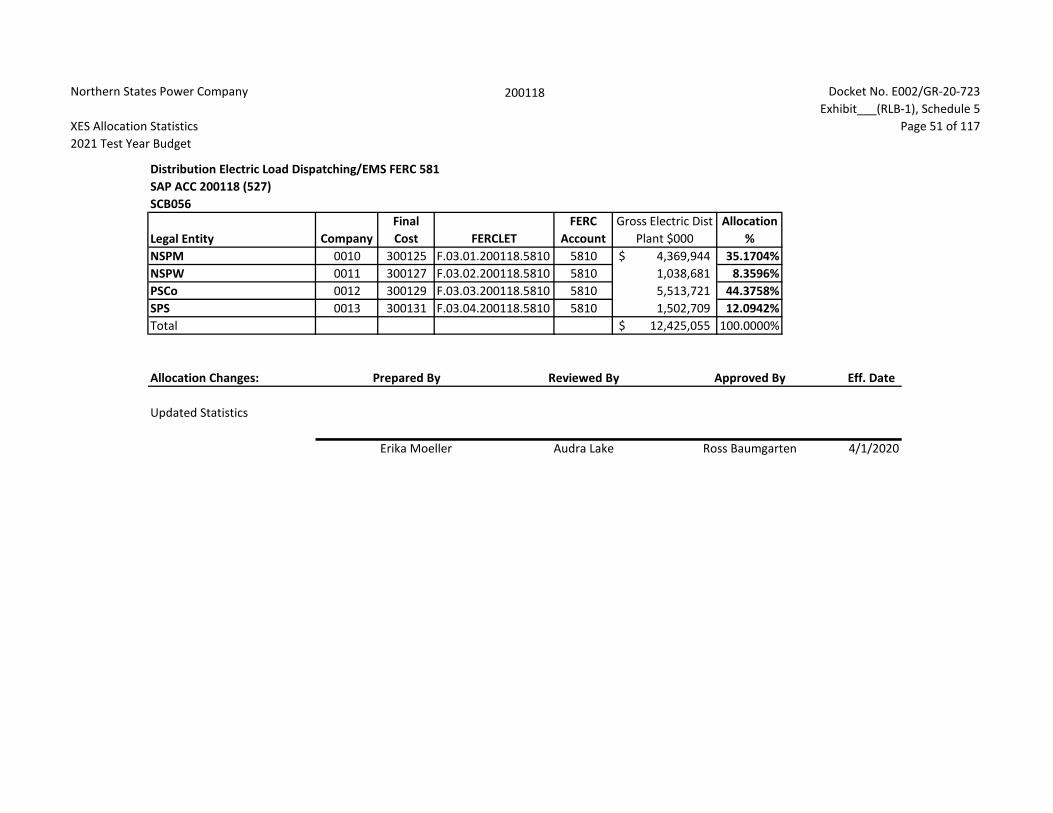
Northern States Power Company
XES Allocation Statistics2021 Test Year Budget
200118 Docket No. E002/GR-20-723Exhibit___(RLB-1), Schedule 5
Page 51 of 117
Distribution Electric Load Dispatching/EMS FERC 581SAP ACC 200118 (527)SCB056
Legal Entity CompanyFinal Cost FERCLET
FERC Account
Gross Electric Dist Plant $000
Allocation %
NSPM 0010 300125 F.03.01.200118.5810 5810 4,369,944$ 35.1704%NSPW 0011 300127 F.03.02.200118.5810 5810 1,038,681 8.3596%PSCo 0012 300129 F.03.03.200118.5810 5810 5,513,721 44.3758%SPS 0013 300131 F.03.04.200118.5810 5810 1,502,709 12.0942%Total 12,425,055$ 100.0000%
Allocation Changes: Prepared By Reviewed By Approved By Eff. Date
Updated Statistics
Erika Moeller Audra Lake Ross Baumgarten 4/1/2020

Northern States Power Company
XES Allocation Statistics2021 Test Year Budget
200119 Docket No. E002/GR-20-723Exhibit___(RLB-1), Schedule 5
Page 52 of 117
Distribution Electric & Gas Miscellaneous FERC 588 & 880SAP ACC 200119 (506, 507, 559)SCB057 5880 8800
Legal Entity CompanyFinal Cost FERCLET
FERC Account
Gross Electric Dist Plant $000
Gross Gas Dist Plant $000
Combined Gross Dist Plant
Allocation %
NSPM 0010 300344 F.03.01.200119.8800 8800 1,296,703$ 1,296,703$ 7.5343%NSPM 0010 302058 F.03.01.200119.5880 5880 4,369,944$ 4,369,944 25.3910% 32.9253%NSPW 0011 300175 F.03.02.200119.8800 8800 325,907 325,907 1.8936%NSPW 0011 300174 F.03.02.200119.5880 5880 1,038,681 1,038,681 6.0351% 7.9287%PSCo 0012 300360 F.03.03.200119.5880 5880 5,513,721 5,513,721 32.0369%PSCo 0012 300361 F.03.03.200119.8800 8800 3,162,931 3,162,931 18.3778% 50.4147%SPS 0013 300370 F.03.04.200119.5880 5880 1,502,709 1,502,709 8.7313% 8.7313%Total 12,425,055$ 4,785,541$ 17,210,596$ 100.0000% 100.0000%
Allocation Changes: Prepared By Reviewed By Approved By Eff. Date
Updated Statistics
Erika Moeller Audra Lake Ross Baumgarten 4/1/2020
FERC Account

Northern States Power Company
XES Allocation Statistics2021 Test Year Budget
200120 Docket No. E002/GR-20-723Exhibit___(RLB-1), Schedule 5
Page 53 of 117
Distribution Electric & Gas Miscellaneous NSPM & PSCo FERC 588 & 880 SAP ACC 200120 (536)SCB058 5880 8800
Legal Entity CompanyFinal Cost FERCLET
FERC Account
Gross Electric Dist Plant $000
Gross Gas Dist Plant $000
Combined Gross Dist Plant $000
Allocation %
NSPM 0010 300344 F.03.01.200120.8800 8800 1,296,703$ 1,296,703$ 9.0405%NSPM 0010 302058 F.03.01.200120.5880 5880 4,369,944$ 4,369,944 30.4668% 39.51%PSCo 0012 300360 F.03.03.200120.5880 5880 5,513,721 5,513,721 38.4411%PSCo 0012 300361 F.03.03.200120.8800 8800 3,162,931 3,162,931 22.0516% 60.49%Total 9,883,665$ 4,459,634$ 14,343,299$ 100.0000% 100.0000%
Allocation Changes: Prepared By Reviewed By Approved By Eff. Date
Updated Statistics
Erika Moeller Audra Lake Ross Baumgarten 4/1/2020
FERC Account

Northern States Power Company
XES Allocation Statistics2021 Test Year Budget
200121 Docket No. E002/GR-20-723Exhibit___(RLB-1), Schedule 5
Page 54 of 117
Distribution Electric & Gas and Transmission Gas Miscellaneous FERC 588, 880, & 859SAP ACC 200121 (474)SCB059
Legal Entity Company
Final Cost
Center FERCLETFERC
Account Utility DistGross Electric
Dist Plant $000Gross Gas Trans
Plant $000Gross Gas Dist
Plant $000
Combined Gross Plant
$000's Allocation %NSPM 0010 300344 F.03.01.200121.8590 8590 Gas Trans 119,495$ 119,495$ 0.6468%NSPM 0010 300344 F.03.01.200121.8800 8800 Gas Dist 1,296,703$ 1,296,703 7.0185%NSPM 0010 302058 F.03.01.200121.5880 5880 Electric Dist 4,369,944$ 4,369,944 23.6527% 31.3180%NSPW 0011 300175 F.03.02.200121.8800 8800 Gas Dist 325,907 325,907 1.7640%NSPW 0011 300174 F.03.02.200121.5880 5880 Electric Dist 1,038,681 1,038,681 5.6220% 7.3860%PSCo 0012 300074 F.03.03.200121.8590 8590 Gas Trans 1,145,332 1,145,332 6.1992%PSCo 0012 300361 F.03.03.200121.8800 8800 Gas Dist 3,162,931 3,162,931 17.1197%PSCo 0012 300360 F.03.03.200121.5880 5880 Electric Dist 5,513,721 5,513,721 29.8435% 53.1624%SPS 0013 300370 F.03.04.200121.5880 5880 Electric Dist 1,502,709 1,502,709 8.1336% 8.1336%Total 12,425,055$ 1,264,827$ 4,785,541$ 18,475,423$ 100.0000% 100.0000%
Allocation Changes: Prepared By Reviewed By Approved By Eff. Date
Updated Statistics
Erika Moeller Audra Lake Ross Baumgarten 4/1/2020

Northern States Power Company
XES Allocation Statistics2021 Test Year Budget
200122 Docket No. E002/GR-20-723Exhibit___(RLB-1), Schedule 5
Page 55 of 117
Transmission Electric Supervision & Engineering (S&E) FERC 560SAP ACC 200122 (442)SCB060
Legal Entity Company
Final Cost
Center FERCLETFERC
Account
Gross Electric Trans Plant
$000Allocation
%NSPM 0010 300125 F.03.01.200122.5600 5600 3,781,955$ 33.5462%NSPW 0011 300127 F.03.02.200122.5600 5600 1,348,538 11.9617%PSCo 0012 300129 F.03.03.200122.5600 5600 2,708,686 24.0263%SPS 0013 300131 F.03.04.200122.5600 5600 3,434,665 30.4658%Total 11,273,844$ 100.0000%
Allocation Changes: Prepared By Reviewed By Approved By Eff. Date
Updated Statistics
Erika Moeller Audra Lake Ross Baumgarten 4/1/2020

Northern States Power Company
XES Allocation Statistics2021 Test Year Budget
200123 Docket No. E002/GR-20-723Exhibit___(RLB-1), Schedule 5
Page 56 of 117
Transmission Electric Reliability, Planning, & Standards Development FERC 561.5SAP ACC 200123 (451)SCB061
Legal Entity CompanyFinal Cost FERCLET
FERC Account
Gross Electric Trans Plant $000
Allocation %
NSPM 0010 300125 F.03.01.200123.5615 5615 3,781,955$ 33.5462%NSPW 0011 300127 F.03.02.200123.5615 5615 1,348,538 11.9617%PSCo 0012 300129 F.03.03.200123.5615 5615 2,708,686 24.0263%SPS 0013 300131 F.03.04.200123.5615 5615 3,434,665 30.4658%Total 11,273,844$ 100.0000%
Allocation Changes: Prepared By Reviewed By Approved By Eff. Date
Updated Statistics
Erika Moeller Audra Lake Ross Baumgarten 4/1/2020

Northern States Power Company
XES Allocation Statistics2021 Test Year Budget
200124 Docket No. E002/GR-20-723Exhibit___(RLB-1), Schedule 5
Page 57 of 117
Transmission Electric Load Dispatch-Monitor and Operate Transmission System FERC 561.2SAP ACC 200124 (526)SCB062
Legal Entity CompanyFinal Cost FERCLET
FERC Account
Gross Electric Trans Plant $000
Allocation %
NSPM 0010 300125 F.03.01.200124.5612 5612 3,781,955$ 33.5462%NSPW 0011 300127 F.03.02.200124.5612 5612 1,348,538 11.9617%PSCo 0012 300129 F.03.03.200124.5612 5612 2,708,686 24.0263%SPS 0013 300131 F.03.04.200124.5612 5612 3,434,665 30.4658%Total 11,273,844$ 100.0000%
Allocation Changes: Prepared By Reviewed By Approved By Eff. Date
Updated Statistics
Erika Moeller Audra Lake Ross Baumgarten 4/1/2020

Northern States Power Company
XES Allocation Statistics2021 Test Year Budget
200125 Docket No. E002/GR-20-723Exhibit___(RLB-1), Schedule 5
Page 58 of 117
Transmission Electric Supervision & Engineering (S&E) NSPM & NSPW FERC 560 SAP ACC 200125 (449)SCB063
Legal Entity Company
Final Cost
Center FERCLETFERC
Account
Gross Electric Trans Plant
$000Allocation
%NSPM 0010 300125 F.03.01.200125.5600 5600 3,781,955$ 73.7152%NSPW 0011 300127 F.03.02.200125.5600 5600 1,348,538 26.2848%Total 5,130,493$ 100.0000%
Allocation Changes: Prepared By Reviewed By Approved By Eff. Date
Updated Statistics
Erika Moeller Audra Lake Ross Baumgarten 4/1/2020

Northern States Power Company
XES Allocation Statistics2021 Test Year Budget
200126 Docket No. E002/GR-20-723Exhibit___(RLB-1), Schedule 5
Page 59 of 117
Utilities Group Administrative & General (A&G) FERC 921SAP ACC 200126 (423, 440, 525)SCB064
Legal Entity Company
Final Cost
Center FERCLETFERC
AccountGross Electric
Trans Plant $000
Gross Electric Dist Plant
$000
Gross Gas Trans Plant
$000
Gross Gas Dist Plant
$000
Combined Gross Delivery Plant $000's
Allocation %
NSPM 0010 300348 F.03.01.200126.9210 9210 3,781,955$ 4,369,944$ 119,495$ 1,296,703$ 9,568,097$ 32.1625%NSPW 0011 300358 F.03.02.200126.9210 9210 1,348,538 1,038,681 - 325,907 2,713,126 9.1200%PSCo 0012 300363 F.03.03.200126.9210 9210 2,708,686 5,513,721 1,145,332 3,162,931 12,530,670 42.1209%SPS 0013 300289 F.03.04.200126.9210 9210 3,434,665 1,502,709 - - 4,937,374 16.5966%Total 11,273,844$ 12,425,055$ 1,264,827$ 4,785,541$ 29,749,267$ 100.0000%
Allocation Changes: Prepared By Reviewed By Approved By Eff. Date
Updated Statistics
Erika Moeller Audra Lake Ross Baumgarten 4/1/2020

Northern States Power Company
XES Allocation Statistics2021 Test Year Budget
200127 Docket No. E002/GR-20-723Exhibit___(RLB-1), Schedule 5
Page 60 of 117
Distribution Gas Supervision & Engineering (S&E) FERC 870SAP ACC 200127 (443)SCB065
Legal Entity CompanyFinal Cost FERCLET
FERC Account
Gross Gas Dist Plant $000
Allocation %
NSPM 0010 300344 F.03.01.200127.8700 8700 1,296,703$ 27.0963%NSPW 0011 300175 F.03.02.200127.8700 8700 325,907 6.8102%PSCo 0012 300361 F.03.03.200127.8700 8700 3,162,931 66.0935%Total 4,785,541$ 100.0000%
Allocation Changes: Prepared By Reviewed By Approved By Eff. Date
Updated Statistics
Erika Moeller Audra Lake Ross Baumgarten 4/1/2020

Northern States Power Company
XES Allocation Statistics2021 Test Year Budget
200128 Docket No. E002/GR-20-723Exhibit___(RLB-1), Schedule 5
Page 61 of 117
Distribution Gas Miscellaneous FERC 880SAP ACC 200128 (445)SCB066
Legal Entity CompanyFinal Cost FERCLET
FERC Account
Gross Gas Dist Plant $000
Allocation %
NSPM 0010 300344 F.03.01.200128.8800 8800 1,296,703$ 27.0963%NSPW 0011 300175 F.03.02.200128.8800 8800 325,907 6.8102%PSCo 0012 300361 F.03.03.200128.8800 8800 3,162,931 66.0935%Total 4,785,541$ 100.0000%
Allocation Changes: Prepared By Reviewed By Approved By Eff. Date
Updated Statistics
Erika Moeller Audra Lake Ross Baumgarten 4/1/2020

Northern States Power Company
XES Allocation Statistics2021 Test Year Budget
200129 Docket No. E002/GR-20-723Exhibit___(RLB-1), Schedule 5
Page 62 of 117
Distribution Gas Meters and House Regulators FERC 878SAP ACC 200129 (454)SCB067
Legal Entity CompanyFinal Cost FERCLET
FERC Account
Gross Gas Dist Plant $000
Allocation %
NSPM 0010 300344 F.03.01.200129.8780 8780 1,296,703$ 27.0963%NSPW 0011 300175 F.03.02.200129.8780 8780 325,907 6.8102%PSCo 0012 300361 F.03.03.200129.8780 8780 3,162,931 66.0935%Total 4,785,541$ 100.0000%
Allocation Changes: Prepared By Reviewed By Approved By Eff. Date
Updated Statistics
Erika Moeller Audra Lake Ross Baumgarten 4/1/2020

Northern States Power Company
XES Allocation Statistics2021 Test Year Budget
200130 Docket No. E002/GR-20-723Exhibit___(RLB-1), Schedule 5
Page 63 of 117
Transmission Gas Supervision & Engineering (S&E) FERC 850SAP ACC 200130 (444)SCB068
Legal Entity CompanyFinal Cost
Center FERCLETFERC
AccountGross Gas Trans
Plant $000 Allocation %NSPM 0010 300344 F.03.01.200130.8500 8500 119,495$ 9.4475%PSCo 0012 300074 F.03.03.200130.8500 8500 1,145,332 90.5525%Total 1,264,827$ 100.0000%
Allocation Changes: Prepared By Reviewed By Approved By Eff. Date
Updated Statistics
Erika Moeller Audra Lake Ross Baumgarten 4/1/2020

Northern States Power Company
XES Allocation Statistics2021 Test Year Budget
200131 Docket No. E002/GR-20-723Exhibit___(RLB-1), Schedule 5
Page 64 of 117
Distribution & Transmission Gas System Control and Load Dispatching FERC 851 & 871SAP ACC 200131 (531)SCB069 8510 8710
Legal Entity CompanyFinal Cost
Center FERCLETFERC
AccountGross Gas Trans
Plant $000Gross Gas Dist
Plant $000Combined Gross Gas Plant $000
Allocation %
NSPM 0010 300344 F.03.01.200131.8510 8510 119,495$ 119,495$ 1.9750%NSPM 0010 300344 F.03.01.200131.8710 8710 1,296,703$ 1,296,703 21.4318% 23.4068%NSPW 0011 300175 F.03.02.200131.8710 8710 325,907 325,907 5.3866% 5.3866%PSCo 0012 300361 F.03.03.200131.8710 8710 3,162,931 3,162,931 52.2766%PSCo 0012 300074 F.03.03.200131.8510 8510 1,145,332 1,145,332 18.9300% 71.2066%Total 1,264,827$ 4,785,541$ 6,050,368$ 100.0000% 100.0000%
Allocation Changes: Prepared By Reviewed By Approved By Eff. Date
Updated Statistics
Erika Moeller Audra Lake Ross Baumgarten 4/1/2020
FERC Account

Northern States Power Company
XES Allocation Statistics2021 Test Year Budget
200132 Docket No. E002/GR-20-723Exhibit___(RLB-1), Schedule 5
Page 65 of 117
Payment & Reporting SAP ACC 200132 (413)SCB070
Legal Entity CompanyFinal Cost
Center FERCLETFERC
AccountTotal Invoice Transactions Allocation %
NSPM 0010 300709 F.03.01.200132.9210 9210 132,621 25.5026%NSPW 0011 300712 F.03.02.200132.9210 9210 29,998 5.7685%PSCo 0012 300715 F.03.03.200132.9210 9210 302,637 58.1960%SPS 0013 300716 F.03.04.200132.9210 9210 54,774 10.5329%Total 520,030 100.0000%
Allocation Changes: Prepared By Reviewed By Approved By Eff. Date
Updated Statistics
Erika Moeller Audra Lake Ross Baumgarten 4/1/2020

Northern States Power Company
XES Allocation Statistics2021 Test Year Budget
200133 Docket No. E002/GR-20-723Exhibit___(RLB-1), Schedule 5
Page 66 of 117
Proprietary Trading - Back OfficeSAP ACC 200133 (128)SCB071
Legal Entity CompanyFinal Cost
Center FERCLETFERC
AccountMaximum
Peak Allocation %NSPM 0010 301457 F.03.01.200133.9210 9210 7,300 36.6755%NSPW 0011 301459 F.03.02.200133.9210 9210 1,474 7.4056%PSCo 0012 301461 F.03.03.200133.9210 9210 6,869 34.5103%SPS 0013 301464 F.03.04.200133.9210 9210 4,261 21.4086%Total 19,904 100.0000%
Allocation Changes: Prepared By Reviewed By Eff. Date
Updated Statistics
Erika Moeller Ross Baumgarten 1/1/2020

Northern States Power Company
XES Allocation Statistics2021 Test Year Budget
200134 Docket No. E002/GR-20-723Exhibit___(RLB-1), Schedule 5
Page 67 of 117
Proprietary Trading - Front/Mid Office FERC 557SAP ACC 200134 (144)SCB072
Legal Entity CompanyFinal Cost
Center FERCLETFERC
AccountMaximum
Peak Allocation %NSPM 0010 300734 F.03.01.200134.5570 5570 8,774 44.0811%PSCo 0012 300738 F.03.03.200134.5570 5570 6,869 34.5103%SPS 0013 300741 F.03.04.200134.5570 5570 4,261 21.4086%Total 19,904 100.0000%
Allocation Changes: Prepared By Reviewed By Eff. Date
Updated Statistics
Erika Moeller Ross Baumgarten 1/1/2020

Northern States Power Company
XES Allocation Statistics2021 Test Year Budget
200135 Docket No. E002/GR-20-723Exhibit___(RLB-1), Schedule 5
Page 68 of 117
Energy Supply Business ResourcesSAP ACC 200135 (414)SCB073
Legal Entity CompanyFinal Cost
Center FERCLETFERC
AccountMWH
Generation 000's Allocation %NSPM 0010 300923 F.03.01.200135.9210 9210 22,856,529 36.1231%NSPW 0011 300926 F.03.02.200135.9210 9210 1,422,483 2.2481%PSCo 0012 300929 F.03.03.200135.9210 9210 24,122,395 38.1238%SPS 0013 300933 F.03.04.200135.9210 9210 14,872,560 23.5050%Total 63,273,967 100.0000%
Allocation Changes: Prepared By Reviewed By Approved By Eff. Date
Updated Statistics
Erika Moeller Audra Lake Ross Baumgarten 4/1/2020

Northern States Power Company
XES Allocation Statistics2021 Test Year Budget
200136 Docket No. E002/GR-20-723Exhibit___(RLB-1), Schedule 5
Page 69 of 117
Energy Markets - FuelSAP ACC 200136 (415)SCB074
Legal Entity CompanyFinal Cost
Center FERCLETFERC
AccountMWH
Generation 000's Allocation %NSPM 0010 301667 F.03.01.200136.9210 9210 22,856,529 36.1231%NSPW 0011 301527 F.03.02.200136.9210 9210 1,422,483 2.2481%PSCo 0012 301463 F.03.03.200136.9210 9210 24,122,395 38.1238%SPS 0013 301464 F.03.04.200136.9210 9210 14,872,560 23.5050%Total 63,273,967 100.0000%
Allocation Changes: Prepared By Reviewed By Approved By Eff. Date
Updated Statistics
Erika Moeller Audra Lake Ross Baumgarten 4/1/2020

Northern States Power Company
XES Allocation Statistics2021 Test Year Budget
200137 Docket No. E002/GR-20-723Exhibit___(RLB-1), Schedule 5
Page 70 of 117
Energy Supply Miscellaneous Power Expense FERC 506, 539, & 549SAP ACC 200137 (455)SCB075 5060 5390 5490
Legal Entity CompanyFinal Cost
Center FERCLETFERC
AccountMWH Steam
Generation 000's
MWH Hydro
Generation
MWH Other Generation
000's
Total ES MWH
GenerationAllocation
%NSPM 0010 301404 F.03.01.200137.5390 5390 64,179 64,179 0.1014%NSPM 0010 301405 F.03.01.200137.5490 5490 11,394,939 11,394,939 18.0089%NSPM 0010 301403 F.03.01.200137.5060 5060 11,397,411 11,397,411 18.0128% 36.1231%NSPW 0011 301073 F.03.02.200137.5490 5490 15,404 15,404 0.0243%NSPW 0011 301682 F.03.02.200137.5060 5060 246,264 246,264 0.3892%NSPW 0011 301073 F.03.02.200137.5390 5390 1,160,815 1,160,815 1.8346% 2.2481%PSCo 0012 300967 F.03.03.200137.5390 5390 302,254 302,254 0.4777%PSCo 0012 300929 F.03.03.200137.5490 5490 11,942,792 11,942,792 18.8748%PSCo 0012 300929 F.03.03.200137.5060 5060 11,877,349 11,877,349 18.7713% 38.1238%SPS 0013 300933 F.03.04.200137.5490 5490 3,138,981 3,138,981 4.9609%SPS 0013 300933 F.03.04.200137.5060 5060 11,733,579 11,733,579 18.5441% 23.5050%Total 35,254,603 1,527,249 26,492,116 63,273,967 100.0000% 100.0000%
Allocation Changes: Prepared By Reviewed By Approved By Eff. Date
Updated Statistics
Erika Moeller Audra Lake Ross Baumgarten 4/1/2020
FERC Account

Northern States Power Company
XES Allocation Statistics2021 Test Year Budget
200138 Docket No. E002/GR-20-723Exhibit___(RLB-1), Schedule 5
Page 71 of 117
Energy Supply Operation Supervision & Engineering (S&E) FERC 500, 535, & 546SAP ACC 200138 (458)SCB076 5000 5350 5460
Legal Entity CompanyFinal Cost
Center FERCLETFERC
AccountMWH Steam
Generation 000's
MWH Hydro
Generation
MWH Other Generation
000's
Total ES MWH
GenerationAllocation
%NSPM 0010 301404 F.03.01.200138.5350 5350 64,179 64,179 0.1014%NSPM 0010 301405 F.03.01.200138.5460 5460 11,394,939 11,394,939 18.0089%NSPM 0010 301403 F.03.01.200138.5000 5000 11,397,411 11,397,411 18.0128% 36.1231%NSPW 0011 301073 F.03.02.200138.5460 5460 15,404 15,404 0.0243%NSPW 0011 301682 F.03.02.200138.5000 5000 246,264 246,264 0.3892%NSPW 0011 301073 F.03.02.200138.5350 5350 1,160,815 1,160,815 1.8346% 2.2481%PSCo 0012 300967 F.03.03.200138.5350 5350 302,254 302,254 0.4777%PSCo 0012 300929 F.03.03.200138.5460 5460 11,942,792 11,942,792 18.8748%PSCo 0012 300929 F.03.03.200138.5000 5000 11,877,349 11,877,349 18.7713% 38.1238%SPS 0013 300933 F.03.04.200138.5460 5460 3,138,981 3,138,981 4.9609%SPS 0013 300933 F.03.04.200138.5000 5000 11,733,579 11,733,579 18.5441% 23.5050%Total 35,254,603 1,527,249 26,492,116 63,273,967 100.0000% 100.0000%
Allocation Changes: Prepared By Reviewed By Approved By Eff. Date
Updated Statistics
Erika Moeller Audra Lake Ross Baumgarten 4/1/2020
FERC Account

Northern States Power Company
XES Allocation Statistics2021 Test Year Budget
200139 Docket No. E002/GR-20-723Exhibit___(RLB-1), Schedule 5
Page 72 of 117
Energy Supply Maintenance Supervision & Engineering (S&E) FERC 510, 541, & 551SAP ACC 200139 (461)SCB077 5100 5410 5510
Legal Entity CompanyFinal Cost
Center FERCLETFERC
AccountMWH Steam
Generation 000's
MWH Hydro
Generation
MWH Other Generation
000's
Total ES MWH
GenerationAllocation
%NSPM 0010 301404 F.03.01.200139.5410 5410 64,179 64,179 0.1014%NSPM 0010 301405 F.03.01.200139.5510 5510 11,394,939 11,394,939 18.0089%NSPM 0010 301403 F.03.01.200139.5100 5100 11,397,411 11,397,411 18.0128% 36.1231%NSPW 0011 301073 F.03.02.200139.5510 5510 15,404 15,404 0.0243%NSPW 0011 301682 F.03.02.200139.5100 5100 246,264 246,264 0.3892%NSPW 0011 301073 F.03.02.200139.5410 5410 1,160,815 1,160,815 1.8346% 2.2481%PSCo 0012 300967 F.03.03.200139.5410 5410 302,254 302,254 0.4777%PSCo 0012 300929 F.03.03.200139.5510 5510 11,942,792 11,942,792 18.8748%PSCo 0012 300929 F.03.03.200139.5100 5100 11,877,349 11,877,349 18.7713% 38.1238%SPS 0013 300933 F.03.04.200139.5510 5510 3,138,981 3,138,981 4.9609%SPS 0013 300933 F.03.04.200139.5100 5100 11,733,579 11,733,579 18.5441% 23.5050%Total 35,254,603 1,527,249 26,492,116 63,273,967 100.0000% 100.0000%
Allocation Changes: Prepared By Reviewed By Approved By Eff. Date
Updated Statistics
Erika Moeller Audra Lake Ross Baumgarten 4/1/2020
FERC Account

Northern States Power Company
XES Allocation Statistics2021 Test Year Budget
200140 Docket No. E002/GR-20-723Exhibit___(RLB-1), Schedule 5
Page 73 of 117
Energy Supply Miscellaneous Power Expense PSCO & SPS FERC 506, 539, & 549SAP ACC 200140 (457)SCB078 5060 5390 5490
Legal Entity CompanyFinal Cost
Center FERCLETFERC
AccountMWH Steam
Generation 000's
MWH Hydro
Generation
MWH Other Generation
000's
Total ES MWH
GenerationAllocation
%PSCo 0012 300967 F.03.03.200140.5390 5390 302,254 302,254 0.7751%PSCo 0012 300929 F.03.03.200140.5490 5490 11,942,792 11,942,792 30.6265%PSCo 0012 300929 F.03.03.200140.5060 5060 11,877,349 11,877,349 30.4587% 61.8603%SPS 0013 300933 F.03.04.200140.5490 5490 3,138,981 3,138,981 8.0497%SPS 0013 300933 F.03.04.200140.5060 5060 11,733,579 11,733,579 30.0900% 38.1397%Total 23,610,928 302,254 15,081,773 38,994,955 100.0000% 100.0000%
Allocation Changes: Prepared By Reviewed By Approved By Eff. Date
Updated Statistics
Erika Moeller Audra Lake Ross Baumgarten 4/1/2020
FERC Account

Northern States Power Company
XES Allocation Statistics2021 Test Year Budget
200141 Docket No. E002/GR-20-723Exhibit___(RLB-1), Schedule 5
Page 74 of 117
Energy Supply Operation Supervision & Engineering (S&E) PSCO & SPS FERC 500, 535, & 546SAP ACC 200141 (460)SCB079 5000 5350 5460
Legal Entity CompanyFinal Cost
Center FERCLETFERC
AccountMWH Steam
Generation 000's
MWH Hydro
Generation
MWH Other Generation
000's
Total ES MWH
GenerationAllocation
%PSCo 0012 300967 F.03.03.200141.5350 5350 302,254 302,254 0.7751% 61.8603%PSCo 0012 300929 F.03.03.200141.5460 5460 11,942,792 11,942,792 30.6265%PSCo 0012 300929 F.03.03.200141.5000 5000 11,877,349 11,877,349 30.4587%SPS 0013 300933 F.03.04.200141.5460 5460 3,138,981 3,138,981 8.0497% 38.1397%SPS 0013 300933 F.03.04.200141.5000 5000 11,733,579 11,733,579 30.0900%Total 23,610,928 302,254 15,081,773 38,994,955 100.0000% 100.0000%
Allocation Changes: Prepared By Reviewed By Approved By Eff. Date
Updated Statistics
Erika Moeller Audra Lake Ross Baumgarten 4/1/2020
FERC Account

Northern States Power Company
XES Allocation Statistics2021 Test Year Budget
200142 Docket No. E002/GR-20-723Exhibit___(RLB-1), Schedule 5
Page 75 of 117
Energy Supply Maintenance Supervision & Engineering (S&E) PSCO & SPS FERC 510, 541, & 551SAP ACC 200142 (463)SCB080 5100 5410 5510
Legal Entity CompanyFinal Cost
Center FERCLETFERC
Account
MWH Steam Generation
000's
MWH Hydro
Generation
MWH Other Generation
000's
Total ES MWH
GenerationAllocation
%PSCo 0012 300967 F.03.03.200142.5410 5410 302,254 302,254 0.7751% 61.8603%PSCo 0012 300929 F.03.03.200142.5510 5510 11,942,792 11,942,792 30.6265%PSCo 0012 300929 F.03.03.200142.5100 5100 11,877,349 11,877,349 30.4587%SPS 0013 300933 F.03.04.200142.5510 5510 3,138,981 3,138,981 8.0497% 38.1397%SPS 0013 300933 F.03.04.200142.5100 5100 11,733,579 11,733,579 30.0900%Total 23,610,928 302,254 15,081,773 38,994,955 100.0000% 100.0000%
Allocation Changes: Prepared By Reviewed By Approved By Eff. Date
Updated Statistics
Erika Moeller Audra Lake Ross Baumgarten 4/1/2020
FERC Account

Northern States Power Company
XES Allocation Statistics2021 Test Year Budget
200143 Docket No. E002/GR-20-723Exhibit___(RLB-1), Schedule 5
Page 76 of 117
Energy Supply Miscellaneous Power Expense NSPM & NSPW FERC 506, 539, & 549SAP ACC 200143 (456)SCB081 5060 5390 5490
Legal Entity CompanyFinal Cost
Center FERCLETFERC
Account
MWH Steam Generation
000's
MWH Hydro
Generation
MWH Other Generation
000's
Total ES MWH
GenerationAllocation
%NSPM 0010 301404 F.03.01.200143.5390 5390 64,179 64,179 0.2643% 94.1412%NSPM 0010 301405 F.03.01.200143.5490 5490 11,394,939 11,394,939 46.9333%NSPM 0010 301403 F.03.01.200143.5060 5060 11,397,411 11,397,411 46.9436%NSPW 0011 301073 F.03.02.200143.5490 5490 15,404 15,404 0.0634% 5.8588%NSPW 0011 301682 F.03.02.200143.5060 5060 246,264 246,264 1.0143%NSPW 0011 301073 F.03.02.200143.5390 5390 1,160,815 1,160,815 4.7811%Total 11,643,676 1,224,994 11,410,343 24,279,012 100.0000% 100.0000%
Allocation Changes: Prepared By Reviewed By Approved By Eff. Date
Updated Statistics
Erika Moeller Audra Lake Ross Baumgarten 4/1/2020
FERC Account

Northern States Power Company
XES Allocation Statistics2021 Test Year Budget
200144 Docket No. E002/GR-20-723Exhibit___(RLB-1), Schedule 5
Page 77 of 117
Energy Supply Operation Supervision & Engineering (S&E) NSPM & NSPW FERC 500, 535, & 546SAP ACC 200144 (459)SCB082 5000 5350 5460
Legal Entity CompanyFinal Cost
Center FERCLETFERC
AccountMWH Steam
Generation 000's
MWH Hydro
Generation
MWH Other Generation
000's
Total ES MWH
GenerationAllocation
%NSPM 0010 301404 F.03.01.200144.5350 5350 64,179 64,179 0.2643% 94.1412%NSPM 0010 301405 F.03.01.200144.5460 5460 11,394,939 11,394,939 46.9333%NSPM 0010 301403 F.03.01.200144.5000 5000 11,397,411 11,397,411 46.9436%NSPW 0011 301073 F.03.02.200144.5460 5460 15,404 15,404 0.0634% 5.8588%NSPW 0011 301682 F.03.02.200144.5000 5000 246,264 246,264 1.0143%NSPW 0011 301073 F.03.02.200144.5350 5350 1,160,815 1,160,815 4.7811%Total 11,643,676 1,224,994 11,410,343 24,279,012 100.0000% 100.0000%
Allocation Changes: Prepared By Reviewed By Approved By Eff. Date
Updated Statistics
Erika Moeller Audra Lake Ross Baumgarten 4/1/2020
FERC Account

Northern States Power Company
XES Allocation Statistics2021 Test Year Budget
200145 Docket No. E002/GR-20-723Exhibit___(RLB-1), Schedule 5
Page 78 of 117
Energy Supply Maintenance Supervision & Engineering (S&E) NSPM & NSPW FERC 510, 541, & 551SAP ACC 200145 (462)SCB083 5100 5410 5510
Legal Entity CompanyFinal Cost
Center FERCLETFERC
AccountMWH Steam
Generation 000's
MWH Hydro
Generation
MWH Other Generation
000's
Total ES MWH
Generation Allocation %NSPM 0010 301404 F.03.01.200145.5410 5410 64,179 64,179 0.2643% 94.1412%NSPM 0010 301405 F.03.01.200145.5510 5510 11,394,939 11,394,939 46.9333%NSPM 0010 301403 F.03.01.200145.5100 5100 11,397,411 11,397,411 46.9436%NSPW 0011 301073 F.03.02.200145.5510 5510 15,404 15,404 0.0634% 5.8588%NSPW 0011 301682 F.03.02.200145.5100 5100 246,264 246,264 1.0143%NSPW 0011 301073 F.03.02.200145.5410 5410 1,160,815 1,160,815 4.7811%Total 11,643,676 1,224,994 11,410,343 24,279,012 100.0000% 100.0000%
Allocation Changes: Prepared By Reviewed By Approved By Eff. Date
Updated Statistics
Erika Moeller Audra Lake Ross Baumgarten 4/1/2020
FERC Account

Northern States Power Company
XES Allocation Statistics2021 Test Year Budget
200146 Docket No. E002/GR-20-723Exhibit___(RLB-1), Schedule 5
Page 79 of 117
Energy Markets - Regulated TradingSAP ACC 200146 (429)SCB084
Legal Entity CompanyFinal Cost
Center FERCLETFERC
AccountTotal MWh
Hour Sales 000's Allocation %NSPM 0010 301457 F.03.01.200146.9210 9210 42,756,896 36.2782%NSPW 0011 301459 F.03.02.200146.9210 9210 6,789,827 5.7610%PSCo 0012 301461 F.03.03.200146.9210 9210 37,417,689 31.7480%SPS 0013 301464 F.03.04.200146.9210 9210 30,893,961 26.2128%Total 117,858,374 100.0000%
Allocation Changes: Prepared By Reviewed By Approved By Eff. Date
Updated Statistics
Erika Moeller Audra Lake Ross Baumgarten 4/1/2020

Northern States Power Company
XES Allocation Statistics2021 Test Year Budget
200147 Docket No. E002/GR-20-723Exhibit___(RLB-1), Schedule 5
Page 80 of 117
Business ObjectsSAP ACC 200147 (554)SCB085
Legal Entity CompanyFinal Cost
Center FERCLETFERC
AccountNo. of Business Objects users Allocation %
NSPM 0010 301673 F.03.01.200147.9210 9210 1,196 52.3185%NSPW 0011 301674 F.03.02.200147.9210 9210 153 6.6929%PSCo 0012 301675 F.03.03.200147.9210 9210 663 29.0026%SPS 0013 301676 F.03.04.200147.9210 9210 274 11.9860%Total 2,286 100.0000%
Allocation Changes: Prepared By Reviewed By Approved By Eff. Date
Updated Statistics
Erika Moeller Audra Lake Ross Baumgarten 4/1/2020
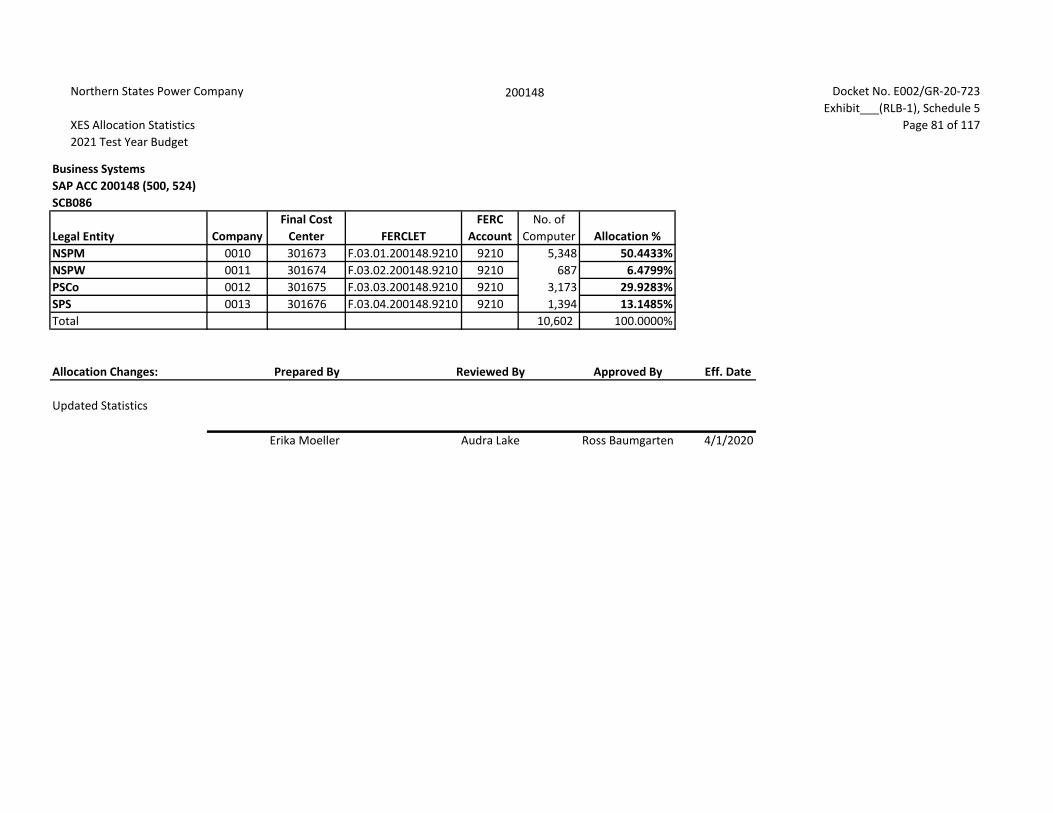
Northern States Power Company
XES Allocation Statistics2021 Test Year Budget
200148 Docket No. E002/GR-20-723Exhibit___(RLB-1), Schedule 5
Page 81 of 117
Business Systems SAP ACC 200148 (500, 524)SCB086
Legal Entity CompanyFinal Cost
Center FERCLETFERC
AccountNo. of
Computer Allocation %NSPM 0010 301673 F.03.01.200148.9210 9210 5,348 50.4433%NSPW 0011 301674 F.03.02.200148.9210 9210 687 6.4799%PSCo 0012 301675 F.03.03.200148.9210 9210 3,173 29.9283%SPS 0013 301676 F.03.04.200148.9210 9210 1,394 13.1485%Total 10,602 100.0000%
Allocation Changes: Prepared By Reviewed By Approved By Eff. Date
Updated Statistics
Erika Moeller Audra Lake Ross Baumgarten 4/1/2020
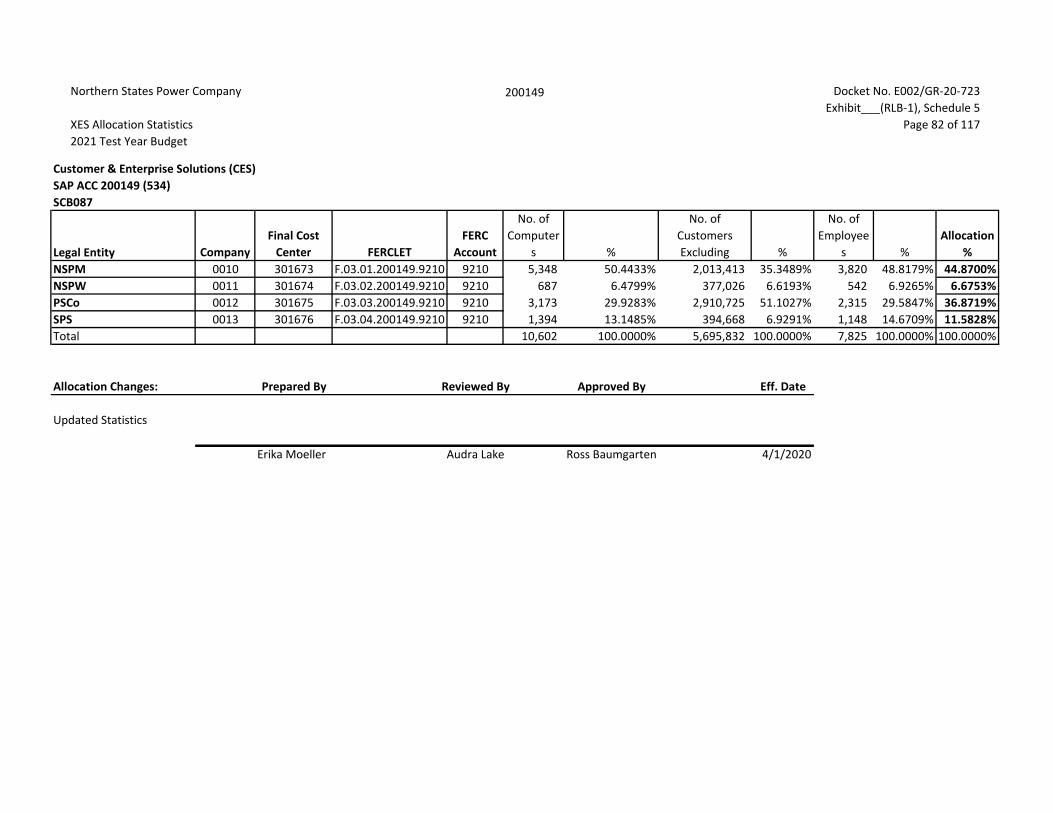
Northern States Power Company
XES Allocation Statistics2021 Test Year Budget
200149 Docket No. E002/GR-20-723Exhibit___(RLB-1), Schedule 5
Page 82 of 117
Customer & Enterprise Solutions (CES)SAP ACC 200149 (534)SCB087
Legal Entity CompanyFinal Cost
Center FERCLETFERC
Account
No. of Computer
s %
No. of Customers Excluding %
No. of Employee
s %Allocation
%NSPM 0010 301673 F.03.01.200149.9210 9210 5,348 50.4433% 2,013,413 35.3489% 3,820 48.8179% 44.8700%NSPW 0011 301674 F.03.02.200149.9210 9210 687 6.4799% 377,026 6.6193% 542 6.9265% 6.6753%PSCo 0012 301675 F.03.03.200149.9210 9210 3,173 29.9283% 2,910,725 51.1027% 2,315 29.5847% 36.8719%SPS 0013 301676 F.03.04.200149.9210 9210 1,394 13.1485% 394,668 6.9291% 1,148 14.6709% 11.5828%Total 10,602 100.0000% 5,695,832 100.0000% 7,825 100.0000% 100.0000%
Allocation Changes: Prepared By Reviewed By Approved By Eff. Date
Updated Statistics
Erika Moeller Audra Lake Ross Baumgarten 4/1/2020

Northern States Power Company
XES Allocation Statistics2021 Test Year Budget
200150 Docket No. E002/GR-20-723Exhibit___(RLB-1), Schedule 5
Page 83 of 117
Interactive Voice Response (IVR)SAP ACC 200150 (520)SCB088
Legal Entity CompanyFinal Cost
Center FERCLETFERC
AccountNo. of
Contacts Allocation %NSPM 0010 300575 F.03.01.200150.9030 9030 1,447,435 34.2896%NSPW 0011 301575 F.03.02.200150.9030 9030 271,892 6.4411%PSCo 0012 300581 F.03.03.200150.9030 9030 1,832,389 43.4090%SPS 0013 300582 F.03.04.200150.9030 9030 669,495 15.8603%Total 4,221,211 100.0000%
Allocation Changes: Prepared By Reviewed By Approved By Eff. Date
Updated Statistics
Erika Moeller Audra Lake Ross Baumgarten 4/1/2020

Northern States Power Company
XES Allocation Statistics2021 Test Year Budget
200151 Docket No. E002/GR-20-723Exhibit___(RLB-1), Schedule 5
Page 84 of 117
Customer Billing FERC 903SAP ACC 200151 (447)SCB089
Legal Entity CompanyFinal Cost
Center FERCLETFERC
AccountNo. of
Customer Bills Allocation %NSPM 0010 300605 F.03.01.200151.9030 9030 1,513,277 39.2309%NSPW 0011 301567 F.03.02.200151.9030 9030 260,656 6.7574%PSCo 0012 300611 F.03.03.200151.9030 9030 1,758,283 45.5825%SPS 0013 302046 F.03.04.200151.9030 9030 325,144 8.4292%Total 3,857,360 100.0000%
Allocation Changes: Prepared By Reviewed By Approved By Eff. Date
Updated Statistics
Erika Moeller Audra Lake Ross Baumgarten 4/1/2020

Northern States Power Company
XES Allocation Statistics2021 Test Year Budget
200152 Docket No. E002/GR-20-723Exhibit___(RLB-1), Schedule 5
Page 85 of 117
Customer Care FERC 902SAP ACC 200152 (436)SCB090
Legal Entity CompanyFinal Cost
Center FERCLETFERC
AccountNo. of
Customers Allocation %NSPM 0010 300585 F.03.01.200152.9020 9020 2,013,424 35.2992%NSPW 0011 301567 F.03.02.200152.9020 9020 377,066 6.6107%PSCo 0012 300591 F.03.03.200152.9020 9020 2,918,714 51.1707%SPS 0013 300592 F.03.04.200152.9020 9020 394,675 6.9194%Total 5,703,879 100.0000%
Allocation Changes: Prepared By Reviewed By Approved By Eff. Date
Updated Statistics
Erika Moeller Audra Lake Ross Baumgarten 4/1/2020

Northern States Power Company
XES Allocation Statistics2021 Test Year Budget
200153 Docket No. E002/GR-20-723Exhibit___(RLB-1), Schedule 5
Page 86 of 117
Customer Safety Advertising & Information CostsSAC APP 200153 (185)SCB091
Legal Entity CompanyFinal Cost
Center FERCLETFERC
AccountNo. of Customers
Excluding Wholesale Allocation %NSPM 0010 300426 F.03.01.200153.9210 9210 2,013,413 35.3489%NSPW 0011 300429 F.03.02.200153.9210 9210 377,026 6.6193%PSCo 0012 300432 F.03.03.200153.9210 9210 2,910,725 51.1027%SPS 0013 300433 F.03.04.200153.9210 9210 394,668 6.9291%Total 5,695,832 100.0000%
Allocation Changes: Prepared By Reviewed By Approved By Eff. Date
Updated Statistics
Erika Moeller Audra Lake Ross Baumgarten 4/1/2020

Northern States Power Company
XES Allocation Statistics2021 Test Year Budget
200154 Docket No. E002/GR-20-723Exhibit___(RLB-1), Schedule 5
Page 87 of 117
Customer Service Information Technology (IT) FERC 903 SAP ACC 200154 (403)SCB092
Legal Entity CompanyFinal Cost
Center FERCLETFERC
AccountNo. of Customers
Excluding Wholesale Allocation %NSPM 0010 300575 F.03.01.200154.9030 9030 2,013,413 35.3489%NSPW 0011 301575 F.03.02.200154.9030 9030 377,026 6.6193%PSCo 0012 300581 F.03.03.200154.9030 9030 2,910,725 51.1027%SPS 0013 300582 F.03.04.200154.9030 9030 394,668 6.9291%Total 5,695,832 100.0000%
Allocation Changes: Prepared By Reviewed By Approved By Eff. Date
Updated Statistics
Erika Moeller Audra Lake Ross Baumgarten 4/1/2020

Northern States Power Company
XES Allocation Statistics2021 Test Year Budget
200155 Docket No. E002/GR-20-723Exhibit___(RLB-1), Schedule 5
Page 88 of 117
Customer Care FERC 903SAP ACC 200155 (435)SCB093
Legal Entity CompanyFinal Cost
Center FERCLETFERC
AccountNo. of Customers
Excluding Wholesale Allocation %NSPM 0010 300555 F.03.01.200155.9030 9030 2,013,413 35.3489%NSPW 0011 301567 F.03.02.200155.9030 9030 377,026 6.6193%PSCo 0012 300561 F.03.03.200155.9030 9030 2,910,725 51.1027%SPS 0013 300562 F.03.04.200155.9030 9030 394,668 6.9291%Total 5,695,832 100.0000%
Allocation Changes: Prepared By Reviewed By Approved By Eff. Date
Updated Statistics
Erika Moeller Audra Lake Ross Baumgarten 4/1/2020
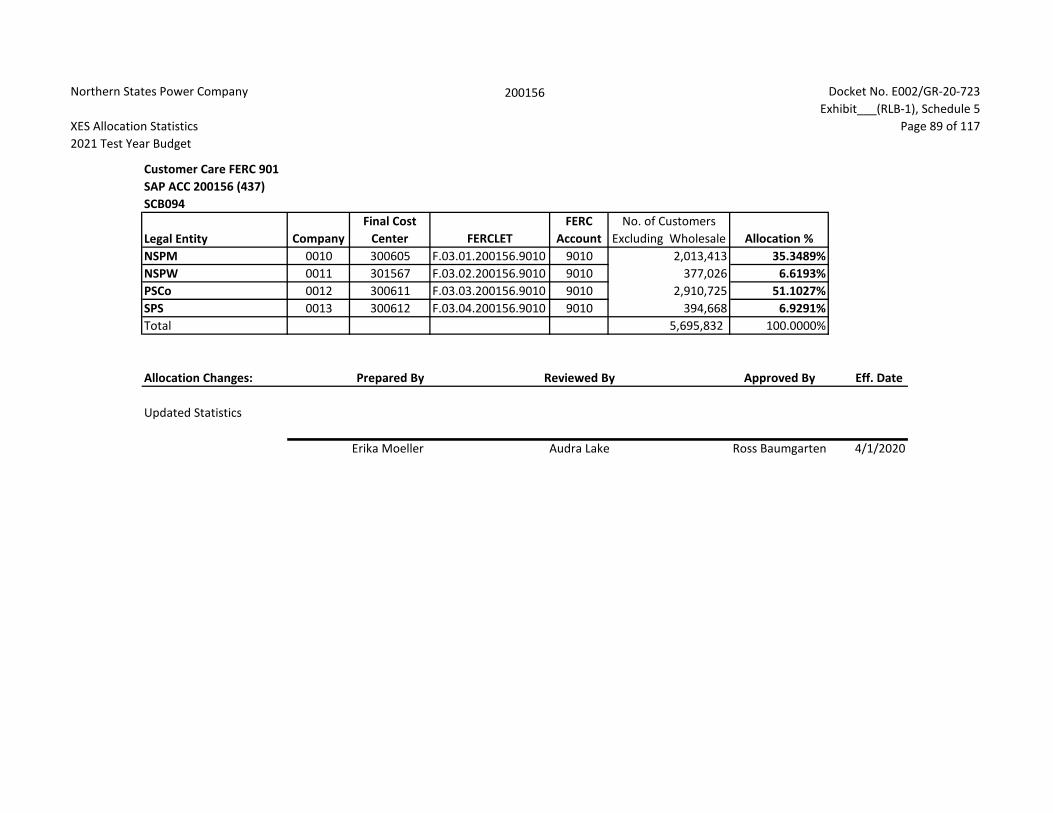
Northern States Power Company
XES Allocation Statistics2021 Test Year Budget
200156 Docket No. E002/GR-20-723Exhibit___(RLB-1), Schedule 5
Page 89 of 117
Customer Care FERC 901SAP ACC 200156 (437)SCB094
Legal Entity CompanyFinal Cost
Center FERCLETFERC
AccountNo. of Customers
Excluding Wholesale Allocation %NSPM 0010 300605 F.03.01.200156.9010 9010 2,013,413 35.3489%NSPW 0011 301567 F.03.02.200156.9010 9010 377,026 6.6193%PSCo 0012 300611 F.03.03.200156.9010 9010 2,910,725 51.1027%SPS 0013 300612 F.03.04.200156.9010 9010 394,668 6.9291%Total 5,695,832 100.0000%
Allocation Changes: Prepared By Reviewed By Approved By Eff. Date
Updated Statistics
Erika Moeller Audra Lake Ross Baumgarten 4/1/2020

Northern States Power Company
XES Allocation Statistics2021 Test Year Budget
200157 Docket No. E002/GR-20-723Exhibit___(RLB-1), Schedule 5
Page 90 of 117
Customer Service Information Technology (IT) PSCo & SPS FERC 903SAP ACC 200157 (404)SCB095
Legal Entity CompanyFinal Cost
Center FERCLETFERC
AccountNo. of Customers
Excluding Wholesale Allocation %PSCo 0012 300581 F.03.03.200157.9030 9030 2,910,725 88.0599%SPS 0013 300582 F.03.04.200157.9030 9030 394,668 11.9401%Total 3,305,393 100.0000%
Allocation Changes: Prepared By Reviewed By Approved By Eff. Date
Updated Statistics
Erika Moeller Audra Lake Ross Baumgarten 4/1/2020

Northern States Power Company
XES Allocation Statistics2021 Test Year Budget
200158 Docket No. E002/GR-20-723Exhibit___(RLB-1), Schedule 5
Page 91 of 117
Customer Care PSCo & SPS FERC 903 SAP ACC 200158 (438)SCB096
Legal Entity CompanyFinal Cost
Center FERCLETFERC
AccountNo. of Customers
Excluding Wholesale Allocation %PSCo 0012 300561 F.03.03.200158.9030 9030 2,910,725 88.0599%SPS 0013 300562 F.03.04.200158.9030 9030 394,668 11.9401%Total 3,305,393 100.0000%
Allocation Changes: Prepared By Reviewed By Approved By Eff. Date
Updated Statistics
Erika Moeller Audra Lake Ross Baumgarten 4/1/2020

Northern States Power Company
XES Allocation Statistics2021 Test Year Budget
200159 Docket No. E002/GR-20-723Exhibit___(RLB-1), Schedule 5
Page 92 of 117
Customer Service Information Technology (IT) NSPM & NSPW FERC 903SAP ACC 200159 (405)SCB097
Legal Entity CompanyFinal Cost
Center FERCLETFERC
AccountNo. of Customers
Excluding Wholesale Allocation %NSPM 0010 300575 F.03.01.200159.9030 9030 2,013,413 84.2278%NSPW 0011 301575 F.03.02.200159.9030 9030 377,026 15.7722%Total 2,390,439 100.0000%
Allocation Changes: Prepared By Reviewed By Approved By Eff. Date
Updated Statistics
Erika Moeller Audra Lake Ross Baumgarten 4/1/2020

Northern States Power Company
XES Allocation Statistics2021 Test Year Budget
200160 Docket No. E002/GR-20-723Exhibit___(RLB-1), Schedule 5
Page 93 of 117
Customer Care NSPM & NSPW FERC 903 SAP ACC 200160 (439)SCB098
Legal Entity CompanyFinal Cost
Center FERCLETFERC
AccountNo. of Customers
Excluding Wholesale Allocation %NSPM 0010 300555 F.03.01.200160.9030 9030 2,013,413 84.2278%NSPW 0011 301567 F.03.02.200160.9030 9030 377,026 15.7722%Total 2,390,439 100.0000%
Allocation Changes: Prepared By Reviewed By Approved By Eff. Date
Updated Statistics
Erika Moeller Audra Lake Ross Baumgarten 4/1/2020

Northern States Power Company
XES Allocation Statistics2021 Test Year Budget
200161 Docket No. E002/GR-20-723Exhibit___(RLB-1), Schedule 5
Page 94 of 117
Customer Care Low Income Assistance FERC 908SAP ACC 200161 (446)SCB099
Legal Entity CompanyFinal Cost
Center FERCLETFERC
AccountNo. of Residential
Customers %No. of Low
Income Customer %Allocation
%NSPM 0010 300565 F.03.01.200161.9080 9080 1,802,029 35.8508% 53,045 48.5297% 42.1903%NSPW 0011 301567 F.03.02.200161.9080 9080 322,171 6.4095% 5,704 5.2185% 5.8140%PSCo 0012 300615 F.03.03.200161.9080 9080 2,591,751 51.5621% 39,709 36.3290% 43.9455%SPS 0013 300582 F.03.04.200161.9080 9080 310,514 6.1776% 10,846 9.9228% 8.0502%Total 5,026,466 100.0000% 109,304 100.0000% 100.0000%
Allocation Changes: Prepared By Reviewed By Approved By Eff. Date
Updated Statistics
Erika Moeller Audra Lake Ross Baumgarten 4/1/2020

Northern States Power Company
XES Allocation Statistics2021 Test Year Budget
200162 Docket No. E002/GR-20-723Exhibit___(RLB-1), Schedule 5
Page 95 of 117
Call Logging and Quality Management (CL/QM) FERC 903SAP ACC 200162 (519)SCB100
Legal Entity CompanyFinal Cost
Center FERCLETFERC
AccountNo. of Customers
Excluding Wholesale %No. of
Contacts %Allocation
%NSPM 0010 300575 F.03.01.200162.9030 9030 2,013,413 35.3489% 1,447,435 34.2896% 34.8192%NSPW 0011 301575 F.03.02.200162.9030 9030 377,026 6.6193% 271,892 6.4411% 6.5302%PSCo 0012 300581 F.03.03.200162.9030 9030 2,910,725 51.1027% 1,832,389 43.4091% 47.2559%SPS 0013 300582 F.03.04.200162.9030 9030 394,668 6.9291% 669,495 15.8603% 11.3947%Total 5,695,832 100.0000% 4,221,211 100.0000% 100.0000%
Allocation Changes: Prepared By Reviewed By Approved By Eff. Date
Updated Statistics
Erika Moeller Audra Lake Ross Baumgarten 4/1/2020

Northern States Power Company
XES Allocation Statistics2021 Test Year Budget
200163 Docket No. E002/GR-20-723Exhibit___(RLB-1), Schedule 5
Page 96 of 117
Employee CommunicationsSAP ACC 200163 (181)SCB101
Legal Entity CompanyFinal Cost
Center FERCLETFERC
AccountNo. of
Employee Allocation %NSPM 0010 301392 F.03.01.200163.9210 9210 3,820 48.7308%NSPW 0011 301393 F.03.02.200163.9210 9210 542 6.9141%PSCo 0012 301394 F.03.03.200163.9210 9210 2,315 29.5318%SPS 0013 301395 F.03.04.200163.9210 9210 1,148 14.6447%Xcel Energy 0023 300014 F.03.08.200163.9210 9210 14 0.1786%Total 7,839 100.0000%
Allocation Changes: Prepared By Reviewed By Approved By Eff. Date
Updated Statistics
Erika Moeller Audra Lake Ross Baumgarten 4/1/2020

Northern States Power Company
XES Allocation Statistics2021 Test Year Budget
200164 Docket No. E002/GR-20-723Exhibit___(RLB-1), Schedule 5
Page 97 of 117
PayrollSAP ACC 200164 (198)SCB102
Legal Entity CompanyFinal Cost
Center FERCLETFERC
AccountNo. of
Employee Allocation %NSPM 0010 300416 F.03.01.200164.9210 9210 3,820 48.7308%NSPW 0011 300419 F.03.02.200164.9210 9210 542 6.9141%PSCo 0012 300422 F.03.03.200164.9210 9210 2,315 29.5318%SPS 0013 300423 F.03.04.200164.9210 9210 1,148 14.6447%Xcel Energy 0023 300014 F.03.08.200164.9210 9210 14 0.1786%Total 7,839 100.0000%
Allocation Changes: Prepared By Reviewed By Approved By Eff. Date
Updated Statistics
Erika Moeller Audra Lake Ross Baumgarten 4/1/2020

Northern States Power Company
XES Allocation Statistics2021 Test Year Budget
200165 Docket No. E002/GR-20-723Exhibit___(RLB-1), Schedule 5
Page 98 of 117
Employee Management SystemsSAP ACC 200165 (515, 521, 552)SCB103
Legal Entity CompanyFinal Cost
Center FERCLETFERC
AccountNo. of
Employee Allocation %NSPM 0010 301673 F.03.01.200165.9210 9210 3,820 48.7308%NSPW 0011 301674 F.03.02.200165.9210 9210 542 6.9141%PSCo 0012 301675 F.03.03.200165.9210 9210 2,315 29.5318%SPS 0013 301676 F.03.04.200165.9210 9210 1,148 14.6447%Xcel Energy 0023 300014 F.03.08.200165.9210 9210 14 0.1786%Total 7,839 100.0000%
Allocation Changes: Prepared By Reviewed By Approved By Eff. Date
Updated Statistics
Erika Moeller Audra Lake Ross Baumgarten 4/1/2020

Northern States Power Company
XES Allocation Statistics2021 Test Year Budget
200166 Docket No. E002/GR-20-723Exhibit___(RLB-1), Schedule 5
Page 99 of 117
Human Resources (Diversity/Safety/Employee Relations)SAP ACC 200166 (190, 197, 199)SCB104
Legal Entity CompanyFinal Cost
Center FERCLETFERC
AccountNo. of
Employee Allocation %NSPM 0010 300416 F.03.01.200166.9210 9210 3,820 48.8179%NSPW 0011 300419 F.03.02.200166.9210 9210 542 6.9265%PSCo 0012 300422 F.03.03.200166.9210 9210 2,315 29.5847%SPS 0013 300423 F.03.04.200166.9210 9210 1,148 14.6709%Total 7,825 100.0000%
Allocation Changes: Prepared By Reviewed By Approved By Eff. Date
Updated Statistics
Erika Moeller Audra Lake Ross Baumgarten 4/1/2020

Northern States Power Company
XES Allocation Statistics2021 Test Year Budget
200167 Docket No. E002/GR-20-723Exhibit___(RLB-1), Schedule 5
Page 100 of 117
e-BusinessSAP ACC 200167 (508, 550)SCB105
Legal Entity CompanyFinal Cost
Center FERCLETFERC
AccountNo. of
Employee Allocation %NSPM 0010 301673 F.03.01.200167.9210 9210 3,820 48.8179%NSPW 0011 301674 F.03.02.200167.9210 9210 542 6.9265%PSCo 0012 301675 F.03.03.200167.9210 9210 2,315 29.5847%SPS 0013 301676 F.03.04.200167.9210 9210 1,148 14.6709%Total 7,825 100.0000%
Allocation Changes: Prepared By Reviewed By Approved By Eff. Date
Updated Statistics
Erika Moeller Audra Lake Ross Baumgarten 4/1/2020

Northern States Power Company
XES Allocation Statistics2021 Test Year Budget
200168 Docket No. E002/GR-20-723Exhibit___(RLB-1), Schedule 5
Page 101 of 117
Gas Management System (GMS) FERC 866 & 880SAP ACC 200168 (517)SCB106
Legal Entity CompanyFinal Cost
Center FERCLETFERC
AccountNo. of Gas Retail
Customers
No. of Gas Transport Customers
Allocation %
NSPM 0010 300344 F.03.01.200168.8660 8660 0 25 0.0016%NSPW 0011 300175 F.03.02.200168.8800 8800 115,955 40 7.5558%PSCo 0012 300074 F.03.03.200168.8660 8660 7,938 0.5170%PSCo 0012 300361 F.03.03.200168.8800 8800 1,411,210 91.9256%Total 1,527,165 8,003 100.0000%
Allocation Changes: Prepared By Reviewed By Approved By Eff. Date
Updated Statistics
Erika Moeller Audra Lake Ross Baumgarten 4/1/2020

Northern States Power Company
XES Allocation Statistics2021 Test Year Budget
200169 Docket No. E002/GR-20-723Exhibit___(RLB-1), Schedule 5
Page 102 of 117
Energy Supply Systems Miscellaneous FERC 417.1, 506, 539, & 549SAP ACC 200169 (504, 537, 553)SCB107
Legal Entity CompanyFinal Cost
Center FERCLETFERC
Account
WAM ES
Users % U5 %Allocation
%NSPM 0010 301404 F.03.01.200169.5390 5390 650 40.4732% 0.4615% 0.1868%NSPM 0010 301403 F.03.01.200169.5060 5060 73.2308% 29.6386%NSPM 0010 301405 F.03.01.200169.5490 5490 26.3077% 10.6476%NSPW 0011 301682 F.03.02.200169.5060 5060 130 8.0946% 49.2308% 3.9851%NSPW 0011 301073 F.03.02.200169.5390 5390 44.6154% 3.6115%NSPW 0011 301073 F.03.02.200169.5490 5490 6.1538% 0.4981%PSCo 0012 301132 F.03.99.200169.4171 4171 461 28.7049% 2.6030% 0.7472%PSCo 0012 300929 F.03.03.200169.5060 5060 86.3340% 24.7821%PSCo 0012 301145 F.03.99.200169.5060 5060 2.1692% 0.6227%PSCo 0012 300967 F.03.03.200169.5390 5390 6.0738% 1.7435%PSCo 0012 300929 F.03.03.200169.5490 5490 2.8200% 0.8095%SPS 0013 300933 F.03.04.200169.5060 5060 365 22.7273% 100.0000% 22.7273%Total 1,606 100.0000% 80.0000% 100.0000%
Allocation Changes: Prepared By Reviewed By Approved By Eff. Date
Updated Statistics
Erika Moeller Audra Lake Ross Baumgarten 4/1/2020

Northern States Power Company
XES Allocation Statistics2021 Test Year Budget
200170 Docket No. E002/GR-20-723Exhibit___(RLB-1), Schedule 5
Page 103 of 117
Meter Reading and Monitoring Systems FERC 902SAP ACC 200170 (518, 540)SCB108
Legal Entity CompanyFinal Cost
Center FERCLETFERC
AccountNo. of Meters Allocation %
NSPM 0010 300585 F.03.01.200170.9020 9020 2,051,988 35.5695%NSPW 0011 301567 F.03.02.200170.9020 9020 383,983 6.6560%PSCo 0012 300591 F.03.03.200170.9020 9020 2,946,206 51.0700%SPS 0013 300592 F.03.04.200170.9020 9020 386,779 6.7045%Total 5,768,956 100.0000%
Allocation Changes: Prepared By Reviewed By Approved By Eff. Date
Updated Statistics
Erika Moeller Audra Lake Ross Baumgarten 4/1/2020

Northern States Power Company
XES Allocation Statistics2021 Test Year Budget
200171 Docket No. E002/GR-20-723Exhibit___(RLB-1), Schedule 5
Page 104 of 117
Customer Resource System (CRS) FERC 903SAP ACC 200171 (503, 555)SCB109
Legal Entity CompanyFinal Cost
Center FERCLETFERC
AccountNo. of Meters %
No. of Contacts %
Allocation %
NSPM 0010 300575 F.03.01.200171.9030 9030 2,051,988 35.5695% 1,447,435 34.2896% 34.9295%NSPW 0011 301575 F.03.02.200171.9030 9030 383,983 6.6560% 271,892 6.4411% 6.5486%PSCo 0012 300581 F.03.03.200171.9030 9030 2,946,206 51.0700% 1,832,389 43.4091% 47.2395%SPS 0013 300582 F.03.04.200171.9030 9030 386,779 6.7045% 669,495 15.8603% 11.2824%Total 5,768,956 100.0000% 4,221,211 100.0000% 100.0000%
Allocation Changes: Prepared By Reviewed By Approved By Eff. Date
Updated Statistics
Erika Moeller Audra Lake Ross Baumgarten 4/1/2020

Northern States Power Company
XES Allocation Statistics2021 Test Year Budget
200172 Docket No. E002/GR-20-723Exhibit___(RLB-1), Schedule 5
Page 105 of 117
NetworkSAP ACC 200172 (523)SCB110
Legal Entity CompanyFinal Cost
Center FERCLETFERC
AccountNo. of
Phones %No. of Radios %
No. of Computer %
Allocation %
NSPM 0010 301673 F.03.01.200172.9210 9210 7,893 54.1395% 2,520 46.4945% 5,348 50.4433% 50.3591%NSPW 0011 301674 F.03.02.200172.9210 9210 1,040 7.1335% 600 11.0701% 687 6.4799% 8.2279%PSCo 0012 301675 F.03.03.200172.9210 9210 3,723 25.5367% 1,600 29.5203% 3,173 29.9283% 28.3284%SPS 0013 301676 F.03.04.200172.9210 9210 1,923 13.1902% 700 12.9151% 1,394 13.1485% 13.0846%Total 14,579 100.0000% 5,420 100.0000% 10,602 100.0000% 100.0000%
Allocation Changes: Prepared By Reviewed By Approved By Eff. Date
Updated Statistics
Erika Moeller Audra Lake Ross Baumgarten 4/1/2020

Northern States Power Company
XES Allocation Statistics2021 Test Year Budget
200173 Docket No. E002/GR-20-723Exhibit___(RLB-1), Schedule 5
Page 106 of 117
Generation Trading/Native Hedge - Back OfficeSAP ACC 200173 (129)SCB111
Legal Entity CompanyFinal Cost
Center FERCLETFERC
AccountAllocation
%NSPM 0010 301457 F.03.01.200173.9210 9210 29.8498%NSPW 0011 301459 F.03.02.200173.9210 9210 6.0274%PSCo 0012 301461 F.03.03.200173.9210 9210 40.3019%SPS 0013 301464 F.03.04.200173.9210 9210 23.8209%Total 100.0000%
Allocation Changes: Prepared By Reviewed By Eff. Date
Updated Statistics
Erika Moeller Ross Baumgarten 1/1/2020
(1) Based on labor hour allocation by Commercial Operations front office trading activities, generation (purchase and sales) and proprietary, with the proprietary allocation to NSPM, PSCo & SPS. Proprietary trading hours are allocated based on the Joint Operating Agreement.

Northern States Power Company
XES Allocation Statistics2021 Test Year Budget
200174 Docket No. E002/GR-20-723Exhibit___(RLB-1), Schedule 5
Page 107 of 117
Generation Trading/Native Hedge - Mid Office FERC 557SAP ACC 200174 (145)SCB112
Legal Entity CompanyFinal Cost
Center FERCLETFERC
AccountAllocation
%NSPM 0010 300734 F.03.01.200174.5570 5570 35.8772%PSCo 0012 300738 F.03.03.200174.5570 5570 40.3019%SPS 0013 300741 F.03.04.200174.5570 5570 23.8209%Total 100.0000%
Allocation Changes: Prepared By Reviewed By Eff. Date
Updated Statistics
Erika Moeller Ross Baumgarten 1/1/2020
(1) Based on labor hour allocation by Commercial Operations front office trading activities, generation (purchase and sales) and proprietary, with the proprietary allocation to NSPM, PSCo & SPS. Proprietary trading hours are allocated based on the Joint Operating Agreement.
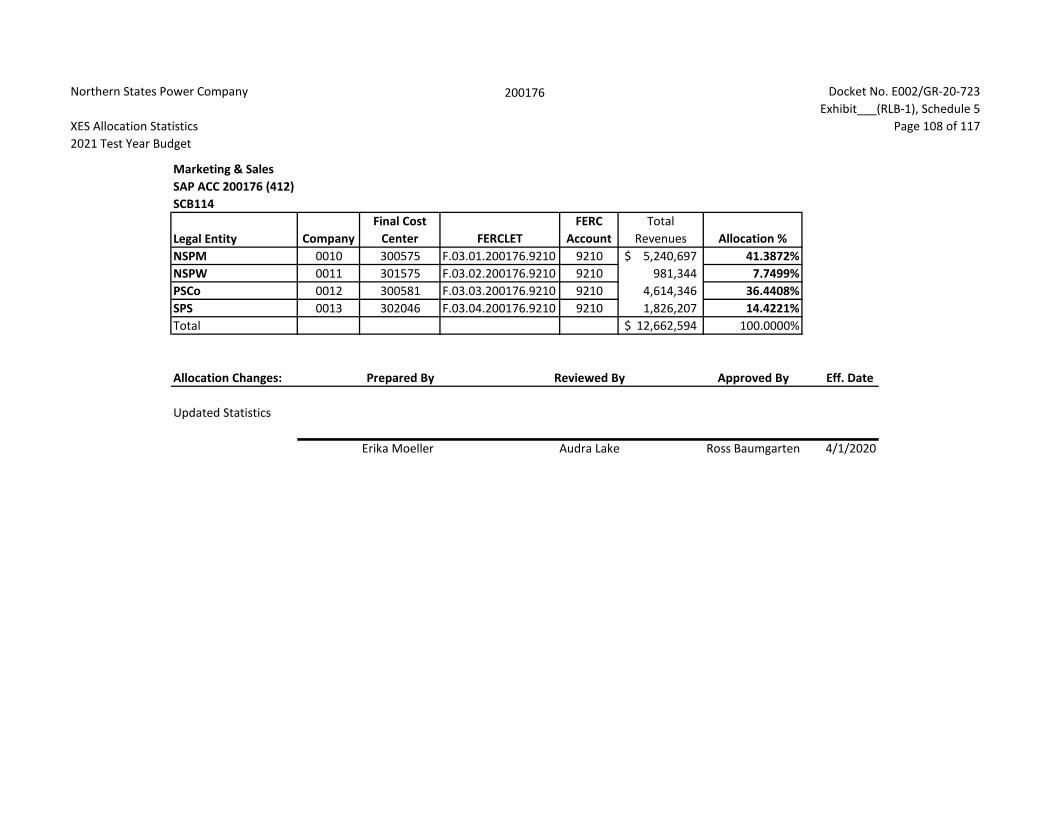
Northern States Power Company
XES Allocation Statistics2021 Test Year Budget
200176 Docket No. E002/GR-20-723Exhibit___(RLB-1), Schedule 5
Page 108 of 117
Marketing & Sales SAP ACC 200176 (412)SCB114
Legal Entity CompanyFinal Cost
Center FERCLETFERC
AccountTotal
Revenues Allocation %NSPM 0010 300575 F.03.01.200176.9210 9210 5,240,697$ 41.3872%NSPW 0011 301575 F.03.02.200176.9210 9210 981,344 7.7499%PSCo 0012 300581 F.03.03.200176.9210 9210 4,614,346 36.4408%SPS 0013 302046 F.03.04.200176.9210 9210 1,826,207 14.4221%Total 12,662,594$ 100.0000%
Allocation Changes: Prepared By Reviewed By Approved By Eff. Date
Updated Statistics
Erika Moeller Audra Lake Ross Baumgarten 4/1/2020

Northern States Power Company
XES Allocation Statistics2021 Test Year Budget
200177 Docket No. E002/GR-20-723Exhibit___(RLB-1), Schedule 5
Page 109 of 117
Rates & Regulation - ElectricSAP ACC 200177 (418)SCB115
Legal Entity CompanyFinal Cost
Center FERCLETFERC
Account
Direct Labor $$ Rates &
Regulation Allocation %NSPM 0010 300833 F.03.01.200177.9210 9210 1,541,743$ 28.4824%NSPW 0011 300673 F.03.02.200177.9210 9210 110,736 2.0458%PSCo 0012 300812 F.03.03.200177.9210 9210 2,517,900 46.5160%SPS 0013 300815 F.03.04.200177.9210 9210 1,242,591 22.9558%Total 5,412,970$ 100.0000%
Allocation Changes: Prepared By Reviewed By Approved By Eff. Date
Updated Statistics
Erika Moeller Audra Lake Ross Baumgarten 4/1/2020

Northern States Power Company
XES Allocation Statistics2021 Test Year Budget
200178 Docket No. E002/GR-20-723Exhibit___(RLB-1), Schedule 5
Page 110 of 117
Rates & RegulationSAP ACC 200178 (417)SCB116
Legal Entity CompanyFinal Cost
Center FERCLETFERC
Account
Direct Labor $$ Rates &
Regulation Allocation %NSPM 0010 300808 F.03.01.200178.9210 9210 1,541,743$ 28.4824%NSPW 0011 300811 F.03.02.200178.9210 9210 110,736 2.0458%PSCo 0012 300814 F.03.03.200178.9210 9210 2,517,900 46.5160%SPS 0013 300815 F.03.04.200178.9210 9210 1,242,591 22.9558%Total 5,412,970$ 100.0000%
Allocation Changes: Prepared By Reviewed By Approved By Eff. Date
Updated Statistics
Erika Moeller Audra Lake Ross Baumgarten 4/1/2020

Northern States Power Company
XES Allocation Statistics2021 Test Year Budget
200180 Docket No. E002/GR-20-723Exhibit___(RLB-1), Schedule 5
Page 111 of 117
EMS-Shared (Energy Management System-SCADA) FERC 556, 561.2, & 581SAP ACC 200180 (528)SCB118
Legal Entity CompanyFinal Cost
Center FERCLETFERC
AccountGross Electric
Prod Plant $000Gross Electric
Trans Plant $000Gross Electric
Dist Plant $000Combined Gross
Plant $000 U5 % Allocation %NSPM 0010 300734 F.03.01.200180.5560 5560 9,964,184$ 3,781,955$ 4,369,944$ 18,116,083$ 2.4574% 1.0134%NSPM 0010 300125 F.03.01.200180.5612 5612 74.7798% 30.8378%NSPM 0010 300125 F.03.01.200180.5810 5810 22.7628% 9.3869%NSPW 0011 300737 F.03.02.200180.5560 5560 519,534 1,348,538 1,038,681 2,906,753 2.2746% 0.1505%NSPW 0011 300127 F.03.02.200180.5612 5612 71.6443% 4.7405%NSPW 0011 300127 F.03.02.200180.5810 5810 26.0811% 1.7257%PSCo 0012 300738 F.03.03.200180.5560 5560 6,583,081 2,708,686 5,513,721 14,805,488 2.1501% 0.7246%PSCo 0012 300129 F.03.03.200180.5612 5612 30.4104% 10.2489%PSCo 0012 300129 F.03.03.200180.5810 5810 67.4395% 22.7285%SPS 0013 300741 F.03.04.200180.5560 5560 3,164,814 3,434,665 1,502,709 8,102,188 2.3319% 0.4301%SPS 0013 300131 F.03.04.200180.5612 5612 71.5856% 13.2027%SPS 0013 300131 F.03.04.200180.5810 5810 26.0825% 4.8104%Total 20,231,613$ 11,273,844$ 12,425,055$ 43,930,512 100.0000% 100.0000%
Allocation Changes: Prepared By Reviewed By Approved By Eff. Date
Updated Statistics
Erika Moeller Audra Lake Ross Baumgarten 4/1/2020

Northern States Power Company
XES Allocation Statistics2021 Test Year Budget
200181 Docket No. E002/GR-20-723Exhibit___(RLB-1), Schedule 5
Page 112 of 117
Energy Supply Environmental Policy & ServicesSAP ACC 200181 (464)SCB119
Legal Entity CompanyFinal Cost
Center FERCLETFERC
Account
Gross Electric Prod Plant
$000Gross Electric
Trans Plant $000Gross Electric Dist
Plant $000Gross Gas Trans
Plant $000Gross Gas Dist
Plant $000Combined Gross
Plant $000's Allocation %NSPM 0010 301667 F.03.01.200181.9210 9210 9,964,184$ 3,781,955$ 4,369,944$ 119,495$ 1,296,703$ 19,532,281$ 39.0795%NSPW 0011 301527 F.03.02.200181.9210 9210 519,534 1,348,538 1,038,681 - 325,907 3,232,660 6.4678%PSCo 0012 301463 F.03.03.200181.9210 9210 6,583,081 2,708,686 5,513,721 1,145,332 3,162,931 19,113,751 38.2421%SPS 0013 300933 F.03.04.200181.9210 9210 3,164,814 3,434,665 1,502,709 - - 8,102,188 16.2106%Total 20,231,613$ 11,273,844$ 12,425,055$ 1,264,827$ 4,785,541$ 49,980,880$ 100.0000%
Allocation Changes: Prepared By Reviewed By Approved By Eff. Date
Updated Statistics
Erika Moeller Audra Lake Ross Baumgarten 4/1/2020

Northern States Power Company
XES Allocation Statistics2021 Test Year Budget
200182 Docket No. E002/GR-20-723Exhibit___(RLB-1), Schedule 5
Page 113 of 117
Energy Supply Environmental Policy & Services NSPM & NSPWSAP ACC 200182 (485)SCB120
Legal Entity CompanyFinal Cost
Center FERCLETFERC
AccountGross Electric
Prod Plant $000Gross Electric
Trans Plant $000Gross Electric Dist
Plant $000Gross Gas Trans
Plant $000Gross Gas Dist
Plant $000Combined Gross
Plat $000's Allocation %NSPM 0010 301667 F.03.01.200182.9210 9210 9,964,184$ 3,781,955$ 4,369,944$ 119,495$ 1,296,703$ 19,532,281$ 85.7998%NSPW 0011 301527 F.03.02.200182.9210 9210 519,534 1,348,538 1,038,681 - 325,907 3,232,660 14.2002%Total 10,483,718$ 5,130,493$ 5,408,625$ 119,495$ 1,622,610$ 22,764,941$ 100.0000%
Allocation Changes: Prepared By Reviewed By Approved By Eff. Date
Updated Statistics
Erika Moeller Audra Lake Ross Baumgarten 4/1/2020

Northern States Power Company
XES Allocation Statistics2021 Test Year Budget
200183 Docket No. E002/GR-20-723Exhibit___(RLB-1), Schedule 5
Page 114 of 117
Energy Supply Environmental Policy & Services PSCo & SPSSAP ACC 200183 (466)SCB121
Legal Entity CompanyFinal Cost
Center FERCLETFERC
Account
Gross Electric Prod Plant
$000Gross Electric
Trans Plant $000
Gross Electric Dist Plant
$000
Gross Gas Trans Plant
$000Gross Gas Dist
Plant $000
Combined Gross Plat
$000's Allocation %PSCo 0012 301463 F.03.03.200183.9210 9210 6,583,081$ 2,708,686$ 5,513,721$ 1,145,332$ 3,162,931$ 19,113,751$ 70.2300%SPS 0013 300933 F.03.04.200183.9210 9210 3,164,814 3,434,665 1,502,709 - - 8,102,188 29.7700%Total 9,747,895$ 6,143,351$ 7,016,430$ 1,145,332$ 3,162,931$ 27,215,939$ 100.0000%
Allocation Changes: Prepared By Reviewed By Approved By Eff. Date
Updated Statistics
Erika Moeller Audra Lake Ross Baumgarten 4/1/2020

Northern States Power Company
XES Allocation Statistics2021 Test Year Budget
200184 Docket No. E002/GR-20-723Exhibit___(RLB-1), Schedule 5
Page 115 of 117
PowerPlanSAP ACC 200184 (516)SCB122
Legal Entity CompanyFinal Cost
Center FERCLETFERC
AccountTotal Plant Assets
$000's Allocation %NSPM 0010 301673 F.03.01.200184.9210 9210 24,724,181$ 41.9720%NSPW 0011 301674 F.03.02.200184.9210 9210 3,671,308 6.2325%PSCo 0012 301675 F.03.03.200184.9210 9210 21,572,345 36.6215%SPS 0013 301676 F.03.04.200184.9210 9210 8,938,415 15.1740%Total 58,906,249$ 100.0000%
Allocation Changes: Prepared By Reviewed By Approved By Eff. Date
Updated Statistics
Erika Moeller Audra Lake Ross Baumgarten 4/1/2020

Northern States Power Company
XES Allocation Statistics2021 Test Year Budget
200805 Docket No. E002/GR-20-723Exhibit___(RLB-1), Schedule 5
Page 116 of 117
Legal Electric Opco’s and Transco’sSAP ACC 200805 (163)SCB124
Legal Entity CompanyFinal Cost
Center FERCLETFERC
Account Total Assets
$000's %Revenues
$000's %
Employee
s % Allocation %NSPM 0010 300377 F.03.01.200805.9210 9210 22,468,670$ 42.4897% 5,240,697$ 41.3872% 3,820 48.8179% 44.2315%NSPW 0011 300381 F.03.02.200805.9210 9210 2,887,050 5.4596% 981,344 7.7499% 542 6.9265% 6.7120%PSCo 0012 300385 F.03.03.200805.9210 9210 19,541,229 36.9537% 4,614,346 36.4408% 2,315 29.5847% 34.3264%SPS 0013 300390 F.03.04.200805.9210 9210 7,982,885 15.0961% 1,826,207 14.4221% 1,148 14.6709% 14.7297%Xcel Energy Transmission Holding Co 0075 300039 F.03.17.200805.9210 9210 242 0.0005% - 0.0000% - 0.0000% 0.0002%Xcel Energy Transmission Development Co 0076 300040 F.03.18.200805.9210 9210 94 0.0002% - 0.0000% - 0.0000% 0.0001%Xcel Energy Southwest Transmission Co 0077 300041 F.03.19.200805.9210 9210 151 0.0003% - 0.0000% - 0.0000% 0.0001%Total 52,880,321$ 100.0000% 12,662,594$ 100.0000% 7,825 100.0000% 100.0000%
Allocation Changes: Prepared By Reviewed By Approved By Eff. Date
Updated Statistics
Erika Moeller Audra Lake Ross Baumgarten 4/1/2020

Northern States Power Company
XES Allocation Statistics2021 Test Year Budget
200806 Docket No. E002/GR-20-723Exhibit___(RLB-1), Schedule 5
Page 117 of 117
Legal Electric NSPM & NSPWSAP ACC 200806 (173)SCB125
Legal Entity CompanyFinal Cost
Center FERCLETFERC
Account Total Assets
$000's % Total
Revenues % No. of
Employee % Allocation %NSPM 0010 300377 F.03.01.200806.9210 9210 22,468,670$ 88.6138% 5,240,697$ 84.2279% 3,820 87.5745% 86.8054%NSPW 0011 300381 F.03.02.200806.9210 9210 2,887,050 11.3862% 981,344 15.7721% 542 12.4255% 13.1946%Total 25,355,720$ 100.0000% 6,222,041$ 100.0000% 4,362 100.0000% 100.0000%
Allocation Changes: Prepared By Reviewed By Approved By Eff. Date
Updated Statistics
Erika Moeller Audra Lake Ross Baumgarten 4/1/2020

Northern States Power Company
XES Allocation Statistics Using FTE Hours2021 Test Year Budget
200063 Docket No. E002/GR-20-723Exhibit___(RLB-1), Schedule 5(a)
Page 1 of 117
Executive - Corporate GovernanceSAP ACC 200063 (110)SCB001
Legal Entity CompanyFinal Cost
Center FERCLETFERC
Account Total Assets
$000's %Revenues
$000's % FTE Hours %Allocation
%NSPM 0010 301367 F.03.01.200063.9210 9210 22,468,670$ 31.3818% 5,240,697$ 37.3735% 9,713,752 44.5680% 37.7744%NSPW 0011 301368 F.03.02.200063.9210 9210 2,887,050 4.0323% 981,344 6.9984% 1,636,749 7.5096% 6.1801%PSCo 0012 301369 F.03.03.200063.9210 9210 19,541,229 27.2931% 4,614,346 32.9068% 7,209,812 33.0796% 31.0931%SPS 0013 301370 F.03.04.200063.9210 9210 7,982,885 11.1496% 1,826,207 13.0234% 3,227,597 14.8087% 12.9939%Eloigne 0015 300009 F.03.05.200063.9210 9210 127,927 0.1787% 9,991 0.0712% 622 0.0029% 0.0843%Reddy Kilowatt 0017 300010 F.03.06.200063.9210 9210 2,901 0.0041% - 0.0000% 0 0.0000% 0.0014%United Power & Land 0019 300012 F.03.07.200063.9210 9210 1,131 0.0016% 24 0.0002% 54 0.0002% 0.0007%Xcel Energy 0023 300014 F.03.08.200063.9210 9210 18,048,786 25.2086% 1,341,300 9.5654% 682 0.0031% 11.5924%1480 Welton 0029 300020 F.03.09.200063.9210 9210 12,090 0.0169% 4,452 0.0317% 18 0.0001% 0.0162%Xcel Energy WYCO Inc. 0038 300025 F.03.10.200063.9210 9210 177,375 0.2477% - 0.0000% 163 0.0007% 0.0828%PSR Investments 0041 300026 F.03.11.200063.9210 9210 9,445 0.0132% - 0.0000% 16 0.0001% 0.0044%WGI 0043 300027 F.03.12.200063.9210 9210 929 0.0013% 147 0.0010% 163 0.0008% 0.0010%Xcel Energy Performance Contracting 0051 300029 F.03.13.200063.9210 9210 468 0.0007% - 0.0000% 37 0.0002% 0.0003%Chippewa Flambeau 0057 300031 F.03.14.200063.9210 9210 944 0.0013% 641 0.0046% 5,141 0.0236% 0.0098%Clearwater 0058 300032 F.03.15.200063.9210 9210 3,032 0.0042% 249 0.0018% 90 0.0004% 0.0021%NSP Lands 0059 300033 F.03.16.200063.9210 9210 49 0.0001% - 0.0000% 14 0.0001% 0.0000%Xcel Energy Transmission Holding Co 0075 300039 F.03.17.200063.9210 9210 242 0.0003% - 0.0000% 33 0.0002% 0.0002%Xcel Energy Transmission Development Co 0076 300040 F.03.18.200063.9210 9210 94 0.0001% - 0.0000% 113 0.0005% 0.0002%Xcel Energy Southwest Transmission Co 0077 300041 F.03.19.200063.9210 9210 151 0.0002% - 0.0000% 18 0.0001% 0.0001%Energy Impact Fund Investments LLC 0086 302160 F.03.20.200063.9210 9210 44,127 0.0616% - 0.0000% 30 0.0001% 0.0206%Nicollet Projects I LLC 0088 302162 F.03.21.200063.9210 9210 72,927 0.1019% 3,087 0.0220% 122 0.0006% 0.0415%Capital Services, LLC 0089 302163 F.03.22.200063.9210 9210 214,824 0.3000% - 0.0000% 94 0.0004% 0.1002%Xcel Energy Investments LLC 0092 302240 F.03.23.200063.9210 9210 472 0.0007% - 0.0000% 23 0.0001% 0.0003%Total 71,597,748$ 100.0000% 14,022,485$ 100.0000% 21,795,345 100.0000% 100.0000%
Allocation Changes: Prepared By Reviewed By Approved By Eff. Date
Updated Statistics
Erika Moeller Audra Lake Ross Baumgarten 4/1/2020

Northern States Power Company
XES Allocation Statistics Using FTE Hours2021 Test Year Budget
200064 Docket No. E002/GR-20-723Exhibit___(RLB-1), Schedule 5(a)
Page 2 of 117
Shareholder - Corporate GovernanceSAP ACC 200064 (115)SCB002
Legal Entity CompanyCost
Center FERCLETFERC
Account Total Assets
$000's %Revenues
$000's % FTE Hours %Allocation
%NSPM 0010 301367 F.03.01.200064.9210 9210 22,468,670$ 31.3818% 5,240,697$ 37.3735% 9,713,752 44.5680% 37.7744%NSPW 0011 301397 F.03.02.200064.9210 9210 2,887,050 4.0323% 981,344 6.9984% 1,636,749 7.5096% 6.1801%PSCo 0012 301398 F.03.03.200064.9210 9210 19,541,229 27.2931% 4,614,346 32.9068% 7,209,812 33.0796% 31.0931%SPS 0013 301399 F.03.04.200064.9210 9210 7,982,885 11.1496% 1,826,207 13.0234% 3,227,597 14.8087% 12.9939%Eloigne 0015 300009 F.03.05.200064.9210 9210 127,927 0.1787% 9,991 0.0712% 622 0.0029% 0.0843%Reddy Kilowatt 0017 300010 F.03.06.200064.9210 9210 2,901 0.0041% - 0.0000% 0 0.0000% 0.0014%United Power & Land 0019 300012 F.03.07.200064.9210 9210 1,131 0.0016% 24 0.0002% 54 0.0002% 0.0007%Xcel Energy 0023 300014 F.03.08.200064.9210 9210 18,048,786 25.2086% 1,341,300 9.5654% 682 0.0031% 11.5924%1480 Welton 0029 300020 F.03.09.200064.9210 9210 12,090 0.0169% 4,452 0.0317% 18 0.0001% 0.0162%Xcel Energy WYCO Inc. 0038 300025 F.03.10.200064.9210 9210 177,375 0.2477% - 0.0000% 163 0.0007% 0.0828%PSR Investments 0041 300026 F.03.11.200064.9210 9210 9,445 0.0132% - 0.0000% 16 0.0001% 0.0044%WGI 0043 300027 F.03.12.200064.9210 9210 929 0.0013% 147 0.0010% 163 0.0008% 0.0010%Xcel Energy Performance Contracting 0051 300029 F.03.13.200064.9210 9210 468 0.0007% - 0.0000% 37 0.0002% 0.0003%Chippewa Flambeau 0057 300031 F.03.14.200064.9210 9210 944 0.0013% 641 0.0046% 5,141 0.0236% 0.0098%Clearwater 0058 300032 F.03.15.200064.9210 9210 3,032 0.0042% 249 0.0018% 90 0.0004% 0.0021%NSP Lands 0059 300033 F.03.16.200064.9210 9210 49 0.0001% - 0.0000% 14 0.0001% 0.0000%Xcel Energy Transmission Holding Co 0075 300039 F.03.17.200064.9210 9210 242 0.0003% - 0.0000% 33 0.0002% 0.0002%Xcel Energy Transmission Development Co 0076 300040 F.03.18.200064.9210 9210 94 0.0001% - 0.0000% 113 0.0005% 0.0002%Xcel Energy Southwest Transmission Co 0077 300041 F.03.19.200064.9210 9210 151 0.0002% - 0.0000% 18 0.0001% 0.0001%Energy Impact Fund Investments LLC 0086 302160 F.03.20.200064.9210 9210 44,127 0.0616% - 0.0000% 30 0.0001% 0.0206%Nicollet Projects I LLC 0088 302162 F.03.21.200064.9210 9210 72,927 0.1019% 3,087 0.0220% 122 0.0006% 0.0415%Capital Services, LLC 0089 302163 F.03.22.200064.9210 9210 214,824 0.3000% - 0.0000% 94 0.0004% 0.1002%Xcel Energy Investments LLC 0092 302240 F.03.23.200064.9210 9210 472 0.0007% - 0.0000% 23 0.0001% 0.0003%Total 71,597,748$ 100.0000% 14,022,485$ 100.0000% 21,795,345 100.0000% 100.0000%
Allocation Changes: Prepared By Reviewed By Approved By Eff. Date
Updated Statistics
Erika Moeller Audra Lake Ross Baumgarten 4/1/2020

Northern States Power Company
XES Allocation Statistics Using FTE Hours2021 Test Year Budget
200065 Docket No. E002/GR-20-723Exhibit___(RLB-1), Schedule 5(a)
Page 3 of 117
Investor Relations - Corporate GovernanceSAP ACC 200065 (116)SCB003
Legal Entity CompanyCost
Center FERCLETFERC
Account Total Assets
$000's %Revenues
$000's % FTE Hours %Allocation
%NSPM 0010 301467 F.03.01.200065.9210 9210 22,468,670$ 31.3818% 5,240,697$ 37.3735% 9,713,752 44.5680% 37.7744%NSPW 0011 301471 F.03.02.200065.9210 9210 2,887,050 4.0323% 981,344 6.9984% 1,636,749 7.5096% 6.1801%PSCo 0012 301475 F.03.03.200065.9210 9210 19,541,229 27.2931% 4,614,346 32.9068% 7,209,812 33.0796% 31.0931%SPS 0013 301476 F.03.04.200065.9210 9210 7,982,885 11.1496% 1,826,207 13.0234% 3,227,597 14.8087% 12.9939%Eloigne 0015 300009 F.03.05.200065.9210 9210 127,927 0.1787% 9,991 0.0712% 622 0.0029% 0.0843%Reddy Kilowatt 0017 300010 F.03.06.200065.9210 9210 2,901 0.0041% - 0.0000% 0 0.0000% 0.0014%United Power & Land 0019 300012 F.03.07.200065.9210 9210 1,131 0.0016% 24 0.0002% 54 0.0002% 0.0007%Xcel Energy 0023 300014 F.03.08.200065.9210 9210 18,048,786 25.2086% 1,341,300 9.5654% 682 0.0031% 11.5924%1480 Welton 0029 300020 F.03.09.200065.9210 9210 12,090 0.0169% 4,452 0.0317% 18 0.0001% 0.0162%Xcel Energy WYCO Inc. 0038 300025 F.03.10.200065.9210 9210 177,375 0.2477% - 0.0000% 163 0.0007% 0.0828%PSR Investments 0041 300026 F.03.11.200065.9210 9210 9,445 0.0132% - 0.0000% 16 0.0001% 0.0044%WGI 0043 300027 F.03.12.200065.9210 9210 929 0.0013% 147 0.0010% 163 0.0008% 0.0010%Xcel Energy Performance Contracting 0051 300029 F.03.13.200065.9210 9210 468 0.0007% - 0.0000% 37 0.0002% 0.0003%Chippewa Flambeau 0057 300031 F.03.14.200065.9210 9210 944 0.0013% 641 0.0046% 5,141 0.0236% 0.0098%Clearwater 0058 300032 F.03.15.200065.9210 9210 3,032 0.0042% 249 0.0018% 90 0.0004% 0.0021%NSP Lands 0059 300033 F.03.16.200065.9210 9210 49 0.0001% - 0.0000% 14 0.0001% 0.0000%Xcel Energy Transmission Holding Co 0075 300039 F.03.17.200065.9210 9210 242 0.0003% - 0.0000% 33 0.0002% 0.0002%Xcel Energy Transmission Development Co 0076 300040 F.03.18.200065.9210 9210 94 0.0001% - 0.0000% 113 0.0005% 0.0002%Xcel Energy Southwest Transmission Co 0077 300041 F.03.19.200065.9210 9210 151 0.0002% - 0.0000% 18 0.0001% 0.0001%Energy Impact Fund Investments LLC 0086 302160 F.03.20.200065.9210 9210 44,127 0.0616% - 0.0000% 30 0.0001% 0.0206%Nicollet Projects I LLC 0088 302162 F.03.21.200065.9210 9210 72,927 0.1019% 3,087 0.0220% 122 0.0006% 0.0415%Capital Services, LLC 0089 302163 F.03.22.200065.9210 9210 214,824 0.3000% - 0.0000% 94 0.0004% 0.1002%Xcel Energy Investments LLC 0092 302240 F.03.23.200065.9210 9210 472 0.0007% - 0.0000% 23 0.0001% 0.0003%Total 71,597,748$ 100.0000% 14,022,485$ 100.0000% 21,795,345 100.0000% 100.0000%
Allocation Changes: Prepared By Reviewed By Approved By Eff. Date
Updated Statistics
Erika Moeller Audra Lake Ross Baumgarten 4/1/2020

Northern States Power Company
XES Allocation Statistics Using FTE Hours2021 Test Year Budget
200066 Docket No. E002/GR-20-723Exhibit___(RLB-1), Schedule 5(a)
Page 4 of 117
Accounting, Reporting & Tax - Corporate GovernanceSAP ACC 200066 (121)SCB004
Legal Entity CompanyCost
Center FERCLETFERC
Account Total Assets
$000's %Revenues
$000's % FTE Hours %Allocation
%NSPM 0010 301683 F.03.01.200066.9210 9210 22,468,670$ 31.3818% 5,240,697$ 37.3735% 9,713,752 44.5680% 37.7744%NSPW 0011 301684 F.03.02.200066.9210 9210 2,887,050 4.0323% 981,344 6.9984% 1,636,749 7.5096% 6.1801%PSCo 0012 301685 F.03.03.200066.9210 9210 19,541,229 27.2931% 4,614,346 32.9068% 7,209,812 33.0796% 31.0931%SPS 0013 301476 F.03.04.200066.9210 9210 7,982,885 11.1496% 1,826,207 13.0234% 3,227,597 14.8087% 12.9939%Eloigne 0015 300009 F.03.05.200066.9210 9210 127,927 0.1787% 9,991 0.0712% 622 0.0029% 0.0843%Reddy Kilowatt 0017 300010 F.03.06.200066.9210 9210 2,901 0.0041% - 0.0000% 0 0.0000% 0.0014%United Power & Land 0019 300012 F.03.07.200066.9210 9210 1,131 0.0016% 24 0.0002% 54 0.0002% 0.0007%Xcel Energy 0023 300014 F.03.08.200066.9210 9210 18,048,786 25.2086% 1,341,300 9.5654% 682 0.0031% 11.5924%1480 Welton 0029 300020 F.03.09.200066.9210 9210 12,090 0.0169% 4,452 0.0317% 18 0.0001% 0.0162%Xcel Energy WYCO Inc. 0038 300025 F.03.10.200066.9210 9210 177,375 0.2477% - 0.0000% 163 0.0007% 0.0828%PSR Investments 0041 300026 F.03.11.200066.9210 9210 9,445 0.0132% - 0.0000% 16 0.0001% 0.0044%WGI 0043 300027 F.03.12.200066.9210 9210 929 0.0013% 147 0.0010% 163 0.0008% 0.0010%Xcel Energy Performance Contracting 0051 300029 F.03.13.200066.9210 9210 468 0.0007% - 0.0000% 37 0.0002% 0.0003%Chippewa Flambeau 0057 300031 F.03.14.200066.9210 9210 944 0.0013% 641 0.0046% 5,141 0.0236% 0.0098%Clearwater 0058 300032 F.03.15.200066.9210 9210 3,032 0.0042% 249 0.0018% 90 0.0004% 0.0021%NSP Lands 0059 300033 F.03.16.200066.9210 9210 49 0.0001% - 0.0000% 14 0.0001% 0.0000%Xcel Energy Transmission Holding Co 0075 300039 F.03.17.200066.9210 9210 242 0.0003% - 0.0000% 33 0.0002% 0.0002%Xcel Energy Transmission Development Co 0076 300040 F.03.18.200066.9210 9210 94 0.0001% - 0.0000% 113 0.0005% 0.0002%Xcel Energy Southwest Transmission Co 0077 300041 F.03.19.200066.9210 9210 151 0.0002% - 0.0000% 18 0.0001% 0.0001%Energy Impact Fund Investments LLC 0086 302160 F.03.20.200066.9210 9210 44,127 0.0616% - 0.0000% 30 0.0001% 0.0206%Nicollet Projects I LLC 0088 302162 F.03.21.200066.9210 9210 72,927 0.1019% 3,087 0.0220% 122 0.0006% 0.0415%Capital Services, LLC 0089 302163 F.03.22.200066.9210 9210 214,824 0.3000% - 0.0000% 94 0.0004% 0.1002%Xcel Energy Investments LLC 0092 302240 F.03.23.200066.9210 9210 472 0.0007% - 0.0000% 23 0.0001% 0.0003%Total 71,597,748$ 100.0000% 14,022,485$ 100.0000% 21,795,345 100.0000% 100.0000%
Allocation Changes: Prepared By Reviewed By Approved By Eff. Date
Updated Statistics
Erika Moeller Audra Lake Ross Baumgarten 4/1/2020
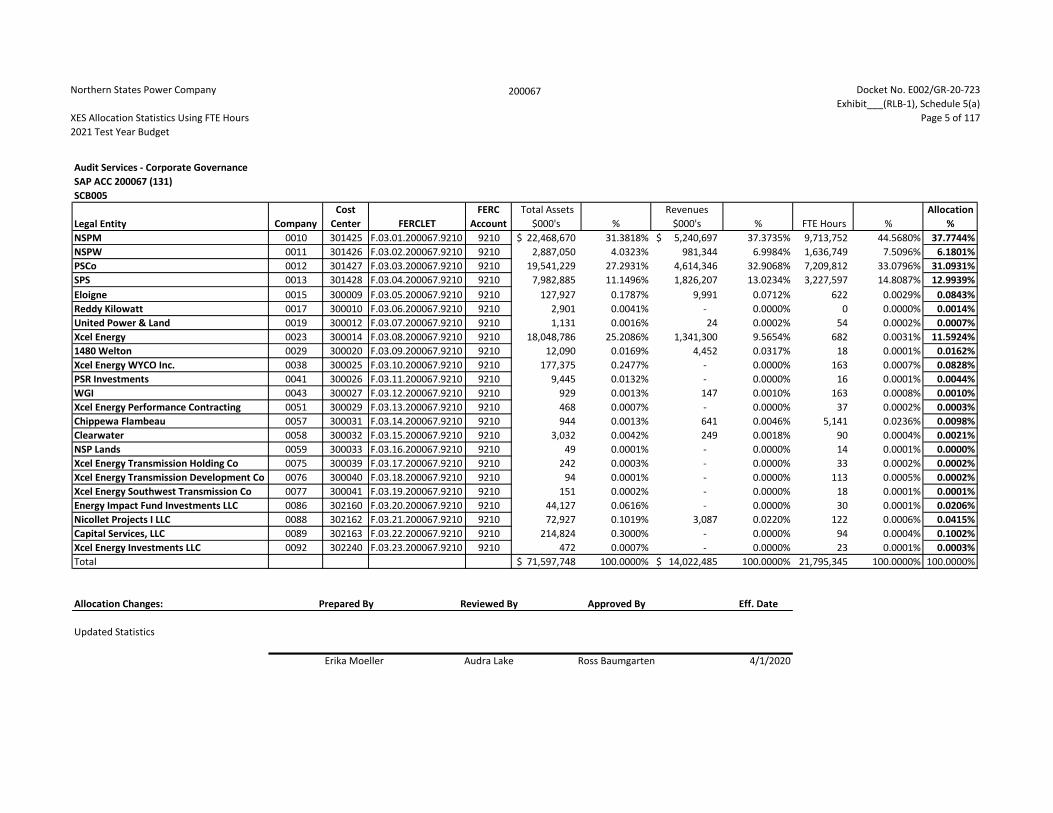
Northern States Power Company
XES Allocation Statistics Using FTE Hours2021 Test Year Budget
200067 Docket No. E002/GR-20-723Exhibit___(RLB-1), Schedule 5(a)
Page 5 of 117
Audit Services - Corporate GovernanceSAP ACC 200067 (131)SCB005
Legal Entity Company
Cost
Center FERCLETFERC
Account Total Assets
$000's %
Revenues
$000's % FTE Hours %Allocation
%NSPM 0010 301425 F.03.01.200067.9210 9210 22,468,670$ 31.3818% 5,240,697$ 37.3735% 9,713,752 44.5680% 37.7744%NSPW 0011 301426 F.03.02.200067.9210 9210 2,887,050 4.0323% 981,344 6.9984% 1,636,749 7.5096% 6.1801%PSCo 0012 301427 F.03.03.200067.9210 9210 19,541,229 27.2931% 4,614,346 32.9068% 7,209,812 33.0796% 31.0931%SPS 0013 301428 F.03.04.200067.9210 9210 7,982,885 11.1496% 1,826,207 13.0234% 3,227,597 14.8087% 12.9939%Eloigne 0015 300009 F.03.05.200067.9210 9210 127,927 0.1787% 9,991 0.0712% 622 0.0029% 0.0843%Reddy Kilowatt 0017 300010 F.03.06.200067.9210 9210 2,901 0.0041% - 0.0000% 0 0.0000% 0.0014%United Power & Land 0019 300012 F.03.07.200067.9210 9210 1,131 0.0016% 24 0.0002% 54 0.0002% 0.0007%Xcel Energy 0023 300014 F.03.08.200067.9210 9210 18,048,786 25.2086% 1,341,300 9.5654% 682 0.0031% 11.5924%1480 Welton 0029 300020 F.03.09.200067.9210 9210 12,090 0.0169% 4,452 0.0317% 18 0.0001% 0.0162%Xcel Energy WYCO Inc. 0038 300025 F.03.10.200067.9210 9210 177,375 0.2477% - 0.0000% 163 0.0007% 0.0828%PSR Investments 0041 300026 F.03.11.200067.9210 9210 9,445 0.0132% - 0.0000% 16 0.0001% 0.0044%WGI 0043 300027 F.03.12.200067.9210 9210 929 0.0013% 147 0.0010% 163 0.0008% 0.0010%Xcel Energy Performance Contracting 0051 300029 F.03.13.200067.9210 9210 468 0.0007% - 0.0000% 37 0.0002% 0.0003%Chippewa Flambeau 0057 300031 F.03.14.200067.9210 9210 944 0.0013% 641 0.0046% 5,141 0.0236% 0.0098%Clearwater 0058 300032 F.03.15.200067.9210 9210 3,032 0.0042% 249 0.0018% 90 0.0004% 0.0021%NSP Lands 0059 300033 F.03.16.200067.9210 9210 49 0.0001% - 0.0000% 14 0.0001% 0.0000%Xcel Energy Transmission Holding Co 0075 300039 F.03.17.200067.9210 9210 242 0.0003% - 0.0000% 33 0.0002% 0.0002%Xcel Energy Transmission Development Co 0076 300040 F.03.18.200067.9210 9210 94 0.0001% - 0.0000% 113 0.0005% 0.0002%Xcel Energy Southwest Transmission Co 0077 300041 F.03.19.200067.9210 9210 151 0.0002% - 0.0000% 18 0.0001% 0.0001%Energy Impact Fund Investments LLC 0086 302160 F.03.20.200067.9210 9210 44,127 0.0616% - 0.0000% 30 0.0001% 0.0206%Nicollet Projects I LLC 0088 302162 F.03.21.200067.9210 9210 72,927 0.1019% 3,087 0.0220% 122 0.0006% 0.0415%Capital Services, LLC 0089 302163 F.03.22.200067.9210 9210 214,824 0.3000% - 0.0000% 94 0.0004% 0.1002%Xcel Energy Investments LLC 0092 302240 F.03.23.200067.9210 9210 472 0.0007% - 0.0000% 23 0.0001% 0.0003%Total 71,597,748$ 100.0000% 14,022,485$ 100.0000% 21,795,345 100.0000% 100.0000%
Allocation Changes: Prepared By Reviewed By Approved By Eff. Date
Updated Statistics
Erika Moeller Audra Lake Ross Baumgarten 4/1/2020

Northern States Power Company
XES Allocation Statistics Using FTE Hours2021 Test Year Budget
200068 Docket No. E002/GR-20-723Exhibit___(RLB-1), Schedule 5(a)
Page 6 of 117
Corporate Finance, Treasury & Cash Management - Corporate GovernanceSAP ACC 200068 (141)SCB006
Legal Entity Company
Cost
Center FERCLETFERC
Account Total Assets
$000's %
Revenues
$000's % FTE Hours %Allocation
%NSPM 0010 301441 F.03.01.200068.9210 9210 22,468,670$ 31.3818% 5,240,697$ 37.3735% 9,713,752 44.5680% 37.7744%NSPW 0011 301442 F.03.02.200068.9210 9210 2,887,050 4.0323% 981,344 6.9984% 1,636,749 7.5096% 6.1801%PSCo 0012 301443 F.03.03.200068.9210 9210 19,541,229 27.2931% 4,614,346 32.9068% 7,209,812 33.0796% 31.0931%SPS 0013 301444 F.03.04.200068.9210 9210 7,982,885 11.1496% 1,826,207 13.0234% 3,227,597 14.8087% 12.9939%Eloigne 0015 300009 F.03.05.200068.9210 9210 127,927 0.1787% 9,991 0.0712% 622 0.0029% 0.0843%Reddy Kilowatt 0017 300010 F.03.06.200068.9210 9210 2,901 0.0041% - 0.0000% 0 0.0000% 0.0014%United Power & Land 0019 300012 F.03.07.200068.9210 9210 1,131 0.0016% 24 0.0002% 54 0.0002% 0.0007%Xcel Energy 0023 300014 F.03.08.200068.9210 9210 18,048,786 25.2086% 1,341,300 9.5654% 682 0.0031% 11.5924%1480 Welton 0029 300020 F.03.09.200068.9210 9210 12,090 0.0169% 4,452 0.0317% 18 0.0001% 0.0162%Xcel Energy WYCO Inc. 0038 300025 F.03.10.200068.9210 9210 177,375 0.2477% - 0.0000% 163 0.0007% 0.0828%PSR Investments 0041 300026 F.03.11.200068.9210 9210 9,445 0.0132% - 0.0000% 16 0.0001% 0.0044%WGI 0043 300027 F.03.12.200068.9210 9210 929 0.0013% 147 0.0010% 163 0.0008% 0.0010%Xcel Energy Performance Contracting 0051 300029 F.03.13.200068.9210 9210 468 0.0007% - 0.0000% 37 0.0002% 0.0003%Chippewa Flambeau 0057 300031 F.03.14.200068.9210 9210 944 0.0013% 641 0.0046% 5,141 0.0236% 0.0098%Clearwater 0058 300032 F.03.15.200068.9210 9210 3,032 0.0042% 249 0.0018% 90 0.0004% 0.0021%NSP Lands 0059 300033 F.03.16.200068.9210 9210 49 0.0001% - 0.0000% 14 0.0001% 0.0000%Xcel Energy Transmission Holding Co 0075 300039 F.03.17.200068.9210 9210 242 0.0003% - 0.0000% 33 0.0002% 0.0002%Xcel Energy Transmission Development Co 0076 300040 F.03.18.200068.9210 9210 94 0.0001% - 0.0000% 113 0.0005% 0.0002%Xcel Energy Southwest Transmission Co 0077 300041 F.03.19.200068.9210 9210 151 0.0002% - 0.0000% 18 0.0001% 0.0001%Energy Impact Fund Investments LLC 0086 302160 F.03.20.200068.9210 9210 44,127 0.0616% - 0.0000% 30 0.0001% 0.0206%Nicollet Projects I LLC 0088 302162 F.03.21.200068.9210 9210 72,927 0.1019% 3,087 0.0220% 122 0.0006% 0.0415%Capital Services, LLC 0089 302163 F.03.22.200068.9210 9210 214,824 0.3000% - 0.0000% 94 0.0004% 0.1002%Xcel Energy Investments LLC 0092 302240 F.03.23.200068.9210 9210 472 0.0007% - 0.0000% 23 0.0001% 0.0003%Total 71,597,748$ 100.0000% 14,022,485$ 100.0000% 21,795,345 100.0000% 100.0000%
Allocation Changes: Prepared By Reviewed By Approved By Eff. Date
Updated Statistics
Erika Moeller Audra Lake Ross Baumgarten 4/1/2020

Northern States Power Company
XES Allocation Statistics Using FTE Hours2021 Test Year Budget
200069 Docket No. E002/GR-20-723Exhibit___(RLB-1), Schedule 5(a)
Page 7 of 117
Risk Management - Corporate GovernanceSAP ACC 200069 (143)SCB007
Legal Entity Company
Cost
Center FERCLETFERC
Account Total Assets
$000's %
Revenues
$000's % FTE Hours %Allocation
%NSPM 0010 301477 F.03.01.200069.9210 9210 22,468,670$ 31.3818% 5,240,697$ 37.3735% 9,713,752 44.5680% 37.7744%NSPW 0011 301478 F.03.02.200069.9210 9210 2,887,050 4.0323% 981,344 6.9984% 1,636,749 7.5096% 6.1801%PSCo 0012 301479 F.03.03.200069.9210 9210 19,541,229 27.2931% 4,614,346 32.9068% 7,209,812 33.0796% 31.0931%SPS 0013 301480 F.03.04.200069.9210 9210 7,982,885 11.1496% 1,826,207 13.0234% 3,227,597 14.8087% 12.9939%Eloigne 0015 300009 F.03.05.200069.9210 9210 127,927 0.1787% 9,991 0.0712% 622 0.0029% 0.0843%Reddy Kilowatt 0017 300010 F.03.06.200069.9210 9210 2,901 0.0041% - 0.0000% 0 0.0000% 0.0014%United Power & Land 0019 300012 F.03.07.200069.9210 9210 1,131 0.0016% 24 0.0002% 54 0.0002% 0.0007%Xcel Energy 0023 300014 F.03.08.200069.9210 9210 18,048,786 25.2086% 1,341,300 9.5654% 682 0.0031% 11.5924%1480 Welton 0029 300020 F.03.09.200069.9210 9210 12,090 0.0169% 4,452 0.0317% 18 0.0001% 0.0162%Xcel Energy WYCO Inc. 0038 300025 F.03.10.200069.9210 9210 177,375 0.2477% - 0.0000% 163 0.0007% 0.0828%PSR Investments 0041 300026 F.03.11.200069.9210 9210 9,445 0.0132% - 0.0000% 16 0.0001% 0.0044%WGI 0043 300027 F.03.12.200069.9210 9210 929 0.0013% 147 0.0010% 163 0.0008% 0.0010%Xcel Energy Performance Contracting 0051 300029 F.03.13.200069.9210 9210 468 0.0007% - 0.0000% 37 0.0002% 0.0003%Chippewa Flambeau 0057 300031 F.03.14.200069.9210 9210 944 0.0013% 641 0.0046% 5,141 0.0236% 0.0098%Clearwater 0058 300032 F.03.15.200069.9210 9210 3,032 0.0042% 249 0.0018% 90 0.0004% 0.0021%NSP Lands 0059 300033 F.03.16.200069.9210 9210 49 0.0001% - 0.0000% 14 0.0001% 0.0000%Xcel Energy Transmission Holding Co 0075 300039 F.03.17.200069.9210 9210 242 0.0003% - 0.0000% 33 0.0002% 0.0002%Xcel Energy Transmission Development Co 0076 300040 F.03.18.200069.9210 9210 94 0.0001% - 0.0000% 113 0.0005% 0.0002%Xcel Energy Southwest Transmission Co 0077 300041 F.03.19.200069.9210 9210 151 0.0002% - 0.0000% 18 0.0001% 0.0001%Energy Impact Fund Investments LLC 0086 302160 F.03.20.200069.9210 9210 44,127 0.0616% - 0.0000% 30 0.0001% 0.0206%Nicollet Projects I LLC 0088 302162 F.03.21.200069.9210 9210 72,927 0.1019% 3,087 0.0220% 122 0.0006% 0.0415%Capital Services, LLC 0089 302163 F.03.22.200069.9210 9210 214,824 0.3000% - 0.0000% 94 0.0004% 0.1002%Xcel Energy Investments LLC 0092 302240 F.03.23.200069.9210 9210 472 0.0007% - 0.0000% 23 0.0001% 0.0003%Total 71,597,748$ 100.0000% 14,022,485$ 100.0000% 21,795,345 100.0000% 100.0000%
Allocation Changes: Prepared By Reviewed By Approved By Eff. Date
Updated Statistics
Erika Moeller Audra Lake Ross Baumgarten 4/1/2020
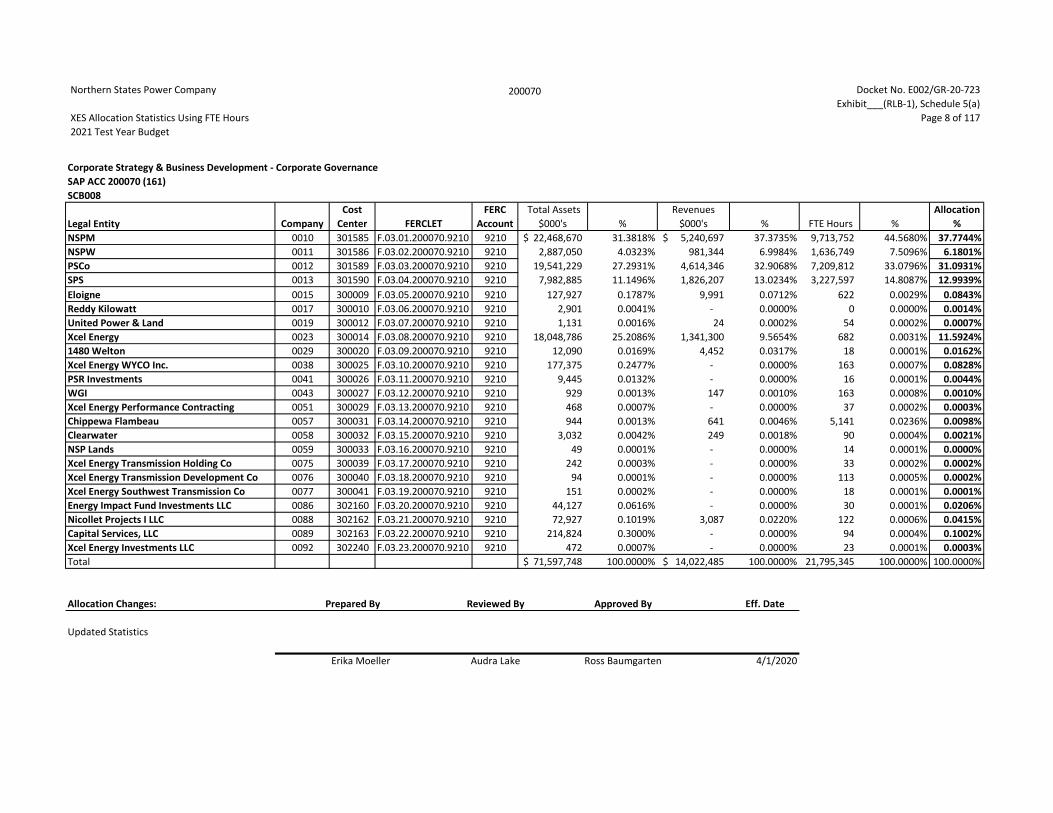
Northern States Power Company
XES Allocation Statistics Using FTE Hours2021 Test Year Budget
200070 Docket No. E002/GR-20-723Exhibit___(RLB-1), Schedule 5(a)
Page 8 of 117
Corporate Strategy & Business Development - Corporate GovernanceSAP ACC 200070 (161)SCB008
Legal Entity Company
Cost
Center FERCLETFERC
Account Total Assets
$000's %
Revenues
$000's % FTE Hours %Allocation
%NSPM 0010 301585 F.03.01.200070.9210 9210 22,468,670$ 31.3818% 5,240,697$ 37.3735% 9,713,752 44.5680% 37.7744%NSPW 0011 301586 F.03.02.200070.9210 9210 2,887,050 4.0323% 981,344 6.9984% 1,636,749 7.5096% 6.1801%PSCo 0012 301589 F.03.03.200070.9210 9210 19,541,229 27.2931% 4,614,346 32.9068% 7,209,812 33.0796% 31.0931%SPS 0013 301590 F.03.04.200070.9210 9210 7,982,885 11.1496% 1,826,207 13.0234% 3,227,597 14.8087% 12.9939%Eloigne 0015 300009 F.03.05.200070.9210 9210 127,927 0.1787% 9,991 0.0712% 622 0.0029% 0.0843%Reddy Kilowatt 0017 300010 F.03.06.200070.9210 9210 2,901 0.0041% - 0.0000% 0 0.0000% 0.0014%United Power & Land 0019 300012 F.03.07.200070.9210 9210 1,131 0.0016% 24 0.0002% 54 0.0002% 0.0007%Xcel Energy 0023 300014 F.03.08.200070.9210 9210 18,048,786 25.2086% 1,341,300 9.5654% 682 0.0031% 11.5924%1480 Welton 0029 300020 F.03.09.200070.9210 9210 12,090 0.0169% 4,452 0.0317% 18 0.0001% 0.0162%Xcel Energy WYCO Inc. 0038 300025 F.03.10.200070.9210 9210 177,375 0.2477% - 0.0000% 163 0.0007% 0.0828%PSR Investments 0041 300026 F.03.11.200070.9210 9210 9,445 0.0132% - 0.0000% 16 0.0001% 0.0044%WGI 0043 300027 F.03.12.200070.9210 9210 929 0.0013% 147 0.0010% 163 0.0008% 0.0010%Xcel Energy Performance Contracting 0051 300029 F.03.13.200070.9210 9210 468 0.0007% - 0.0000% 37 0.0002% 0.0003%Chippewa Flambeau 0057 300031 F.03.14.200070.9210 9210 944 0.0013% 641 0.0046% 5,141 0.0236% 0.0098%Clearwater 0058 300032 F.03.15.200070.9210 9210 3,032 0.0042% 249 0.0018% 90 0.0004% 0.0021%NSP Lands 0059 300033 F.03.16.200070.9210 9210 49 0.0001% - 0.0000% 14 0.0001% 0.0000%Xcel Energy Transmission Holding Co 0075 300039 F.03.17.200070.9210 9210 242 0.0003% - 0.0000% 33 0.0002% 0.0002%Xcel Energy Transmission Development Co 0076 300040 F.03.18.200070.9210 9210 94 0.0001% - 0.0000% 113 0.0005% 0.0002%Xcel Energy Southwest Transmission Co 0077 300041 F.03.19.200070.9210 9210 151 0.0002% - 0.0000% 18 0.0001% 0.0001%Energy Impact Fund Investments LLC 0086 302160 F.03.20.200070.9210 9210 44,127 0.0616% - 0.0000% 30 0.0001% 0.0206%Nicollet Projects I LLC 0088 302162 F.03.21.200070.9210 9210 72,927 0.1019% 3,087 0.0220% 122 0.0006% 0.0415%Capital Services, LLC 0089 302163 F.03.22.200070.9210 9210 214,824 0.3000% - 0.0000% 94 0.0004% 0.1002%Xcel Energy Investments LLC 0092 302240 F.03.23.200070.9210 9210 472 0.0007% - 0.0000% 23 0.0001% 0.0003%Total 71,597,748$ 100.0000% 14,022,485$ 100.0000% 21,795,345 100.0000% 100.0000%
Allocation Changes: Prepared By Reviewed By Approved By Eff. Date
Updated Statistics
Erika Moeller Audra Lake Ross Baumgarten 4/1/2020

Northern States Power Company
XES Allocation Statistics Using FTE Hours2021 Test Year Budget
200071 Docket No. E002/GR-20-723Exhibit___(RLB-1), Schedule 5(a)
Page 9 of 117
Legal - Corporate GovernanceSAP ACC 200071 (171)SCB009
Legal Entity Company
Cost
Center FERCLETFERC
Account Total Assets
$000's %
Revenues
$000's % FTE Hours %Allocation
%NSPM 0010 301563 F.03.01.200071.9210 9210 22,468,670$ 31.3818% 5,240,697$ 37.3735% 9,713,752 44.5680% 37.7744%NSPW 0011 302044 F.03.02.200071.9210 9210 2,887,050 4.0323% 981,344 6.9984% 1,636,749 7.5096% 6.1801%PSCo 0012 300388 F.03.03.200071.9210 9210 19,541,229 27.2931% 4,614,346 32.9068% 7,209,812 33.0796% 31.0931%SPS 0013 300390 F.03.04.200071.9210 9210 7,982,885 11.1496% 1,826,207 13.0234% 3,227,597 14.8087% 12.9939%Eloigne 0015 300009 F.03.05.200071.9210 9210 127,927 0.1787% 9,991 0.0712% 622 0.0029% 0.0843%Reddy Kilowatt 0017 300010 F.03.06.200071.9210 9210 2,901 0.0041% - 0.0000% 0 0.0000% 0.0014%United Power & Land 0019 300012 F.03.07.200071.9210 9210 1,131 0.0016% 24 0.0002% 54 0.0002% 0.0007%Xcel Energy 0023 300014 F.03.08.200071.9210 9210 18,048,786 25.2086% 1,341,300 9.5654% 682 0.0031% 11.5924%1480 Welton 0029 300020 F.03.09.200071.9210 9210 12,090 0.0169% 4,452 0.0317% 18 0.0001% 0.0162%Xcel Energy WYCO Inc. 0038 300025 F.03.10.200071.9210 9210 177,375 0.2477% - 0.0000% 163 0.0007% 0.0828%PSR Investments 0041 300026 F.03.11.200071.9210 9210 9,445 0.0132% - 0.0000% 16 0.0001% 0.0044%WGI 0043 300027 F.03.12.200071.9210 9210 929 0.0013% 147 0.0010% 163 0.0008% 0.0010%Xcel Energy Performance Contracting 0051 300029 F.03.13.200071.9210 9210 468 0.0007% - 0.0000% 37 0.0002% 0.0003%Chippewa Flambeau 0057 300031 F.03.14.200071.9210 9210 944 0.0013% 641 0.0046% 5,141 0.0236% 0.0098%Clearwater 0058 300032 F.03.15.200071.9210 9210 3,032 0.0042% 249 0.0018% 90 0.0004% 0.0021%NSP Lands 0059 300033 F.03.16.200071.9210 9210 49 0.0001% - 0.0000% 14 0.0001% 0.0000%Xcel Energy Transmission Holding Co 0075 300039 F.03.17.200071.9210 9210 242 0.0003% - 0.0000% 33 0.0002% 0.0002%Xcel Energy Transmission Development Co 0076 300040 F.03.18.200071.9210 9210 94 0.0001% - 0.0000% 113 0.0005% 0.0002%Xcel Energy Southwest Transmission Co 0077 300041 F.03.19.200071.9210 9210 151 0.0002% - 0.0000% 18 0.0001% 0.0001%Energy Impact Fund Investments LLC 0086 302160 F.03.20.200071.9210 9210 44,127 0.0616% - 0.0000% 30 0.0001% 0.0206%Nicollet Projects I LLC 0088 302162 F.03.21.200071.9210 9210 72,927 0.1019% 3,087 0.0220% 122 0.0006% 0.0415%Capital Services, LLC 0089 302163 F.03.22.200071.9210 9210 214,824 0.3000% - 0.0000% 94 0.0004% 0.1002%Xcel Energy Investments LLC 0092 302240 F.03.23.200071.9210 9210 472 0.0007% - 0.0000% 23 0.0001% 0.0003%Total 71,597,748$ 100.0000% 14,022,485$ 100.0000% 21,795,345 100.0000% 100.0000%
Allocation Changes: Prepared By Reviewed By Approved By Eff. Date
Updated Statistics
Erika Moeller Audra Lake Ross Baumgarten 4/1/2020

Northern States Power Company
XES Allocation Statistics Using FTE Hours2021 Test Year Budget
200072 Docket No. E002/GR-20-723Exhibit___(RLB-1), Schedule 5(a)
Page 10 of 117
Communications - Corporate GovernanceSAP ACC 200072 (180)SCB010
Legal Entity Company
Cost
Center FERCLETFERC
Account Total Assets
$000's %
Revenues
$000's % FTE Hours %Allocation
%NSPM 0010 300788 F.03.01.200072.9210 9210 22,468,670$ 31.3818% 5,240,697$ 37.3735% 9,713,752 44.5680% 37.7744%NSPW 0011 300791 F.03.02.200072.9210 9210 2,887,050 4.0323% 981,344 6.9984% 1,636,749 7.5096% 6.1801%PSCo 0012 300794 F.03.03.200072.9210 9210 19,541,229 27.2931% 4,614,346 32.9068% 7,209,812 33.0796% 31.0931%SPS 0013 300795 F.03.04.200072.9210 9210 7,982,885 11.1496% 1,826,207 13.0234% 3,227,597 14.8087% 12.9939%Eloigne 0015 300009 F.03.05.200072.9210 9210 127,927 0.1787% 9,991 0.0712% 622 0.0029% 0.0843%Reddy Kilowatt 0017 300010 F.03.06.200072.9210 9210 2,901 0.0041% - 0.0000% 0 0.0000% 0.0014%United Power & Land 0019 300012 F.03.07.200072.9210 9210 1,131 0.0016% 24 0.0002% 54 0.0002% 0.0007%Xcel Energy 0023 300014 F.03.08.200072.9210 9210 18,048,786 25.2086% 1,341,300 9.5654% 682 0.0031% 11.5924%1480 Welton 0029 300020 F.03.09.200072.9210 9210 12,090 0.0169% 4,452 0.0317% 18 0.0001% 0.0162%Xcel Energy WYCO Inc. 0038 300025 F.03.10.200072.9210 9210 177,375 0.2477% - 0.0000% 163 0.0007% 0.0828%PSR Investments 0041 300026 F.03.11.200072.9210 9210 9,445 0.0132% - 0.0000% 16 0.0001% 0.0044%WGI 0043 300027 F.03.12.200072.9210 9210 929 0.0013% 147 0.0010% 163 0.0008% 0.0010%Xcel Energy Performance Contracting 0051 300029 F.03.13.200072.9210 9210 468 0.0007% - 0.0000% 37 0.0002% 0.0003%Chippewa Flambeau 0057 300031 F.03.14.200072.9210 9210 944 0.0013% 641 0.0046% 5,141 0.0236% 0.0098%Clearwater 0058 300032 F.03.15.200072.9210 9210 3,032 0.0042% 249 0.0018% 90 0.0004% 0.0021%NSP Lands 0059 300033 F.03.16.200072.9210 9210 49 0.0001% - 0.0000% 14 0.0001% 0.0000%Xcel Energy Transmission Holding Co 0075 300039 F.03.17.200072.9210 9210 242 0.0003% - 0.0000% 33 0.0002% 0.0002%Xcel Energy Transmission Development Co 0076 300040 F.03.18.200072.9210 9210 94 0.0001% - 0.0000% 113 0.0005% 0.0002%Xcel Energy Southwest Transmission Co 0077 300041 F.03.19.200072.9210 9210 151 0.0002% - 0.0000% 18 0.0001% 0.0001%Energy Impact Fund Investments LLC 0086 302160 F.03.20.200072.9210 9210 44,127 0.0616% - 0.0000% 30 0.0001% 0.0206%Nicollet Projects I LLC 0088 302162 F.03.21.200072.9210 9210 72,927 0.1019% 3,087 0.0220% 122 0.0006% 0.0415%Capital Services, LLC 0089 302163 F.03.22.200072.9210 9210 214,824 0.3000% - 0.0000% 94 0.0004% 0.1002%Xcel Energy Investments LLC 0092 302240 F.03.23.200072.9210 9210 472 0.0007% - 0.0000% 23 0.0001% 0.0003%Total 71,597,748$ 100.0000% 14,022,485$ 100.0000% 21,795,345 100.0000% 100.0000%
Allocation Changes: Prepared By Reviewed By Approved By Eff. Date
Updated Statistics
Erika Moeller Audra Lake Ross Baumgarten 4/1/2020

Northern States Power Company
XES Allocation Statistics Using FTE Hours2021 Test Year Budget
200073 Docket No. E002/GR-20-723Exhibit___(RLB-1), Schedule 5(a)
Page 11 of 117
Human Resources - Corporate GovernanceSAP ACC 200073 (189)SCB011
Legal Entity CompanyCost
Center FERCLETFERC
Account Total Assets
$000's %Revenues
$000's % FTE Hours %Allocation
%NSPM 0010 300416 F.03.01.200073.9210 9210 22,468,670$ 31.3818% 5,240,697$ 37.3735% 9,713,752 44.5680% 37.7744%NSPW 0011 300419 F.03.02.200073.9210 9210 2,887,050 4.0323% 981,344 6.9984% 1,636,749 7.5096% 6.1801%PSCo 0012 300422 F.03.03.200073.9210 9210 19,541,229 27.2931% 4,614,346 32.9068% 7,209,812 33.0796% 31.0931%SPS 0013 300423 F.03.04.200073.9210 9210 7,982,885 11.1496% 1,826,207 13.0234% 3,227,597 14.8087% 12.9939%Eloigne 0015 300009 F.03.05.200073.9210 9210 127,927 0.1787% 9,991 0.0712% 622 0.0029% 0.0843%Reddy Kilowatt 0017 300010 F.03.06.200073.9210 9210 2,901 0.0041% - 0.0000% 0 0.0000% 0.0014%United Power & Land 0019 300012 F.03.07.200073.9210 9210 1,131 0.0016% 24 0.0002% 54 0.0002% 0.0007%Xcel Energy 0023 300014 F.03.08.200073.9210 9210 18,048,786 25.2086% 1,341,300 9.5654% 682 0.0031% 11.5924%1480 Welton 0029 300020 F.03.09.200073.9210 9210 12,090 0.0169% 4,452 0.0317% 18 0.0001% 0.0162%Xcel Energy WYCO Inc. 0038 300025 F.03.10.200073.9210 9210 177,375 0.2477% - 0.0000% 163 0.0007% 0.0828%PSR Investments 0041 300026 F.03.11.200073.9210 9210 9,445 0.0132% - 0.0000% 16 0.0001% 0.0044%WGI 0043 300027 F.03.12.200073.9210 9210 929 0.0013% 147 0.0010% 163 0.0008% 0.0010%Xcel Energy Performance Contracting 0051 300029 F.03.13.200073.9210 9210 468 0.0007% - 0.0000% 37 0.0002% 0.0003%Chippewa Flambeau 0057 300031 F.03.14.200073.9210 9210 944 0.0013% 641 0.0046% 5,141 0.0236% 0.0098%Clearwater 0058 300032 F.03.15.200073.9210 9210 3,032 0.0042% 249 0.0018% 90 0.0004% 0.0021%NSP Lands 0059 300033 F.03.16.200073.9210 9210 49 0.0001% - 0.0000% 14 0.0001% 0.0000%Xcel Energy Transmission Holding Co 0075 300039 F.03.17.200073.9210 9210 242 0.0003% - 0.0000% 33 0.0002% 0.0002%Xcel Energy Transmission Development Co 0076 300040 F.03.18.200073.9210 9210 94 0.0001% - 0.0000% 113 0.0005% 0.0002%Xcel Energy Southwest Transmission Co 0077 300041 F.03.19.200073.9210 9210 151 0.0002% - 0.0000% 18 0.0001% 0.0001%Energy Impact Fund Investments LLC 0086 302160 F.03.20.200073.9210 9210 44,127 0.0616% - 0.0000% 30 0.0001% 0.0206%Nicollet Projects I LLC 0088 302162 F.03.21.200073.9210 9210 72,927 0.1019% 3,087 0.0220% 122 0.0006% 0.0415%Capital Services, LLC 0089 302163 F.03.22.200073.9210 9210 214,824 0.3000% - 0.0000% 94 0.0004% 0.1002%Xcel Energy Investments LLC 0092 302240 F.03.23.200073.9210 9210 472 0.0007% - 0.0000% 23 0.0001% 0.0003%Total 71,597,748$ 100.0000% 14,022,485$ 100.0000% 21,795,345 100.0000% 100.0000%
Allocation Changes: Prepared By Reviewed By Approved By Eff. Date
Updated Statistics
Erika Moeller Audra Lake Ross Baumgarten 4/1/2020
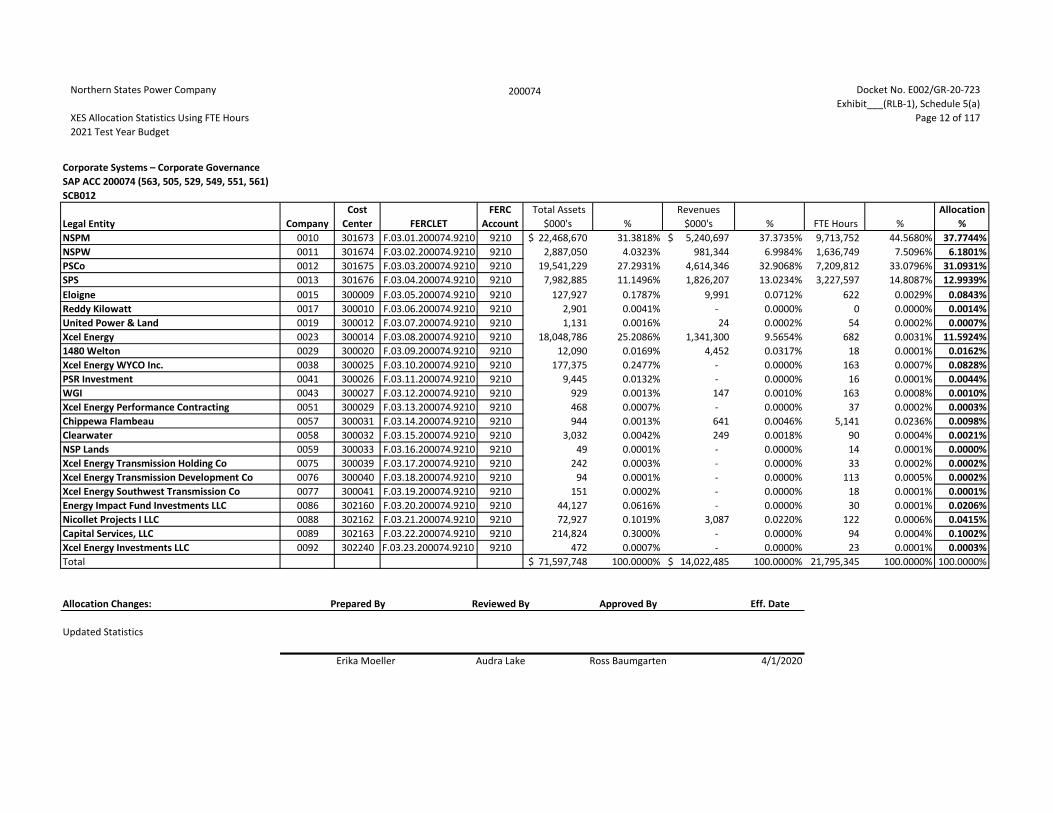
Northern States Power Company
XES Allocation Statistics Using FTE Hours2021 Test Year Budget
200074 Docket No. E002/GR-20-723Exhibit___(RLB-1), Schedule 5(a)
Page 12 of 117
Corporate Systems – Corporate GovernanceSAP ACC 200074 (563, 505, 529, 549, 551, 561)SCB012
Legal Entity Company
Cost
Center FERCLETFERC
Account Total Assets
$000's %
Revenues
$000's % FTE Hours %Allocation
%NSPM 0010 301673 F.03.01.200074.9210 9210 22,468,670$ 31.3818% 5,240,697$ 37.3735% 9,713,752 44.5680% 37.7744%NSPW 0011 301674 F.03.02.200074.9210 9210 2,887,050 4.0323% 981,344 6.9984% 1,636,749 7.5096% 6.1801%PSCo 0012 301675 F.03.03.200074.9210 9210 19,541,229 27.2931% 4,614,346 32.9068% 7,209,812 33.0796% 31.0931%SPS 0013 301676 F.03.04.200074.9210 9210 7,982,885 11.1496% 1,826,207 13.0234% 3,227,597 14.8087% 12.9939%Eloigne 0015 300009 F.03.05.200074.9210 9210 127,927 0.1787% 9,991 0.0712% 622 0.0029% 0.0843%Reddy Kilowatt 0017 300010 F.03.06.200074.9210 9210 2,901 0.0041% - 0.0000% 0 0.0000% 0.0014%United Power & Land 0019 300012 F.03.07.200074.9210 9210 1,131 0.0016% 24 0.0002% 54 0.0002% 0.0007%Xcel Energy 0023 300014 F.03.08.200074.9210 9210 18,048,786 25.2086% 1,341,300 9.5654% 682 0.0031% 11.5924%1480 Welton 0029 300020 F.03.09.200074.9210 9210 12,090 0.0169% 4,452 0.0317% 18 0.0001% 0.0162%Xcel Energy WYCO Inc. 0038 300025 F.03.10.200074.9210 9210 177,375 0.2477% - 0.0000% 163 0.0007% 0.0828%PSR Investment 0041 300026 F.03.11.200074.9210 9210 9,445 0.0132% - 0.0000% 16 0.0001% 0.0044%WGI 0043 300027 F.03.12.200074.9210 9210 929 0.0013% 147 0.0010% 163 0.0008% 0.0010%Xcel Energy Performance Contracting 0051 300029 F.03.13.200074.9210 9210 468 0.0007% - 0.0000% 37 0.0002% 0.0003%Chippewa Flambeau 0057 300031 F.03.14.200074.9210 9210 944 0.0013% 641 0.0046% 5,141 0.0236% 0.0098%Clearwater 0058 300032 F.03.15.200074.9210 9210 3,032 0.0042% 249 0.0018% 90 0.0004% 0.0021%NSP Lands 0059 300033 F.03.16.200074.9210 9210 49 0.0001% - 0.0000% 14 0.0001% 0.0000%Xcel Energy Transmission Holding Co 0075 300039 F.03.17.200074.9210 9210 242 0.0003% - 0.0000% 33 0.0002% 0.0002%Xcel Energy Transmission Development Co 0076 300040 F.03.18.200074.9210 9210 94 0.0001% - 0.0000% 113 0.0005% 0.0002%Xcel Energy Southwest Transmission Co 0077 300041 F.03.19.200074.9210 9210 151 0.0002% - 0.0000% 18 0.0001% 0.0001%Energy Impact Fund Investments LLC 0086 302160 F.03.20.200074.9210 9210 44,127 0.0616% - 0.0000% 30 0.0001% 0.0206%Nicollet Projects I LLC 0088 302162 F.03.21.200074.9210 9210 72,927 0.1019% 3,087 0.0220% 122 0.0006% 0.0415%Capital Services, LLC 0089 302163 F.03.22.200074.9210 9210 214,824 0.3000% - 0.0000% 94 0.0004% 0.1002%Xcel Energy Investments LLC 0092 302240 F.03.23.200074.9210 9210 472 0.0007% - 0.0000% 23 0.0001% 0.0003%Total 71,597,748$ 100.0000% 14,022,485$ 100.0000% 21,795,345 100.0000% 100.0000%
Allocation Changes: Prepared By Reviewed By Approved By Eff. Date
Updated Statistics
Erika Moeller Audra Lake Ross Baumgarten 4/1/2020

Northern States Power Company
XES Allocation Statistics Using FTE Hours2021 Test Year Budget
200075 Docket No. E002/GR-20-723Exhibit___(RLB-1), Schedule 5(a)
Page 13 of 117
Board of Directors - Corporate GovernanceSAP ACC 200075 (114)SCB013
Legal Entity Company
Cost
Center FERCLETFERC
Account Total Assets
$000's %
Revenues
$000's % FTE Hours %Allocation
%NSPM 0010 300500 F.03.01.200075.9302 9302 22,468,670$ 31.3818% 5,240,697$ 37.3735% 9,713,752 44.5680% 37.7744%NSPW 0011 300504 F.03.02.200075.9302 9302 2,887,050 4.0323% 981,344 6.9984% 1,636,749 7.5096% 6.1801%PSCo 0012 300509 F.03.03.200075.9302 9302 19,541,229 27.2931% 4,614,346 32.9068% 7,209,812 33.0796% 31.0931%SPS 0013 300511 F.03.04.200075.9302 9302 7,982,885 11.1496% 1,826,207 13.0234% 3,227,597 14.8087% 12.9939%Eloigne 0015 300009 F.03.05.200075.9302 9302 127,927 0.1787% 9,991 0.0712% 622 0.0029% 0.0843%Reddy Kilowatt 0017 300010 F.03.06.200075.9302 9302 2,901 0.0041% - 0.0000% 0 0.0000% 0.0014%United Power & Land 0019 300012 F.03.07.200075.9302 9302 1,131 0.0016% 24 0.0002% 54 0.0002% 0.0007%Xcel Energy 0023 300014 F.03.08.200075.9302 9302 18,048,786 25.2086% 1,341,300 9.5654% 682 0.0031% 11.5924%1480 Welton 0029 300020 F.03.09.200075.9302 9302 12,090 0.0169% 4,452 0.0317% 18 0.0001% 0.0162%Xcel Energy WYCO Inc. 0038 300025 F.03.10.200075.9302 9302 177,375 0.2477% - 0.0000% 163 0.0007% 0.0828%PSR Investments 0041 300026 F.03.11.200075.9302 9302 9,445 0.0132% - 0.0000% 16 0.0001% 0.0044%WGI 0043 300027 F.03.12.200075.9302 9302 929 0.0013% 147 0.0010% 163 0.0008% 0.0010%Xcel Energy Performance Contracting 0051 300029 F.03.13.200075.9302 9302 468 0.0007% - 0.0000% 37 0.0002% 0.0003%Chippewa Flambeau 0057 300031 F.03.14.200075.9302 9302 944 0.0013% 641 0.0046% 5,141 0.0236% 0.0098%Clearwater 0058 300032 F.03.15.200075.9302 9302 3,032 0.0042% 249 0.0018% 90 0.0004% 0.0021%NSP Lands 0059 300033 F.03.16.200075.9302 9302 49 0.0001% - 0.0000% 14 0.0001% 0.0000%Xcel Energy Transmission Holding Co 0075 300039 F.03.17.200075.9302 9302 242 0.0003% - 0.0000% 33 0.0002% 0.0002%Xcel Energy Transmission Development Co 0076 300040 F.03.18.200075.9302 9302 94 0.0001% - 0.0000% 113 0.0005% 0.0002%Xcel Energy Southwest Transmission Co 0077 300041 F.03.19.200075.9302 9302 151 0.0002% - 0.0000% 18 0.0001% 0.0001%Energy Impact Fund Investments LLC 0086 302160 F.03.20.200075.9302 9302 44,127 0.0616% - 0.0000% 30 0.0001% 0.0206%Nicollet Projects I LLC 0088 302162 F.03.21.200075.9302 9302 72,927 0.1019% 3,087 0.0220% 122 0.0006% 0.0415%Capital Services, LLC 0089 302163 F.03.22.200075.9302 9302 214,824 0.3000% - 0.0000% 94 0.0004% 0.1002%Xcel Energy Investments LLC 0092 302240 F.03.23.200075.9302 9302 472 0.0007% - 0.0000% 23 0.0001% 0.0003%Total 71,597,748$ 100.0000% 14,022,485$ 100.0000% 21,795,345 100.0000% 100.0000%
Allocation Changes: Prepared By Reviewed By Approved By Eff. Date
Updated Statistics
Erika Moeller Audra Lake Ross Baumgarten 4/1/2020

Northern States Power Company
XES Allocation Statistics Using FTE Hours2021 Test Year Budget
200076 Docket No. E002/GR-20-723Exhibit___(RLB-1), Schedule 5(a)
Page 14 of 117
Xcel FoundationSAP ACC 200076 (182)SCB014
Legal Entity Company
Cost
Center FERCLETFERC
Account Total Assets
$000's %
Revenues
$000's % FTE Hours %Allocation
%NSPM 0010 301601 F.03.01.200076.9210 9210 22,468,670$ 31.5986% 5,240,697$ 37.4231% 9,713,752 44.5812% 37.8677%NSPW 0011 302044 F.03.02.200076.9210 9210 2,887,050 4.0602% 981,344 7.0077% 1,636,749 7.5118% 6.1932%PSCo 0012 301382 F.03.03.200076.9210 9210 19,541,229 27.4816% 4,614,346 32.9504% 7,209,812 33.0894% 31.1738%SPS 0013 301680 F.03.04.200076.9210 9210 7,982,885 11.2267% 1,826,207 13.0407% 3,227,597 14.8130% 13.0268%Xcel Energy 0023 300014 F.03.08.200076.9210 9210 18,048,786 25.3828% 1,341,300 9.5781% 682 0.0031% 11.6546%Xcel Energy WYCO Inc. 0038 300025 F.03.10.200076.9210 9210 177,375 0.2494% - 0.0000% 163 0.0007% 0.0834%Xcel Energy Transmission Holding Co 0075 300039 F.03.17.200076.9210 9210 242 0.0003% - 0.0000% 33 0.0002% 0.0002%Xcel Energy Transmission Development Co 0076 300040 F.03.18.200076.9210 9210 94 0.0001% - 0.0000% 113 0.0005% 0.0002%Xcel Energy Southwest Transmission Co 0077 300041 F.03.19.200076.9210 9210 151 0.0002% - 0.0000% 18 0.0001% 0.0001%Total 71,106,482$ 100.0000% 14,003,894$ 100.0000% 21,788,920 100.0000% 100.0000%
Allocation Changes: Prepared By Reviewed By Approved By Eff. Date
Updated Statistics
Erika Moeller Audra Lake Ross Baumgarten 4/1/2020

Northern States Power Company
XES Allocation Statistics Using FTE Hours2021 Test Year Budget
200077 Docket No. E002/GR-20-723Exhibit___(RLB-1), Schedule 5(a)
Page 15 of 117
BrandingSAP ACC 200077 (184)SCB015
Legal Entity Company
Cost
Center FERCLETFERC
Account Total Assets
$000's %
Revenues
$000's % FTE Hours %Allocation
%NSPM 0010 300788 F.03.01.200077.9210 9210 22,468,670$ 31.5986% 5,240,697$ 37.4231% 9,713,752 44.5812% 37.8677%NSPW 0011 300791 F.03.02.200077.9210 9210 2,887,050 4.0602% 981,344 7.0077% 1,636,749 7.5118% 6.1932%PSCo 0012 300794 F.03.03.200077.9210 9210 19,541,229 27.4816% 4,614,346 32.9504% 7,209,812 33.0894% 31.1738%SPS 0013 300795 F.03.04.200077.9210 9210 7,982,885 11.2267% 1,826,207 13.0407% 3,227,597 14.8130% 13.0268%Xcel Energy 0023 300014 F.03.08.200077.9210 9210 18,048,786 25.3828% 1,341,300 9.5781% 682 0.0031% 11.6546%Xcel Energy WYCO Inc. 0038 300025 F.03.10.200077.9210 9210 177,375 0.2494% - 0.0000% 163 0.0007% 0.0834%Xcel Energy Transmission Holding Co 0075 300039 F.03.17.200077.9210 9210 242 0.0003% - 0.0000% 33 0.0002% 0.0002%Xcel Energy Transmission Development Co 0076 300040 F.03.18.200077.9210 9210 94 0.0001% - 0.0000% 113 0.0005% 0.0002%Xcel Energy Southwest Transmission Co 0077 300041 F.03.19.200077.9210 9210 151 0.0002% - 0.0000% 18 0.0001% 0.0001%Total 71,106,482$ 100.0000% 14,003,894$ 100.0000% 21,788,920 100.0000% 100.0000%
Allocation Changes: Prepared By Reviewed By Approved By Eff. Date
Updated Statistics
Erika Moeller Audra Lake Ross Baumgarten 4/1/2020
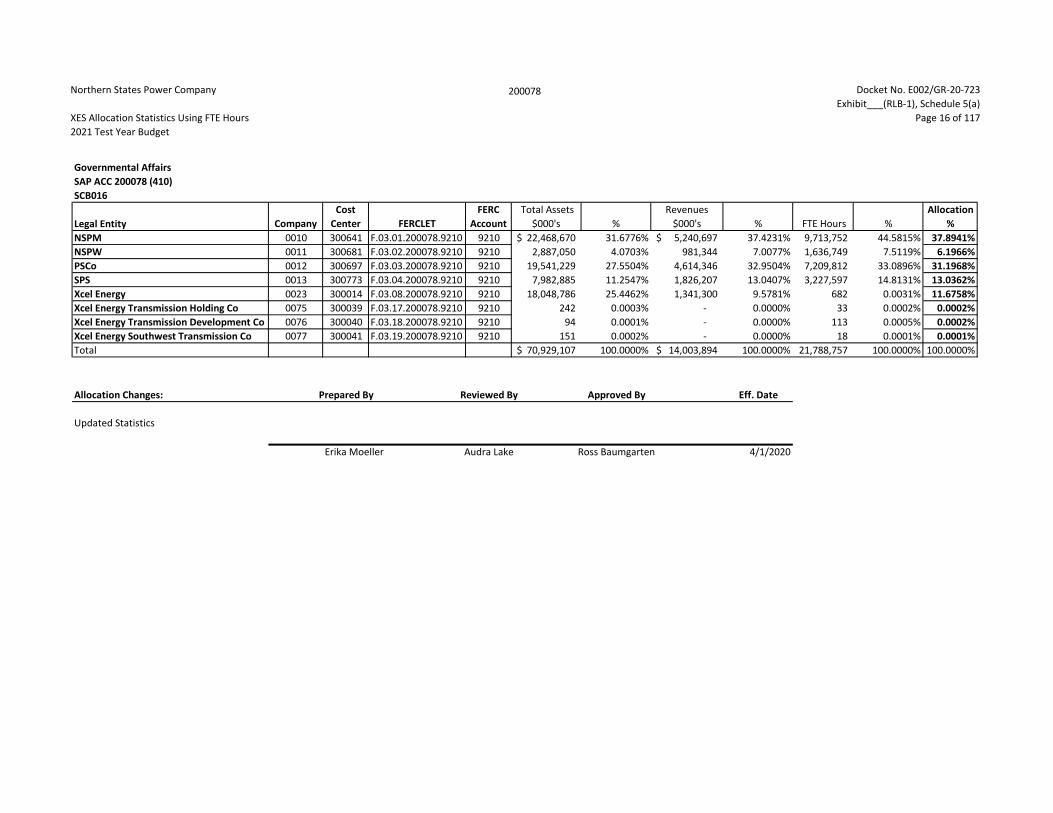
Northern States Power Company
XES Allocation Statistics Using FTE Hours2021 Test Year Budget
200078 Docket No. E002/GR-20-723Exhibit___(RLB-1), Schedule 5(a)
Page 16 of 117
Governmental AffairsSAP ACC 200078 (410)SCB016
Legal Entity Company
Cost
Center FERCLETFERC
Account Total Assets
$000's %
Revenues
$000's % FTE Hours %Allocation
%NSPM 0010 300641 F.03.01.200078.9210 9210 22,468,670$ 31.6776% 5,240,697$ 37.4231% 9,713,752 44.5815% 37.8941%NSPW 0011 300681 F.03.02.200078.9210 9210 2,887,050 4.0703% 981,344 7.0077% 1,636,749 7.5119% 6.1966%PSCo 0012 300697 F.03.03.200078.9210 9210 19,541,229 27.5504% 4,614,346 32.9504% 7,209,812 33.0896% 31.1968%SPS 0013 300773 F.03.04.200078.9210 9210 7,982,885 11.2547% 1,826,207 13.0407% 3,227,597 14.8131% 13.0362%Xcel Energy 0023 300014 F.03.08.200078.9210 9210 18,048,786 25.4462% 1,341,300 9.5781% 682 0.0031% 11.6758%Xcel Energy Transmission Holding Co 0075 300039 F.03.17.200078.9210 9210 242 0.0003% - 0.0000% 33 0.0002% 0.0002%Xcel Energy Transmission Development Co 0076 300040 F.03.18.200078.9210 9210 94 0.0001% - 0.0000% 113 0.0005% 0.0002%Xcel Energy Southwest Transmission Co 0077 300041 F.03.19.200078.9210 9210 151 0.0002% - 0.0000% 18 0.0001% 0.0001%Total 70,929,107$ 100.0000% 14,003,894$ 100.0000% 21,788,757 100.0000% 100.0000%
Allocation Changes: Prepared By Reviewed By Approved By Eff. Date
Updated Statistics
Erika Moeller Audra Lake Ross Baumgarten 4/1/2020

Northern States Power Company
XES Allocation Statistics Using FTE Hours2021 Test Year Budget
200079 Docket No. E002/GR-20-723Exhibit___(RLB-1), Schedule 5(a)
Page 17 of 117
Federal LobbyingSAP ACC 200079 (409)SCB017
Legal Entity Company
Cost
Center FERCLETFERC
Account Total Assets
$000's %
Revenues
$000's % FTE Hours %Allocation
%NSPM 0010 302054 F.03.01.200079.4264 4264 22,468,670$ 31.6776% 5,240,697$ 37.4231% 9,713,752 44.5815% 37.8941%NSPW 0011 302055 F.03.02.200079.4264 4264 2,887,050 4.0703% 981,344 7.0077% 1,636,749 7.5119% 6.1966%PSCo 0012 300698 F.03.03.200079.4264 4264 19,541,229 27.5504% 4,614,346 32.9504% 7,209,812 33.0896% 31.1968%SPS 0013 300821 F.03.04.200079.4264 4264 7,982,885 11.2547% 1,826,207 13.0407% 3,227,597 14.8131% 13.0362%Xcel Energy 0023 300014 F.03.08.200079.4264 4264 18,048,786 25.4462% 1,341,300 9.5781% 682 0.0031% 11.6758%Xcel Energy Transmission Holding Co 0075 300039 F.03.17.200079.4264 4264 242 0.0003% - 0.0000% 33 0.0002% 0.0002%Xcel Energy Transmission Development Co 0076 300040 F.03.18.200079.4264 4264 94 0.0001% - 0.0000% 113 0.0005% 0.0002%Xcel Energy Southwest Transmission Co 0077 300041 F.03.19.200079.4264 4264 151 0.0002% - 0.0000% 18 0.0001% 0.0001%Total 70,929,107$ 100.0000% 14,003,894$ 100.0000% 21,788,757 100.0000% 100.0000%
Allocation Changes: Prepared By Reviewed By Approved By Eff. Date
Updated Statistics
Erika Moeller Audra Lake Ross Baumgarten 4/1/2020

Northern States Power Company
XES Allocation Statistics Using FTE Hours2021 Test Year Budget
200080 Docket No. E002/GR-20-723Exhibit___(RLB-1), Schedule 5(a)
Page 18 of 117
Capital Asset AccountingSAP ACC 200080 (135)SCB018
Legal Entity Company
Cost
Center FERCLETFERC
Account Total Assets
$000's %
Revenues
$000's % FTE Hours %Allocation
%NSPM 0010 301683 F.03.01.200080.9210 9210 22,468,670$ 42.2315% 5,240,697$ 41.3374% 9,713,752 44.5703% 42.7132%NSPW 0011 301684 F.03.02.200080.9210 9210 2,887,050 5.4264% 981,344 7.7406% 1,636,749 7.5100% 6.8923%PSCo 0012 301685 F.03.03.200080.9210 9210 19,541,229 36.7291% 4,614,346 36.3969% 7,209,812 33.0813% 35.4024%SPS 0013 301476 F.03.04.200080.9210 9210 7,982,885 15.0044% 1,826,207 14.4047% 3,227,597 14.8094% 14.7395%Eloigne 0015 300009 F.03.05.200080.9210 9210 127,927 0.2404% 9,991 0.0788% 622 0.0029% 0.1074%Reddy Kilowatt 0017 300010 F.03.06.200080.9210 9210 2,901 0.0055% - 0.0000% 0 0.0000% 0.0018%United Power & Land 0019 300012 F.03.07.200080.9210 9210 1,131 0.0021% 24 0.0002% 54 0.0002% 0.0009%1480 Welton 0029 300020 F.03.09.200080.9210 9210 12,090 0.0227% 4,452 0.0351% 18 0.0001% 0.0193%Xcel Energy WYCO Inc. 0038 300025 F.03.10.200080.9210 9210 177,375 0.3334% - 0.0000% 163 0.0007% 0.1114%WGI 0043 300027 F.03.12.200080.9210 9210 929 0.0017% 147 0.0012% 163 0.0008% 0.0012%Chippewa Flambeau 0057 300031 F.03.14.200080.9210 9210 944 0.0018% 641 0.0051% 5,141 0.0236% 0.0101%Xcel Energy Transmission Holding Co 0075 300039 F.03.17.200080.9210 9210 242 0.0005% - 0.0000% 33 0.0002% 0.0002%Xcel Energy Transmission Development Co 0076 300040 F.03.18.200080.9210 9210 94 0.0002% - 0.0000% 113 0.0005% 0.0002%Xcel Energy Southwest Transmission Co 0077 300041 F.03.19.200080.9210 9210 151 0.0003% - 0.0000% 18 0.0001% 0.0001%Total 53,203,618$ 100.0000% 12,677,849$ 100.0000% 21,794,238 100.0000% 100.0000%
Allocation Changes: Prepared By Reviewed By Approved By Eff. Date
Updated Statistics
Erika Moeller Audra Lake Ross Baumgarten 4/1/2020
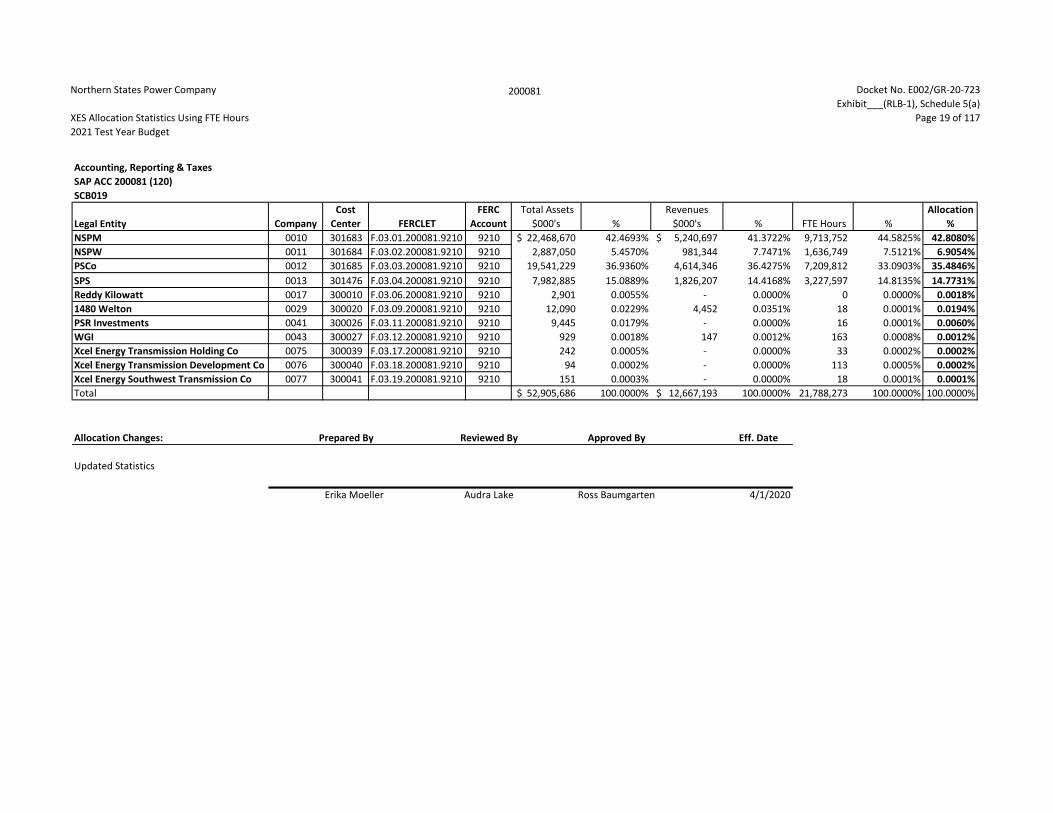
Northern States Power Company
XES Allocation Statistics Using FTE Hours2021 Test Year Budget
200081 Docket No. E002/GR-20-723Exhibit___(RLB-1), Schedule 5(a)
Page 19 of 117
Accounting, Reporting & TaxesSAP ACC 200081 (120)SCB019
Legal Entity Company
Cost
Center FERCLETFERC
Account Total Assets
$000's %
Revenues
$000's % FTE Hours %Allocation
%NSPM 0010 301683 F.03.01.200081.9210 9210 22,468,670$ 42.4693% 5,240,697$ 41.3722% 9,713,752 44.5825% 42.8080%NSPW 0011 301684 F.03.02.200081.9210 9210 2,887,050 5.4570% 981,344 7.7471% 1,636,749 7.5121% 6.9054%PSCo 0012 301685 F.03.03.200081.9210 9210 19,541,229 36.9360% 4,614,346 36.4275% 7,209,812 33.0903% 35.4846%SPS 0013 301476 F.03.04.200081.9210 9210 7,982,885 15.0889% 1,826,207 14.4168% 3,227,597 14.8135% 14.7731%Reddy Kilowatt 0017 300010 F.03.06.200081.9210 9210 2,901 0.0055% - 0.0000% 0 0.0000% 0.0018%1480 Welton 0029 300020 F.03.09.200081.9210 9210 12,090 0.0229% 4,452 0.0351% 18 0.0001% 0.0194%PSR Investments 0041 300026 F.03.11.200081.9210 9210 9,445 0.0179% - 0.0000% 16 0.0001% 0.0060%WGI 0043 300027 F.03.12.200081.9210 9210 929 0.0018% 147 0.0012% 163 0.0008% 0.0012%Xcel Energy Transmission Holding Co 0075 300039 F.03.17.200081.9210 9210 242 0.0005% - 0.0000% 33 0.0002% 0.0002%Xcel Energy Transmission Development Co 0076 300040 F.03.18.200081.9210 9210 94 0.0002% - 0.0000% 113 0.0005% 0.0002%Xcel Energy Southwest Transmission Co 0077 300041 F.03.19.200081.9210 9210 151 0.0003% - 0.0000% 18 0.0001% 0.0001%Total 52,905,686$ 100.0000% 12,667,193$ 100.0000% 21,788,273 100.0000% 100.0000%
Allocation Changes: Prepared By Reviewed By Approved By Eff. Date
Updated Statistics
Erika Moeller Audra Lake Ross Baumgarten 4/1/2020

Northern States Power Company
XES Allocation Statistics Using FTE Hours2021 Test Year Budget
200082 Docket No. E002/GR-20-723Exhibit___(RLB-1), Schedule 5(a)
Page 20 of 117
Audit ServicesSAP ACC 200082 (130)SCB020
Legal Entity Company
Cost
Center FERCLETFERC
Account Total Assets
$000's %
Revenues
$000's % FTE Hours %Allocation
%NSPM 0010 301425 F.03.01.200082.9210 9210 22,468,670$ 42.4693% 5,240,697$ 41.3722% 9,713,752 44.5825% 42.8080%NSPW 0011 301426 F.03.02.200082.9210 9210 2,887,050 5.4570% 981,344 7.7471% 1,636,749 7.5121% 6.9054%PSCo 0012 301427 F.03.03.200082.9210 9210 19,541,229 36.9360% 4,614,346 36.4275% 7,209,812 33.0903% 35.4846%SPS 0013 301428 F.03.04.200082.9210 9210 7,982,885 15.0889% 1,826,207 14.4168% 3,227,597 14.8135% 14.7731%Reddy Kilowatt 0017 300010 F.03.06.200082.9210 9210 2,901 0.0055% - 0.0000% 0 0.0000% 0.0018%1480 Welton 0029 300020 F.03.09.200082.9210 9210 12,090 0.0229% 4,452 0.0351% 18 0.0001% 0.0194%PSR Investments 0041 300026 F.03.11.200082.9210 9210 9,445 0.0179% - 0.0000% 16 0.0001% 0.0060%WGI 0043 300027 F.03.12.200082.9210 9210 929 0.0018% 147 0.0012% 163 0.0008% 0.0012%Xcel Energy Transmission Holding Co 0075 300039 F.03.17.200082.9210 9210 242 0.0005% - 0.0000% 33 0.0002% 0.0002%Xcel Energy Transmission Development Co 0076 300040 F.03.18.200082.9210 9210 94 0.0002% - 0.0000% 113 0.0005% 0.0002%Xcel Energy Southwest Transmission Co 0077 300041 F.03.19.200082.9210 9210 151 0.0003% - 0.0000% 18 0.0001% 0.0001%Total 52,905,686$ 100.0000% 12,667,193$ 100.0000% 21,788,273 100.0000% 100.0000%
Allocation Changes: Prepared By Reviewed By Approved By Eff. Date
Updated Statistics
Erika Moeller Audra Lake Ross Baumgarten 4/1/2020
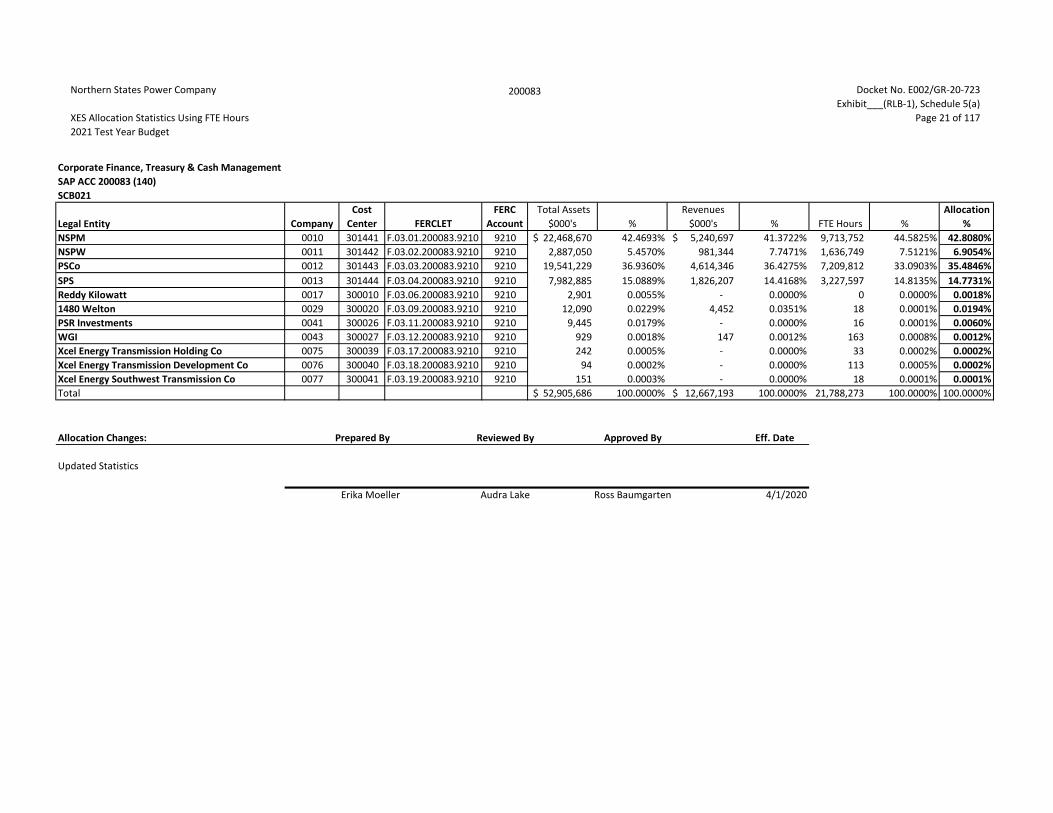
Northern States Power Company
XES Allocation Statistics Using FTE Hours2021 Test Year Budget
200083 Docket No. E002/GR-20-723Exhibit___(RLB-1), Schedule 5(a)
Page 21 of 117
Corporate Finance, Treasury & Cash ManagementSAP ACC 200083 (140)SCB021
Legal Entity Company
Cost
Center FERCLETFERC
Account Total Assets
$000's %
Revenues
$000's % FTE Hours %Allocation
%NSPM 0010 301441 F.03.01.200083.9210 9210 22,468,670$ 42.4693% 5,240,697$ 41.3722% 9,713,752 44.5825% 42.8080%NSPW 0011 301442 F.03.02.200083.9210 9210 2,887,050 5.4570% 981,344 7.7471% 1,636,749 7.5121% 6.9054%PSCo 0012 301443 F.03.03.200083.9210 9210 19,541,229 36.9360% 4,614,346 36.4275% 7,209,812 33.0903% 35.4846%SPS 0013 301444 F.03.04.200083.9210 9210 7,982,885 15.0889% 1,826,207 14.4168% 3,227,597 14.8135% 14.7731%Reddy Kilowatt 0017 300010 F.03.06.200083.9210 9210 2,901 0.0055% - 0.0000% 0 0.0000% 0.0018%1480 Welton 0029 300020 F.03.09.200083.9210 9210 12,090 0.0229% 4,452 0.0351% 18 0.0001% 0.0194%PSR Investments 0041 300026 F.03.11.200083.9210 9210 9,445 0.0179% - 0.0000% 16 0.0001% 0.0060%WGI 0043 300027 F.03.12.200083.9210 9210 929 0.0018% 147 0.0012% 163 0.0008% 0.0012%Xcel Energy Transmission Holding Co 0075 300039 F.03.17.200083.9210 9210 242 0.0005% - 0.0000% 33 0.0002% 0.0002%Xcel Energy Transmission Development Co 0076 300040 F.03.18.200083.9210 9210 94 0.0002% - 0.0000% 113 0.0005% 0.0002%Xcel Energy Southwest Transmission Co 0077 300041 F.03.19.200083.9210 9210 151 0.0003% - 0.0000% 18 0.0001% 0.0001%Total 52,905,686$ 100.0000% 12,667,193$ 100.0000% 21,788,273 100.0000% 100.0000%
Allocation Changes: Prepared By Reviewed By Approved By Eff. Date
Updated Statistics
Erika Moeller Audra Lake Ross Baumgarten 4/1/2020

Northern States Power Company
XES Allocation Statistics Using FTE Hours2021 Test Year Budget
200084 Docket No. E002/GR-20-723Exhibit___(RLB-1), Schedule 5(a)
Page 22 of 117
Risk ManagementSAP ACC 200084 (142)SCB022
Legal Entity Company
Cost
Center FERCLETFERC
Account Total Assets
$000's %
Revenues
$000's % FTE Hours %Allocation
%NSPM 0010 301477 F.03.01.200084.9210 9210 22,468,670$ 42.4693% 5,240,697$ 41.3722% 9,713,752 44.5825% 42.8080%NSPW 0011 301478 F.03.02.200084.9210 9210 2,887,050 5.4570% 981,344 7.7471% 1,636,749 7.5121% 6.9054%PSCo 0012 301479 F.03.03.200084.9210 9210 19,541,229 36.9360% 4,614,346 36.4275% 7,209,812 33.0903% 35.4846%SPS 0013 301480 F.03.04.200084.9210 9210 7,982,885 15.0889% 1,826,207 14.4168% 3,227,597 14.8135% 14.7731%Reddy Kilowatt 0017 300010 F.03.06.200084.9210 9210 2,901 0.0055% - 0.0000% 0 0.0000% 0.0018%1480 Welton 0029 300020 F.03.09.200084.9210 9210 12,090 0.0229% 4,452 0.0351% 18 0.0001% 0.0194%PSR Investments 0041 300026 F.03.11.200084.9210 9210 9,445 0.0179% - 0.0000% 16 0.0001% 0.0060%WGI 0043 300027 F.03.12.200084.9210 9210 929 0.0018% 147 0.0012% 163 0.0008% 0.0012%Xcel Energy Transmission Holding Co 0075 300039 F.03.17.200084.9210 9210 242 0.0005% - 0.0000% 33 0.0002% 0.0002%Xcel Energy Transmission Development Co 0076 300040 F.03.18.200084.9210 9210 94 0.0002% - 0.0000% 113 0.0005% 0.0002%Xcel Energy Southwest Transmission Co 0077 300041 F.03.19.200084.9210 9210 151 0.0003% - 0.0000% 18 0.0001% 0.0001%Total 52,905,686$ 100.0000% 12,667,193$ 100.0000% 21,788,273 100.0000% 100.0000%
Allocation Changes: Prepared By Reviewed By Approved By Eff. Date
Updated Statistics
Erika Moeller Audra Lake Ross Baumgarten 4/1/2020

Northern States Power Company
XES Allocation Statistics Using FTE Hours2021 Test Year Budget
200086 Docket No. E002/GR-20-723Exhibit___(RLB-1), Schedule 5(a)
Page 23 of 117
Legal & Claims ServicesSAP ACC 200086 (170)SCB024
Legal Entity Company
Cost
Center FERCLETFERC
Account Total Assets
$000's %
Revenues
$000's % FTE Hours %Allocation
%NSPM 0010 301563 F.03.01.200086.9210 9210 22,468,670$ 42.4693% 5,240,697$ 41.3722% 9,713,752 44.5825% 42.8080%NSPW 0011 302044 F.03.02.200086.9210 9210 2,887,050 5.4570% 981,344 7.7471% 1,636,749 7.5121% 6.9054%PSCo 0012 300388 F.03.03.200086.9210 9210 19,541,229 36.9360% 4,614,346 36.4275% 7,209,812 33.0903% 35.4846%SPS 0013 300390 F.03.04.200086.9210 9210 7,982,885 15.0889% 1,826,207 14.4168% 3,227,597 14.8135% 14.7731%Reddy Kilowatt 0017 300010 F.03.06.200086.9210 9210 2,901 0.0055% - 0.0000% 0 0.0000% 0.0018%1480 Welton 0029 300020 F.03.09.200086.9210 9210 12,090 0.0229% 4,452 0.0351% 18 0.0001% 0.0194%PSR Investments 0041 300026 F.03.11.200086.9210 9210 9,445 0.0179% - 0.0000% 16 0.0001% 0.0060%WGI 0043 300027 F.03.12.200086.9210 9210 929 0.0018% 147 0.0012% 163 0.0008% 0.0012%Xcel Energy Transmission Holding Co 0075 300039 F.03.17.200086.9210 9210 242 0.0005% - 0.0000% 33 0.0002% 0.0002%Xcel Energy Transmission Development Co 0076 300040 F.03.18.200086.9210 9210 94 0.0002% - 0.0000% 113 0.0005% 0.0002%Xcel Energy Southwest Transmission Co 0077 300041 F.03.19.200086.9210 9210 151 0.0003% - 0.0000% 18 0.0001% 0.0001%Total 52,905,686$ 100.0000% 12,667,193$ 100.0000% 21,788,273 100.0000% 100.0000%
Allocation Changes: Prepared By Reviewed By Approved By Eff. Date
Updated Statistics
Erika Moeller Audra Lake Ross Baumgarten 4/1/2020

Northern States Power Company
XES Allocation Statistics Using FTE Hours2021 Test Year Budget
200087 Docket No. E002/GR-20-723Exhibit___(RLB-1), Schedule 5(a)
Page 24 of 117
Accounting, Reporting & Tax - RegulatedSAP ACC 200087 (123)SCB025
Legal Entity CompanyCost
Center FERCLETFERC
Account Total Assets
$000's %Revenues
$000's % FTE Hours %Allocation
%NSPM 0010 301683 F.03.01.200087.9210 9210 22,468,670$ 42.4897% 5,240,697$ 41.3872% 9,713,752 44.5829% 42.8200%NSPW 0011 301684 F.03.02.200087.9210 9210 2,887,050 5.4596% 981,344 7.7499% 1,636,749 7.5121% 6.9072%PSCo 0012 301685 F.03.03.200087.9210 9210 19,541,229 36.9537% 4,614,346 36.4408% 7,209,812 33.0906% 35.4950%SPS 0013 301476 F.03.04.200087.9210 9210 7,982,885 15.0961% 1,826,207 14.4221% 3,227,597 14.8136% 14.7773%Xcel Energy Transmission Holding Co 0075 300039 F.03.17.200087.9210 9210 242 0.0005% - 0.0000% 33 0.0002% 0.0002%Xcel Energy Transmission Development Co 0076 300040 F.03.18.200087.9210 9210 94 0.0002% - 0.0000% 113 0.0005% 0.0002%Xcel Energy Southwest Transmission Co 0077 300041 F.03.19.200087.9210 9210 151 0.0003% - 0.0000% 18 0.0001% 0.0001%Total 52,880,321$ 100.0000% 12,662,594$ 100.0000% 21,788,076 100.0000% 100.0000%
Allocation Changes: Prepared By Reviewed By Approved By Eff. Date
Updated Statistics
Erika Moeller Audra Lake Ross Baumgarten 4/1/2020

Northern States Power Company
XES Allocation Statistics Using FTE Hours2021 Test Year Budget
200088 Docket No. E002/GR-20-723Exhibit___(RLB-1), Schedule 5(a)
Page 25 of 117
Accounting, Reporting, Tax & Audit Services - Regulated ElectricSAP ACC 200088 (127, 133)SCB026
Legal Entity Company
Cost
Center FERCLETFERC
Account Total Assets
$000's %
Revenues
$000's % FTE Hours %Allocation
%NSPM 0010 300498 F.03.01.200088.9210 9210 22,468,670$ 42.4897% 5,240,697$ 41.3872% 9,713,752 44.5829% 42.8200%NSPW 0011 300502 F.03.02.200088.9210 9210 2,887,050 5.4596% 981,344 7.7499% 1,636,749 7.5121% 6.9072%PSCo 0012 300506 F.03.03.200088.9210 9210 19,541,229 36.9537% 4,614,346 36.4408% 7,209,812 33.0906% 35.4950%SPS 0013 300511 F.03.04.200088.9210 9210 7,982,885 15.0961% 1,826,207 14.4221% 3,227,597 14.8136% 14.7773%Xcel Energy Transmission Holding Co 0075 300039 F.03.17.200088.9210 9210 242 0.0005% - 0.0000% 33 0.0002% 0.0002%Xcel Energy Transmission Development Co 0076 300040 F.03.18.200088.9210 9210 94 0.0002% - 0.0000% 113 0.0005% 0.0002%Xcel Energy Southwest Transmission Co 0077 300041 F.03.19.200088.9210 9210 151 0.0003% - 0.0000% 18 0.0001% 0.0001%Total 52,880,321$ 100.0000% 12,662,594$ 100.0000% 21,788,076 100.0000% 100.0000%
Allocation Changes: Prepared By Reviewed By Approved By Eff. Date
Updated Statistics
Erika Moeller Audra Lake Ross Baumgarten 4/1/2020

Northern States Power Company
XES Allocation Statistics Using FTE Hours2021 Test Year Budget
200089 Docket No. E002/GR-20-723Exhibit___(RLB-1), Schedule 5(a)
Page 26 of 117
Audit Services - OpCo's & TransCo’sSAP ACC 200089 (132)SCB027
Legal Entity Company
Cost
Center FERCLETFERC
Account Total Assets
$000's %
Revenues
$000's % FTE Hours %Allocation
%NSPM 0010 301425 F.03.01.200089.9210 9210 22,468,670$ 42.4897% 5,240,697$ 41.3872% 9,713,752 44.5829% 42.8200%NSPW 0011 301426 F.03.02.200089.9210 9210 2,887,050 5.4596% 981,344 7.7499% 1,636,749 7.5121% 6.9072%PSCo 0012 301427 F.03.03.200089.9210 9210 19,541,229 36.9537% 4,614,346 36.4408% 7,209,812 33.0906% 35.4950%SPS 0013 301428 F.03.04.200089.9210 9210 7,982,885 15.0961% 1,826,207 14.4221% 3,227,597 14.8136% 14.7773%Xcel Energy Transmission Holding Co 0075 300039 F.03.17.200089.9210 9210 242 0.0005% - 0.0000% 33 0.0002% 0.0002%Xcel Energy Transmission Development Co 0076 300040 F.03.18.200089.9210 9210 94 0.0002% - 0.0000% 113 0.0005% 0.0002%Xcel Energy Southwest Transmission Co 0077 300041 F.03.19.200089.9210 9210 151 0.0003% - 0.0000% 18 0.0001% 0.0001%Total 52,880,321$ 100.0000% 12,662,594$ 100.0000% 21,788,076 100.0000% 100.0000%
Allocation Changes: Prepared By Reviewed By Approved By Eff. Date
Updated Statistics
Erika Moeller Audra Lake Ross Baumgarten 4/1/2020

Northern States Power Company
XES Allocation Statistics Using FTE Hours2021 Test Year Budget
200090 Docket No. E002/GR-20-723Exhibit___(RLB-1), Schedule 5(a)
Page 27 of 117
Risk Management - OpCo's & TransCo’sSAP ACC 200090 (146)SCB028
Legal Entity Company
Cost
Center FERCLETFERC
Account Total Assets
$000's %
Revenues
$000's % FTE Hours %Allocation
%NSPM 0010 301477 F.03.01.200090.9210 9210 22,468,670$ 42.4897% 5,240,697$ 41.3872% 9,713,752 44.5829% 42.8200%NSPW 0011 301478 F.03.02.200090.9210 9210 2,887,050 5.4596% 981,344 7.7499% 1,636,749 7.5121% 6.9072%PSCo 0012 301479 F.03.03.200090.9210 9210 19,541,229 36.9537% 4,614,346 36.4408% 7,209,812 33.0906% 35.4950%SPS 0013 301480 F.03.04.200090.9210 9210 7,982,885 15.0961% 1,826,207 14.4221% 3,227,597 14.8136% 14.7773%Xcel Energy Transmission Holding Co 0075 300039 F.03.17.200090.9210 9210 242 0.0005% - 0.0000% 33 0.0002% 0.0002%Xcel Energy Transmission Development Co 0076 300040 F.03.18.200090.9210 9210 94 0.0002% - 0.0000% 113 0.0005% 0.0002%Xcel Energy Southwest Transmission Co 0077 300041 F.03.19.200090.9210 9210 151 0.0003% - 0.0000% 18 0.0001% 0.0001%Total 52,880,321$ 100.0000% 12,662,594$ 100.0000% 21,788,076 100.0000% 100.0000%
Allocation Changes: Prepared By Reviewed By Approved By Eff. Date
Updated Statistics
Erika Moeller Audra Lake Ross Baumgarten 4/1/2020

Northern States Power Company
XES Allocation Statistics Using FTE Hours2021 Test Year Budget
200091 Docket No. E002/GR-20-723Exhibit___(RLB-1), Schedule 5(a)
Page 28 of 117
Captive InsuranceSAP ACC 200091 (147)SCB029
Legal Entity Company
Cost
Center FERCLETFERC
Account Total Assets
$000's %
Revenues
$000's % FTE Hours %Allocation
%NSPM 0010 301477 F.03.01.200091.9210 9210 22,468,670$ 42.4897% 5,240,697$ 41.3872% 9,713,752 44.5829% 42.8200%NSPW 0011 301478 F.03.02.200091.9210 9210 2,887,050 5.4596% 981,344 7.7499% 1,636,749 7.5121% 6.9072%PSCo 0012 301479 F.03.03.200091.9210 9210 19,541,229 36.9537% 4,614,346 36.4408% 7,209,812 33.0906% 35.4950%SPS 0013 301480 F.03.04.200091.9210 9210 7,982,885 15.0961% 1,826,207 14.4221% 3,227,597 14.8136% 14.7773%Xcel Energy Transmission Holding Co 0075 300039 F.03.17.200091.9210 9210 242 0.0005% - 0.0000% 33 0.0002% 0.0002%Xcel Energy Transmission Development Co 0076 300040 F.03.18.200091.9210 9210 94 0.0002% - 0.0000% 113 0.0005% 0.0002%Xcel Energy Southwest Transmission Co 0077 300041 F.03.19.200091.9210 9210 151 0.0003% - 0.0000% 18 0.0001% 0.0001%Total 52,880,321$ 100.0000% 12,662,594$ 100.0000% 21,788,076 100.0000% 100.0000%
Allocation Changes: Prepared By Reviewed By Approved By Eff. Date
Updated Statistics
Erika Moeller Audra Lake Ross Baumgarten 4/1/2020

Northern States Power Company
XES Allocation Statistics Using FTE Hours2021 Test Year Budget
200092 Docket No. E002/GR-20-723Exhibit___(RLB-1), Schedule 5(a)
Page 29 of 117
Corporate Strategy & Business Development SAP ACC 200092 (162)SCB030
Legal Entity Company
Cost
Center FERCLETFERC
Account Total Assets
$000's %
Revenues
$000's % FTE Hours %Allocation
%NSPM 0010 301585 F.03.01.200092.9210 9210 22,468,670$ 42.4897% 5,240,697$ 41.3872% 9,713,752 44.5829% 42.8200%NSPW 0011 301586 F.03.02.200092.9210 9210 2,887,050 5.4596% 981,344 7.7499% 1,636,749 7.5121% 6.9072%PSCo 0012 301589 F.03.03.200092.9210 9210 19,541,229 36.9537% 4,614,346 36.4408% 7,209,812 33.0906% 35.4950%SPS 0013 301590 F.03.04.200092.9210 9210 7,982,885 15.0961% 1,826,207 14.4221% 3,227,597 14.8136% 14.7773%Xcel Energy Transmission Holding Co 0075 300039 F.03.17.200092.9210 9210 242 0.0005% - 0.0000% 33 0.0002% 0.0002%Xcel Energy Transmission Development Co 0076 300040 F.03.18.200092.9210 9210 94 0.0002% - 0.0000% 113 0.0005% 0.0002%Xcel Energy Southwest Transmission Co 0077 300041 F.03.19.200092.9210 9210 151 0.0003% - 0.0000% 18 0.0001% 0.0001%Total 52,880,321$ 100.0000% 12,662,594$ 100.0000% 21,788,076 100.0000% 100.0000%
Allocation Changes: Prepared By Reviewed By Approved By Eff. Date
Updated Statistics
Erika Moeller Audra Lake Ross Baumgarten 4/1/2020

Northern States Power Company
XES Allocation Statistics Using FTE Hours2021 Test Year Budget
200093 Docket No. E002/GR-20-723Exhibit___(RLB-1), Schedule 5(a)
Page 30 of 117
Legal - OpCo's & TransCo’sSAP ACC 200093 (174)SCB031
Legal Entity Company
Cost
Center FERCLETFERC
Account Total Assets
$000's %
Revenues
$000's % FTE Hours %Allocation
%NSPM 0010 301563 F.03.01.200093.9210 9210 22,468,670$ 42.4897% 5,240,697$ 41.3872% 9,713,752 44.5829% 42.8200%NSPW 0011 302044 F.03.02.200093.9210 9210 2,887,050 5.4596% 981,344 7.7499% 1,636,749 7.5121% 6.9072%PSCo 0012 300388 F.03.03.200093.9210 9210 19,541,229 36.9537% 4,614,346 36.4408% 7,209,812 33.0906% 35.4950%SPS 0013 300390 F.03.04.200093.9210 9210 7,982,885 15.0961% 1,826,207 14.4221% 3,227,597 14.8136% 14.7773%Xcel Energy Transmission Holding Co 0075 300039 F.03.17.200093.9210 9210 242 0.0005% - 0.0000% 33 0.0002% 0.0002%Xcel Energy Transmission Development Co 0076 300040 F.03.18.200093.9210 9210 94 0.0002% - 0.0000% 113 0.0005% 0.0002%Xcel Energy Southwest Transmission Co 0077 300041 F.03.19.200093.9210 9210 151 0.0003% - 0.0000% 18 0.0001% 0.0001%Total 52,880,321$ 100.0000% 12,662,594$ 100.0000% 21,788,076 100.0000% 100.0000%
Allocation Changes: Prepared By Reviewed By Approved By Eff. Date
Updated Statistics
Erika Moeller Audra Lake Ross Baumgarten 4/1/2020

Northern States Power Company
XES Allocation Statistics Using FTE Hours2021 Test Year Budget
200094 Docket No. E002/GR-20-723Exhibit___(RLB-1), Schedule 5(a)
Page 31 of 117
Supply ChainSAP ACC 200094 (416)SCB032
Legal Entity Company
Cost
Center FERCLETFERC
Account Total Assets
$000's %
Revenues
$000's % FTE Hours %Allocation
%NSPM 0010 300709 F.03.01.200094.9210 9210 22,468,670$ 42.4897% 5,240,697$ 41.3872% 9,713,752 44.5829% 42.8200%NSPW 0011 300712 F.03.02.200094.9210 9210 2,887,050 5.4596% 981,344 7.7499% 1,636,749 7.5121% 6.9072%PSCo 0012 300715 F.03.03.200094.9210 9210 19,541,229 36.9537% 4,614,346 36.4408% 7,209,812 33.0906% 35.4950%SPS 0013 300716 F.03.04.200094.9210 9210 7,982,885 15.0961% 1,826,207 14.4221% 3,227,597 14.8136% 14.7773%Xcel Energy Transmission Holding Co 0075 300039 F.03.17.200094.9210 9210 242 0.0005% - 0.0000% 33 0.0002% 0.0002%Xcel Energy Transmission Development Co 0076 300040 F.03.18.200094.9210 9210 94 0.0002% - 0.0000% 113 0.0005% 0.0002%Xcel Energy Southwest Transmission Co 0077 300041 F.03.19.200094.9210 9210 151 0.0003% - 0.0000% 18 0.0001% 0.0001%Total 52,880,321$ 100.0000% 12,662,594$ 100.0000% 21,788,076 100.0000% 100.0000%
Allocation Changes: Prepared By Reviewed By Approved By Eff. Date
Updated Statistics
Erika Moeller Audra Lake Ross Baumgarten 4/1/2020

Northern States Power Company
XES Allocation Statistics Using FTE Hours2021 Test Year Budget
200095 Docket No. E002/GR-20-723Exhibit___(RLB-1), Schedule 5(a)
Page 32 of 117
Energy Supply Asset ManagementSAP ACC 200095 (430)SCB033
Legal Entity Company
Cost
Center FERCLETFERC
Account Total Assets
$000's %
Revenues
$000's % FTE Hours %Allocation
%NSPM 0010 300923 F.03.01.200095.9210 9210 22,468,670$ 42.4897% 5,240,697$ 41.3872% 9,713,752 44.5829% 42.8200%NSPW 0011 300926 F.03.02.200095.9210 9210 2,887,050 5.4596% 981,344 7.7499% 1,636,749 7.5121% 6.9072%PSCo 0012 300929 F.03.03.200095.9210 9210 19,541,229 36.9537% 4,614,346 36.4408% 7,209,812 33.0906% 35.4950%SPS 0013 300933 F.03.04.200095.9210 9210 7,982,885 15.0961% 1,826,207 14.4221% 3,227,597 14.8136% 14.7773%Xcel Energy Transmission Holding Co 0075 300039 F.03.17.200095.9210 9210 242 0.0005% - 0.0000% 33 0.0002% 0.0002%Xcel Energy Transmission Development Co 0076 300040 F.03.18.200095.9210 9210 94 0.0002% - 0.0000% 113 0.0005% 0.0002%Xcel Energy Southwest Transmission Co 0077 300041 F.03.19.200095.9210 9210 151 0.0003% - 0.0000% 18 0.0001% 0.0001%Total 52,880,321$ 100.0000% 12,662,594$ 100.0000% 21,788,076 100.0000% 100.0000%
Allocation Changes: Prepared By Reviewed By Approved By Eff. Date
Updated Statistics
Erika Moeller Audra Lake Ross Baumgarten 4/1/2020

Northern States Power Company
XES Allocation Statistics Using FTE Hours2021 Test Year Budget
200096 Docket No. E002/GR-20-723Exhibit___(RLB-1), Schedule 5(a)
Page 33 of 117
Energy Markets - Business ServicesSAP ACC 200096 (431)SCB034
Legal Entity Company
Cost
Center FERCLETFERC
Account Total Assets
$000's %
Revenues
$000's % FTE Hours %Allocation
%NSPM 0010 301667 F.03.01.200096.9210 9210 22,468,670$ 42.4897% 5,240,697$ 41.3872% 9,713,752 44.5829% 42.8200%NSPW 0011 301527 F.03.02.200096.9210 9210 2,887,050 5.4596% 981,344 7.7499% 1,636,749 7.5121% 6.9072%PSCo 0012 301463 F.03.03.200096.9210 9210 19,541,229 36.9537% 4,614,346 36.4408% 7,209,812 33.0906% 35.4950%SPS 0013 301464 F.03.04.200096.9210 9210 7,982,885 15.0961% 1,826,207 14.4221% 3,227,597 14.8136% 14.7773%Xcel Energy Transmission Holding Co 0075 300039 F.03.17.200096.9210 9210 242 0.0005% - 0.0000% 33 0.0002% 0.0002%Xcel Energy Transmission Development Co 0076 300040 F.03.18.200096.9210 9210 94 0.0002% - 0.0000% 113 0.0005% 0.0002%Xcel Energy Southwest Transmission Co 0077 300041 F.03.19.200096.9210 9210 151 0.0003% - 0.0000% 18 0.0001% 0.0001%Total 52,880,321$ 100.0000% 12,662,594$ 100.0000% 21,788,076 100.0000% 100.0000%
Allocation Changes: Prepared By Reviewed By Approved By Eff. Date
Updated Statistics
Erika Moeller Audra Lake Ross Baumgarten 4/1/2020

Northern States Power Company
XES Allocation Statistics Using FTE Hours2021 Test Year Budget
200097 Docket No. E002/GR-20-723Exhibit___(RLB-1), Schedule 5(a)
Page 34 of 117
Accounting and Finance Software Applications MaintenanceSAP ACC 200097 (533, 535, 539, 542)SCB035
Legal Entity Company
Cost
Center FERCLETFERC
Account Total Assets
$000's %
Revenues
$000's % FTE Hours %Allocation
%NSPM 0010 301673 F.03.01.200097.9210 9210 22,468,670$ 42.4897% 5,240,697$ 41.3872% 9,713,752 44.5829% 42.8200%NSPW 0011 301674 F.03.02.200097.9210 9210 2,887,050 5.4596% 981,344 7.7499% 1,636,749 7.5121% 6.9072%PSCo 0012 301675 F.03.03.200097.9210 9210 19,541,229 36.9537% 4,614,346 36.4408% 7,209,812 33.0906% 35.4950%SPS 0013 301676 F.03.04.200097.9210 9210 7,982,885 15.0961% 1,826,207 14.4221% 3,227,597 14.8136% 14.7773%Xcel Energy Transmission Holding Co 0075 300039 F.03.17.200097.9210 9210 242 0.0005% - 0.0000% 33 0.0002% 0.0002%Xcel Energy Transmission Development Co 0076 300040 F.03.18.200097.9210 9210 94 0.0002% - 0.0000% 113 0.0005% 0.0002%Xcel Energy Southwest Transmission Co 0077 300041 F.03.19.200097.9210 9210 151 0.0003% - 0.0000% 18 0.0001% 0.0001%Total 52,880,321$ 100.0000% 12,662,594$ 100.0000% 21,788,076 100.0000% 100.0000%
Allocation Changes: Prepared By Reviewed By Approved By Eff. Date
Updated Statistics
Erika Moeller Audra Lake Ross Baumgarten 4/1/2020

Northern States Power Company
XES Allocation Statistics Using FTE Hours2021 Test Year Budget
200098 Docket No. E002/GR-20-723Exhibit___(RLB-1), Schedule 5(a)
Page 35 of 117
Electric Transmission FERC 566SAP ACC 200098 (468)SCB036
Legal Entity Company
Cost
Center FERCLETFERC
Account Total Assets
$000's %
Revenues
$000's % FTE Hours %Allocation
%NSPM 0010 300125 F.03.01.200098.5660 5660 22,468,670$ 42.4897% 5,240,697$ 41.3872% 9,713,752 44.5829% 42.8200%NSPW 0011 300127 F.03.02.200098.5660 5660 2,887,050 5.4596% 981,344 7.7499% 1,636,749 7.5121% 6.9072%PSCo 0012 300129 F.03.03.200098.5660 5660 19,541,229 36.9537% 4,614,346 36.4408% 7,209,812 33.0906% 35.4950%SPS 0013 300131 F.03.04.200098.5660 5660 7,982,885 15.0961% 1,826,207 14.4221% 3,227,597 14.8136% 14.7773%Xcel Energy Transmission Holding Co 0075 300039 F.03.17.200098.5660 5660 242 0.0005% - 0.0000% 33 0.0002% 0.0002%Xcel Energy Transmission Development Co 0076 300040 F.03.18.200098.5660 5660 94 0.0002% - 0.0000% 113 0.0005% 0.0002%Xcel Energy Southwest Transmission Co 0077 300041 F.03.19.200098.5660 5660 151 0.0003% - 0.0000% 18 0.0001% 0.0001%Total 52,880,321$ 100.0000% 12,662,594$ 100.0000% 21,788,076 100.0000% 100.0000%
Allocation Changes: Prepared By Reviewed By Approved By Eff. Date
Updated Statistics
Erika Moeller Audra Lake Ross Baumgarten 4/1/2020

Northern States Power Company
XES Allocation Statistics Using FTE Hours2021 Test Year Budget
200099 Docket No. E002/GR-20-723Exhibit___(RLB-1), Schedule 5(a)
Page 36 of 117
Electric Distribution FERC 588SAP ACC 200099 (469)SCB037
Legal Entity Company
Cost
Center FERCLETFERC
Account Total Assets
$000's %
Revenues
$000's % FTE Hours %Allocation
%NSPM 0010 302058 F.03.01.200099.5880 5880 22,468,670$ 42.4897% 5,240,697$ 41.3872% 9,713,752 44.5829% 42.8200%NSPW 0011 300174 F.03.02.200099.5880 5880 2,887,050 5.4596% 981,344 7.7499% 1,636,749 7.5121% 6.9072%PSCo 0012 300360 F.03.03.200099.5880 5880 19,541,229 36.9537% 4,614,346 36.4408% 7,209,812 33.0906% 35.4950%SPS 0013 300370 F.03.04.200099.5880 5880 7,982,885 15.0961% 1,826,207 14.4221% 3,227,597 14.8136% 14.7773%Xcel Energy Transmission Holding Co 0075 300039 F.03.17.200099.5880 5880 242 0.0005% - 0.0000% 33 0.0002% 0.0002%Xcel Energy Transmission Development Co 0076 300040 F.03.18.200099.5880 5880 94 0.0002% - 0.0000% 113 0.0005% 0.0002%Xcel Energy Southwest Transmission Co 0077 300041 F.03.19.200099.5880 5880 151 0.0003% - 0.0000% 18 0.0001% 0.0001%Total 52,880,321$ 100.0000% 12,662,594$ 100.0000% 21,788,076 100.0000% 100.0000%
Allocation Changes: Prepared By Reviewed By Approved By Eff. Date
Updated Statistics
Erika Moeller Audra Lake Ross Baumgarten 4/1/2020

Northern States Power Company
XES Allocation Statistics Using FTE Hours2021 Test Year Budget
200100 Docket No. E002/GR-20-723Exhibit___(RLB-1), Schedule 5(a)
Page 37 of 117
Accounting, Reporting, Tax & Audit Services – Regulated GasSAP ACC 200100 (134)SCB038
Legal Entity Company
Cost
Center FERCLETFERC
Account Total Assets
$000's %
Revenues
$000's % FTE Hours %Allocation
%NSPM 0010 300499 F.03.01.200100.9210 9210 22,468,670$ 50.0450% 5,240,697$ 48.3620% 9,713,752 52.3361% 50.2478%NSPW 0011 300503 F.03.02.200100.9210 9210 2,887,050 6.4304% 981,344 9.0560% 1,636,749 8.8185% 8.1016%PSCo 0012 300507 F.03.03.200100.9210 9210 19,541,229 43.5246% 4,614,346 42.5820% 7,209,812 38.8453% 41.6506%Total 44,896,949$ 100.0000% 10,836,387$ 100.0000% 18,560,314 100.0000% 100.0000%
Allocation Changes: Prepared By Reviewed By Approved By Eff. Date
Updated Statistics
Erika Moeller Audra Lake Ross Baumgarten 4/1/2020

Northern States Power Company
XES Allocation Statistics Using FTE Hours2021 Test Year Budget
200101 Docket No. E002/GR-20-723Exhibit___(RLB-1), Schedule 5(a)
Page 38 of 117
Legal GasSAP ACC 200101 (164)SCB039
Legal Entity Company
Cost
Center FERCLETFERC
Account Total Assets
$000's %
Revenues
$000's % FTE Hours %Allocation
%NSPM 0010 301562 F.03.01.200101.9210 9210 22,468,670$ 50.0450% 5,240,697$ 48.3620% 9,713,752 52.3361% 50.2478%NSPW 0011 300382 F.03.02.200101.9210 9210 2,887,050 6.4304% 981,344 9.0560% 1,636,749 8.8185% 8.1016%PSCo 0012 300386 F.03.03.200101.9210 9210 19,541,229 43.5246% 4,614,346 42.5820% 7,209,812 38.8453% 41.6506%Total 44,896,949$ 100.0000% 10,836,387$ 100.0000% 18,560,314 100.0000% 100.0000%
Allocation Changes: Prepared By Reviewed By Approved By Eff. Date
Updated Statistics
Erika Moeller Audra Lake Ross Baumgarten 4/1/2020

Northern States Power Company
XES Allocation Statistics Using FTE Hours2021 Test Year Budget
200102 Docket No. E002/GR-20-723Exhibit___(RLB-1), Schedule 5(a)
Page 39 of 117
Gas Distribution FERC 880SAP ACC 200102 (470)SCB040
Legal Entity Company
Cost
Center FERCLETFERC
Account Total Assets
$000's %
Revenues
$000's % FTE Hours %Allocation
%NSPM 0010 300344 F.03.01.200102.8800 8800 22,468,670$ 50.0450% 5,240,697$ 48.3620% 9,713,752 52.3361% 50.2478%NSPW 0011 300175 F.03.02.200102.8800 8800 2,887,050 6.4304% 981,344 9.0560% 1,636,749 8.8185% 8.1016%PSCo 0012 300361 F.03.03.200102.8800 8800 19,541,229 43.5246% 4,614,346 42.5820% 7,209,812 38.8453% 41.6506%Total 44,896,949$ 100.0000% 10,836,387$ 100.0000% 18,560,314 100.0000% 100.0000%
Allocation Changes: Prepared By Reviewed By Approved By Eff. Date
Updated Statistics
Erika Moeller Audra Lake Ross Baumgarten 4/1/2020

Northern States Power Company
XES Allocation Statistics Using FTE Hours2021 Test Year Budget
200103 Docket No. E002/GR-20-723Exhibit___(RLB-1), Schedule 5(a)
Page 40 of 117
Electric Distribution PSCo & SPS FERC 588SAP ACC 200103 (472)SCB041
Legal Entity Company
Cost
Center FERCLETFERC
Account Total Assets
$000's %
Revenues
$000's % FTE Hours %Allocation
%PSCo 0012 300360 F.03.03.200103.5880 5880 19,541,229$ 70.9968% 4,614,346$ 71.6452% 7,209,812 69.0766% 70.5729%SPS 0013 300370 F.03.04.200103.5880 5880 7,982,885 29.0032% 1,826,207 28.3548% 3,227,597 30.9234% 29.4271%Total 27,524,114$ 100.0000% 6,440,553$ 100.0000% 10,437,410 100.0000% 100.0000%
Allocation Changes: Prepared By Reviewed By Approved By Eff. Date
Updated Statistics
Erika Moeller Audra Lake Ross Baumgarten 4/1/2020

Northern States Power Company
XES Allocation Statistics Using FTE Hours2021 Test Year Budget
200104 Docket No. E002/GR-20-723Exhibit___(RLB-1), Schedule 5(a)
Page 41 of 117
Accounting & Reporting – PSCo & SPSSAP ACC 200104 (124)SCB042
Legal Entity CompanyCost
Center FERCLETFERC
Account Total Assets
$000's %Revenues
$000's % FTE Hours %Allocation
%PSCo 0012 301685 F.03.03.200104.9210 9210 19,541,229$ 70.9968% 4,614,346$ 71.6452% 7,209,812 69.0766% 70.5729%SPS 0013 301476 F.03.04.200104.9210 9210 7,982,885 29.0032% 1,826,207 28.3548% 3,227,597 30.9234% 29.4271%Total 27,524,114$ 100.0000% 6,440,553$ 100.0000% 10,437,410 100.0000% 100.0000%
Allocation Changes: Prepared By Reviewed By Approved By Eff. Date
Updated Statistics
Erika Moeller Audra Lake Ross Baumgarten 4/1/2020
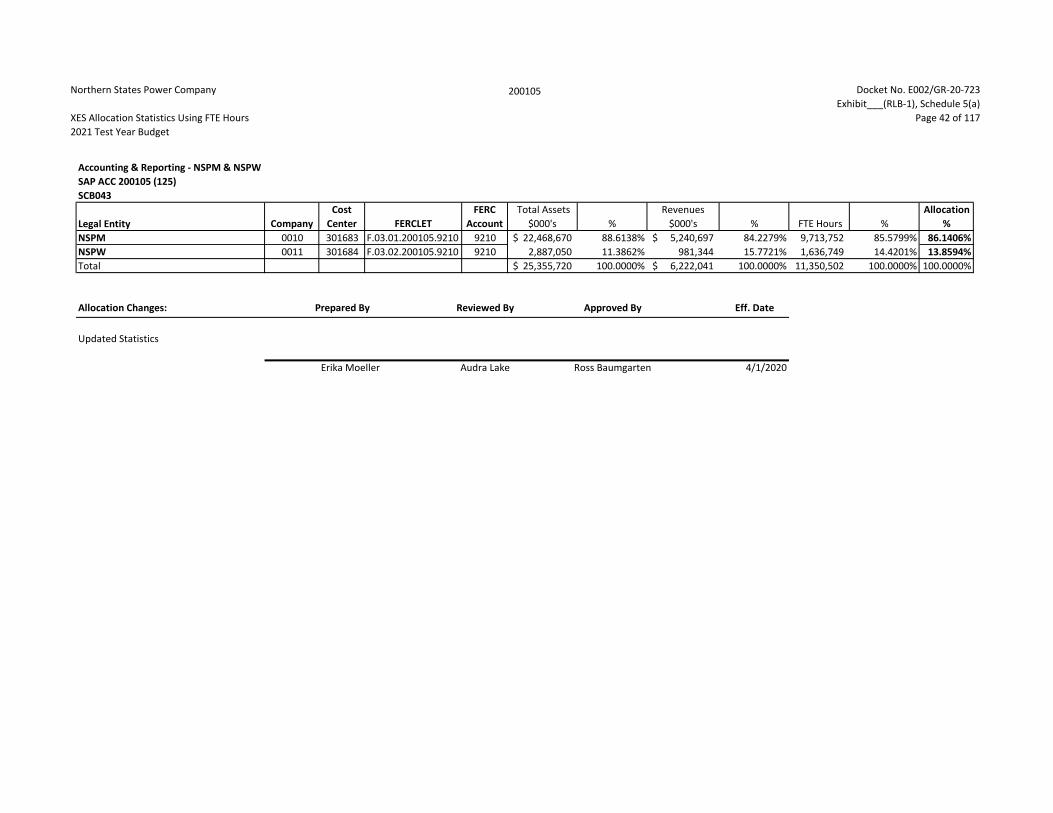
Northern States Power Company
XES Allocation Statistics Using FTE Hours2021 Test Year Budget
200105 Docket No. E002/GR-20-723Exhibit___(RLB-1), Schedule 5(a)
Page 42 of 117
Accounting & Reporting - NSPM & NSPWSAP ACC 200105 (125)SCB043
Legal Entity Company
Cost
Center FERCLETFERC
Account Total Assets
$000's %
Revenues
$000's % FTE Hours %Allocation
%NSPM 0010 301683 F.03.01.200105.9210 9210 22,468,670$ 88.6138% 5,240,697$ 84.2279% 9,713,752 85.5799% 86.1406%NSPW 0011 301684 F.03.02.200105.9210 9210 2,887,050 11.3862% 981,344 15.7721% 1,636,749 14.4201% 13.8594%Total 25,355,720$ 100.0000% 6,222,041$ 100.0000% 11,350,502 100.0000% 100.0000%
Allocation Changes: Prepared By Reviewed By Approved By Eff. Date
Updated Statistics
Erika Moeller Audra Lake Ross Baumgarten 4/1/2020

Northern States Power Company
XES Allocation Statistics Using FTE Hours2021 Test Year Budget
200106 Docket No. E002/GR-20-723Exhibit___(RLB-1), Schedule 5(a)
Page 43 of 117
Accounting & Reporting Electric - NSPM & NSPWSAP ACC 200106 (126)SCB044
Legal Entity Company
Cost
Center FERCLETFERC
Account Total Assets
$000's %
Revenues
$000's % FTE Hours %Allocation
%NSPM 0010 300498 F.03.01.200106.9210 9210 22,468,670$ 88.6138% 5,240,697$ 84.2279% 9,713,752 85.5799% 86.1406%NSPW 0011 300502 F.03.02.200106.9210 9210 2,887,050 11.3862% 981,344 15.7721% 1,636,749 14.4201% 13.8594%Total 25,355,720$ 100.0000% 6,222,041$ 100.0000% 11,350,502 100.0000% 100.0000%
Allocation Changes: Prepared By Reviewed By Approved By Eff. Date
Updated Statistics
Erika Moeller Audra Lake Ross Baumgarten 4/1/2020

Northern States Power Company
XES Allocation Statistics Using FTE Hours2021 Test Year Budget
200107 Docket No. E002/GR-20-723Exhibit___(RLB-1), Schedule 5(a)
Page 44 of 117
Legal - NSPM & NSPWSAP ACC 200107 (172)SCB045
Legal Entity Company
Cost
Center FERCLETFERC
Account Total Assets
$000's %
Revenues
$000's % FTE Hours %Allocation
%NSPM 0010 301563 F.03.01.200107.9210 9210 22,468,670$ 88.6138% 5,240,697$ 84.2279% 9,713,752 85.5799% 86.1406%NSPW 0011 302044 F.03.02.200107.9210 9210 2,887,050 11.3862% 981,344 15.7721% 1,636,749 14.4201% 13.8594%Total 25,355,720$ 100.0000% 6,222,041$ 100.0000% 11,350,502 100.0000% 100.0000%
Allocation Changes: Prepared By Reviewed By Approved By Eff. Date
Updated Statistics
Erika Moeller Audra Lake Ross Baumgarten 4/1/2020

Northern States Power Company
XES Allocation Statistics Using FTE Hours2021 Test Year Budget
200108 Docket No. E002/GR-20-723Exhibit___(RLB-1), Schedule 5(a)
Page 45 of 117
Advanced Metering Infrastructure (AMI)SAP ACC 200108SCB108
Legal Entity CompanyFinal Cost
Center FERCLETFERC
AccountNo. of AMI
Meters Allocation %NSPM 0010 301660 F.03.01.200108.9020 9020 9,035 40.9918%PSCo 0012 300506 F.03.03.200108.9020 9020 13,006 59.0082%Total 22,041 100.0000%
Allocation Changes: Prepared By Reviewed By Eff. Date
Updated Statistics
Erika Moeller Ross Baumgarten 1/1/2020

Northern States Power Company
XES Allocation Statistics Using FTE Hours2021 Test Year Budget
200111 Docket No. E002/GR-20-723Exhibit___(RLB-1), Schedule 5(a)
Page 46 of 117
Enterprise Application Integration (EAI)SAP ACC 200111 (544)SCB049 200074 200097 200119 200120 200131 200147 200150 200165 200167 200169 200170 200171 200184
Legal Entity CompanyFinal Cost
Center FERCLETFERC
AccountGeneral Ledger
Avg %CBS-ALS-CFM
Avg %GIS-OMS
Avg %Design Tool
Avg %Gas SCADA
Avg %Business Obj
Avg % IVR Avg %PeopleSoft-TIME Avg %
HR Systems
Maximo Avg %
MDMS-MRAS Avg % CRS Avg %
PowerPlan Avg %
Allocation %
NSPM 0010 300344 F.03.01.200111.8510 8510 1.9750% 0.1519% 38.8575%NSPM 0010 300344 F.03.01.200111.8710 8710 21.4318% 1.6486%NSPM 0010 300344 F.03.01.200111.8800 8800 7.5343% 9.0405% 1.2750%NSPM 0010 302058 F.03.01.200111.5880 5880 25.3910% 30.4668% 4.2968%NSPM 0010 300575 F.03.01.200111.9030 9030 34.2896% 34.9295% 5.3245%NSPM 0010 300585 F.03.01.200111.9020 9020 35.5695% 2.7361%NSPM 0010 301404 F.03.01.200111.5390 5390 0.1868% 0.0144%NSPM 0010 301403 F.03.01.200111.5060 5060 29.6386% 2.2799%NSPM 0010 301405 F.03.01.200111.5490 5490 10.6476% 0.8190%NSPM 0010 301673 F.03.01.200111.9210 9210 37.7744% 42.8200% 52.3185% 44.5819% 44.5832% 41.9720% 20.3113%NSPW 0011 300175 F.03.02.200111.8710 8710 5.3866% 0.4144% 6.3148%NSPW 0011 300175 F.03.02.200111.8800 8800 1.8936% 0.1457%NSPW 0011 300174 F.03.02.200111.5880 5880 6.0351% 0.4642%NSPW 0011 301575 F.03.02.200111.9030 9030 6.4411% 6.5486% 0.9992%NSPW 0011 301567 F.03.02.200111.9020 9020 6.6560% 0.5120%NSPW 0011 301674 F.03.02.200111.9210 9210 6.1801% 6.9072% 6.6929% 7.5120% 7.5122% 6.2325% 3.1567%NSPW 0011 301073 F.03.02.200111.5490 5490 0.4981% 0.0383%NSPW 0011 301682 F.03.02.200111.5060 5060 3.9851% 0.3065%NSPW 0011 301073 F.03.02.200111.5390 5390 3.6115% 0.2778%PSCo 0012 300361 F.03.03.200111.8710 8710 52.2766% 4.0213% 42.3795%PSCo 0012 300074 F.03.03.200111.8510 8510 18.9300% 1.4562%PSCo 0012 300360 F.03.03.200111.5880 5880 32.0369% 38.4411% 5.4214%PSCo 0012 300581 F.03.03.200111.9030 9030 43.4090% 47.2395% 6.9730%PSCo 0012 300361 F.03.03.200111.8800 8800 18.3778% 22.0516% 3.1100%PSCo 0012 300591 F.03.03.200111.9020 9020 51.0700% 3.9285%PSCo 0012 301675 F.03.03.200111.9210 9210 31.0931% 35.4950% 29.0026% 33.0898% 33.0909% 36.6215% 15.2610%PSCo 0012 301132 F.03.99.200111.4171 4171 0.7472% 0.0575%PSCo 0012 300929 F.03.03.200111.5060 5060 24.7821% 1.9063%PSCo 0012 301145 F.03.99.200111.5060 5060 0.6227% 0.0479%PSCo 0012 300967 F.03.03.200111.5390 5390 1.7435% 0.1341%PSCo 0012 300929 F.03.03.200111.5490 5490 0.8095% 0.0623%SPS 0013 300370 F.03.04.200111.5880 5880 8.7313% 0.6716% 11.5280%SPS 0013 300592 F.03.04.200111.9020 9020 6.7045% 0.5157%SPS 0013 300582 F.03.04.200111.9030 9030 15.8603% 11.2824% 2.0879%SPS 0013 301676 F.03.04.200111.9210 9210 12.9939% 14.7773% 11.9860% 14.8132% 14.8137% 15.1740% 6.5045%SPS 0013 300933 F.03.04.200111.5060 5060 22.7273% 1.7483%Eloigne 0015 300009 F.03.05.200111.9210 9210 0.0843% 0.0065% 0.0065%Reddy Kilowatt 0017 300010 F.03.06.200111.9210 9210 0.0014% 0.0001% 0.0001%United Power & Land 0019 300012 F.03.07.200111.9210 9210 0.0007% 0.0001% 0.0001%Xcel Energy 0023 300014 F.03.08.200111.9210 9210 11.5924% 0.0031% 0.8920% 0.8920%1480 Welton 0029 300020 F.03.09.200111.9210 9210 0.0162% 0.0012% 0.0012%Xcel Energy WYCO Inc. 0038 300025 F.03.10.200111.9210 9210 0.0828% 0.0064% 0.0064%PSR Investment 0041 300026 F.03.11.200111.9210 9210 0.0044% 0.0003% 0.0003%WGI 0043 300027 F.03.12.200111.9210 9210 0.0010% 0.0001% 0.0001%Xcel Energy Performance Contracting 0051 300029 F.03.13.200111.9210 9210 0.0003% 0.0000% 0.0000%Chippewa Flambeau 0057 300031 F.03.14.200111.9210 9210 0.0098% 0.0008% 0.0008%Clearwater 0058 300032 F.03.15.200111.9210 9210 0.0021% 0.0002% 0.0002%NSP Lands 0059 300033 F.03.16.200111.9210 9210 0.0000% 0.0000% 0.0000%Xcel Energy Transmission Holding Co 0075 300039 F.03.17.200111.9210 9210 0.0002% 0.0002% 0.0000% 0.0000%Xcel Energy Transmission Development Co 0076 300040 F.03.18.200111.9210 9210 0.0002% 0.0002% 0.0000% 0.0000%Xcel Energy Southwest Transmission Co 0077 300041 F.03.19.200111.9210 9210 0.0001% 0.0001% 0.0000% 0.0000%Energy Impact Fund Investments LLC 0086 302160 F.03.20.200111.9210 9210 0.0206% 0.0016% 0.0016%Nicollet Projects I LLC 0088 302162 F.03.21.200111.9210 9210 0.0415% 0.0032% 0.0032%Capital Services, LLC 0089 302163 F.03.22.200111.9210 9210 0.1002% 0.0077% 0.0077%Xcel Energy Investments LLC 0092 302240 F.03.23.200111.9210 9210 0.0003% 0.0000% 0.0000%Total 100.0000% 100.0000% 100.0000% 100.0000% 100.0000% 100.0000% 100.0000% 100.0000% 100.0000% 100.0000% 100.0000% 100.0000% 100.0000% 100.0000% 100.0000%
Allocation Changes: Prepared By Reviewed By Approved By Eff. Date
Updated Statistics
Erika Moeller Audra Lake Ross Baumgarten 4/1/2020

Northern States Power Company
XES Allocation Statistics Using FTE Hours2021 Test Year Budget
200112 Docket No. E002/GR-20-723Exhibit___(RLB-1), Schedule 5(a)
Page 47 of 117
Mainframe ChargesSAP ACC 200112 (562)SCB050 200165 200168 200170
Legal Entity CompanyCost
Center FERCLETFERC
AccountTIME/PTRS
Avg % GMS Avg %MDMSAvg
% Allocation %NSPM 0010 300344 F.03.01.200112.8660 8660 0.0016% 0.0005% 26.7176%NSPM 0010 300585 F.03.01.200112.9020 9020 35.5695% 11.8565%NSPM 0010 301673 F.03.01.200112.9210 9210 44.5819% 14.8606%NSPW 0011 301567 F.03.02.200112.9020 9020 6.6560% 2.2187% 7.2413%NSPW 0011 301674 F.03.02.200112.9210 9210 7.5120% 2.5040%NSPW 0011 300175 F.03.02.200112.8800 8800 7.5558% 2.5186%PSCo 0012 300074 F.03.03.200112.8660 8660 0.5170% 0.1723% 58.8676%PSCo 0012 301675 F.03.03.200112.9210 9210 33.0898% 11.0299%PSCo 0012 300591 F.03.03.200112.9020 9020 51.0700% 17.0233%PSCo 0012 300361 F.03.03.200112.8800 8800 91.9256% 30.6421%SPS 0013 300592 F.03.04.200112.9020 9020 6.7045% 2.2348% 7.1725%SPS 0013 301676 F.03.04.200112.9210 9210 14.8132% 4.9377%Xcel Energy 0023 300014 F.03.08.200112.9210 9210 0.0031% 0.0010% 0.0010%Total 100.0000% 100.0000% 100.0000% 100.0000% 100.0000%
Allocation Changes: Prepared By Reviewed By Approved By Eff. Date
Updated Statistics
Erika Moeller Audra Lake Ross Baumgarten 4/1/2020

Northern States Power Company
XES Allocation Statistics Using FTE Hours2021 Test Year Budget
200115 Docket No. E002/GR-20-723Exhibit___(RLB-1), Schedule 5(a)
Page 48 of 117
Miscellaneous ApplicationsSAP ACC 200115 (514)SCB053 200074 200097 200119 200120 200131 200148 200165 200168 200169 200170 200171 200180 200184
Legal Entity CompanyFinal Cost
Center FERCLETFERC
AccountGeneral Ledger
Avg %CBS-ALS-CFM
Avg %GIS-OMS
Avg %Design
Tool Avg %Gas SCADA
Avg %Bus Sys Avg
%PeopleSoft-TIME Avg % GMS Avg %
Maximo Avg %
MDMS-MRAS Avg CRS Avg %
EMS-Shared Avg
PowerPlan Avg %
Allocation %
NSPM 0010 300344 F.03.01.200115.8660 8660 0.0016% 0.0001% 35.8186%NSPM 0010 300344 F.03.01.200115.8510 8510 1.9750% 0.1519%NSPM 0010 300344 F.03.01.200115.8710 8710 21.4318% 1.6486%NSPM 0010 300575 F.03.01.200115.9030 9030 34.9295% 2.6869%NSPM 0010 300585 F.03.01.200115.9020 9020 35.5695% 2.7361%NSPM 0010 300344 F.03.01.200115.8800 8800 7.5343% 9.0405% 1.2750%NSPM 0010 302058 F.03.01.200115.5880 5880 25.3910% 30.4668% 4.2968%NSPM 0010 301404 F.03.01.200115.5390 5390 0.1868% 0.0144%NSPM 0010 300734 F.03.01.200115.5560 5560 1.0134% 0.0780%NSPM 0010 300125 F.03.01.200115.5612 5612 30.8378% 2.3721%NSPM 0010 300125 F.03.01.200115.5810 5810 9.3869% 0.7221%NSPM 0010 301673 F.03.01.200115.9210 9210 37.7744% 42.8200% 50.4433% 44.5819% 41.9720% 16.7377%NSPM 0010 301403 F.03.01.200115.5060 5060 29.6386% 2.2799%NSPM 0010 301405 F.03.01.200115.5490 5490 10.6476% 0.8190%NSPW 0011 300175 F.03.02.200115.8710 8710 5.3866% 0.4144% 6.3152%NSPW 0011 301575 F.03.02.200115.9030 9030 6.5486% 0.5037%NSPW 0011 301567 F.03.02.200115.9020 9020 6.6560% 0.5120%NSPW 0011 300174 F.03.02.200115.5880 5880 6.0351% 0.4642%NSPW 0011 300175 F.03.02.200115.8800 8800 1.8936% 7.5558% 0.7269%NSPW 0011 301674 F.03.02.200115.9210 9210 6.1801% 6.9072% 6.4799% 7.5120% 6.2325% 2.5624%NSPW 0011 301073 F.03.02.200115.5490 5490 0.4981% 0.0383%NSPW 0011 300737 F.03.02.200115.5560 5560 0.1505% 0.0116%NSPW 0011 300127 F.03.02.200115.5612 5612 4.7405% 0.3647%NSPW 0011 300127 F.03.02.200115.5810 5810 1.7257% 0.1327%NSPW 0011 301682 F.03.02.200115.5060 5060 3.9851% 0.3065%NSPW 0011 301073 F.03.02.200115.5390 5390 3.6115% 0.2778%PSCo 0012 300074 F.03.03.200115.8660 8660 0.5170% 0.0398% 46.2694%PSCo 0012 300361 F.03.03.200115.8710 8710 52.2766% 4.0213%PSCo 0012 300074 F.03.03.200115.8510 8510 18.9300% 1.4562%PSCo 0012 300581 F.03.03.200115.9030 9030 47.2395% 3.6338%PSCo 0012 300591 F.03.03.200115.9020 9020 51.0700% 3.9285%PSCo 0012 300360 F.03.03.200115.5880 5880 32.0369% 38.4411% 5.4214%PSCo 0012 300361 F.03.03.200115.8800 8800 18.3778% 22.0516% 91.9256% 10.1812%PSCo 0012 301675 F.03.03.200115.9210 9210 31.0931% 35.4950% 29.9283% 33.0898% 36.6215% 12.7867%PSCo 0012 301132 F.03.99.200115.4171 4171 0.7472% 0.0575%PSCo 0012 300929 F.03.03.200115.5060 5060 24.7821% 1.9063%PSCo 0012 300738 F.03.03.200115.5560 5560 0.7246% 0.0557%PSCo 0012 300129 F.03.03.200115.5612 5612 10.2489% 0.7884%PSCo 0012 300129 F.03.03.200115.5810 5810 22.7285% 1.7483%PSCo 0012 301145 F.03.99.200115.5060 5060 0.6227% 0.0479%PSCo 0012 300967 F.03.03.200115.5390 5390 1.7435% 0.1341%PSCo 0012 300929 F.03.03.200115.5490 5490 0.8095% 0.0623%SPS 0013 300592 F.03.04.200115.9020 9020 6.7045% 0.5157% 10.6766%SPS 0013 300582 F.03.04.200115.9030 9030 11.2824% 0.8679%SPS 0013 300370 F.03.04.200115.5880 5880 8.7313% 0.6716%SPS 0013 301676 F.03.04.200115.9210 9210 12.9939% 14.7773% 13.1485% 14.8132% 15.1740% 5.4544%SPS 0013 300933 F.03.04.200115.5060 5060 22.7273% 1.7483%SPS 0013 300741 F.03.04.200115.5560 5560 0.4301% 0.0331%SPS 0013 300131 F.03.04.200115.5612 5612 13.2027% 1.0156%SPS 0013 300131 F.03.04.200115.5810 5810 4.8104% 0.3700%Eloigne 0015 300009 F.03.05.200115.9210 9210 0.0843% 0.0065% 0.0065%Reddy Kilowatt 0017 300010 F.03.06.200115.9210 9210 0.0014% 0.0001% 0.0001%United Power & Land 0019 300012 F.03.07.200115.9210 9210 0.0007% 0.0001% 0.0001%Xcel Energy 0023 300014 F.03.08.200115.9210 9210 11.5924% 0.0031% 0.8920% 0.8920%1480 Welton 0029 300020 F.03.09.200115.9210 9210 0.0162% 0.0012% 0.0012%Xcel Energy WYCO Inc. 0038 300025 F.03.10.200115.9210 9210 0.0828% 0.0064% 0.0064%PSR Investment 0041 300026 F.03.11.200115.9210 9210 0.0044% 0.0003% 0.0003%WGI 0043 300027 F.03.12.200115.9210 9210 0.0010% 0.0001% 0.0001%Xcel Energy Performance Contracting 0051 300029 F.03.13.200115.9210 9210 0.0003% 0.0000% 0.0000%Chippewa Flambeau 0057 300031 F.03.14.200115.9210 9210 0.0098% 0.0008% 0.0008%Clearwater 0058 300032 F.03.15.200115.9210 9210 0.0021% 0.0002% 0.0002%NSP Lands 0059 300033 F.03.16.200115.9210 9210 0.0000% 0.0000% 0.0000%Xcel Energy Transmission Holding Co 0075 300039 F.03.17.200115.9210 9210 0.0002% 0.0002% 0.0000% 0.0000%Xcel Energy Transmission Development Co 0076 300040 F.03.18.200115.9210 9210 0.0002% 0.0002% 0.0000% 0.0000%Xcel Energy Southwest Transmission Co 0077 300041 F.03.19.200115.9210 9210 0.0001% 0.0001% 0.0000% 0.0000%Energy Impact Fund Investments LLC 0086 302160 F.03.20.200115.9210 9210 0.0206% 0.0016% 0.0016%Nicollet Projects I LLC 0088 302162 F.03.21.200115.9210 9210 0.0415% 0.0032% 0.0032%Capital Services, LLC 0089 302163 F.03.22.200115.9210 9210 0.1002% 0.0077% 0.0077%Xcel Energy Investments LLC 0092 302240 F.03.23.200115.9210 9210 0.0003% 0.0000% 0.0000%Total 100.0000% 100.0000% 100.0000% 100.0000% 100.0000% 100.0000% 100.0000% 100.0000% 100.0000% 100.0000% 100.0000% 100.0000% 100.0000% 100.0000% 100.0000%
Allocation Changes: Prepared By Reviewed By Approved By Eff. Date
Updated Statistics
Erika Moeller Audra Lake Ross Baumgarten 4/1/2020

Northern States Power Company
XES Allocation Statistics Using FTE Hours2021 Test Year Budget
200116 Docket No. E002/GR-20-723Exhibit___(RLB-1), Schedule 5(a)
Page 49 of 117
Distribution Electric Supervision & Engineering (S&E) FERC 580SAP ACC 200116 (441)SCB054
Legal Entity Company
Final Cost
Center FERCLETFERC
Account
Gross Electric Dist Plant
$000 Allocation %NSPM 0010 302058 F.03.01.200116.5800 5800 4,369,944$ 35.1704%NSPW 0011 300174 F.03.02.200116.5800 5800 1,038,681 8.3596%PSCo 0012 300360 F.03.03.200116.5800 5800 5,513,721 44.3758%SPS 0013 300370 F.03.04.200116.5800 5800 1,502,709 12.0942%Total 12,425,055$ 100.0000%
Allocation Changes: Prepared By Reviewed By Approved By Eff. Date
Updated Statistics
Erika Moeller Audra Lake Ross Baumgarten 4/1/2020

Northern States Power Company
XES Allocation Statistics Using FTE Hours2021 Test Year Budget
200117 Docket No. E002/GR-20-723Exhibit___(RLB-1), Schedule 5(a)
Page 50 of 117
Distribution Electric Metering FERC 586SAP ACC 200117 (453)SCB055
Legal Entity Company
Final Cost
Center FERCLETFERC
Account
Gross Electric Dist Plant
$000 Allocation %NSPM 0010 302058 F.03.01.200117.5860 5860 4,369,944$ 35.1704%NSPW 0011 300174 F.03.02.200117.5860 5860 1,038,681 8.3596%PSCo 0012 300360 F.03.03.200117.5860 5860 5,513,721 44.3758%SPS 0013 300370 F.03.04.200117.5860 5860 1,502,709 12.0942%Total 12,425,055$ 100.0000%
Allocation Changes: Prepared By Reviewed By Approved By Eff. Date
Updated Statistics
Erika Moeller Audra Lake Ross Baumgarten 4/1/2020

Northern States Power Company
XES Allocation Statistics Using FTE Hours2021 Test Year Budget
200118 Docket No. E002/GR-20-723Exhibit___(RLB-1), Schedule 5(a)
Page 51 of 117
Distribution Electric Load Dispatching/EMS FERC 581SAP ACC 200118 (527)SCB056
Legal Entity Company
Final Cost
Center FERCLETFERC
Account
Gross Electric Dist Plant
$000 Allocation %NSPM 0010 300125 F.03.01.200118.5810 5810 4,369,944$ 35.1704%NSPW 0011 300127 F.03.02.200118.5810 5810 1,038,681 8.3596%PSCo 0012 300129 F.03.03.200118.5810 5810 5,513,721 44.3758%SPS 0013 300131 F.03.04.200118.5810 5810 1,502,709 12.0942%Total 12,425,055$ 100.0000%
Allocation Changes: Prepared By Reviewed By Approved By Eff. Date
Updated Statistics
Erika Moeller Audra Lake Ross Baumgarten 4/1/2020

Northern States Power Company
XES Allocation Statistics Using FTE Hours2021 Test Year Budget
200119 Docket No. E002/GR-20-723Exhibit___(RLB-1), Schedule 5(a)
Page 52 of 117
Distribution Electric & Gas Miscellaneous FERC 588 & 880SAP ACC 200119 (506, 507, 559)SCB057 5880 8800
Legal Entity Company
Final Cost
Center FERCLETFERC
Account
Gross Electric Dist Plant
$000Gross Gas Dist
Plant $000
Combined Gross Dist Plant
$000 Allocation %NSPM 0010 300344 F.03.01.200119.8800 8800 1,296,703$ 1,296,703$ 7.5343%NSPM 0010 302058 F.03.01.200119.5880 5880 4,369,944$ 4,369,944 25.3910% 32.9253%NSPW 0011 300175 F.03.02.200119.8800 8800 325,907 325,907 1.8936%NSPW 0011 300174 F.03.02.200119.5880 5880 1,038,681 1,038,681 6.0351% 7.9287%PSCo 0012 300360 F.03.03.200119.5880 5880 5,513,721 5,513,721 32.0369%PSCo 0012 300361 F.03.03.200119.8800 8800 3,162,931 3,162,931 18.3778% 50.4147%SPS 0013 300370 F.03.04.200119.5880 5880 1,502,709 1,502,709 8.7313% 8.7313%Total 12,425,055$ 4,785,541$ 17,210,596$ 100.0000% 100.0000%
Allocation Changes: Prepared By Reviewed By Approved By Eff. Date
Updated Statistics
Erika Moeller Audra Lake Ross Baumgarten 4/1/2020
FERC Account

Northern States Power Company
XES Allocation Statistics Using FTE Hours2021 Test Year Budget
200120 Docket No. E002/GR-20-723Exhibit___(RLB-1), Schedule 5(a)
Page 53 of 117
Distribution Electric & Gas Miscellaneous NSPM & PSCo FERC 588 & 880 SAP ACC 200120 (536)SCB058 5880 8800
Legal Entity Company
Final Cost
Center FERCLETFERC
Account
Gross Electric Dist Plant
$000Gross Gas Dist
Plant $000Combined Gross Dist Plant $000 Allocation %
NSPM 0010 300344 F.03.01.200120.8800 8800 1,296,703$ 1,296,703$ 9.0405%NSPM 0010 302058 F.03.01.200120.5880 5880 4,369,944$ 4,369,944 30.4668% 39.51%PSCo 0012 300360 F.03.03.200120.5880 5880 5,513,721 5,513,721 38.4411%PSCo 0012 300361 F.03.03.200120.8800 8800 3,162,931 3,162,931 22.0516% 60.49%Total 9,883,665$ 4,459,634$ 14,343,299$ 100.0000% 100.0000%
Allocation Changes: Prepared By Reviewed By Approved By Eff. Date
Updated Statistics
Erika Moeller Audra Lake Ross Baumgarten 4/1/2020
FERC Account

Northern States Power Company
XES Allocation Statistics Using FTE Hours2021 Test Year Budget
200121 Docket No. E002/GR-20-723Exhibit___(RLB-1), Schedule 5(a)
Page 54 of 117
Distribution Electric & Gas and Transmission Gas Miscellaneous FERC 588, 880, & 859SAP ACC 200121 (474)SCB059
Legal Entity Company
Final Cost
Center FERCLETFERC
Account Utility Dist
Gross Electric Dist Plant
$000
Gross Gas Trans Plant
$000Gross Gas Dist
Plant $000
Combined Gross Plant
$000's Allocation %NSPM 0010 300344 F.03.01.200121.8590 8590 Gas Trans 119,495$ 119,495$ 0.6468%NSPM 0010 300344 F.03.01.200121.8800 8800 Gas Dist 1,296,703$ 1,296,703 7.0185%NSPM 0010 302058 F.03.01.200121.5880 5880 Electric Dist 4,369,944$ 4,369,944 23.6527% 31.3180%NSPW 0011 300175 F.03.02.200121.8800 8800 Gas Dist 325,907 325,907 1.7640%NSPW 0011 300174 F.03.02.200121.5880 5880 Electric Dist 1,038,681 1,038,681 5.6220% 7.3860%PSCo 0012 300074 F.03.03.200121.8590 8590 Gas Trans 1,145,332 1,145,332 6.1992%PSCo 0012 300361 F.03.03.200121.8800 8800 Gas Dist 3,162,931 3,162,931 17.1197%PSCo 0012 300360 F.03.03.200121.5880 5880 Electric Dist 5,513,721 5,513,721 29.8435% 53.1624%SPS 0013 300370 F.03.04.200121.5880 5880 Electric Dist 1,502,709 1,502,709 8.1336% 8.1336%Total 12,425,055$ 1,264,827$ 4,785,541$ 18,475,423$ 100.0000% 100.0000%
Allocation Changes: Prepared By Reviewed By Approved By Eff. Date
Updated Statistics
Erika Moeller Audra Lake Ross Baumgarten 4/1/2020
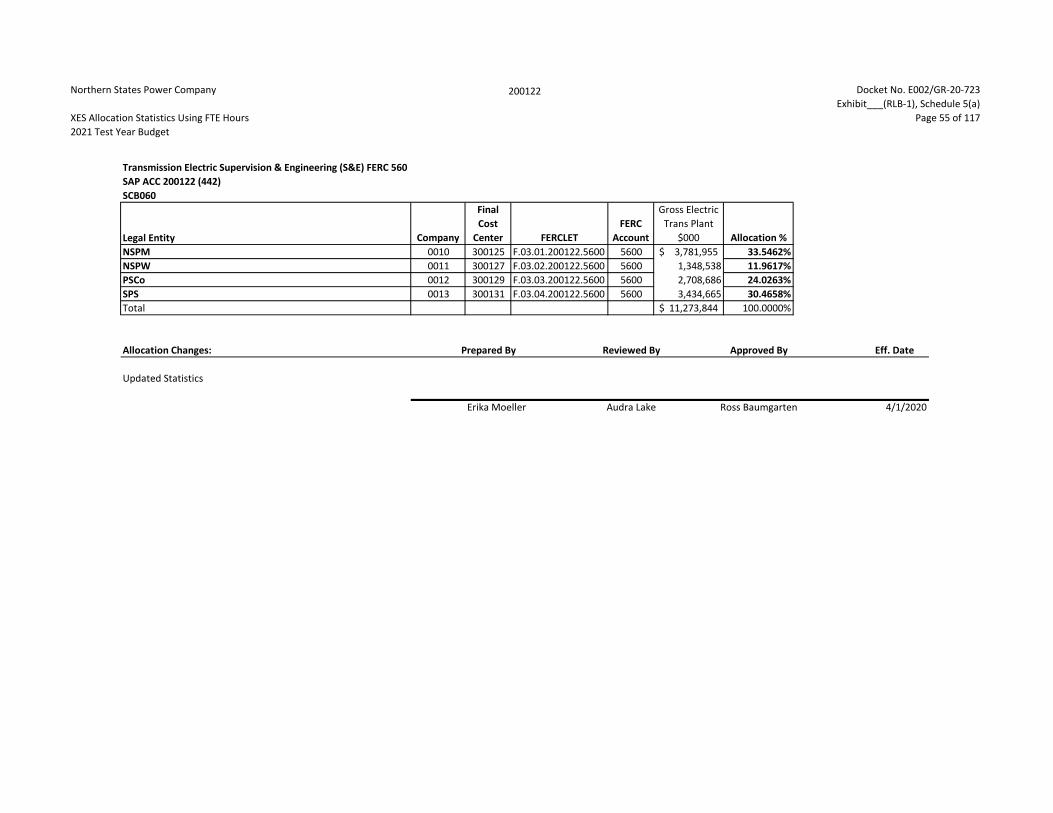
Northern States Power Company
XES Allocation Statistics Using FTE Hours2021 Test Year Budget
200122 Docket No. E002/GR-20-723Exhibit___(RLB-1), Schedule 5(a)
Page 55 of 117
Transmission Electric Supervision & Engineering (S&E) FERC 560SAP ACC 200122 (442)SCB060
Legal Entity Company
Final Cost
Center FERCLETFERC
Account
Gross Electric Trans Plant
$000 Allocation %NSPM 0010 300125 F.03.01.200122.5600 5600 3,781,955$ 33.5462%NSPW 0011 300127 F.03.02.200122.5600 5600 1,348,538 11.9617%PSCo 0012 300129 F.03.03.200122.5600 5600 2,708,686 24.0263%SPS 0013 300131 F.03.04.200122.5600 5600 3,434,665 30.4658%Total 11,273,844$ 100.0000%
Allocation Changes: Prepared By Reviewed By Approved By Eff. Date
Updated Statistics
Erika Moeller Audra Lake Ross Baumgarten 4/1/2020

Northern States Power Company
XES Allocation Statistics Using FTE Hours2021 Test Year Budget
200123 Docket No. E002/GR-20-723Exhibit___(RLB-1), Schedule 5(a)
Page 56 of 117
Transmission Electric Reliability, Planning, & Standards Development FERC 561.5SAP ACC 200123 (451)SCB061
Legal Entity Company
Final Cost
Center FERCLETFERC
Account
Gross Electric Trans Plant
$000 Allocation %NSPM 0010 300125 F.03.01.200123.5615 5615 3,781,955$ 33.5462%NSPW 0011 300127 F.03.02.200123.5615 5615 1,348,538 11.9617%PSCo 0012 300129 F.03.03.200123.5615 5615 2,708,686 24.0263%SPS 0013 300131 F.03.04.200123.5615 5615 3,434,665 30.4658%Total 11,273,844$ 100.0000%
Allocation Changes: Prepared By Reviewed By Approved By Eff. Date
Updated Statistics
Erika Moeller Audra Lake Ross Baumgarten 4/1/2020

Northern States Power Company
XES Allocation Statistics Using FTE Hours2021 Test Year Budget
200124 Docket No. E002/GR-20-723Exhibit___(RLB-1), Schedule 5(a)
Page 57 of 117
Transmission Electric Load Dispatch-Monitor and Operate Transmission System FERC 561.2SAP ACC 200124 (526)SCB062
Legal Entity Company
Final Cost
Center FERCLETFERC
Account
Gross Electric Trans Plant
$000 Allocation %NSPM 0010 300125 F.03.01.200124.5612 5612 3,781,955$ 33.5462%NSPW 0011 300127 F.03.02.200124.5612 5612 1,348,538 11.9617%PSCo 0012 300129 F.03.03.200124.5612 5612 2,708,686 24.0263%SPS 0013 300131 F.03.04.200124.5612 5612 3,434,665 30.4658%Total 11,273,844$ 100.0000%
Allocation Changes: Prepared By Reviewed By Approved By Eff. Date
Updated Statistics
Erika Moeller Audra Lake Ross Baumgarten 4/1/2020

Northern States Power Company
XES Allocation Statistics Using FTE Hours2021 Test Year Budget
200125 Docket No. E002/GR-20-723Exhibit___(RLB-1), Schedule 5(a)
Page 58 of 117
Transmission Electric Supervision & Engineering (S&E) NSPM & NSPW FERC 560 SAP ACC 200125 (449)SCB063
Legal Entity Company
Final Cost
Center FERCLETFERC
Account
Gross Electric Trans Plant
$000 Allocation %NSPM 0010 300125 F.03.01.200125.5600 5600 3,781,955$ 73.7152%NSPW 0011 300127 F.03.02.200125.5600 5600 1,348,538 26.2848%Total 5,130,493$ 100.0000%
Allocation Changes: Prepared By Reviewed By Approved By Eff. Date
Updated Statistics
Erika Moeller Audra Lake Ross Baumgarten 4/1/2020

Northern States Power Company
XES Allocation Statistics Using FTE Hours2021 Test Year Budget
200126 Docket No. E002/GR-20-723Exhibit___(RLB-1), Schedule 5(a)
Page 59 of 117
Utilities Group Administrative & General (A&G) FERC 921SAP ACC 200126 (423, 440, 525)SCB064
Legal Entity Company
Final Cost
Center FERCLETFERC
Account
Gross Electric Trans Plant
$000
Gross Electric Dist Plant
$000
Gross Gas Trans Plant
$000Gross Gas Dist
Plant $000
Combined Gross Delivery Plant $000's Allocation %
NSPM 0010 300348 F.03.01.200126.9210 9210 3,781,955$ 4,369,944$ 119,495$ 1,296,703$ 9,568,097$ 32.1625%NSPW 0011 300358 F.03.02.200126.9210 9210 1,348,538 1,038,681 - 325,907 2,713,126 9.1200%PSCo 0012 300363 F.03.03.200126.9210 9210 2,708,686 5,513,721 1,145,332 3,162,931 12,530,670 42.1209%SPS 0013 300289 F.03.04.200126.9210 9210 3,434,665 1,502,709 - - 4,937,374 16.5966%Total 11,273,844$ 12,425,055$ 1,264,827$ 4,785,541$ 29,749,267$ 100.0000%
Allocation Changes: Prepared By Reviewed By Approved By Eff. Date
Updated Statistics
Erika Moeller Audra Lake Ross Baumgarten 4/1/2020

Northern States Power Company
XES Allocation Statistics Using FTE Hours2021 Test Year Budget
200127 Docket No. E002/GR-20-723Exhibit___(RLB-1), Schedule 5(a)
Page 60 of 117
Distribution Gas Supervision & Engineering (S&E) FERC 870SAP ACC 200127 (443)SCB065
Legal Entity Company
Cost
Center FERCLETFERC
AccountGross Gas Dist
Plant $000 Allocation %NSPM 0010 300344 F.03.01.200127.8700 8700 1,296,703$ 27.0963%NSPW 0011 300175 F.03.02.200127.8700 8700 325,907 6.8102%PSCo 0012 300361 F.03.03.200127.8700 8700 3,162,931 66.0935%Total 4,785,541$ 100.0000%
Allocation Changes: Prepared By Reviewed By Approved By Eff. Date
Updated Statistics
Erika Moeller Audra Lake Ross Baumgarten 4/1/2020
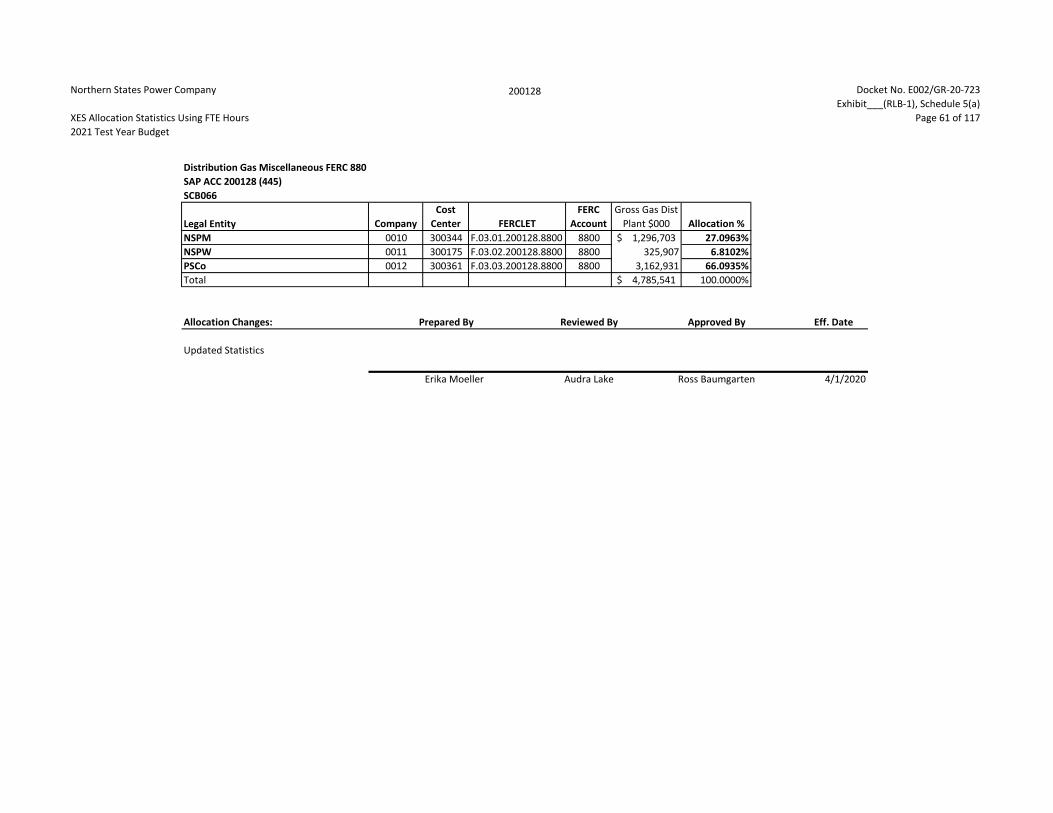
Northern States Power Company
XES Allocation Statistics Using FTE Hours2021 Test Year Budget
200128 Docket No. E002/GR-20-723Exhibit___(RLB-1), Schedule 5(a)
Page 61 of 117
Distribution Gas Miscellaneous FERC 880SAP ACC 200128 (445)SCB066
Legal Entity Company
Cost
Center FERCLETFERC
AccountGross Gas Dist
Plant $000 Allocation %NSPM 0010 300344 F.03.01.200128.8800 8800 1,296,703$ 27.0963%NSPW 0011 300175 F.03.02.200128.8800 8800 325,907 6.8102%PSCo 0012 300361 F.03.03.200128.8800 8800 3,162,931 66.0935%Total 4,785,541$ 100.0000%
Allocation Changes: Prepared By Reviewed By Approved By Eff. Date
Updated Statistics
Erika Moeller Audra Lake Ross Baumgarten 4/1/2020

Northern States Power Company
XES Allocation Statistics Using FTE Hours2021 Test Year Budget
200129 Docket No. E002/GR-20-723Exhibit___(RLB-1), Schedule 5(a)
Page 62 of 117
Distribution Gas Meters and House Regulators FERC 878SAP ACC 200129 (454)SCB067
Legal Entity Company
Cost
Center FERCLETFERC
AccountGross Gas Dist
Plant $000 Allocation %NSPM 0010 300344 F.03.01.200129.8780 8780 1,296,703$ 27.0963%NSPW 0011 300175 F.03.02.200129.8780 8780 325,907 6.8102%PSCo 0012 300361 F.03.03.200129.8780 8780 3,162,931 66.0935%Total 4,785,541$ 100.0000%
Allocation Changes: Prepared By Reviewed By Approved By Eff. Date
Updated Statistics
Erika Moeller Audra Lake Ross Baumgarten 4/1/2020

Northern States Power Company
XES Allocation Statistics Using FTE Hours2021 Test Year Budget
200130 Docket No. E002/GR-20-723Exhibit___(RLB-1), Schedule 5(a)
Page 63 of 117
Transmission Gas Supervision & Engineering (S&E) FERC 850SAP ACC 200130 (444)SCB068
Legal Entity CompanyFinal Cost
Center FERCLETFERC
Account
Gross Gas Trans Plant
$000 Allocation %NSPM 0010 300344 F.03.01.200130.8500 8500 119,495$ 9.4475%PSCo 0012 300074 F.03.03.200130.8500 8500 1,145,332 90.5525%Total 1,264,827$ 100.0000%
Allocation Changes: Prepared By Reviewed By Approved By Eff. Date
Updated Statistics
Erika Moeller Audra Lake Ross Baumgarten 4/1/2020

Northern States Power Company
XES Allocation Statistics Using FTE Hours2021 Test Year Budget
200131 Docket No. E002/GR-20-723Exhibit___(RLB-1), Schedule 5(a)
Page 64 of 117
Distribution & Transmission Gas System Control and Load Dispatching FERC 851 & 871SAP ACC 200131 (531)SCB069 8510 8710
Legal Entity CompanyFinal Cost
Center FERCLETFERC
Account
Gross Gas Trans Plant
$000Gross Gas Dist
Plant $000Combined Gross Gas Plant $000 Allocation %
NSPM 0010 300344 F.03.01.200131.8510 8510 119,495$ 119,495$ 1.9750%NSPM 0010 300344 F.03.01.200131.8710 8710 1,296,703$ 1,296,703 21.4318% 23.4068%NSPW 0011 300175 F.03.02.200131.8710 8710 325,907 325,907 5.3866% 5.3866%PSCo 0012 300361 F.03.03.200131.8710 8710 3,162,931 3,162,931 52.2766%PSCo 0012 300074 F.03.03.200131.8510 8510 1,145,332 1,145,332 18.9300% 71.2066%Total 1,264,827$ 4,785,541$ 6,050,368$ 100.0000% 100.0000%
Allocation Changes: Prepared By Reviewed By Approved By Eff. Date
Updated Statistics
Erika Moeller Audra Lake Ross Baumgarten 4/1/2020
FERC Account

Northern States Power Company
XES Allocation Statistics Using FTE Hours2021 Test Year Budget
200132 Docket No. E002/GR-20-723Exhibit___(RLB-1), Schedule 5(a)
Page 65 of 117
Payment & Reporting SAP ACC 200132 (413)SCB070
Legal Entity CompanyFinal Cost
Center FERCLETFERC
AccountTotal Invoice Transactions Allocation %
NSPM 0010 300709 F.03.01.200132.9210 9210 132,621 25.5026%NSPW 0011 300712 F.03.02.200132.9210 9210 29,998 5.7685%PSCo 0012 300715 F.03.03.200132.9210 9210 302,637 58.1960%SPS 0013 300716 F.03.04.200132.9210 9210 54,774 10.5329%Total 520,030 100.0000%
Allocation Changes: Prepared By Reviewed By Approved By Eff. Date
Updated Statistics
Erika Moeller Audra Lake Ross Baumgarten 4/1/2020

Northern States Power Company
XES Allocation Statistics Using FTE Hours2021 Test Year Budget
200133 Docket No. E002/GR-20-723Exhibit___(RLB-1), Schedule 5(a)
Page 66 of 117
Proprietary Trading - Back OfficeSAP ACC 200133 (128)SCB071
Legal Entity CompanyFinal Cost
Center FERCLETFERC
AccountMaximum Peak MWH Allocation %
NSPM 0010 301457 F.03.01.200133.9210 9210 7,300 36.6755%NSPW 0011 301459 F.03.02.200133.9210 9210 1,474 7.4056%PSCo 0012 301461 F.03.03.200133.9210 9210 6,869 34.5103%SPS 0013 301464 F.03.04.200133.9210 9210 4,261 21.4086%Total 19,904 100.0000%
Allocation Changes: Prepared By Reviewed By Eff. Date
Updated Statistics
Erika Moeller Ross Baumgarten 1/1/2020

Northern States Power Company
XES Allocation Statistics Using FTE Hours2021 Test Year Budget
200134 Docket No. E002/GR-20-723Exhibit___(RLB-1), Schedule 5(a)
Page 67 of 117
Proprietary Trading - Front/Mid Office FERC 557SAP ACC 200134 (144)SCB072
Legal Entity CompanyFinal Cost
Center FERCLETFERC
AccountMaximum Peak MWH Allocation %
NSPM 0010 300734 F.03.01.200134.5570 5570 8,774 44.0811%PSCo 0012 300738 F.03.03.200134.5570 5570 6,869 34.5103%SPS 0013 300741 F.03.04.200134.5570 5570 4,261 21.4086%Total 19,904 100.0000%
Allocation Changes: Prepared By Reviewed By Eff. Date
Updated Statistics
Erika Moeller Ross Baumgarten 1/1/2020

Northern States Power Company
XES Allocation Statistics Using FTE Hours2021 Test Year Budget
200135 Docket No. E002/GR-20-723Exhibit___(RLB-1), Schedule 5(a)
Page 68 of 117
Energy Supply Business ResourcesSAP ACC 200135 (414)SCB073
Legal Entity CompanyFinal Cost
Center FERCLETFERC
Account
MWH Generation
000's Allocation %NSPM 0010 300923 F.03.01.200135.9210 9210 22,856,529 36.1231%NSPW 0011 300926 F.03.02.200135.9210 9210 1,422,483 2.2481%PSCo 0012 300929 F.03.03.200135.9210 9210 24,122,395 38.1238%SPS 0013 300933 F.03.04.200135.9210 9210 14,872,560 23.5050%Total 63,273,967 100.0000%
Allocation Changes: Prepared By Reviewed By Approved By Eff. Date
Updated Statistics
Erika Moeller Audra Lake Ross Baumgarten 4/1/2020

Northern States Power Company
XES Allocation Statistics Using FTE Hours2021 Test Year Budget
200136 Docket No. E002/GR-20-723Exhibit___(RLB-1), Schedule 5(a)
Page 69 of 117
Energy Markets - FuelSAP ACC 200136 (415)SCB074
Legal Entity CompanyFinal Cost
Center FERCLETFERC
Account
MWH Generation
000's Allocation %NSPM 0010 301667 F.03.01.200136.9210 9210 22,856,529 36.1231%NSPW 0011 301527 F.03.02.200136.9210 9210 1,422,483 2.2481%PSCo 0012 301463 F.03.03.200136.9210 9210 24,122,395 38.1238%SPS 0013 301464 F.03.04.200136.9210 9210 14,872,560 23.5050%Total 63,273,967 100.0000%
Allocation Changes: Prepared By Reviewed By Approved By Eff. Date
Updated Statistics
Erika Moeller Audra Lake Ross Baumgarten 4/1/2020

Northern States Power Company
XES Allocation Statistics Using FTE Hours2021 Test Year Budget
200137 Docket No. E002/GR-20-723Exhibit___(RLB-1), Schedule 5(a)
Page 70 of 117
Energy Supply Miscellaneous Power Expense FERC 506, 539, & 549SAP ACC 200137 (455)SCB075 5060 5390 5490
Legal Entity CompanyFinal Cost
Center FERCLETFERC
Account
MWH Steam Generation
000's
MWH Hydro Generation
000's
MWH Other Generation
000'sTotal ES MWH
Generation Allocation %NSPM 0010 301404 F.03.01.200137.5390 5390 64,179 64,179 0.1014%NSPM 0010 301405 F.03.01.200137.5490 5490 11,394,939 11,394,939 18.0089%NSPM 0010 301403 F.03.01.200137.5060 5060 11,397,411 11,397,411 18.0128% 36.1231%NSPW 0011 301073 F.03.02.200137.5490 5490 15,404 15,404 0.0243%NSPW 0011 301682 F.03.02.200137.5060 5060 246,264 246,264 0.3892%NSPW 0011 301073 F.03.02.200137.5390 5390 1,160,815 1,160,815 1.8346% 2.2481%PSCo 0012 300967 F.03.03.200137.5390 5390 302,254 302,254 0.4777%PSCo 0012 300929 F.03.03.200137.5490 5490 11,942,792 11,942,792 18.8748%PSCo 0012 300929 F.03.03.200137.5060 5060 11,877,349 11,877,349 18.7713% 38.1238%SPS 0013 300933 F.03.04.200137.5490 5490 3,138,981 3,138,981 4.9609%SPS 0013 300933 F.03.04.200137.5060 5060 11,733,579 11,733,579 18.5441% 23.5050%Total 35,254,603 1,527,249 26,492,116 63,273,967 100.0000% 100.0000%
Allocation Changes: Prepared By Reviewed By Approved By Eff. Date
Updated Statistics
Erika Moeller Audra Lake Ross Baumgarten 4/1/2020
FERC Account

Northern States Power Company
XES Allocation Statistics Using FTE Hours2021 Test Year Budget
200138 Docket No. E002/GR-20-723Exhibit___(RLB-1), Schedule 5(a)
Page 71 of 117
Energy Supply Operation Supervision & Engineering (S&E) FERC 500, 535, & 546SAP ACC 200138 (458)SCB076 5000 5350 5460
Legal Entity CompanyFinal Cost
Center FERCLETFERC
Account
MWH Steam Generation
000's
MWH Hydro Generation
000's
MWH Other Generation
000'sTotal ES MWH
Generation Allocation %NSPM 0010 301404 F.03.01.200138.5350 5350 64,179 64,179 0.1014%NSPM 0010 301405 F.03.01.200138.5460 5460 11,394,939 11,394,939 18.0089%NSPM 0010 301403 F.03.01.200138.5000 5000 11,397,411 11,397,411 18.0128% 36.1231%NSPW 0011 301073 F.03.02.200138.5460 5460 15,404 15,404 0.0243%NSPW 0011 301682 F.03.02.200138.5000 5000 246,264 246,264 0.3892%NSPW 0011 301073 F.03.02.200138.5350 5350 1,160,815 1,160,815 1.8346% 2.2481%PSCo 0012 300967 F.03.03.200138.5350 5350 302,254 302,254 0.4777%PSCo 0012 300929 F.03.03.200138.5460 5460 11,942,792 11,942,792 18.8748%PSCo 0012 300929 F.03.03.200138.5000 5000 11,877,349 11,877,349 18.7713% 38.1238%SPS 0013 300933 F.03.04.200138.5460 5460 3,138,981 3,138,981 4.9609%SPS 0013 300933 F.03.04.200138.5000 5000 11,733,579 11,733,579 18.5441% 23.5050%Total 35,254,603 1,527,249 26,492,116 63,273,967 100.0000% 100.0000%
Allocation Changes: Prepared By Reviewed By Approved By Eff. Date
Updated Statistics
Erika Moeller Audra Lake Ross Baumgarten 4/1/2020
FERC Account

Northern States Power Company
XES Allocation Statistics Using FTE Hours2021 Test Year Budget
200139 Docket No. E002/GR-20-723Exhibit___(RLB-1), Schedule 5(a)
Page 72 of 117
Energy Supply Maintenance Supervision & Engineering (S&E) FERC 510, 541, & 551SAP ACC 200139 (461)SCB077 5100 5410 5510
Legal Entity CompanyFinal Cost
Center FERCLETFERC
Account
MWH Steam Generation
000's
MWH Hydro Generation
000's
MWH Other Generation
000'sTotal ES MWH
Generation Allocation %NSPM 0010 301404 F.03.01.200139.5410 5410 64,179 64,179 0.1014%NSPM 0010 301405 F.03.01.200139.5510 5510 11,394,939 11,394,939 18.0089%NSPM 0010 301403 F.03.01.200139.5100 5100 11,397,411 11,397,411 18.0128% 36.1231%NSPW 0011 301073 F.03.02.200139.5510 5510 15,404 15,404 0.0243%NSPW 0011 301682 F.03.02.200139.5100 5100 246,264 246,264 0.3892%NSPW 0011 301073 F.03.02.200139.5410 5410 1,160,815 1,160,815 1.8346% 2.2481%PSCo 0012 300967 F.03.03.200139.5410 5410 302,254 302,254 0.4777%PSCo 0012 300929 F.03.03.200139.5510 5510 11,942,792 11,942,792 18.8748%PSCo 0012 300929 F.03.03.200139.5100 5100 11,877,349 11,877,349 18.7713% 38.1238%SPS 0013 300933 F.03.04.200139.5510 5510 3,138,981 3,138,981 4.9609%SPS 0013 300933 F.03.04.200139.5100 5100 11,733,579 11,733,579 18.5441% 23.5050%Total 35,254,603 1,527,249 26,492,116 63,273,967 100.0000% 100.0000%
Allocation Changes: Prepared By Reviewed By Approved By Eff. Date
Updated Statistics
Erika Moeller Audra Lake Ross Baumgarten 4/1/2020
FERC Account
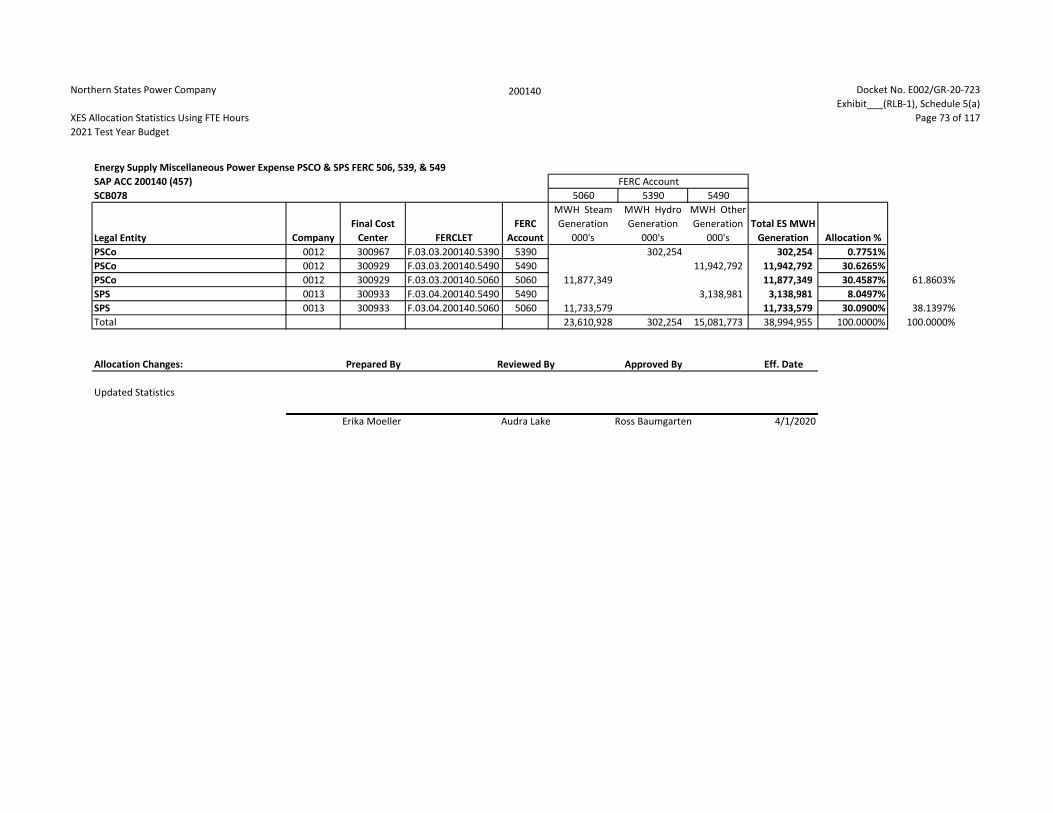
Northern States Power Company
XES Allocation Statistics Using FTE Hours2021 Test Year Budget
200140 Docket No. E002/GR-20-723Exhibit___(RLB-1), Schedule 5(a)
Page 73 of 117
Energy Supply Miscellaneous Power Expense PSCO & SPS FERC 506, 539, & 549SAP ACC 200140 (457)SCB078 5060 5390 5490
Legal Entity CompanyFinal Cost
Center FERCLETFERC
Account
MWH Steam Generation
000's
MWH Hydro Generation
000's
MWH Other Generation
000'sTotal ES MWH
Generation Allocation %PSCo 0012 300967 F.03.03.200140.5390 5390 302,254 302,254 0.7751%PSCo 0012 300929 F.03.03.200140.5490 5490 11,942,792 11,942,792 30.6265%PSCo 0012 300929 F.03.03.200140.5060 5060 11,877,349 11,877,349 30.4587% 61.8603%SPS 0013 300933 F.03.04.200140.5490 5490 3,138,981 3,138,981 8.0497%SPS 0013 300933 F.03.04.200140.5060 5060 11,733,579 11,733,579 30.0900% 38.1397%Total 23,610,928 302,254 15,081,773 38,994,955 100.0000% 100.0000%
Allocation Changes: Prepared By Reviewed By Approved By Eff. Date
Updated Statistics
Erika Moeller Audra Lake Ross Baumgarten 4/1/2020
FERC Account

Northern States Power Company
XES Allocation Statistics Using FTE Hours2021 Test Year Budget
200141 Docket No. E002/GR-20-723Exhibit___(RLB-1), Schedule 5(a)
Page 74 of 117
Energy Supply Operation Supervision & Engineering (S&E) PSCO & SPS FERC 500, 535, & 546SAP ACC 200141 (460)SCB079 5000 5350 5460
Legal Entity CompanyFinal Cost
Center FERCLETFERC
Account
MWH Steam Generation
000's
MWH Hydro Generation
000's
MWH Other Generation
000'sTotal ES MWH
Generation Allocation %PSCo 0012 300967 F.03.03.200141.5350 5350 302,254 302,254 0.7751% 61.8603%PSCo 0012 300929 F.03.03.200141.5460 5460 11,942,792 11,942,792 30.6265%PSCo 0012 300929 F.03.03.200141.5000 5000 11,877,349 11,877,349 30.4587%SPS 0013 300933 F.03.04.200141.5460 5460 3,138,981 3,138,981 8.0497% 38.1397%SPS 0013 300933 F.03.04.200141.5000 5000 11,733,579 11,733,579 30.0900%Total 23,610,928 302,254 15,081,773 38,994,955 100.0000% 100.0000%
Allocation Changes: Prepared By Reviewed By Approved By Eff. Date
Updated Statistics
Erika Moeller Audra Lake Ross Baumgarten 4/1/2020
FERC Account

Northern States Power Company
XES Allocation Statistics Using FTE Hours2021 Test Year Budget
200142 Docket No. E002/GR-20-723Exhibit___(RLB-1), Schedule 5(a)
Page 75 of 117
Energy Supply Maintenance Supervision & Engineering (S&E) PSCO & SPS FERC 510, 541, & 551SAP ACC 200142 (463)SCB080 5100 5410 5510
Legal Entity CompanyFinal Cost
Center FERCLETFERC
Account
MWH Steam Generation
000's
MWH Hydro Generation
000's
MWH Other Generation
000'sTotal ES MWH
Generation Allocation %PSCo 0012 300967 F.03.03.200142.5410 5410 302,254 302,254 0.7751% 61.8603%PSCo 0012 300929 F.03.03.200142.5510 5510 11,942,792 11,942,792 30.6265%PSCo 0012 300929 F.03.03.200142.5100 5100 11,877,349 11,877,349 30.4587%SPS 0013 300933 F.03.04.200142.5510 5510 3,138,981 3,138,981 8.0497% 38.1397%SPS 0013 300933 F.03.04.200142.5100 5100 11,733,579 11,733,579 30.0900%Total 23,610,928 302,254 15,081,773 38,994,955 100.0000% 100.0000%
Allocation Changes: Prepared By Reviewed By Approved By Eff. Date
Updated Statistics
Erika Moeller Audra Lake Ross Baumgarten 4/1/2020
FERC Account

Northern States Power Company
XES Allocation Statistics Using FTE Hours2021 Test Year Budget
200143 Docket No. E002/GR-20-723Exhibit___(RLB-1), Schedule 5(a)
Page 76 of 117
Energy Supply Miscellaneous Power Expense NSPM & NSPW FERC 506, 539, & 549SAP ACC 200143 (456)SCB081 5060 5390 5490
Legal Entity CompanyFinal Cost
Center FERCLETFERC
Account
MWH Steam Generation
000's
MWH Hydro Generation
000's
MWH Other Generation
000'sTotal ES MWH
Generation Allocation %NSPM 0010 301404 F.03.01.200143.5390 5390 64,179 64,179 0.2643% 94.1412%NSPM 0010 301405 F.03.01.200143.5490 5490 11,394,939 11,394,939 46.9333%NSPM 0010 301403 F.03.01.200143.5060 5060 11,397,411 11,397,411 46.9436%NSPW 0011 301073 F.03.02.200143.5490 5490 15,404 15,404 0.0634% 5.8588%NSPW 0011 301682 F.03.02.200143.5060 5060 246,264 246,264 1.0143%NSPW 0011 301073 F.03.02.200143.5390 5390 1,160,815 1,160,815 4.7811%Total 11,643,676 1,224,994 11,410,343 24,279,012 100.0000% 100.0000%
Allocation Changes: Prepared By Reviewed By Approved By Eff. Date
Updated Statistics
Erika Moeller Audra Lake Ross Baumgarten 4/1/2020
FERC Account

Northern States Power Company
XES Allocation Statistics Using FTE Hours2021 Test Year Budget
200144 Docket No. E002/GR-20-723Exhibit___(RLB-1), Schedule 5(a)
Page 77 of 117
Energy Supply Operation Supervision & Engineering (S&E) NSPM & NSPW FERC 500, 535, & 546SAP ACC 200144 (459)SCB082 5000 5350 5460
Legal Entity CompanyFinal Cost
Center FERCLETFERC
Account
MWH Steam Generation
000's
MWH Hydro Generation
000's
MWH Other Generation
000'sTotal ES MWH
Generation Allocation %NSPM 0010 301404 F.03.01.200144.5350 5350 64,179 64,179 0.2643% 94.1412%NSPM 0010 301405 F.03.01.200144.5460 5460 11,394,939 11,394,939 46.9333%NSPM 0010 301403 F.03.01.200144.5000 5000 11,397,411 11,397,411 46.9436%NSPW 0011 301073 F.03.02.200144.5460 5460 15,404 15,404 0.0634% 5.8588%NSPW 0011 301682 F.03.02.200144.5000 5000 246,264 246,264 1.0143%NSPW 0011 301073 F.03.02.200144.5350 5350 1,160,815 1,160,815 4.7811%Total 11,643,676 1,224,994 11,410,343 24,279,012 100.0000% 100.0000%
Allocation Changes: Prepared By Reviewed By Approved By Eff. Date
Updated Statistics
Erika Moeller Audra Lake Ross Baumgarten 4/1/2020
FERC Account

Northern States Power Company
XES Allocation Statistics Using FTE Hours2021 Test Year Budget
200145 Docket No. E002/GR-20-723Exhibit___(RLB-1), Schedule 5(a)
Page 78 of 117
Energy Supply Maintenance Supervision & Engineering (S&E) NSPM & NSPW FERC 510, 541, & 551SAP ACC 200145 (462)SCB083 5100 5410 5510
Legal Entity CompanyFinal Cost
Center FERCLETFERC
Account
MWH Steam Generation
000's
MWH Hydro Generation
000's
MWH Other Generation
000'sTotal ES MWH
Generation Allocation %NSPM 0010 301404 F.03.01.200145.5410 5410 64,179 64,179 0.2643% 94.1412%NSPM 0010 301405 F.03.01.200145.5510 5510 11,394,939 11,394,939 46.9333%NSPM 0010 301403 F.03.01.200145.5100 5100 11,397,411 11,397,411 46.9436%NSPW 0011 301073 F.03.02.200145.5510 5510 15,404 15,404 0.0634% 5.8588%NSPW 0011 301682 F.03.02.200145.5100 5100 246,264 246,264 1.0143%NSPW 0011 301073 F.03.02.200145.5410 5410 1,160,815 1,160,815 4.7811%Total 11,643,676 1,224,994 11,410,343 24,279,012 100.0000% 100.0000%
Allocation Changes: Prepared By Reviewed By Approved By Eff. Date
Updated Statistics
Erika Moeller Audra Lake Ross Baumgarten 4/1/2020
FERC Account

Northern States Power Company
XES Allocation Statistics Using FTE Hours2021 Test Year Budget
200146 Docket No. E002/GR-20-723Exhibit___(RLB-1), Schedule 5(a)
Page 79 of 117
Energy Markets - Regulated TradingSAP ACC 200146 (429)SCB084
Legal Entity CompanyFinal Cost
Center FERCLETFERC
Account
Total MWh Hour Sales
000's Allocation %NSPM 0010 301457 F.03.01.200146.9210 9210 42,756,896 36.2782%NSPW 0011 301459 F.03.02.200146.9210 9210 6,789,827 5.7610%PSCo 0012 301461 F.03.03.200146.9210 9210 37,417,689 31.7480%SPS 0013 301464 F.03.04.200146.9210 9210 30,893,961 26.2128%Total 117,858,374 100.0000%
Allocation Changes: Prepared By Reviewed By Approved By Eff. Date
Updated Statistics
Erika Moeller Audra Lake Ross Baumgarten 4/1/2020

Northern States Power Company
XES Allocation Statistics Using FTE Hours2021 Test Year Budget
200147 Docket No. E002/GR-20-723Exhibit___(RLB-1), Schedule 5(a)
Page 80 of 117
Business ObjectsSAP ACC 200147 (554)SCB085
Legal Entity CompanyFinal Cost
Center FERCLETFERC
Account
No. of Business
Objects users Allocation %NSPM 0010 301673 F.03.01.200147.9210 9210 1,196 52.3185%NSPW 0011 301674 F.03.02.200147.9210 9210 153 6.6929%PSCo 0012 301675 F.03.03.200147.9210 9210 663 29.0026%SPS 0013 301676 F.03.04.200147.9210 9210 274 11.9860%Total 2,286 100.0000%
Allocation Changes: Prepared By Reviewed By Approved By Eff. Date
Updated Statistics
Erika Moeller Audra Lake Ross Baumgarten 4/1/2020

Northern States Power Company
XES Allocation Statistics Using FTE Hours2021 Test Year Budget
200148 Docket No. E002/GR-20-723Exhibit___(RLB-1), Schedule 5(a)
Page 81 of 117
Business Systems SAP ACC 200148 (500, 524)SCB086
Legal Entity CompanyFinal Cost
Center FERCLETFERC
AccountNo. of
Computers Allocation %NSPM 0010 301673 F.03.01.200148.9210 9210 5,348 50.4433%NSPW 0011 301674 F.03.02.200148.9210 9210 687 6.4799%PSCo 0012 301675 F.03.03.200148.9210 9210 3,173 29.9283%SPS 0013 301676 F.03.04.200148.9210 9210 1,394 13.1485%Total 10,602 100.0000%
Allocation Changes: Prepared By Reviewed By Approved By Eff. Date
Updated Statistics
Erika Moeller Audra Lake Ross Baumgarten 4/1/2020

Northern States Power Company
XES Allocation Statistics Using FTE Hours2021 Test Year Budget
200149 Docket No. E002/GR-20-723Exhibit___(RLB-1), Schedule 5(a)
Page 82 of 117
Customer & Enterprise Solutions (CES)SAP ACC 200149 (534)SCB087
Legal Entity CompanyFinal Cost
Center FERCLETFERC
AccountNo. of
Computers %
Customers Excluding Wholesale % FTE Hours %
Allocation %
NSPM 0010 301673 F.03.01.200149.9210 9210 5,348 50.4433% 2,013,413 35.3489% 9,713,752 44.5832% 43.4585%NSPW 0011 301674 F.03.02.200149.9210 9210 687 6.4799% 377,026 6.6193% 1,636,749 7.5122% 6.8705%PSCo 0012 301675 F.03.03.200149.9210 9210 3,173 29.9283% 2,910,725 51.1027% 7,209,812 33.0909% 38.0406%SPS 0013 301676 F.03.04.200149.9210 9210 1,394 13.1485% 394,668 6.9291% 3,227,597 14.8137% 11.6304%Total 10,602 100.0000% 5,695,832 100.0000% 21,787,911 100.0000% 100.0000%
Allocation Changes: Prepared By Reviewed By Approved By Eff. Date
Updated Statistics
Erika Moeller Audra Lake Ross Baumgarten 4/1/2020

Northern States Power Company
XES Allocation Statistics Using FTE Hours2021 Test Year Budget
200150 Docket No. E002/GR-20-723Exhibit___(RLB-1), Schedule 5(a)
Page 83 of 117
Interactive Voice Response (IVR)SAP ACC 200150 (520)SCB088
Legal Entity CompanyFinal Cost
Center FERCLETFERC
AccountNo. of
Contacts Allocation %NSPM 0010 300575 F.03.01.200150.9030 9030 1,447,435 34.2896%NSPW 0011 301575 F.03.02.200150.9030 9030 271,892 6.4411%PSCo 0012 300581 F.03.03.200150.9030 9030 1,832,389 43.4090%SPS 0013 300582 F.03.04.200150.9030 9030 669,495 15.8603%Total 4,221,211 100.0000%
Allocation Changes: Prepared By Reviewed By Approved By Eff. Date
Updated Statistics
Erika Moeller Audra Lake Ross Baumgarten 4/1/2020

Northern States Power Company
XES Allocation Statistics Using FTE Hours2021 Test Year Budget
200151 Docket No. E002/GR-20-723Exhibit___(RLB-1), Schedule 5(a)
Page 84 of 117
Customer Billing FERC 903SAP ACC 200151 (447)SCB089
Legal Entity CompanyFinal Cost
Center FERCLETFERC
AccountNo. of
Customer Bills Allocation %NSPM 0010 300605 F.03.01.200151.9030 9030 1,513,277 39.2309%NSPW 0011 301567 F.03.02.200151.9030 9030 260,656 6.7574%PSCo 0012 300611 F.03.03.200151.9030 9030 1,758,283 45.5825%SPS 0013 302046 F.03.04.200151.9030 9030 325,144 8.4292%Total 3,857,360 100.0000%
Allocation Changes: Prepared By Reviewed By Approved By Eff. Date
Updated Statistics
Erika Moeller Audra Lake Ross Baumgarten 4/1/2020
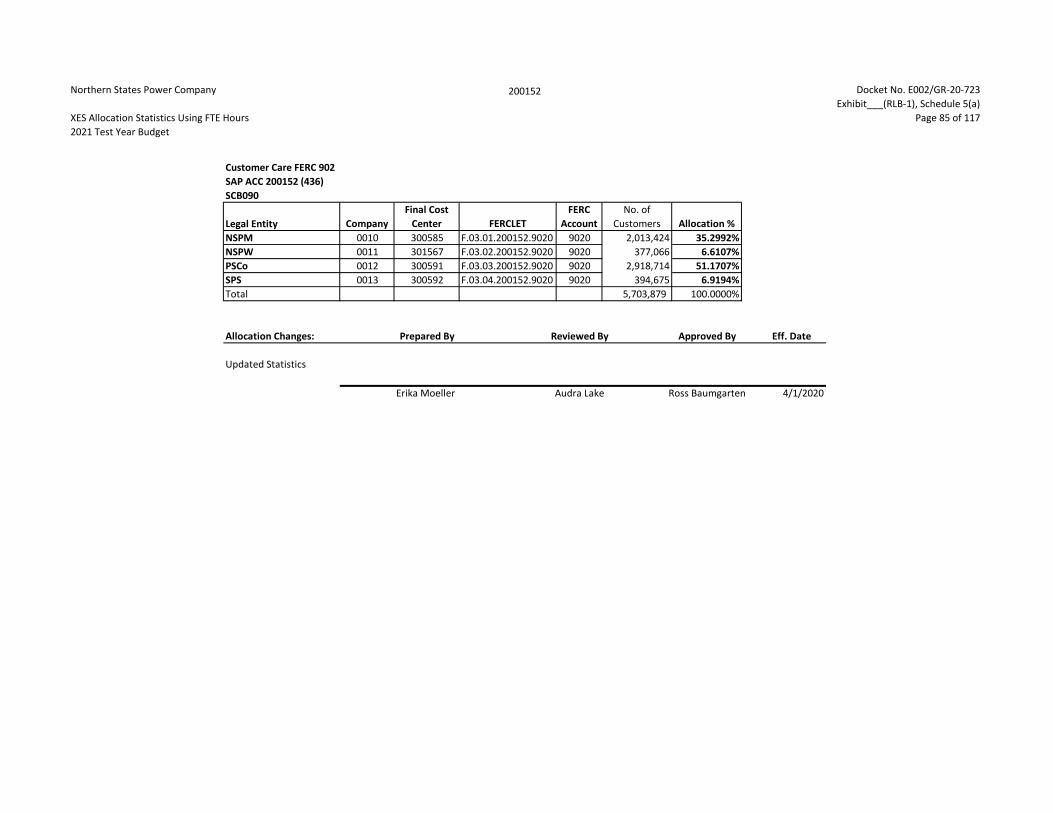
Northern States Power Company
XES Allocation Statistics Using FTE Hours2021 Test Year Budget
200152 Docket No. E002/GR-20-723Exhibit___(RLB-1), Schedule 5(a)
Page 85 of 117
Customer Care FERC 902SAP ACC 200152 (436)SCB090
Legal Entity CompanyFinal Cost
Center FERCLETFERC
AccountNo. of
Customers Allocation %NSPM 0010 300585 F.03.01.200152.9020 9020 2,013,424 35.2992%NSPW 0011 301567 F.03.02.200152.9020 9020 377,066 6.6107%PSCo 0012 300591 F.03.03.200152.9020 9020 2,918,714 51.1707%SPS 0013 300592 F.03.04.200152.9020 9020 394,675 6.9194%Total 5,703,879 100.0000%
Allocation Changes: Prepared By Reviewed By Approved By Eff. Date
Updated Statistics
Erika Moeller Audra Lake Ross Baumgarten 4/1/2020

Northern States Power Company
XES Allocation Statistics Using FTE Hours2021 Test Year Budget
200153 Docket No. E002/GR-20-723Exhibit___(RLB-1), Schedule 5(a)
Page 86 of 117
Customer Safety Advertising & Information CostsSAC APP 200153 (185)SCB091
Legal Entity CompanyFinal Cost
Center FERCLETFERC
Account
No. of Customers Excluding Wholesale Allocation %
NSPM 0010 300426 F.03.01.200153.9210 9210 2,013,413 35.3489%NSPW 0011 300429 F.03.02.200153.9210 9210 377,026 6.6193%PSCo 0012 300432 F.03.03.200153.9210 9210 2,910,725 51.1027%SPS 0013 300433 F.03.04.200153.9210 9210 394,668 6.9291%Total 5,695,832 100.0000%
Allocation Changes: Prepared By Reviewed By Approved By Eff. Date
Updated Statistics
Erika Moeller Audra Lake Ross Baumgarten 4/1/2020

Northern States Power Company
XES Allocation Statistics Using FTE Hours2021 Test Year Budget
200154 Docket No. E002/GR-20-723Exhibit___(RLB-1), Schedule 5(a)
Page 87 of 117
Customer Service Information Technology (IT) FERC 903 SAP ACC 200154 (403)SCB092
Legal Entity CompanyFinal Cost
Center FERCLETFERC
Account
No. of Customers Excluding Wholesale Allocation %
NSPM 0010 300575 F.03.01.200154.9030 9030 2,013,413 35.3489%NSPW 0011 301575 F.03.02.200154.9030 9030 377,026 6.6193%PSCo 0012 300581 F.03.03.200154.9030 9030 2,910,725 51.1027%SPS 0013 300582 F.03.04.200154.9030 9030 394,668 6.9291%Total 5,695,832 100.0000%
Allocation Changes: Prepared By Reviewed By Approved By Eff. Date
Updated Statistics
Erika Moeller Audra Lake Ross Baumgarten 4/1/2020

Northern States Power Company
XES Allocation Statistics Using FTE Hours2021 Test Year Budget
200155 Docket No. E002/GR-20-723Exhibit___(RLB-1), Schedule 5(a)
Page 88 of 117
Customer Care FERC 903SAP ACC 200155 (435)SCB093
Legal Entity CompanyFinal Cost
Center FERCLETFERC
Account
No. of Customers Excluding Wholesale Allocation %
NSPM 0010 300555 F.03.01.200155.9030 9030 2,013,413 35.3489%NSPW 0011 301567 F.03.02.200155.9030 9030 377,026 6.6193%PSCo 0012 300561 F.03.03.200155.9030 9030 2,910,725 51.1027%SPS 0013 300562 F.03.04.200155.9030 9030 394,668 6.9291%Total 5,695,832 100.0000%
Allocation Changes: Prepared By Reviewed By Approved By Eff. Date
Updated Statistics
Erika Moeller Audra Lake Ross Baumgarten 4/1/2020
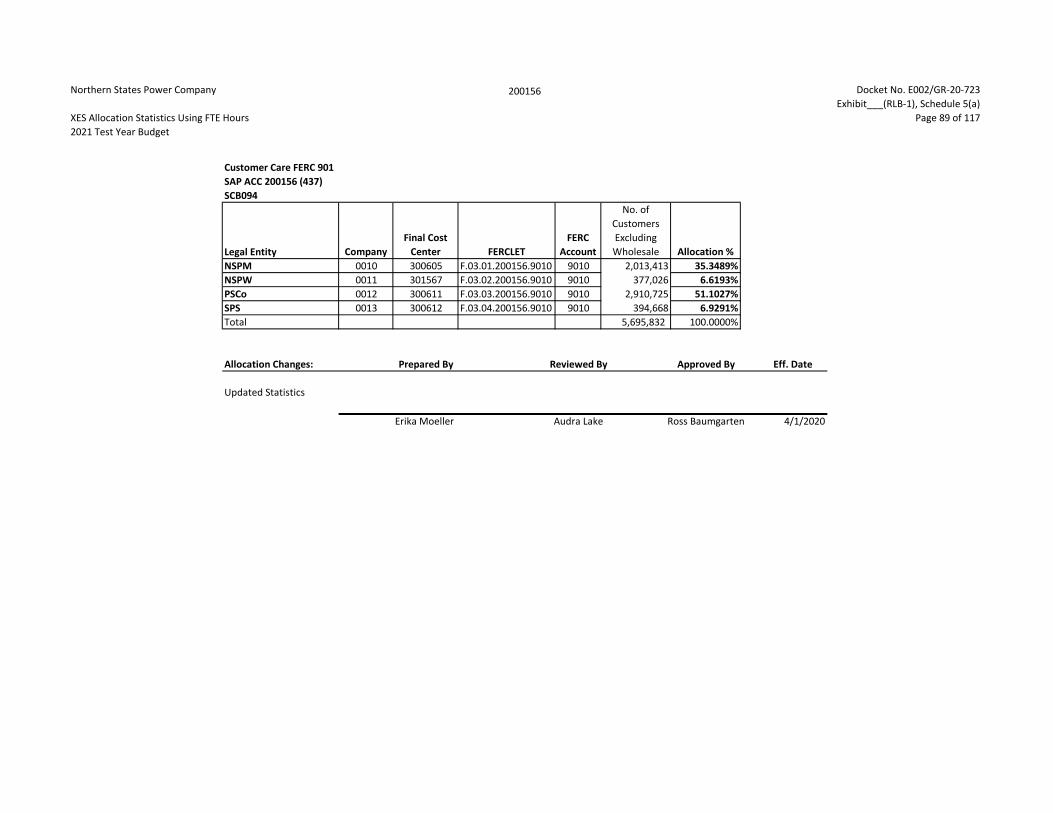
Northern States Power Company
XES Allocation Statistics Using FTE Hours2021 Test Year Budget
200156 Docket No. E002/GR-20-723Exhibit___(RLB-1), Schedule 5(a)
Page 89 of 117
Customer Care FERC 901SAP ACC 200156 (437)SCB094
Legal Entity CompanyFinal Cost
Center FERCLETFERC
Account
No. of Customers Excluding Wholesale Allocation %
NSPM 0010 300605 F.03.01.200156.9010 9010 2,013,413 35.3489%NSPW 0011 301567 F.03.02.200156.9010 9010 377,026 6.6193%PSCo 0012 300611 F.03.03.200156.9010 9010 2,910,725 51.1027%SPS 0013 300612 F.03.04.200156.9010 9010 394,668 6.9291%Total 5,695,832 100.0000%
Allocation Changes: Prepared By Reviewed By Approved By Eff. Date
Updated Statistics
Erika Moeller Audra Lake Ross Baumgarten 4/1/2020

Northern States Power Company
XES Allocation Statistics Using FTE Hours2021 Test Year Budget
200157 Docket No. E002/GR-20-723Exhibit___(RLB-1), Schedule 5(a)
Page 90 of 117
Customer Service Information Technology (IT) PSCo & SPS FERC 903SAP ACC 200157 (404)SCB095
Legal Entity CompanyFinal Cost
Center FERCLETFERC
Account
No. of Customers Excluding Wholesale Allocation %
PSCo 0012 300581 F.03.03.200157.9030 9030 2,910,725 88.0599%SPS 0013 300582 F.03.04.200157.9030 9030 394,668 11.9401%Total 3,305,393 100.0000%
Allocation Changes: Prepared By Reviewed By Approved By Eff. Date
Updated Statistics
Erika Moeller Audra Lake Ross Baumgarten 4/1/2020

Northern States Power Company
XES Allocation Statistics Using FTE Hours2021 Test Year Budget
200158 Docket No. E002/GR-20-723Exhibit___(RLB-1), Schedule 5(a)
Page 91 of 117
Customer Care PSCo & SPS FERC 903 SAP ACC 200158 (438)SCB096
Legal Entity CompanyFinal Cost
Center FERCLETFERC
Account
No. of Customers Excluding Wholesale Allocation %
PSCo 0012 300561 F.03.03.200158.9030 9030 2,910,725 88.0599%SPS 0013 300562 F.03.04.200158.9030 9030 394,668 11.9401%Total 3,305,393 100.0000%
Allocation Changes: Prepared By Reviewed By Approved By Eff. Date
Updated Statistics
Erika Moeller Audra Lake Ross Baumgarten 4/1/2020
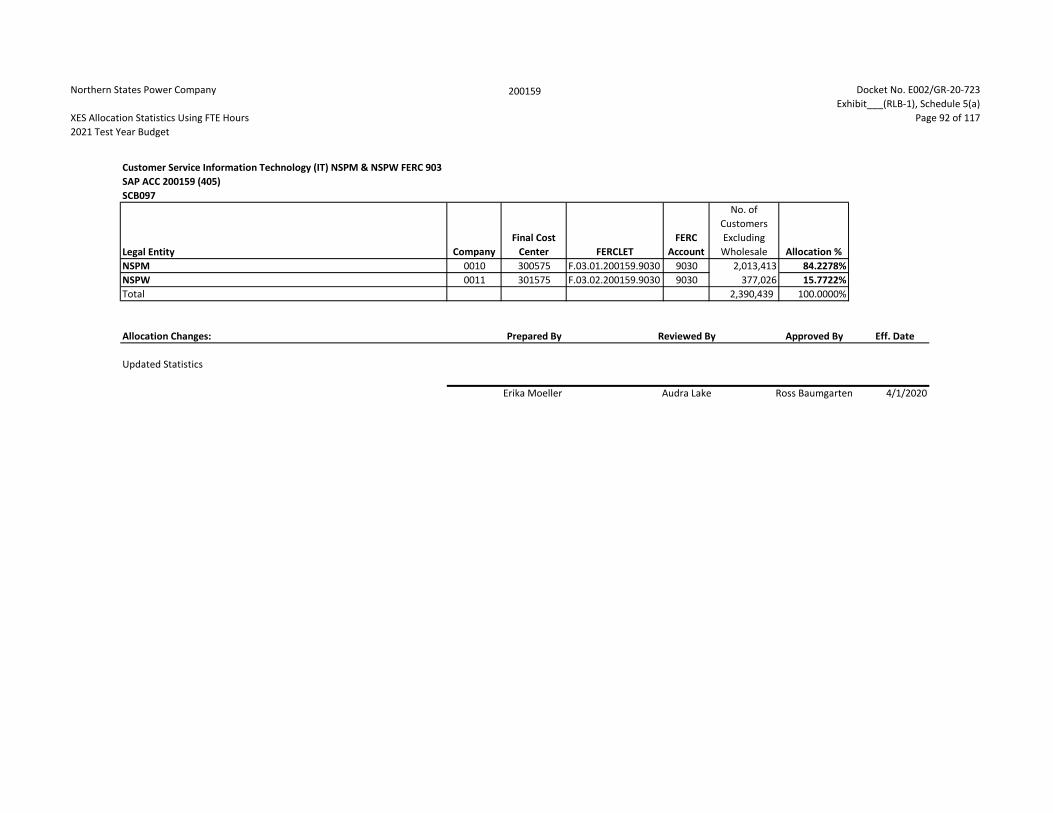
Northern States Power Company
XES Allocation Statistics Using FTE Hours2021 Test Year Budget
200159 Docket No. E002/GR-20-723Exhibit___(RLB-1), Schedule 5(a)
Page 92 of 117
Customer Service Information Technology (IT) NSPM & NSPW FERC 903SAP ACC 200159 (405)SCB097
Legal Entity CompanyFinal Cost
Center FERCLETFERC
Account
No. of Customers Excluding Wholesale Allocation %
NSPM 0010 300575 F.03.01.200159.9030 9030 2,013,413 84.2278%NSPW 0011 301575 F.03.02.200159.9030 9030 377,026 15.7722%Total 2,390,439 100.0000%
Allocation Changes: Prepared By Reviewed By Approved By Eff. Date
Updated Statistics
Erika Moeller Audra Lake Ross Baumgarten 4/1/2020
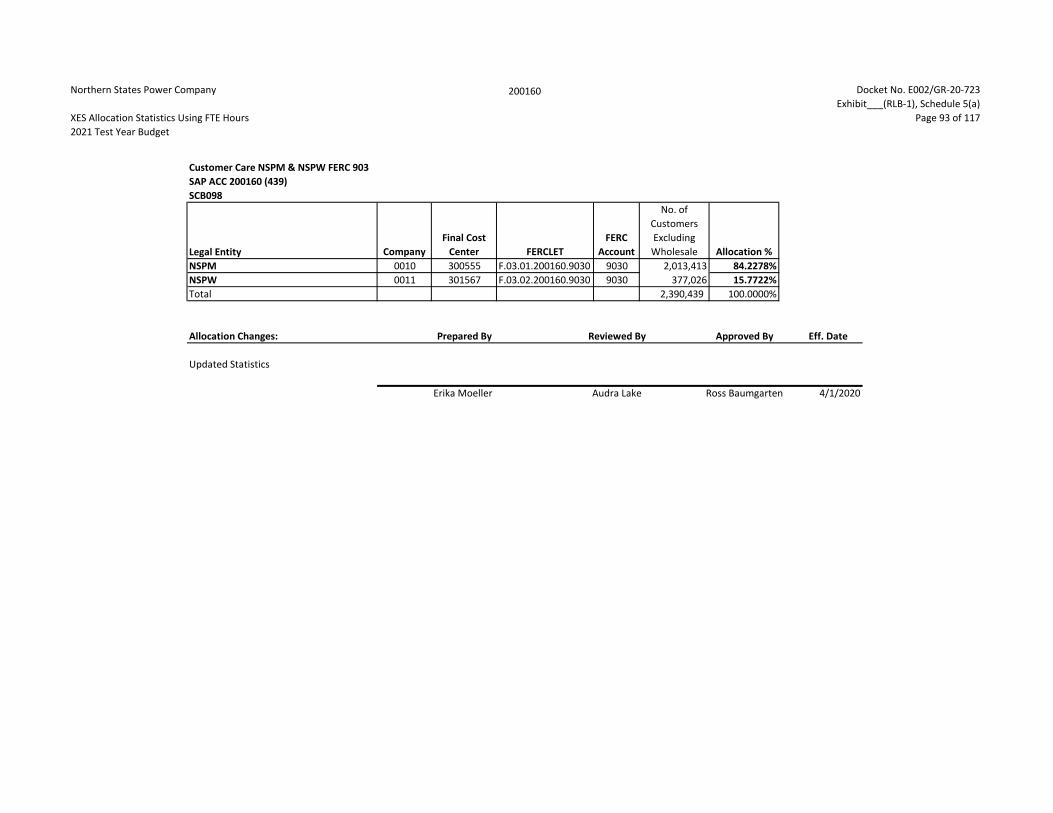
Northern States Power Company
XES Allocation Statistics Using FTE Hours2021 Test Year Budget
200160 Docket No. E002/GR-20-723Exhibit___(RLB-1), Schedule 5(a)
Page 93 of 117
Customer Care NSPM & NSPW FERC 903 SAP ACC 200160 (439)SCB098
Legal Entity CompanyFinal Cost
Center FERCLETFERC
Account
No. of Customers Excluding Wholesale Allocation %
NSPM 0010 300555 F.03.01.200160.9030 9030 2,013,413 84.2278%NSPW 0011 301567 F.03.02.200160.9030 9030 377,026 15.7722%Total 2,390,439 100.0000%
Allocation Changes: Prepared By Reviewed By Approved By Eff. Date
Updated Statistics
Erika Moeller Audra Lake Ross Baumgarten 4/1/2020

Northern States Power Company
XES Allocation Statistics Using FTE Hours2021 Test Year Budget
200161 Docket No. E002/GR-20-723Exhibit___(RLB-1), Schedule 5(a)
Page 94 of 117
Customer Care Low Income Assistance FERC 908SAP ACC 200161 (446)SCB099
Legal Entity CompanyFinal Cost
Center FERCLETFERC
Account
No. of Residential Customers %
No. of Low Income Customer
Calls %Allocation
%NSPM 0010 300565 F.03.01.200161.9080 9080 1,802,029 35.8508% 53,045 48.5297% 42.1903%NSPW 0011 301567 F.03.02.200161.9080 9080 322,171 6.4095% 5,704 5.2185% 5.8140%PSCo 0012 300615 F.03.03.200161.9080 9080 2,591,751 51.5621% 39,709 36.3290% 43.9455%SPS 0013 300582 F.03.04.200161.9080 9080 310,514 6.1776% 10,846 9.9228% 8.0502%Total 5,026,466 100.0000% 109,304 100.0000% 100.0000%
Allocation Changes: Prepared By Reviewed By Approved By Eff. Date
Updated Statistics
Erika Moeller Audra Lake Ross Baumgarten 4/1/2020

Northern States Power Company
XES Allocation Statistics Using FTE Hours2021 Test Year Budget
200162 Docket No. E002/GR-20-723Exhibit___(RLB-1), Schedule 5(a)
Page 95 of 117
Call Logging and Quality Management (CL/QM) FERC 903SAP ACC 200162 (519)SCB100
Legal Entity CompanyFinal Cost
Center FERCLETFERC
Account
No. of Customers Excluding %
No. of Contacts %
Allocation %
NSPM 0010 300575 F.03.01.200162.9030 9030 2,013,413 35.3489% 1,447,435 34.2896% 34.8192%NSPW 0011 301575 F.03.02.200162.9030 9030 377,026 6.6193% 271,892 6.4411% 6.5302%PSCo 0012 300581 F.03.03.200162.9030 9030 2,910,725 51.1027% 1,832,389 43.4091% 47.2559%SPS 0013 300582 F.03.04.200162.9030 9030 394,668 6.9291% 669,495 15.8603% 11.3947%Total 5,695,832 100.0000% 4,221,211 100.0000% 100.0000%
Allocation Changes: Prepared By Reviewed By Approved By Eff. Date
Updated Statistics
Erika Moeller Audra Lake Ross Baumgarten 4/1/2020

Northern States Power Company
XES Allocation Statistics Using FTE Hours2021 Test Year Budget
200163 Docket No. E002/GR-20-723Exhibit___(RLB-1), Schedule 5(a)
Page 96 of 117
Employee CommunicationsSAP ACC 200163 (181)SCB101
Legal Entity CompanyFinal Cost
Center FERCLETFERC
Account FTE Hours Allocation %NSPM 0010 301392 F.03.01.200163.9210 9210 9,713,752 44.5819%NSPW 0011 301393 F.03.02.200163.9210 9210 1,636,749 7.5120%PSCo 0012 301394 F.03.03.200163.9210 9210 7,209,812 33.0898%SPS 0013 301395 F.03.04.200163.9210 9210 3,227,597 14.8132%Xcel Energy 0023 300014 F.03.08.200163.9210 9210 682 0.0031%Total 21,788,593 100.0000%
Allocation Changes: Prepared By Reviewed By Approved By Eff. Date
Updated Statistics
Erika Moeller Audra Lake Ross Baumgarten 4/1/2020

Northern States Power Company
XES Allocation Statistics Using FTE Hours2021 Test Year Budget
200164 Docket No. E002/GR-20-723Exhibit___(RLB-1), Schedule 5(a)
Page 97 of 117
PayrollSAP ACC 200164 (198)SCB102
Legal Entity CompanyFinal Cost
Center FERCLETFERC
Account FTE Hours Allocation %NSPM 0010 300416 F.03.01.200164.9210 9210 9,713,752 44.5819%NSPW 0011 300419 F.03.02.200164.9210 9210 1,636,749 7.5120%PSCo 0012 300422 F.03.03.200164.9210 9210 7,209,812 33.0898%SPS 0013 300423 F.03.04.200164.9210 9210 3,227,597 14.8132%Xcel Energy 0023 300014 F.03.08.200164.9210 9210 682 0.0031%Total 21,788,593 100.0000%
Allocation Changes: Prepared By Reviewed By Approved By Eff. Date
Updated Statistics
Erika Moeller Audra Lake Ross Baumgarten 4/1/2020

Northern States Power Company
XES Allocation Statistics Using FTE Hours2021 Test Year Budget
200165 Docket No. E002/GR-20-723Exhibit___(RLB-1), Schedule 5(a)
Page 98 of 117
Employee Management SystemsSAP ACC 200165 (515, 521, 552)SCB103
Legal Entity CompanyFinal Cost
Center FERCLETFERC
Account FTE Hours Allocation %NSPM 0010 301673 F.03.01.200165.9210 9210 9,713,752 44.5819%NSPW 0011 301674 F.03.02.200165.9210 9210 1,636,749 7.5120%PSCo 0012 301675 F.03.03.200165.9210 9210 7,209,812 33.0898%SPS 0013 301676 F.03.04.200165.9210 9210 3,227,597 14.8132%Xcel Energy 0023 300014 F.03.08.200165.9210 9210 682 0.0031%Total 21,788,593 100.0000%
Allocation Changes: Prepared By Reviewed By Approved By Eff. Date
Updated Statistics
Erika Moeller Audra Lake Ross Baumgarten 4/1/2020

Northern States Power Company
XES Allocation Statistics Using FTE Hours2021 Test Year Budget
200166 Docket No. E002/GR-20-723Exhibit___(RLB-1), Schedule 5(a)
Page 99 of 117
Human Resources (Diversity/Safety/Employee Relations)SAP ACC 200166 (190, 197, 199)SCB104
Legal Entity CompanyFinal Cost
Center FERCLETFERC
Account FTE Hours Allocation %NSPM 0010 300416 F.03.01.200166.9210 9210 9,713,752 44.5832%NSPW 0011 300419 F.03.02.200166.9210 9210 1,636,749 7.5122%PSCo 0012 300422 F.03.03.200166.9210 9210 7,209,812 33.0909%SPS 0013 300423 F.03.04.200166.9210 9210 3,227,597 14.8137%Total 21,787,911 100.0000%
Allocation Changes: Prepared By Reviewed By Approved By Eff. Date
Updated Statistics
Erika Moeller Audra Lake Ross Baumgarten 4/1/2020

Northern States Power Company
XES Allocation Statistics Using FTE Hours2021 Test Year Budget
200167 Docket No. E002/GR-20-723Exhibit___(RLB-1), Schedule 5(a)
Page 100 of 117
e-BusinessSAP ACC 200167 (508, 550)SCB105
Legal Entity CompanyFinal Cost
Center FERCLETFERC
Account FTE Hours Allocation %NSPM 0010 301673 F.03.01.200167.9210 9210 9,713,752 44.5832%NSPW 0011 301674 F.03.02.200167.9210 9210 1,636,749 7.5122%PSCo 0012 301675 F.03.03.200167.9210 9210 7,209,812 33.0909%SPS 0013 301676 F.03.04.200167.9210 9210 3,227,597 14.8137%Total 21,787,911 100.0000%
Allocation Changes: Prepared By Reviewed By Approved By Eff. Date
Updated Statistics
Erika Moeller Audra Lake Ross Baumgarten 4/1/2020

Northern States Power Company
XES Allocation Statistics Using FTE Hours2021 Test Year Budget
200168 Docket No. E002/GR-20-723Exhibit___(RLB-1), Schedule 5(a)
Page 101 of 117
Gas Management System (GMS) FERC 866 & 880SAP ACC 200168 (517)SCB106
Legal Entity CompanyFinal Cost
Center FERCLETFERC
Account
No. of Gas Retail
Customers
No. of Gas Transport Customers
Allocation %
NSPM 0010 300344 F.03.01.200168.8660 8660 0 25 0.0016%NSPW 0011 300175 F.03.02.200168.8800 8800 115,955 40 7.5558%PSCo 0012 300074 F.03.03.200168.8660 8660 7,938 0.5170%PSCo 0012 300361 F.03.03.200168.8800 8800 1,411,210 91.9256%Total 1,527,165 8,003 100.0000%
Allocation Changes: Prepared By Reviewed By Approved By Eff. Date
Updated Statistics
Erika Moeller Audra Lake Ross Baumgarten 4/1/2020

Northern States Power Company
XES Allocation Statistics Using FTE Hours2021 Test Year Budget
200169 Docket No. E002/GR-20-723Exhibit___(RLB-1), Schedule 5(a)
Page 102 of 117
Energy Supply Systems Miscellaneous FERC 417.1, 506, 539, & 549SAP ACC 200169 (504, 537, 553)SCB107
Legal Entity CompanyFinal Cost
Center FERCLETFERC
AccountNo. of WAM
ES Users % U5 % Allocation %NSPM 0010 301404 F.03.01.200169.5390 5390 650 40.4732% 0.4615% 0.1868%NSPM 0010 301403 F.03.01.200169.5060 5060 73.2308% 29.6386%NSPM 0010 301405 F.03.01.200169.5490 5490 26.3077% 10.6476%NSPW 0011 301682 F.03.02.200169.5060 5060 130 8.0946% 49.2308% 3.9851%NSPW 0011 301073 F.03.02.200169.5390 5390 44.6154% 3.6115%NSPW 0011 301073 F.03.02.200169.5490 5490 6.1538% 0.4981%PSCo 0012 301132 F.03.99.200169.4171 4171 461 28.7049% 2.6030% 0.7472%PSCo 0012 300929 F.03.03.200169.5060 5060 86.3340% 24.7821%PSCo 0012 301145 F.03.99.200169.5060 5060 2.1692% 0.6227%PSCo 0012 300967 F.03.03.200169.5390 5390 6.0738% 1.7435%PSCo 0012 300929 F.03.03.200169.5490 5490 2.8200% 0.8095%SPS 0013 300933 F.03.04.200169.5060 5060 365 22.7273% 100.0000% 22.7273%Total 1,606 100.0000% 100.0000% 100.0000%
Allocation Changes: Prepared By Reviewed By Approved By Eff. Date
Updated Statistics
Erika Moeller Audra Lake Ross Baumgarten 4/1/2020

Northern States Power Company
XES Allocation Statistics Using FTE Hours2021 Test Year Budget
200170 Docket No. E002/GR-20-723Exhibit___(RLB-1), Schedule 5(a)
Page 103 of 117
Meter Reading and Monitoring Systems FERC 902SAP ACC 200170 (518, 540)SCB108
Legal Entity CompanyFinal Cost
Center FERCLETFERC
Account No. of Meters Allocation %NSPM 0010 300585 F.03.01.200170.9020 9020 2,051,988 35.5695%NSPW 0011 301567 F.03.02.200170.9020 9020 383,983 6.6560%PSCo 0012 300591 F.03.03.200170.9020 9020 2,946,206 51.0700%SPS 0013 300592 F.03.04.200170.9020 9020 386,779 6.7045%Total 5,768,956 100.0000%
Allocation Changes: Prepared By Reviewed By Approved By Eff. Date
Updated Statistics
Erika Moeller Audra Lake Ross Baumgarten 4/1/2020

Northern States Power Company
XES Allocation Statistics Using FTE Hours2021 Test Year Budget
200171 Docket No. E002/GR-20-723Exhibit___(RLB-1), Schedule 5(a)
Page 104 of 117
Customer Resource System (CRS) FERC 903SAP ACC 200171 (503, 555)SCB109
Legal Entity CompanyFinal Cost
Center FERCLETFERC
Account No. of Meters %No. of
Contacts %Allocation
%NSPM 0010 300575 F.03.01.200171.9030 9030 2,051,988 35.5695% 1,447,435 34.2896% 34.9295%NSPW 0011 301575 F.03.02.200171.9030 9030 383,983 6.6560% 271,892 6.4411% 6.5486%PSCo 0012 300581 F.03.03.200171.9030 9030 2,946,206 51.0700% 1,832,389 43.4091% 47.2395%SPS 0013 300582 F.03.04.200171.9030 9030 386,779 6.7045% 669,495 15.8603% 11.2824%Total 5,768,956 100.0000% 4,221,211 100.0000% 100.0000%
Allocation Changes: Prepared By Reviewed By Approved By Eff. Date
Updated Statistics
Erika Moeller Audra Lake Ross Baumgarten 4/1/2020

Northern States Power Company
XES Allocation Statistics Using FTE Hours2021 Test Year Budget
200172 Docket No. E002/GR-20-723Exhibit___(RLB-1), Schedule 5(a)
Page 105 of 117
NetworkSAP ACC 200172 (523)SCB110
Legal Entity CompanyFinal Cost
Center FERCLETFERC
Account No. of Phones %No. of Radios %
Computer
s %Allocation
%NSPM 0010 301673 F.03.01.200172.9210 9210 7,893 54.1395% 2,520 46.4945% 5,348 50.4433% 50.3591%NSPW 0011 301674 F.03.02.200172.9210 9210 1,040 7.1335% 600 11.0701% 687 6.4799% 8.2279%PSCo 0012 301675 F.03.03.200172.9210 9210 3,723 25.5367% 1,600 29.5203% 3,173 29.9283% 28.3284%SPS 0013 301676 F.03.04.200172.9210 9210 1,923 13.1902% 700 12.9151% 1,394 13.1485% 13.0846%Total 14,579 100.0000% 5,420 100.0000% 10,602 100.0000% 100.0000%
Allocation Changes: Prepared By Reviewed By Approved By Eff. Date
Updated Statistics
Erika Moeller Audra Lake Ross Baumgarten 4/1/2020

Northern States Power Company
XES Allocation Statistics Using FTE Hours2021 Test Year Budget
200173 Docket No. E002/GR-20-723Exhibit___(RLB-1), Schedule 5(a)
Page 106 of 117
Generation Trading/Native Hedge - Back OfficeSAP ACC 200173 (129)SCB111
Legal Entity CompanyFinal Cost
Center FERCLETFERC
Account Allocation %NSPM 0010 301457 F.03.01.200173.9210 9210 29.8498%NSPW 0011 301459 F.03.02.200173.9210 9210 6.0274%PSCo 0012 301461 F.03.03.200173.9210 9210 40.3019%SPS 0013 301464 F.03.04.200173.9210 9210 23.8209%Total 100.0000%
Allocation Changes: Prepared By Reviewed By Eff. Date
Updated Statistics
Erika Moeller Ross Baumgarten 1/1/2020
(1) Based on labor hour allocation by Commercial Operations front office trading activities, generation (purchase and sales) and proprietary, with the proprietary allocation to NSPM, PSCo & SPS. Proprietary trading hours are allocated based on the Joint Operating Agreement.

Northern States Power Company
XES Allocation Statistics Using FTE Hours2021 Test Year Budget
200174 Docket No. E002/GR-20-723Exhibit___(RLB-1), Schedule 5(a)
Page 107 of 117
Generation Trading/Native Hedge - Mid Office FERC 557SAP ACC 200174 (145)SCB112
Legal Entity CompanyFinal Cost
Center FERCLETFERC
Account Allocation %NSPM 0010 300734 F.03.01.200174.5570 5570 35.8772%PSCo 0012 300738 F.03.03.200174.5570 5570 40.3019%SPS 0013 300741 F.03.04.200174.5570 5570 23.8209%Total 100.0000%
Allocation Changes: Prepared By Reviewed By Eff. Date
Updated Statistics
Erika Moeller Ross Baumgarten 1/1/2020
(1) Based on labor hour allocation by Commercial Operations front office trading activities, generation (purchase and sales) and proprietary, with the proprietary allocation to NSPM, PSCo & SPS. Proprietary trading hours are allocated based on the Joint Operating Agreement.

Northern States Power Company
XES Allocation Statistics Using FTE Hours2021 Test Year Budget
200176 Docket No. E002/GR-20-723Exhibit___(RLB-1), Schedule 5(a)
Page 108 of 117
Marketing & Sales SAP ACC 200176 (412)SCB114
Legal Entity CompanyFinal Cost
Center FERCLETFERC
Account
Revenues
$000's Allocation %NSPM 0010 300575 F.03.01.200176.9210 9210 5,240,697$ 41.3872%NSPW 0011 301575 F.03.02.200176.9210 9210 981,344 7.7499%PSCo 0012 300581 F.03.03.200176.9210 9210 4,614,346 36.4408%SPS 0013 302046 F.03.04.200176.9210 9210 1,826,207 14.4221%Total 12,662,594$ 100.0000%
Allocation Changes: Prepared By Reviewed By Approved By Eff. Date
Updated Statistics
Erika Moeller Audra Lake Ross Baumgarten 4/1/2020

Northern States Power Company
XES Allocation Statistics Using FTE Hours2021 Test Year Budget
200177 Docket No. E002/GR-20-723Exhibit___(RLB-1), Schedule 5(a)
Page 109 of 117
Rates & Regulation - ElectricSAP ACC 200177 (418)SCB115
Legal Entity CompanyFinal Cost
Center FERCLETFERC
Account
Direct Labor $$ Rates & Regulation Allocation %
NSPM 0010 300833 F.03.01.200177.9210 9210 1,541,743$ 28.4824%NSPW 0011 300673 F.03.02.200177.9210 9210 110,736 2.0458%PSCo 0012 300812 F.03.03.200177.9210 9210 2,517,900 46.5160%SPS 0013 300815 F.03.04.200177.9210 9210 1,242,591 22.9558%Total 5,412,970$ 100.0000%
Allocation Changes: Prepared By Reviewed By Approved By Eff. Date
Updated Statistics
Erika Moeller Audra Lake Ross Baumgarten 4/1/2020

Northern States Power Company
XES Allocation Statistics Using FTE Hours2021 Test Year Budget
200178 Docket No. E002/GR-20-723Exhibit___(RLB-1), Schedule 5(a)
Page 110 of 117
Rates & RegulationSAP ACC 200178 (417)SCB116
Legal Entity CompanyFinal Cost
Center FERCLETFERC
Account
Direct Labor $$ Rates & Regulation Allocation %
NSPM 0010 300808 F.03.01.200178.9210 9210 1,541,743$ 28.4824%NSPW 0011 300811 F.03.02.200178.9210 9210 110,736 2.0458%PSCo 0012 300814 F.03.03.200178.9210 9210 2,517,900 46.5160%SPS 0013 300815 F.03.04.200178.9210 9210 1,242,591 22.9558%Total 5,412,970$ 100.0000%
Allocation Changes: Prepared By Reviewed By Approved By Eff. Date
Updated Statistics
Erika Moeller Audra Lake Ross Baumgarten 4/1/2020

Northern States Power Company
XES Allocation Statistics Using FTE Hours2021 Test Year Budget
200180 Docket No. E002/GR-20-723Exhibit___(RLB-1), Schedule 5(a)
Page 111 of 117
EMS-Shared (Energy Management System-SCADA) FERC 556, 561.2, & 581SAP ACC 200180 (528)SCB118
Legal Entity CompanyFinal Cost
Center FERCLETFERC
Account
Gross Electric Prod Plant
$000
Gross Electric Trans Plant
$000
Gross Electric Dist Plant
$000
Combined Gross Plant
$000 U5 % Allocation %NSPM 0010 300734 F.03.01.200180.5560 5560 9,964,184$ 3,781,955$ 4,369,944$ 18,116,083$ 2.4574% 1.0134%NSPM 0010 300125 F.03.01.200180.5612 5612 74.7798% 30.8378%NSPM 0010 300125 F.03.01.200180.5810 5810 22.7628% 9.3869%NSPW 0011 300737 F.03.02.200180.5560 5560 519,534 1,348,538 1,038,681 2,906,753 2.2746% 0.1505%NSPW 0011 300127 F.03.02.200180.5612 5612 71.6443% 4.7405%NSPW 0011 300127 F.03.02.200180.5810 5810 26.0811% 1.7257%PSCo 0012 300738 F.03.03.200180.5560 5560 6,583,081 2,708,686 5,513,721 14,805,488 2.1501% 0.7246%PSCo 0012 300129 F.03.03.200180.5612 5612 30.4104% 10.2489%PSCo 0012 300129 F.03.03.200180.5810 5810 67.4395% 22.7285%SPS 0013 300741 F.03.04.200180.5560 5560 3,164,814 3,434,665 1,502,709 8,102,188 2.3319% 0.4301%SPS 0013 300131 F.03.04.200180.5612 5612 71.5856% 13.2027%SPS 0013 300131 F.03.04.200180.5810 5810 26.0825% 4.8104%Total 20,231,613$ 11,273,844$ 12,425,055$ 43,930,512 100.0000% 100.0000%
Allocation Changes: Prepared By Reviewed By Approved By Eff. Date
Updated Statistics
Erika Moeller Audra Lake Ross Baumgarten 4/1/2020

Northern States Power Company
XES Allocation Statistics Using FTE Hours2021 Test Year Budget
200181 Docket No. E002/GR-20-723Exhibit___(RLB-1), Schedule 5(a)
Page 112 of 117
Energy Supply Environmental Policy & ServicesSAP ACC 200181 (464)SCB119
Legal Entity CompanyFinal Cost
Center FERCLETFERC
Account
Gross Electric Prod Plant
$000
Gross Electric Trans Plant
$000
Gross Electric Dist Plant
$000
Gross Gas Trans Plant
$000Gross Gas Dist
Plant $000
Combined Gross Plant
$000'sAllocation
%NSPM 0010 301667 F.03.01.200181.9210 9210 9,964,184$ 3,781,955$ 4,369,944$ 119,495$ 1,296,703$ 19,532,281$ 39.0795%NSPW 0011 301527 F.03.02.200181.9210 9210 519,534 1,348,538 1,038,681 - 325,907 3,232,660 6.4678%PSCo 0012 301463 F.03.03.200181.9210 9210 6,583,081 2,708,686 5,513,721 1,145,332 3,162,931 19,113,751 38.2421%SPS 0013 300933 F.03.04.200181.9210 9210 3,164,814 3,434,665 1,502,709 - - 8,102,188 16.2106%Total 20,231,613$ 11,273,844$ 12,425,055$ 1,264,827$ 4,785,541$ 49,980,880$ 100.0000%
Allocation Changes: Prepared By Reviewed By Approved By Eff. Date
Updated Statistics
Erika Moeller Audra Lake Ross Baumgarten 4/1/2020

Northern States Power Company
XES Allocation Statistics Using FTE Hours2021 Test Year Budget
200182 Docket No. E002/GR-20-723Exhibit___(RLB-1), Schedule 5(a)
Page 113 of 117
Energy Supply Environmental Policy & Services NSPM & NSPWSAP ACC 200182 (485)SCB120
Legal Entity CompanyFinal Cost
Center FERCLETFERC
Account
Gross Electric Prod Plant
$000
Gross Electric Trans Plant
$000
Gross Electric Dist Plant
$000
Gross Gas Trans Plant
$000Gross Gas Dist
Plant $000
Combined Gross Plat
$000'sAllocation
%NSPM 0010 301667 F.03.01.200182.9210 9210 9,964,184$ 3,781,955$ 4,369,944$ 119,495$ 1,296,703$ 19,532,281$ 85.7998%NSPW 0011 301527 F.03.02.200182.9210 9210 519,534 1,348,538 1,038,681 - 325,907 3,232,660 14.2002%Total 10,483,718$ 5,130,493$ 5,408,625$ 119,495$ 1,622,610$ 22,764,941$ 100.0000%
Allocation Changes: Prepared By Reviewed By Approved By Eff. Date
Updated Statistics
Erika Moeller Audra Lake Ross Baumgarten 4/1/2020

Northern States Power Company
XES Allocation Statistics Using FTE Hours2021 Test Year Budget
200183 Docket No. E002/GR-20-723Exhibit___(RLB-1), Schedule 5(a)
Page 114 of 117
Energy Supply Environmental Policy & Services PSCo & SPSSAP ACC 200183 (466)SCB121
Legal Entity CompanyFinal Cost
Center FERCLETFERC
Account
Gross Electric Prod Plant
$000
Gross Electric Trans Plant
$000
Gross Electric Dist Plant
$000
Gross Gas Trans Plant
$000Gross Gas Dist
Plant $000
Combined Gross Plat
$000'sAllocation
%PSCo 0012 301463 F.03.03.200183.9210 9210 6,583,081$ 2,708,686$ 5,513,721$ 1,145,332$ 3,162,931$ 19,113,751$ 70.2300%SPS 0013 300933 F.03.04.200183.9210 9210 3,164,814 3,434,665 1,502,709 - - 8,102,188 29.7700%Total 9,747,895$ 6,143,351$ 7,016,430$ 1,145,332$ 3,162,931$ 27,215,939$ 100.0000%
Allocation Changes: Prepared By Reviewed By Approved By Eff. Date
Updated Statistics
Erika Moeller Audra Lake Ross Baumgarten 4/1/2020

Northern States Power Company
XES Allocation Statistics Using FTE Hours2021 Test Year Budget
200184 Docket No. E002/GR-20-723Exhibit___(RLB-1), Schedule 5(a)
Page 115 of 117
PowerPlanSAP ACC 200184 (516)SCB122
Legal Entity CompanyFinal Cost
Center FERCLETFERC
AccountTotal Plant
Assets $000's Allocation %NSPM 0010 301673 F.03.01.200184.9210 9210 24,724,181$ 41.9720%NSPW 0011 301674 F.03.02.200184.9210 9210 3,671,308 6.2325%PSCo 0012 301675 F.03.03.200184.9210 9210 21,572,345 36.6215%SPS 0013 301676 F.03.04.200184.9210 9210 8,938,415 15.1740%Total 58,906,249$ 100.0000%
Allocation Changes: Prepared By Reviewed By Approved By Eff. Date
Updated Statistics
Erika Moeller Audra Lake Ross Baumgarten 4/1/2020

Northern States Power Company
XES Allocation Statistics Using FTE Hours2021 Test Year Budget
200805 Docket No. E002/GR-20-723Exhibit___(RLB-1), Schedule 5(a)
Page 116 of 117
Legal Electric Opco’s and Transco’sSAP ACC 200805 (163)SCB124
Legal Entity CompanyFinal Cost
Center FERCLETFERC
Account Total Assets
$000's %Revenues
$000's % FTE Hours %Allocation
%NSPM 0010 300377 F.03.01.200805.9210 9210 22,468,670$ 42.4897% 5,240,697$ 41.3872% 9,713,752 44.5829% 42.8200%NSPW 0011 300381 F.03.02.200805.9210 9210 2,887,050 5.4596% 981,344 7.7499% 1,636,749 7.5121% 6.9072%PSCo 0012 300385 F.03.03.200805.9210 9210 19,541,229 36.9537% 4,614,346 36.4408% 7,209,812 33.0906% 35.4950%SPS 0013 300390 F.03.04.200805.9210 9210 7,982,885 15.0961% 1,826,207 14.4221% 3,227,597 14.8136% 14.7773%Xcel Energy Transmission Holding Co 0075 300039 F.03.17.200805.9210 9210 242 0.0005% - 0.0000% 33 0.0002% 0.0002%Xcel Energy Transmission Development Co 0076 300040 F.03.18.200805.9210 9210 94 0.0002% - 0.0000% 113 0.0005% 0.0002%Xcel Energy Southwest Transmission Co 0077 300041 F.03.19.200805.9210 9210 151 0.0003% - 0.0000% 18 0.0001% 0.0001%Total 52,880,321$ 100.0000% 12,662,594$ 100.0000% 21,788,076 100.0000% 100.0000%
Allocation Changes: Prepared By Reviewed By Approved By Eff. Date
Updated Statistics
Erika Moeller Audra Lake Ross Baumgarten 4/1/2020

Northern States Power Company
XES Allocation Statistics Using FTE Hours2021 Test Year Budget
200806 Docket No. E002/GR-20-723Exhibit___(RLB-1), Schedule 5(a)
Page 117 of 117
Legal Electric NSPM & NSPWSAP ACC 200806 (173)SCB125
Legal Entity CompanyFinal Cost
Center FERCLETFERC
Account Total Assets
$000's %Revenues
$000's % FTE Hours %Allocation
%NSPM 0010 300377 F.03.01.200806.9210 9210 22,468,670$ 88.6138% 5,240,697$ 84.2279% 9,713,752 85.5799% 86.1406%NSPW 0011 300381 F.03.02.200806.9210 9210 2,887,050 11.3862% 981,344 15.7721% 1,636,749 14.4201% 13.8594%Total 25,355,720$ 100.0000% 6,222,041$ 100.0000% 11,350,502 100.0000% 100.0000%
Allocation Changes: Prepared By Reviewed By Approved By Eff. Date
Updated Statistics
Erika Moeller Audra Lake Ross Baumgarten 4/1/2020

Northern States Power Company
Impact to NSPM (Total Company) 2021 Test Year for Change in XES AllocationsUsing FTE Method instead of Number of Employees2021 Test Year Budget
Docket No. E002/GR-20-723Exhibit___(RLB-1), Schedule 5(b)
Page 1 of 1
E/G Allocator Two Factor Jurisdictional Allocator E/G Allocator93.64% 87.08% 6.20% 6.73% 6.36% 88.70% 11.30%
Allocating Cost Center Allocating Cost Center Description Allocation Method Current Method FTE Method Variance
XESTotal Amount (2021 Budget)
NSPMAmount
NSPMRevised Amount
NSPMImpact NSPM Elec MN Elec ND Elec SD Elec NSPM Gas MN Gas ND Gas
200063 Executive - Corporate Governance Assets/Revenue/No. of Employees 39.1620% 37.7744% -1.3876% 62,088,726$ 24,315,187$ 23,453,644$ (861,543)$ (806,769)$ (702,494)$ (49,990)$ (54,285)$ (54,774)$ (48,587)$ (6,187)$ 200064 Shareholder - Corporate Governance Assets/Revenue/No. of Employees 39.1620% 37.7744% -1.3876% - - - - - - - - - - - 200065 Investor Relations - Corporate Governance Assets/Revenue/No. of Employees 39.1620% 37.7744% -1.3876% 1,932,392 756,763 729,950 (26,814) (25,109) (21,864) (1,556) (1,690) (1,705) (1,512) (193) 200066 Accounting, Reporting & Tax - Corporate Governance Assets/Revenue/No. of Employees 39.1620% 37.7744% -1.3876% 22,952,328 8,988,591 8,670,104 (318,487) (298,238) (259,691) (18,480) (20,068) (20,248) (17,961) (2,287) 200067 Audit Services - Corporate Governance Assets/Revenue/No. of Employees 39.1620% 37.7744% -1.3876% 3,114,519 1,219,708 1,176,491 (43,217) (40,469) (35,238) (2,508) (2,723) (2,748) (2,438) (310) 200068 Corporate Finance, Treasury & Cash Management - Corporate Governance Assets/Revenue/No. of Employees 39.1620% 37.7744% -1.3876% 3,165,626 1,239,723 1,195,796 (43,926) (41,134) (35,817) (2,549) (2,768) (2,793) (2,477) (316) 200069 Risk Management - Corporate Governance Assets/Revenue/No. of Employees 39.1620% 37.7744% -1.3876% 584,979 229,089 220,972 (8,117) (7,601) (6,619) (471) (511) (516) (458) (58) 200070 Corporate Strategy & Business Development - Corporate Governance Assets/Revenue/No. of Employees 39.1620% 37.7744% -1.3876% 3,014,019 1,180,350 1,138,528 (41,823) (39,164) (34,102) (2,427) (2,635) (2,659) (2,359) (300) 200071 Legal - Corporate Governance Assets/Revenue/No. of Employees 39.1620% 37.7744% -1.3876% 13,695,744 5,363,527 5,173,485 (190,042) (177,960) (154,959) (11,027) (11,974) (12,082) (10,717) (1,365) 200072 Communications - Corporate Governance Assets/Revenue/No. of Employees 39.1620% 37.7744% -1.3876% 5,045,620 1,975,966 1,905,953 (70,013) (65,562) (57,088) (4,062) (4,411) (4,451) (3,948) (503) 200073 Human Resources - Corporate Governance Assets/Revenue/No. of Employees 39.1620% 37.7744% -1.3876% 6,108,190 2,392,090 2,307,332 (84,757) (79,369) (69,111) (4,918) (5,341) (5,389) (4,780) (609) 200074 Corporate Systems – Corporate Governance Assets/Revenue/No. of Employees 39.1620% 37.7744% -1.3876% 22,972,513 8,996,496 8,677,729 (318,767) (298,500) (259,919) (18,496) (20,085) (20,266) (17,977) (2,289) 200075 Board of Directors - Corporate Governance Assets/Revenue/No. of Employees 39.1620% 37.7744% -1.3876% 4,834,041 1,893,107 1,826,030 (67,077) (62,813) (54,694) (3,892) (4,226) (4,265) (3,783) (482) 200076 Xcel Foundation Assets/Revenue/No. of Employees 39.2509% 37.8677% -1.3832% 1,210,862 475,274 458,526 (16,749) (15,684) (13,657) (972) (1,055) (1,065) (945) (120) 200077 Branding Assets/Revenue/No. of Employees 39.2509% 37.8677% -1.3832% 13,005,654 5,104,836 4,924,942 (179,894) (168,457) (146,684) (10,438) (11,335) (11,437) (10,145) (1,292) 200078 Governmental Affairs Assets/Revenue/No. of Employees 39.2771% 37.8941% -1.3830% 3,778,758 1,484,187 1,431,926 (52,260) (48,938) (42,613) (3,032) (3,293) (3,323) (2,948) (375) 200079 Federal Lobbying Assets/Revenue/No. of Employees 39.2771% 37.8941% -1.3830% 909,485 357,219 344,641 (12,578) (11,778) (10,256) (730) (793) (800) (710) (90) 200080 Capital Asset Accounting Assets/Revenue/No. of Employees 44.1288% 42.7132% -1.4156% 1,025,317 452,460 437,946 (14,514) (13,592) (11,835) (842) (915) (923) (819) (104) 200081 Accounting, Reporting & Taxes Assets/Revenue/No. of Employees 44.2197% 42.8080% -1.4117% 90,869 40,182 38,899 (1,283) (1,201) (1,046) (74) (81) (82) (73) (9) 200082 Audit Services Assets/Revenue/No. of Employees 44.2197% 42.8080% -1.4117% - - - - - - - - - - - 200083 Corporate Finance, Treasury & Cash Management Assets/Revenue/No. of Employees 44.2197% 42.8080% -1.4117% - - - - - - - - - - - 200084 Risk Management Assets/Revenue/No. of Employees 44.2197% 42.8080% -1.4117% - - - - - - - - - - - 200086 Legal & Claims Services Assets/Revenue/No. of Employees 44.2197% 42.8080% -1.4117% 859,720 380,165 368,029 (12,137) (11,365) (9,896) (704) (765) (772) (685) (87) 200087 Accounting, Reporting & Tax - Regulated Assets/Revenue/No. of Employees 44.2315% 42.8200% -1.4115% 12,257,455 5,421,656 5,248,642 (173,014) (162,014) (141,074) (10,039) (10,901) (11,000) (9,757) (1,243) 200088 Accounting, Reporting, Tax & Audit Services - Regulated Electric Assets/Revenue/No. of Employees 44.2315% 42.8200% -1.4115% 6,230,300 2,755,755 2,667,814 (87,941) (82,350) (71,706) (5,103) (5,541) (5,591) (4,959) (632) 200089 Audit Services - OpCo's & TransCo’s Assets/Revenue/No. of Employees 44.2315% 42.8200% -1.4115% 146,028 64,590 62,529 (2,061) (1,930) (1,681) (120) (130) (131) (116) (15) 200090 Risk Management - OpCo's & TransCo’s Assets/Revenue/No. of Employees 44.2315% 42.8200% -1.4115% 3,954,467 1,749,120 1,693,303 (55,817) (52,269) (45,513) (3,239) (3,517) (3,549) (3,148) (401) 200091 Captive Insurance Assets/Revenue/No. of Employees 44.2315% 42.8200% -1.4115% 12,800,602 5,661,898 5,481,218 (180,680) (169,193) (147,325) (10,484) (11,384) (11,487) (10,189) (1,298) 200092 Corporate Strategy & Business Development Assets/Revenue/No. of Employees 44.2315% 42.8200% -1.4115% 5,694,157 2,518,611 2,438,238 (80,373) (75,263) (65,535) (4,664) (5,064) (5,110) (4,533) (577) 200093 Legal - OpCo's & TransCo’s Assets/Revenue/No. of Employees 44.2315% 42.8200% -1.4115% 130,529 57,735 55,892 (1,842) (1,725) (1,502) (107) (116) (117) (104) (13) 200094 Supply Chain Assets/Revenue/No. of Employees 44.2315% 42.8200% -1.4115% - - - - - - - - - - - 200095 Energy Supply Asset Management Assets/Revenue/No. of Employees 44.2315% 42.8200% -1.4115% - - - - - - - - - - - 200096 Energy Markets - Business Services Assets/Revenue/No. of Employees 44.2315% 42.8200% -1.4115% 4,639,509 2,052,124 1,986,638 (65,487) (61,323) (53,397) (3,800) (4,126) (4,163) (3,693) (470) 200097 Accounting and Finance Software Applications Maintenance Assets/Revenue/No. of Employees 44.2315% 42.8200% -1.4115% 473,073 209,247 202,570 (6,677) (6,253) (5,445) (387) (421) (425) (377) (48) 200098 Electric Transmission FERC 566 Assets/Revenue/No. of Employees 44.2315% 42.8200% -1.4115% 750,708 332,049 321,453 (10,596) (9,923) (8,640) (615) (668) (674) (598) (76) 200099 Electric Distribution FERC 588 Assets/Revenue/No. of Employees 44.2315% 42.8200% -1.4115% - - - - - - - - - - - 200100 Accounting, Reporting, Tax & Audit Services – Regulated Gas Assets/Revenue/No. of Employees 51.8728% 50.2478% -1.6250% 79,344 41,158 39,869 (1,289) (1,207) (1,051) (75) (81) (82) (73) (9) 200101 Legal Gas Assets/Revenue/No. of Employees 51.8728% 50.2478% -1.6250% 624,711 324,055 313,904 (10,152) (9,506) (8,277) (589) (640) (645) (572) (73) 200102 Gas Distribution FERC 880 Assets/Revenue/No. of Employees 51.8728% 50.2478% -1.6250% 95,315 49,442 47,894 (1,549) (1,450) (1,263) (90) (98) (98) (87) (11) 200105 Accounting & Reporting - NSPM & NSPW Assets/Revenue/No. of Employees 86.8054% 86.1406% -0.6648% 524,452 455,253 451,766 (3,487) (3,265) (2,843) (202) (220) (222) (197) (25) 200106 Accounting & Reporting Electric - NSPM & NSPW Assets/Revenue/No. of Employees 86.8054% 86.1406% -0.6648% 286,742 248,907 247,001 (1,906) (1,785) (1,554) (111) (120) (121) (107) (14) 200107 Legal - NSPM & NSPW Assets/Revenue/No. of Employees 86.8054% 86.1406% -0.6648% 60,948 52,906 52,501 (405) (379) (330) (23) (26) (26) (23) (3) 200111 Enterprise Application Integration (EAI) Average of a Select Set of Software Allocators 39.7177% 38.8575% -0.8602% 109,369,681 43,439,122 42,498,324 (940,796) (880,983) (767,116) (54,588) (59,279) (59,813) (53,056) (6,757) 200112 Mainframe Charges Average of a Select Set of Software Allocators 28.1006% 26.7176% -1.3830% 4,722,552 1,327,065 1,261,753 (65,313) (61,160) (53,255) (3,790) (4,115) (4,152) (3,683) (469) 200115 Miscellaneous Applications Average of All Software Percentages 36.3529% 35.8186% -0.5343% 31,084,200 11,300,008 11,133,925 (166,083) (155,524) (135,423) (9,637) (10,465) (10,559) (9,366) (1,193) 200149 Customer & Enterprise Solutions (CES) No. of Computers/ No. of Customers/ No. of Employees 44.8700% 43.4585% -1.4115% 2,098,414 941,558 911,939 (29,619) (27,736) (24,151) (1,719) (1,866) (1,883) (1,670) (213) 200163 Employee Communications No. of Employees 48.7308% 44.5819% -4.1489% 780,790 380,485 348,091 (32,394) (30,335) (26,414) (1,880) (2,041) (2,060) (1,827) (233) 200164 Payroll No. of Employees 48.7308% 44.5819% -4.1489% 1,704,170 830,456 759,751 (70,704) (66,209) (57,651) (4,103) (4,455) (4,495) (3,987) (508) 200165 Employee Management Systems No. of Employees 48.7308% 44.5819% -4.1489% 8,714,921 4,246,851 3,885,277 (361,573) (338,586) (294,824) (20,980) (22,782) (22,988) (20,391) (2,597) 200166 Human Resources (Diversity/Safety/Employee Relations) No. of Employees 48.8179% 44.5832% -4.2347% 23,106,507 11,280,111 10,301,620 (978,491) (916,282) (797,853) (56,776) (61,654) (62,210) (55,183) (7,027) 200167 e-Business No. of Employees 48.8179% 44.5832% -4.2347% 177,704 86,751 79,226 (7,525) (7,047) (6,136) (437) (474) (478) (424) (54) 200805 Legal Electric Opco’s and Transco’s Assets/Revenue/No. of Employees 44.2315% 42.8200% -1.4115% - - - - - - - - - - - 200806 Legal Electric NSPM & NSPW Assets/Revenue/No. of Employees 86.8054% 86.1406% -0.6648% - - - - - - - - - - -
NSPMAmount
NSPM Revised Amount
NSPM 2021 Budget Impact
162,671,835$ 156,972,059$ (5,699,774)$ (5,337,400)$ (4,647,542)$ (330,726)$ (359,138)$ (362,377)$ (321,442)$ (40,935)$
Minnesota Jurisdiction Electric Long Term Incentive Adjustment 140,664Minnesota Jurisdiction Electric Payroll Tax Adjustment (19,821)
Total Minnesota Jurisdiction Electric Adjustment (4,526,699)$
Customer Allocator

Northern States Power Company
XES 2019 FERC Form 60
Docket No. E002/GR-20-723Exhibit___(RLB), Schedule 6
Page 1 of 64
Northern States Power Company
XES 2019 FERC Form 60
Docket No. E002/GR-20-723 Exhibit___(RLB), Schedule 6
Page 2 of 64

Northern States Power Company
XES 2019 FERC Form 60
Docket No. E002/GR-20-723 Exhibit___(RLB), Schedule 6
Page 3 of 64

Northern States Power Company
XES 2019 FERC Form 60
Docket No. E002/GR-20-723 Exhibit___(RLB), Schedule 6
Page 4 of 64

Northern States Power Company
XES 2019 FERC Form 60
Docket No. E002/GR-20-723 Exhibit___(RLB), Schedule 6
Page 5 of 64

Northern States Power Company
XES 2019 FERC Form 60
Docket No. E002/GR-20-723 Exhibit___(RLB), Schedule 6
Page 6 of 64

Northern States Power Company
XES 2019 FERC Form 60
Docket No. E002/GR-20-723 Exhibit___(RLB), Schedule 6
Page 7 of 64
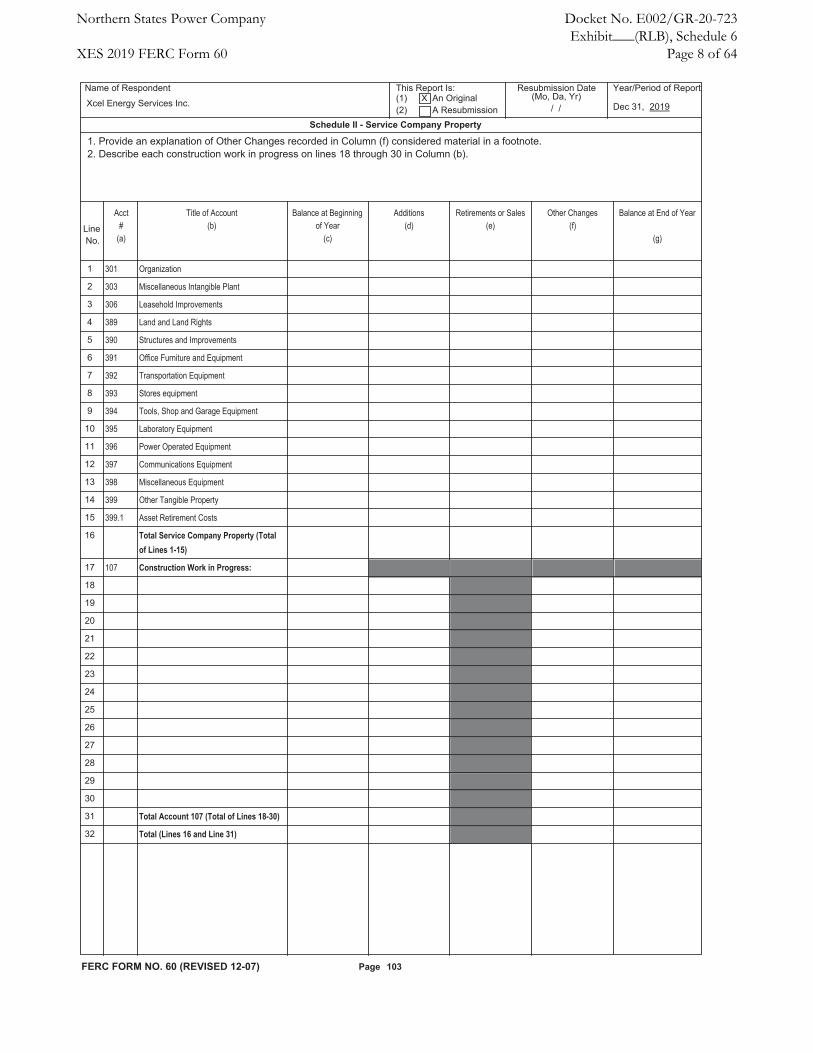
Northern States Power Company
XES 2019 FERC Form 60
Docket No. E002/GR-20-723 Exhibit___(RLB), Schedule 6
Page 8 of 64

Northern States Power Company
XES 2019 FERC Form 60
Docket No. E002/GR-20-723 Exhibit___(RLB), Schedule 6
Page 9 of 64

Northern States Power Company
XES 2019 FERC Form 60
Docket No. E002/GR-20-723 Exhibit___(RLB), Schedule 6
Page 10 of 64
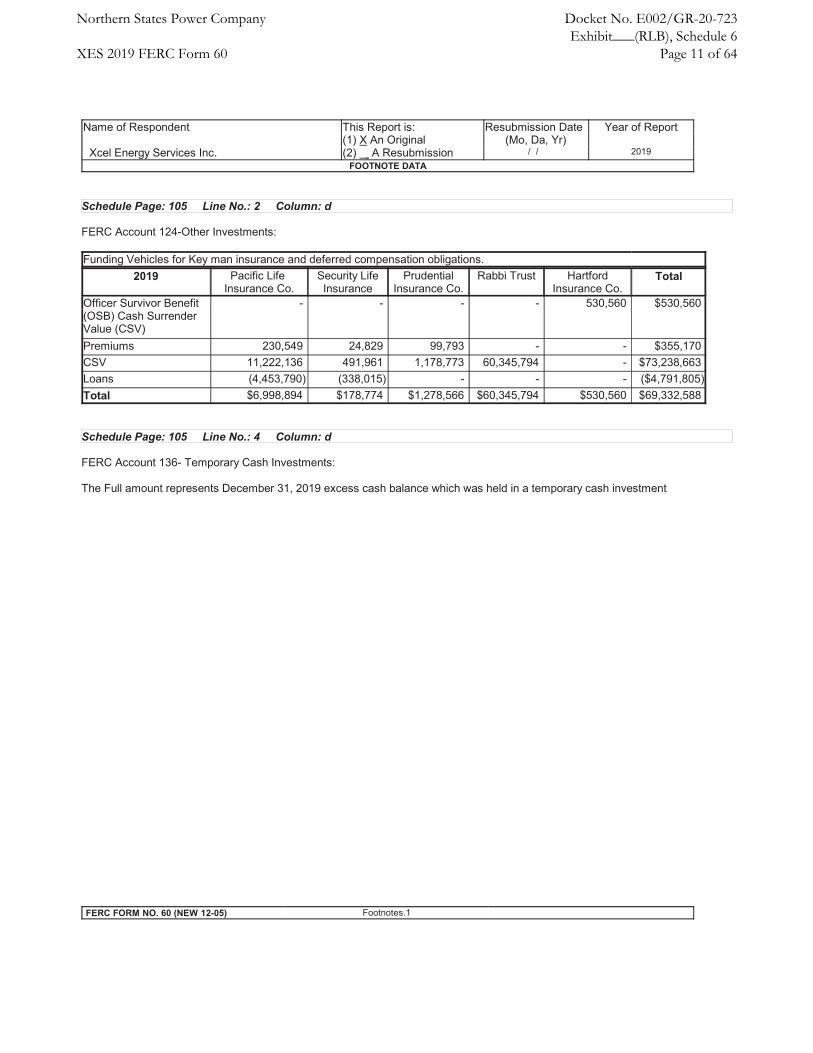
Northern States Power Company
XES 2019 FERC Form 60
Docket No. E002/GR-20-723 Exhibit___(RLB), Schedule 6
Page 11 of 64

Northern States Power Company
XES 2019 FERC Form 60
Docket No. E002/GR-20-723 Exhibit___(RLB), Schedule 6
Page 12 of 64

Northern States Power Company
XES 2019 FERC Form 60
Docket No. E002/GR-20-723 Exhibit___(RLB), Schedule 6
Page 13 of 64

Northern States Power Company
XES 2019 FERC Form 60
Docket No. E002/GR-20-723 Exhibit___(RLB), Schedule 6
Page 14 of 64

Northern States Power Company
XES 2019 FERC Form 60
Docket No. E002/GR-20-723 Exhibit___(RLB), Schedule 6
Page 15 of 64

Northern States Power Company
XES 2019 FERC Form 60
Docket No. E002/GR-20-723 Exhibit___(RLB), Schedule 6
Page 16 of 64

Northern States Power Company
XES 2019 FERC Form 60
Docket No. E002/GR-20-723 Exhibit___(RLB), Schedule 6
Page 17 of 64

Northern States Power Company
XES 2019 FERC Form 60
Docket No. E002/GR-20-723 Exhibit___(RLB), Schedule 6
Page 18 of 64

Northern States Power Company
XES 2019 FERC Form 60
Docket No. E002/GR-20-723 Exhibit___(RLB), Schedule 6
Page 19 of 64

Northern States Power Company
XES 2019 FERC Form 60
Docket No. E002/GR-20-723 Exhibit___(RLB), Schedule 6
Page 20 of 64

Northern States Power Company
XES 2019 FERC Form 60
Docket No. E002/GR-20-723 Exhibit___(RLB), Schedule 6
Page 21 of 64
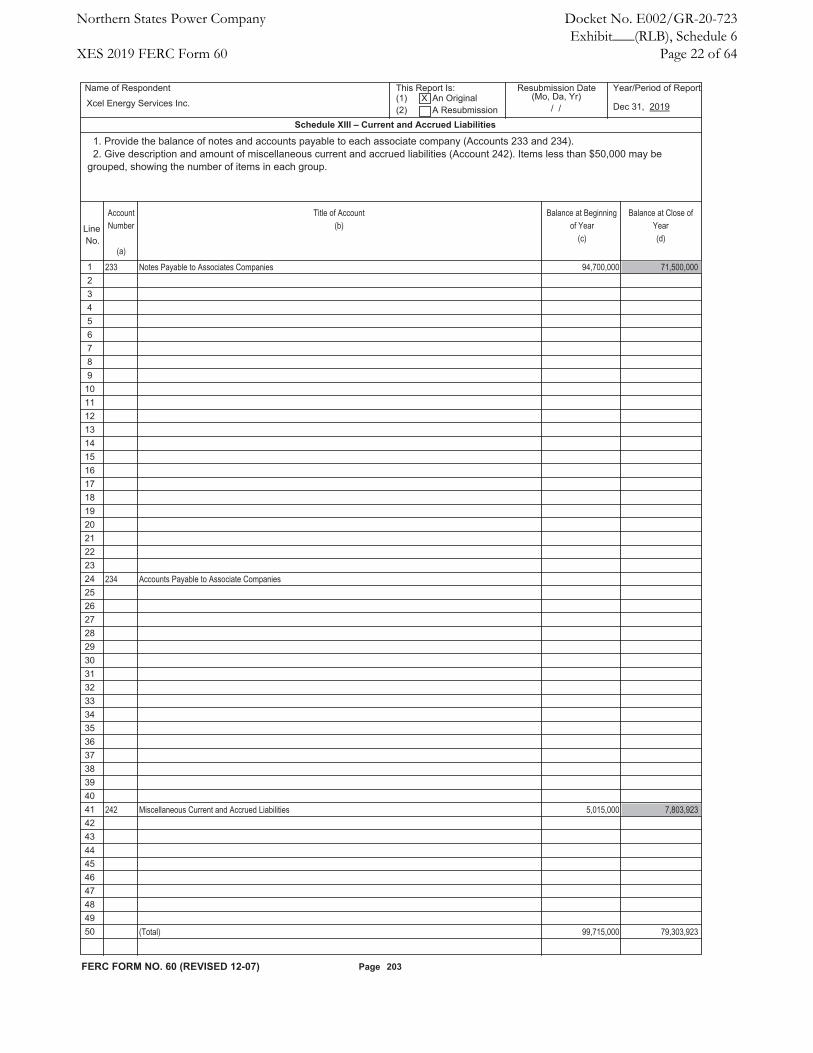
Northern States Power Company
XES 2019 FERC Form 60
Docket No. E002/GR-20-723 Exhibit___(RLB), Schedule 6
Page 22 of 64

Northern States Power Company
XES 2019 FERC Form 60
Docket No. E002/GR-20-723 Exhibit___(RLB), Schedule 6
Page 23 of 64
•
•
•
•
Northern States Power Company
XES 2019 FERC Form 60
Docket No. E002/GR-20-723 Exhibit___(RLB), Schedule 6
Page 24 of 64

Northern States Power Company
XES 2019 FERC Form 60
Docket No. E002/GR-20-723 Exhibit___(RLB), Schedule 6
Page 25 of 64

Northern States Power Company
XES 2019 FERC Form 60
Docket No. E002/GR-20-723 Exhibit___(RLB), Schedule 6
Page 26 of 64

Northern States Power Company
XES 2019 FERC Form 60
Docket No. E002/GR-20-723 Exhibit___(RLB), Schedule 6
Page 27 of 64

Northern States Power Company
XES 2019 FERC Form 60
Docket No. E002/GR-20-723 Exhibit___(RLB), Schedule 6
Page 28 of 64

Northern States Power Company
XES 2019 FERC Form 60
Docket No. E002/GR-20-723 Exhibit___(RLB), Schedule 6
Page 29 of 64
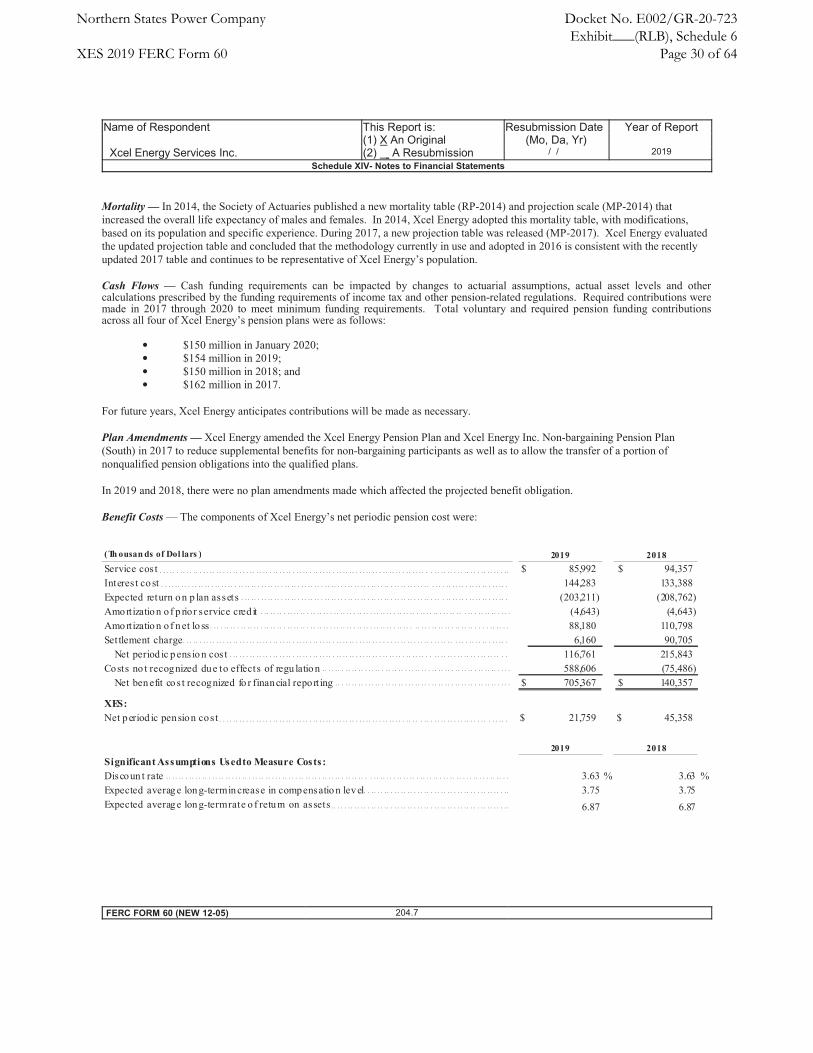
•
•
•
•
Northern States Power Company
XES 2019 FERC Form 60
Docket No. E002/GR-20-723 Exhibit___(RLB), Schedule 6
Page 30 of 64
Northern States Power Company
XES 2019 FERC Form 60
Docket No. E002/GR-20-723 Exhibit___(RLB), Schedule 6
Page 31 of 64

Northern States Power Company
XES 2019 FERC Form 60
Docket No. E002/GR-20-723 Exhibit___(RLB), Schedule 6
Page 32 of 64

Northern States Power Company
XES 2019 FERC Form 60
Docket No. E002/GR-20-723 Exhibit___(RLB), Schedule 6
Page 33 of 64

Northern States Power Company
XES 2019 FERC Form 60
Docket No. E002/GR-20-723 Exhibit___(RLB), Schedule 6
Page 34 of 64
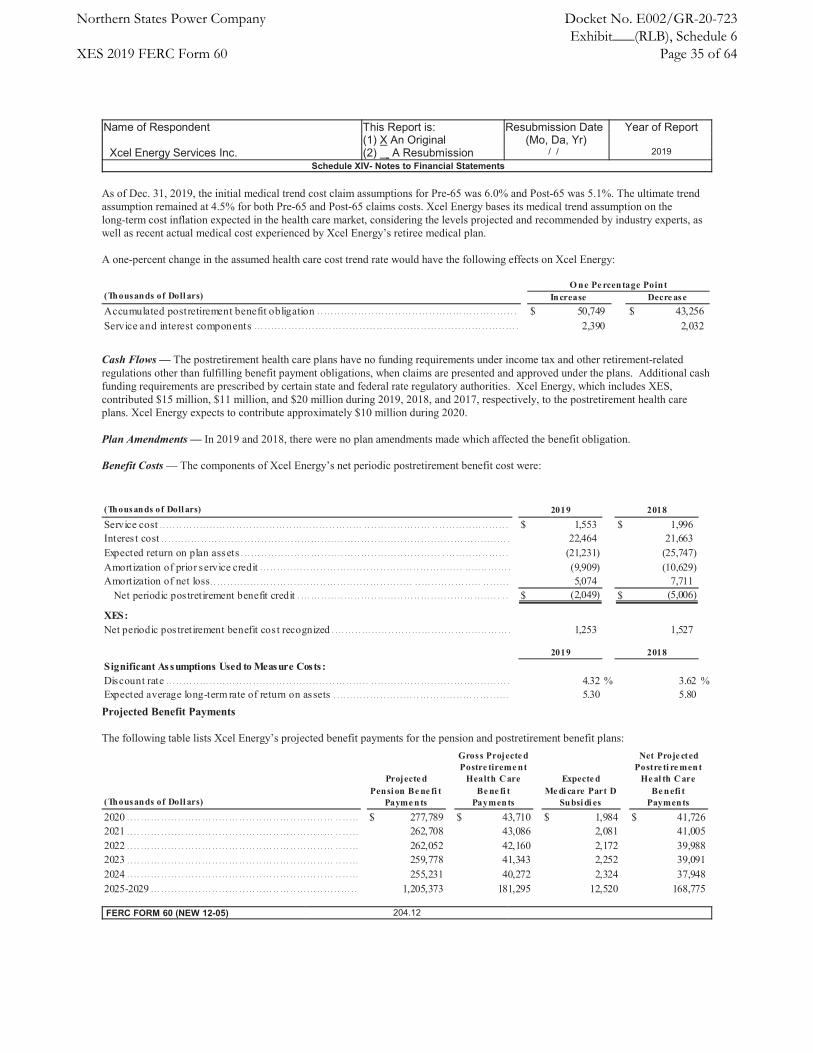
Northern States Power Company
XES 2019 FERC Form 60
Docket No. E002/GR-20-723 Exhibit___(RLB), Schedule 6
Page 35 of 64

Northern States Power Company
XES 2019 FERC Form 60
Docket No. E002/GR-20-723 Exhibit___(RLB), Schedule 6
Page 36 of 64

Northern States Power Company
XES 2019 FERC Form 60
Docket No. E002/GR-20-723 Exhibit___(RLB), Schedule 6
Page 37 of 64

Northern States Power Company
XES 2019 FERC Form 60
Docket No. E002/GR-20-723 Exhibit___(RLB), Schedule 6
Page 38 of 64

Northern States Power Company
XES 2019 FERC Form 60
Docket No. E002/GR-20-723 Exhibit___(RLB), Schedule 6
Page 39 of 64
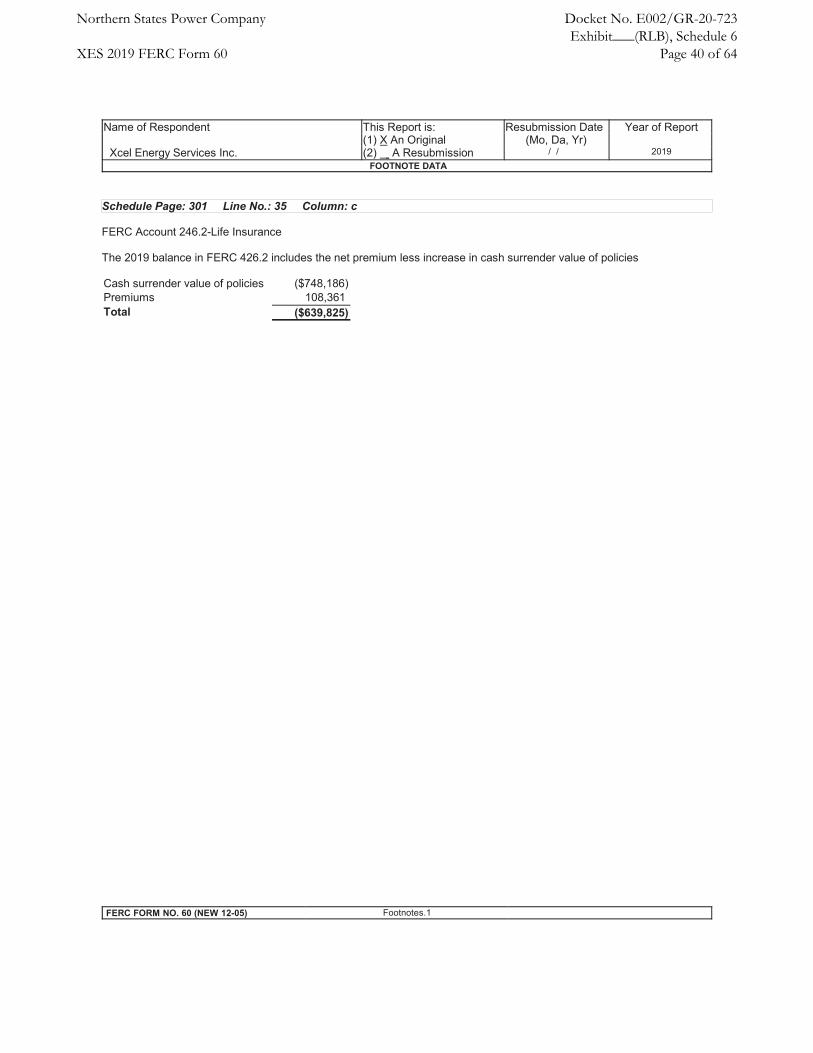
Northern States Power Company
XES 2019 FERC Form 60
Docket No. E002/GR-20-723 Exhibit___(RLB), Schedule 6
Page 40 of 64

Northern States Power Company
XES 2019 FERC Form 60
Docket No. E002/GR-20-723 Exhibit___(RLB), Schedule 6
Page 41 of 64

Northern States Power Company
XES 2019 FERC Form 60
Docket No. E002/GR-20-723 Exhibit___(RLB), Schedule 6
Page 42 of 64

Northern States Power Company
XES 2019 FERC Form 60
Docket No. E002/GR-20-723 Exhibit___(RLB), Schedule 6
Page 43 of 64

Northern States Power Company
XES 2019 FERC Form 60
Docket No. E002/GR-20-723 Exhibit___(RLB), Schedule 6
Page 44 of 64

Northern States Power Company
XES 2019 FERC Form 60
Docket No. E002/GR-20-723 Exhibit___(RLB), Schedule 6
Page 45 of 64

Northern States Power Company
XES 2019 FERC Form 60
Docket No. E002/GR-20-723 Exhibit___(RLB), Schedule 6
Page 46 of 64
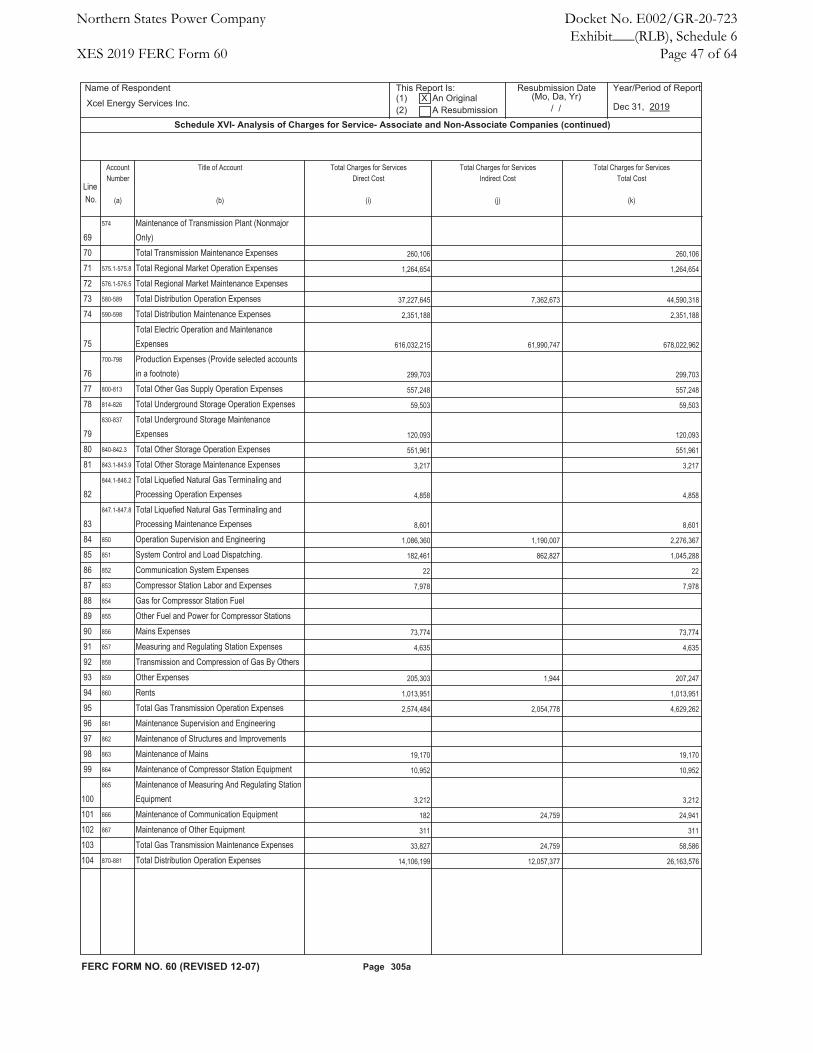
Northern States Power Company
XES 2019 FERC Form 60
Docket No. E002/GR-20-723 Exhibit___(RLB), Schedule 6
Page 47 of 64

Northern States Power Company
XES 2019 FERC Form 60
Docket No. E002/GR-20-723 Exhibit___(RLB), Schedule 6
Page 48 of 64

Northern States Power Company
XES 2019 FERC Form 60
Docket No. E002/GR-20-723 Exhibit___(RLB), Schedule 6
Page 49 of 64

Northern States Power Company
XES 2019 FERC Form 60
Docket No. E002/GR-20-723 Exhibit___(RLB), Schedule 6
Page 50 of 64

Northern States Power Company
XES 2019 FERC Form 60
Docket No. E002/GR-20-723 Exhibit___(RLB), Schedule 6
Page 51 of 64
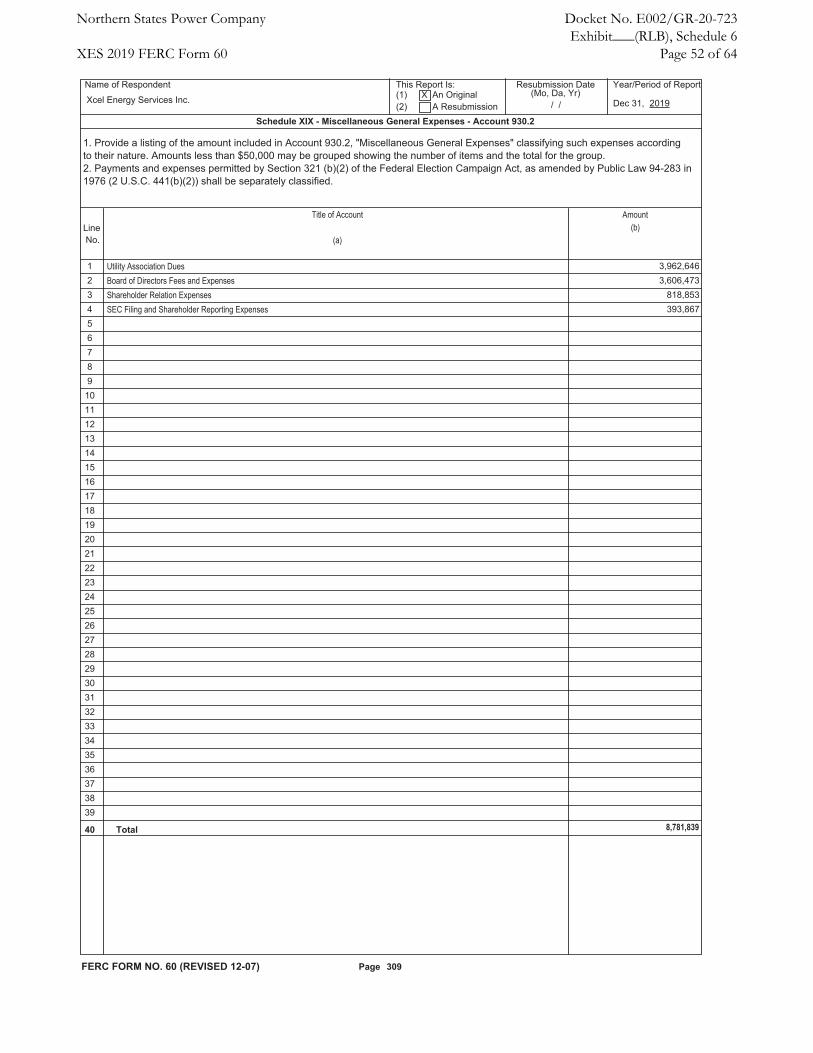
Northern States Power Company
XES 2019 FERC Form 60
Docket No. E002/GR-20-723 Exhibit___(RLB), Schedule 6
Page 52 of 64

Northern States Power Company
XES 2019 FERC Form 60
Docket No. E002/GR-20-723 Exhibit___(RLB), Schedule 6
Page 53 of 64

Northern States Power Company
XES 2019 FERC Form 60
Docket No. E002/GR-20-723 Exhibit___(RLB), Schedule 6
Page 54 of 64

Northern States Power Company
XES 2019 FERC Form 60
Docket No. E002/GR-20-723Exhibit___(RLB), Schedule 6
Page 55 of 64

Northern States Power Company
XES 2019 FERC Form 60
Docket No. E002/GR-20-723 Exhibit___(RLB), Schedule 6
Page 56 of 64

Northern States Power Company
XES 2019 FERC Form 60
Docket No. E002/GR-20-723 Exhibit___(RLB), Schedule 6
Page 57 of 64

Northern States Power Company
XES 2019 FERC Form 60
Docket No. E002/GR-20-723 Exhibit___(RLB), Schedule 6
Page 58 of 64

Northern States Power Company
XES 2019 FERC Form 60
Docket No. E002/GR-20-723Exhibit___(RLB), Schedule 6
Page 59 of 64

Northern States Power Company
XES 2019 FERC Form 60
Docket No. E002/GR-20-723 Exhibit___(RLB), Schedule 6
Page 60 of 64

Northern States Power Company
XES 2019 FERC Form 60
Docket No. E002/GR-20-723Exhibit___(RLB), Schedule 6
Page 61 of 64

Northern States Power Company
XES 2019 FERC Form 60
Docket No. E002/GR-20-723Exhibit___(RLB), Schedule 6
Page 62 of 64

Northern States Power Company
XES 2019 FERC Form 60
Docket No. E002/GR-20-723Exhibit___(RLB), Schedule 6
Page 63 of 64

Northern States Power Company
XES 2019 FERC Form 60
Docket No. E002/GR-20-723Exhibit___(RLB), Schedule 6
Page 64 of 64

Northern States Power Company
Utility Allocation Factors2021 Test Year Budget
Docket No. E002/GR-20-723Exhibit___(RLB-1), Schedule 7
Page 1 of 1
Cost Categories Allocation Method Reasonableness of Allocation Method Electric GasFERC Accounts 901-917 (excluding commodity bad debt in FERC 904)
Customer bill counts for the electric and gas departments.
Using Customer bill counts is reasonable because costs recorded in FERC accounts 901-917 are customer related. 79.6498% 20.3502%
FERC 904 (commodity bad debt portion)
Average total electric and gas revenues for the previous four years.
Using a revenue allocator is reasonable because commodity bad debt costs have a cost-causative relationship with uncollectible utility revenues. 77.0815% 11.1777%
FERC Accounts 920-924 3-factor allocation for the electric and gas departments.
Using a 3-factor allocation is reasonable because costs recorded in FERC accounts 920-924 are general in nature. 93.6423% 6.3577%
FERC Accounts 925-926 Operating labor for the electric and gas departments.
Using Operating labor is reasonable because costs recorded in FERC accounts 925-926 are employee related. 91.7887% 8.2113%
FERC Accounts 927-935 3-factor for the electric and gas departments. Using a 3-factor allocation is reasonable because costs recorded in FERC accounts 927-937 are general in nature. 93.6423% 6.3577%
2021 Test Year Percentages

Northern States Power Company
Administrative Services Agreements Charges Page 1 of 1
2021 Test Year Budget
Budget Year Total by Total for SPS 2021 Operating Co and PSCo
NSPM charges to NSPW
Facilities Overheads 7,890$ Labor Additives 691$
Total Charges to NSPW 8,581$
NSPW charges to NSPM
Facilities Overheads 23,945$ Labor Additives 1,122$ Total Charges to NSPM 25,067$
Charges from/to NSPW 33,648$
NSPM charges to PSCo
Facilities Overheads 1,571$ Labor Additives 137$ Total Charges to PSCo 1,708$
PSCo charges to NSPM
Facilities Overheads 1,179$ Labor Additives 15$
1,194$ 2,902$
NSPM charges to SPS
Facilities Overheads 407$ Labor Additives 41$ Total Charges to SPS 448$
SPS charges to NSPM
Facilities Overheads 101$ Labor Additives 2$
103$ 551$
Charges from/to Regulated Utility Operating Companies other than NSPW 3,453$
Definitions:NSPM - Northern States Power Company-Minnesota (Total Company)NSPW - Northern States Power Company-Wisconsin (Total Company)PSCo - Public Service Company of ColoradoSPS - Southwestern Public Service
Docket No. E002/GR-20-723Exhibit___(RLB-1), Schedule 8
Between Regulated Utility Operating Companies and NSPM (Total Company)

Northern States Power Company
Non-Regulated Business Activity SignificanceFiscal Year Ended 12/31/2019
Consolidated All Other % NSPM (Total Company) Non-Regulated of Total
Operating revenues 5,111,800$ (1)(2) 33,900$ (1)(2) 0.66%Less: Interest charges and financing costs (220,900) (1) - (1) Income tax expense (47,400) (1) 1,100 (1)Net income (542,600) (1) (11,600) (1)
Subtotal 4,300,900$ (3) 23,400$ (3)Add: Other expense, net (800) (2) - Allowance for funds used during construction - equity 24,800 (2) -
Operating expenses 4,324,900$ (2) 23,400$ (3)Less: Purchased cost of goods sold (COGS) (1,950,700) (3) (23,200) (2)
Operating expense, net of purchased COGS 2,374,200$ (3) 200$ (3) 0.01%
Calculation of Purchased Fuel, Power & Gas Expense (Purchased COGS)Electric fuel and purchased power 1,600,300$ (2)Cost of natural gas sold and transported 327,200 (2)Cost of sales - other 23,200 (2) 23,200$ (2)
Purchased COGS 1,950,700$ (3) 23,200$
Calculation of Operating Expenses excluding Purchased COGSOperating and maintenance expense 1,203,100$ (2)Conservation program expenses 119,700 (2)Depreciation and amortization 791,300 (2)Taxes (other than income taxes) 260,100 (2)
Operating expense, net of purchased COGS 2,374,200$ (3)
Total Operating Expenses (excluding interest and income tax expenses) 4,324,900$ (2)
(1) From page 51 of Northern States Power Company's (NSPM) Form 10-K filed with the SEC for the fiscal yearended December 31, 2019. According to NSPM, the "All Other" column primarily includes appliance repair services,non-utility real estate activities, and revenues associated with processing solid waste into refuse-derived fuel.
(2) From page 23 of Northern States Power Company's (NSPM) Form 10-K filed with the SEC for the fiscalyear ended December 31, 2019.
(3) Calculated number from above.
Docket No. E002/GR-20-723Exhibit___(RLB-1), Schedule 9
Page 1 of 1

UNITED STATESSECURITIES AND EXCHANGE COMMISSION
Washington, D.C. 20549
FORM 10-K (Mark One)
ANNUAL REPORT PURSUANT TO SECTION 13 OR 15(d) OF THE SECURITIES EXCHANGE ACT OF 1934
For the fiscal year ended December 31, 2019 or
TRANSITION REPORT PURSUANT TO SECTION 13 OR 15(d) OF THE SECURITIES EXCHANGE ACT OF 1934
001-31387(Commission File Number)
Northern States Power Company(Exact name of registrant as specificed in its charter)
Minnesota 41-1967505(State or other jurisdiction of incorporation or organization) (I.R.S. Employer Identification No.)
414 Nicollet Mall Minneapolis Minnesota 55401(Address of principal executive offices) (Zip Code)
(612) 330-5500(Registrant’s telephone number, including area code)
Securities registered pursuant to Section 12(b) of the Act:
Title of each class Trading Symbol Name of each exchange on which registeredN/A N/A N/A
Securities registered pursuant to section 12(g) of the Act: NoneIndicate by check mark if the registrant is a well-known seasoned issuer, as defined in Rule 405 of the Securities Act. Yes No
Indicate by check mark if the registrant is not required to file reports pursuant to Section 13 or Section 15(d) of the Act. Yes No Indicate by check mark whether the registrant (1) has filed all reports required to be filed by Section 13 or 15(d) of the Securities Exchange Act of 1934 during the preceding 12 months (or for such shorter period that the registrant was required to file such reports), and (2) has been subject to such filing requirements for the past 90 days. Yes NoIndicate by check mark whether the registrant has submitted electronically every Interactive Data File required to be submitted pursuant to Rule 405 of Regulation S-T (§232.405 of this chapter) during the preceding 12 months (or for such shorter period that the registrant was required to submit such files). Yes No
Indicate by check mark whether the registrant is a large accelerated filer, an accelerated filer, a non-accelerated filer, a smaller reporting company, or an emerging growth company. See the definitions of “large accelerated filer”, “accelerated filer”, “smaller reporting company”, and “emerging growth company” in Rule 12b-2 of the Exchange Act. Large accelerated filer Accelerated filer Non-accelerated filer Smaller reporting company Emerging growth companyIf an emerging growth company, indicate by check mark if the registrant has elected not to use the extended transition period for complying with any new or revised financial accounting standards provided pursuant to Section 13(a) of the Exchange Act.
Indicate by check mark whether the registrant is a shell company (as defined in Rule 12b-2 of the Act). Yes NoAs of Feb. 21, 2020, 1,000,000 shares of common stock, par value $0.01 per share, were outstanding, all of which were held by Xcel Energy Inc., a Minnesota corporation.
DOCUMENTS INCORPORATED BY REFERENCEThe information required by Item 14 of Form 10-K is set forth under the heading “Independent Registered Public Accounting Firm – Audit and Non-Audit Fees” in Xcel Energy Inc.’s definitive Proxy Statement for the 2020 Annual Meeting of Shareholders which definitive Proxy Statement is expected to be filed with the SEC on or about April 6, 2020. Such information set forth under such heading is incorporated herein by this reference hereto.Northern States Power Company meets the conditions set forth in General Instructions I(1)(a) and (b) of Form 10-K and is therefore filing this form with the reduced disclosure format permitted by General Instruction I(2).
Northern States Power Company
NSPM 2019 SEC Form 10-K
Docket No. E002/GR-20-723Exhibit___(RLB-1), Schedule 10
Page 1 of 56

2
TABLE OF CONTENTS
PART IItem 1 — Business
Definition of AbbreviationsForward-Looking StatementsWhere to Find More InformationCompany OverviewElectric OperationsNatural Gas OperationsGeneralEnvironmentalEmployees
Item 1A — Risk FactorsItem 1B — Unresolved Staff CommentsItem 2 — PropertiesItem 3 — Legal ProceedingsItem 4 — Mine Safety Disclosures
PART IIItem 5 — Market for Registrant’s Common Equity, Related Stockholder Matters and Issuer Purchases of Equity SecuritiesItem 6 — Selected Financial DataItem 7 — Management’s Discussion and Analysis of Financial Condition and Results of OperationsItem 7A — Quantitative and Qualitative Disclosures About Market RiskItem 8 — Financial Statements and Supplementary DataItem 9 — Changes in and Disagreements with Accountants on Accounting and Financial DisclosureItem 9A — Controls and ProceduresItem 9B — Other Information
PART IIIItem 10 — Directors, Executive Officers and Corporate GovernanceItem 11 — Executive CompensationItem 12 — Security Ownership of Certain Beneficial Owners and Management and Related Stockholder MattersItem 13 — Certain Relationships and Related Transactions, and Director IndependenceItem 14 — Principal Accountant Fees and Services
PART IVItem 15 — Exhibits, Financial Statement SchedulesItem 16 — Form 10-K Summary
Signatures
This Form 10-K is filed by NSP-Minnesota. NSP-Minnesota is a wholly owned subsidiary of Xcel Energy Inc. Additional information on Xcel Energy is available in various filings with the SEC. This report should be read in its entirety.
33444477888
14141414
1415151920515252
5252525252
5355
56
Northern States Power Company
NSPM 2019 SEC Form 10-K
Docket No. E002/GR-20-723 Exhibit___(RLB-1), Schedule 10
Page 2 of 56
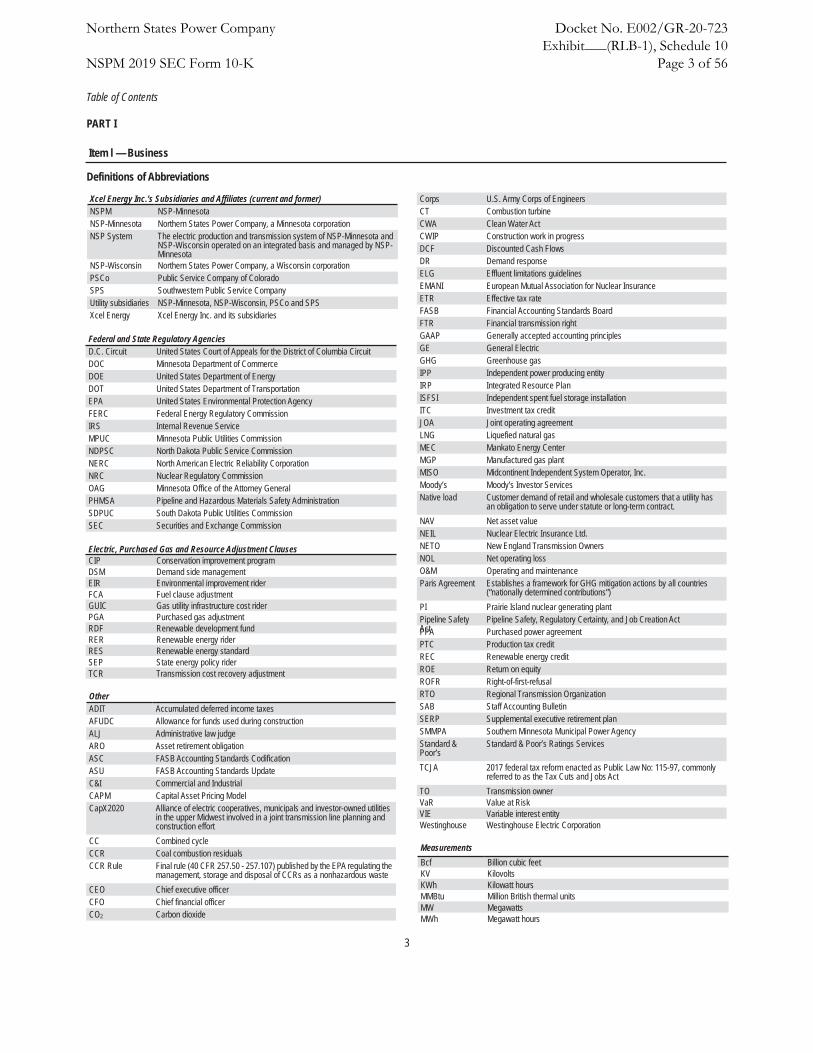
Table of Contents
3
PART I
Item l — Business
Definitions of Abbreviations
Xcel Energy Inc.’s Subsidiaries and Affiliates (current and former)NSPM NSP-MinnesotaNSP-Minnesota Northern States Power Company, a Minnesota corporationNSP System The electric production and transmission system of NSP-Minnesota and
NSP-Wisconsin operated on an integrated basis and managed by NSP-Minnesota
NSP-Wisconsin Northern States Power Company, a Wisconsin corporationPSCo Public Service Company of ColoradoSPS Southwestern Public Service CompanyUtility subsidiaries NSP-Minnesota, NSP-Wisconsin, PSCo and SPSXcel Energy Xcel Energy Inc. and its subsidiaries
Federal and State Regulatory AgenciesD.C. Circuit United States Court of Appeals for the District of Columbia CircuitDOC Minnesota Department of CommerceDOE United States Department of EnergyDOT United States Department of TransportationEPA United States Environmental Protection AgencyFERC Federal Energy Regulatory CommissionIRS Internal Revenue ServiceMPUC Minnesota Public Utilities CommissionNDPSC North Dakota Public Service CommissionNERC North American Electric Reliability CorporationNRC Nuclear Regulatory CommissionOAG Minnesota Office of the Attorney GeneralPHMSA Pipeline and Hazardous Materials Safety AdministrationSDPUC South Dakota Public Utilities CommissionSEC Securities and Exchange Commission
Electric, Purchased Gas and Resource Adjustment ClausesCIP Conservation improvement programDSM Demand side managementEIR Environmental improvement riderFCA Fuel clause adjustmentGUIC Gas utility infrastructure cost riderPGA Purchased gas adjustmentRDF Renewable development fundRER Renewable energy riderRES Renewable energy standardSEP State energy policy riderTCR Transmission cost recovery adjustment
OtherADIT Accumulated deferred income taxesAFUDC Allowance for funds used during constructionALJ Administrative law judgeARO Asset retirement obligationASC FASB Accounting Standards CodificationASU FASB Accounting Standards UpdateC&I Commercial and IndustrialCAPM Capital Asset Pricing ModelCapX2020 Alliance of electric cooperatives, municipals and investor-owned utilities
in the upper Midwest involved in a joint transmission line planning andconstruction effort
CC Combined cycleCCR Coal combustion residualsCCR Rule Final rule (40 CFR 257.50 - 257.107) published by the EPA regulating the
management, storage and disposal of CCRs as a nonhazardous wasteCEO Chief executive officerCFO Chief financial officerCO2 Carbon dioxide
Corps U.S. Army Corps of EngineersCT Combustion turbineCWA Clean Water ActCWIP Construction work in progressDCF Discounted Cash FlowsDR Demand responseELG Effluent limitations guidelinesEMANI European Mutual Association for Nuclear InsuranceETR Effective tax rateFASB Financial Accounting Standards BoardFTR Financial transmission rightGAAP Generally accepted accounting principlesGE General ElectricGHG Greenhouse gasIPP Independent power producing entityIRP Integrated Resource PlanISFSI Independent spent fuel storage installationITC Investment tax creditJOA Joint operating agreementLNG Liquefied natural gasMEC Mankato Energy CenterMGP Manufactured gas plantMISO Midcontinent Independent System Operator, Inc.Moody’s Moody’s Investor ServicesNative load Customer demand of retail and wholesale customers that a utility has
an obligation to serve under statute or long-term contract.NAV Net asset valueNEIL Nuclear Electric Insurance Ltd.NETO New England Transmission OwnersNOL Net operating lossO&M Operating and maintenanceParis Agreement Establishes a framework for GHG mitigation actions by all countries
(“nationally determined contributions”)PI Prairie Island nuclear generating plantPipeline SafetyAct
Pipeline Safety, Regulatory Certainty, and Job Creation ActPPA Purchased power agreementPTC Production tax creditREC Renewable energy creditROE Return on equityROFR Right-of-first-refusalRTO Regional Transmission OrganizationSAB Staff Accounting BulletinSERP Supplemental executive retirement planSMMPA Southern Minnesota Municipal Power AgencyStandard &Poor’s
Standard & Poor’s Ratings Services
TCJA 2017 federal tax reform enacted as Public Law No: 115-97, commonlyreferred to as the Tax Cuts and Jobs Act
TO Transmission ownerVaR Value at RiskVIE Variable interest entityWestinghouse Westinghouse Electric Corporation
MeasurementsBcf Billion cubic feetKV KilovoltsKWh Kilowatt hoursMMBtu Million British thermal unitsMW MegawattsMWh Megawatt hours
Northern States Power Company
NSPM 2019 SEC Form 10-K
Docket No. E002/GR-20-723 Exhibit___(RLB-1), Schedule 10
Page 3 of 56

Table of Contents
4
Forward-Looking Statements
Except for the historical statements contained in this report, the matters discussed herein are forward-looking statements that are subject to certain risks, uncertainties and assumptions. Such forward-looking statements, assumptions and other statements are intended to be identified in this document by the words “anticipate,” “believe,” “could,” “estimate,” “expect,” “intend,” “may,” “objective,” “outlook,” “plan,” “project,” “possible,” “potential,” “should,” “will,” “would” and similar expressions. Actual results may vary materially. Forward-looking statements speak only as of the date they are made, and we expressly disclaim any obligation to update any forward-looking information. The following factors, in addition to those discussed elsewhere in this Annual Report on Form 10-K for the fiscal year ended Dec. 31, 2019 (including risk factors listed from time to time by NSP-Minnesota in reports filed with the SEC, including “Risk Factors” in Item 1A of this Annual Report on Form 10-K hereto), could cause actual results to differ materially from management expectations as suggested by such forward-looking information: operational safety, including our nuclear generation facilities; successful long-term operational planning; commodity risks associated with energy markets and production; rising energy prices and fuel costs; qualified employee work force and third-party contractor factors; ability to recover costs, changes in regulation and subsidiaries’ ability to recover costs from customers; reductions in our credit ratings and the cost of maintaining certain contractual relationships; general economic conditions, including inflation rates, monetary fluctuations and their impact on capital expenditures and the ability of NSP-Minnesota and its subsidiaries to obtain financing on favorable terms; availability or cost of capital; our customers’ and counterparties’ ability to pay their debts to us; assumptions and costs relating to funding our employee benefit plans and health care benefits; our subsidiaries’ ability to make dividend payments; tax laws; effects of geopolitical events, including war and acts of terrorism; cyber security threats and data security breaches; seasonal weather patterns; changes in environmental laws and regulations; climate change and other weather; natural disaster and resource depletion, including compliance with any accompanying legislative and regulatory changes; and costs of potential regulatory penalties.
Where to Find More Information
NSP-Minnesota is a wholly owned subsidiary of Xcel Energy Inc., and Xcel Energy’s website address is www.xcelenergy.com. Xcel Energy makes available, free of charge through its website, its annual report on Form 10-K, quarterly reports on Form 10-Q, current reports on Form 8-K and all amendments to those reports filed or furnished pursuant to Section 13(a) or 15(d) of the Securities Exchange Act of 1934 as soon as reasonably practicable after the reports are electronically filed with or furnished to the SEC. The SEC maintains an internet site that contains reports, proxy and information statements, and other information regarding issuers that file electronically at http://www.sec.gov.
Company Overview
Electric customers 1.5 million NSP-Minnesota was incorporated in 2000 under the laws of Minnesota. NSP-Minnesota conducts business in Minnesota, North Dakota and South Dakota and has electric operations in all three states including the generation, purchase, transmission, distribution and sale of electricity. NSP-Minnesota and NSP-Wisconsin electric operations are managed on the NSP System. NSP-Minnesota also purchases, transports, distributes and sells natural gas to retail customers and transports customer-owned natural gas in Minnesota and North Dakota.
Natural gas customers 0.5 millionTotal assets $19.9 billionRate Base $11.2 billionROE 9.31%Electric generating capacity 7,712 MWGas storage capacity 17.1 BcfElectric transmission lines (conductor miles) 33,528 milesElectric distribution lines (conductor miles) 80,186 milesNatural gas transmission lines 86 milesNatural gas distribution lines 10,518 miles
Electric Operations
NSP-Minnesota had electric sales volume of 41,298 (millions of KWh), 1,497,043 customers and electric revenues of $4,506.6 (millions of dollars) for 2019.
Northern States Power Company
NSPM 2019 SEC Form 10-K
Docket No. E002/GR-20-723 Exhibit___(RLB-1), Schedule 10
Page 4 of 56

Table of Contents
5
Sales/Revenue Statistics
2019 2018KWH sales per retail customer 22,405 23,511Revenue per retail customer $2,368 $2,414Residential revenue per KWh 13.22¢ 13.03¢Large C&I revenue per KWh 7.96¢ 7.69¢Small C&I revenue per KWh 10.15¢ 9.79¢Total retail revenue per KWh 10.57¢ 10.27¢
Owned and Purchased Energy Generation — 2019
Electric Energy SourcesTotal electric generation by source (including energy market purchases) for the year ended Dec. 31, 2019:
*Distributed generation from the Solar*Rewards® program is not included (approximately 12.3 million KWh for 2019).
Renewable Energy Sources — NSP SystemThe NSP System’s renewable energy portfolio includes wind, hydroelectric, biomass and solar power from both owned generating facilities and PPAs. Renewable percentages will vary year over year based on system additions, weather, system demand and transmission constraints.See Item 2 — Properties for further information.Renewable energy as a percentage of total energy for 2019:
(a) Includes biomass and hydroelectric
Wind Energy SourcesOwned — Owned and operated wind farms with corresponding capacity:
2019 2018
Wind Farms Capacity Wind Farms Capacity7 1090 MW 5 840 MW
PPAs — Number of PPAs with range:
2019 2018
PPAs Range PPAs Range131 0.7 MW - 205.5 MW 132 0.7 MW - 205.5 MW
Capacity — Wind capacity:
2019 20182,780 MW 2,550 MW
Average Cost (Owned) — Average cost per MWh of wind energy from owned generation:
2019 2018$35 $37
Average Cost (PPAs) — Average cost per MWh of wind energy under existing PPAs:
2019 2018$41 $44
Northern States Power Company
NSPM 2019 SEC Form 10-K
Docket No. E002/GR-20-723 Exhibit___(RLB-1), Schedule 10
Page 5 of 56

Table of Contents
6
Wind Energy DevelopmentNSP-Minnesota placed approximately 250 MW of wind into service during 2019:
Project CapacityFoxtail 150 MWLake Benton 99 MW
NSP-Minnesota currently has approximately 1,170 MW of owned wind under development or construction and approximately 450 MW of planned PPAs with an estimated completion date of 2021 or earlier:
Project Capacity Estimated CompletionFreeborn 200 MW 2020Blazing Star 1 200 MW 2020Blazing Star 2 200 MW 2020Crowned Ridge (a) 200 MW 2020Jeffers (b) 44 MW 2020CWN (b) 26 MW 2020Dakota Range 300 MW 2021Various PPAs ~450 MW 2020-2021
(a) Build-own-transfer project.(b) Repowering project.
Solar Energy SourcesSolar energy PPAs:
Type CapacityDistributed Generation 736 MWUtility-Scale 266 MW
Other Carbon-Free Energy Sources — NSP SystemThe NSP System’s other carbon-free energy portfolio includes nuclear from owned generating facilities. See Item 2 — Properties for further information.Nuclear Energy SourcesThe NSP System has two nuclear plants (owned by NSP-Minnesota) with approximately 1,700 MW of total 2019 net summer dependable capacity. NSP-Minnesota secures contracts for uranium concentrates, uranium conversion, uranium enrichment and fuel fabrication to operate its nuclear plants. The contract strategy involves a portfolio of spot purchases and medium and long-term contracts for uranium concentrates, conversion services and enrichment services with multiple producers and with a focus on diversification and alternate sources to minimize potential impacts caused by supply interruptions due to geographical and world political issues.Nuclear Fuel Cost
Delivered cost per MMBtu of nuclear fuel consumed for owned electric generation and the percentage of total fuel requirements:
NuclearCost Percent
2019 $ 0.81 45%2018 0.80 45
Fossil Fuel Energy Sources — NSP SystemThe NSP System’s fossil fuel energy portfolio includes coal and natural gas power from both owned generating facilities and PPAs. See Item 2 — Properties for further information.Coal Energy SourcesNSP System has three coal plants with approximately 2,400 MW of total 2019 net summer dependable capacity. Approved and proposed coal plant retirements:
Approved (2019 to 2027)Year Plant Capacity
2023 Sherco Unit 2 682 MW2026 Sherco Unit 1 680 MW
Proposed (2028 to 2030)Year Plant Capacity
2028 A.S King 511 MW2030 Sherco Unit 3 517 MW
Coal Fuel Cost
Delivered cost per MMBtu of coal consumed for owned electric generation and the percentage of total fuel requirements:
Coal (a)
Cost Percent2019 $ 2.02 36%2018 2.13 42
(a) Includes refuse-derived fuel and wood for the NSP System.
Natural Gas Energy SourcesThe NSP System has eight natural gas plants with approximately 2,800 MW of total 2019 net summer dependable capacity. Natural gas supplies, transportation and storage services for power plants are procured to provide an adequate supply of fuel. Remaining requirements are procured through a liquid spot market. Generally, natural gas supply contracts have variable pricing that is tied to natural gas indices. Natural gas supply and transportation agreements include obligations for the purchase and/or delivery of specified volumes or payments in lieu of delivery.Natural Gas Cost
Delivered cost per MMBtu of natural gas consumed for owned electric generation and the percentage of total fuel requirements:
Natural GasCost Percent
2019 $ 3.09 19%2018 3.87 13
Capacity and DemandUninterrupted system peak demand and occurrence date:
System Peak Demand (in MW)2019 2018
8,774 July 19 8,927 June 29
Northern States Power Company
NSPM 2019 SEC Form 10-K
Docket No. E002/GR-20-723 Exhibit___(RLB-1), Schedule 10
Page 6 of 56

Table of Contents
7
TransmissionTransmission lines deliver electricity over long distances from power sources to transmission substations closer to homes and businesses. A strong transmission system ensures continued reliable and affordable service, ability to meet state and regional energy policy goals, and support a diverse generation mix, including renewable energy. NSP-Minnesota owns more than 33,500 conductor miles of transmission lines across its service territory.
During 2019, NSP-Minnesota completed the following transmission projects:
Project Miles SizeMaple River-Red River 5 115 KV
Upcoming transmission projects:
Project Miles Size Completion DateHuntley-Wilmarth 50 345 KV 2021
Natural Gas Operations
Natural gas operations consist of purchase, transportation and distribution of natural gas to end use residential, C&I and transport customers. NSP-Minnesota had natural gas deliveries of 106,292 (thousands of MMBtu), 525,511 customers and natural gas revenues of $571.3 (millions of dollars) for 2019.
Sales/Revenue Statistics
2019 2018MMBtu sales per retail customer 176.96 172.78Revenue per retail customer $ 1,072.29 $ 1,094.53Residential revenue per MMBtu 7.04 7.29C&I revenue per MMBtu 5.12 5.42Transportation and other revenue per MMBtu 0.59 1.09
Capability and DemandNatural gas supply requirements are categorized as firm or interruptible (customers with an alternate energy supply). Maximum daily output (firm and interruptible) and occurrence date:
2019 2018MMBtu Date MMBtu Date
897,615 (a) Feb. 25 786,751 Jan. 12
(a) Increase in maximum MMBtu output due to colder winter temperatures in 2019.
Natural Gas Supply and CostsNSP-Minnesota actively seeks natural gas supply, transportation and storage alternatives to yield a diversified portfolio, which provides increased flexibility, decreased interruption and financial risk and economical rates. In addition, NSP-Minnesota conducts natural gas price hedging activities approved by its state commissions. Average delivered cost per MMBtu of natural gas for regulated retail distribution:
2019 2018$ 3.71 $ 4.03
NSP-Minnesota has natural gas supply transportation and storage agreements that include obligations for purchase and/or delivery of specified volumes or to make payments in lieu of delivery. See Item 2 - Properties for further information.
General
SeasonalityDemand for electric power and natural gas is affected by seasonal differences in the weather. In general, peak sales of electricity occur in the summer months and peak sales of natural gas occur in the winter months. As a result, the overall operating results may fluctuate substantially on a seasonal basis. Additionally, NSP-Minnesota’s operations have historically generated less revenues and income when weather conditions are milder in the winter and cooler in the summer. CompetitionNSP-Minnesota is subject to public policies that promote competition and development of energy markets. NSP-Minnesota’s industrial and large commercial customers have the ability to generate their own electricity. In addition, customers may have the option of substituting other fuels or relocating their facilities to a lower cost region.
Northern States Power Company
NSPM 2019 SEC Form 10-K
Docket No. E002/GR-20-723 Exhibit___(RLB-1), Schedule 10
Page 7 of 56

Table of Contents
8
Customers have the opportunity to supply their own power with distributed generation including solar generation and in most jurisdictions can currently avoid paying for most of the fixed production, transmission and distribution costs incurred to serve them. Several states, including Minnesota, have incentives for the development of rooftop solar, community solar gardens and other distributed energy resources. Distributed generating resources are potential competitors to NSP-Minnesota’s electric service business with these incentives and federal tax subsidies. The FERC has continued to promote competitive wholesale markets through open access transmission and other means. NSP-Minnesota’s wholesale customers can purchase their output from generation resources of competing suppliers or non-contracted quantities and use the transmission systems of Xcel Energy Inc.’s utility subsidiaries on a comparable basis to serve their native load. FERC Order No. 1000 established competition for construction and operation of certain new electric transmission facilities. State utilities commissions have also created resource planning programs that promote competition for electricity generation resources used to provide service to retail customers. NSP-Minnesota has franchise agreements with cities subject to periodic renewal; however, a city could seek alternative means to access electric power or gas, such as municipalization. No municipalization activities are occurring presently. While facing these challenges, NSP-Minnesota believes its rates and services are competitive with alternatives currently available.
Public Utility Regulation
See Item 7 for discussion of public utility regulation.
Environmental
Environmental Regulation Our facilities are regulated by federal and state environmental agencies that have jurisdiction over air emissions, water quality, wastewater discharges, solid wastes and hazardous substances. Various company activities require registrations, permits, licenses, inspections and approvals from these agencies. NSP-Minnesota has received necessary authorizations for the construction and continued operation of its generation, transmission and distribution systems. Our facilities have been designed and constructed to operate in compliance with applicable environmental standards and related monitoring and reporting requirements. However, it is not possible to determine when or to what extent additional facilities or modifications of existing or planned facilities will be required as a result of changes to regulations, interpretations or enforcement policies or what effect future laws or regulations may have. We may be required to incur expenditures in the future for remediation of MGP and other sites if it is determined that prior compliance efforts are not sufficient.NSP-Minnesota must comply with emission budgets that require the purchase of emission allowances from other utilities.
There are significant present and future environmental regulations to encourage use of clean energy technologies and regulate emissions of GHGs. NSP-Minnesota has undertaken numerous initiatives to meet current requirements and prepare for potential future regulations, reduce GHG emissions and respond to state renewable and energy efficiency goals. If future environmental regulations do not take into consideration investments already made or if additional initiatives or emission reductions are required, substantial costs may be incurred. In July 2019, the EPA adopted the Affordable Clean Energy rule, which requires states to develop plans for GHG reductions from coal-fired power plants. The state plans, due to the EPA in July 2022, will evaluate and potentially require heat rate improvements at existing coal-fired plants. It is not yet known how these state plans will affect NSP-Minnesota’s existing coal plants, but they could require substantial additional investment, even in plants slated for retirement. NSP-Minnesota believes, based on prior state commission practice, the cost of these initiatives or replacement generation would be recoverable through rates.NSP-Minnesota seeks to address climate change and potential climate change regulation through efforts to reduce its GHG emissions in a balanced, cost-effective manner.
EmployeesAs of Dec. 31, 2019, NSP-Minnesota had 3,195 full-time employees and eight part-time employees, of which 2,036 were covered under collective-bargaining agreements.
ITEM 1A — RISK FACTORS
Xcel Energy, which includes NSP-Minnesota, is subject to a variety of risks, many of which are beyond our control. Risks that may adversely affect the business, financial condition, results of operations or cash flows are described below. These risks should be carefully considered together with the other information set forth in this report and future reports that Xcel Energy files with the SEC.Oversight of Risk and Related ProcessesThe Board of Directors is responsible for the oversight of material risk and maintaining an effective risk monitoring process. Management and the Board of Directors have responsibility for overseeing the identification and mitigation of key risks.At a threshold level, NSP-Minnesota maintains a robust compliance program and promotes a culture of compliance beginning with the tone at the top. The risk mitigation process includes adherence to our code of conduct and compliance policies, operation of formal risk management structures and overall business management. NSP-Minnesota further mitigates inherent risks through formal risk committees and corporate functions such as internal audit, and internal controls over financial reporting and legal.Management identifies and analyzes risks to determine materiality and other attributes such as timing, probability and controllability. Identification and risk analysis occurs formally through risk assessment conducted by senior management, the financial disclosure process, hazard risk procedures, internal audit and compliance with financial and operational controls. Management also identifies and analyzes risk through the business planning process, development of goals and establishment of key performance indicators, including identification of barriers to implementing our strategy. The business planning process also identifies likelihood and mitigating factors to prevent the assumption of inappropriate risk to meet goals.
Northern States Power Company
NSPM 2019 SEC Form 10-K
Docket No. E002/GR-20-723 Exhibit___(RLB-1), Schedule 10
Page 8 of 56
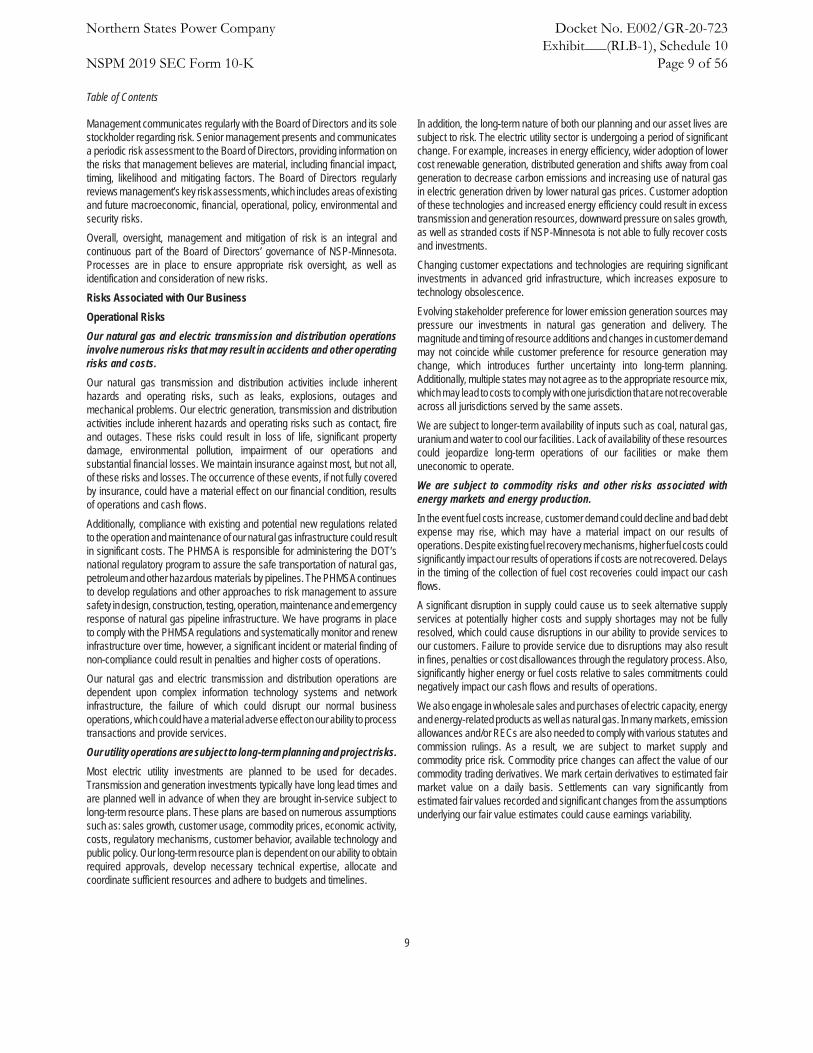
Table of Contents
9
Management communicates regularly with the Board of Directors and its sole stockholder regarding risk. Senior management presents and communicates a periodic risk assessment to the Board of Directors, providing information on the risks that management believes are material, including financial impact, timing, likelihood and mitigating factors. The Board of Directors regularly reviews management’s key risk assessments, which includes areas of existing and future macroeconomic, financial, operational, policy, environmental and security risks. Overall, oversight, management and mitigation of risk is an integral and continuous part of the Board of Directors’ governance of NSP-Minnesota. Processes are in place to ensure appropriate risk oversight, as well as identification and consideration of new risks. Risks Associated with Our BusinessOperational RisksOur natural gas and electric transmission and distribution operations involve numerous risks that may result in accidents and other operating risks and costs.Our natural gas transmission and distribution activities include inherent hazards and operating risks, such as leaks, explosions, outages and mechanical problems. Our electric generation, transmission and distribution activities include inherent hazards and operating risks such as contact, fire and outages. These risks could result in loss of life, significant property damage, environmental pollution, impairment of our operations and substantial financial losses. We maintain insurance against most, but not all, of these risks and losses. The occurrence of these events, if not fully covered by insurance, could have a material effect on our financial condition, results of operations and cash flows.Additionally, compliance with existing and potential new regulations related to the operation and maintenance of our natural gas infrastructure could result in significant costs. The PHMSA is responsible for administering the DOT’s national regulatory program to assure the safe transportation of natural gas, petroleum and other hazardous materials by pipelines. The PHMSA continues to develop regulations and other approaches to risk management to assure safety in design, construction, testing, operation, maintenance and emergency response of natural gas pipeline infrastructure. We have programs in place to comply with the PHMSA regulations and systematically monitor and renew infrastructure over time, however, a significant incident or material finding of non-compliance could result in penalties and higher costs of operations. Our natural gas and electric transmission and distribution operations are dependent upon complex information technology systems and network infrastructure, the failure of which could disrupt our normal business operations, which could have a material adverse effect on our ability to process transactions and provide services. Our utility operations are subject to long-term planning and project risks.Most electric utility investments are planned to be used for decades. Transmission and generation investments typically have long lead times and are planned well in advance of when they are brought in-service subject to long-term resource plans. These plans are based on numerous assumptions such as: sales growth, customer usage, commodity prices, economic activity, costs, regulatory mechanisms, customer behavior, available technology and public policy. Our long-term resource plan is dependent on our ability to obtain required approvals, develop necessary technical expertise, allocate and coordinate sufficient resources and adhere to budgets and timelines.
In addition, the long-term nature of both our planning and our asset lives are subject to risk. The electric utility sector is undergoing a period of significant change. For example, increases in energy efficiency, wider adoption of lower cost renewable generation, distributed generation and shifts away from coal generation to decrease carbon emissions and increasing use of natural gas in electric generation driven by lower natural gas prices. Customer adoption of these technologies and increased energy efficiency could result in excess transmission and generation resources, downward pressure on sales growth, as well as stranded costs if NSP-Minnesota is not able to fully recover costs and investments. Changing customer expectations and technologies are requiring significant investments in advanced grid infrastructure, which increases exposure to technology obsolescence. Evolving stakeholder preference for lower emission generation sources may pressure our investments in natural gas generation and delivery. The magnitude and timing of resource additions and changes in customer demand may not coincide while customer preference for resource generation may change, which introduces further uncertainty into long-term planning. Additionally, multiple states may not agree as to the appropriate resource mix, which may lead to costs to comply with one jurisdiction that are not recoverable across all jurisdictions served by the same assets. We are subject to longer-term availability of inputs such as coal, natural gas, uranium and water to cool our facilities. Lack of availability of these resources could jeopardize long-term operations of our facilities or make them uneconomic to operate.We are subject to commodity risks and other risks associated with energy markets and energy production.In the event fuel costs increase, customer demand could decline and bad debt expense may rise, which may have a material impact on our results of operations. Despite existing fuel recovery mechanisms, higher fuel costs could significantly impact our results of operations if costs are not recovered. Delays in the timing of the collection of fuel cost recoveries could impact our cash flows. A significant disruption in supply could cause us to seek alternative supply services at potentially higher costs and supply shortages may not be fully resolved, which could cause disruptions in our ability to provide services to our customers. Failure to provide service due to disruptions may also result in fines, penalties or cost disallowances through the regulatory process. Also, significantly higher energy or fuel costs relative to sales commitments could negatively impact our cash flows and results of operations.We also engage in wholesale sales and purchases of electric capacity, energy and energy-related products as well as natural gas. In many markets, emission allowances and/or RECs are also needed to comply with various statutes and commission rulings. As a result, we are subject to market supply and commodity price risk. Commodity price changes can affect the value of our commodity trading derivatives. We mark certain derivatives to estimated fair market value on a daily basis. Settlements can vary significantly from estimated fair values recorded and significant changes from the assumptions underlying our fair value estimates could cause earnings variability.
Northern States Power Company
NSPM 2019 SEC Form 10-K
Docket No. E002/GR-20-723 Exhibit___(RLB-1), Schedule 10
Page 9 of 56

Table of Contents
10
Failure to attract and retain a qualified workforce could have an adverse effect on operations.Certain specialized knowledge is required of our technical employees for construction and operation of transmission, generation, and distribution assets. Our business strategy is dependent on our ability to recruit, retain and motivate employees. Competition for skilled employees is high in the areas of business operations. Failure to hire and adequately train replacement employees, including the transfer of significant internal historical knowledge and expertise to new employees, or future availability and cost of contract labor may adversely affect the ability to manage and operate our business. We have seen a tightening of supply for engineers and skilled laborers in certain markets and are implementing plans to retain these employees. Inability to attract and retain these employees could adversely impact our results of operations, financial condition or cash flows.Our operations use third-party contractors in addition to employees to perform periodic and ongoing work.We rely on third-party contractors to perform operations, maintenance and construction work. Our contractual arrangements with these contractors typically include performance standards, progress payments, insurance requirements and security for performance. Poor vendor performance could impact ongoing operations, restoration operations, our reputation and could introduce financial risk or risks of fines. We are subject to the risks of nuclear generation.NSP-Minnesota has two nuclear generation plants, PI and Monticello. Risks of nuclear generation include:• Hazards associated with the use of radioactive material in energy
production, including management, handling, storage and disposal;• Limitations on insurance available to cover losses that may arise in
connection with nuclear operations, as well as obligations to contribute to an insurance pool in the event of damages at a covered U.S. reactor; and
• Technological and financial uncertainties related to the costs ofdecommissioning nuclear plants may cause our funding obligations to change.
The NRC has authority to impose licensing and safety-related requirements for the operation of nuclear generation facilities, including the ability to impose fines and/or shut down a unit until compliance is achieved. Revised NRC safety requirements could necessitate substantial capital expenditures or an increase in operating expenses. In addition, the Institute for Nuclear Power Operations reviews our nuclear operations and nuclear generation facilities. Compliance with the Institute for Nuclear Power Operations’ recommendations could result in substantial capital expenditures or a substantial increase in operating expenses.If an incident did occur, it could have a material impact on our results of operations, financial condition or cash flows. Furthermore, non-compliance or the occurrence of a serious incident at other nuclear facilities could result in increased industry regulation, which may increase our compliance costs.NSP-Wisconsin’s production and transmission system is operated on an integrated basis with our production and transmission system, and NSP-Wisconsin may be subject to risks associated with our nuclear generation.
We are a wholly owned subsidiary of Xcel Energy Inc. Xcel Energy Inc. can exercise substantial control over our dividend policy and business and operations and may exercise that control in a manner that may be perceived to be adverse to our interests.All of the members of our Board of Directors, as well as many of our executive officers, are officers of Xcel Energy Inc. Our Board of Directors makes determinations with respect to a number of significant corporate events, including the payment of our dividends.We have historically paid quarterly dividends to Xcel Energy Inc. In 2019, 2018 and 2017 we paid $466.6 million, $456.3 million and $506.6 million of dividends to Xcel Energy Inc., respectively. If Xcel Energy Inc.’s cash requirements increase, our Board of Directors could decide to increase the dividends we pay to Xcel Energy Inc. to help support Xcel Energy Inc.’s cash needs. This could adversely affect our liquidity. The most restrictive dividend limitation for NSP-Minnesota is imposed by our state regulatory commissions. State regulatory commissions indirectly limit the amount of dividends NSP-Minnesota can pay to Xcel Energy Inc., by requiring a minimum equity-to-total capitalization ratio. See Note 5 to the consolidated financial statements for further information.Financial RisksOur profitability depends on our ability to recover costs from our customers and changes in regulation may impair our ability to recover costs from our customers.We are subject to comprehensive regulation by federal and state utility regulatory agencies, including siting and construction of facilities, customer service and the rates that we can charge customers.The profitability of our operations is dependent on our ability to recover the costs of providing energy and utility services and earn a return on our capital investment. Our rates are generally regulated and based on an analysis of our costs incurred in a test year. We are subject to both future and historical test years depending upon the regulatory jurisdiction. Thus, the rates we are allowed to charge may or may not match our costs at any given time. Rate regulation is premised on providing an opportunity to earn a reasonable rate of return on invested capital. There can also be no assurance that our regulatory commissions will judge all our costs to be prudent, which could result in disallowances, or that the regulatory process will always result in rates that will produce full recovery. Overall, management believes prudently incurred costs are recoverable given the existing regulatory framework. However, there may be changes in the regulatory environment that could impair our ability to recover costs historically collected from customers, or we could exceed caps on capital costs (e.g., wind projects) required by commissions and result in less than full recovery. Changes in the long-term cost-effectiveness or to the operating conditions of our assets may result in early retirements of utility facilities. While regulation typically provides relief for these types of changes, there is no assurance that regulators would allow full recovery of all remaining costs. In a continued low interest rate environment there has been increased downward pressure on allowed ROE. Conversely, higher than expected inflation or tariffs may increase costs of construction and operations. Also, rising fuel costs could increase the risk that we will not be able to fully recover our fuel costs from our customers. Adverse regulatory rulings or the imposition of additional regulations could have an adverse impact on our results of operations and materially affect our ability to meet our financial obligations, including debt payments.
Northern States Power Company
NSPM 2019 SEC Form 10-K
Docket No. E002/GR-20-723Exhibit___(RLB-1), Schedule 10
Page 10 of 56
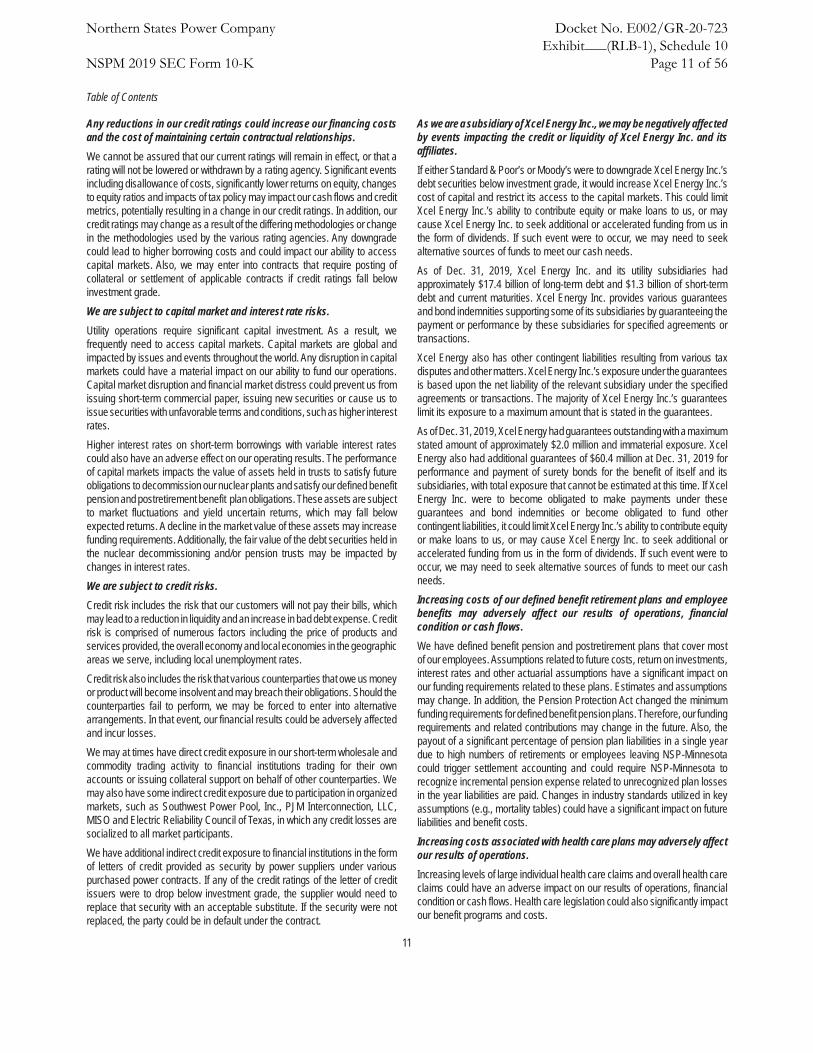
Table of Contents
11
Any reductions in our credit ratings could increase our financing costs and the cost of maintaining certain contractual relationships.We cannot be assured that our current ratings will remain in effect, or that a rating will not be lowered or withdrawn by a rating agency. Significant events including disallowance of costs, significantly lower returns on equity, changes to equity ratios and impacts of tax policy may impact our cash flows and credit metrics, potentially resulting in a change in our credit ratings. In addition, our credit ratings may change as a result of the differing methodologies or change in the methodologies used by the various rating agencies. Any downgrade could lead to higher borrowing costs and could impact our ability to access capital markets. Also, we may enter into contracts that require posting of collateral or settlement of applicable contracts if credit ratings fall below investment grade.We are subject to capital market and interest rate risks.Utility operations require significant capital investment. As a result, we frequently need to access capital markets. Capital markets are global and impacted by issues and events throughout the world. Any disruption in capital markets could have a material impact on our ability to fund our operations. Capital market disruption and financial market distress could prevent us from issuing short-term commercial paper, issuing new securities or cause us to issue securities with unfavorable terms and conditions, such as higher interest rates.Higher interest rates on short-term borrowings with variable interest rates could also have an adverse effect on our operating results. The performance of capital markets impacts the value of assets held in trusts to satisfy future obligations to decommission our nuclear plants and satisfy our defined benefit pension and postretirement benefit plan obligations. These assets are subject to market fluctuations and yield uncertain returns, which may fall below expected returns. A decline in the market value of these assets may increase funding requirements. Additionally, the fair value of the debt securities held in the nuclear decommissioning and/or pension trusts may be impacted by changes in interest rates.We are subject to credit risks.Credit risk includes the risk that our customers will not pay their bills, which may lead to a reduction in liquidity and an increase in bad debt expense. Credit risk is comprised of numerous factors including the price of products and services provided, the overall economy and local economies in the geographic areas we serve, including local unemployment rates.Credit risk also includes the risk that various counterparties that owe us money or product will become insolvent and may breach their obligations. Should the counterparties fail to perform, we may be forced to enter into alternative arrangements. In that event, our financial results could be adversely affected and incur losses.We may at times have direct credit exposure in our short-term wholesale and commodity trading activity to financial institutions trading for their own accounts or issuing collateral support on behalf of other counterparties. We may also have some indirect credit exposure due to participation in organized markets, such as Southwest Power Pool, Inc., PJM Interconnection, LLC, MISO and Electric Reliability Council of Texas, in which any credit losses are socialized to all market participants.We have additional indirect credit exposure to financial institutions in the form of letters of credit provided as security by power suppliers under various purchased power contracts. If any of the credit ratings of the letter of credit issuers were to drop below investment grade, the supplier would need to replace that security with an acceptable substitute. If the security were not replaced, the party could be in default under the contract.
As we are a subsidiary of Xcel Energy Inc., we may be negatively affected by events impacting the credit or liquidity of Xcel Energy Inc. and its affiliates.If either Standard & Poor’s or Moody’s were to downgrade Xcel Energy Inc.’s debt securities below investment grade, it would increase Xcel Energy Inc.’s cost of capital and restrict its access to the capital markets. This could limit Xcel Energy Inc.’s ability to contribute equity or make loans to us, or may cause Xcel Energy Inc. to seek additional or accelerated funding from us in the form of dividends. If such event were to occur, we may need to seek alternative sources of funds to meet our cash needs.As of Dec. 31, 2019, Xcel Energy Inc. and its utility subsidiaries had approximately $17.4 billion of long-term debt and $1.3 billion of short-term debt and current maturities. Xcel Energy Inc. provides various guarantees and bond indemnities supporting some of its subsidiaries by guaranteeing the payment or performance by these subsidiaries for specified agreements or transactions.Xcel Energy also has other contingent liabilities resulting from various tax disputes and other matters. Xcel Energy Inc.’s exposure under the guarantees is based upon the net liability of the relevant subsidiary under the specified agreements or transactions. The majority of Xcel Energy Inc.’s guarantees limit its exposure to a maximum amount that is stated in the guarantees. As of Dec. 31, 2019, Xcel Energy had guarantees outstanding with a maximum stated amount of approximately $2.0 million and immaterial exposure. Xcel Energy also had additional guarantees of $60.4 million at Dec. 31, 2019 for performance and payment of surety bonds for the benefit of itself and its subsidiaries, with total exposure that cannot be estimated at this time. If Xcel Energy Inc. were to become obligated to make payments under these guarantees and bond indemnities or become obligated to fund other contingent liabilities, it could limit Xcel Energy Inc.’s ability to contribute equity or make loans to us, or may cause Xcel Energy Inc. to seek additional or accelerated funding from us in the form of dividends. If such event were to occur, we may need to seek alternative sources of funds to meet our cash needs.Increasing costs of our defined benefit retirement plans and employee benefits may adversely affect our results of operations, financial condition or cash flows.We have defined benefit pension and postretirement plans that cover most of our employees. Assumptions related to future costs, return on investments, interest rates and other actuarial assumptions have a significant impact on our funding requirements related to these plans. Estimates and assumptions may change. In addition, the Pension Protection Act changed the minimum funding requirements for defined benefit pension plans. Therefore, our funding requirements and related contributions may change in the future. Also, the payout of a significant percentage of pension plan liabilities in a single year due to high numbers of retirements or employees leaving NSP-Minnesota could trigger settlement accounting and could require NSP-Minnesota to recognize incremental pension expense related to unrecognized plan losses in the year liabilities are paid. Changes in industry standards utilized in key assumptions (e.g., mortality tables) could have a significant impact on future liabilities and benefit costs. Increasing costs associated with health care plans may adversely affect our results of operations.Increasing levels of large individual health care claims and overall health care claims could have an adverse impact on our results of operations, financial condition or cash flows. Health care legislation could also significantly impact our benefit programs and costs.
Northern States Power Company
NSPM 2019 SEC Form 10-K
Docket No. E002/GR-20-723Exhibit___(RLB-1), Schedule 10
Page 11 of 56

Table of Contents
12
Federal tax law may significantly impact our business.NSP-Minnesota collects through regulated rates estimated federal, state and local tax payments. Changes to federal tax law may benefit or adversely affect our earnings and customer costs. Tax depreciable lives and the value of various tax credits or the timeliness of their utilization may impact the economics or selection of resources. There could be timing delays before regulated rates provide for realization of tax changes in revenues. In addition, certain IRS tax policies such as tax normalization may impact our ability to economically deliver certain types of resources relative to market prices. Macroeconomic RisksEconomic conditions impact our business.Our operations are affected by local, national and worldwide economic conditions, which correlates to customers/sales growth (decline). Economic conditions may be impacted by insufficient financial sector liquidity leading to potential increased unemployment, which may impact customers’ ability to pay their bills which could lead to additional bad debt expense. Additionally, NSP-Minnesota faces competitive factors, which could have an adverse impact on our financial condition, results of operations and cash flows. Further, worldwide economic activity impacts the demand for basic commodities necessary for utility infrastructure, which may inhibit our ability to acquire sufficient supplies. We operate in a capital intensive industry and federal trade policy could significantly impact the cost of materials we use. There may be delays before these additional material costs can be recovered in rates. Operations could be impacted by war, terrorism or other events.Our generation plants, fuel storage facilities, transmission and distribution facilities and information and control systems may be targets of terrorist activities. Any disruption could impact operations or result in a decrease in revenues and additional costs to repair and insure our assets. These disruptions could have a material impact on our financial condition, results of operations or cash flows. The potential for terrorism has subjected our operations to increased risks and could have a material effect on our business. We have already incurred increased costs for security and capital expenditures in response to these risks. The insurance industry has also been affected by these events and the availability of insurance may decrease. In addition, insurance may have higher deductibles, higher premiums and more restrictive policy terms.A disruption of the regional electric transmission grid, interstate natural gas pipeline infrastructure or other fuel sources, could negatively impact our business, our brand and reputation. Because our facilities are part of an interconnected system, we face the risk of possible loss of business due to a disruption caused by the actions of a neighboring utility.We also face the risks of possible loss of business due to significant events such as severe storm, severe temperature extremes, wildfires, widespread pandemic, generator or transmission facility outage, pipeline rupture, railroad disruption, operator error, sudden and significant increase or decrease in wind generation or a disruption of work force within our operating systems (or on a neighboring system). The recent coronavirus outbreak in China is an example of how major catastrophic events throughout the world may disrupt our business. While we are a domestic company, the Company participates in a global supply chain, which includes materials and components that are sourced from China. A prolonged disruption could result in the delay of equipment and materials that may impact our ability to reliably serve our customers.
Disruption due to events such as those noted above could result in a significant decrease in revenues and significant additional costs to repair assets, which could have a material impact on our results of operations, financial condition or cash flows.NSP-Minnesota participates in biennial grid security and emergency response exercises (GridEx). These efforts, led by the NERC, test and further develop the coordination, threat sharing, and interaction between utilities and various government agencies relative to potential cyber and physical threats against the nation’s electric grid. A cyber incident or security breach could have a material effect on our business.We operate in an industry that requires the continued operation of sophisticated information technology, control systems and network infrastructure. In addition, we use our systems and infrastructure to create, collect, use, disclose, store, dispose of and otherwise process sensitive information, including company data, customer energy usage data, and personal information regarding customers, employees and their dependents, contractors and other individuals.Our generation, transmission, distribution and fuel storage facilities, information technology systems and other infrastructure or physical assets, as well as information processed in our systems (e.g., information regarding our customers, employees, operations, infrastructure and assets) could be affected by cyber security incidents, including those caused by human error. Our industry has been the target of several attacks on operational systems and has seen an increased volume and sophistication of cyber security incidents from international activist organizations, Nation States and individuals. Cyber security incidents could harm our businesses by limiting our generating, transmitting and distributing capabilities, delaying our development and construction of new facilities or capital improvement projects to existing facilities, disrupting our customer operations or causing the release of customer information, all of which would likely receive state and federal regulatory scrutiny and could expose us to liability. Our generation, transmission systems and natural gas pipelines are part of an interconnected system. Therefore, a disruption caused by the impact of a cyber security incident of the regional electric transmission grid, natural gas pipeline infrastructure or other fuel sources of our third-party service providers’ operations, could also negatively impact our business. Our supply chain for procurement of digital equipment may expose software or hardware to these risks and could result in a breach or significant costs of remediation. We are unable to quantify the potential impact of cyber security threats or subsequent related actions. Cyber security incidents and regulatory action could result in a material decrease in revenues and may causesignificant additional costs (e.g., penalties, third-party claims, repairs, insurance or compliance) and potentially disrupt our supply and markets for natural gas, oil and other fuels.We maintain security measures to protect our information technology and control systems, network infrastructure and other assets. However, these assets and the information they process may be vulnerable to cyber security incidents, including asset failure or unauthorized access to assets or information. A failure or breach of our technology systems or those of our third-party service providers could disrupt critical business functions and may negatively impact our business, our brand, and our reputation. The cyber security threat is dynamic and evolves continually, and our efforts to prioritize network protection may not be effective given the constant changes to threat vulnerability.
Northern States Power Company
NSPM 2019 SEC Form 10-K
Docket No. E002/GR-20-723Exhibit___(RLB-1), Schedule 10
Page 12 of 56

Table of Contents
13
Our operating results may fluctuate on a seasonal and quarterly basis and can be adversely affected by milder weather.Our electric and natural gas utility businesses are seasonal and weather patterns can have a material impact on our operating performance. Demand for electricity is often greater in the summer and winter months associated with cooling and heating. Because natural gas is heavily used for residential and commercial heating, the demand depends heavily upon weather patterns. A significant amount of natural gas revenues are recognized in the first and fourth quarters related to the heating season. Accordingly, our operations have historically generated less revenues and income when weather conditions are milder in the winter and cooler in the summer. Unusually mild winters and summers could have an adverse effect on our financial condition, results of operations or cash flows.Public Policy RisksWe may be subject to legislative and regulatory responses to climate change, with which compliance could be difficult and costly.Legislative and regulatory responses related to climate change and new interpretations of existing laws create financial risk as our facilities may be subject to additional regulation at either the state or federal level in the future. Such regulations could impose substantial costs on our system. We may be subject to climate change lawsuits. An adverse outcome could require substantial capital expenditures and possibly require payment of substantial penalties or damages. Defense costs associated with such litigation can also be significant and could affect results of operations, financial condition or cash flows if such costs are not recovered through regulated rates.Although the United States has not adopted any international or federal GHG emission reduction targets, many states and localities may continue to pursue climate policies in the absence of federal mandates. The steps that NSP-Minnesota has taken to date to reduce GHG emissions, including energy efficiency measures, adding renewable generation or retiring or converting coal plants to natural gas, occurred under state-endorsed resource plans, renewable energy standards and other state policies. While those actions likely would have put NSP-Minnesota in a good position to meet federal or international standards being discussed, the lack of federal action does not adversely impact these state-endorsed actions and plans. If our regulators do not allow us to recover all or a part of the cost of capital investment or the O&M costs incurred to comply with the mandates, it could have a material effect on our results of operations, financial condition or cash flows. Increased risks of regulatory penalties could negatively impact our business.The Energy Act increased civil penalty authority for violation of FERC statutes, rules and orders. The FERC can impose penalties of up to $1.3 million per violation per day, particularly as it relates to energy trading activities for both electricity and natural gas. In addition, NERC electric reliability standards and critical infrastructure protection requirements are mandatory and subject to potential financial penalties. Also, the PHMSA, Occupational Safety and Health Administration and other federal agencies have the authority to assess penalties. In the event of serious incidents, these agencies have become more active in pursuing penalties. Some states additionally have the authority to impose substantial penalties. If a serious reliability, cyber or safety incident did occur, it could have a material effect on our results of operations, financial condition or cash flows.
Environmental RisksWe are subject to environmental laws and regulations, with which compliance could be difficult and costly.We are subject to environmental laws and regulations that affect many aspects of our operations, including air emissions, water quality, wastewater discharges and the generation, transport and disposal of solid wastes and hazardous substances. Laws and regulations require us to obtain permits, licenses, and approvals and to comply with a variety of environmental requirements.Environmental laws and regulations can also require us to restrict or limit the output of facilities or the use of certain fuels, shift generation to lower-emitting facilities, install pollution control equipment, clean up spills and other contamination and correct environmental hazards. Environmental regulations may also lead to shutdown of existing facilities. Failure to meet requirements of environmental mandates may result in fines or penalties. We may be required to pay all or a portion of the cost to remediate (i.e., clean-up) sites where our past activities, or the activities of other parties, caused environmental contamination. We are subject to mandates to provide customers with clean energy, renewable energy and energy conservation offerings. It could have a material effect on our results of operations, financial condition or cash flows if our regulators do not allow us to recover the cost of capital investment or the O&M costs incurred to comply with the requirements.In addition, existing environmental laws or regulations may be revised, and new laws or regulations may be adopted. We may also incur additional unanticipated obligations or liabilities under existing environmental laws and regulations.We are subject to physical and financial risks associated with climate change and other weather, natural disaster and resource depletion impacts.Climate change can create physical and financial risk. Physical risks include changes in weather conditions and extreme weather events.Our customers’ energy needs vary with weather. To the extent weather conditions are affected by climate change, customers’ energy use could increase or decrease. Increased energy use due to weather changes may require us to invest in generating assets, transmission and infrastructure. Decreased energy use due to weather changes may result in decreased revenues. Climate change may impact a region’s economy, which could impact our sales and revenues. The price of energy has an impact on the economic health of our communities. The cost of additional regulatory requirements, such as regulation of GHG, could impact the availability of goods and prices charged by our suppliers which would normally be borne by consumers through higher prices for energy and purchased goods. To the extent financial markets view climate change and emissions of GHGs as a financial risk, this could negatively affect our ability to access capital markets or cause us to receive less than ideal terms and conditions.Severe weather impacts our service territories, primarily when thunderstorms, flooding, tornadoes, wildfires and snow or ice storms occur. Extreme weather conditions in general require system backup and can contribute to increased system stress, including service interruptions. Extreme weather conditions creating high energy demand may raise electricity prices, increasing the cost of energy we provide to our customers.
Northern States Power Company
NSPM 2019 SEC Form 10-K
Docket No. E002/GR-20-723 Exhibit___(RLB-1), Schedule 10
Page 13 of 56

Table of Contents
14
To the extent the frequency of extreme weather events increases, this could increase our cost of providing service. Periods of extreme temperatures could impact our ability to meet demand. Changes in precipitation resulting in droughts or water shortages could adversely affect our operations. Drought conditions also contribute to the increase in wildfire risk from our electric generation facilities. While we carry liability insurance, given an extreme event, if NSP-Minnesota was found to be liable for wildfire damages, amounts that potentially exceed our coverage could negatively impact our results of operations, financial condition or cash flows. Drought or water depletion could adversely impact our ability to provide electricity to customers, cause early retirement of units and increase the price paid for energy. We may not recover all costs related to mitigating these physical and financial risks.
ITEM 1B — UNRESOLVED STAFF COMMENTS
None.
ITEM 2 — PROPERTIES
Virtually all of the utility plant property of NSP-Minnesota is subject to the lien of its first mortgage bond indenture.
NSP-MinnesotaStation, Location and Unit Fuel Installed MW (a)
Steam:A.S. King-Bayport, MN, 1 Unit Coal 1968 511Sherco-Becker, MN
Unit 1 Coal 1976 680Unit 2 Coal 1977 682Unit 3 Coal 1987 517 (b)
Monticello MN, 1 Unit Nuclear 1971 617PI-Welch, MN
Unit 1 Nuclear 1973 521Unit 2 Nuclear 1974 519
Various locations, 4 Units Wood/Refuse Various 36 (c)
Combustion Turbine:Angus Anson-Sioux Falls, SD, 3 Units Natural Gas 1994 - 2005 327Black Dog-Burnsville, MN, 3 Units Natural Gas 1987 - 2018 494Blue Lake-Shakopee, MN, 6 Units Natural Gas 1974 - 2005 453High Bridge-St. Paul, MN, 3 Units Natural Gas 2008 530Inver Hills-Inver Grove Heights, MN, 6 Units Natural Gas 1972 282Riverside-Minneapolis, MN, 3 Units Natural Gas 2009 454Various locations, 7 Units Natural Gas Various 10Wind:Border-Rolette County, ND, 75 Units Wind 2015 148 (d)
Courtenay Wind-Stutsman County, ND, 100 Units Wind 2016 190 (d)
Foxtail-Dickey County, ND, 75 Units Wind 2019 150 (d)
Grand Meadow-Mower County, MN, 67 Units Wind 2008 99 (d)
Lake Benton-Pipestone County, MN, 44 Units Wind 2019 99 (d)
Nobles-Nobles County, MN, 134 Units Wind 2010 197 (d)
Pleasant Valley-Mower County, MN, 100 Units Wind 2015 196 (d)
Total 7,712(a) Summer 2019 net dependable capacity.(b) Based on NSP-Minnesota’s ownership of 59%.(c) Refuse-derived fuel is made from municipal solid waste.(d) Values disclosed are the maximum generation levels for these wind units. Capacity is
attainable only when wind conditions are sufficiently available (on-demand net dependable capacity is zero).
Electric utility overhead and underground transmission and distribution lines (measured in conductor miles) at Dec. 31, 2019:
Conductor Miles500 KV 2,917345 KV 13,133230 KV 2,203161 KV 673115 KV 8,045Less than 115 KV 86,743
NSP-Minnesota had 346 electric utility transmission and distribution substations at Dec. 31, 2019.Natural gas utility mains at Dec. 31, 2019:
MilesTransmission 86Distribution 10,518
ITEM 3 — LEGAL PROCEEDINGS
NSP-Minnesota is involved in various litigation matters in the ordinary course of business. The assessment of whether a loss is probable or is a reasonable possibility, and whether the loss or a range of loss is estimable, often involves a series of complex judgments about future events. Management maintains accruals for losses probable of being incurred and subject to reasonable estimation. Management is sometimes unable to estimate an amount or range of a reasonably possible loss in certain situations, including but not limited to when (1) the damages sought are indeterminate, (2) the proceedings are in the early stages, or (3) the matters involve novel or unsettled legal theories. In such cases, there is considerable uncertainty regarding the timing or ultimate resolution of such matters, including a possible eventual loss. For current proceedings not specifically reported herein, management does not anticipate that the ultimate liabilities, if any, would have a material effect on NSP-Minnesota’s financial statements. Unless otherwise required by GAAP, legal fees are expensed as incurred.See Note 10 to the consolidated financial statements, Item 1 and Item 7 for further information.
ITEM 4 — MINE SAFETY DISCLOSURES
None.
PART II
ITEM 5 — MARKET FOR REGISTRANT’S COMMON EQUITY, RELATED STOCKHOLDER MATTERS AND ISSUER PURCHASES OF EQUITY SECURITIES
NSP-Minnesota is a wholly owned subsidiary of Xcel Energy Inc. and there is no market for its common equity securities. The dividends declared during 2019 and 2018 were as follows:
(Millions of Dollars) 2019 2018First quarter $ 94.6 $ 84.6Second quarter 95.3 88.7Third quarter 94.0 184.2Fourth quarter 194.3 82.7
Northern States Power Company
NSPM 2019 SEC Form 10-K
Docket No. E002/GR-20-723Exhibit___(RLB-1), Schedule 10
Page 14 of 56

Table of Contents
15
ITEM 6 — SELECTED FINANCIAL DATA
This is omitted per conditions set forth in general instructions I(1)(a) and (b) of Form 10-K for wholly owned subsidiaries (reduced disclosure format).
ITEM 7 — MANAGEMENT’S DISCUSSION AND ANALYSIS OFFINANCIAL CONDITION AND RESULTS OF OPERATIONS
Discussion of financial condition and liquidity for NSP-Minnesota is omitted per conditions set forth in general instructions I(1)(a) and (b) of Form 10-K for wholly owned subsidiaries. It is replaced with management’s narrative analysis and the results of operations for the current year as set forth in general instructions I(2)(a) of Form 10-K for wholly owned subsidiaries (reduced disclosure format).Non-GAAP Financial MeasuresThe following discussion includes financial information prepared in accordance with GAAP, as well as certain non-GAAP financial measures such as, electric margin, natural gas margin, and ongoing earnings. Generally, a non-GAAP financial measure is a measure of a company’s financial performance, financial position or cash flows that excludes (or includes) amounts that are adjusted from measures calculated and presented in accordance with GAAP. NSP-Minnesota’s management uses non-GAAP measures for financial planning and analysis, for reporting of results to the Board of Directors, in determining performance-based compensation and communicating its earnings outlook to analysts and investors. Non-GAAP financial measures are intended to supplement investors’ understanding of our performance and should not be considered alternatives for financial measures presented in accordance with GAAP. These measures are discussed in more detail below and may not be comparable to other companies’ similarly titled non-GAAP financial measures.Electric and Natural Gas MarginsElectric margin is presented as electric revenues less electric fuel and purchased power expenses. Natural gas margin is presented as natural gas revenues less the cost of natural gas sold and transported. Expenses incurred for electric fuel and purchased power and the cost of natural gas are generally recovered through various regulatory recovery mechanisms. As a result, changes in these expenses are generally offset in operating revenues.Management believes electric and natural gas margins provide the most meaningful basis for evaluating our operations because they exclude the revenue impact of fluctuations in these expenses. These margins can be reconciled to operating income, a GAAP measure, by including other operating revenues, cost of sales-other, O&M expenses, conservation and DSM expenses, depreciation and amortization and taxes (other than income taxes).Earnings Adjusted for Certain Items (Ongoing Earnings)Ongoing earnings reflect adjustments to GAAP earnings (net income) for certain items.We use these non-GAAP financial measures to evaluate and provide details of NSP-Minnesota’s core earnings and underlying performance. We believe these measurements are useful to investors to evaluate the actual and projected financial performance and contribution of NSP-Minnesota. For the years ended Dec. 31, 2019 and Dec. 31, 2018, there were no adjustments to GAAP earnings and therefore GAAP earnings equal ongoing earnings.
Results of Operations
2019 Comparison with 2018NSP-Minnesota’s net income was approximately $542.6 million for 2019, compared with approximately $492.3 million for 2018. The increase in earnings was driven by a higher electric margin resulting from regulatory rate outcomes and capital riders and lower O&M, partially offset by increased depreciation. Electric MarginElectric revenues and fuel and purchased power expenses are impacted by fluctuation in the price of natural gas, coal and uranium used in the generation of electricity. However, these price fluctuations have minimal impact on electric margin due to fuel recovery mechanisms that recover fuel expenses. In addition, electric customers receive a credit for PTCs that are generated in a particular period. Electric Revenues and Margin:
(Millions of Dollars) 2019 2018Electric revenues $ 4,506.6 $ 4,508.0Electric fuel and purchased power (1,600.3) (1,701.1)
Electric margin $ 2,906.3 $ 2,806.9
Changes in Electric Margin:
(Millions of Dollars) 2019 vs. 2018Regulatory rate outcomes (Minnesota, North and South Dakota) $ 70.7Non-fuel riders 37.2Interchange agreement billings with NSP-Wisconsin 7.1Conservation program revenue (offset by expenses) 7.0Retail sales decline, net of MN decoupling and sales true-up(excluding weather impact) (21.1)Purchased capacity costs (12.3)Estimated impact of weather, net of Minnesota decoupling (10.8)Other (net) 21.6
Total increase in electric margin $ 99.4
Natural Gas MarginTotal natural gas expense varies with changing sales and the cost of natural gas. However, fluctuations in the cost of natural gas have minimal impact on natural gas margin due to natural gas cost recovery mechanisms.Natural Gas Revenues and Margin:
(Millions of Dollars) 2019 2018Natural gas revenues $ 571.3 $ 583.1Cost of natural gas sold and transported (327.2) (345.1)
Natural gas margin $ 244.1 $ 238.0
Changes in Natural Gas Margin:
(Millions of Dollars) 2019 vs. 2018Infrastructure rider $ 2.9Estimated impact of weather 2.7Sales growth (excluding weather impact) 1.3Conservation program revenue (offset by expenses) (2.2)Other (net) 1.4
Total increase in natural gas margin $ 6.1
Northern States Power Company
NSPM 2019 SEC Form 10-K
Docket No. E002/GR-20-723 Exhibit___(RLB-1), Schedule 10
Page 15 of 56

Table of Contents
16
Non-Fuel Operating Expenses and Other ItemsO&M Expenses — O&M expenses decreased $20.2 million, or 1.7%, for 2019. Decrease was driven by lower plant generation expense, primarily due to timing of planned maintenance and overhauls and reduced nuclear plant operation expenses. The decrease was partially offset by higher distribution storm expenses. Depreciation and Amortization — Depreciation and amortization expense increased $49.7 million, or 6.7%, for 2019. Increase was primarily due to higher non-fuel rider amortization, increased capital investments including Monticello's dry fuel storage, Prairie Island and Sherco generator replacements and various software solutions. Additionally, Foxtail and Lake Benton wind farms were placed into service. The increase was partially offset by decreased depreciation due to the impact of life extensions approved by the MPUC at various electric plants.Income Taxes — Income tax expense increased $20.2 million for 2019 compared with the same period in 2018. The ETR was 8.0% for 2019 compared with 5.2% for 2018. These increases were primarily due to 2019 higher pretax income.2018 Comparison with 2017 A discussion of changes in NSP-Minnesota’s results of operations and liquidity and capital resources from the year ended Dec. 31, 2017 to Dec. 31, 2018 can be found in Part II, “Item 7, Management’s Discussion and Analysis of Financial Condition and Results of Operations” of our Annual Report on Form 10-K for the fiscal year 2018, which was filed with the SEC on Feb. 22, 2019. However, such discussion is not incorporated by reference into, and does not constitute a part of, this Annual Report on Form 10-K.
Public Utility Regulation
The FERC has jurisdiction over rates for electric transmission service in interstate commerce and electricity sold at wholesale, hydro facility licensing, natural gas transportation, asset transactions and mergers, accounting practices and certain other activities of NSP-Minnesota, including enforcement of North American Electric Reliability Corporation mandatory electric reliability standards. State and local agencies have jurisdiction over many of NSP-Minnesota’s activities, including regulation of retail rates and environmental matters.Xcel Energy, which includes NSP-Minnesota, attempts to mitigate the risk of regulatory penalties through formal training on prohibited practices and a compliance function that reviews interaction with the markets under FERC and Commodity Futures Trading Commission jurisdictions. Public campaigns are conducted to raise awareness of public safety issues of interacting with our electric systems. While programs to comply with regulatory requirements are in place, there is no guarantee compliance programs or other measures will be sufficient to ensure against violations. Decisions by these regulators can significantly impact NSP-Minnesota’s results of operations.
See Rate Matters within Note 10 to the consolidated financial statements for further information.Summary of Regulatory Agencies and Areas of Jurisdiction
Regulatory Body Additional Information on Regulatory Authority
MPUC (a)
Retail rates, services, security issuances, property transfers, mergers, disposition of assets, affiliate transactions, and other aspects of electric and natural gas operations.Reviews and approves IRPs for meeting future energy needs.Certifies the need and siting for generating plants greater than 50 MW and transmission lines greater than 100 KV in Minnesota.Reviews and approves natural gas supply plans.Pipeline safety compliance.
NDPSC (a)
Retail rates, services and other aspects of electric and natural gas operations.Regulatory authority over generation and transmission facilities, along with the siting and routing of new generation and transmission facilities in North Dakota.Pipeline safety compliance.
SDPUC
Retail rates, services and other aspects of electric operations.Regulatory authority over generation and transmission facilities, along with the siting and routing of new generation and transmission facilities in South Dakota.Pipeline safety compliance.
FERC
Wholesale electric operations, hydroelectric licensing, accounting practices, wholesale sales for resale, transmission of electricity in interstate commerce, compliance with NERC electric reliability standards, asset transfers and mergers, and natural gas transactions in interstate commerce.
MISO
NSP-Minnesota is a transmission owning member of the MISO RTO and operates within the MISO RTO and wholesale markets. NSP-Minnesota makes wholesale sales in other RTO markets at market-based rates. NSP-Minnesota and NSP-Wisconsin also make wholesale electric sales at market-based prices to customers outside of their balancing authority as jointly authorized by the FERC.
DOT Pipeline safety compliance.Minnesota Officeof Pipeline Safety Pipeline safety compliance.
(a) Jurisdictional Cost Recovery Allocation — In December 2016, NSP-Minnesota filed a resource treatment framework with the NDPSC and MPUC to allow NSP-Minnesota’s operations in North Dakota and Minnesota to gradually become more independent of one another. The filing identified two options: a legal separation, creating a separate North Dakota operating company; or a pseudo-separation, which maintains the current corporate structure but directly assigns costs and benefits of each resource to the jurisdiction that supports it. Docket remains under consideration by the NDPSC.
Northern States Power Company
NSPM 2019 SEC Form 10-K
Docket No. E002/GR-20-723 Exhibit___(RLB-1), Schedule 10
Page 16 of 56

Table of Contents
17
Recovery Mechanisms
Mechanism Additional InformationCIP Rider (a) Recovers costs of conservation and demand-side management programs.
EIR Recovers costs of environmental improvement projects.RDF Allocates money collected from customers to support research and development of emerging renewable energy projects and technologies.RES Recovers cost of renewable generation in Minnesota.RER Recovers the cost of renewable generation in North Dakota.SEP Recovers costs related to various energy policies approved by the Minnesota legislature.TCR Recovers costs for investments in electric transmission and distribution grid modernization.
Infrastructure Rider Recovers costs for investments in generation and incremental property taxes in South Dakota.
FCA (b)Minnesota, North Dakota and South Dakota include a FCA for monthly billing adjustments to recover changes in prudently incurred costs of fuel related items and purchased energy. Capacity costs are recovered through base rates and are not recovered through the FCA. MISO costs are generally recovered through either the FCA or base rates.
PGA Provides for prospective monthly rate adjustments for costs of purchased natural gas, transportation and storage service. Includes a true-up process for difference between projected and actual costs.
GUIC Rider Recovers costs for transmission and distribution pipeline integrity management programs, including: funding for pipeline assessments, deferred costs for sewer separation and pipeline integrity management programs.
(a) Minnesota state law requires NSP-Minnesota to invest 2% of its state electric revenues and 0.5% of its state gas revenues in CIP. These costs are recovered through an annual cost-recovery mechanism.
(b) In 2017, the MPUC changed the FCA process in Minnesota, which will implemented in 2020. Under the new process, each month utilities would collect amounts equal to the baseline cost of energy set at the start of the plan year (base would be reset annually). Monthly variations to the baseline costs would be tracked and netted over a 12-month period. Utilities would issue refunds above the baseline costs and could seek recovery of any overage.
Pending and Recently Concluded Regulatory Proceedings
MechanismUtility
Service
AmountRequested (in
millions)Filing Date Approval Additional Information
2018 TCR Electric $98 November 2017 Received In November 2019, the MPUC issued an order setting an ROE of 9.06% and recovery of 2017-2018 expenses related to advanced grid investments.
2020 TCR Electric $82 November 2019 Pending In November 2019, NSP-Minnesota filed the 2020 TCR Rider. The filing included an ROE of 9.06%. Timing of an MPUC ruling is uncertain.
2019 GUIC NaturalGas $29 November 2018 Pending In November 2018, NSP-Minnesota filed the 2019 GUIC Rider with the MPUC. The filing included an ROE
of 10.25%. Timing of an MPUC ruling is uncertain.
2020 GUIC NaturalGas $21 November 2019 Pending In November 2019, NSP-Minnesota filed the 2020 GUIC Rider with the MPUC. The filing included an ROE
of 9.04%. Timing of an MPUC ruling is uncertain.
2018 RES Electric $23 November 2017 Received In November 2019, the MPUC approved an order setting an ROE of 9.06%.
2020 RES Electric $102 November 2019 PendingIn November 2019, NSP-Minnesota filed the 2020 RES Rider with the MPUC. The requested amount includes a true-up for the 2019 rider of $38 million and the 2020 requested amount of $64 million. The filing included an ROE of 9.06%. Timing of an MPUC ruling is uncertain.
Minnesota Electric Rate Case and Alternative Petition — In November 2019, NSP-Minnesota filed a three-year electric rate case with the MPUC. The proposed electric rates reflect a three-year increase in revenues of approximately $201.4 million (6.5%) in 2020, with subsequent incremental increases of $146.4 million (4.8%) in 2021 and $118.3 million (3.9%) in 2022. The rate case is based on a requested ROE of 10.2%, a 52.5% equity ratio, an average electric rate base of $9.0 billion for 2020, $9.3 billion for 2021 and $9.8 billion for 2022. In addition, NSP-Minnesota requested interim rates, subject to refund, of $122.0 million to be implemented in January 2020 and an incremental $144.0 million to be implemented in January 2021. NSP-Minnesota also filed a stay-out petition, in which NSP-Minnesota would withdraw its electric rate case and refrain from filing another rate case for one year if the MPUC were to approve an extension of true-up mechanisms for sales, capital and property taxes. NSP-Minnesota also requested that the MPUC delay any increase to the Nuclear Decommissioning Trust annual accrual until 2021.
In December 2019, the MPUC verbally approved the stay-out petition including extension of the sales, capital and property tax true-up mechanisms and the delay of any increase to the Nuclear Decommissioning Trust annual accrual until Jan. 1, 2021.MEC Acquisition — In November 2018, NSP-Minnesota reached an agreement with Southern Power Company (a subsidiary of Southern Company) to purchase MEC, a 760 MW natural gas combined cycle facility, for approximately $650 million. In September 2019, the MPUC denied NSP-Minnesota's request to purchase MEC as a rate base asset. In January 2020, the MPUC approved Xcel Energy’s plan to acquire MEC as a non-regulated investment and step into the terms of the existing PPAs with NSP-Minnesota. A newly formed non-regulated subsidiary of Xcel Energy completed the transaction to purchase MEC on Jan. 17, 2020.
Northern States Power Company
NSPM 2019 SEC Form 10-K
Docket No. E002/GR-20-723 Exhibit___(RLB-1), Schedule 10
Page 17 of 56

Table of Contents
18
Minnesota Resource Plan — In July 2019, NSP-Minnesota filed its Minnesota resource plan, which runs through 2034. The plan would result in an 80% carbon reduction by 2030 (from 2005) and puts NSP-Minnesota on a path to achieving its vision of being 100% carbon-free by 2050. The preferred plan includes the following: • Extends the life of the Monticello nuclear plant from 2030 to 2040; • Continues to run the Prairie Island nuclear plant through current end of
life (2033 and 2034);• Includes the MEC acquisition and construction of the Sherco CC
natural gas plant;• Includes the early retirement of the King coal plant (511 MW) in 2028
and the Sherco 3 coal plant (517 MW) in 2030; • Adds approximately 1,700 MW of firm peaking (CT, pumped hydro,
battery storage, DR, etc.);• Adds approximately 1,200 MW of wind replacement; and• Adds approximately 4,000 MW of solar. Intervening parties will provide recommendations and comments on the resource plan. Following the MPUC’s denial of its request to purchase MEC, NSP-Minnesota will provide updates to remove its ownership of MEC from the preferred plan. The MPUC required NSP-Minnesota to update its filing to address issues related to its decision on MEC, including certain new modeling scenarios. An updated filing is required by April 1, 2020. The MPUC is anticipated to make a final decision on the resource plan in the first half of 2021. Jeffers Wind and Community Wind North Repowering Acquisition — In October 2019, the MPUC approved NSP-Minnesota’s request to acquire the Jeffers and Community Wind North wind facilities in western Minnesota from Longroad Energy. The wind farms will have approximately 70 MW of capacity after being repowered. The repowering is expected to be completed by December 2020 and qualify for the full PTC. The $135 million asset acquisition is projected to provide customer savings of approximately $7 million over the life of the facilities.NSP-Minnesota — Mower Wind Facility — In August 2019, NSP-Minnesota filed a petition with the MPUC to acquire the Mower wind facility from affiliates of NextEra Energy, Inc. for an undisclosed amount. The Mower facility is located in southeastern Minnesota and is currently contracted under a PPA with NSP-Minnesota through 2026. Mower is expected to continue to have approximately 99 MW of capacity following a planned repowering. The acquisition would occur after repowering, which is expected to be complete in 2020 and qualify for the full PTC. NSP-Minnesota will need approval from both the MPUC and FERC to complete the transaction. NSP-Minnesota filed reply comments addressing the DOC’s concerns with the transaction in February 2020.Timing of MPUC and FERC decisions are uncertain. Purchased Power Arrangements and Transmission Service ProviderNSP-Minnesota expects to use power plants, power purchases, CIP/DSM options, new generation facilities and expansion of power plants to meet its system capacity requirements.Purchased Power — NSP-Minnesota has contracts to purchase power from other utilities and IPPs. Long-term purchased power contracts for dispatchable resources typically require a capacity and an energy charge. NSP-Minnesota makes short-term purchases to meet system requirements, replace company owned generation, meet operating reserve obligations or obtain energy at a lower cost.
PPA Terminations and Amendments — In June 2018, NSP-Minnesota terminated the Benson and Laurentian PPAs, and purchased the Benson biomass facility. As a result, a $103 million regulatory asset was recognized for the costs of the Benson transaction. For Laurentian, a regulatory asset of $109 million was recognized for annual termination payments/obligations. Regulatory approvals provide for recovery of the Benson regulatory asset over 10 years and Laurentian termination payments as they occur (over six years). Termination of the PPAs is expected to save customers over $600 million throughout the next 10 years.Purchased Transmission Services — NSP-Minnesota and NSP-Wisconsin have contracts with MISO and other regional transmission service providers to deliver power and energy to their customers.Minnesota State ROFR Statute Complaint — In September 2017, LSP Transmission filed a complaint in the Minnesota District Court against the Minnesota Attorney General, MPUC and DOC. The complaint was in response to MISO assigning NSP-Minnesota and ITC Midwest, LLC to jointly own a new 345 KV transmission line from Mankato to Winnebago, Minnesota. The project was estimated to cost $108 million and projected to be in-service by the end of 2021. It was assigned to NSP-Minnesota and ITC Midwest as the incumbent utilities, consistent with a Minnesota state ROFR statute. The complaint challenged the constitutionality of the statute and is seeking declaratory judgment that the statute violates the Commerce Clause of the U.S. Constitution and should not be enforced. The Minnesota state agencies and NSP-Minnesota filed motions to dismiss. In June 2018, the Minnesota District Court granted the defendants’ motions to dismiss with prejudice. LSP Transmission filed an appeal in July 2018. In September 2019, the estimate was updated to approximately $140 million, due to various changes in build plans. In October 2019, oral arguments were held with the Eighth Circuit Court of Appeals. A decision is expected in the first or second quarter of 2020. Nuclear Power Operations and Waste DisposalNuclear power plant operations produce gaseous, liquid and solid radioactive wastes, which are covered by federal regulation. High-level radioactive wastes primarily include used nuclear fuel. Low-level waste consists primarily of demineralizer resins, paper, protective clothing, rags, tools and equipment contaminated through use.NRC Regulation — The NRC regulates nuclear operations. Costs of complying with NRC requirements can affect both operating expenses and capital investments of the plants. NSP-Minnesota has obtained recovery of these compliance costs and expects to recover future compliance costs.Low-Level Waste Disposal — Low level waste disposal from Monticello and PI is disposed at the Clive facility located in Utah and the Waste Control Specialists facility in Texas. NSP-Minnesota has storage capacity available on-site at PI and Monticello which would allow both plants to continue to operate until the end of their current licensed lives if of-site low-level waste disposal facilities become unavailable.High-Level Radioactive Waste Disposal — The federal government has responsibility to permanently dispose domestic spent nuclear fuel and other high-level radioactive wastes. The Nuclear Waste Policy Act requires the DOE to implement a program for nuclear high-level waste management. This includes the siting, licensing, construction and operation of a repository for spent nuclear fuel from civilian nuclear power reactors and other high-level radioactive wastes at a permanent federal storage or disposal facility. The federal government has been evaluating a nuclear geologic repository at Yucca Mountain, Nevada for many years. Currently, there are no definitive plans for a permanent federal storage facility at Yucca Mountain or any other site.
Northern States Power Company
NSPM 2019 SEC Form 10-K
Docket No. E002/GR-20-723Exhibit___(RLB-1), Schedule 10
Page 18 of 56

Table of Contents
19
Nuclear Spent Fuel Storage — NSP-Minnesota has interim on-site storage for spent nuclear fuel at its Monticello and PI nuclear generating plants. Authorized storage capacity is sufficient to allow NSP-Minnesota to operate until the end of the operating licenses in 2030 for Monticello, 2033 for PI Unit 1, and 2034 for PI Unit 2. Authorizations for additional spent fuel storage capacity may be required at each site to support either continued operation or decommissioning if the federal government does not commence storage operations.See Note 12 to the consolidated financial statements for further information.Wholesale and Commodity Marketing OperationsNSP-Minnesota conducts various wholesale marketing operations, including the purchase and sale of electric capacity, energy, ancillary services and energy-related products. NSP-Minnesota uses physical and financial instruments to minimize commodity price and credit risk and hedge sales and purchases. NSP-Minnesota also engages in trading activity unrelated to hedging. Sharing of any margins is determined through state regulatory proceedings as well as the operation of the FERC approved JOA. NSP-Minnesota does not serve any wholesale requirements customers at cost-based regulated rates.
ITEM 7A — QUANTITATIVE AND QUALITATIVE DISCLOSURES ABOUT MARKET RISK
Derivatives, Risk Management and Market RiskNSP-Minnesota is exposed to a variety of market risks in the normal course of business. Market risk is the potential loss that may occur as a result of adverse changes in the market or fair value of a particular instrument or commodity. All financial and commodity-related instruments, including derivatives, are subject to market risk. See Note 8 to the consolidated financial statements for further information.NSP-Minnesota is exposed to the impact of adverse changes in price for energy and energy related products, which is partially mitigated by the use of commodity derivatives. In addition to ongoing monitoring and maintaining credit policies intended to minimize overall credit risk, management takes steps to mitigate changes in credit and concentration risks associated with its derivatives and other contracts, including parental guarantees and requests of collateral. While NSP-Minnesota expects that the counterparties will perform under the contracts underlying its derivatives, the contracts expose NSP-Minnesota to some credit and non-performance risk. Distress in the financial markets may impact counterparty risk, the fair value of the securities in the nuclear decommissioning fund and pension fund and NSP-Minnesota’s ability to earn a return on short-term investments.Commodity Price Risk — NSP-Minnesota is exposed to commodity price risk in its electric and natural gas operations. Commodity price risk is managed by entering into long- and short-term physical purchase and sales contracts for electric capacity, energy and energy-related products and fuels used in generation and distribution activities. Commodity price risk is also managed through the use of financial derivative instruments. NSP-Minnesota’s risk management policy allows it to manage commodity price risk within each rate-regulated operation per commission approved hedge plans.
Wholesale and Commodity Trading Risk — NSP-Minnesota conducts various wholesale and commodity trading activities, including the purchase and sale of electric capacity, energy, energy-related instruments and natural gas-related instruments, including derivatives. NSP-Minnesota’s risk management policy allows management to conduct these activities within guidelines and limitations as approved by its risk management committee.At Dec. 31, 2019, fair values by source for net commodity trading contract assets were as follows:
Futures/ Forwards Maturity
(Millions of Dollars)
MaturityLess
Than 1Year
Maturity 1 to 3 Years
Maturity 4 to 5 Years
MaturityGreaterThan 5Years
Total Futures/Forwards Fair Value
NSP-Minnesota (a) $ (0.5) $ 1.9 $ 1.5 $ 3.1 $ 6.0NSP-Minnesota (b) 2.2 (2.3) (2.1) (10.3) (12.5)
$ 1.7 $ (0.4) $ (0.6) $ (7.2) $ (6.5)
(a) Prices actively quoted or based on actively quoted prices.(b) Prices based on models and other valuation methods.
Options Maturity
(Millions of Dollars)
MaturityLess
Than 1Year
Maturity 1 to 3 Years
Maturity 4 to 5 Years
MaturityGreaterThan 5Years
Total Futures/Forwards Fair Value
NSP-Minnesota (a) $ 3.6 $ 0.9 $ — $ — $ 4.5
(a) Prices based on models and other valuation methods.
Changes in the fair value of commodity trading contracts before the impacts of margin-sharing for the years ended Dec. 31, were as follows:
(Millions of Dollars) 2019 2018Fair value of commodity trading net contract assets outstanding atJan. 1 $ 16.0 $ 15.7Contracts realized or settled during the period (10.8) (2.0)Commodity trading contract additions and changes during the period (7.2) 2.3Fair value of commodity trading net contract assets outstanding at Dec.31 $ (2.0) $ 16.0
At Dec. 31, 2019, a 10% increase in market prices for commodity trading contracts would increase pretax income by approximately $6.4 million, whereas a 10% decrease would decrease pretax income by approximately $6.3 million. At Dec. 31, 2018, a 10% increase in market prices for commodity trading contracts would increase pretax income by approximately $16.6 million, whereas a 10% decrease would decrease pretax income by approximately $16.5 million.NSP-Minnesota’s wholesale and commodity trading operations measure the outstanding risk exposure to price changes on transactions, contracts and obligations using VaR. VaR expresses the potential change in fair value on the outstanding transactions, contracts and obligations over a particular period of time under normal market conditions.
Northern States Power Company
NSPM 2019 SEC Form 10-K
Docket No. E002/GR-20-723 Exhibit___(RLB-1), Schedule 10
Page 19 of 56

Table of Contents
20
VaRs for the NSP-Minnesota and PSCo commodity trading operations, calculated on a consolidated basis using a Monte Carlo simulation with a 95% confidence level and a one-day holding period:
(Millions ofDollars)
Year EndedDec. 31 VaR Limit Average High Low
2019 $ 0.4 $ 3.0 $ 0.6 $ 0.8 $ 0.32018 4.8 6.0 0.6 5.6 0.1
In November 2018, management temporarily increased the VaR limit to accommodate a 10-year transaction. NSP-Minnesota has been systematically hedging the transaction and the consolidated VaR returned below $3 million in January 2019.Nuclear Fuel Supply — NSP-Minnesota has received all enriched nuclear material for 2019 and has contracted for approximately 51% of its 2020 enriched nuclear material requirements from sources that could be impacted by sanctions against entities doing business with Iran. Those sanctions may impact the supply of enriched nuclear material supplied from Russia. Long-term, through 2030, NSP-Minnesota is scheduled to take delivery of approximately 29% of its average enriched nuclear material requirements from these sources. Alternate potential sources provide the flexibility to manage NSP-Minnesota’s nuclear fuel supply. NSP-Minnesota periodically assesses if further actions are required to assure a secure supply of enriched nuclear material.Interest Rate Risk — NSP-Minnesota is subject to interest rate risk. NSP-Minnesota’s risk management policy allows interest rate risk to be managed through the use of fixed rate debt, floating rate debt and interest rate derivatives such as swaps, caps, collars and put or call options.A 100-basis-point change in the benchmark rate on NSP-Minnesota’s variable rate debt would impact annual pretax interest expense by approximately $0.3 million in 2019 and $1.5 million in 2018.NSP-Minnesota maintains a nuclear decommissioning fund, as required by the NRC. The nuclear decommissioning fund is subject to interest rate risk and equity price risk. The fund is invested in a diversified portfolio of cash equivalents, debt securities, equity securities and other investments. These investments may be used only for the purpose of decommissioning NSP-Minnesota’s nuclear generating plants. Realized and unrealized gains on the decommissioning fund investments are deferred as an offset of NSP-Minnesota’s regulatory asset for nuclear decommissioning costs. Fluctuations in equity prices or interest rates affecting the nuclear decommissioning fund do not have a direct impact on earnings due to the application of regulatory accounting. See Note 8 to the consolidated financial statements for further information.Credit Risk — NSP-Minnesota is also exposed to credit risk. Credit risk relates to the risk of loss resulting from counterparties’ nonperformance on their contractual obligations. NSP-Minnesota maintains credit policies intended to minimize overall credit risk and actively monitor these policies to reflect changes and scope of operations.At Dec. 31, 2019, a 10% increase in commodity prices would have resulted in an increase in credit exposure of $20.6 million, while a decrease in prices of 10% would have resulted in an increase in credit exposure of $8.1 million. At Dec. 31, 2018, a 10% increase in commodity prices would have resulted in an increase in credit exposure of $1.4 million, while a decrease in prices of 10% would have resulted in an increase in credit exposure of $12.5 million.
NSP-Minnesota conducts credit reviews for all counterparties. NSP-Minnesota employs credit risk controls, such as letters of credit, parental guarantees, master netting agreements and termination provisions. Credit exposure is monitored and, when necessary, the activity with a specific counterparty is limited until credit enhancement is provided. Distress in the financial markets could increase NSP-Minnesota’s credit risk.Fair Value MeasurementsNSP-Minnesota uses derivative contracts such as futures, forwards, interest rate swaps, options and FTRs to manage commodity price and interest rate risk. Derivative contracts, with the exception of those designated as normal purchase-normal sale contracts, are reported at fair value. NSP-Minnesota’s investments held in the nuclear decommissioning fund, rabbi trusts, pension and other postretirement funds are also subject to fair value accounting.See Notes 8 and 9 to the consolidated financial statements for further information.Commodity Derivatives — NSP-Minnesota continuously monitors the creditworthiness of the counterparties to its commodity derivative contracts and assesses each counterparty’s ability to perform on the transactions. Given the typically short duration of these contracts, the impact of discounting commodity derivative assets for counterparty credit risk was not material to the fair value of commodity derivative assets at Dec. 31, 2019. Adjustments to fair value for credit risk of commodity trading instruments are recorded in electric revenues. Credit risk adjustments for other commodity derivative instruments are recorded as other comprehensive income or deferred as regulatory assets and liabilities. Classification as a regulatory asset or liability is based on commission approved regulatory recovery mechanisms. The impact of discounting commodity derivative liabilities for credit risk was immaterial at Dec. 31, 2019.
ITEM 8 — FINANCIAL STATEMENTS AND SUPPLEMENTARY DATA
See Item 15-1 for an index of financial statements included herein.See Note 14 to the consolidated financial statements for further information.
Northern States Power Company
NSPM 2019 SEC Form 10-K
Docket No. E002/GR-20-723 Exhibit___(RLB-1), Schedule 10
Page 20 of 56

Table of Contents
21
Management Report on Internal Control Over Financial ReportingThe management of NSP-Minnesota is responsible for establishing and maintaining adequate internal control over financial reporting. NSP-Minnesota’s internal control system was designed to provide reasonable assurance to Xcel Energy Inc.’s and NSP-Minnesota’s management and board of directors regarding the preparation and fair presentation of published financial statements.All internal control systems, no matter how well designed, have inherent limitations. Therefore, even those systems determined to be effective can provide only reasonable assurance with respect to financial statement preparation and presentation.NSP-Minnesota management assessed the effectiveness of NSP-Minnesota’s internal control over financial reporting as of Dec. 31, 2019. In making this assessment, it used the criteria set forth by the Committee of Sponsoring Organizations of the Treadway Commission (COSO) in Internal Control — Integrated Framework (2013). Based on our assessment, we believe that, as of Dec. 31, 2019, NSP-Minnesota’s internal control over financial reporting is effective at the reasonable assurance level based on those criteria.
/s/ BEN FOWKE /s/ ROBERT C. FRENZELBen Fowke Robert C. FrenzelChairman, Chief Executive Officer and Director Executive Vice President, Chief Financial Officer and DirectorFeb. 21, 2020 Feb. 21, 2020
Northern States Power Company
NSPM 2019 SEC Form 10-K
Docket No. E002/GR-20-723 Exhibit___(RLB-1), Schedule 10
Page 21 of 56
Table of Contents
22
REPORT OF INDEPENDENT REGISTERED PUBLIC ACCOUNTING FIRM
To the stockholder and Board of Directors of Northern States Power Company, a Minnesota corporation
Opinion on the Financial Statements
We have audited the accompanying consolidated balance sheets of Northern States Power Company, a Minnesota corporation and subsidiaries (the "Company") as of December 31, 2019 and 2018, the related consolidated statements of income, comprehensive income, cash flows and common stockholder’s equity, for each of the three years in the period ended December 31, 2019, and the related notes and the schedule listed in the Index at Item 15 (collectively referred to as the "financial statements"). In our opinion, the financial statements present fairly, in all material respects, the financial position of the Company as of December 31, 2019 and 2018, and the results of its operations and its cash flows for each of the three years in the period ended December 31, 2019, in conformity with accounting principles generally accepted in the United States of America.
Basis for Opinion
These financial statements are the responsibility of the Company's management. Our responsibility is to express an opinion on the Company's financial statements based on our audits. We are a public accounting firm registered with the Public Company Accounting Oversight Board (United States) (PCAOB) and are required to be independent with respect to the Company in accordance with the U.S. federal securities laws and the applicable rules and regulations of the Securities and Exchange Commission and the PCAOB.
We conducted our audits in accordance with the standards of the PCAOB. Those standards require that we plan and perform the audit to obtain reasonable assurance about whether the financial statements are free of material misstatement, whether due to error or fraud. The Company is not required to have, nor were we engaged to perform, an audit of its internal control over financial reporting. As part of our audits, we are required to obtain an understanding of internal control over financial reporting but not for the purpose of expressing an opinion on the effectiveness of the Company’s internal control over financial reporting. Accordingly, we express no such opinion.
Our audits included performing procedures to assess the risks of material misstatement of the financial statements, whether due to error or fraud, and performing procedures that respond to those risks. Such procedures included examining, on a test basis, evidence regarding the amounts and disclosures in the financial statements. Our audits also included evaluating the accounting principles used and significant estimates made by management, as well as evaluating the overall presentation of the financial statements. We believe that our audits provide a reasonable basis for our opinion.
/s/ DELOITTE & TOUCHE LLPMinneapolis, MinnesotaFebruary 21, 2020
We have served as the Company’s auditor since 2002.
Northern States Power Company
NSPM 2019 SEC Form 10-K
Docket No. E002/GR-20-723 Exhibit___(RLB-1), Schedule 10
Page 22 of 56

Table of Contents
23
NSP-MINNESOTA AND SUBSIDIARIESCONSOLIDATED STATEMENTS OF INCOME
(amounts in millions)
Year Ended Dec. 312019 2018 2017
Operating revenuesElectric, non-affiliates $ 4,049.2 $ 4,034.3 $ 4,051.5Electric, affiliates 457.4 473.7 490.2Natural gas 571.3 583.1 531.9Other 33.9 30.8 28.4
Total operating revenues 5,111.8 5,121.9 5,102.0
Operating expensesElectric fuel and purchased power 1,600.3 1,701.1 1,626.9Cost of natural gas sold and transported 327.2 345.1 301.8Cost of sales — other 23.2 19.7 18.1Operating and maintenance expenses 1,203.1 1,223.3 1,198.3Conservation program expenses 119.7 118.0 120.1Depreciation and amortization 791.3 741.6 700.6Taxes (other than income taxes) 260.1 256.6 253.5
Total operating expenses 4,324.9 4,405.4 4,219.3
Operating income 786.9 716.5 882.7
Other expense, net (0.8) (6.5) (9.1)Allowance for funds used during construction — equity 24.8 23.8 29.5
Interest charges and financing costsInterest charges — includes other financing costs of
$7.4, $7.4 and $7.3 respectively 233.3 226.8 228.4Allowance for funds used during construction — debt (12.4) (12.5) (15.1)
Total interest charges and financing costs 220.9 214.3 213.3
Income before income taxes 590.0 519.5 689.8Income taxes 47.4 27.2 199.7
Net income $ 542.6 $ 492.3 $ 490.1
See Notes to Consolidated Financial Statements
Northern States Power Company
NSPM 2019 SEC Form 10-K
Docket No. E002/GR-20-723 Exhibit___(RLB-1), Schedule 10
Page 23 of 56

Table of Contents
24
NSP-MINNESOTA AND SUBSIDIARIESCONSOLIDATED STATEMENTS OF COMPREHENSIVE INCOME
(amounts in millions)
Year Ended Dec. 312019 2018 2017
Net income $ 542.6 $ 492.3 $ 490.1
Other comprehensive income
Defined pension and other postretirement benefits:Net pension and retiree medical (loss) gain arising during the period, net of tax of $(0.1), $0.3 and$(0.4), respectively (0.4) 0.6 (0.5)Reclassification of loss to net income, net of tax of $0.1, $0.1 and $0.1, respectively 0.2 0.2 0.1
Derivative instruments:Net fair value increase, net of tax of $0 — — 0.1Reclassification of loss to net income, net of tax of $0.3, $0.3 and $0.6, respectively 0.8 0.7 0.9
Marketable securities:Net fair value decrease, net of tax of $0 — (0.1) —
Other comprehensive income 0.6 1.4 0.6Comprehensive income $ 543.2 $ 493.7 $ 490.7
See Notes to Consolidated Financial Statements
Northern States Power Company
NSPM 2019 SEC Form 10-K
Docket No. E002/GR-20-723 Exhibit___(RLB-1), Schedule 10
Page 24 of 56

Table of Contents
25
NSP-MINNESOTA AND SUBSIDIARIESCONSOLIDATED STATEMENTS OF CASH FLOWS
(amounts in millions)
Year Ended Dec. 312019 2018 2017
Operating activitiesNet income $ 542.6 $ 492.3 $ 490.1Adjustments to reconcile net income to cash provided by operating activities:
Depreciation and amortization 798.3 748.1 707.0Nuclear fuel amortization 119.0 121.9 114.4Deferred income taxes (39.0) 41.3 193.2Allowance for equity funds used during construction (24.8) (23.8) (29.5)Provision for bad debts 13.0 16.2 15.7Net realized and unrealized hedging and derivative transactions 18.5 27.0 (2.8)Changes in operating assets and liabilities:
Accounts receivable 15.0 (42.7) (29.8)Accrued unbilled revenues 19.6 7.4 (18.1)Inventories (28.7) (21.4) 7.6Other current assets (3.3) 94.4 (25.3)Accounts payable (12.5) 10.5 46.5Net regulatory assets and liabilities (139.7) 182.3 (36.4)Other current liabilities (11.7) (64.0) (71.8)Pension and other employee benefit obligations (48.5) (75.8) (56.7)
Other, net (48.9) (31.5) (31.3)Net cash provided by operating activities 1,168.9 1,482.2 1,272.8
Investing activitiesUtility capital/construction expenditures (1,416.9) (1,149.7) (987.2)Purchases of investment securities (995.1) (852.9) (1,690.5)Proceeds from the sale of investment securities 975.0 832.6 1,668.9Investments in utility money pool arrangement (219.0) (805.0) (122.0)Repayments from utility money pool arrangement 219.0 805.0 122.0Other, net (3.1) (3.5) (3.5)
Net cash used in investing activities (1,440.1) (1,173.5) (1,012.3)
Financing activities(Repayments of) proceeds from short-term borrowings, net (120.0) 130.0 (65.0)Borrowings under utility money pool arrangement 696.0 479.0 838.0Repayments under utility money pool arrangement (696.0) (564.0) (753.0)Proceeds from issuance of long-term debt 579.8 — 585.2Repayments of long-term debt, including reacquisition premiums — — (507.9)Capital contributions from parent 354.3 108.8 145.0Dividends paid to parent (466.6) (456.3) (506.6)
Net cash provided by (used in) financing activities 347.5 (302.5) (264.3)
Net change in cash, cash equivalents and restricted cash 76.3 6.2 (3.8)Cash, cash equivalents and restricted cash at beginning of period 50.0 43.8 47.6Cash, cash equivalents and restricted cash at end of period $ 126.3 $ 50.0 $ 43.8
Supplemental disclosure of cash flow information:Cash paid for interest (net of amounts capitalized) $ (208.9) $ (207.4) $ (214.2)Cash (paid) received for income taxes, net (104.5) 89.0 (70.9)
Supplemental disclosure of non-cash investing transactions:Accrued property, plant and equipment additions $ 94.5 $ 92.5 $ 93.1Inventory transfers to property, plant and equipment 23.5 60.8 17.3Operating lease right-of-use assets 628.5 — —Allowances for equity funds used during construction 24.8 23.8 29.5
See Notes to Consolidated Financial Statements
Northern States Power Company
NSPM 2019 SEC Form 10-K
Docket No. E002/GR-20-723Exhibit___(RLB-1), Schedule 10
Page 25 of 56

Table of Contents
26
NSP-MINNESOTA AND SUBSIDIARIESCONSOLIDATED BALANCE SHEETS
(amounts in millions, except share and per share data)
Dec. 312019 2018
AssetsCurrent assets
Cash and cash equivalents $ 126.3 $ 50.0Accounts receivable, net 359.8 380.9Accounts receivable from affiliates 43.8 11.0Accrued unbilled revenues 250.7 270.3Inventories 304.8 299.4Regulatory assets 320.1 280.3Derivative instruments 32.5 25.8Prepayments and other 31.5 28.9
Total current assets 1,469.5 1,346.6
Property, plant and equipment 14,244.0 13,541.7
Other assetsNuclear decommissioning fund and other investments 2,495.2 2,107.2Regulatory assets 1,125.0 1,454.1Derivative instruments 9.2 17.0Operating lease right-of-use assets 563.8 —Other 9.7 3.3
Total other assets 4,202.9 3,581.6Total assets $ 19,916.4 $ 18,469.9
Liabilities and EquityCurrent liabilities
Current portion of long-term debt $ 300.0 $ —Short-term debt 30.0 150.0Accounts payable 388.0 393.6Accounts payable to affiliates 76.0 109.7Regulatory liabilities 141.0 262.4Taxes accrued 232.1 230.1Accrued interest 72.2 67.2Dividends payable to parent 94.3 82.7Derivative instruments 25.0 16.5Customer deposits 46.4 53.7Operating lease liabilities 79.9 —Other 154.9 154.8
Total current liabilities 1,639.8 1,520.7
Deferred credits and other liabilitiesDeferred income taxes 1,779.1 1,682.4Deferred investment tax credits 19.7 21.1Regulatory liabilities 1,937.1 1,984.7Asset retirement obligations 2,280.3 2,177.9Derivative instruments 110.2 112.2Pension and employee benefit obligations 235.9 305.1Operating lease liabilities 525.7 —Other 85.5 155.5
Total deferred credits and other liabilities 6,973.5 6,438.9
Commitments and contingenciesCapitalization
Long-term debt 5,221.3 4,937.2Common stock — 5,000,000 shares authorized of $0.01 par value; 1,000,000 shares
outstanding at Dec. 31, 2019 and 2018, respectively — —Additional paid in capital 4,067.9 3,624.2Retained earnings 2,036.4 1,972.0Accumulated other comprehensive loss (22.5) (23.1)
Total common stockholder’s equity 6,081.8 5,573.1Total liabilities and equity $ 19,916.4 $ 18,469.9
See Notes to Consolidated Financial Statements
Northern States Power Company
NSPM 2019 SEC Form 10-K
Docket No. E002/GR-20-723 Exhibit___(RLB-1), Schedule 10
Page 26 of 56

Table of Contents
27
NSP-MINNESOTA AND SUBSIDIARIESCONSOLIDATED STATEMENTS OF COMMON STOCKHOLDER’S EQUITY
(amounts in millions, except share data)Common Stock Accumulated
OtherComprehensiveIncome (Loss)
Total CommonStockholder’s
EquitySharesPar
Value
AdditionalPaid InCapital
RetainedEarnings
Balance at Dec. 31, 2016 1,000,000 $ — $ 3,435.1 $ 1,941.3 $ (20.8) $ 5,355.6
Net income 490.1 490.1Other comprehensive income 0.6 0.6Dividends declared to parent (515.8) (515.8)Contribution of capital by parent 145.1 145.1Adoption of ASU No. 2018-02 4.3 (4.3) —Balance at Dec. 31, 2017 1,000,000 $ — $ 3,580.2 $ 1,919.9 $ (24.5) $ 5,475.6
Net income 492.3 492.3Other comprehensive income 1.4 1.4Dividends declared to parent (440.2) (440.2)Contribution of capital by parent 44.0 44.0Balance at Dec. 31, 2018 1,000,000 $ — $ 3,624.2 $ 1,972.0 $ (23.1) $ 5,573.1
Net income 542.6 542.6Other comprehensive income 0.6 0.6Dividends declared to parent (478.2) (478.2)Contribution of capital by parent 443.7 443.7Balance at Dec. 31, 2019 1,000,000 $ — $ 4,067.9 $ 2,036.4 $ (22.5) $ 6,081.8
See Notes to Consolidated Financial Statements
Northern States Power Company
NSPM 2019 SEC Form 10-K
Docket No. E002/GR-20-723 Exhibit___(RLB-1), Schedule 10
Page 27 of 56

Table of Contents
28
Notes to Consolidated Financial Statements
1. Summary of Significant Accounting Policies
General — NSP-Minnesota is engaged in the regulated generation, purchase, transmission, distribution and sale of electricity and in the regulated purchase, transportation, distribution and sale of natural gas.NSP-Minnesota’s consolidated financial statements include its wholly-owned subsidiaries. In the consolidation process, all intercompany transactions and balances are eliminated. NSP-Minnesota has investments in certain plants and transmission facilities jointly owned with nonaffiliated utilities. NSP-Minnesota’s proportionate share of jointly owned facilities is recorded as property, plant and equipment on the consolidated balance sheets and NSP-Minnesota’s proportionate share of the operating costs associated with these facilities is included in its consolidated statements of income.NSP-Minnesota’s consolidated financial statements are presented in accordance with GAAP. All of NSP-Minnesota’s underlying accounting records also conform to the FERC uniform system of accounts or to systems required by various state regulatory commissions. Certain amounts in the 2018 and 2017 consolidated financial statements or notes have been reclassified to conform to the 2019 presentation for comparative purposes; however, such reclassifications did not affect net income, total assets, liabilities, equity or cash flows.NSP-Minnesota has evaluated events occurring after Dec. 31, 2019 up to the date of issuance of these consolidated financial statements. These statements contain all necessary adjustments and disclosures resulting from that evaluation.Use of Estimates — NSP-Minnesota uses estimates based on the best information available in recording transactions and balances resulting from business operations. Estimates are used on items such as plant depreciable lives or potential disallowances, AROs, certain regulatory assets and liabilities, tax provisions, uncollectible amounts, environmental costs, unbilled revenues, jurisdictional fuel and energy cost allocations and actuarially determined benefit costs. Recorded estimates are revised when better information becomes available or actual amounts can be determined. Revisions can affect operating results.Regulatory Accounting — NSP-Minnesota accounts for income and expense items in accordance with accounting guidance for regulated operations. Under this guidance:• Certain costs, which would otherwise be charged to expense or other
comprehensive income, are deferred as regulatory assets based on the expected ability to recover the costs in future rates; and
• Certain credits, which would otherwise be reflected as income or other comprehensive income, are deferred as regulatory liabilities based on the expectation the amounts will be returned to customers in future rates, or because the amounts were collected in rates prior to the costs being incurred.
Estimates of recovering deferred costs and returning deferred credits are based on specific ratemaking decisions or precedent for each item. Regulatory assets and liabilities are amortized consistent with the treatment in the rate setting process. If changes in the regulatory environment occur, NSP-Minnesota may no longer be eligible to apply this accounting treatment, and may be required to eliminate regulatory assets and liabilities from its balance sheet. Such changes could have a material effect on NSP-Minnesota’s results of operations, financial condition and cash flows. See Note 4 for further information.
Income Taxes — NSP-Minnesota accounts for income taxes using the asset and liability method, which requires recognition of deferred tax assets and liabilities for the expected future tax consequences of events that have been included in the financial statements. NSP-Minnesota defers income taxes for all temporary differences between pretax financial and taxable income and between the book and tax bases of assets and liabilities. NSP-Minnesota uses rates that are scheduled to be in effect when the temporary differences are expected to reverse. The effect of a change in tax rates on deferred tax assets and liabilities is recognized in the period that includes the enactment date.The effects of NSP-Minnesota’s tax rate changes are generally subject to a normalization method of accounting. Therefore, the revaluation of most of its net deferred taxes upon a tax rate reduction results in the establishment of a net regulatory liability, which will be refundable to utility customers over the remaining life of the related assets. A tax rate increase would result in the establishment of a similar regulatory asset. Reversal of certain temporary differences are accounted for as current income tax expense due to the effects of past regulatory practices, when deferred taxes were not required to be recorded due to the use of flow through accounting for ratemaking purposes. Tax credits are recorded when earned unless there is a requirement to defer the benefit and amortize it over the book depreciable lives of the related property. The requirement to defer and amortize tax credits only applies to federal ITCs related to public utility property. Utility rate regulation also has resulted in the recognition of regulatory assets and liabilities related to income taxes. Deferred tax assets are reduced by a valuation allowance if it is more likely than not that some portion or all of the deferred tax asset will not be realized. NSP-Minnesota follows the applicable accounting guidance to measure and disclose uncertain tax positions that it has taken or expects to take in its income tax returns. NSP-Minnesota recognizes a tax position in its consolidated financial statements when it is more likely than not that the position will be sustained upon examination based on the technical merits of the position. Recognition of changes in uncertain tax positions are reflected as a component of income tax expense.NSP-Minnesota reports interest and penalties related to income taxes within the other income and interest charges in the consolidated statements of income.Xcel Energy Inc. and its subsidiaries, including NSP-Minnesota, file consolidated federal income tax returns as well as consolidated or separate state income tax returns. Federal income taxes paid by Xcel Energy Inc. are allocated to its subsidiaries based on separate company computations. A similar allocation is made for state income taxes paid by Xcel Energy Inc. in connection with consolidated state filings. Xcel Energy Inc. also allocates its own income tax benefits to its direct subsidiaries.See Note 7 for further information.Property, Plant and Equipment and Depreciation in Regulated Operations — Property, plant and equipment is stated at original cost. The cost of plant includes direct labor and materials, contracted work, overhead costs and AFUDC. The cost of plant retired is charged to accumulated depreciation and amortization. Amounts recovered in rates for future removal costs are recorded as regulatory liabilities. Significant additions or improvements extending asset lives are capitalized, while repairs and maintenance costs are charged to expense as incurred.
Northern States Power Company
NSPM 2019 SEC Form 10-K
Docket No. E002/GR-20-723 Exhibit___(RLB-1), Schedule 10
Page 28 of 56

Table of Contents
29
Maintenance and replacement of items determined to be less than a unit of property are charged to operating expenses as incurred. Planned maintenance activities are charged to operating expense unless the cost represents the acquisition of an additional unit of property or the replacement of an existing unit of property.Property, plant and equipment is tested for impairment when it is determined that the carrying value of the assets may not be recoverable. A loss is recognized in the current period if it becomes probable that part of a cost of a plant under construction or recently completed plant will be disallowed for recovery from customers and a reasonable estimate of the disallowance can be made.For investments in property, plant and equipment that are abandoned and not expected to go into service, incurred costs and related deferred tax amounts are compared to the discounted estimated future rate recovery, and a loss is recognized, if necessary.NSP-Minnesota records depreciation expense using the straight-line method over the plant’s useful life. Actuarial life studies are performed and submitted to the state and federal commissions for review. Upon acceptance by the various commissions, the resulting lives and net salvage rates are used to calculate depreciation. Depreciation expense, expressed as a percentage of average depreciable property, was approximately 3.7% for 2019, 3.6% for 2018 and 3.6% for 2017.See Note 3 for further information.AROs — NSP-Minnesota accounts for AROs under accounting guidance that requires a liability for the fair value of an ARO to be recognized in the period in which it is incurred if it can be reasonably estimated, with the offsetting associated asset retirement costs capitalized as a long-lived asset. The liability is generally increased over time by applying the effective interest method of accretion, and the capitalized costs are depreciated over the useful life of the long-lived asset.Changes resulting from revisions to the timing or amount of expected asset retirement cash flows are recognized as an increase or a decrease in the ARO. NSP-Minnesota also recovers through rates certain future plant removal costs in addition to AROs. The accumulated removal costs for these obligations are reflected in the consolidated balance sheets as a regulatory liability. See Note 10 for further information.Nuclear Decommissioning — Nuclear decommissioning studies that estimate NSP-Minnesota’s costs of decommissioning its nuclear power plants are performed at least every three years and submitted to the state commissions for approval. For ratemaking purposes, NSP-Minnesota recovers regulator-approved decommissioning costs of its nuclear power plants over each facility’s expected service life, typically based on the triennial decommissioning studies. The studies consider estimated future costs of decommissioning and the market value of investments in trust funds and recommend annual funding amounts. Amounts collected in rates are deposited in the trust funds. For financial reporting purposes, NSP-Minnesota accounts for nuclear decommissioning as an ARO.Restricted funds for the payment of future decommissioning expenditures for NSP-Minnesota’s nuclear facilities are included in nuclear decommissioning fund and other assets on the consolidated balance sheets. See Notes 8 and 10 for further information.
Benefit Plans and Other Postretirement Benefits — NSP-Minnesota maintains pension and postretirement benefit plans for eligible employees. Recognizing the cost of providing benefits and measuring the projected benefit obligation of these plans requires management to make various assumptions and estimates.Certain unrecognized actuarial gains and losses and unrecognized prior service costs or credits are deferred as regulatory assets and liabilities, rather than recorded as other comprehensive income, based on regulatory recovery mechanisms.See Note 9 for further information.Environmental Costs — Environmental costs are recorded when it is probable NSP-Minnesota is liable for remediation costs and the liability can be reasonably estimated. Costs are deferred as a regulatory asset if it is probable that the costs will be recovered from customers in future rates. Otherwise, the costs are expensed. If an environmental expense is related to facilities currently in use, such as emission-control equipment, the cost is capitalized and depreciated over the life of the plant.Estimated remediation costs are regularly adjusted as estimates are revised and remediation proceeds. If other participating potentially responsible parties exist and acknowledge their potential involvement with a site, costs are estimated and recorded only for NSP-Minnesota’s expected share of the cost. Future costs of restoring sites are treated as a capitalized cost of plant retirement. The depreciation expense levels recoverable in rates include a provision for removal expenses. Removal costs recovered in rates before the related costs are incurred are classified as a regulatory liability.See Note 10 for further information.Revenue from Contracts with Customers — Performance obligations related to the sale of energy are satisfied as energy is delivered to customers. NSP-Minnesota recognizes revenue that corresponds to the price of the energy delivered to the customer. The measurement of energy sales to customers is generally based on the reading of their meters, which occurs on a systematic basis throughout the month. At the end of each month, amounts of energy delivered to customers since the date of the last meter reading are estimated, and the corresponding unbilled revenue is recognized. NSP-Minnesota does not recognize a separate financing component of its collections from customers as contract terms are short-term in nature. NSP-Minnesota presents its revenues net of any excise or sales taxes or fees.NSP-Minnesota recognizes sales to both native load and other end use customers on a gross basis in electric revenues and cost of sales. Revenues and charges for short term wholesale sales of excess energy transacted through RTOs are also recorded on a gross basis. Other RTO revenues and charges are recorded on a net basis in cost of sales.NSP-Minnesota has various rate-adjustment mechanisms that provide for the recovery of natural gas, electric fuel and purchased energy costs. Cost-adjustment tariffs may increase or decrease the level of revenue collected from customers and are revised periodically for differences between the total amount collected under the clauses and the costs incurred. When applicable, fuel cost over-recoveries (the excess of fuel revenue billed to customers over fuel costs incurred) are deferred as regulatory liabilities and under-recoveries (the excess of fuel costs incurred over fuel revenues billed to customers) are deferred as regulatory assets.See Note 6 for further information.
Northern States Power Company
NSPM 2019 SEC Form 10-K
Docket No. E002/GR-20-723 Exhibit___(RLB-1), Schedule 10
Page 29 of 56

Table of Contents
30
Cash and Cash Equivalents — NSP-Minnesota considers investments in instruments with a remaining maturity of three months or less at the time of purchase to be cash equivalents.Accounts Receivable and Allowance for Bad Debts — Accounts receivable are stated at the actual billed amount net of an allowance for bad debts. NSP-Minnesota establishes an allowance for uncollectible receivables based on a policy that reflects its expected exposure to the credit risk of customers.As of Dec. 31, 2019 and 2018, the allowance for bad debts was $23.0 million and $23.5 million, respectively. Inventory — Inventory is recorded at average cost and consisted of the following:
(Millions of Dollars) Dec. 31, 2019 Dec. 31, 2018Inventories
Materials and supplies $ 175.6 $ 176.3Fuel 103.2 88.5Natural gas 26.0 34.6
Total inventories $ 304.8 $ 299.4
Fair Value Measurements — NSP-Minnesota presents cash equivalents, interest rate derivatives, commodity derivatives and nuclear decommissioning fund assets at estimated fair values in its consolidated financial statements. Cash equivalents are recorded at cost plus accrued interest; money market funds are measured using quoted NAVs. For interest rate derivatives, quoted prices based primarily on observable market interest rate curves are used to establish fair value. For commodity derivatives, the most observable inputs available are generally used to determine the fair value of each contract. In the absence of a quoted price, NSP-Minnesota may use quoted prices for similar contracts or internally prepared valuation models to determine fair value. For the pension and postretirement plan assets and nuclear decommissioning fund, published trading data and pricing models, generally using the most observable inputs available, are utilized to estimate fair value for each security. See Notes 8 and 9 for further information.Derivative Instruments — NSP-Minnesota uses derivative instruments in connection with its interest rate, utility commodity price, vehicle fuel price and commodity trading activities, including forward contracts, futures, swaps and options. Any derivative instruments not qualifying for the normal purchases and normal sales exception are recorded on the consolidated balance sheets at fair value as derivative instruments. Classification of changes in fair value for those derivative instruments is dependent on the designation of a qualifying hedging relationship. Changes in fair value of derivative instruments not designated in a qualifying hedging relationship are reflected in current earnings or as a regulatory asset or liability. Classification as a regulatory asset or liability is based on commission approved regulatory recovery mechanisms.Gains or losses on commodity trading transactions are recorded as a component of electric operating revenues; hedging transactions for vehicle fuel costs are recorded as a component of capital projects and O&M costs; and interest rate hedging transactions are recorded as a component of interest expense.Normal Purchases and Normal Sales — NSP-Minnesota enters into contracts for purchases and sales of commodities for use in its operations. At inception, contracts are evaluated to determine whether a derivative exists and/or whether an instrument may be exempted from derivative accounting if designated as a normal purchase or normal sale.
See Note 8 for further information.Commodity Trading Operations — All applicable gains and losses related to commodity trading activities are shown on a net basis in electric operating revenues in the consolidated statements of income.Commodity trading activities are not associated with energy produced from NSP-Minnesota’s generation assets or energy and capacity purchased to serve native load. Commodity trading contracts are recorded at fair market value and commodity trading results include the impact of all margin-sharing mechanisms. See Note 8 for further information.Other Utility ItemsAFUDC — AFUDC represents the cost of capital used to finance utility construction activity. AFUDC is computed by applying a composite financing rate to qualified CWIP. The amount of AFUDC capitalized as a utility construction cost is credited to other nonoperating income (for equity capital) and interest charges (for debt capital). AFUDC amounts capitalized are included in NSP-Minnesota’s rate base for establishing utility rates. Alternative Revenue — Certain rate rider mechanisms (including decoupling and CIP programs) qualify as alternative revenue programs. These mechanisms arise from costs imposed upon the utility by action of a regulator or legislative body related to an environmental, public safety or other mandate. When certain criteria are met, including expected collection within 24 months, revenue is recognized equal to the revenue requirement, which may include incentives and return on rate base items.Billing amounts are revised periodically for differences between total amount collected and revenue earned, which may increase or decrease the level of revenue collected from customers. Alternative revenues arising from these programs are presented on a gross basis and disclosed separately from revenue from contracts with customers.See Note 6 for further information. Conservation Programs — Costs incurred for CIP programs are deferred if it is probable future revenue will recover the incurred cost. Revenues recognized for incentive programs for the recovery of lost margins and/or conservation performance incentives are limited to amounts expected to be collected within 24 months from the year they are earned. Regulatory assets are recognized to reflect the amount of costs or earned incentives that have not yet been collected from customers.Emission Allowances — Emission allowances are recorded at cost, including broker commission fees. The inventory accounting model is utilized for all emission allowances and sales of these allowances are included in electric revenues.Nuclear Refueling Outage Costs — NSP-Minnesota uses a deferral and amortization method for nuclear refueling costs. This method amortizes costs over the period between refueling outages consistent with rate recovery.RECs — Cost of RECs that are utilized for compliance is recorded as electric fuel and purchased power expense. Sales of RECs are recorded in electric revenues on a gross basis. The cost of these RECs and amounts credited to customers under margin-sharing mechanisms are recorded in electric fuel and purchased power expense. Cost of RECs that are utilized to support commodity trading activities are recorded in a similar manner as the associated commodities and are shown on a net basis in electric operating revenues in the consolidated statements of income.
Northern States Power Company
NSPM 2019 SEC Form 10-K
Docket No. E002/GR-20-723 Exhibit___(RLB-1), Schedule 10
Page 30 of 56

Table of Contents
31
2. Accounting Pronouncements
Recently IssuedCredit Losses — In 2016, the FASB issued Financial Instruments - Credit Losses, Topic 326 (ASC Topic 326), which changes how entities account for losses on receivables and certain other assets. The guidance requires use of a current expected credit loss model, which may result in earlier recognition of credit losses than under previous accounting standards. ASC Topic 326 is effective for interim and annual periods beginning on or after Dec. 15, 2019, and will be applied using a modified-retrospective approach, with a cumulative-effect adjustment to retained earnings as of Jan. 1, 2020. NSP-Minnesota expects the impact of adoption of the new standard to include first-time recognition of expected credit losses (i.e., bad debt expense) on unbilled revenues, with the initial allowance established at Jan. 1, 2020 charged to retained earnings. Recognition of this allowance and other impacts of adoption are expected to be immaterial to the consolidated financial statements.Recently AdoptedLeases — In 2016, the FASB issued Leases, Topic 842 (ASC Topic 842), which provides new accounting and disclosure guidance for leasing activities, most significantly requiring that operating leases be recognized on the balance sheet. NSP-Minnesota adopted the guidance on Jan. 1, 2019 utilizing the package of transition practical expedients provided by the new standard, including carrying forward prior conclusions on whether agreements existing before the adoption date contain leases and whether existing leases are operating or finance leases; ASC Topic 842 refers to capital leases as finance leases.Specifically for land easement contracts, NSP-Minnesota has elected the practical expedient provided by ASU No. 2018-01 Leases: Land Easement Practical Expedient for Transition to Topic 842, and as a result, only those easement contracts entered on or after Jan. 1, 2019 will be evaluated to determine if lease treatment is appropriate.NSP-Minnesota also utilized the transition practical expedient offered by ASU No. 2018-11 Leases: Targeted Improvements to implement the standard on a prospective basis. As a result, reporting periods in the consolidated financial statements beginning Jan. 1, 2019 reflect the implementation of ASC Topic 842, while prior periods continue to be reported in accordance with Leases, Topic 840 (ASC Topic 840). Other than first-time recognition of operating leases on its consolidated balance sheet, the implementation of ASC Topic 842 did not have a significant impact on NSP-Minnesota’s consolidated financial statements. Adoption resulted in recognition of approximately $0.5 billion of operating lease ROU assets and current/noncurrent operating lease liabilities. See Note 10 for leasing disclosures.
3. Property, Plant and Equipment
Major classes of property, plant and equipment
(Millions of Dollars) Dec. 31, 2019 Dec. 31, 2018Property, plant and equipment
Electric plant $ 18,519.5 $ 17,749.3Natural gas plant 1,562.9 1,475.5Common and other property 886.7 803.1CWIP 846.3 615.1
Total property, plant and equipment 21,815.4 20,643.0Less accumulated depreciation (7,945.3) (7,454.8)Nuclear fuel 2,909.8 2,770.4Less accumulated amortization (2,535.9) (2,416.9)
Property, plant and equipment, net $ 14,244.0 $ 13,541.7
Joint Ownership of Generation and Transmission FacilitiesJointly owned assets as of Dec. 31, 2019:
(Millions of Dollars)Plant inService
AccumulatedDepreciation CWIP
PercentOwned
Electric generation:Sherco Unit 3 $ 603.0 $ 426.3 $ 3.8 59%Sherco common facilities 144.7 102.7 1.9 80Sherco substation 4.8 3.5 — 59
Electric transmission:CapX2020 972.5 91.6 2.2 51Grand Meadow 10.7 2.6 — 50
Total $ 1,735.7 $ 626.7 $ 7.9
NSP-Minnesota’s share of operating expenses and construction expenditures is included in the applicable utility accounts. Respective owners are responsible for providing their own financing.
Northern States Power Company
NSPM 2019 SEC Form 10-K
Docket No. E002/GR-20-723 Exhibit___(RLB-1), Schedule 10
Page 31 of 56
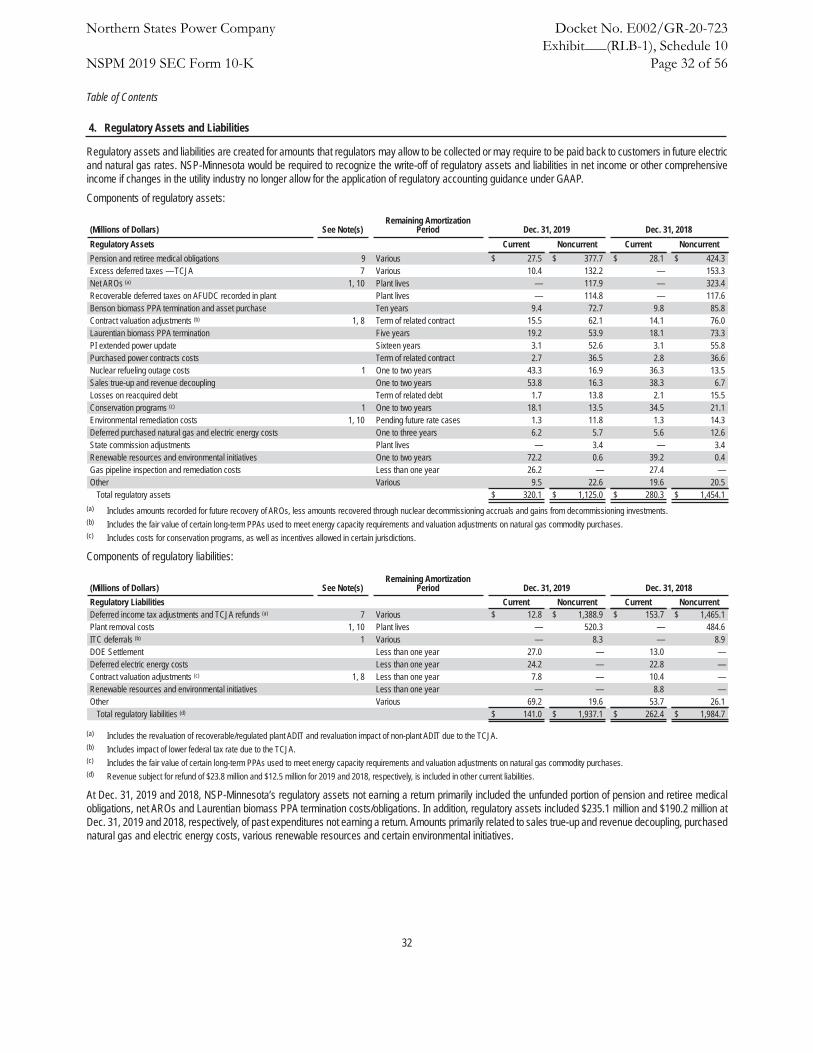
Table of Contents
32
4. Regulatory Assets and Liabilities
Regulatory assets and liabilities are created for amounts that regulators may allow to be collected or may require to be paid back to customers in future electric and natural gas rates. NSP-Minnesota would be required to recognize the write-off of regulatory assets and liabilities in net income or other comprehensive income if changes in the utility industry no longer allow for the application of regulatory accounting guidance under GAAP.Components of regulatory assets:
(Millions of Dollars) See Note(s)Remaining Amortization
Period Dec. 31, 2019 Dec. 31, 2018Regulatory Assets Current Noncurrent Current NoncurrentPension and retiree medical obligations 9 Various $ 27.5 $ 377.7 $ 28.1 $ 424.3Excess deferred taxes — TCJA 7 Various 10.4 132.2 — 153.3Net AROs (a) 1, 10 Plant lives — 117.9 — 323.4Recoverable deferred taxes on AFUDC recorded in plant Plant lives — 114.8 — 117.6Benson biomass PPA termination and asset purchase Ten years 9.4 72.7 9.8 85.8Contract valuation adjustments (b) 1, 8 Term of related contract 15.5 62.1 14.1 76.0Laurentian biomass PPA termination Five years 19.2 53.9 18.1 73.3PI extended power update Sixteen years 3.1 52.6 3.1 55.8Purchased power contracts costs Term of related contract 2.7 36.5 2.8 36.6Nuclear refueling outage costs 1 One to two years 43.3 16.9 36.3 13.5Sales true-up and revenue decoupling One to two years 53.8 16.3 38.3 6.7Losses on reacquired debt Term of related debt 1.7 13.8 2.1 15.5Conservation programs (c) 1 One to two years 18.1 13.5 34.5 21.1Environmental remediation costs 1, 10 Pending future rate cases 1.3 11.8 1.3 14.3Deferred purchased natural gas and electric energy costs One to three years 6.2 5.7 5.6 12.6State commission adjustments Plant lives — 3.4 — 3.4Renewable resources and environmental initiatives One to two years 72.2 0.6 39.2 0.4Gas pipeline inspection and remediation costs Less than one year 26.2 — 27.4 —Other Various 9.5 22.6 19.6 20.5
Total regulatory assets $ 320.1 $ 1,125.0 $ 280.3 $ 1,454.1(a) Includes amounts recorded for future recovery of AROs, less amounts recovered through nuclear decommissioning accruals and gains from decommissioning investments.(b) Includes the fair value of certain long-term PPAs used to meet energy capacity requirements and valuation adjustments on natural gas commodity purchases.(c) Includes costs for conservation programs, as well as incentives allowed in certain jurisdictions.
Components of regulatory liabilities:
(Millions of Dollars) See Note(s)Remaining Amortization
Period Dec. 31, 2019 Dec. 31, 2018Regulatory Liabilities Current Noncurrent Current NoncurrentDeferred income tax adjustments and TCJA refunds (a) 7 Various $ 12.8 $ 1,388.9 $ 153.7 $ 1,465.1Plant removal costs 1, 10 Plant lives — 520.3 — 484.6ITC deferrals (b) 1 Various — 8.3 — 8.9DOE Settlement Less than one year 27.0 — 13.0 —Deferred electric energy costs Less than one year 24.2 — 22.8 —Contract valuation adjustments (c) 1, 8 Less than one year 7.8 — 10.4 —Renewable resources and environmental initiatives Less than one year — — 8.8 —Other Various 69.2 19.6 53.7 26.1
Total regulatory liabilities (d) $ 141.0 $ 1,937.1 $ 262.4 $ 1,984.7
(a) Includes the revaluation of recoverable/regulated plant ADIT and revaluation impact of non-plant ADIT due to the TCJA.(b) Includes impact of lower federal tax rate due to the TCJA.(c) Includes the fair value of certain long-term PPAs used to meet energy capacity requirements and valuation adjustments on natural gas commodity purchases.(d) Revenue subject for refund of $23.8 million and $12.5 million for 2019 and 2018, respectively, is included in other current liabilities.
At Dec. 31, 2019 and 2018, NSP-Minnesota’s regulatory assets not earning a return primarily included the unfunded portion of pension and retiree medical obligations, net AROs and Laurentian biomass PPA termination costs/obligations. In addition, regulatory assets included $235.1 million and $190.2 million at Dec. 31, 2019 and 2018, respectively, of past expenditures not earning a return. Amounts primarily related to sales true-up and revenue decoupling, purchased natural gas and electric energy costs, various renewable resources and certain environmental initiatives.
Northern States Power Company
NSPM 2019 SEC Form 10-K
Docket No. E002/GR-20-723 Exhibit___(RLB-1), Schedule 10
Page 32 of 56
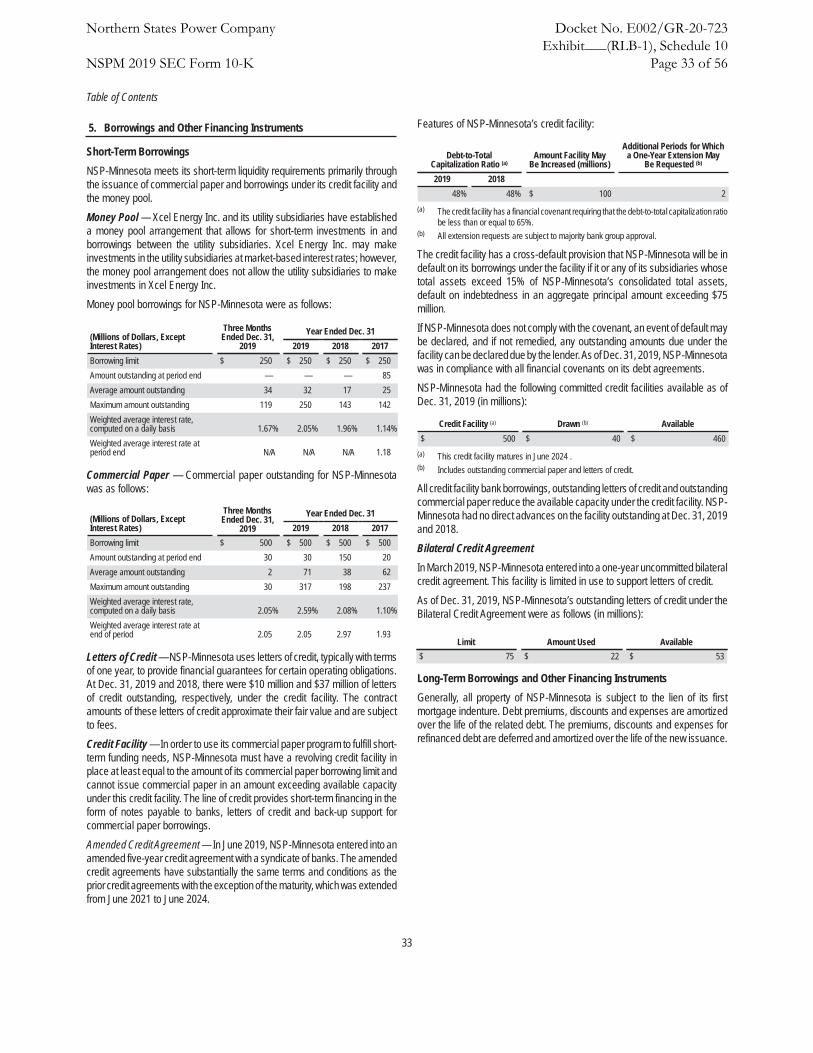
Table of Contents
33
5. Borrowings and Other Financing Instruments
Short-Term BorrowingsNSP-Minnesota meets its short-term liquidity requirements primarily through the issuance of commercial paper and borrowings under its credit facility and the money pool.Money Pool — Xcel Energy Inc. and its utility subsidiaries have established a money pool arrangement that allows for short-term investments in and borrowings between the utility subsidiaries. Xcel Energy Inc. may make investments in the utility subsidiaries at market-based interest rates; however, the money pool arrangement does not allow the utility subsidiaries to make investments in Xcel Energy Inc. Money pool borrowings for NSP-Minnesota were as follows:
(Millions of Dollars, ExceptInterest Rates)
Three MonthsEnded Dec. 31,
2019Year Ended Dec. 31
2019 2018 2017Borrowing limit $ 250 $ 250 $ 250 $ 250Amount outstanding at period end — — — 85Average amount outstanding 34 32 17 25Maximum amount outstanding 119 250 143 142Weighted average interest rate,computed on a daily basis 1.67% 2.05% 1.96% 1.14%Weighted average interest rate atperiod end N/A N/A N/A 1.18
Commercial Paper — Commercial paper outstanding for NSP-Minnesota was as follows:
(Millions of Dollars, ExceptInterest Rates)
Three MonthsEnded Dec. 31,
2019Year Ended Dec. 31
2019 2018 2017Borrowing limit $ 500 $ 500 $ 500 $ 500Amount outstanding at period end 30 30 150 20Average amount outstanding 2 71 38 62Maximum amount outstanding 30 317 198 237Weighted average interest rate,computed on a daily basis 2.05% 2.59% 2.08% 1.10%Weighted average interest rate atend of period 2.05 2.05 2.97 1.93
Letters of Credit — NSP-Minnesota uses letters of credit, typically with terms of one year, to provide financial guarantees for certain operating obligations. At Dec. 31, 2019 and 2018, there were $10 million and $37 million of letters of credit outstanding, respectively, under the credit facility. The contract amounts of these letters of credit approximate their fair value and are subject to fees. Credit Facility — In order to use its commercial paper program to fulfill short-term funding needs, NSP-Minnesota must have a revolving credit facility in place at least equal to the amount of its commercial paper borrowing limit and cannot issue commercial paper in an amount exceeding available capacity under this credit facility. The line of credit provides short-term financing in the form of notes payable to banks, letters of credit and back-up support for commercial paper borrowings. Amended Credit Agreement — In June 2019, NSP-Minnesota entered into an amended five-year credit agreement with a syndicate of banks. The amended credit agreements have substantially the same terms and conditions as the prior credit agreements with the exception of the maturity, which was extended from June 2021 to June 2024.
Features of NSP-Minnesota’s credit facility:
Debt-to-Total Capitalization Ratio (a)
Amount Facility MayBe Increased (millions)
Additional Periods for Which a One-Year Extension May
Be Requested (b)
2019 201848% 48% $ 100 2
(a) The credit facility has a financial covenant requiring that the debt-to-total capitalization ratio be less than or equal to 65%.
(b) All extension requests are subject to majority bank group approval.
The credit facility has a cross-default provision that NSP-Minnesota will be in default on its borrowings under the facility if it or any of its subsidiaries whose total assets exceed 15% of NSP-Minnesota’s consolidated total assets, default on indebtedness in an aggregate principal amount exceeding $75 million.
If NSP-Minnesota does not comply with the covenant, an event of default may be declared, and if not remedied, any outstanding amounts due under the facility can be declared due by the lender. As of Dec. 31, 2019, NSP-Minnesota was in compliance with all financial covenants on its debt agreements.NSP-Minnesota had the following committed credit facilities available as of Dec. 31, 2019 (in millions):
Credit Facility (a) Drawn (b) Available$ 500 $ 40 $ 460
(a) This credit facility matures in June 2024 .(b) Includes outstanding commercial paper and letters of credit.
All credit facility bank borrowings, outstanding letters of credit and outstanding commercial paper reduce the available capacity under the credit facility. NSP-Minnesota had no direct advances on the facility outstanding at Dec. 31, 2019and 2018.Bilateral Credit AgreementIn March 2019, NSP-Minnesota entered into a one-year uncommitted bilateral credit agreement. This facility is limited in use to support letters of credit. As of Dec. 31, 2019, NSP-Minnesota’s outstanding letters of credit under the Bilateral Credit Agreement were as follows (in millions):
Limit Amount Used Available$ 75 $ 22 $ 53
Long-Term Borrowings and Other Financing InstrumentsGenerally, all property of NSP-Minnesota is subject to the lien of its first mortgage indenture. Debt premiums, discounts and expenses are amortized over the life of the related debt. The premiums, discounts and expenses for refinanced debt are deferred and amortized over the life of the new issuance.
Northern States Power Company
NSPM 2019 SEC Form 10-K
Docket No. E002/GR-20-723 Exhibit___(RLB-1), Schedule 10
Page 33 of 56

Table of Contents
34
Long term debt obligations for NSP-Minnesota as of Dec. 31 (millions of dollars):
Financing InstrumentInterest
Rate Maturity Date 2019 2018First mortgage bonds 2.20% Aug. 15, 2020 $ 300 $ 300First mortgage bonds 2.15% Aug. 15, 2022 300 300First mortgage bonds 2.60% May 15, 2023 400 400First mortgage bonds 7.13% July 1, 2025 250 250First mortgage bonds 6.50% March 1, 2028 150 150First mortgage bonds 5.25% July 15, 2035 250 250First mortgage bonds 6.25% June 1, 2036 400 400First mortgage bonds 6.20% July 1, 2037 350 350First mortgage bonds 5.35% Nov. 1, 2039 300 300First mortgage bonds 4.85% Aug. 15, 2040 250 250First mortgage bonds 3.40% Aug. 15, 2042 500 500First mortgage bonds 4.13% May 15, 2044 300 300First mortgage bonds 4.00% Aug. 15, 2045 300 300First mortgage bonds 3.60% May 15, 2046 350 350First mortgage bonds 3.60% Sept. 15, 2047 600 600First mortgage bonds (a) 2.90% March 1, 2050 600 —Unamortized discount (31) (21)Unamortized debt issuancecost (48) (42)Current maturities (300) —Total long-term debt $ 5,221 $ 4,937
(a) 2019 financing
Maturities of long-term debt are as follows:
(Millions of Dollars)2020 $ 3002021 —2022 3002023 4002024 —
Deferred Financing Costs — Deferred financing costs of approximately $48 million and $42 million, net of amortization, are presented as a deduction from the carrying amount of long-term debt at Dec. 31, 2019 and 2018, respectively. Dividend Restrictions — NSP-Minnesota’s dividends are subject to the FERC’s jurisdiction, which prohibits the payment of dividends out of capital accounts. Dividend payments are solely to be paid from retained earnings.NSP-Minnesota’s state regulatory commissions additionally impose dividend limitations, which are more restrictive than those imposed by the FERC.Requirements and actuals as of Dec. 31, 2019:
Equity to Total Capitalization Ratio - Required RangeEquity to Total Capitalization
Ratio - ActualLow High 2019
47.1% 57.5% 52.3%
Unrestricted RetainedEarnings Total Capitalization Limit on Total Capitalization
$ 1.1 billion $ 11.6 billion $ 12.7 billion
6. Revenues
Revenue is classified by the type of goods/services rendered and market/customer type. NSP-Minnesota’s operating revenues consisted of the following:
Year Ended Dec. 31, 2019
(Millions of Dollars) ElectricNatural
Gas All Other TotalMajor revenue types
Revenue from contracts with customers:Residential $ 1,280.2 $ 303.0 $ 30.1 $ 1,613.3C&I 2,054.3 228.6 — 2,282.9Other 32.9 — 3.8 36.7
Total retail 3,367.4 531.6 33.9 3,932.9Wholesale 210.1 — — 210.1Transmission 216.0 — — 216.0Interchange 458.7 — — 458.7Other 11.9 9.8 — 21.7
Total revenue fromcontracts with customers 4,264.1 541.4 33.9 4,839.4Alternative revenue and other 242.5 29.9 — 272.4
Total revenues $ 4,506.6 $ 571.3 $ 33.9 $ 5,111.8
Year Ended Dec. 31, 2018
(Millions of Dollars) ElectricNatural
Gas All Other TotalMajor revenue types
Revenue from contracts with customers:Residential $ 1,308.4 $ 308.8 $ 27.2 $ 1,644.4C&I 2,052.1 239.3 0.2 2,291.6Other 36.5 — 3.4 39.9
Total retail 3,397.0 548.1 30.8 3,975.9Wholesale 189.2 — — 189.2Transmission 238.1 — — 238.1Interchange 473.7 — — 473.7Other 28.3 11.7 — 40.0
Total revenue fromcontracts with customers 4,326.3 559.8 30.8 4,916.9Alternative revenue and other 181.7 23.3 — 205.0
Total revenues $ 4,508.0 $ 583.1 $ 30.8 $ 5,121.9
Northern States Power Company
NSPM 2019 SEC Form 10-K
Docket No. E002/GR-20-723 Exhibit___(RLB-1), Schedule 10
Page 34 of 56

Table of Contents
35
7. Income Taxes
Federal Tax Reform — In 2017, the TCJA was signed into law. The key provisions impacting Xcel Energy (which includes NSP-Minnesota), generally beginning in 2018, included: • Corporate federal tax rate reduction from 35% to 21%;• Normalization of resulting plant-related excess deferred taxes;• Elimination of the corporate alternative minimum tax;• Continued interest expense deductibility and discontinued bonus
depreciation for regulated public utilities;• Limitations on certain executive compensation deductions;• Limitations on certain deductions for NOLs arising after Dec. 31, 2017
(limited to 80% of taxable income); • Repeal of the section 199 manufacturing deduction; and• Reduced deductions for meals and entertainment as well as state and
local lobbying.Xcel Energy estimated the effects of the TCJA, which have been reflected in the consolidated financial statements. Reductions in deferred tax assets and liabilities due to a decrease in corporate federal tax rates typically result in a net tax benefit. However, the impacts are primarily recognized as regulatory liabilities refundable to utility customers as a result of IRS requirements and past regulatory treatment.Estimated impacts of the new tax law for NSP-Minnesota in December 2017 included:• $1.1 billion ($1.5 billion grossed-up for tax) of reclassifications of plant-
related excess deferred taxes to regulatory liabilities upon valuation at the new 21% federal rate. The regulatory liabilities will be amortized consistent with IRS normalization requirements, resulting in customer refunds over the average remaining life of the related property;
• $133 million and $56 million of reclassifications (grossed-up for tax) of excess deferred taxes for non-plant related deferred tax assets and liabilities, respectively, to regulatory assets and liabilities; and
• $19 million of total estimated income tax expense related to the federal tax reform implementation, and a $5 million reduction to net income related to the allocation of Xcel Energy Services Inc.’s tax rate change on its deferred taxes.
Xcel Energy accounted for the state tax impacts of federal tax reform based on enacted state tax laws. Any future state tax law changes related to the TCJA will be accounted for in the periods state laws are enacted.Federal Audit — NSP-Minnesota is a member of the Xcel Energy affiliated group that files a consolidated federal income tax return. Statute of limitations applicable to Xcel Energy’s consolidated federal income tax returns expire as follows:
Tax Year(s) Expiration2009 - 2013 June 20202014 - 2016 September 2020
In 2015, the IRS commenced an examination of tax years 2012 and 2013. In 2017, the IRS concluded the audit of tax years 2012 and 2013 and proposed an adjustment that would impact Xcel Energy’s NOL and ETR. Xcel Energy filed a protest with the IRS. As of Dec. 31, 2019, the case has been forwarded to the Office of Appeals and Xcel Energy has recognized its best estimate of income tax expense that will result from a final resolution of this issue; however, the outcome and timing of a resolution is unknown.In 2018, the IRS began an audit of tax years 2014 - 2016. As of Dec. 31, 2019 no adjustments have been proposed.State Audits — NSP-Minnesota is a member of the Xcel Energy affiliated group that files consolidated state income tax returns. As of Dec. 31, 2019, NSP-Minnesota’s earliest open tax year subject to examination by state taxing authorities under applicable statutes of limitations is 2009. There are currently no state income tax audits in progress.Unrecognized Tax Benefits — Unrecognized tax benefit balance includes permanent tax positions, which if recognized would affect the annual ETR. In addition, the unrecognized tax benefit balance includes temporary tax positions for which the ultimate deductibility is highly certain, but for which there is uncertainty about the timing of such deductibility. A change in the period of deductibility would not affect the ETR but would accelerate the payment to the taxing authority to an earlier period.Unrecognized tax benefits - permanent vs temporary:
(Millions of Dollars)Dec. 31,
2019Dec. 31,
2018Unrecognized tax benefit — Permanent tax positions $ 14.8 $ 11.6Unrecognized tax benefit — Temporary tax positions 4.9 5.3
Total unrecognized tax benefit $ 19.7 $ 16.9
Changes in unrecognized tax benefits:
(Millions of Dollars) 2019 2018 2017Balance at Jan. 1 $ 16.9 $ 18.1 $ 60.8Additions based on tax positions related to the current year 2.6 2.0 2.7Reductions based on tax positions related to the current year (0.5) (0.3) (1.7)Additions for tax positions of prior years 0.7 0.6 5.7Reductions for tax positions of prior years — (1.1) (49.4)Settlements with taxing authorities — (2.4) —Balance at Dec. 31 $ 19.7 $ 16.9 $ 18.1
Unrecognized tax benefits were reduced by tax benefits associated with NOL and tax credit carryforwards:
(Millions of Dollars) Dec. 31, 2019 Dec. 31, 2018NOL and tax credit carryforwards $ (16.3) $ (12.7)
Net deferred tax liability associated with the unrecognized tax benefit amounts and related NOLs and tax credits carryforwards were $11.3 million and $7.3 million at Dec. 31, 2019 and Dec. 31, 2018, respectively. As the IRS Appeals and federal audit progress and state audits resume, it is reasonably possible that the amount of unrecognized tax benefit could decrease up to approximately $13.7 million in the next 12 months.
Northern States Power Company
NSPM 2019 SEC Form 10-K
Docket No. E002/GR-20-723 Exhibit___(RLB-1), Schedule 10
Page 35 of 56

Table of Contents
36
Payable for interest related to unrecognized tax benefits is partially offset by the interest benefit associated with NOL and tax credit carryforwards. Interest payable related to unrecognized tax benefits:
(Millions of Dollars) 2019 2018 2017Payable for interest related to unrecognized tax benefitsat Jan. 1 $ (1.2) $ (0.9) $ (2.0)Interest (expense) income related to unrecognized taxbenefits (0.4) (0.3) 1.1Payable for interest related to unrecognized tax benefitsat Dec. 31 $ (1.6) $ (1.2) $ (0.9)
No amounts were accrued for penalties related to unrecognized tax benefits as of Dec. 31, 2019, 2018, or 2017.Other Income Tax Matters — NOL amounts represent the tax loss that is carried forward and tax credits represent the deferred tax asset. NOL and tax credit carryforwards as of Dec. 31 were as follows:
(Millions of Dollars) 2019 2018Federal tax credit carryforwards $ 449.0 $ 379.4State NOL carryforwards 133.0 221.2Valuation allowances for state NOL carryforwards (0.5) (0.8)State tax credit carryforwards, net of federal detriment (a) 77.5 87.9Valuation allowances for state credit carryforwards, net of federal benefit (b) (65.9) (78.5)
(a) State tax credit carryforwards are net of federal detriment of $20.6 million and $23.4 million as of Dec. 31, 2019 and 2018, respectively.
(b) Valuation allowances for state tax credit carryforwards were net of federal benefit of $17.5 million and $20.9 million as of Dec. 31, 2019 and 2018, respectively.
Federal carryforward periods expire between 2023 and 2039 and state carryforward periods expire between 2020 and 2035.Total income tax expense from operations differs from the amount computed by applying the statutory federal income tax rate to income before income tax expense.Effective income tax rate for years ended Dec. 31:
2019 2018 (a) 2017 (a)
Federal statutory rate 21.0% 21.0% 35.0%State income tax on pretax income, net of federal taxeffect 7.1 7.1 5.8Increases (decreases) in tax from:
Wind PTCs (11.8) (13.6) (11.4)Plant regulatory differences (b) (7.4) (8.8) (0.3)Other tax credits, net of NOL & tax credit allowances (1.5) (1.1) (1.0)Change in unrecognized tax benefits 0.5 0.1 (1.6)Tax reform — — 2.7Other, net 0.1 0.5 (0.2)
Effective income tax rate 8.0% 5.2% 29.0%(a) Prior periods have been reclassified to conform to current year presentation.(b) Regulatory differences for income tax primarily relate to the credit of excess deferred taxes
to customers through the average rate assumption method. Income tax benefits associated with the credit of excess deferred credits are offset by corresponding revenue reductions.
Components of income tax expense for years ended Dec. 31:
(Millions of Dollars) 2019 2018 2017Current federal tax expense (benefit) $ 80.7 $ (16.8) $ 29.6Current state tax expense 7.9 5.2 14.7Current change in unrecognized tax benefit (0.8) (1.1) (36.2)Deferred federal tax (benefit) expense (86.2) (2.4) 121.6Deferred state tax expense 43.2 42.1 46.7Deferred change in unrecognized tax expense 4.0 1.6 24.9Deferred ITCs (1.4) (1.4) (1.6)
Total income tax expense $ 47.4 $ 27.2 $ 199.7
Components of deferred income tax expense as of Dec. 31:
(Millions of Dollars) 2019 2018 2017Deferred tax expense (benefit) excluding items below $ 96.7 $ 70.1 (1,176.4)Amortization and adjustments to deferred income taxeson income tax regulatory assets and liabilities (135.4) (28.2) 1,369.9Tax expense allocated to other comprehensive income,net of adoption of ASU No. 2018-02, and other (0.3) (0.6) (0.3)
Deferred tax expense $ (39.0) $ 41.3 $ 193.2
Components of the net deferred tax liability as of Dec. 31:
(Millions of Dollars) 2019 2018 (a)
Deferred tax liabilities:Differences between book and tax bases of property $ 2,361.0 $ 2,257.6Regulatory assets 257.4 260.8Operating lease assets 169.6 —Pension expense 68.4 64.7Other 10.2 9.1
Total deferred tax liabilities $ 2,866.6 $ 2,592.2
Deferred tax assets:Tax credit carryforward $ 526.5 $ 467.3Regulatory Liabilities 364.9 380.5Operating lease liabilities 169.6 —NOL and tax credit valuation allowances (66.0) (78.6)Other employee benefits 37.5 38.6Rate refund 11.0 49.7NOL carryforward 10.4 17.9Deferred investment tax credits 5.9 6.4Other 27.7 28.0
Total deferred tax assets $ 1,087.5 $ 909.8Net deferred tax liability $ 1,779.1 $ 1,682.4
(a) Prior periods have been reclassified to conform to current year presentation.
Northern States Power Company
NSPM 2019 SEC Form 10-K
Docket No. E002/GR-20-723 Exhibit___(RLB-1), Schedule 10
Page 36 of 56

Table of Contents
37
8. Fair Value of Financial Assets and Liabilities
Fair Value MeasurementsThe accounting guidance for fair value measurements and disclosures provides a single definition of fair value and requires disclosures about assets and liabilities measured at fair value. A hierarchical framework for disclosing the observability of the inputs utilized in measuring assets and liabilities at fair value is established by this guidance. • Level 1 — Quoted prices are available in active markets for identical
assets or liabilities as of the reporting date. The types of assets and liabilities included in Level 1 are highly liquid and actively traded instruments with quoted prices;
• Level 2 — Pricing inputs are other than quoted prices in active markets, but are either directly or indirectly observable as of the reporting date. The types of assets and liabilities included in Level 2 are typically either comparable to actively traded securities or contracts, or priced with models using highly observable inputs; and
• Level 3 — Significant inputs to pricing have little or no observability as of the reporting date. The types of assets and liabilities included in Level 3 are those valued with models requiring significant management judgment or estimation.
Specific valuation methods include:Cash equivalents — The fair values of cash equivalents are generally based on cost plus accrued interest; money market funds are measured using quoted NAV.Investments in equity securities and other funds — Equity securities are valued using quoted prices in active markets. The fair values for commingled funds are measured using NAVs. The investments in commingled funds may be redeemed for NAV with proper notice. Private equity commingled fund investments require approval of the fund for any unscheduled redemption, and such redemptions may be approved or denied by the fund at its sole discretion. Unscheduled distributions from real estate commingled funds investments may be redeemed with proper notice, however, may be delayed or discounted as a result of fund illiquidity. Investments in debt securities — Fair values for debt securities are determined by a third-party pricing service using recent trades and observable spreads from benchmark interest rates for similar securities.Interest rate derivatives — The fair values of interest rate derivatives are based on broker quotes that utilize current market interest rate forecasts.Commodity derivatives — The methods used to measure the fair value of commodity derivative forwards and options utilize forward prices and volatilities, as well as pricing adjustments for specific delivery locations, and are generally assigned a Level 2 classification. When contractual settlements relate to inactive delivery locations or extend to periods beyond those readily observable on active exchanges or quoted by brokers, the significance of the use of less observable forecasts of forward prices and volatilities on a valuation is evaluated, and may result in Level 3 classification.
Electric commodity derivatives held by NSP-Minnesota include transmission congestion instruments, generally referred to as FTRs. FTRs purchased from a RTO are financial instruments that entitle or obligate the holder to monthly revenues or charges based on transmission congestion across a given transmission path. The value of an FTR is derived from, and designed to offset, the cost of transmission congestion. In addition to overall transmission load, congestion is also influenced by the operating schedules of power plants and the consumption of electricity pertinent to a given transmission path. Unplanned plant outages, scheduled plant maintenance, changes in the relative costs of fuels used in generation, weather and overall changes in demand for electricity can each impact the operating schedules of the power plants on the transmission grid and the value of an FTR.If forecasted costs of electric transmission congestion increase or decrease for a given FTR path, the value of that particular FTR instrument will likewise increase or decrease. Given the limited observability of important inputs to the value of FTRs between auction processes, including expected plant operating schedules and retail and wholesale demand, fair value measurements for FTRs have been assigned a Level 3. Non-trading monthly FTR settlements are included in fuel and purchased energy cost recovery mechanisms, and therefore changes in the fair value of the yet to be settled portions of most FTRs are deferred as a regulatory asset or liability. Given this regulatory treatment and the limited magnitude of NSP-Minnesota’s FTRs relative to its electric utility operations, the numerous unobservable quantitative inputs pertinent to the value of FTRs are immaterial to the consolidated financial statements of NSP-Minnesota.Non-Derivative Fair Value MeasurementsNuclear Decommissioning Fund — The NRC requires NSP-Minnesota to maintain a portfolio of investments to fund the costs of decommissioning its nuclear generating plants. Assets of the nuclear decommissioning fund are legally restricted for the purpose of decommissioning these facilities. The fund contains cash equivalents, debt securities, equity securities and other investments. NSP-Minnesota uses the MPUC approved asset allocation for the escrow and investment targets by asset class for both the escrow and qualified trust.NSP-Minnesota recognizes the costs of funding the decommissioning over the lives of the nuclear plants, assuming rate recovery of all costs. Realized and unrealized gains on fund investments over the life of the fund are deferred as an offset of NSP-Minnesota’s regulatory asset for nuclear decommissioning costs. Consequently, any realized and unrealized gains and losses on securities in the nuclear decommissioning fund are deferred as a component of the regulatory asset.Unrealized gains for the nuclear decommissioning fund were $705.5 millionand $450.1 million as of Dec. 31, 2019 and 2018, respectively, and unrealized losses were $5.9 million and $44.8 million as of Dec. 31, 2019 and 2018, respectively.
Northern States Power Company
NSPM 2019 SEC Form 10-K
Docket No. E002/GR-20-723 Exhibit___(RLB-1), Schedule 10
Page 37 of 56

Table of Contents
38
Non-derivative instruments with recurring fair value measurements in the nuclear decommissioning fund:
Dec. 31, 2019Fair Value
(Millions of Dollars) Cost Level 1 Level 2 Level 3 NAV TotalNuclear decommissioning fund (a)
Cash equivalents $ 33.4 $ 33.4 $ — $ — $ — $ 33.4Commingled funds 732.8 — — — 934.9 934.9Debt securities 489.2 — 495.2 12.7 — 507.9Equity securities 484.6 962.0 1.4 — — 963.4
Total $ 1,740.0 $ 995.4 $ 496.6 $ 12.7 $ 934.9 $ 2,439.6(a) Reported in nuclear decommissioning fund and other investments on the consolidated
balance sheet, which also includes $55.6 million of rabbi trust assets and miscellaneous investments.
Dec. 31, 2018Fair Value
(Millions of Dollars) Cost Level 1 Level 2 Level 3 NAV TotalNuclear decommissioning fund (a)
Cash equivalents $ 24.3 $ 24.3 $ — $ — $ — $ 24.3Commingled funds 758.1 79.2 — — 819.1 898.3Debt securities 465.6 — 435.6 — — 435.6Equity securities 401.4 696.5 — — — 696.5
Total $ 1,649.4 $ 800.0 $ 435.6 $ — $ 819.1 $ 2,054.7
(a) Reported in nuclear decommissioning fund and other investments on the consolidated balance sheet, which also includes $52.5 million of rabbi trust assets and miscellaneous investments.
For the years ended Dec. 31, 2019 and 2018, there were immaterial Level 3 nuclear decommissioning fund investments or transfer of amounts between levels.Contractual maturity dates of debt securities in the nuclear decommissioning fund as of Dec. 31, 2019:
Final Contractual Maturity
(Millions of Dollars)
Due in 1 Year
or Less
Due in 1 to 5
Years
Due in 5 to 10Years
Due after 10
Years TotalDebt securities $ (6.8) $ 110.5 $ 246.1 $ 158.1 $ 507.9
Rabbi TrustsNSP-Minnesota has established a rabbi trust to provide partial funding for future deferred compensation plan distributions. Cost and fair value of assets held in rabbi trusts:
Dec. 31, 2019Fair Value
(Millions of Dollars) Cost Level 1 Level 2 Level 3 TotalRabbi Trusts (a)
Cash equivalents $ 1.2 $ 1.2 $ — $ — $ 1.2Mutual funds 11.4 13.1 — — 13.1
Total $ 12.6 $ 14.3 $ — $ — $ 14.3(a) Reported in nuclear decommissioning fund and other investments on the consolidated
balance sheet.
Dec. 31, 2018Fair Value
(Millions of Dollars) Cost Level 1 Level 2 Level 3 TotalRabbi Trusts (a)
Cash equivalents $ 0.4 $ 0.4 $ — $ — $ 0.4Mutual funds 10.8 10.7 — — 10.7
Total $ 11.2 $ 11.1 $ — $ — $ 11.1(a) Reported in nuclear decommissioning fund and other investments on the consolidated
balance sheet.
Derivative Fair Value MeasurementsNSP-Minnesota enters into derivative instruments, including forward contracts, futures, swaps and options, for trading purposes and to manage risk in connection with changes in interest rates, utility commodity prices and vehicle fuel prices.Interest Rate Derivatives — NSP-Minnesota enters into various instruments that effectively fix the interest payments on certain floating rate debt obligations or effectively fix the yield or price on a specified benchmark interest rate for an anticipated debt issuance for a specific period. These derivative instruments are generally designated as cash flow hedges for accounting purposes.As of Dec. 31, 2019, accumulated other comprehensive losses related to interest rate derivatives included $0.8 million of net losses expected to be reclassified into earnings during the next 12 months as the related hedged interest rate transactions impact earnings.Wholesale and Commodity Trading Risk — NSP-Minnesota conducts various wholesale and commodity trading activities, including the purchase and sale of electric capacity, energy, energy-related instruments and natural gas-related instruments, including derivatives. NSP-Minnesota is allowed to conduct these activities within guidelines and limitations as approved by its risk management committee, comprised of management personnel not directly involved in activities governed by this policy.Commodity Derivatives — NSP-Minnesota enters into derivative instruments to manage variability of future cash flows from changes in commodity prices in its electric and natural gas operations, as well as for trading purposes. This could include the purchase or sale of energy or energy-related products, natural gas to generate electric energy, natural gas for resale, FTRs, vehicle fuel, and weather derivatives.As of Dec. 31, 2019, NSP-Minnesota had no commodity derivative contracts designated as cash flow hedges. NSP-Minnesota may enter into derivative instruments that mitigate commodity price risk on behalf of electric and natural gas customers, but may not be designated as qualifying hedging transactions. Changes in the fair value of non-trading commodity derivative instruments are recorded in other comprehensive income or deferred as a regulatory asset or liability. The classification as a regulatory asset or liability is based on commission approved regulatory recovery mechanisms. Immaterial amounts to income related to the ineffectiveness of cash flow hedges were recorded for the years ended Dec. 31, 2019 and 2018.As of Dec. 31, 2019, there were immaterial net gains related to commodity derivative cash flow hedges recorded as a component of accumulated other comprehensive losses or related amounts expected to be reclassified into earnings during the next 12 months.
Northern States Power Company
NSPM 2019 SEC Form 10-K
Docket No. E002/GR-20-723 Exhibit___(RLB-1), Schedule 10
Page 38 of 56

Table of Contents
39
NSP-Minnesota enters into commodity derivative instruments for trading purposes not directly related to commodity price risks associated with serving its electric and natural gas customers. Changes in the fair value of these commodity derivatives are recorded in electric operating revenues, net of amounts credited to customers under margin-sharing mechanisms.Gross notional amounts of commodity forwards, options and FTRs at Dec. 31:
(Amounts in Millions) (a) (b) 2019 2018MWh of electricity 79.1 56.8MMBtu of natural gas 77.8 42.7
(a) Amounts are not reflective of net positions in the underlying commodities.(b) Notional amounts for options are included on a gross basis, but are weighted for the
probability of exercise.
Consideration of Credit Risk and Concentrations — NSP-Minnesota continuously monitors the creditworthiness of counterparties to its interest rate derivatives and commodity derivative contracts prior to settlement, and assesses each counterparty’s ability to perform on the transactions set forth in the contracts. Impact of credit risk was immaterial to the fair value of unsettled commodity derivatives presented in the consolidated balance sheets.NSP-Minnesota employs additional credit risk control mechanisms when appropriate, such as letters of credit, parental guarantees, standardized master netting agreements and termination provisions that allow for offsetting of positive and negative exposures. Credit exposure is monitored and, when necessary, the activity with a specific counterparty is limited until credit enhancement is provided.
NSP-Minnesota’s most significant concentrations of credit risk with particular entities or industries are contracts with counterparties to its wholesale, trading and non-trading commodity activities. As of Dec. 31, 2019, eight of NSP-Minnesota’s 10 most significant counterparties for these activities, comprising $54.2 million or 68% of this credit exposure, had investment grade credit ratings from Standard & Poor’s, Moody’s or Fitch Ratings.Two of the 10 most significant counterparties, comprising $15.8 million or 20%of this credit exposure, were not rated by these external agencies, but based on NSP-Minnesota’s internal analysis, had credit quality consistent with investment grade. Nine of these significant counterparties are municipal or cooperative electric entities, RTOs or other utilities.Qualifying Cash Flow Hedges — Financial impact of qualifying interest rate and vehicle fuel cash flow hedges on NSP-Minnesota’s accumulated other comprehensive loss, included in the consolidated statements of common stockholder’s equity and in the consolidated statements of comprehensive income:
(Millions of Dollars) 2019 2018 2017Accumulated other comprehensive loss related to cash flowhedges at Jan. 1 $ (20.2) $ (20.9) $ (18.2)After-tax net unrealized gains related to derivativesaccounted for as hedges — — 0.1After-tax net realized losses on derivative transactionsreclassified into earnings 0.8 0.7 0.9Adoption of ASU. 2018-02 (a) — — (3.7)Accumulated other comprehensive loss related to cash flowhedges at Dec. 31 $ (19.4) $ (20.2) $ (20.9)
(a) In 2017, NSP-Minnesota implemented ASU No. 2018-02 related to TCJA, which resulted in reclassification of certain credit balances within net accumulated other comprehensive loss to retained earnings.
Impact of derivative activity:
Pre-Tax Fair Value Gains (Losses) Recognized
During the Period in:(Millions of Dollars) Accumulated Other Comprehensive Loss Regulatory (Assets) and LiabilitiesYear Ended Dec. 31, 2019Other derivative instruments
Electric commodity $ — $ 1.5Natural gas commodity — (2.9)
Total $ — $ (1.4)
Year Ended Dec. 31, 2018Other derivative instruments
Electric commodity $ — $ (5.5)Natural gas commodity — 1.8
Total $ — $ (3.7)
Year Ended Dec. 31, 2017Derivatives designated as cash flow hedges
Vehicle fuel and other commodity $ 0.1 $ —Total $ 0.1 $ —
Other derivative instrumentsElectric commodity — 9.3Natural gas commodity — (1.9)
Total $ — $ 7.4
Northern States Power Company
NSPM 2019 SEC Form 10-K
Docket No. E002/GR-20-723 Exhibit___(RLB-1), Schedule 10
Page 39 of 56

Table of Contents
40
Pre-Tax (Gains) LossesReclassified into IncomeDuring the Period from:
Pre-Tax Gains (Losses)Recognized
During the Period in Income(Millions of Dollars)Accumulated Other Comprehensive
LossRegulatory
Assets and (Liabilities)Year Ended Dec. 31, 2019
Derivatives designated as cash flow hedgesInterest rate $ 1.1 (a) $ — $ —
Total $ 1.1 $ — $ —
Other derivative instrumentsCommodity trading $ — $ — $ (0.7) (c)
Electric commodity — 0.8 (d) —Natural gas commodity — 0.9 (e) (2.5) (e)
Total $ — $ 1.7 $ (3.2)
Year Ended Dec. 31, 2018
Derivatives designated as cash flow hedgesInterest rate $ 1.1 (a) $ — $ —
Vehicle fuel and other commodity (0.1) (b) — —Total $ 1.0 $ — $ —
Other derivative instrumentsCommodity trading $ — $ — $ 10.9 (c)
Electric commodity — 3.3 (d) —Natural gas commodity — (1.9) (e) (1.3) (e)
Total $ — $ 1.4 $ 9.6
Year Ended Dec. 31, 2017
Derivatives designated as cash flow hedges
Interest rate $ 1.5 (a) $ — $ —Total $ 1.5 $ — $ —
Other derivative instrumentsCommodity trading $ — $ — $ 9.4 (c)
Electric commodity — (13.8) (d) —Natural gas commodity — 1.0 (e) (1.2) (e)
Total $ — $ (12.8) $ 8.2(a) Amounts are recorded to interest charges.(b) Amounts are recorded to O&M expenses.(c) Amounts are recorded to electric operating revenues. Portions of these gains and losses are subject to sharing with electric customers through margin-sharing mechanisms and deducted from
gross revenue, as appropriate.(d) Amounts are recorded to electric fuel and purchased power. These derivative settlement gains and losses are shared with electric customers through fuel and purchased energy cost-recovery
mechanisms, and reclassified out of income as regulatory assets or liabilities, as appropriate.(e) Amounts are recorded to cost of natural gas sold and transported. These derivative settlement gains and losses are shared with natural gas customers through purchased natural gas cost-
recovery mechanisms, and reclassified out of income as regulatory assets and liabilities, as appropriate.
NSP-Minnesota had no derivative instruments designated as fair value hedges during the years ended Dec. 31, 2019, 2018 and 2017. Credit Related Contingent Features — Contract provisions for derivative instruments that NSP-Minnesota enters into, including those accounted for as normal purchase-normal sale contracts and therefore not reflected on the consolidated balance sheets, may require the posting of collateral or settlement of the contracts for various reasons, including if NSP-Minnesota’s credit ratings are downgraded below its investment grade credit rating by any of the major credit rating agencies, or for cross-default contractual provisions if there was a failure under other financing arrangements related to payment terms or other covenants. As of Dec. 31, 2019 and 2018, there were $7.1 million and no derivative instruments in a liability position with such underlying contract provisions, respectfully.Certain derivative instruments are also subject to contract provisions that contain adequate assurance clauses. These provisions allow counterparties to seek performance assurance, including cash collateral, in the event that NSP-Minnesota’s ability to fulfill its contractual obligations is reasonably expected to be impaired. NSP-Minnesota had no collateral posted related to adequate assurance clauses in derivative contracts as of Dec. 31, 2019 and 2018.
Northern States Power Company
NSPM 2019 SEC Form 10-K
Docket No. E002/GR-20-723 Exhibit___(RLB-1), Schedule 10
Page 40 of 56

Table of Contents
41
Recurring Fair Value Measurements — The following table presents for each of the fair value hierarchy levels, NSP-Minnesota’s derivative assets and liabilities measured at fair value on a recurring basis at Dec. 31, 2019 and 2018:
Dec. 31, 2019 Dec. 31, 2018Fair Value
Fair ValueTotal Netting (a)
Fair ValueFair Value
Total Netting (a)(Millions of Dollars)Level
1Level
2Level
3 TotalLevel
1Level
2Level
3 TotalCurrent derivative assetsOther derivative instruments:
Commodity trading $ 1.6 $ 39.5 $ 23.6 $ 64.7 $ (42.1) $ 22.6 $ 1.1 $ 27.1 $ 2.2 $ 30.4 $ (16.0) $ 14.4Electric commodity — — 8.7 8.7 (0.9) 7.8 — — 10.5 10.5 (0.1) 10.4Natural gas commodity — 2.1 — 2.1 — 2.1 — 1.0 — 1.0 — 1.0
Total current derivative assets $ 1.6 $ 41.6 $ 32.3 $ 75.5 $ (43.0) 32.5 $ 1.1 $ 28.1 $ 12.7 $ 41.9 $ (16.1) 25.8PPAs (b) — —
Current derivative instruments $ 32.5 $ 25.8Noncurrent derivative assetsOther derivative instruments:
Commodity trading $ 8.5 $ 29.4 $ 6.0 $ 43.9 $ (34.8) $ 9.1 $ — $ 25.3 $ 5.0 $ 30.3 $ (13.4) $ 16.9Total noncurrent derivative assets $ 8.5 $ 29.4 $ 6.0 $ 43.9 $ (34.8) 9.1 $ — $ 25.3 $ 5.0 $ 30.3 $ (13.4) 16.9
PPAs (b) 0.1 0.1Noncurrent derivative instruments $ 9.2 $ 17.0
Dec. 31, 2019 Dec. 31, 2018Fair Value
Fair ValueTotal Netting (a)
Fair ValueFair Value
Total Netting (a)(Millions of Dollars)Level
1Level
2Level
3 TotalLevel
1Level
2Level
3 TotalCurrent derivative liabilitiesOther derivative instruments:
Commodity trading $ 2.2 $ 42.1 $ 15.0 $ 59.3 $ (49.8) $ 9.5 $ 1.4 $ 23.9 $ 1.7 $ 27.0 $ (24.5) $ 2.5Electric commodity — — 1.0 1.0 (1.0) — — — 0.1 0.1 (0.1) —Natural gas commodity — 1.7 — 1.7 — 1.7 — — — — — —
Total current derivative liabilities $ 2.2 $ 43.8 $ 16.0 $ 62.0 $ (50.8) 11.2 $ 1.4 $ 23.9 $ 1.8 $ 27.1 $ (24.6) 2.5PPAs (b) 13.8 14.0
Current derivative instruments $ 25.0 $ 16.5Noncurrent derivative liabilitiesOther derivative instruments:
Commodity trading $ 2.0 $ 32.3 $ 17.0 $ 51.3 $ (3.3) $ 48.0 $ 0.1 $ 16.0 $ 1.6 $ 17.7 $ 17.9 $ 35.6Total noncurrent derivative liabilities $ 2.0 $ 32.3 $ 17.0 $ 51.3 $ (3.3) 48.0 $ 0.1 $ 16.0 $ 1.6 $ 17.7 $ 17.9 35.6
PPAs (b) 62.2 76.6Noncurrent derivative instruments $ 110.2 $ 112.2
(a) NSP-Minnesota nets derivative instruments and related collateral in its consolidated balance sheet when supported by a legally enforceable master netting agreement, and all derivative instruments and related collateral amounts were subject to master netting agreements at Dec. 31, 2019 and 2018. At both Dec. 31, 2019 and 2018, derivative assets and liabilities include $31.5 million of obligations to return cash collateral, respectively. At Dec. 31, 2019 and 2018, derivative assets and liabilities include the rights to reclaim cash collateral of $7.9 million and $8.7 million, respectively. The counterparty netting excludes settlement receivables and payables and non-derivative amounts that may be subject to the same master netting agreements.
(b) During 2006, Xcel Energy qualified these contracts under the normal purchase exception. Based on this qualification, the contracts are no longer adjusted to fair value and the previous carrying value of these contracts will be amortized over the remaining contract lives along with the offsetting regulatory assets and liabilities.
Changes in Level 3 commodity derivatives for the years ended Dec. 31, 2019, 2018 and 2017:
Year Ended Dec. 31(Millions of Dollars) 2019 2018 2017Balance at Jan. 1 $ 14.3 $ 22.6 $ 15.3
Purchases 16.7 26.4 40.6Settlements (27.5) (17.2) (41.7)
Net transactions recorded during the period:Gains (losses) recognized in earnings (a) 3.2 (1.5) 5.5Net (losses) gains recognized as regulatory assets and liabilities (1.4) (16.0) 2.9
Balance at Dec. 31 $ 5.3 $ 14.3 $ 22.6
(a) Amounts relate to commodity derivatives held at the end of the period.
NSP-Minnesota recognizes transfers between levels as of the beginning of each period. There were no transfers of amounts between levels for derivative instruments for the years ended 2017 - 2019.
Northern States Power Company
NSPM 2019 SEC Form 10-K
Docket No. E002/GR-20-723 Exhibit___(RLB-1), Schedule 10
Page 41 of 56

Table of Contents
42
Fair Value of Long-Term DebtAs of Dec. 31, other financial instruments for which the carrying amount did not equal fair value:
2019 2018
(Millions of Dollars)CarryingAmount
FairValue
CarryingAmount
FairValue
Long-term debt, including currentportion $ 5,521.3 $ 6,296.5 $ 4,937.2 $ 5,230.9
Fair value of NSP-Minnesota’s long-term debt is estimated based on recent trades and observable spreads from benchmark interest rates for similar securities. Fair value estimates are based on information available to management as of Dec. 31, 2019 and 2018, and given the observability of the inputs, fair values presented for long-term debt were assigned as Level 2.
9. Benefit Plans and Other Postretirement Benefits
Pension and Postretirement Health Care BenefitsXcel Energy, which includes NSP-Minnesota, has several noncontributory, defined benefit pension plans that cover almost all employees. Generally, benefits are based on a combination of years of service and average pay. Xcel Energy’s and NSP-Minnesota’s policy is to fully fund into an external trust the actuarially determined pension costs subject to the limitations of applicable employee benefit and tax laws.In addition to the qualified pension plans, Xcel Energy maintains a SERP and a nonqualified pension plan. The SERP is maintained for certain executives that were participants in the plan in 2008, when the SERP was closed to new participants. The nonqualified pension plan provides benefits for compensation that is in excess of the limits applicable to the qualified pension plans, with distributions funded by Xcel Energy’s consolidated operating cash flows. Obligations of the SERP and nonqualified plan as of Dec. 31, 2019 and 2018 were $39 million and $33 million, respectively, of which $4 million was attributable to NSP-Minnesota in both years. In 2019 and 2018, Xcel Energy recognized net benefit cost for the SERP and nonqualified plans of $4 million , of which $1 million was attributable to NSP-Minnesota in both years.
Xcel Energy and NSP-Minnesota base the investment-return assumption on expected long-term performance for each of the asset classes in its pension and postretirement health care portfolios. For pension assets, Xcel Energy and NSP-Minnesota consider the historical returns achieved by their asset portfolio over the past 20 years or longer period, as well as the long-term projected return levels. Xcel Energy and NSP-Minnesota continually review their pension assumptions. Pension cost determination assumes a forecasted mix of investment types over the long-term.• Investment returns in 2019 were above the assumed level of 7.10%;• Investment returns in 2018 were below the assumed level of 7.10%;• Investment returns in 2017 were above the assumed level of 7.10%; and• In 2020, NSP-Minnesota’s expected investment-return assumption is
7.10%.Pension plan and postretirement benefit assets are invested in a portfolio according to Xcel Energy’s and NSP-Minnesota’s return, liquidity and diversification objectives to provide a source of funding for plan obligations and minimize contributions to the plan, within appropriate levels of risk. The principal mechanism for achieving these objectives is the asset allocation given the long-term risk, return, correlation and liquidity characteristics of each particular asset class.There were no significant concentrations of risk in any industry, index, or entity. Market volatility can impact even well-diversified portfolios and significantly affect the return levels achieved by the assets in any year.State agencies also have issued guidelines to the funding of postretirement benefit costs.Xcel Energy’s ongoing investment strategy is based on plan-specific investment recommendations that seek to minimize potential investment and interest rate risk as a plan’s funded status increases over time. The investment recommendations result in a greater percentage of long-duration fixed income securities being allocated to specific plans having relatively higher funded status ratios and a greater percentage of growth assets being allocated to plans having relatively lower funded status ratios.
Plan AssetsFor each of the fair value hierarchy levels, NSP-Minnesota’s pension plan assets measured at fair value:
Dec. 31, 2019 (a) Dec. 31, 2018 (a)
(Millions of Dollars) Level 1 Level 2 Level 3Measured
at NAV Total Level 1 Level 2 Level 3Measured
at NAV TotalCash equivalents $ 40.9 $ — $ — $ — $ 40.9 $ 31.8 $ — $ — $ — $ 31.8Commingled funds 360.3 — — 270.3 630.6 241.0 — — 271.2 512.2Debt securities — 155.5 1.1 — 156.6 — 143.7 — — 143.7Equity securities 22.6 — — — 22.6 29.3 — — — 29.3Other (31.5) 1.2 — (5.2) (35.5) 0.5 1.3 — (8.2) (6.4)
Total $ 392.3 $ 156.7 $ 1.1 $ 265.1 $ 815.2 $ 302.6 $ 145.0 $ — $ 263.0 $ 710.6(a) See Note 8 for further information on fair value measurement inputs and methods.
Northern States Power Company
NSPM 2019 SEC Form 10-K
Docket No. E002/GR-20-723 Exhibit___(RLB-1), Schedule 10
Page 42 of 56

Table of Contents
43
For each of the fair value hierarchy levels, NSP-Minnesota’s postretirement benefit plan assets that were measured at fair value:
Dec. 31, 2019 (a) Dec. 31, 2018 (a)
(Millions of Dollars) Level 1 Level 2 Level 3Measured
at NAV Total Level 1 Level 2 Level 3Measured
at NAV TotalCash equivalents $ 0.1 $ — $ — $ — $ 0.1 $ 0.1 $ — $ — $ — $ 0.1Insurance contracts — 0.3 — — 0.3 — 0.3 — — 0.3Commingled funds 0.4 — — 0.5 0.9 0.8 — — 0.2 1.0Debt securities — 1.3 — — 1.3 — 1.0 — — 1.0Equity securities — — — — — — — — — —
Total $ 0.5 $ 1.6 $ — $ 0.5 $ 2.6 $ 0.9 $ 1.3 $ — $ 0.2 $ 2.4(a) See Note 8 for further information on fair value measurement inputs and methods.
Immaterial assets were transferred in or out of Level 3 for 2019. No assets were transferred in or out of Level 3 for 2018.Funded Status — Comparisons of the actuarially computed benefit obligation, changes in plan assets and funded status of the pension and postretirement health care plans for NSP-Minnesota are as follows:
Pension Benefits Postretirement Benefits(Millions of Dollars) 2019 2018 2019 2018Change in Benefit Obligation:Obligation at Jan. 1 $ 907.0 $ 1,035.1 $ 76.0 $ 88.8Service cost 25.4 28.0 0.1 0.2Interest cost 37.1 35.2 3.2 3.1Plan amendments 1.0 — — —Actuarial loss (gain) 61.7 (50.8) 3.8 (9.0)Plan participants’ contributions — — 0.3 0.4Benefit payments (a) (90.0) (140.5) (7.9) (7.5)
Obligation at Dec. 31 $ 942.2 $ 907.0 $ 75.5 $ 76.0Change in Fair Value of Plan Assets:Fair value of plan assets at Jan. 1 $ 710.6 $ 824.5 $ 2.4 $ 6.5Actual return on plan assets 147.8 (36.5) — —Employer contributions 46.8 63.1 7.7 3.0Plan participants’ contributions — — 0.3 0.4Benefit payments (90.0) (140.5) (7.8) (7.5)
Fair value of plan assets at Dec. 31 $ 815.2 $ 710.6 $ 2.6 $ 2.4Funded status of plans at Dec. 31 $ (127.0) $ (196.4) $ (72.9) $ (73.6)
Amounts recognized in the Consolidated Balance Sheet at Dec. 31:Current assets (liabilities) $ — $ — $ (4.3) $ (4.8)Noncurrent assets (liabilities) (127.0) (196.4) (68.6) (68.8)
Net amounts recognized $ (127.0) $ (196.4) $ (72.9) $ (73.6)
(a) Includes approximately $105 million of lump-sum benefit payments used in the determination of a settlement charge in 2018.
Significant Assumptions Used to Measure Benefit Obligations:Discount rate for year-end valuation 3.49% 4.31% 3.47% 4.32%Expected average long-term increase in compensation level 3.75% 3.75% N/A N/AMortality table Pri-2012 RP-2014 Pri-2012 RP-2014Health care costs trend rate — initial: Pre-65 N/A N/A 6.00% 6.50%Health care costs trend rate — initial: Post-65 N/A N/A 5.10% 5.30%Ultimate trend assumption — initial: Pre-65 N/A N/A 4.50% 4.50%Ultimate trend assumption — initial: Post-65 N/A N/A 4.50% 4.50%Years until ultimate trend is reached N/A N/A 3 4
The accumulated benefit obligation for the pension plan was $872 million and $845 million as of Dec. 31, 2019 and 2018, respectively.
Northern States Power Company
NSPM 2019 SEC Form 10-K
Docket No. E002/GR-20-723 Exhibit___(RLB-1), Schedule 10
Page 43 of 56

Table of Contents
44
Net Periodic Benefit Cost — Net periodic benefit cost other than the service cost component is included in other income in the consolidated statement of income. Components of net periodic benefit cost and the amounts recognized in other comprehensive income and regulatory assets and liabilities are as follows:
Pension Benefits Postretirement Benefits(Millions of Dollars) 2019 2018 2017 2019 2018 2017Service cost $ 25.4 $ 28.0 $ 27.8 $ 0.1 $ 0.2 $ 0.1Interest cost 37.1 35.2 40.7 3.2 3.1 3.4Expected return on plan assets (54.3) (58.2) (60.1) (0.1) (0.4) (0.2)Amortization of prior service cost (0.1) (0.1) 1.1 (3.0) (3.0) (3.0)Amortization of net loss 30.2 38.5 39.6 1.5 2.4 2.0Settlement charge (a) — 48.8 48.2 — — —
Net periodic pension cost 38.3 92.2 97.3 1.7 2.3 2.3Costs not recognized due to effects of regulation (5.2) (66.0) (72.2) — — —
Net benefit cost recognized for financial reporting $ 33.1 $ 26.2 $ 25.1 $ 1.7 $ 2.3 $ 2.3Significant Assumptions Used to Measure Costs:Discount rate 4.31% 3.63% 4.13% 4.32% 3.62% 4.13%Expected average long-term increase in compensation level 3.75 3.75 3.75 — — —Expected average long-term rate of return on assets 7.10 7.10 7.10 4.50 5.30 5.80
(a) A settlement charge is required when the amount of lump-sum distributions during the year is greater than the sum of the service and interest cost components of the annual net periodic pension cost. In 2018 and 2017, as a result of lump-sum distributions during the 2018 and 2017 plan years, NSP-Minnesota recorded a total pension settlement charge of $48.8 million in 2018 and $48.2 million in 2017 , which was not recognized due to the effects of regulation.
Pension Benefits Postretirement Benefits(Millions of Dollars) 2019 2018 2019 2018Amounts Not Yet Recognized as Components of Net Periodic Benefit Cost:Net loss $ 440.0 $ 502.0 $ 36.8 $ 34.3Prior service credit (0.2) (1.2) (9.4) (12.4)
Total $ 439.8 $ 500.8 $ 27.4 $ 21.9Amounts Not Yet Recognized as Components of Net Periodic Benefit Cost Have BeenRecorded as Follows Based Upon Expected Recovery in Rates:Current regulatory assets $ 29.3 $ 35.5 $ — $ —Noncurrent regulatory assets 410.5 465.3 25.6 20.5Deferred income taxes — — 0.5 0.4Net-of-tax accumulated other comprehensive income — — 1.3 1.0
Total $ 439.8 $ 500.8 $ 27.4 $ 21.9
Measurement date Dec. 31, 2019 Dec. 31, 2018 Dec. 31, 2019 Dec. 31, 2018
Cash Flows — Cash funding requirements can be impacted by changes to actuarial assumptions, actual asset levels and other calculations prescribed by the funding requirements of income tax and other pension-related regulations. Required contributions were made in 2017 - 2020 to meet minimum funding requirements. Total voluntary and required pension funding contributions across all four of Xcel Energy’s pension plans were as follows:• $150 million in January 2020, of which $44 million is attributable to NSP-
Minnesota; • $154 million in 2019, of which $47 million was attributable to NSP-
Minnesota; • $150 million in 2018, of which $63 million was attributable to NSP-
Minnesota; and• $162 million in 2017, of which $61 million was attributable to NSP-
Minnesota.
The postretirement health care plans have no funding requirements other than fulfilling benefit payment obligations, when claims are presented and approved. Additional cash funding requirements are prescribed by certain state and federal rate regulatory authorities. Voluntary postretirement funding contributions: • $10 million in January 2020, of which $7 million is attributable to NSP-
Minnesota;• $15 million in 2019, of which $8 million, was attributable to NSP-
Minnesota;• $11 million in 2018, of which $3 million was attributable to NSP-
Minnesota; and• $20 million in 2017, of which $10 million was attributable to NSP-
Minnesota.
Northern States Power Company
NSPM 2019 SEC Form 10-K
Docket No. E002/GR-20-723 Exhibit___(RLB-1), Schedule 10
Page 44 of 56

Table of Contents
45
Target asset allocations:
Pension BenefitsPostretirement
Benefits2019 2018 2019 2018
Domestic and international equitysecurities 37% 37% 15% 18%Long-duration fixed income andinterest rate swap securities 30 28 — —Short-to-intermediate fixed incomesecurities 14 18 72 70Alternative investments 17 15 9 8Cash 2 2 4 4
Total 100% 100% 100% 100%
Plan Amendments —The Xcel Energy Pension Plan, which includes NSP-Minnesota, and Xcel Energy Inc. Nonbargaining Pension Plan (South) were amended in 2017 to reduce supplemental benefits for non-bargaining participants as well as to allow the transfer of a portion of non-qualified pension obligations into the qualified plans.In 2019, the Pension Protection Act measurement concept was extended beyond 2019 for NSP bargaining terminations and retirements to Dec. 31, 2022.In 2019, there were no plan amendments made which affected the postretirement benefit obligation. Projected Benefit PaymentsNSP-Minnesota’s projected benefit payments:
(Millions of Dollars)
Projected Pension Benefit
Payments
Gross ProjectedPostretirement
Health CareBenefit
Payments
Expected Medicare
Part D Subsidies
Net ProjectedPostretirement
Health CareBenefit
Payments2020 $ 89.9 $ 6.9 $ — $ 6.92021 82.4 6.6 — 6.62022 80.8 6.2 — 6.22023 78.5 5.9 — 5.92024 74.1 5.6 — 5.62025-2029 326.7 23.6 — 23.6
Defined Contribution PlansXcel Energy, which includes NSP-Minnesota, maintains 401(k) and other defined contribution plans that cover most employees. The expense to these plans for NSP-Minnesota was approximately $12 million in 2019, 2018 and in 2017, respectively.Multiemployer PlansNSP-Minnesota contributes to several union multiemployer pension and other postretirement benefit plans, none of which are individually significant. These plans provide pension and postretirement health care benefits to certain union employees who may perform services for multiple employers and do not participate in the NSP-Minnesota sponsored pension and postretirement health care plans. Contributing to these types of plans creates risk that differs from providing benefits under NSP-Minnesota sponsored plans, in that if another participating employer ceases to contribute to a multiemployer plan, additional unfunded obligations may need to be funded over time by remaining participating employers.
10. Commitments and Contingencies
LegalNSP-Minnesota is involved in various litigation matters that are being defended and handled in the ordinary course of business. Assessing whether a loss is probable or a reasonable possibility, and whether the loss or a range of loss is estimable, often involves complex judgments regarding future events. Management maintains accruals for losses that are probable of being incurred and subject to reasonable estimation. Management may be unable to estimate an amount or range of a reasonably possible loss in certain situations, including when (1) the damages sought are indeterminate, (2) the proceedings are in the early stages, or (3) the matters involve novel or unsettled legal theories. In such cases, there is considerable uncertainty regarding the timing or ultimate resolution of such matters, including a possible eventual loss. For current proceedings not specifically reported herein, management does not anticipate the ultimate liabilities, if any, arising from such current proceedings would have a material effect on NSP-Minnesota’s financial statements. Unless otherwise required by GAAP, legal fees are expensed as incurred.Rate MattersMEC Acquisition — In November 2018, NSP-Minnesota reached an agreement with Southern Power Company (a subsidiary of Southern Company) to purchase MEC, a 760 MW natural gas combined cycle facility, with capacity and energy historically sold to NSP-Minnesota under PPAs expiring in 2026 and 2039, for approximately $650 million. In September 2019, the MPUC denied NSP-Minnesota's request to purchase MEC as a rate base asset. In January 2020, the MPUC approved Xcel Energy’s plan to acquire MEC as a non-regulated investment and step into the terms of the existing PPAs with NSP-Minnesota. A newly formed non-regulated subsidiary of Xcel Energy completed the transaction to purchase MEC on Jan. 17, 2020.Sherco — In NSP-Minnesota’s 2013 fuel reconciliation filing, the MPUC made recovery of replacement power costs associated with the 2011 incident at its Sherco Unit 3 plant provisional and subject to further review following conclusion of litigation commenced by NSP-Minnesota, SMMPA (Co-owner of Sherco Unit 3) and insurance companies against GE.In 2018, NSP-Minnesota and SMMPA reached a settlement with GE. NSP-Minnesota notified the MPUC of its proposal to refund the GE settlement proceeds back to customers through the FCA. The insurance providers continued their litigation against GE and the case went to trial. In 2018, GE prevailed in the lawsuit with the insurance companies, however, the jury found comparable fault, finding that GE was 52% and NSP-Minnesota was 48% at fault. At that point in the litigation, NSP-Minnesota was no longer involved in the case and was not present to make arguments about its role in the event. The specific issue leading to the fault apportionment was also not before the jury and not relevant to the outcome of the trial.In January 2019, the DOC recommended that NSP-Minnesota refund $20 million of previously recovered purchased power costs to its customers, based on the jury’s apportionment of fault. The OAG recommended the MPUC withhold any decision until the underlying litigation by the insurance providers (currently under appeal) is concluded. The DOC subsequently filed comments agreeing with the OAG’s recommendation to withhold a decision pending the outcome of any appeals. NSP-Minnesota filed reply comments arguing that the DOC recommendations are without merit and that it acted prudently in operating the plant and its settlement with GE was reasonable.
Northern States Power Company
NSPM 2019 SEC Form 10-K
Docket No. E002/GR-20-723 Exhibit___(RLB-1), Schedule 10
Page 45 of 56
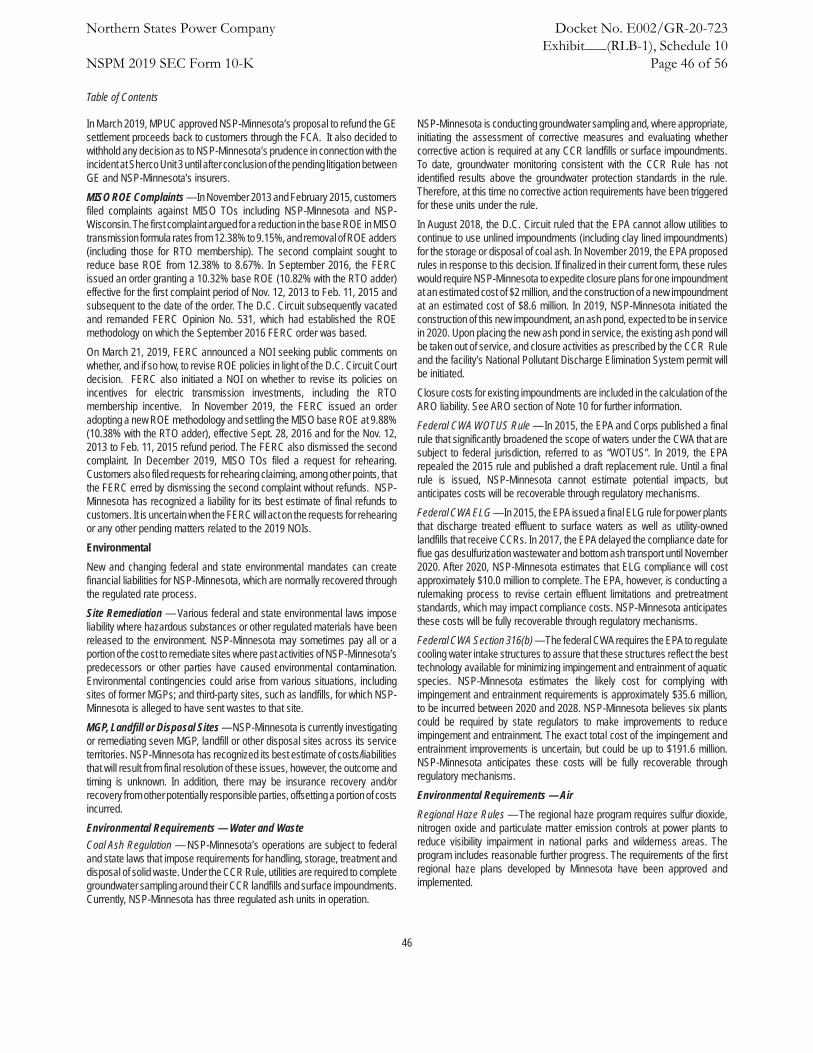
Table of Contents
46
In March 2019, MPUC approved NSP-Minnesota’s proposal to refund the GE settlement proceeds back to customers through the FCA. It also decided to withhold any decision as to NSP-Minnesota’s prudence in connection with the incident at Sherco Unit 3 until after conclusion of the pending litigation between GE and NSP-Minnesota’s insurers.MISO ROE Complaints — In November 2013 and February 2015, customers filed complaints against MISO TOs including NSP-Minnesota and NSP-Wisconsin. The first complaint argued for a reduction in the base ROE in MISO transmission formula rates from 12.38% to 9.15%, and removal of ROE adders (including those for RTO membership). The second complaint sought to reduce base ROE from 12.38% to 8.67%. In September 2016, the FERC issued an order granting a 10.32% base ROE (10.82% with the RTO adder) effective for the first complaint period of Nov. 12, 2013 to Feb. 11, 2015 and subsequent to the date of the order. The D.C. Circuit subsequently vacated and remanded FERC Opinion No. 531, which had established the ROE methodology on which the September 2016 FERC order was based.On March 21, 2019, FERC announced a NOI seeking public comments on whether, and if so how, to revise ROE policies in light of the D.C. Circuit Court decision. FERC also initiated a NOI on whether to revise its policies on incentives for electric transmission investments, including the RTO membership incentive. In November 2019, the FERC issued an order adopting a new ROE methodology and settling the MISO base ROE at 9.88% (10.38% with the RTO adder), effective Sept. 28, 2016 and for the Nov. 12, 2013 to Feb. 11, 2015 refund period. The FERC also dismissed the second complaint. In December 2019, MISO TOs filed a request for rehearing. Customers also filed requests for rehearing claiming, among other points, that the FERC erred by dismissing the second complaint without refunds. NSP-Minnesota has recognized a liability for its best estimate of final refunds to customers. It is uncertain when the FERC will act on the requests for rehearing or any other pending matters related to the 2019 NOIs.Environmental New and changing federal and state environmental mandates can create financial liabilities for NSP-Minnesota, which are normally recovered through the regulated rate process. Site Remediation — Various federal and state environmental laws impose liability where hazardous substances or other regulated materials have been released to the environment. NSP-Minnesota may sometimes pay all or a portion of the cost to remediate sites where past activities of NSP-Minnesota’s predecessors or other parties have caused environmental contamination. Environmental contingencies could arise from various situations, including sites of former MGPs; and third-party sites, such as landfills, for which NSP-Minnesota is alleged to have sent wastes to that site.MGP, Landfill or Disposal Sites — NSP-Minnesota is currently investigating or remediating seven MGP, landfill or other disposal sites across its service territories. NSP-Minnesota has recognized its best estimate of costs/liabilities that will result from final resolution of these issues, however, the outcome and timing is unknown. In addition, there may be insurance recovery and/or recovery from other potentially responsible parties, offsetting a portion of costs incurred.Environmental Requirements — Water and WasteCoal Ash Regulation — NSP-Minnesota’s operations are subject to federal and state laws that impose requirements for handling, storage, treatment and disposal of solid waste. Under the CCR Rule, utilities are required to complete groundwater sampling around their CCR landfills and surface impoundments. Currently, NSP-Minnesota has three regulated ash units in operation.
NSP-Minnesota is conducting groundwater sampling and, where appropriate, initiating the assessment of corrective measures and evaluating whether corrective action is required at any CCR landfills or surface impoundments. To date, groundwater monitoring consistent with the CCR Rule has not identified results above the groundwater protection standards in the rule. Therefore, at this time no corrective action requirements have been triggered for these units under the rule. In August 2018, the D.C. Circuit ruled that the EPA cannot allow utilities to continue to use unlined impoundments (including clay lined impoundments) for the storage or disposal of coal ash. In November 2019, the EPA proposed rules in response to this decision. If finalized in their current form, these rules would require NSP-Minnesota to expedite closure plans for one impoundment at an estimated cost of $2 million, and the construction of a new impoundment at an estimated cost of $8.6 million. In 2019, NSP-Minnesota initiated the construction of this new impoundment, an ash pond, expected to be in service in 2020. Upon placing the new ash pond in service, the existing ash pond will be taken out of service, and closure activities as prescribed by the CCR Rule and the facility’s National Pollutant Discharge Elimination System permit will be initiated.Closure costs for existing impoundments are included in the calculation of the ARO liability. See ARO section of Note 10 for further information.Federal CWA WOTUS Rule — In 2015, the EPA and Corps published a final rule that significantly broadened the scope of waters under the CWA that are subject to federal jurisdiction, referred to as “WOTUS”. In 2019, the EPA repealed the 2015 rule and published a draft replacement rule. Until a final rule is issued, NSP-Minnesota cannot estimate potential impacts, but anticipates costs will be recoverable through regulatory mechanisms.Federal CWA ELG — In 2015, the EPA issued a final ELG rule for power plants that discharge treated effluent to surface waters as well as utility-owned landfills that receive CCRs. In 2017, the EPA delayed the compliance date for flue gas desulfurization wastewater and bottom ash transport until November 2020. After 2020, NSP-Minnesota estimates that ELG compliance will cost approximately $10.0 million to complete. The EPA, however, is conducting a rulemaking process to revise certain effluent limitations and pretreatment standards, which may impact compliance costs. NSP-Minnesota anticipates these costs will be fully recoverable through regulatory mechanisms.Federal CWA Section 316(b) — The federal CWA requires the EPA to regulate cooling water intake structures to assure that these structures reflect the best technology available for minimizing impingement and entrainment of aquatic species. NSP-Minnesota estimates the likely cost for complying with impingement and entrainment requirements is approximately $35.6 million, to be incurred between 2020 and 2028. NSP-Minnesota believes six plants could be required by state regulators to make improvements to reduce impingement and entrainment. The exact total cost of the impingement and entrainment improvements is uncertain, but could be up to $191.6 million. NSP-Minnesota anticipates these costs will be fully recoverable through regulatory mechanisms.Environmental Requirements — AirRegional Haze Rules — The regional haze program requires sulfur dioxide, nitrogen oxide and particulate matter emission controls at power plants to reduce visibility impairment in national parks and wilderness areas. The program includes reasonable further progress. The requirements of the first regional haze plans developed by Minnesota have been approved and implemented.
Northern States Power Company
NSPM 2019 SEC Form 10-K
Docket No. E002/GR-20-723 Exhibit___(RLB-1), Schedule 10
Page 46 of 56

Table of Contents
47
AROs — AROs have been recorded for NSP-Minnesota’s assets. For nuclear assets, the ARO is associated with the decommissioning of NSP-Minnesota nuclear generating plants.Aggregate fair value of NSP-Minnesota’s legally restricted assets, for funding future nuclear decommissioning, was $2.4 billion and $2.1 billion for 2019 and 2018, respectively.NSP-Minnesota’s AROs were as follows:
2019
(Millions of Dollars)
Jan. 1,2019
AmountsIncurred
(a)
AmountsSettled
(b) Accretion
Cash Flow
Revisions (c)
Dec. 31,2019
ElectricNuclear $ 1,968.3 $ — $ — $ 99.5 $ — $ 2,067.8Wind 104.9 10.3 — 4.8 (6.9) 113.1Steam andotherproduction 49.2 — (3.2) 1.8 (1.0) 46.8Distribution 14.5 — — 0.6 — 15.1Miscellaneous 1.8 — — — (1.6) 0.2Natural gasTransmissionanddistribution 38.2 — — 1.6 (3.6) 36.2Miscellaneous 0.2 — — 0.1 — 0.3CommonMiscellaneous 0.8 — — — — 0.8
Total liability $2,177.9 $ 10.3 $ (3.2) $ 108.4 $ (13.1) $2,280.3(a) Amounts incurred relate to the wind farms placed in service in 2019 (Lake Benton and
Foxtail).(b) Amounts settled related to closure of certain ash containment facilities.(c) In 2019, AROs were revised for changes in timing and estimates of cash flows. Changes
in wind AROs were driven by new dismantling studies. Changes in gas transmission and distribution AROs were primarily related to increased gas line mileage and number of services, which were more than offset by decreased inflation rates. Changes in steam and other production AROs primarily related to the cost estimates to remediate ponds at production facilities.
2018
(Millions of Dollars)
Jan. 1,2018
Amounts Settled
(a) Accretion
Cash Flow
Revisions (b)
Dec. 31, 2018
(c)
ElectricNuclear $ 1,873.6 $ — $ 94.7 $ — $ 1,968.3Wind 94.1 — 4.3 6.5 104.9Steam and other production 64.0 (6.6) 2.1 (10.3) 49.2Distribution 5.8 — 0.2 8.5 14.5Miscellaneous 1.9 — — (0.1) 1.8Natural gasTransmission and distribution 43.6 — 1.8 (7.2) 38.2Miscellaneous 0.2 — — — 0.2CommonMiscellaneous 0.7 — 0.1 — 0.8
Total liability $ 2,083.9 $ (6.6) $ 103.2 $ (2.6) $ 2,177.9(a) Amounts settled related to asbestos abatement projects and closure of certain ash
containment facilities.(b) In 2018, AROs were revised for changes in timing and estimates of cash flows. Changes
in gas transmission and distribution AROs were mainly related to increased gas line mileage and number of services, which were more than offset by increased discount rates. Changes in electric distribution AROs primarily related to increased labor costs.
(c) There were no ARO amounts incurred in 2018.
Indeterminate AROs — Outside of the recorded asbestos AROs, other plants or buildings may contain asbestos due to the age of many of NSP-Minnesota’s facilities, but no confirmation or measurement of the cost of removal could be determined as of Dec. 31, 2019. Therefore, an ARO has not been recorded for these facilities.Removal Costs — NSP-Minnesota records a regulatory liability for the plant removal costs that are recovered currently in rates. Removal costs have accumulated based on varying rates as authorized by the appropriate regulatory entities. NSP-Minnesota has estimated the amount of removal costs accumulated through historic depreciation expense based on current factors used in the existing depreciation rates. Removal costs as of Dec. 31, 2019 and 2018 were $520.3 million and $484.6 million, respectively.Nuclear RelatedNuclear Insurance — NSP-Minnesota’s public liability for claims from any nuclear incident is limited to $13.9 billion under the Price-Anderson amendment to the Atomic Energy Act. NSP-Minnesota has secured $450.0 million of coverage for its public liability exposure with a pool of insurance companies. The remaining $13.5 billion of exposure is funded by the Secondary Financial Protection Program, available from assessments by the federal government. NSP-Minnesota is subject to assessments of up to $137.6 million per reactor-incident for each of its three licensed reactors, for public liability arising from a nuclear incident at any licensed nuclear facility in the United States. The maximum funding requirement is $20.5 million per reactor-incident during any one year. Maximum assessments are subject to inflation adjustments by the NRC and state premium taxes. The NRC’s last adjustment was effective November 2018.NSP-Minnesota purchases insurance for property damage and site decontamination cleanup costs from NEIL and EMANI. The coverage limits are $2.7 billion for each of NSP-Minnesota’s two nuclear plant sites. NEIL also provides business interruption insurance coverage up to $350.0 million, including the cost of replacement power during prolonged accidental outages of nuclear generating units. Premiums are expensed over the policy term. All companies insured with NEIL are subject to retroactive premium adjustments if losses exceed accumulated reserve funds. Capital has been accumulated in the reserve funds of NEIL and EMANI to the extent that NSP-Minnesota would have no exposure for retroactive premium assessments in case of a single incident under the business interruption and the property damage insurance coverage. NSP-Minnesota could be subject to annual maximum assessments of approximately $12.0 million for business interruption insurance and $35.1 million for property damage insurance if losses exceed accumulated reserve funds.Nuclear Fuel Disposal — NSP-Minnesota is responsible for temporarily storing spent nuclear fuel from its nuclear plants. The DOE is responsible for permanently storing spent fuel from U.S. nuclear plants, but no such facility is yet available. NSP-Minnesota owns temporary on-site storage facilities for spent fuel at its Monticello and PI nuclear plants, which consist of storage pools and dry cask facilities. The Monticello dry-cask storage facility currently stores all 30 of the authorized canisters. The PI dry-cask storage facility currently stores 44 of the 64 authorized casks. Monticello’s future spent fuel will continue to be placed in its spent fuel pool. The decommissioning plan addresses the disposition of spent fuel at the end of the licensed life.
Northern States Power Company
NSPM 2019 SEC Form 10-K
Docket No. E002/GR-20-723 Exhibit___(RLB-1), Schedule 10
Page 47 of 56

Table of Contents
48
Regulatory Plant Decommissioning Recovery — Decommissioning activities for NSP-Minnesota’s nuclear facilities are planned to begin at the end of each unit’s operating license and be completed by 2091. NSP-Minnesota’s current operating licenses allow continued use of its Monticello nuclear plant until 2030 and its PI nuclear plant until 2033 for Unit 1 and 2034 for Unit 2. Future decommissioning costs of nuclear facilities are estimated through triennial periodic studies that assess the costs and timing of planned nuclear decommissioning activities for each unit.Obligations for decommissioning are expected to be funded 100% by the external decommissioning trust fund. The cost study assumes the external decommissioning fund will earn an after-tax return between 5.23% and 6.30%. Realized and unrealized gains on fund investments are deferred as an offset of NSP-Minnesota’s regulatory asset for nuclear decommissioning costs. Decommissioning costs are quantified in 2014 dollars. Escalation rates are 4.36% for plant removal activities and 3.36% for fuel management and site restoration activities. NSP-Minnesota had $2.4 billion of assets held in external decommissioning trusts at Dec. 31, 2019. The following table summarizes the funded status of NSP-Minnesota’s decommissioning obligation. Xcel Energy believes future decommissioning costs will continue to be recovered in customer rates. The following amounts were prepared on a regulatory basis and not directly recorded in the financial statements as an ARO.
Regulatory Basis(Millions of Dollars) 2019 2018Estimated decommissioning cost obligation from most recently
approved study (in 2014 dollars) $ 3,012.3 $ 3,012.3Effect of escalating costs 688.2 538.9Estimated decommissioning cost obligation (in current dollars) 3,700.5 3,551.2Effect of escalating costs to payment date 7,505.0 7,654.3Estimated future decommissioning costs (undiscounted) 11,205.5 11,205.5Effect of discounting obligation (using average risk-free interest
rate of 2.39% and 3.33% for 2019 and 2018, respectively) (5,562.2) (6,911.5)Discounted decommissioning cost obligation $ 5,643.3 $ 4,294.0
Assets held in external decommissioning trust $ 2,439.6 $ 2,054.7Underfunding of external decommissioning fund compared to
the discounted decommissioning obligation 3,203.7 2,239.3
Calculations and data used by the regulator in approving NSP-Minnesota’s rates are useful in assessing future cash flows. Regulatory basis information is a means to reconcile amounts previously provided to the MPUC and utilized for regulatory purposes to amounts used for financial reporting. Reconciliation of the discounted decommissioning cost obligation - regulated basis to the ARO recorded in accordance with GAAP:
(Millions of Dollars) 2019 2018Discounted decommissioning cost obligation - regulated basis $ 5,643.3 $ 4,294.0Differences in discount rate and market risk premium (2,295.2) (1,446.4)O&M costs not included for GAAP (1,280.3) (879.3)Nuclear production decommissioning ARO - GAAP $ 2,067.8 $ 1,968.3
Decommissioning expenses recognized as a result of regulation:
(Millions of Dollars) 2019 2018 2017Annual decommissioning recorded as depreciation expense: (a) (b) $ 20.4 $ 20.4 $ 20.4
(a) Decommissioning expense does not include depreciation of the capitalized nuclear asset retirement costs.
(b) Decommissioning expenses in 2019, 2018 and 2017 include Minnesota’s retail jurisdiction annual funding requirement of approximately $14.0 million.
The 2014 nuclear decommissioning filing, approved in 2015, was used for regulatory presentation in 2019, 2018 and 2017. The 2017 filing, effective Jan. 1, 2019, has been approved by the MPUC. In December 2019, the MPUC verbally approved for NSP-Minnesota to delay any increase to the annual funding requirement until 2021.LeasesNSP-Minnesota evaluates contracts that may contain leases, including PPAs and arrangements for the use of office space and other facilities, vehicles and equipment. Under ASC Topic 842, adopted by NSP-Minnesota on Jan. 1, 2019, a contract contains a lease if it conveys the exclusive right to control the use of a specific asset. A contract determined to contain a lease is evaluated further to determine if the arrangement is a finance lease. ROU assets represent NSP-Minnesota's rights to use leased assets. Starting in 2019, the present value of future operating lease payments are recognized in current and noncurrent operating lease liabilities. These amounts, adjusted for any prepayments or incentives, are recognized as operating lease ROU assets. Most of NSP-Minnesota’s leases do not contain a readily determinable discount rate. Therefore, the present value of future lease payments is generally calculated using the estimated incremental borrowing rate (weighted-average of 3.8%). NSP-Minnesota has elected to utilize the practical expedient under which non-lease components, such as asset maintenance costs included in payments, are not deducted from minimum lease payments for the purposes of lease accounting and disclosure.Leases with an initial term of 12 months or less are classified as short-term leases and are not recognized on the consolidated balance sheet.Operating lease ROU assets:
(Millions of Dollars) Dec. 31, 2019PPAs $ 556.3Other 72.2Gross operating lease ROU assets 628.5Accumulated amortization (64.7)
Net operating lease ROU assets $ 563.8
Components of lease expense:
(Millions of Dollars) 2019 2018 2017Operating leases
PPA capacity payments $ 75.9 $ 62.5 $ 62.7Other operating leases (a) 9.1 13.7 14.2
Total operating lease expense (b) $ 85.0 $ 76.2 $ 76.9(a) Includes short-term lease expense of $1.4 million, $2.0 million and $2.7 million for 2019,
2018 and 2017, respectively.(b) PPA capacity payments are included in electric fuel and purchased power on the
consolidated statements of income. Expense for other operating leases is included in O&M expense and electric fuel and purchased power.
Northern States Power Company
NSPM 2019 SEC Form 10-K
Docket No. E002/GR-20-723 Exhibit___(RLB-1), Schedule 10
Page 48 of 56

Table of Contents
49
Commitments under operating leases as of Dec. 31, 2019:
(Millions of Dollars)
PPA (a) (b)
OperatingLeases
Other Operating
Leases
TotalOperating
Leases2020 $ 93.5 $ 7.9 $ 101.42021 94.9 8.0 102.92022 96.4 11.9 108.32023 97.9 7.0 104.92024 99.5 6.8 106.3Thereafter 119.8 44.9 164.7Total minimum obligation 602.0 86.5 688.5Interest component of obligation (66.2) (16.7) (82.9)Present value of minimum obligation $ 535.8 $ 69.8 605.6Less current portion (79.9)Noncurrent operating lease liabilities $ 525.7
Weighted-average remaining lease term in years 6.7(a) Amounts do not include PPAs accounted for as executory contracts and/or contingent
payments, such as energy payments on renewable PPAs.(b) PPA operating leases contractually expire at various dates through 2026.
Commitments under operating leases as of Dec. 31, 2018:
(Millions of Dollars)
PPA (a) (b)
OperatingLeases
Other OperatingLeases
TotalOperating
Leases2019 $ 65.0 $ 13.5 $ 78.52020 66.1 8.4 74.52021 67.1 8.4 75.52022 68.2 8.1 76.32023 69.3 7.3 76.6Thereafter 143.5 36.0 179.5
(a) Amounts do not include PPAs accounted for as executory contracts and/or contingent payments, such as energy payments on renewable PPAs.
(b) PPA operating leases contractually expire at various dates through 2026.PPAs and Fuel ContractsNon-Lease PPAs — NSP-Minnesota has entered into PPAs with other utilities and energy suppliers with various expiration dates through 2033 for purchased power to meet system load and energy requirements, operating reserve obligations and as part of wholesale and commodity trading activities. In general, these agreements provide for energy payments, based on actual energy delivered and capacity payments. Certain PPAs accounted for as executory contracts contain minimum energy purchase commitments, and total energy payments on those contracts were $102.4 million, $104.7 million and $96.7 million in 2019, 2018 and 2017, respectively.Included in electric fuel and purchased power expenses for PPAs accounted for as executory contracts were payments for capacity of $53.8 million, $52.7 million and $84.1 million in 2019, 2018 and 2017, respectively.Capacity and energy payments are contingent on the IPPs meeting contract obligations, including plant availability requirements. Certain contractual payments are adjusted based on market indices. The effects of price adjustments on financial results are mitigated through purchased energy cost recovery mechanisms.
At Dec. 31, 2019, the estimated future payments for capacity and energy that NSP-Minnesota is obligated to purchase pursuant to these executory contracts, subject to availability, were as follows:
(Millions of Dollars) Capacity Energy (a)
2020 $ 54.5 $ 109.42021 62.2 157.32022 61.3 172.92023 62.8 176.92024 64.5 181.8Thereafter 45.4 146.3
Total (b) $ 350.7 $ 944.6(a) Excludes contingent energy payments for renewable energy PPAs.(b) Includes amounts allocated to NSP-Wisconsin through intercompany charges.
Fuel Contracts — NSP-Minnesota has entered into various long-term commitments for the purchase and delivery of a significant portion of its coal, nuclear fuel and natural gas requirements. These contracts expire in various years between 2020 and 2037. NSP-Minnesota is required to pay additional amounts depending on actual quantities shipped under these agreements. Estimated minimum purchases for these contracts as of Dec. 31, 2019:
(Millions of Dollars) Coal Nuclear fuelNatural gas
supply
Natural gasstorage and
transportation2020 $ 171.3 $ 53.8 $ 36.8 $ 133.02021 85.2 102.5 1.4 129.82022 51.9 85.3 0.8 124.32023 35.1 103.0 — 107.82024 0.9 74.5 — 101.1Thereafter 2.6 275.1 — 273.6
Total (a) $ 347.0 $ 694.2 $ 39.0 $ 869.6(a) Includes amounts allocated to NSP-Wisconsin through intercompany charges.
VIEsUnder certain PPAs, NSP-Minnesota purchases power from IPPs for which NSP-Minnesota is required to reimburse fuel costs, or to participate in tolling arrangements under which NSP-Minnesota procures the natural gas required to produce the energy that it purchases. NSP-Minnesota has determined that certain IPPs are VIEs. NSP-Minnesota is not subject to risk of loss from the operations of these entities, and no significant financial support is required other than contractual payments for energy and capacity. NSP-Minnesota evaluated each of these VIEs for possible consolidation, including review of qualitative factors such as the length and terms of the contract, control over O&M, control over dispatch of electricity, historical and estimated future fuel and electricity prices, and financing activities. NSP-Minnesota concluded that these entities are not required to be consolidated in its consolidated financial statements because it does not have the power to direct the activities that most significantly impact the entities’ economic performance. NSP-Minnesota had approximately 1,347 MW and 1,002 MW of capacity under long-term PPAs at Dec. 31, 2019 and 2018, respectively, with entities that have been determined to be VIEs. These agreements have expiration dates through 2039.
Northern States Power Company
NSPM 2019 SEC Form 10-K
Docket No. E002/GR-20-723Exhibit___(RLB-1), Schedule 10
Page 49 of 56

Table of Contents
50
11. Other Comprehensive Income
Changes in accumulated other comprehensive loss, net of tax, for the years ended Dec. 31:
2019
(Millions of Dollars)
Gains andLosses onCash Flow
Hedges
DefinedBenefit
Pension andPostretirem
ent Items Total
Accumulated other comprehensive loss at Jan. 1 $ (20.2) $ (2.9) $ (23.1)Other comprehensive loss beforereclassifications (net of taxes of $0 and $(0.1)respectively) — (0.4) (0.4)
Losses reclassified from net accumulated othercomprehensive loss:
Interest rate derivatives (net of taxes of $0.3 and $0, respectively) (a) 0.8 (a) — 0.8Amortization of net actuarial loss (net of taxesof $0 and $0.1, respectively) — 0.2 (b) 0.2
Net current period other comprehensive income(loss) 0.8 (0.2) 0.6Accumulated other comprehensive loss at Dec.31 $ (19.4) $ (3.1) $ (22.5)
(a) Included in interest charges.(b) Included in the computation of net periodic pension and postretirement benefit costs. See
Note 9 for further information.
2018
(Millions of Dollars)
Gains and Losses on Cash Flow
Hedges
UnrealizedGains andLosses onMarketableSecurities
Defined Benefit
Pension and Postretirement
Items Total
Accumulated othercomprehensive (loss) income atJan. 1 $ (20.9) $ 0.1 $ (3.7) $ (24.5)
Other comprehensive (loss)income beforereclassifications (net of taxesof $0, $0 and $0.3,respectively) — (0.1) 0.6 0.5
Losses reclassified from netaccumulated othercomprehensive loss:
Interest rate derivatives (net oftaxes of $0.3, $0 and $0,respectively) 0.7 (a) — — 0.7Amortization of net actuarialloss (net of taxes of $0, $0and $0.1, respectively) — — 0.2 (b) 0.2
Net current period othercomprehensive income (loss) 0.7 (0.1) 0.8 1.4
Accumulated othercomprehensive loss at Dec. 31 $ (20.2) $ — $ (2.9) $ (23.1)
(a) Included in interest charges.(b) Included in the computation of net periodic pension and postretirement benefit costs. See
Note 9 for further information.
12. Segments and Related Information
NSP-Minnesota evaluates performance based on profit or loss generated from the product or service provided. These segments are managed separately because the revenue streams are dependent upon regulated rate recovery, which is separately determined for each segment.
NSP-Minnesota has the following reportable segments:• Regulated Electric — The regulated electric utility segment generates
electricity which is transmitted and distributed in Minnesota, North Dakota and South Dakota. In addition, this segment includes sales for resaleand provides wholesale transmission service to various entities in theUnited States. The regulated electric utility segment also includes NSP-Minnesota’s wholesale commodity and trading operations; and
• Regulated Natural Gas — The regulated natural gas utility segmenttransports, stores and distributes natural gas in portions of Minnesotaand North Dakota.
NSP-Minnesota presents Other, which includes operating segments, with revenues below the necessary quantitative thresholds. Those operating segments primarily include appliance repair services, non-utility real estate activities and revenues associated with processing solid waste into refuse-derived fuel.Asset and capital expenditure information is not provided for NSP-Minnesota’s reportable segments because as an integrated electric and natural gas utility, NSP-Minnesota operates significant assets that are not dedicated to a specific business segment, and reporting assets and capital expenditures by business segment would require arbitrary and potentially misleading allocations, which may not necessarily reflect the assets that would be required for the operation of the business segments on a stand-alone basis.To report income from operations for regulated electric and regulated natural gas utility segments, the majority of costs are directly assigned to each segment. However, some costs, such as common depreciation, common O&M expenses and interest expense are allocated based on cost causation allocators. A general allocator is used for certain general and administrative expenses, including office supplies, rent, property insurance and general advertising.
Northern States Power Company
NSPM 2019 SEC Form 10-K
Docket No. E002/GR-20-723Exhibit___(RLB-1), Schedule 10
Page 50 of 56

Table of Contents
51
NSP-Minnesota’s segment information is as follows:
(Millions of Dollars) 2019 2018 2017Regulated Electric
Operating revenues (a) $ 4,506.6 $ 4,508.0 $ 4,541.7Intersegment revenues 0.6 0.8 0.6
Total operating revenue $ 4,507.2 $ 4,508.8 $ 4,542.3Depreciation and amortization 742.1 697.8 661.3Interest charges and financing costs 205.3 199.5 199.8Income tax expense 36.1 16.4 179.9Net income 491.0 450.4 462.5
Regulated Natural GasOperating revenues (a) $ 571.3 $ 583.1 $ 531.9Intersegment revenues 0.8 0.5 0.5
Total operating revenue $ 572.1 $ 583.6 $ 532.4Depreciation and amortization 48.8 43.3 38.7Interest charges and financing costs 15.6 14.8 13.5Income tax expense 12.4 10.2 10.0Net income 40.0 34.2 28.4
OtherOperating revenues (a) $ 33.9 $ 30.8 $ 28.4Depreciation and amortization 0.4 0.5 0.6Interest charges and financing costs — — —Income tax expense (1.1) 0.6 9.8Net income (loss) 11.6 7.7 (0.8)
Consolidated TotalTotal operating revenue (a) $ 5,113.2 $ 5,123.2 $ 5,103.1Reconciling eliminations (1.4) (1.3) (1.1)
Consolidated total revenue $ 5,111.8 $ 5,121.9 $ 5,102.0Depreciation and amortization 791.3 741.6 700.6Interest charges and financing costs 220.9 214.3 213.3Income tax expense 47.4 27.2 199.7Net income 542.6 492.3 490.1
(a) Operating revenues include $457.4 million, $473.7 million, and $490.2 million of intercompany revenue for the years ended Dec. 31, 2019, 2018 and 2017, respectively. See Note 13 for further information.
13. Related Party Transactions
Xcel Energy Services Inc. provides management, administrative and other services for the subsidiaries of Xcel Energy Inc., including NSP-Minnesota. The services are provided and billed to each subsidiary in accordance with service agreements executed by each subsidiary. NSP-Minnesota uses the services provided by Xcel Energy Services Inc. whenever possible. Costs are charged directly to the subsidiary and are allocated if they cannot be directly assigned.Xcel Energy Inc., NSP-Minnesota, PSCo and SPS have established a utility money pool arrangement. See Note 5 for further information.The electric production and transmission costs of the entire NSP System are shared by NSP-Minnesota and NSP-Wisconsin. The Interchange Agreement provides for the sharing of all costs of generation and transmission facilities of the system, including capital costs.
Significant affiliate transactions among the companies and related parties including billings under the Interchange Agreement for the years ended Dec. 31:
(Millions of Dollars) 2019 2018 2017Operating revenues:
Electric $ 457.4 $ 473.7 $ 490.2Gas 0.5 — —
Operating expenses:Purchased power 60.5 61.1 66.8Transmission expense 116.2 96.8 110.5Other operating expenses — paid to XcelEnergy Services Inc. 533.2 534.8 539.4
Interest expense 0.7 0.3 —
Accounts receivable and payable with affiliates at Dec. 31 were:
2019 2018
(Millions of Dollars)Accounts
ReceivableAccountsPayable
AccountsReceivable
AccountsPayable
NSP-Wisconsin $ 7.9 $ — $ 11.0 $ —PSCo — 18.8 — 17.9SPS — 4.2 — 4.7Other subsidiaries of XcelEnergy Inc. 35.9 53.0 — 87.1
$ 43.8 $ 76.0 $ 11.0 $ 109.7
14. Summarized Quarterly Financial Data (Unaudited)
Quarter Ended
(Millions of Dollars)March 31,
2019June 30,
2019Sept. 30,
2019Dec. 31,
2019Operating revenues $ 1,350.5 $ 1,185.0 $ 1,344.6 $ 1,231.7Operating income 167.3 147.3 291.0 181.3Net income 113.2 95.9 208.6 124.9
Quarter Ended
(Millions of Dollars)March 31,
2018June 30,
2018Sept. 30,
2018Dec. 31,
2018Operating revenues $ 1,310.8 $ 1,187.7 $ 1,351.8 $ 1,271.6Operating income (a) 171.4 150.1 259.5 135.5Net income 111.7 92.4 201.2 87.0
(a) In 2018, NSP-Minnesota implemented ASU No. 2017-07 related to net periodic benefit cost, which resulted in retrospective reclassification of pension costs from O&M expense to other income.
ITEM 9 — CHANGES IN AND DISAGREEMENTS IN AND DISAGREEMENTS WITH ACCOUNTANTS ON ACCOUNTING AND FINANCIAL DISCLOSURE
None.
Northern States Power Company
NSPM 2019 SEC Form 10-K
Docket No. E002/GR-20-723 Exhibit___(RLB-1), Schedule 10
Page 51 of 56

Table of Contents
52
ITEM 9A — CONTROLS AND PROCEDURES
Disclosure Controls and ProceduresNSP-Minnesota maintains a set of disclosure controls and procedures designed to ensure that information required to be disclosed in reports that it files or submits under the Securities Exchange Act of 1934 is recorded, processed, summarized, and reported within the time periods specified in SEC rules and forms. In addition, the disclosure controls and procedures ensure that information required to be disclosed is accumulated and communicated to management, including the CEO and CFO, allowing timely decisions regarding required disclosure. As of Dec. 31, 2019, based on an evaluation carried out under the supervision and with the participation of NSP-Minnesota’s management, including the CEO and CFO, of the effectiveness of its disclosure controls and procedures, the CEO and CFO have concluded that NSP-Minnesota’s disclosure controls and procedures were effective.Internal Control Over Financial ReportingNo changes in NSP-Minnesota’s internal control over financial reporting occurred during the most recent fiscal quarter that materially affected, or are reasonably likely to materially affect, NSP-Minnesota’s internal control over financial reporting. NSP-Minnesota maintains internal control over financial reporting to provide reasonable assurance regarding the reliability of the financial reporting. NSP-Minnesota has evaluated and documented its controls in process activities, general computer activities, and on an entity-wide level. During the year and in preparation for issuing its report for the year ended Dec. 31, 2019 on internal controls under section 404 of the Sarbanes-Oxley Act of 2002, NSP-Minnesota conducted testing and monitoring of its internal control over financial reporting. Based on the control evaluation, testing and remediation performed, NSP-Minnesota did not identify any material control weaknesses, as defined under the standards and rules issued by the Public Company Accounting Oversight Board, as approved by the SEC and as indicated in NSP-Minnesota’s Management Report on Internal Controls over Financial Reporting, which is contained in Item 8 herein.This annual report does not include an attestation report of NSP-Minnesota’s independent registered public accounting firm regarding internal control over financial reporting. Management’s report was not subject to attestation by NSP-Minnesota’s independent registered public accounting firm pursuant to the rules of the SEC that permit NSP-Minnesota to provide only management’s report in this annual report.
ITEM 9B — OTHER INFORMATION
None.PART IIIItems 10, 11, 12 and 13 of Part III of Form 10-K have been omitted from this report for NSP-Minnesota in accordance with conditions set forth in general instructions I(1)(a) and (b) of Form 10-K for wholly-owned subsidiaries.
ITEM 10 — DIRECTORS, EXECUTIVE OFFICERS AND CORPORATE GOVERNANCE
ITEM 11 — EXECUTIVE COMPENSATION
ITEM 12 — SECURITY OWNERSHIP OF CERTAIN BENEFICIAL OWNERS AND MANAGEMENT AND RELATED STOCKHOLDER MATTERS
ITEM 13 — CERTAIN RELATIONSHIP AND RELATED TRANSACTIONS, AND DIRECTOR INDEPENDENCE
Information required under this Item is contained in Xcel Energy Inc.’s definitive Proxy Statement for its 2020 Annual Meeting of Shareholders, which is incorporated by reference.
ITEM 14 — PRINCIPAL ACCOUNTANT FEES AND SERVICES
The information required by Item 14 of Form 10-K is set forth under the heading “Independent Registered Public Accounting Firm - Audit and Non-Audit Fees” in Xcel Energy Inc.’s definitive Proxy Statement for the 2020 Annual Meeting of Shareholders which definitive Proxy Statement is expected to be filed with the SEC on or about April 6, 2020. Such information set forth under such heading is incorporated herein by this reference hereto.
Northern States Power Company
NSPM 2019 SEC Form 10-K
Docket No. E002/GR-20-723 Exhibit___(RLB-1), Schedule 10
Page 52 of 56

Table of Contents
53
PART IV
ITEM 15 — EXHIBITS, FINANCIAL STATEMENT SCHEDULES
1 Consolidated Financial Statements:
Management Report on Internal Controls Over Financial Reporting — For the year ended Dec. 31, 2019.Report of Independent Registered Public Accounting Firm — Financial StatementsConsolidated Statements of Income — For the three years ended Dec. 31, 2019, 2018 and 2017.Consolidated Statements of Comprehensive Income — For the three years ended Dec. 31, 2019, 2018 and 2017.Consolidated Statements of Cash Flows — For the three years ended Dec. 31, 2019, 2018 and 2017.Consolidated Balance Sheets — As of Dec. 31, 2019 and 2018.Consolidated Statements of Common Stockholder’s Equity — For the three years ended Dec. 31, 2019, 2018 and 2017.
2 Schedule II — Valuation and Qualifying Accounts and Reserves for the years ended Dec. 31, 2019, 2018 and 2017.
3 Exhibits
* Indicates incorporation by reference+ Executive Compensation Arrangements and Benefit Plans Covering Executive Officers and Directors
ExhibitNumber
Description Report or Registration Statement SEC File orRegistrationNumber
ExhibitReference
3.01* Articles of Incorporation and Amendments of Northern Power Corp. (renamed Northern States Power Co. (a Minnesota corporation) on Aug. 21, 2000)
NSP-Minnesota Form 10-12G dated Oct. 5,2000
000-31709 3.01
3.02* By-Laws of NSP-Minnesota as Amended and Restated on Jan. 25, 2019 NSP-Minnesota Form 10-K for the year endedDec. 31, 2018
001-31387 3.02
4.01* Supplemental and Restated Trust Indenture, dated May 1, 1988, from NSP-Minnesota to Harris Trust and Savings Bank, as Trustee, providing for the issuance of First Mortgage Bonds, Supplemental Indentures between NSP-Minnesota and said Trustee
Xcel Energy Inc. Form S-3 dated April 18,2018
001-03034 4(b)(3)
4.02* Supplemental Trust Indenture dated June 1, 1995, creating $250 million principal amount of 7.125% First Mortgage Bonds, Series due July 1, 2025
Xcel Energy Inc. Form 10-K for the year endedDec. 31, 2017
001-03034 4.11
4.03* Supplemental Trust Indenture dated March 1, 1998, creating $150 million principal amount of 6.5% First Mortgage Bonds, Series due March 1, 2028
Xcel Energy Inc. Form 10-K for the year endedDec. 31, 2017
001-03034 4.12
4.04* Supplemental Trust Indenture dated Aug. 1, 2000 (Assignment and Assumption of Trust Indenture) NSP-Minnesota Form 10-12G dated Oct. 5,2000
000-31709 4.51
4.05* Indenture, dated July 1, 1999, between NSP-Minnesota and Norwest Bank Minnesota, NA, as Trustee, providing for the issuance of Sr. Debt Securities
Xcel Energy Inc. Form S-3 dated April 18,2018
001-03034 4(b)(7)
4.06* Supplemental Indenture, dated Aug. 18, 2000, supplemental to the Indenture dated July 1, 1999, among Xcel Energy, NSP-Minnesota and Wells Fargo Bank Minnesota, NA, as Trustee (Assignment and Assumption of Indenture)
NSP-Minnesota Form 10-12G dated Oct. 5,2000
000-31709 4.63
4.07* Supplemental Trust Indenture dated July 1, 2005 between NSP-Minnesota and BNY Midwest Trust Company, as successor Trustee, creating $200 million principal amount of 5.25% First Mortgage Bonds, Series due July 15, 2035
NSP-Minnesota Form 8-K dated July 14, 2005 001-31387 4.01
4.08* Supplemental Trust Indenture dated May 1, 2006 between NSP-Minnesota and BNY Midwest Trust Company, as successor Trustee, creating $400 million principal amount of 6.25% First Mortgage Bonds, Series due June 1, 2036
NSP-Minnesota Form 8-K dated May 18, 2006 001-31387 4.01
4.09* Supplemental Trust Indenture, dated June 1, 2007, between NSP-Minnesota and BNY Midwest Trust Company, as successor Trustee
NSP-Minnesota Form 8-K dated June 19, 2007 001-31387 4.01
4.10* Supplemental Trust Indenture dated as of Nov. 1, 2009 between NSP-Minnesota and The Bank of New York Mellon Trust Co., NA, as successor Trustee, creating $300 million principal amount of 5.35% First Mortgage Bonds, Series due Nov. 1, 2039
NSP-Minnesota Form 8-K dated Nov. 16, 2009 001-31387 4.01
4.11* Supplemental Trust Indenture dated as of Aug. 1, 2010 between NSP-Minnesota and The Bank of New York Mellon Trust Company, NA, as successor Trustee, creating $250 million principal of 1.950% First Mortgage Bonds, Series due Aug. 15, 2015 and $250 million principal amount of 4.850% First Mortgage Bonds, Series due Aug. 15, 2040
NSP-Minnesota Form 8-K dated Aug. 4, 2010 001-31387 4.01
4.12* Supplemental Trust Indenture dated as of Aug. 1, 2012 between NSP-Minnesota and The Bank of New York Mellon Trust Company, NA, as successor Trustee, creating $300 million principal amount of 2.15% First Mortgage Bonds, Series due Aug. 15, 2022 and $500 million principal amount of 3.40% First Mortgage Bonds, Series due Aug. 15, 2042
NSP-Minnesota Form 8-K dated Aug. 13, 2012 001-31387 4.01
4.13* Supplemental Trust Indenture dated as of May 1, 2013 between NSP-Minnesota and The Bank of New York Mellon Trust Company, N.A., as successor Trustee, creating $400 million principal amount of 2.60% First Mortgage Bonds, Series due May 15, 2023
NSP-Minnesota Form 8-K dated May 20, 2013 001-31387 4.01
Northern States Power Company
NSPM 2019 SEC Form 10-K
Docket No. E002/GR-20-723Exhibit___(RLB-1), Schedule 10
Page 53 of 56

Table of Contents
54
4.14* Supplemental Trust Indenture dated as of May 1, 2014 between NSP-Minnesota and The Bank of New York Mellon Trust Company, N.A., as successor Trustee, creating $300 million principal amount of 4.125% First Mortgage Bonds, Series due May 15, 2044
NSP-Minnesota Form 8-K dated May 13, 2014 001-31387 4.01
4.15* Supplemental Indenture dated as of Aug. 1, 2015 between NSP-Minnesota and The Bank of New York Mellon Trust Company, N.A., as successor Trustee, creating $300 million principal amount of 2.20% First Mortgage Bonds, Series due Aug. 15, 2020 and $300 million principal amount of 4.00% First Mortgage Bonds, Series due Aug. 15, 2045
NSP-Minnesota Form 8-K dated Aug. 11, 2015 001-31387 4.01
4.16* Supplemental Trust Indenture dated as of May 1, 2016 between NSP-Minnesota and The Bank of New York Mellon Trust Company, N.A., as successor Trustee, creating $350 million principal amount of 3.600% First Mortgage Bonds, Series due May 15, 2046
NSP-Minnesota Form 8-K dated May 31, 2016 001-31387 4.01
4.17* Supplemental Indenture dated as of Sept. 1, 2017 between NSP-Minnesota and The Bank of New York Mellon Trust Company, N.A., as successor trustee, creating $600 million principal amount of 3.60% First Mortgage Bonds, Series due Sept. 15, 2047
NSP-Minnesota Form 8-K dated Sept. 13,2017
001-31387 4.01
4.18* Supplemental Trust Indenture dated as of Sept. 1, 2019 between Northern States Power Company and the Bank of New York Mellon Trust Company, N.A., as successor Trustee, creating $600 million principal amount of 2.90% First Mortgage Bonds, Series due March 1, 2050
NSP-Minnesota Form 8-K dated Sept. 10,2019
001-31387 4.01
10.01*+ Xcel Energy Inc. Nonqualified Pension Plan (2009 Restatement) Xcel Energy Inc. Form 10-K for the year endedDec. 31, 2008
001-03034 10.02
10.02*+ Xcel Energy Senior Executive Severance and Change-in-Control Policy (2009 Amendment and Restatement)
Xcel Energy Inc. Form 10-K for the year endedDec. 31, 2008
001-03034 10.05
10.03*+ Xcel Energy Inc. Non-Employee Directors Deferred Compensation Plan Xcel Energy Inc. Form 10-K for the year endedDec. 31, 2008
001-03034 10.08
10.04*+ Form of Services Agreement between Xcel Energy Services Inc. and utility companies Xcel Energy Inc. Form U5B dated Nov. 16,2000
001-03034 H-1
10.05*+ Xcel Energy Inc. Supplemental Executive Retirement Plan as amended and restated Jan. 1, 2009 Xcel Energy Inc. Form 10-K for the year endedDec. 31, 2008
001-03034 10.17
10.06* Restated Interchange Agreement dated Jan. 16, 2001 between NSP-Wisconsin and NSP-Minnesota NSP-Wisconsin Form S-4 dated Jan. 21, 2004 333-112033 10.01
10.07*+ First Amendment to Exhibit 10.02 dated Aug. 26, 2009 Xcel Energy Inc. Form 10-Q for the quarterended Sept. 30, 2009
001-03034 10.06
10.08*+ Xcel Energy Inc. Executive Annual Incentive Award Plan Form of Restricted Stock Agreement Xcel Energy Inc. Form 10-Q for the quarterended Sept. 30, 2009
001-03034 10.08
10.09*+ Xcel Energy Inc. Executive Annual Incentive Plan (as amended and restated effective Feb. 17, 2010) Xcel Energy Inc. Definitive Proxy Statementdated April 6, 2010
001-03034 Schedule14A
10.10*+ Stock Equivalent Plan for Non-Employee Directors of Xcel Energy Inc. as amended and restated effective Feb. 23, 2011
Xcel Energy Inc. Definitive Proxy Statementdated April 5, 2011
001-03034 Schedule14A
10.11*+ Xcel Energy Inc. Nonqualified Deferred Compensation Plan (2009 Restatement) Xcel Energy Inc. Form 10-K for the year endedDec. 31, 2008
001-03034 10.07
10.12*+ First Amendment to Exhibit 10.11 effective Nov. 29, 2011 Xcel Energy Inc. Form 10-K for the year endedDec. 31, 2011
001-03034 10.17
10.13*+ Second Amendment to Exhibit 10.02 dated Oct. 26, 2011 Xcel Energy Inc. Form 10-K for the year endedDec. 31, 2011
001-03034 10.18
10.14*+ First Amendment to Exhibit 10.09 dated Feb. 20, 2013 Xcel Energy Inc. Form 10-Q for the quarterended March 31, 2013
001-03034 10.01
10.15*+ Fourth Amendment to Exhibit 10.02 dated Feb. 20, 2013 Xcel Energy Inc. Form 10-Q for the quarterended March 31, 2013
001-03034 10.02
10.16*+ Second Amendment to Exhibit 10.11 dated May 21, 2013 Xcel Energy Inc. Form 10-K for the year endedDec. 31, 2013
001-03034 10.22
10.17*+ Stock Equivalent Program for Non-Employee Directors of Xcel Energy Inc. under the Xcel Energy Inc. 2015 Omnibus Incentive Plan
Xcel Energy Inc. Form 8-K dated May 20, 2015 001-03034 10.02
10.18*+ Fifth Amendment Exhibit 10.02 dated May 3, 2016 Xcel Energy Inc. Form 10-Q for the quarterended June 30, 2016
001-03034 10.01
10.19*+ Third Amendment to Exhibit 10.11 dated Sept. 30, 2016 Xcel Energy Inc. Form 10-Q for the quarterended Sept. 30, 2016
001-03034 10.01
10.20*+ Fourth Amendment to Exhibit 10.11 dated Oct. 23, 2017 Xcel Energy Inc. Form 10-Q for the quarterended Sept. 30, 2017
001-03034 10.1
10.21*+ Sixth Amendment to Exhibit 10.02 dated Feb. 22, 2018 Xcel Energy Inc. Form 10-K for the year endedDec. 31, 2017
001-03034 10.30
10.22*+ Seventh Amendment to Exhibit 10.02 dated May 7, 2018 Xcel Energy Inc. Form 10-Q for the quarterended June 30, 2018
001-03034 10.01
10.23*+ Xcel Energy Inc. Amended and Restated 2015 Omnibus Incentive Plan Xcel Energy Inc. Form 10-K for the year endedDec. 31, 2018
001-03034 10.34
10.24*+ Form of Xcel Energy Inc. 2015 Omnibus Incentive Plan Award Agreement Terms and Conditions under the Xcel Energy Inc. Amended and Restated 2015 Omnibus Incentive Plan
Xcel Energy Inc. Form 10-K for the year endedDec. 31, 2018
001-03034 10.35
10.25*+ Stock Program for Non-Employee Directors of Xcel Energy Inc. as Amended and Restated on Dec. 12, 2017 under the 2015 Omnibus Incentive Plan
Xcel Energy Inc. Form 10-K for the year endedDec. 31, 2018
001-03034 10.36
10.26* Third Amended and Restated Credit Agreement, dated as of June 7, 2019 among NSP-Minnesota, as Borrower, the several lenders from time to time parties thereto, JPMorgan Chase Bank, N.A., as Administrative Agent, Bank of America, N.A. and Barclays Bank Plc, as Syndication Agents, Wells Fargo Bank, National Association, MUFG Bank, Ltd., and Citibank, N.A., as Documentation Agents
Xcel Energy Inc. Form 8-K dated June 7, 2019 001-03034 99.02
Northern States Power Company
NSPM 2019 SEC Form 10-K
Docket No. E002/GR-20-723Exhibit___(RLB-1), Schedule 10
Page 54 of 56

Table of Contents
55
10.27*+ Form of Xcel Energy Inc. 2015 Omnibus Incentive Award Agreement Terms and Conditions under the Xcel Energy Inc. Amended and Restated 2015 Omnibus Incentive Plan
Xcel Energy Inc. Form 10-K for the year endedDec. 31, 2019
001-03034 10.33
23.01 Consent of Independent Registered Public Accounting Firm.31.01 Principal Executive Officer’s certification pursuant to 18 U.S.C. Section 1350, as adopted pursuant to Section 302 of the Sarbanes-Oxley Act of 2002.31.02 Principal Financial Officer’s certification pursuant to 18 U.S.C. Section 1350, as adopted pursuant to Section 302 of the Sarbanes-Oxley Act of 2002.32.01 Certification pursuant to 18 U.S.C. Section 1350, as adopted pursuant to Section 906 of the Sarbanes-Oxley Act of 2002.101.INS XBRL Instance Document - the instance document does not appear in the Interactive Data File because its XBRL tags are embedded within the Inline XBRL document
101.SCH XBRL Schema
101.CAL XBRL Calculation
101.DEF XBRL Definition
101.LAB XBRL Label
101.PRE XBRL Presentation
104 Cover Page Interactive Data File (formatted as Inline XBRL and contained in Exhibit 101)
SCHEDULE IINSP-Minnesota and Subsidiaries Valuation and Qualifying Accounts
Years Ended Dec. 31
Allowance for bad debts(Millions of Dollars) 2019 2018 2017Balance at Jan. 1 $ 23.5 $ 21.3 $ 20.0Additions charged to costs and expenses 13.0 16.2 15.7Additions charged to other accounts (a) 6.5 4.1 3.8Deductions from reserves (b) (20.0) (18.1) (18.2)Balance at Dec. 31 $ 23.0 $ 23.5 $ 21.3
(a) Recovery of amounts previously written off.(b) Deductions related primarily to bad debt write-offs.
ITEM 16 — FORM 10-K SUMMARY
None.
Northern States Power Company
NSPM 2019 SEC Form 10-K
Docket No. E002/GR-20-723Exhibit___(RLB-1), Schedule 10
Page 55 of 56

Table of Contents
56
SignaturesPursuant to the requirements of Section 13 or 15(d) of the Securities Exchange Act of 1934, the registrant has duly caused this annual report to be signed on its behalf by the undersigned thereunto duly authorized.
NORTHERN STATES POWER COMPANY (A MINNESOTA CORPORATION)
Feb. 21, 2020 /s/ ROBERT C. FRENZELRobert C. FrenzelExecutive Vice President, Chief Financial Officer and Director(Principal Financial Officer)
Pursuant to the requirements of the Securities Exchange Act of 1934, this report has been signed below by the following persons on behalf of the registrant and in the capacities on the date indicated above.
/s/ BEN FOWKE /s/ CHRISTOPHER B. CLARKBen Fowke Christopher B. ClarkChairman, Chief Executive Officer and Director President and Director(Principal Executive Officer)
/s/ ROBERT C. FRENZEL /s/ JEFFREY S. SAVAGERobert C. Frenzel Jeffrey S. SavageExecutive Vice President, Chief Financial Officer and Director Senior Vice President, Controller(Principal Financial Officer) (Principal Accounting Officer)
/s/ DAVID L. EVESDavid L. EvesExecutive Vice President, Group President, Utilities and Director
SUPPLEMENTAL INFORMATION TO BE FURNISHED WITH REPORTS FILED PURSUANT TO SECTION 15(D) OF THE ACT BY REGISTRANTS WHICH HAVE NOT REGISTERED SECURITIES PURSUANT TO SECTION 12 OF THE ACTNSP-Minnesota has not sent, and does not expect to send, an annual report or proxy statement to its security holder.
Northern States Power Company
NSPM 2019 SEC Form 10-K
Docket No. E002/GR-20-723Exhibit___(RLB-1), Schedule 10
Page 56 of 56

Northern States Power Company
Non-Regulated Business Activity Allocation Factors2021 Test Year Budget
Docket No. E002/GR-20-723Exhibit___(RLB-1), Schedule 11
Page 1 of 1
Allocation Allocation Method Reasonableness of Allocation Method Allocation PercentLabor Related Overhead Based on employee-related
expenses, office equipment, and supervision of the service provider.
This allocation represents the relationship between the costs to support labor with labor costs, and is applied to loaded labor.
13.5838%
Corporate Residual Two-Factor Allocator based on number of employees and revenues relative to NSPM totals.
This allocation represents a fair comparison of the non-regulated business' relative size to the total company and is applied to the prior year actual pool of expenses incurred on behalf of the corporation.
HomeSmart - 0.4930%Customer Owned Street Lighting - 0.0027%
Infowise - 0.0016%ConnectSmart - 0.0006%