direct versus indirect export channels: what determines ... · direct versus indirect export...
TRANSCRIPT
Direct Versus Indirect Export Channels:
What Determines the Decision?
(18.02.2014) Preliminary version, please do not quote without permision
Authors: Florian JohannsenA
Inmaculada Martínez-ZarzosoB,A
Affiliations: A Georg-August Universität Göttingen, Germany
B Universitat Jaume I, Spain
Abstract
This paper investigates the determinants of the decision to export indirectly using firm-level data
for 27 Eastern and Central European countries and 4 periods. According to the related theories, the
interaction between firm heterogeneity and fixed export costs is the main factor explaining this
decision (Ahn et al. 2011). The main hypothesis is that this decision is mostly affected by the
associated costs to export, which could be extremely high for small and medium firms (Bernard et
al. 2011; Zerihun, 2012). Hence, we expect to find higher indirect exports for firms that perceive
transportation, crime, legal system and corruption as severe obstacles. A probit and a fixed effect
models are estimated to investigate the determinants of the decision to export indirectly and the
determinants of the amount exported, respectively. The main results indicate that whereas
customs time influences the decision to export indirectly, it does not affect the amount exported
indirectly. The latter is mostly determined by the above-mentioned trade costs factors and also by
the size of the firm and the ownership structure. We also find in separate estimations for goods
and services that transportation and legal system constrains affect service exports to a greater
extent than good exports.
Key words: intermediaries, indirect exporting, Eastern Europe, Central Asia, uncertainty
JEL classification: F14, F15, L22, O24
ACorresponding Author. Chair of Economic Theory and Development Economics
Platz der Göttinger Sieben 3. 37073 Göttingen, Germany. Email: [email protected]
goettingen.de.

Table of Contents
I - Introduction 1
II – Empirical Analysis 3
II.I - Model Specification 6
III – Main Findings 8
III.I - Goods vs. Services 11
III.II – Robustness: Two-Stage Approach 14
IV - Conclusion 16
Bibliography 17
Appendix 19
Direct Versus Indirect Export Channels: What Determines the Decision?
I - Introduction
In the past two decades, there has been a growing interest in the study of the internationalization
strategies of firms (Bernard et al. 2003; Bernard & Jensen 2004). Three main modes of sales have
been considered in the related literature, namely domestic sales, direct exports and exports using
an intermediary (indirect exports). A first strand of papers focused on studying the determinants of
the choice between exporting or not, without paying attention to the choice between direct and
indirect exporting. In this line, according to the seminal paper by Melitz (2003) firms have to pay a
fixed entry cost to access foreign markets accompanied by variable trade costs when a product is
exported directly. If the fixed cost is high and expected sales are low, a firm is likely to serve only
the domestic market. The decision mainly depends on the productivity level of a firm in
comparison to other firms in the country. Only the most productive firms will select into exporting,
whereas the less productive firms will sell domestically. Trade liberalization will lead to reallocation
of firms within industries and to an increase in the average productivity.
As for the choice whether to export directly or indirectly, several factors have been identified in the
related literature influencing the decision. Specifically, intermediaries reduce search costs for the
producing firms (Spulber 1999), facilitate matching of sellers and buyers (Rubinstein & Wolinsky
1987) and can act as guarantor of quality (Biglaiser 1993). Studies that extend the model of Melitz
(2003) with intermediaries indicate that for less productive firms exporting, an option could be via
a middleman. Indirect exporting is assumed to have higher marginal costs, but lower or even no
fixed costs (Akerman 2010; Ahn et al. 2011; Felbermayr & Jung 2011; Crozet et al. 2013). Firms
tend to rely more on intermediaries when fixed costs are high or when destination markets are
small and higher-than-average productivity levels are needed to overcome lower profits.
Recent studies investigating the determinants of export behaviour with firm-level data find that
productivity of indirect exporters lies between productivity levels of direct and non-exporters
(McCann, 2012). McCann (2012) also finds strong evidence supporting the importance of
productivity as well as of other features and characteristics of wholesalers as determinants of the
export decision. According to Bernard et al. (2011), wholesalers in Italy are smaller than direct
exporting manufacturers and export a larger variety of products to less countries. They emphasize
1

the importance of intermediaries when firms are exporting to destinations with weak contracting
environments and when exporting homogeneous products. Crozet et al. (2013) find that French
wholesalers mainly serve countries with smaller market size and higher trade costs than the
average destination.
Abel-Koch (2011), using survey data for Turkey, shows that indirect exporters are mostly small
firms, producing low-quality goods, or introducing an entirely new product to foreign markets, but
other factors as foreign ownership or the existence of credit constraints do not influence the
decision of exporting indirectly. Also using survey data for firms in Sub-Saharan Africa, Zerihun
(2012) provides evidence showing that the decision to export indirectly is positively influenced by
firm size, being a subsidiary of a multi-plan firm and having access to information technology and
negatively affected by the firms' perceptions of obstacles in the form of corruption or access to
finance. McCann (2013) finds that in Eastern Europe and Central Asia single product firms are less
likely to export indirectly than multi-product firms, implying a mixing strategy of direct and indirect
exporting depending on the product and the destination market.
In the above-mentioned studies, little emphasis has been put on the role of perceived uncertainty
on the decision of exporting indirectly. To export directly a firm has to deal with several potential
obstacles that can induce additional costs of unforeseeable size. These include, among others,
foreign and domestic bureaucracy and corruption, customs proceedings, transportation and cross-
border financial transactions. Due to the uncertainty of these costs, risk averse firms may choose
to use a middleman in some markets in order to lower the overall exposure to uncertainty.
Specially in unstable foreign markets, firms will be willing to accept higher variable costs even if its
productivity level is above average. Risk averse firms may also want to test demand in a foreign
market using an intermediary first, before taking the decision to pay the fixed costs of entry for
direct exporting, especially when fixed costs are high or market potential is low.
We investigate the determinants of the decision to export directly or via intermediaries with a
special focus on the firms' perception of uncertainty that affects transaction costs. In particular,
factors such transportation impediments, crime, weak legal system and volatility in the exchange
rate are considered. To our knowledge, this is the first paper to investigate this issue with a larger
variety of measures used as proxies for perceived obstacles to trade. In addition we distinguish
between trade in goods and trade in services, because the characteristics of both activities are
2

different and could be affected by uncertainty in different ways. We focus on the Eastern Europe
and Central Asia for three reasons. First, the region is particularly interesting as it consists of many
highly integrated countries for historic reasons that share a similar cultural background with most
of their direct neighbours and have lower language barriers. Second, in these countries political
instability, corruption and criminality are well-known factors deterring a well-functioning market
economy. Finally, this is the first paper to focus in the effect of uncertainty on the
internationalization strategies of firms in Eastern Europe and Central Asia1.
We assume that the uncertainty is a greater threat to direct exporters and can be avoided by using
an intermediary. The modelling strategy consist on estimating a Probit model to investigate the
determinants of the decision to export indirectly and a fixed effects model to estimate the effects
on the intensity of the indirect exporting. As a robustness check we also estimate a two-stage
approach that consists on estimating the probability to export in the first step as a selection
equation and the share of indirect exports with respect to total exports in the second step
including elements of the first step to control for selection bias.
The main results suggest that firms with higher sales are less likely to make use of intermediaries
and export a smaller share of their exports indirectly. While perception of transportation and the
legal system as an obstacle and higher volatility in the exchange rate appears to increase the share
of indirect exports especially for services, crime has a similar effect on exports of goods.
The paper is structured as follows: section II analyses the data and explains the empirical
approach, section III presents the findings and section IV concludes.
II - Empirical Analysis
In this study we focus on the perception of obstacles to trade and their influence on the decision
to export directly or via an intermediary. In order to obtain the variables that will be used as
determinants of this decision we combine information from the World Bank Enterprise Business
Environment and Enterprise Performance Survey (BEEPS) with country specific information on
regional integration and volatility in the exchange rate of the different currencies with respect to
1 McCann (2013) also focuses on the Eastern Europe and Central Asia region. However, his main aim is different to
ours, in particular he gives descriptive evidence of the characteristics of indirect exporters and compares the
likelihood to export indirectly of single-product and multi-product firms and focus exclusively on manufacturing
firms, excluding the service sector from the analysis.
3

the Euro. Data on exchange rates comes from OANDA Corporation2. A description of the variables
is shown in Table II.1.
The dataset includes information taken from BEEPS for 27 countries over 4 years (2002, 2005, 2007
and 2009) and 18 sectors. A number of variables related to transaction costs and uncertainty are
selected from the surveys. In particular, foreign ownership, perception of transportation, customs,
crime and legal system as being an obstacle for the firm's activity, time needed to clear customs.
The surveys used stratified random sampling techniques to select a representative sample for each
country using industry, establishment size and region as levels of stratification.
Table II.2 presents a list of covered sectors and the share of firms that use intermediaries for at
least a part of their exports. Hence, we use a broad definition of indirect exports, which includes all
firms that export through an intermediary, also those using a mixed strategy with part of their
foreign sales exported directly3. Out of all exporters, most firms in our sample only export directly
2 OANDA.com.
3 We follow McCann (2013) in using the same definition of indirect exports. Although he first used a narrow
definition, he justifies the use of the broad definition in the core of his paper.
4
Table II.1: Variables
Variable Description Range
Dependent variable
share of indirect exports of total exports 0-100
Firm characteristics
natural logarithm of total sales 8-32
share of exported sales 1-100
=1 if a part of the firm is owned by foreign private individuals 0 or 1
perception of transportation as an obstacle 0=no obstacle - 4=very severe
perception of customs and trade regulation as an obstacle 0=no obstacle - 4=very severe
perception of crime, theft and disorder as an obstacle 0=no obstacle - 4=very severe
perception of the court system as fair, impartial and uncorrupted 1=agree - 4=disagree
number of av. days it tool for exported goods to clear customs 1=1 or less - 5=more than 20
Country variables
=1 if country j was a member of the EU in year t 0 or 1
=1 if country j was a member of the CEFTA in year t 0 or 1
measure for volatility in the exchange rate of j and the Euro in t-1
Indirectexportsijkt
ln Salesijkt
Exportintensityijkt
Foreignijkt
Transportationijkt
Customsijkt
Crimeijkt
Legalsystemijkt
Customstimeijkt
EUjt
CEFTAjt
Volatilityjt-1 0-0.47

and around 24 percent use also or exclusively an intermediary. The share varies across sectors
going from 11 percent for the IT-sector to 34 percent for hotels and restaurants.
Table II.2: Direct and Indirect Exporters
Table A1 in the Appendix shows the distribution of exporting firms for all sectors over all countries.
The largest sectors in the sample in terms of number of firms are food, wholesale and other
manufacturing. Concerning the countries in the sample, Bulgaria, Croatia and Slovenia are the
countries with the largest share of firms in the dataset. Summary statistics of firm and country
specific variables are displayed in Table II.3. The average share of exports over total sales is 42
percent, of which 17 percent on average are exported indirectly. About 26.5 percent of the firms
are at least partly foreign owned and while 36 percent are located in a member of the European
Union (EU), 31 percent are located in a member of the Central European Free Trade Agreement
(CEFTA).
5
Sector CodeAny indirect exports
TotalNo Yes %
Other manufacturing 2 338 139 29.14 477
Food 15 706 227 24.33 933
Texti les 17 110 37 25.17 147
Garments 18 245 103 29.60 348
Chemicals 24 98 35 26.32 133
Plasti cs & rubber 25 68 26 27.66 94
Non metallic mineral products 26 71 17 19.32 88
Basic metals 27 31 10 24.39 41
Fabricated metal products 28 286 92 24.34 378
Machinery and equipment 29 271 80 22.79 351
Electronics 31 67 19 22.09 86
Constructi on 45 162 32 16.49 194
Other services 50 230 39 14.50 269
Wholesale 51 401 120 23.03 521
Retail 52 180 57 24.05 237
Hotel and restaurants 55 69 36 34.29 105
Transport 60 322 118 26.82 440
IT 72 76 9 10.59 85
Total - 3731 1196 24.27 4927

Table II.3: Summary Statistics
II.I - Model Specification
The first part of our econometric approach consists on estimating a Probit model with country and
industry fixed effects to explain the probability of exporting indirectly. In a second step we
estimate a OLS-FE regression, using the share of indirect exports over total exports as dependent
variable. In addition, as a robustness we will use a 2-stage approach to correct for a potential
sample selection bias, which could be present due to the fact that we restrict our sample to
exporting firms only.
The specification of the Probit model used to predict indirect exports is given by,
Pr (IndirectExporter ijkt=1)=Φ (β0+β1 ln Sales ijkt+β2 Exportintensityijkt+β3 Foreignijkt+β4Transportationijkt )+β5 Customsijkt+β6Crime ijkt+β7 Legalsystemijkt+β8Corruptionijkt+β9Customstimeijkt+
β10 EU jt+β11CEFTA jt+β12Volatility jt−1+κ j+λkt+εijkt
(1)
where IndirectExporterijkt is a dummy variable that takes the value one if firm i in country j and
sector k exports a part of its foreign sales using an intermediary and zero if all exports are direct
exports. Firm specific variables include ln Salesijkt, which is the natural log of sales,
6
Variable Obs. Mean Std. Dev Min Max
dependent variable
4,927 17.206 34.601 0 100
f irm characterist ics
4,927 14.767 2.264 8.006 32.236
4,927 41.894 34.652 1 100
4,927 0.265 0.441 0 1
4,927 0.818 1.146 0 4
4,927 1.211 1.162 0 4
4,927 0.947 1.137 0 4
4,927 2.501 0.979 1 4
3,542 1.711 0.924 1 5
country specif ic variables
4,927 0.362 0.481 0 1
4,927 0.313 0.464 0 1
4,309 0.020 0.043 0 0.470
Indirectexportsijkt
ln Salesijkt
Export intensityijkt
Foreignijkt
Transportat ionijkt
Customsijkt
Crimeijkt
Legalsystemijkt
Customst imeijkt
EUjt
CEFTAjt
Volat ilityjt-1

Exportintensityijkt, that denotes the share of exported sales and Foreignijkt, which is dummy variable
that takes the value of one when a part of the firm is owned by a foreign individual or firm and
zero otherwise4. A firms' Perception of obstacles is captured by three different variables on a scale
from zero to four. First, for transportation (Transportationijkt), second for customs and trade
regulation (Customsijkt) and third for crime, theft and disorder (Crimeijkt). The perception of fairness
of the legal system is also measured on a scale from one to four (Legalsystemijkt), while for time
efficiency of customs authorities we use a scale from one to five (Customstimeijkt). We introduce
country specific dummy variables that take the value one if country j is member of the European
Union (EUjt) or the Central European Free Trade Agreement (CEFTAjt) in year t and a measure of
volatility for the nominal exchange rate of the domestic currency with the Euro (Volatilityjt-1). The
latter is defined as the standard deviation of the first difference of the logarithms of the monthly
domestic nominal exchange rate to the Euro for the twelve month of the past year:
Volatility jt−1=Std. dev. [ln (e j , m)−ln (e j ,m−1) ] ,m=1...12 . (2)
In a next step, we estimate the determinants of a firms' intensity of indirect exports with pooled
OLS:
Indirectexportsijkt=β0+β1 ln Salesijkt+β2 Exportintensity ijkt+β3 Foreignijkt+β4 Transportationijkt +β5Customsijkt+β6Crimeijkt +β7 Legalsystemijkt+β8Corruptionijkt+
β9 Customstimeijkt+β10 EU jt+β11 CEFTA jt+β12Volatility jt −1+κ j+λ kt+εijkt
, (3)
where the dependent variable is the share of indirect exports of total exports for firm i in year t. All
other variables are identical to the model in (1).
The previous two models assume that firms first decide whether or not to export and second
about the modality and that both decisions are independent from each other. Following the
approach of Heckman (1978), we estimate a 2-stage model that allows us to control for the sample
selection bias caused by ignoring non-exporters and by assuming that the error term in equation
(1) and (3) are independent.
In the first stage, we estimate a Probit model on the probability to export,
4 We are unable to include a measure of productivity in the model, as the World Bank firm-level data for the selected
region does not provide the number of employees for each firm, but only a discrete variable with 4 group-size
categories.
7

Pr (Exporter ijkt=1)=β0+β1 ln Sales ijkt+β2 Foreignijkt+β3 Transportationijkt+β4 Customsijkt
+β5 Crimeijkt+β6 Legalsystem ijkt+β7 EU jt+β8CEFTA jt+β9Volatility jt−1+κ j+λ kt+εijkt. (4)
The second stage is estimated using an OLS-FE model and is given by,
Indirectexportsijkt=β0+β1 ln Salesijkt+β2 Foreignijkt+β3 Transportationijkt+β4 Crime ijkt+β5 Legalsystem ijkt+β6 EU jt+β7 CEFTA jt+β8Volatility jt−1+ IMR+κ j+λkt+εijkt
. (5)
In order to fulfil the exclusion restriction, we use a variable that only affects the probability to
export, but not the intensity of indirect exporting. We estimate the second stage without the
variable measuring the perception of customs proceedings as an obstacle, which yields no
significant estimates when controlling for differences between countries in the sample.
In the second step regression, we include the inverse mills ratio (IMR) to the model in the second
stage. It is a correction for sample selection which addresses the biases generated by unobserved
shocks.
III - Main Findings
Results from the Probit estimation as denoted in equation (1) are shown in Table III.1. A number
of versions are estimated including different sets of fixed effects and control variables. Columns
(1) show the results from estimating the model with country, year and industry fixed effects, while
colunm (2) includes couuntry and industry-year fixed effects (as specified in model (1)). The
inclusion of the exchange rate volatility variable reduces the sample size considerably, hence for
comparison purposes the model is estimated in columns (3) and (4) with and without this variable
for the same sample. Finally in column (5) the variable customs time, for which there are many
missing observations is added.
According to our estimates, larger firms in terms of higher sales tend to have a lower probability to
export indirectly, whereas firms with a larger share of total sales going to non-domestic markets
are more likely to export using an intermediary. A possible explanation for the latter could be the
greater exposure to uncertainty concerning expected profits when exporting directly, which
increases when exporting a lot. The use of an intermediary lowers uncertainty as it only involves
higher variable costs. In particular, A 10 percentage points increase in overall export intensity of a
firm increases the probability to use an intermediary by 0.5 percent according to column (2). A 10
percent increase in total sales decreases the probability to use an intermediary by 8 percent
8

(column 2). The estimates turn out to be positive and insignificant when a variable controlling for
the time to clear customs is included in the model, this is probably due to the fact that the
inclusion of this variable considerably reduces the number of observations (by around one fifth).
Foreign ownership decreases the probability of export indirectly by 7 percentage points. This fact
could be explained by the lower fixed costs of exporting or accessing to the owners international
network. While potential obstacles like transportation, crime and the legal system lower the
probability to export directly significantly, customs impediments does not show a statistically
significant effect. A 1 point increase in the perception of the severity increases the probability of
indirect exporting by around 2 percentage points for transportation, 1.4 percentage points for
crime and 1.5 percentage points for the legal system. Longer time to clear customs and volatility in
the exchange rate also increase the probability of exporting indirectly. Although the decision for
the mode of export appears to be affected significantly by the perception of uncertainty in various
fields, we do not find any significant effects of membership in EU or CEFTA on the probability to
use an intermediary.
9

Table III.1: Regression Results - Probability to Export Indirectly
OLS regression estimates of model (3), with the share of indirect exports as the dependent variable
are provided in Table III.2. The main results are in general similar to the ones of the previous model
in terms of sing and significance level. The main difference is that estimates for country specific
dummy variables for EU and CEFTA membership yield significant results indicating that
membership in either of the two agreements decreases the share of indirect exports. This can be
attributed to economic integration facilitating export procedures and thereby lowering fixed costs
of exporting, which in turn affect mainly direct exporting. The effect is larger for the EU with a
decrease in the share of indirect exports of around 11 percentage points (column (2)) than for
CEFTA with a decrease of around 5 percentage points.
10
(1) (2) (3) (4) (5)
-0.0084** -0.0084** -0.0168*** -0.0172*** 0.000467
(0.00336) (0.00342) (0.00399) (0.00400) (0.00330)
0.00050*** 0.00050*** 0.00072*** 0.00072*** 0.00099***
(0.000191) (0.000192) (0.000210) (0.000210) (0.000177)
-0.0699*** -0.0734*** -0.0673*** -0.0656*** -0.0370***
(0.0137) (0.0137) (0.0152) (0.0152) (0.0127)
0.0190*** 0.0186*** 0.0178*** 0.0177*** 0.0191***
(0.00590) (0.00591) (0.00636) (0.00635) (0.00543)
0.00444 0.00404 0.00501 0.00511 0.00179
(0.00601) (0.00603) (0.00650) (0.00650) (0.00572)
0.0147** 0.0146** 0.0137** 0.0133** 0.0103*
(0.00577) (0.00580) (0.00630) (0.00630) (0.00540)
0.0138** 0.0148** 0.0177** 0.0174** 0.00979
(0.00700) (0.00704) (0.00776) (0.00776) (0.00671)
-0.0558 -0.0672 -0.0431 -0.00419 0.00409
(0.0506) (0.0510) (0.0698) (0.0761) (0.0522)
-0.0127 -0.0196 0.0129 0.0580 0.00732
(0.0353) (0.0358) (0.0520) (0.0600) (0.0349)
- - - -0.0172***
(0.00634)
- - -0.454**
-(0.206)
Year Dummies Yes No No No No
Industry Dummies Yes No No No No
Country Dummies Yes Yes Yes Yes Yes
No Yes Yes Yes Yes
Observat ions 4,927 4,925 4,296 4,296 3,419
R^2 0.0444 0.0525 0.0554 0.0565 0.0729
lg Salesijkt
Export intensityijkt
Foreignijkt
Transportat ionijkt
Customsijkt
Crimeijkt
Legalsystemijkt
EUjt
CEFTAjt
Customst imeijkt
Volat ilityjt-1
Year-Industry Dum.
Notes: Reported values are marginal ef fects at the mean of the independent
variables; Robust standard errors in parentheses; *** p<0.01, ** p<0.05, *
p<0.1; Sample in (3) is reduced to the same observat ions as used in (4).

Both variables turn insignificant when controls for exchange rate volatility and time to clear
customs are added to the model. However, we are able to show in column (3), which shows
insignificant estimates for both agreements, that this is due to the reduction in observations and
not to the inclusion of the additional variables. Column (3) includes the same variables included
column (2), but reducing the number of observations to match column (4). While the effect of
higher export intensity is positive and highly significant for the probability to export indirectly, it is
only significant at the 10 percent level and mostly negative for the share of indirect exports.
Table III.2: Regression Results - OLS_FE on the Share of Indirect Exports
11
(1) (2) (3) (4) (5)
-1.226*** -1.194*** -1.848*** -1.889*** -0.0191
(0.286) (0.290) (0.327) (0.328) (0.187)
-0.0288* -0.0290* -0.0180 -0.0186 0.0325***
(0.0151) (0.0152) (0.0166) (0.0166) (0.00933)
-4.777*** -5.042*** -4.103*** -3.913*** -1.964***
(1.090) (1.096) (1.188) (1.190) (0.638)
1.290** 1.218** 1.181** 1.178** 0.788**
(0.514) (0.514) (0.542) (0.541) (0.320)
-0.223 -0.228 -0.300 -0.287 0.0946
(0.487) (0.489) (0.524) (0.524) (0.313)
1.221** 1.221** 1.113** 1.074** 0.385
(0.492) (0.492) (0.529) (0.529) (0.302)
1.048* 1.047* 1.132* 1.116* 0.552*
(0.559) (0.564) (0.620) (0.620) (0.335)
-10.74*** -11.74*** -8.322 -5.616 -2.478
(3.950) (4.035) (5.071) (5.106) (2.433)
-4.638* -5.027* -1.705 1.516 -1.571
(2.619) (2.679) (3.491) (3.571) (1.513)
- - - -0.692*
(0.357)
- - -41.94***
-(16.22)
Constant27.12*** 40.19*** 50.67*** 50.47*** -6.168*
(5.403) (12.38) (17.36) (17.35) (3.420)
Year Dummies Yes No No No No
Industry Dummies Yes No No No No
Country Dummies Yes Yes Yes Yes Yes
No Yes Yes Yes Yes
Observat ions 4,927 4,927 4,309 4,309 3,542
R^2 0.050 0.059 0.064 0.066 0.047
ln Salesijkt
Export intensityijkt
Foreignijkt
Transportat ionijkt
Customsijkt
Crimeijkt
Legalsystemijkt
EUjt
CEFTAjt
Customst imeijkt
Volat ilityjt-1
Year-Industry Dum.
Notes: Robust standard errors in parentheses; *** p<0.01, ** p<0.05, *
p<0.1; Sample in (3) is reduced to the same observat ions as used in (4).

III.I - Goods versus Services
The used dataset covers firms producing goods and services and both are very different in terms of
export procedures. For this reason we present in this section separate estimates for each type of
firms. In this way we will be able to analyse the differences in the impact of perception of
uncertainty on the decision to export indirectly between both sets of exporters. Therefore, we
estimate the models (1) and (3) separately for goods and services with the same specification as in
column (2) and (4) in Table III.1 and Table III.2 to be able to compare the estimates. Table III.3
shows the results for goods in columns with uneven numbers and for services in columns with
even numbers. The table is divided into two parts. The first show the results of estimating model
(3) and the second model (1).
According to the results shown in columns (1) and (2) of Table III.3 for goods and services,
respectively and for the whole sample, export intensity has a significant negative impact on the
share of indirectly exported services, whereas the effect for goods is non-significant. Foreign
ownership promotes direct exports only of goods, but not for services. As regards the regional
integration dummies, EU membership decreases indirect export intensity to a very similar extent
for goods and services, while CEFTA membership does so only for services. The effect of volatility in
the exchange rate to the Euro, shown in column (4), increases the probability of indirect exports
for services only, but no effect is found for goods. A similar outcome is obtained for the legal-
system variable, which only show a positive and significant estimate for indirect exports of
services. While perception of crime as an obstacle has a significant impact on the probability to
export directly and their volume of goods, Transportation has a higher and more significant impact
on the choice of the export channel for services than for goods.
Summarizing, determinants of the probability to export indirectly differ to some extent for goods
and services. While the perception of crime as an obstacle appears to be more important for trade
in goods, exports of services are more affected by uncertainty related to future revenues
(exchange rate volatility) and to a well-functioning legal system. The first outcome seems intuitive
when considering crime in the form of physical theft of goods. The latter could be due to
peculiarities of the service sectors in general that make it more vulnerable to fluctuations in the
exchange rate. For instance, infrequent use of indirect hedging as less inputs are needed in the
production process of services or more difficult access to financial hedging due to a lack of assets
12

could be some of the reasons. Furthermore, transportation is a greater concern for firms in the
service sector. Than for firms in goods sectors A likely explanation is that services are frequently
non-traded goods and often provided in locations close to the customer. In such a case,
transportation obstacles could be a serious concern. For exports in goods instead, transport is
usually taken care of by a logistics company, which is in turn the one affected by obstacles with
regard to the transportation of goods. From the perspective of the firm, these obstacles do
increase the costs of exporting and thereby affect the decision to export5. But as transporting the
goods is not a direct issue the firm have to deal with, perception of transportation as an obstacle
might be seen only with reference to transportation conducted by the firm itself. Results may look
different for questions regarding the perception of other trade costs as an obstacle, different form
transportation. Unfortunately, questions going in this direction are not included in the survey of
the World Bank.
5 See section III.II for the impact of the perception of transportation as an obstacle on the decision to export at all.
13

Table III.4: Regression Results - Goods versus Services
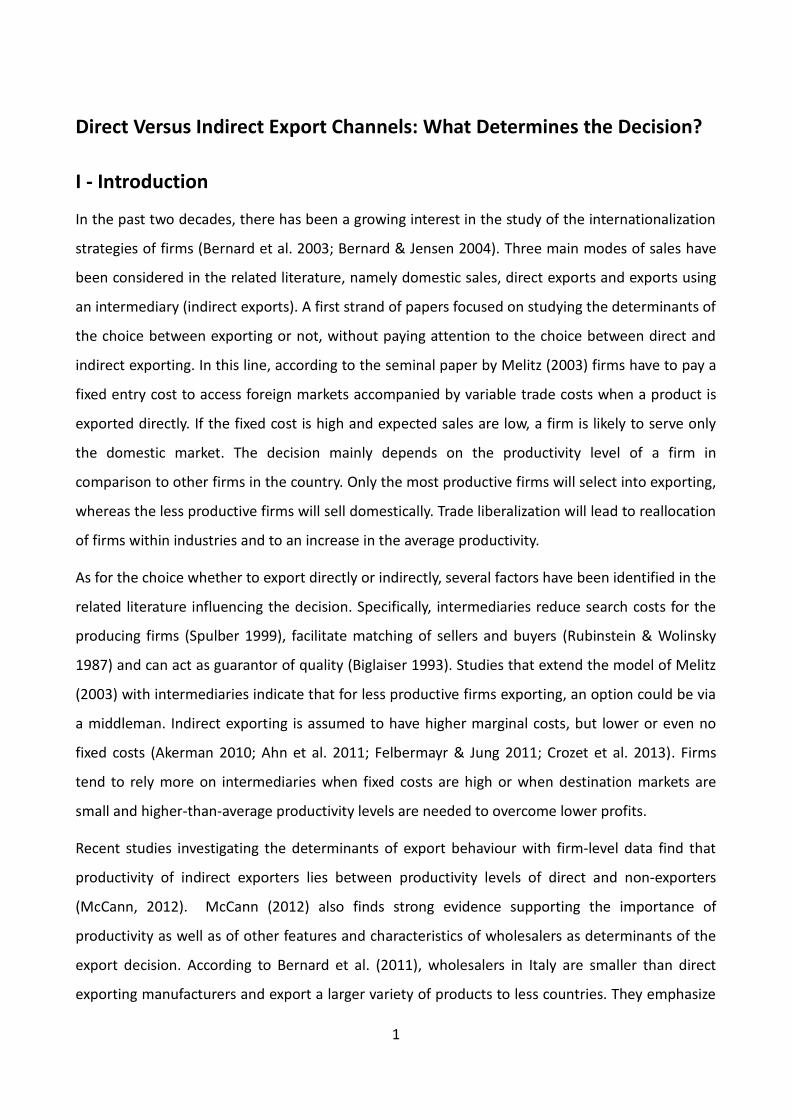
In order to assess the relative importance of each of the variables in model (5) in comparison to
our measure of exchange rate volatility, we present beta coefficients in Table III.5. Beta coefficients
are measured in standard deviations and therefore the magnitude of the coefficients can be
compared also for variables measured in different units. As shown in column (1), which contains
the beta coefficients for the model in Table III.2 column (2), a one standard deviation increase in
export intensity decreases the share of indirect exports on total exports by 0.0187 standard
deviations. Beta coefficients based on models estimated on Table III.4 columns (3) and (4) indicate
the relative importance of sales for goods and services, respectively and of foreign ownership for
14
(1) (2) (3) (4) (5) (6) (7) (8)
OLS OLS OLS OLS
Goods Services Goods Services Goods Services Goods Services
-1.306*** -1.290*** -2.117*** -1.699*** -0.0101** -0.00760 -0.0192*** -0.0149**
(0.385) (0.458) (0.433) (0.509) (0.00461) (0.00526) (0.00540) (0.00609)
-0.00396 -0.0710*** 0.0125 -0.0774*** 0.00062** 0.000290 0.00088*** 0.000359
(0.0190) (0.0255) (0.0204) (0.0287) (0.000243) (0.000322) (0.000263) (0.000362)
-7.415*** -2.189 -6.429*** -0.418 -0.105*** -0.0357 -0.0987*** -0.0204
(1.369) (1.878) (1.453) (2.074) (0.0173) (0.0223) (0.0189) (0.0256)
0.805 1.809** 0.857 1.629* 0.0132* 0.0266*** 0.0141* 0.0226**
(0.622) (0.900) (0.653) (0.948) (0.00754) (0.00958) (0.00807) (0.0103)
-0.750 0.632 -0.637 0.376 -0.000216 0.00890 0.00188 0.00816
(0.631) (0.779) (0.668) (0.852) (0.00783) (0.00942) (0.00838) (0.0104)
1.969*** -0.148 1.733*** -0.182 0.0218*** 0.00247 0.0192** 0.00443
(0.622) (0.809) (0.666) (0.870) (0.00744) (0.00927) (0.00803) (0.0102)
0.475 1.825** 0.677 1.876* 0.0115 0.0180* 0.0169* 0.0178
(0.730) (0.894) (0.794) (1.001) (0.00921) (0.0109) (0.0101) (0.0122)
-11.36** -11.07* -8.714 -2.120 -0.0617 -0.0414 -0.0593 0.0912
(5.389) (6.294) (6.860) (8.049) (0.0708) (0.0768) (0.0985) (0.127)
-2.535 -7.728* 0.465 3.329 0.0139 -0.0472 0.0286 0.108
(3.650) (4.066) (5.220) (5.161) (0.0512) (0.0516) (0.0796) (0.0950)
- -6.117 85.45***
- --0.0783 0.984***
(20.85) (24.05) (0.321) (0.294)
Constant42.76*** 22.27** 54.11*** 22.83**
- - - -(12.97) (8.970) (18.12) (9.895)
Observations 3,076 1,851 2,690 1,619 3,076 1,843 2,690 1,600
R^2 0.062 0.076 0.072 0.084 0.0525 0.0712 0.0588 0.0751
Probit Probit Probit Probit
lg Salesijkt
Exportintensityijkt
Foreignijkt
Transportationijkt
Customsijkt
Crimeijkt
Legalsystemijkt
EUjt
CEFTAjt
Volatilityjt-1
Notes: Reported values for probit regressions are marginal effects at the mean of the independent variables;
Robust standard errors in parentheses; *** p<0.01, ** p<0.05, * p<0.1. Country and year-industry fixed effects
included in all regressions.
goods (column 2, Table III.5) in explaining the share of intermediated exports and show the large
impact of exchange rate volatility on services (column 3).
Table III.5: Beta Coefficients
III.II - Robustness: Two-Stage Approach
Estimates for the 2-stage approach are presented in Table III.6. The first stage uses as dependent
variable the probability to export and the second stage the share of indirect exports. While sales
and foreign ownership increase a firms' probability to export and decreases the share of indirect
exports, stronger perception of crime and transportation as an obstacle decreases the probability
to export and increases the share of intermediated exports. The quality of the legal system only
seems to affect the choice of the export mode by promoting direct exports, but it does not seem
to affect the decision to export. Surprisingly, the variable customs proceedings shows a significant
and positive effect on the probability to export, indicating that when customs proceedings are
seeing as mayor obstacle, firms are more likely to export. Apparently, only firms that do export see
customs proceedings as a problem. As explained in Section II, we exclude the latter variable from
the second stage to fulfil the exclusion restriction.
15
(1) (2) (3)
OLS OLS OLS
All Goods Services
-0.123 -0.136 -0.111
-0.0187 0.0127 -0.0723
-0.0797 -0.125 -0.0297
0.0209 0.00629 0.0470
-0.0492 -0.0815 -0.00518
0.0396 0.0290 0.0539
-0.00965 -0.0216 0.0124
0.0355 0.0577 -0.00593
0.0315 0.0190 0.0534
0.0521 0.00712 0.116
Year Dummies No No No
Industry Dummies No No No
Country Dummies Yes Yes Yes
Yes Yes Yes
Observati ons 4,309 2,690 1,619
R^2 0.066 0.072 0.084
Notes: Reported values are beta coeffi cients.
ln Salesijkt
Exporti ntensityijkt
Foreignijkt
Transportati onijkt
Customsijkt
Crimeijkt
Legalsystemijkt
EUjt
CEFTAjt
Volati lityjt-1
Year-Industry Dum.

Euro and CEFTA dummies as controls for economic and trade integration have a significant positive
impact on the probability to the export of 12 and 6 percentage points and decrease the share of
intermediated exports by 12 and 5 percent. Both variables turn insignificant when the measure of
exchange rate volatility to the Euro is introduced. While volatility has no significant impact on the
probability to export, it increases the share of indirect exports. The fact that the Inverse Mills Ratio
is insignificant in the second stage indicates that there is no evidence that a selection bias is
present.
Table III.6: Regression Results - Heckman 2-Stage
16
(1) (2) (3) (4)
OLS OLS
0.0646*** -1.711*** 0.1377*** -0.969**
(0.00241) (0.489) (0.00200) (0.419)
0.173*** -3.640*** 0.197*** -4.518***
(0.0141) (1.399) (0.0125) (1.417)
-0.00996** 1.113** -0.00807** 1.181**
(0.00418) (0.511) (0.00375) (0.485)
0.0678***-
0.0638***-
(0.00403) (0.00355)
-0.0290*** 0.973* -0.0311*** 1.090**
(0.00388) (0.535) (0.00349) (0.503)
0.00711 1.151* 0.00262 1.093*
(0.00481) (0.619) (0.00423) (0.563)
-0.0139 -6.084 0.123*** -11.86***
(0.0423) (5.104) (0.0333) (4.067)
-0.0450 1.287 0.0632*** -5.007*
(0.0305) (3.564) (0.0222) (2.712)
-0.194 38.99**- -
(0.136) (16.88)
Inverse Mills Ratio --6.499
--6.880
(7.151) (6.651)
Constant-
48.32***-
36.88***
(18.38) (13.30)
Country Dummies Yes Yes Yes Yes
Yes Yes Yes Yes
Observations 13,645 4,309 16,327 4,927
R^2 0.280 0.066 0.273 0.059
1st Stage 2nd Stage 1st Stage 2nd Stage
Probit Probit
lg Salesijkt
Foreignijkt
Transportationijkt
Customsijkt
Crimeijkt
Legalsystemijkt
EUjt
CEFTAjt
Volatilityjt-1
Year-Industry Dum.
Notes: Reported values for probit regressions are marginal effects at
the mean of the independent variables; Robust standard errors in
parentheses; *** p<0.01, ** p<0.05, * p<0.1.
IV - Conclusion
Although being vague in its' nature, uncertainty, measured as the perceived severity of obstacles,
appears to play an important role in explaining a firms' choice between direct and indirect
exporting and seems to have a slightly different impact for goods and services.
Firms that are large, foreign owned and export a higher share of their production prefer direct
exporting, while uncertainty in different fields makes firm prefer the use of intermediaries. In
particular, the perception of potential threats like criminality, problems with the transport
infrastructure or the legal system have a significant impact on the mode of export. Furthermore,
we show that uncertainty about future revenues due to volatility in the domestic exchange rate
increases the share of indirect exports on total exports for services, but has no significant impact
on exports of goods. We could also show that our results are not driven by sample selection bias
and the inclusion of various controls confirms its robustness.
Finally, our findings highlight the importance of intermediaries in countries where firms perceive
challenges in the business environment that increase the level of uncertainty and in turn the fixed
costs of exporting. Lowering perceived uncertainty as well as improving conditions for
intermediaries would help domestic firms with their exporting activities.
17

Bibliography
Abel-Koch, J., 2011. Who uses intermediaries in international trade? Evidence from firm-level
survey data. Globalisation, Productivity and Technology Research Paper Series (University of
Nottingham), 25.
Ahn, J., Khandelwal, A.K. & Wei, S.-J., 2011. The role of intermediaries in facilitating trade. Journal
of International Economics, 84(1), pp.73–85.
Akerman, A., 2010. A Theory on the Role of Wholesalers in International Trade based on
Economies of Scope. Research Papers in Economics, 1.
Bernard, A.B. et al., 2003. Plants and Productivity in International Trade. American Economic
Review, 93(4), pp.1268–1290.
Bernard, A.B., Grazzi, M. & Tomasi, C., 2011. Intermediaries in International Trade: Direct versus
indirect modes of export. NBER Working Paper Series, 17711.
Bernard, A.B. & Jensen, J.B., 2004. Why Some Firms Export. The Review of Economics and
Statistics, 86(2), pp.561–569.
Biglaiser, G., 1993. Middlemen as Experts. RAND Journal of Economics, 24(2), pp.212–223.
Crozet, M., Lalanne, G. & Poncet, S., 2013. Wholesalers in international trade. European Economic
Review, 58, pp.1–17.
Felbermayr, G. & Jung, B., 2011. Trade Intermediation and the Organization of Exporters. Review of
International Economics, 19(4), pp.634–648.
Heckman, J., 1979. Sample selection bias as a specification error. Econometrica, pp. 153-161.
McCann, F., 2013. Indirect Exporters. Journal of Industry, Competition and Trade, 13(4), pp.519–
535.
Melitz, M.J., 2003. The Impact of Trade on Intra-Industry Reallocations and Aggregate Industry
Productivity. Econometrica, 71(6), pp.1695 – 1725.
18

Rubinstein, A. & Wolinsky, A., 1987. Middlemen. The Quarterly Journal of Economics, 102(3),
pp.581–93.
Spulber, D.F., 1999. Market Microstructure, Cambridge University Press.
Zerihun, S., 2012. A Firm’s Choice Between Direct and Indirect Export Channel of Exports by: A
Study of Manufacturing Firms in Sub Saharan African Economies.
19

Appendix
Table A1: Covered Countries and Sectors
20
Country Sector
2 15 17 18 24 25 26 27 28 29 31 45 50 51 52 55 60 72 All %
Albania 10 25 9 5 3 0 1 3 3 0 0 2 6 12 3 16 28 0 126 2.56
Belarus 15 29 4 4 3 2 3 0 3 4 0 18 2 24 3 2 29 1 146 2.96
Georgia 4 29 2 1 1 0 3 1 0 1 0 3 9 6 5 0 10 0 75 1.52
Tajikistan 6 18 9 4 3 2 2 1 0 1 1 2 2 13 1 0 1 0 66 1.34
Ukraine 26 61 5 26 6 0 2 0 10 51 1 4 23 22 4 6 24 1 272 5.52
Uzbekistan 6 36 6 3 6 2 3 0 0 7 1 0 7 7 0 0 8 1 93 1.89
Russia 24 46 3 4 31 3 1 4 11 38 8 10 8 13 2 1 12 0 219 4.44
Poland 19 49 6 39 2 11 6 3 43 34 2 14 12 37 8 2 40 5 332 6.74
Romania 16 24 3 45 3 2 5 3 17 20 0 2 7 9 6 9 16 3 190 3.86
Serbia 29 36 12 5 8 5 3 2 17 7 2 12 13 28 18 5 21 2 225 4.57
Kazakhstan 7 42 0 2 2 0 1 0 4 9 2 5 4 15 0 0 2 0 95 1.93
Moldova 9 47 2 15 0 0 2 0 15 2 1 0 7 12 13 1 15 0 141 2.86
Bosnia 35 17 1 6 2 4 2 2 13 9 0 19 4 18 6 4 15 0 157 3.19
Azerbaijan 2 12 2 1 1 0 0 0 0 2 0 3 0 2 1 1 1 0 28 0.57
FYROM 26 16 6 24 4 0 5 2 6 3 2 13 2 20 11 2 21 2 165 3.35
Armenia 8 56 3 8 5 5 3 1 3 6 1 0 5 5 0 1 7 3 120 2.44
Kyrgyz 8 23 9 1 1 1 3 0 2 2 1 2 4 10 1 0 6 0 74 1.50
Estonia 33 22 3 6 1 3 3 0 7 3 3 12 16 17 13 9 18 2 171 3.47
Czech Republic 28 37 2 1 4 7 4 6 16 15 5 7 22 24 14 2 20 5 219 4.44
Hungary 16 43 7 20 4 10 5 5 69 33 3 14 12 31 17 8 16 0 313 6.35
Latvia 25 35 0 7 0 0 1 0 3 1 0 7 13 17 11 2 20 0 142 2.88
Lithuania 28 35 11 5 1 3 4 0 3 7 4 7 11 27 18 2 31 0 197 4.00
Slovakia 12 26 1 4 5 2 1 4 7 14 1 11 26 24 12 2 15 2 169 3.43
Slovenia 23 44 8 3 6 10 6 2 28 28 3 16 28 42 38 11 32 7 335 6.80
Bulgaria 22 63 12 83 25 15 7 1 23 40 36 3 13 40 10 3 18 49 463 9.40
Croati a 37 62 21 26 6 7 11 1 73 14 9 8 13 44 19 16 14 1 382 7.75
Montenegro 3 0 0 0 0 0 1 0 2 0 0 0 0 2 3 0 0 1 12 0.24
Total 477 933 147 348 133 94 88 41 378 351 86 194 269 521 237 105 440 85 4927 100
% 9.68 18.9 2.98 7.06 2.7 1.9 1.79 0.8 7.67 7.12 1.7 3.94 5.46 10.6 4.81 2.13 8.93 1.7 100
Notes: Sectors 45-72 are considered as selling services.

21
Table A2: Correlation
1.000 0.037 0.055 -0.039 0.083 0.018 0.046 -0.006 0.022 0.007 0.050 0.003
0.037 1.000 0.008 0.078 0.142 0.022 0.067 0.001 0.116 -0.105 0.040 0.014
0.055 0.008 1.000 0.145 0.003 0.004 -0.036 -0.028 0.044 -0.012 -0.013 -0.054
-0.039 0.078 0.145 1.000 -0.003 0.053 -0.057 0.024 -0.022 0.044 -0.024 -0.008
0.083 0.142 0.003 -0.003 1.000 0.353 0.261 -0.136 0.035 0.095 0.095 0.050
0.018 0.022 0.004 0.053 0.353 1.000 0.239 -0.112 -0.155 0.308 0.162 0.112
0.046 0.067 -0.036 -0.057 0.261 0.239 1.000 -0.136 -0.030 0.152 0.091 0.069
-0.006 0.001 -0.028 0.024 -0.136 -0.112 -0.136 1.000 0.067 -0.071 -0.051 -0.087
-0.027 -0.172 0.050 -0.033 -0.093 -0.006 -0.076 0.061 -0.566 -0.011 -0.161 -0.128
0.007 -0.105 -0.012 0.044 0.095 0.308 0.152 -0.071 -0.232 1.000 0.109 0.115
0.050 0.040 -0.013 -0.024 0.095 0.162 0.091 -0.051 -0.022 0.109 1.000 0.036
0.003 0.014 -0.054 -0.008 0.050 0.112 0.069 -0.087 -0.208 0.115 0.036 1.000
Indirectexportsijkt
lg Salesijkt
Export intensityijkt
Foreignijkt
Transportat ionijkt
Customsijkt
Crimeijkt
Legalsystemijkt
Corrupt ionijkt
EUjt
CEFTAjt
Volat ilityjt-1
Indirectexportsijkt
lg Salesijkt
Export intensityijkt
Foreignijkt
Transportat ionijkt
Customsijkt
Crimeijkt
Legalsystemijkt
Customst imeijkt
EUjt
CEFTAjt
Volat ilityjt-1