directory of coal mines in illinois - isgs.illinois.edu · directory of coal mines in illinois...
TRANSCRIPT


DIRECTORY OF COAL MINES IN ILLINOIS7.5-MINUTE QUADRANGLE SERIESNEWTON QUADRANGLEJASPER COUNTY
Jennifer M. Obrad & C. Chenoweth
2011
Prairie Research InstituteWilliam W. Shilts, Executive DirectorILLINOIS STATE GEOLOGICAL SURVEYE. Donald McKay III, Director
Natural Resources Building615 East Peabody DriveChampaign, Illinois 61820
Phone 217-244-4610Fax 217-333-2830

This material is based upon work supported by the Illinois Department of Transportation. Any opinions,findings, and conclusions or recommendations expressed in this publication are those of the authors and donot necessarily reflect the views of the Illinois Department of Transportation.
Cover photo Track-mounted duckbill loading machine at a Peabody Coal Company mine, ca. 1915.
DISCLAIMER: The accuracy and completeness of mine maps and directories vary with the availability ofreliable information. Maps and other information used to compile this mine map and directory were obtainedfrom a variety of sources and the accuracy of some of the original information cannot be verified. Consequently, the Illinois State Geological Survey (ISGS) cannot guarantee the mine maps are free of errorsand disclaims any responsibility for damages that may result from actions or decisions based on them.
The ISGS updates the maps and directories periodically, and welcomes any new information or corrections. Please contact the Coal Section of the ISGS at the address shown on the title page of this directory, ortelephone (217) 244-4610.
© 2011 The Board of Trustees of the University of Illinois. All rights reserved.For permission information, contact the Illinois State Geological Survey.

CONTENTS
INTRODUCTION . . . . . . . . . . . . . . . . . . . . . . . . . . . . . . . . . . . . . . . . . . . . . . . . . . . . . . . . . . . . . . . . . . . . . . . . . . . . . . . . 1
MINING IN THE NEWTON QUADRANGLE . . . . . . . . . . . . . . . . . . . . . . . . . . . . . . . . . . . . . . . . . . . . . . . . . . . . . . . . . . . . 1
PART I EXPLANATION OF MAP AND MINE SUMMARY SHEET . . . . . . . . . . . . . . . . . . . . . . . . . . . . . . . . . . . . . . . . . . 2INTERPRETING THE MAP . . . . . . . . . . . . . . . . . . . . . . . . . . . . . . . . . . . . . . . . . . . . . . . . . . . . . . . . . . . . . . . . . . . . . . 2
Mine Type and Mining Method . . . . . . . . . . . . . . . . . . . . . . . . . . . . . . . . . . . . . . . . . . . . . . . . . . . . . . . . . . . . . . . . . 2Source Maps . . . . . . . . . . . . . . . . . . . . . . . . . . . . . . . . . . . . . . . . . . . . . . . . . . . . . . . . . . . . . . . . . . . . . . . . . . . . . . . 3Points and Labels . . . . . . . . . . . . . . . . . . . . . . . . . . . . . . . . . . . . . . . . . . . . . . . . . . . . . . . . . . . . . . . . . . . . . . . . . . . 3
INTERPRETING A MINE SUMMARY SHEET . . . . . . . . . . . . . . . . . . . . . . . . . . . . . . . . . . . . . . . . . . . . . . . . . . . . . . . . 6
REFERENCES . . . . . . . . . . . . . . . . . . . . . . . . . . . . . . . . . . . . . . . . . . . . . . . . . . . . . . . . . . . . . . . . . . . . . . . . . . . . . . . . . . 8
PART II DIRECTORY OF MINES IN THE NEWTON QUADRANGLE . . . . . . . . . . . . . . . . . . . . . . . . . . . . . . . . . . . . . . . 9
MINE SUMMARY SHEETS . . . . . . . . . . . . . . . . . . . . . . . . . . . . . . . . . . . . . . . . . . . . . . . . . . . . . . . . . . . . . . . . . . . . . . . . 9Mine Index 2509
James Tytle, Brush Creek Mine . . . . . . . . . . . . . . . . . . . . . . . . . . . . . . . . . . . . . . . . . . . . . . . . . . . . . . . . . . . . . . . . 9Mine Index 2511
Andrew Brown, Brush Creek Mine . . . . . . . . . . . . . . . . . . . . . . . . . . . . . . . . . . . . . . . . . . . . . . . . . . . . . . . . . . . . . 10
OTHER MINES SHOWN ON NEWTON QUADRANGLE . . . . . . . . . . . . . . . . . . . . . . . . . . . . . . . . . . . . . . . . . . . . . . . . . 11Mine Index 4230 . . . . . . . . . . . . . . . . . . . . . . . . . . . . . . . . . . . . . . . . . . . . . . . . . . . . . . . . . . . . . . . . . . . . . . . . . . . . . 11Mine Index 6849 . . . . . . . . . . . . . . . . . . . . . . . . . . . . . . . . . . . . . . . . . . . . . . . . . . . . . . . . . . . . . . . . . . . . . . . . . . . . . 11Mine Index 6855 . . . . . . . . . . . . . . . . . . . . . . . . . . . . . . . . . . . . . . . . . . . . . . . . . . . . . . . . . . . . . . . . . . . . . . . . . . . . . 11Mine Index 6856 . . . . . . . . . . . . . . . . . . . . . . . . . . . . . . . . . . . . . . . . . . . . . . . . . . . . . . . . . . . . . . . . . . . . . . . . . . . . . 11Mine Index 6857 . . . . . . . . . . . . . . . . . . . . . . . . . . . . . . . . . . . . . . . . . . . . . . . . . . . . . . . . . . . . . . . . . . . . . . . . . . . . . 11Mine Index 6858 . . . . . . . . . . . . . . . . . . . . . . . . . . . . . . . . . . . . . . . . . . . . . . . . . . . . . . . . . . . . . . . . . . . . . . . . . . . . . 11
MINES WHOSE LOCATIONS ARE NOT KNOWN, NEWTON QUADRANGLE . . . . . . . . . . . . . . . . . . . . . . . . . . . . . . . . 11
INDEX OF MINES IN THE NEWTON QUADRANGLE . . . . . . . . . . . . . . . . . . . . . . . . . . . . . . . . . . . . . . . . . . . . . . . . . . . 12


1
INTRODUCTIONCoal has been mined in 76 counties of Illinois. More than 7,400 coal mines have operated sincecommercial mining began in Illinois about 1810; fewer than 30 are currently active. To detail the extentand location of coal mining in Illinois, the Illinois State Geological Survey (ISGS) has compiled maps anddirectories of known coal mines. The ISGS offers maps at a scale of 1:100,000 and accompanyingdirectories for each county in which coal mining is known to have occurred. Maps at a scale of 1:24,000and accompanying directories, such as this, are available for selected quadrangles. Contact the ISGS fora list of these quadrangles.
These larger scale maps show the approximate positions of mines in relation to surface features such asroads and water bodies, and indicate the mining method used and the accuracy of the mine boundaries. The maps are useful for locating mine boundaries relative to specific properties and for assessing thepotential for subsidence in an area. Mine boundaries compiled from final mine surveys are generallyshown within 200 feet of their true position. As a result of poor cartographic quality and inaccuracies in theoriginal mine surveys, boundaries of some older mines may be mislocated on the map by 500 feet ormore. Original mine maps should be consulted in situations that require precise delineation of mineboundaries or internal workings of mined areas.
This directory serves as a key to the accompanying mine map and provides basic information on the coalmines in the quadrangle. The directory is composed of two parts. Part I explains the symbols andpatterns used on the accompanying map and the summary data presented for each mine. Part IInumerically lists the mines in the quadrangle and summarizes the geology and production history of eachmine. Total production for the mine, not the portion in the quadrangle, is given.
MINING IN THE NEWTON QUADRANGLE
The 1899 Coal Report District 6 inspector reported on page 127 "In Jasper county, at Newton, the countyseat, I found two small mines operation. Coal has been mined at this place for the last six years. The coalis found in a ridge, the height of which is about 60 feet above the bottom lands on each side. The breadthof the ridge, where one of the mines is located, is only 100 feet. The ridge extends north and broadensout. The seam is 30 inches in thickness, and to measure from the top of the ridge to the coal seam, it willaverage 50 feet in depth." The location described is vague, but does fit the mines shown on the NewtonQuadrangle in SE 6-T6N-R10E and N ½ 7-T6N-R10E. This area includes 7 mines. The tonnage was notreported for that or previous years, and the next year, Newton was not visited. Jasper County was notlisted in the Coal Reports until 1933. The inescapable conclusion is that mining took place that was notreported. The area mined and the years of operation are unknown.

2
PART I EXPLANATION OF MAP AND MINE SUMMARY SHEET
INTERPRETING THE MAP
The map accompanying this directory shows the location of coal mines known to be present in the quadrangle. Themap, corresponding to a U.S. Geological Survey (USGS) 7.5-minute quadrangle, covers an area bounded by lines oflatitude and longitude 7.5-minutes apart. In Illinois, a quadrangle is approximately 6.5 miles east to west and 8.5miles north to south, an area of about 56 square miles. The ISGS generally offers one map of mines per quadrangle. In some areas where extensive mining occurred in two or more overlapping seams, separate maps are compiled formines in each seam to maintain readability of the map.
Mine Type and Mining MethodThe mine type is indicated on the map by pattern color: green represents surface mines; red and yellow representunderground mines. The red patterns are used for areas of underground mining that are documented by a primary orsecondary source map. A yellow pattern is used for cases where no map of the mine workings is available, but ageneral area of mining can be inferred from property maps or production figures. The patterns indicate the mainmining methods used in underground mines. The methods are (1) room and pillar and (2) high extraction. Themethod used gives some indication of the amount and pattern of coal extraction within each mined area, and hassome influence on the timing and type of subsidence that can occur over a mine.
The following discussion and illustrations of mining methods are based on Guither et al. (1984).
In room-and-pillar mines, coal is removed from haulage-ways (entries) and selected areas called rooms. Pillars ofunmined coal are left between the rooms to support the roof. Depending on the size of rooms and pillars, the amountof coal removed from the production areas will range from 40% to 70%.
Room and Pillar - mining is divided into six categories:• room-and-pillar basic (RPB, fig. 1A), an early method that did not follow a preset mining plan and therefore
resulted in very irregular designs;• modified room and pillar (MRP, fig. 1B);• room-and-pillar panel (RPP, fig. 1C);• blind room and pillar (BRP, fig. 1D);• checkerboard room and pillar (CRP, fig. 1E);• room and pillar (RP), a classification used when the specific type of room-and-pillar mining is unknown.
Blind and checkerboard are the most common types of room-and-pillar mining used in Illinois today. The knowledgeof room-and-pillar mining methods gives a trained engineer information on the nature of subsidence that may occur. A more extensive discussion of subsidence can be found in Bauer et al. (1993).
High-extraction These mining methods are subdivided into high-extraction retreat (HER, Fig 1F) and longwall (LW,Fig 1G, 1H). In these methods, much of the coal is removed within well defined areas of the mine. Subsidence of thesurface above these areas occurs within weeks. Once the subsidence activity ceases, the potential for furthermovement over these areas is low; however, subsidence may continue for several years after mining.
High-extraction retreat mining is a form of room-and-pillar mining that extracts most of the coal. Rooms and pillarsare developed in the panels, and the pillars are then systematically removed (fig. 1F).
In early (pre-1960) longwall mines, mining advanced in multiple directions from a central shaft (fig. 1G). Large pillars of coal were left around the shaft, but all coal was removed beyond these pillars. Minersplaced rock and wooden props and cribs in the mined-out areas to support the mine roof. The overlying rockgradually settled onto these supports, thus producing subsidence at the surface. In post-1959 longwall mines, room-and-pillar methods have been used to develop the main entries of the mine and panel areas. Modern longwallmethods extract 100 percent of the coal in the panel areas (fig. 1H).

3
SOURCE MAPS
Mine outlines depicted on the map are, whenever possible, based on maps made from original mine surveys. Theprocess of compiling and digitizing the quadrangle map may produce errors of less than 200 feet in the location ofmine boundaries. Larger errors of 500 feet or more are possible for mines that have incomplete or inaccurate sourcemaps.
Because of the extreme complexity of some mine maps, detailed features of mined areas have been omitted. Thedigitized mine boundary includes the exterior boundary of all rooms or entries that were at least 80 feet wide orprotruded 500 feet from the main mining area. Unmined areas between mines are shown if they are at least 80 feetwide; unmined blocks of coal within mines are shown if they are at least 400 feet on each side. Original source mapsshould be consulted when precise information on mine boundaries or interior features is needed.
The mine summary sheet lists the source maps used to determine each mine outline. The completeness of mapsources is indicated on the map by a line symbol at the mine boundary. Source maps are organized in fivecategories.
Final mine map The mine outline was digitized from an original map made from mine surveys conducted within afew months after production ceased. The date of the map and the last reported production are listed on the summarysheet.
Not a final map The mine is currently active or the mine outline was made from a map based on mine surveysconducted more than few months before production ceased. This implies the actual mined-out area is probably largerthan the outline on the map. The mine summary sheet indicated the dates of source maps and the last reportedproduction, as well as the approximate tonnage mined between these two dates (if the mine is abandoned). Thesummary sheet also lists the approximate acreage mined since the date of the map and, in some cases, indicates thearea where additional mining may have taken place. This latter information is determined by locating on the map theactive faces relative to probable boundaries of the mine property.
Undated map The source map was undated, so it may or may not be based on a final mine survey. Whensufficient data are available, the probable acreage of the mined area is estimated from reported production, averageseam thickness and a recovery rate comparable to other mines in the area. This information is listed in the summarysheet for the mine.
Incomplete map The source map did not show the entire mine. The summary sheet indicates the missing part ofthe mine map and the acreage of the unmapped area, which is estimated from the amount of coal known to havebeen produced from the mine.
Secondary source map The original mine map was not found so the outline shown was determined fromsecondary sources (e.g., outlines from small-scale regional maps published in other reports). The summary sheetdescribes the secondary sources.
POINTS AND LABELS
The locations of all known mine openings (shafts, slopes, and drifts) and surface mine tipples are plotted on the map. Tipples are areas where coal was cleaned, stockpiled, and loaded for shipping.
Only openings or tipples are plotted for mines without source maps. If the precise locations of these features areunknown, a special symbol is used to indicate the approximate location of the mine.
Each mine on the map is labeled with the names of the mine and operating company, ISGS mine index number, andyears of operation (if known) if space permits. A seam designation is given on maps where more than one seam wasmined. For a mine that operated under more than one name, only the most recent name is generally given. When amine changed names or ownership shortly before closing, an earlier name is listed. All company and mine names arelisted on the mine summary sheet in the directory, under the production history segment.


6
Figure 2 Generalized stratigraphicsection, showing approximate verticalrelations of coals in Illinois.
INTERPRETING A MINE SUMMARY SHEET
The mine summary sheet is arranged numerically by mine indexnumber. Index numbers are shown on the map and in the mine listing. The mine summary sheet provides the following information (ifavailable).
Company and mine name The last company or owner of the mine isused, unless no production was recorded for the last owner. In thatcase, the penultimate owner is listed. Mines often have no specificname; in these cases, the company name is also used as the minename.
Type Underground denotes a subsurface mine in which the coal wasreached through a shaft, slope, or a drift entry. Surface denotes asurface, open pit or strip mine.
Total mined-out acreage shown The total acreage of the minedarea mapped, including any acreage mined on adjacent quadrangles, is calculated from the digitized outline of the mine. The acreage oflarge barrier pillars depicted on the map is excluded from the mined-outacreage. Small pillars not digitized are included in the acreagecalculation. If the mine outline is not based on a final mine map, theacreage is followed by an estimate of additional acres that may havebeen mined. The estimate is determined from reported mineproduction, approximate thickness of the coal, and recovery ratescalculated from nearby mines that used similar mining methods.
SHAFT, SLOPE, DRIFT OR TIPPLE LOCATIONS
Shaft, slope, drift, or tipple locations Locations of all known formerentry points to underground mines or the location of coal cleaning,tipple, and shipping equipment used by the mine’s facility are listed. The location is described in terms of county, township and range (Twp-Rge), section, and location within the section by quarters. NE SW NW,for instance, would describe the location in the northeast quarter of thesouthwest quarter of the northwest quarter. When sections areirregular in size, the quarters remain the same size and are oriented (or“registered”) from the southeast corner of the section. Approximatefootage from the section lines (FEL = from east line, FNL = from northline, for example) is given when that information is known; thisindicates a surveyed location and is not derived from maps. Entrypoints are also plotted on the map and coded for the type of entry ortipple. A mine opening may have had many purposes during the life ofthe mine. Old hoist shafts are often later used for air and escapeshafts; this information is included in the directory when known. Thetipple for underground mines was generally located near the main shaftor slope. At surface mines, coal was sometimes hauled to a centraltipple several miles from the mine pit.
GEOLOGY
Seam(s) mined The name of the coal seam(s) mined is listed, if known. If multiple seams were mined, they are alllisted, although the mined-out area for each seam may be shown on separate maps. Figure 2 shows the stratigraphicsection of the coal-bearing interval in Illinois, and the vertical relations among the coals.
Depth The depth to the top of the seam in the vicinity of the shaft is listed, if known. The depth is determined fromnotes made by geologists who visited the mine during its operation or from drill hole data in ISGS files. Depthgenerally varies little over the extent of a mine; however, reported depths for an individual mine may vary. Depth forsurface-mined coals varies, and is usually represented as a range.

7
Thickness The approximate thickness of the mined seam is shown, if known. Thickness also comes from notes ofgeologists who visited the mine during its operation or from borehole data in ISGS files. Minimum, maximum, andaverage thicknesses are given when this information is available.
Mining method The principal mining method used at the mine (figs. 1A-H) is listed. See the mining methodssection at the beginning of this directory for a discussion of this parameter.
Geologic problems reported Any known geologic problems, such as faults, water seepage, floor heaving, andunstable roof, encountered in the mine are reported. This information is from notes made by ISGS geologists whovisited the mine, or from reports by mine inspectors published by the Illinois Department of Mines and Minerals, orfrom the source map(s). Geologic problems are not reported for active mines.
PRODUCTION HISTORY
Production history Tons of coal produced from the mine by each mine owner are totaled. When the source mapused for the mine outline is not a final mine map, the tonnage produced since the date of the map is identified. Formines that extend into adjacent quadrangles, the tonnage reported includes areas mined in adjacent quadrangles.
SOURCE OF DATA
Source map This section lists information about the map(s) used to compile the mine outline and the locations oftipples and mine openings. In some cases more than one source map was used. For example, a map drawn beforethe mine closed may provide better information on original areas of the mine than a later map. When more than onemap was used, the bibliography section explains what information was taken from each source.
Date The date of the most recent mine survey listed on the source map is reported.
Original scale The original scale of the source map is listed. Many maps are photo-reductions and are no longer attheir original scale. The original scale gives some indication of the level of detail of the mine outline and the accuracyof the mine boundary relative to surface features. Generally, the larger the scale, the greater the accuracy and detailof the mine map. Mine outlines taken from source maps at scales smaller than 1:24,000 may be highly generalizedand may well be inaccurately located with respect to surface features.
Digitized scale The scale of the digitized map is reported. The scale may be different from that of the originalsource map. In many cases the digitized map was made from a photo-reduction of the original source map, or thesource map was not in a condition suitable for digitizing and the mine boundaries were transferred to another basemap.
Map type Source maps are classified into five categories to indicate the probable completeness of the map. Seediscussion of source maps in the previous section.
Annotated bibliography Sources that provide information about the mine are listed, with the data taken from eachsource. Some commonly used sources are described below. Full bibliographic references are given for all othersources. Unless otherwise noted, all sources are available for public inspection at the ISGS.
Coal Reports Published since 1881, these reports contain tabular data on mine ownership, production, employment,and accidents. Some volumes include short descriptions made by mine inspectors of physical features andconditions in selected mines.
Directory of Illinois Coal Mines This source is a compilation of basic data about Illinois coal mines, originallygathered by ISGS staff in the early 1950s. Sources used for this directory are undocumented, but they are primarilyIllinois Department of Mines and Minerals annual reports, ISGS mine notes, and coal company officials.
ENR Document 85/01, Guither, H. D., J. K. Hines, and R. A. Bauer, 1985 The Economic Effect of UndergroundMining Upon Land Used for Illinois Agriculture: Illinois Department of Energy and Natural Resources Document 85/01,185 p.
Microfilm map The U.S. Bureau of Mines maintains a microfilm archive of mine maps. A microfilm file for Illinois isavailable for public viewing at the ISGS.

8
Mine notes ISGS geologists have visited mines or contacted mine officials throughout the state since the early1900s. Notes made during these visits range from brief descriptions of the mine location to long narratives (includingsketches) of mining conditions and geology.
Federal Land Bank of St. Louis, Preliminary Reports on Subsidence Investigations Mining engineers working for theFederal Land Bank of St. Louis mapped areas of subsidence due to coal mining in the early 1930s. These reportsoften include county maps of mine properties with mined-out areas including shaft locations, as well as subsidenceareas.
REFERENCESBauer, R. A., B. A. Trent, and P. B. Dumontelle, 1993, Mine Subsidence in Illinois: Facts for the Homeowner
Considering Insurance, Illinois State Geological Survey, Environmental Geology Note 144, 16p.
Guither, H. D., J. K. Hines, and R. A. Bauer, 1985, The Economic Effects of Underground Mining Upon Land Used forIllinois Agriculture, Illinois Department of Energy and Natural Resources Document 85/01, 185p.
9
PART II DIRECTORY OF MINES IN THE NEWTON QUADRANGLE
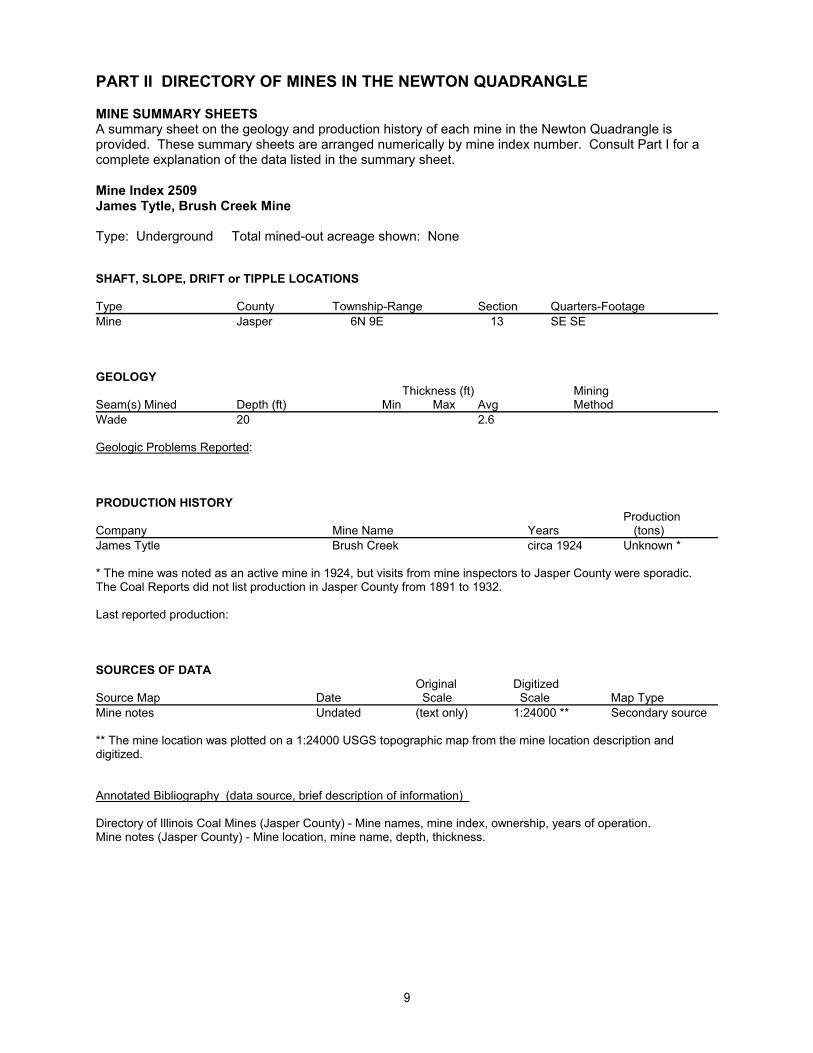
MINE SUMMARY SHEETSA summary sheet on the geology and production history of each mine in the Newton Quadrangle isprovided. These summary sheets are arranged numerically by mine index number. Consult Part I for acomplete explanation of the data listed in the summary sheet.
Mine Index 2509James Tytle, Brush Creek Mine
Type: Underground Total mined-out acreage shown: None
SHAFT, SLOPE, DRIFT or TIPPLE LOCATIONS
Type County Township-Range Section Quarters-FootageMine Jasper 6N 9E 13 SE SE
GEOLOGY Thickness (ft) Mining
Seam(s) Mined Depth (ft) Min Max Avg MethodWade 20 2.6
Geologic Problems Reported:
PRODUCTION HISTORY Production
Company Mine Name Years (tons) James Tytle Brush Creek circa 1924 Unknown *
* The mine was noted as an active mine in 1924, but visits from mine inspectors to Jasper County were sporadic. The Coal Reports did not list production in Jasper County from 1891 to 1932.
Last reported production:
SOURCES OF DATAOriginal Digitized
Source Map Date Scale Scale Map Type Mine notes Undated (text only) 1:24000 ** Secondary source
** The mine location was plotted on a 1:24000 USGS topographic map from the mine location description anddigitized.
Annotated Bibliography (data source, brief description of information)
Directory of Illinois Coal Mines (Jasper County) - Mine names, mine index, ownership, years of operation.Mine notes (Jasper County) - Mine location, mine name, depth, thickness.
10
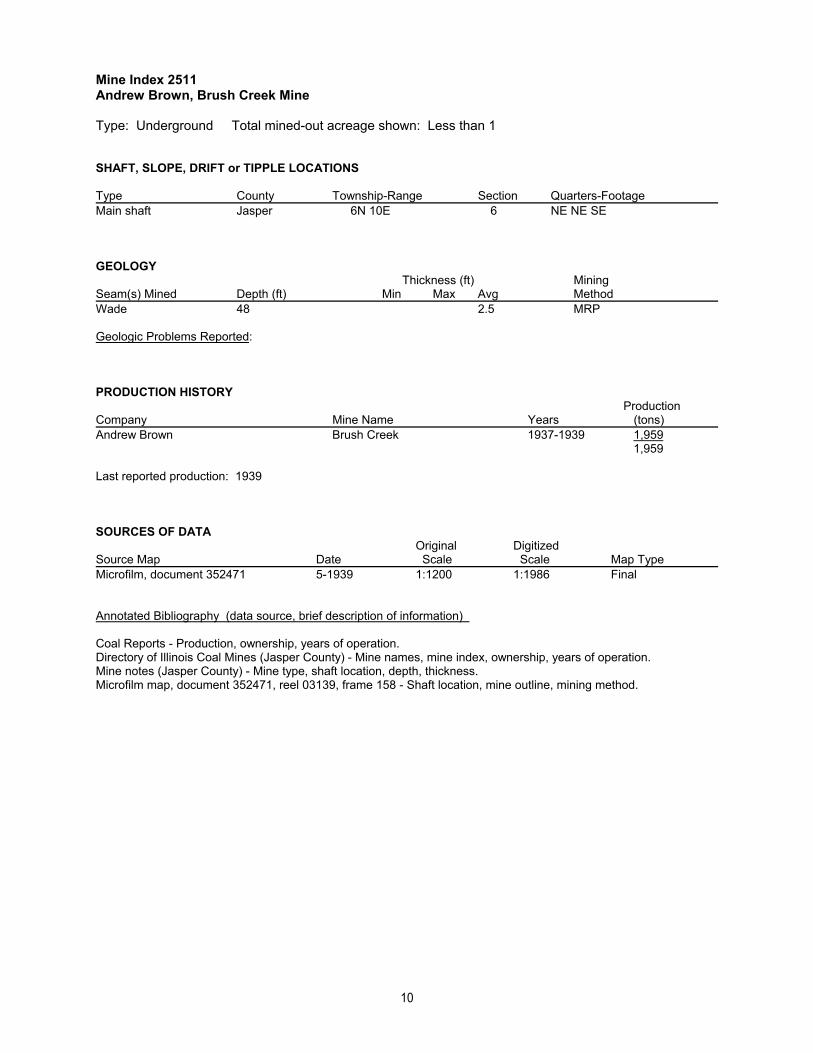
Mine Index 2511Andrew Brown, Brush Creek Mine
Type: Underground Total mined-out acreage shown: Less than 1
SHAFT, SLOPE, DRIFT or TIPPLE LOCATIONS
Type County Township-Range Section Quarters-FootageMain shaft Jasper 6N 10E 6 NE NE SE
GEOLOGY Thickness (ft) Mining
Seam(s) Mined Depth (ft) Min Max Avg MethodWade 48 2.5 MRP
Geologic Problems Reported:
PRODUCTION HISTORY Production
Company Mine Name Years (tons) Andrew Brown Brush Creek 1937-1939 1,959
1,959
Last reported production: 1939
SOURCES OF DATAOriginal Digitized
Source Map Date Scale Scale Map Type Microfilm, document 352471 5-1939 1:1200 1:1986 Final
Annotated Bibliography (data source, brief description of information)
Coal Reports - Production, ownership, years of operation.Directory of Illinois Coal Mines (Jasper County) - Mine names, mine index, ownership, years of operation.Mine notes (Jasper County) - Mine type, shaft location, depth, thickness.Microfilm map, document 352471, reel 03139, frame 158 - Shaft location, mine outline, mining method.

11
OTHER MINES SHOWN ON NEWTON QUADRANGLE
Mine Index 4230 SE SE SW 6-T6N-10E, drift source: ISGS field notes (J. M. Weller, 8-14-1934)Mine Index 6849 SE NE NW 7-T6N-R10E source: ISGS field notes (J. M. Weller, 7-9-1933)Mine Index 6855 NW NE SE 6-T6N-R10E, slope, 15 feet deep, 2.3-2.7 feet thick source: ISGS field notes (J. M.
Weller, 8-14-1934)Mine Index 6856 NE SE SW 6-T6N-R10E source: ISGS field notes (J. M. Weller, 7-9-1933)Mine Index 6857 NE NE NW 7-T6N-R10E, shaft source: ISGS field notes (J. M. Weller, 7-9-1933)Mine Index 6858 NE NE SE 6-T6N-R10E source: ISGS field notes (J. M. Weller, 7-9-1933)
MINES WHOSE LOCATIONS ARE NOT KNOWN, NEWTON QUADRANGLE
The locations of the following mines are unknown, but the production tonnage, operating names, andnearest town were reported in the Annual Coal Reports. The operators listed below mined in or near theNewton Quadrangle. The information shown is similar to that presented on the summary sheets in theprevious pages of this directory. The first item is the name the mine operated under as listed in the CoalReport, then the years the mine reported. If no physical data are available, the next item listed is the totaltons produced by the mine. If physical data are available, the order of presentation is as follows: type ofopening for the mine (drift, slope or shaft), depth of coal in feet, and thickness of coal in feet.
The total tons mined by these unlocated mines is 21,008 (930 underground and 20,078 mined byuncertain method), which would represent approximately 4 to 10 acres, depending on the recovery factor,mining method, and numerous other factors. (Note: 1 square mile = 640 acres)
NEWTON
Jourdan (Joseph N.), 1934-1935, underground 675 tons Mine Index 2508
Nigh (F.), 1882-1889, slope, –, 90, 3.0, RP 19,926 tonsNigh & Barbel, 1889-1890 152 tons
20,078 tons
Jourdan & Lytle, 1933-1934, underground 255 tons

12
INDEX OF MINES IN THE NEWTON QUADRANGLE
Barbel (Nigh & Barbel) . . . . . . . . . . . . . . . . . . . . . . . . . . . . . . . . . . . . . . . . . . . . . . . . . . . . . . . . . . . . . . . . . . . . . . . 11Brown (Andrew) . . . . . . . . . . . . . . . . . . . . . . . . . . . . . . . . . . . . . . . . . . . . . . . . . . . . . . . . . . . . . . . . . . . . . . . . . . . . 10Brush Creek Mine . . . . . . . . . . . . . . . . . . . . . . . . . . . . . . . . . . . . . . . . . . . . . . . . . . . . . . . . . . . . . . . . . . . . . . . . . 9, 10Jourdan (Joseph N.) . . . . . . . . . . . . . . . . . . . . . . . . . . . . . . . . . . . . . . . . . . . . . . . . . . . . . . . . . . . . . . . . . . . . . . . . . 11Jourdan & Lytle . . . . . . . . . . . . . . . . . . . . . . . . . . . . . . . . . . . . . . . . . . . . . . . . . . . . . . . . . . . . . . . . . . . . . . . . . . . . . 11Lytle (Jourdan & Lytle) . . . . . . . . . . . . . . . . . . . . . . . . . . . . . . . . . . . . . . . . . . . . . . . . . . . . . . . . . . . . . . . . . . . . . . . 11Nigh (F.) . . . . . . . . . . . . . . . . . . . . . . . . . . . . . . . . . . . . . . . . . . . . . . . . . . . . . . . . . . . . . . . . . . . . . . . . . . . . . . . . . . 11Nigh & Barbel . . . . . . . . . . . . . . . . . . . . . . . . . . . . . . . . . . . . . . . . . . . . . . . . . . . . . . . . . . . . . . . . . . . . . . . . . . . . . . 11Tytle (James) . . . . . . . . . . . . . . . . . . . . . . . . . . . . . . . . . . . . . . . . . . . . . . . . . . . . . . . . . . . . . . . . . . . . . . . . . . . . . . . 9
