dirk schoenmaker, jan sass - eiopa and presentations/dsf... · 2 cross-border insurance in europe1...
TRANSCRIPT

DSF Policy Paper Series
Cross-border Insurance in Europe
Dirk Schoenmaker, Jan Sass
November 2014
DSF Policy Paper, No. 45
2
Cross-border Insurance in Europe1
Dirk Schoenmaker and Jan Sass *
Abstract
This paper employs a new dataset to construct a comprehensive overview of cross-border insurance
in the European Union. Cross-border insurance -measured as the foreign share in total gross written
premium- appears to be persuasive at 36 percent, which is higher than in banking with 25 percent.
Looking more detailed at cross-border insurance, 29 out of this 36 percent is from other EU countries,
while 7 percent is from third countries (outside Europe). This international insurance market provides
a challenging background, against which Solvency II will start in January 2016.
The European Insurance and Occupational Pensions Authority (EIOPA) is already playing a
coordinating role in the regulatory implementation of Solvency II. It also participates in the supervisory
colleges, which will need to decide on the approval of internal models across the large European
insurance groups. Nevertheless, final authority remains with national supervisors in this coordination
model. This paper suggests that the increasing share of cross-border insurance may tilt the
supervisory balance towards centralisation. Insurance Union may also be an effective solution to
address level playing field issues.
* Duisenberg School of Finance
1 Dirk Schoenmaker and Jan Sass are at Duisenberg School of Finance. Part of this research was done at EIOPA in Frankfurt. We would like to thank Sandra Desson and her team for their support and aid during this research. The paper reflects the opinions of the authors and not necessarily of EIOPA.

3
1. Introduction
While insurance is traditionally an international business, the degree of internationalisation is difficult
to measure due to a lack of data. By contrast, cross-border banking and capital markets transactions
are well documented, which supports both policymakers and business leaders in their decision-
making. With the advance to Solvency II, the single market in insurance will be reinforced by the new
common capital framework. This may also lead to market restructuring (Stoyanova and Gründl,
2014). Earlier examples of regulatory driven market structuring are the adoption of the third life and
non-life directives, which introduced home country control (i.e. the single market) and the introduction
of the euro, both in the 1990s. The subsequent wave of intra-European consolidation was stronger in
the insurance sector than in other financial sectors (Berger et al.,1999).
The new risk-based capital framework will leave room for supervisory interpretation and discretion
(e.g. in the model approval process or Pillar 2). Solvency II will thus give rise to level playing field
discussions between the insurance industry and supervisors. A detailed overview of the market would
aid an informed debate about the materiality of level playing field issues. It would also help
supervisors to assess the impact of Solvency II across Europe.
The aim of this paper is to provide a comprehensive overview of cross-border insurance in Europe.
The data sources on international insurance provide a scattered view of the European market. The
European Insurance and Occupational Pensions Authority (EIOPA) publishes data on cross-border
branches, while the OECD Insurance Statistics provide an aggregate, albeit incomplete, overview of
foreign subsidiaries. Furthermore, Insurance Europe, the federation of European insurers, publishes
worldwide premiums, but without a country breakdown.
Consistent and effective supervision of European cross-border insurers is enhanced by the so-called
colleges of supervisors, with representatives from the home country, host countries and EIOPA.
These colleges are led by a group supervisor, usually the supervisor from the country where the
holding company is located. The Helsinki Protocol describes the required collaboration between
European insurance supervisors in the group supervision of these insurance groups. As part of this
group supervision, the network of European insurance supervisors presented in EIOPA have
collected the “Helsinki List” of European insurance groups, with a detailed breakdown of branches
and subsidiaries by country of the major insurers across the European Economic Area (EEA).2 We
develop a methodology to link the Helsinki data to the EIOPA data on foreign branches and OECD
data on foreign subsidiaries. The result is a comprehensive dataset of cross-border insurance in
Europe at country level.
The results confirm the international orientation of insurance found in earlier studies (Van der Zwet,
2003; Focarelli and Pozzolo, 2008). Cross-border insurance, measured by Gross Written Premium
(GWP), amounts to 36 percent in EU countries in 2012, while the comparable number for banking,
measured by assets, stands at 25 percent. Next, the main vehicle for cross-border insurance is the
subsidiary form at 31 percent, with a minor role for branches at 5 percent. Nevertheless, we discern a
recent trend of establishing more branches abroad and transforming European subsidiaries into
branches. Moving from country to individual firm level, the results indicate that the 25 largest
European insurers are very international with 32 percent of GWP in the rest of Europe and 27 percent
in the rest of the world. Again the large banks are less international with 24 percent in the rest of
Europe and 23 percent in the rest of the world.
2 The Helsinki list data is confidential. We use data aggregated at country level. These data cannot be related to individual insurance groups.
4
Comparing the main regions, it appears that the large European insurers are far more international (at
60 percent), than their American (at 22 percent) and Asian (at 4 percent) counterparts. It is therefore
no surprise that five out of the nine global systemically important insurers (G-SIIs) are from Europe,
while only three from the US and one from China.
Insurance appears thus to be more international than banking. This raises the question whether there
is a case for an Insurance Union following the Banking Union. After the crisis, national supervisors
(both in Europe and beyond) tend to require overcapitalisation of local subsidiaries. Insurance groups
have thus pockets of capital locked up in the various jurisdictions in which they operate. Consolidated
supervision, including centralised capital management, would be an argument in favour of centralised
supervision. Another argument is the business practice of integrated asset management at large
insurers. Finally, some supervisors will no doubt be tougher than other supervisors, also under the
new harmonised Solvency II framework. A centralised supervisor would be an effective solution to
address level playing field issues.
On the contrary, insurance is less subject to systemic risk and related externalities than banking
(Weiss and Mühlnickel, 2014). Cross-border externalities are the main reason for Banking Union
(Schoenmaker, 2013). Moreover, insurance is largely local business, as products are attuned to local
tax, social security and legal rules (e.g. liability law).
The paper is organised as follows. The next section reviews the existing literature on
internationalisation and describes methodology and data. The subsequent sections presents results
on the current state of cross-border insurance activities at a country level and at a firm level. We also
show the internationalisation of the global systemically important insurers. The final section presents
conclusions and policy implications.
2. Methodology and Data
2.1 Methodology
In the literature, a variety of indicators are used to measure internationalisation. Research on the
internationalisation of financial firms is extensive, but most studies focus on banks (see Moshirian,
2006, for an overview). At the country level, the first line of research looks at the Foreign Direct
Investment (FDI) flows in banking. Soussa (2004) looks at the FDI inflows into the banking sector in
emerging markets and finds that between 1990 and 2003 most investments were directed to Latin
America and Eastern Europe. Later research is carried out by De Nicolo et al. (2004) who measure
internationalisation through foreign bank ownerships, i.e. the amount of total assets in which foreign
banks have an equity share of 50% or more. Alternatively, Claessens and Van Horen (2014) define
foreign bank presence as the number of foreign banks as a share of total banks in a country. In
Schoenmaker (2013) international banking is measured by the amount of foreign lending as a share
of total lending in a country.
At the firm level, early research focuses on non-financial institutions, but more recent papers also
examine the degree of internationalisation of financial firms. A first line of research measures
internationalisation for non-financial institutions by a single variable. Examples are the foreign sales to
total sales ratio (Stopford and Wells, 1972), the foreign asset ratio (Geringer et al., 1989), the number
of foreign countries in which a firm has operating subsidiaries (Tallman and Li, 1996) or the foreign
employees ratio (Kim et al., 1989). However, measuring the degree of internationalisation based on
just one variable might not be ideal. Sullivan (1994) reviews 17 papers that research the
measurement of internationalisation based on a single variable and finds that using only one single
indicator increases the possibility of measurement errors. He recommends using a multidimensional

5
measurement method, called the Trans Nationality Index (TNI). Sullivan’s findings are challenged by
Ramaswamy et al. (1996) who find little support for his findings.
To measure internationalisation at the firm level, early research from Berger et al. (2003) and
Focarelli and Pozzolo (2005) examine the number of countries a financial institution provides cash
management services to. Drawback is that this does measure the scope of internationalisation, but
not its scale or intensity. In order to obtain a more complete measurement, another approach is to
look at the full set of activities of a financial institution. Slager (2004) and Schoenmaker and Oosterloo
(2005) have applied Sullivan’s proposed approach of looking at more than one variable when
measuring internationalisation. This was done by looking at foreign revenue, foreign assets and
foreign employees. Gulamhussen et al. (2014) also establish a more complete set of measures,
examining i) the number of foreign countries in which a bank is active divided by the maximum
amount of foreign countries in which the most international active bank is active, ii) the share of
foreign assets and iii) a transformed Hirsch-Herfindahl Index that measures international
concentration.
As mentioned before, internationalisation of the insurance industry has not been covered as
extensively as of the banking sector. One of the first relevant papers is by Eppink & Van Rhijn (1988)
who research the degree of internationalisation of several Dutch insurance companies. The degree of
internationalisation is obtained by looking at the geographic distribution of revenues, profits and
employees. More extensive research is carried out by Van der Zwet (2003) who uses data on the 53
largest financial groups worldwide, based on market capitalisation in 2000. By looking at the
geographical diversification of total revenues (Gross Written Premium), van der Zwet finds that
insurance groups are more internationally oriented than banks.
In sum, sales, assets, employees and a count of foreign country activity are generally used to
measure internationalisation for non-financial firms. For banks, these variables are broadly the same.
Generally, the amount of foreign assets is a very good indicator. For insurance companies, Gross
Written Premium (GWP) is the most commonly used indicator. GWP is also taken as measurement
for internationalisation by Van der Zwet (2003) and Schoenmaker, Oosterloo and Winkels (2008).
Assets have become less meaningful as indicator of internationalisation. Insurers are increasingly
adopting a centralised asset management strategy, by which they acquire assets globally, irrelevant
of their geographical insurance underwriting activities. Following Ramaswamy et al. (1996), we use
the dominant indicator to determine geographical segmentation in the insurance industry. This
variable is the amount of GWP. If data on the geographical split of GWP is unavailable, we turn to a
geographical split of employees and subsequently to the location of assets.
These premiums are divided into three segments: premiums from the Home Country, premiums from
the rest of the Region and premiums from the Rest of the World. The GWP for each segment region
will be divided by the total premium written by the insurer to determine the percentage GWP in each
geographical segment. In some parts of the analysis Region and World are separated, while in other
parts they are added together under International. Throughout the paper, we use weighted averages
to establish the internationalisation of a group of insurers (e.g. the top 20) or a group of countries (e.g.
the EU).
6
2.2 Data
At the country level, comprehensive cross-border data are not available. The data sources on
international insurance provide a scattered view of the European market. EIOPA publishes data on
cross-border branches, while the OECD Insurance Statistics provide an aggregate, albeit incomplete,
overview of foreign subsidiaries. A complete picture of the European insurance market and its degree
of internationalisation has therefore not yet been established. This paper has circumvented the
unavailability of these data by combining publicly available data with data from EIOPA. These data
are obtained via the so called Helsinki List. The Helsinki List is a list with data on all significant cross
border activities of European insurance groups that are active across borders in the European
Economic Area (EEA). The Helsinki List was originally established to share contact details among
supervisors to improve cooperation. By including figures on GWP, it is currently also used to improve
the oversight of cross-border insurance groups in Europe. Every year, EIOPA receives data from
each group supervisor with a summary of cross-border activities such as the number of EU/EEA
branches, EU/EEA subsidiaries, the number of branches/subsidiaries in non EU/EEA countries, the
GWP written by each insurance entity and finally also the Solvency Ratio at group and subsidiary
level. All the major cross-border insurers are included in this list which makes the cross-border
coverage very extensive (See Statistical Annex A12 for a template of the Helsinki List).
For the analysis on the number of enterprises, we use the Statistical Annex to EIOPA Financial
Stability Reports. This dataset contains statistical information submitted by national authorities to
EIOPA from 2005 to 2012. It reports the number of national enterprises, the number of branches from
EU/EEA and number of branches from non-EU/EEA countries per country. Moreover, we use the
EIOPA Register of Insurance Undertakings. This is the online register of registered insurance
undertakings in the EU that states the number and details of the national enterprises, EU/EEA
branches and non-EU/EEA branches (also called third country branches). With these data, national
enterprises3 could be split into home and foreign controlled enterprises (also called foreign
subsidiaries). Finally, we also use a list of the subsidiaries and branches of insurers from the United
States (US) in the EEA, provided by EIOPA (Statistical Annex A2). For links to the sources and a
detailed description of the data, please see the Appendix.
To analyse the premiums written by these different enterprises, we start by assigning the GWP from
every subsidiary or branch on the Helsinki List to the relevant country. By doing this, we can establish
a first insurance cross-border overview. Moreover, we use the OECD Insurance Statistics 2005-2012,
another source with information on cross-border insurance activities in Europe. Among other data, it
contains information for OECD countries on the number of foreign controlled insurance entities and
the GWP written by these foreign controlled insurance entities. The OECD Insurance Statistics are
very useful as they cover the majority of the large insurance markets in Europe. Germany, Italy, the
Netherlands and the UK are covered. However, for other larger countries such as France and Ireland
no data from the OECD were available. Finally, similar data on branches are used from a Statistical
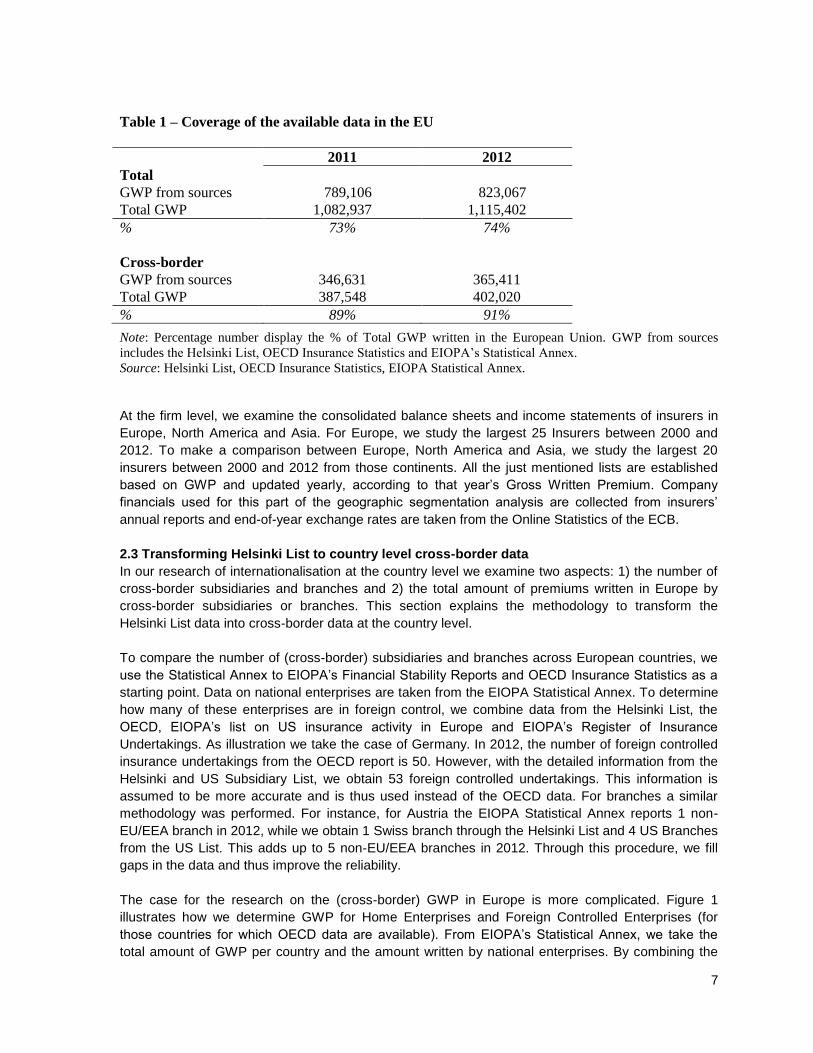
Annex published by EIOPA. When combining these three sources, we can cover around 75% of the
total EU insurance market and around 90% of all cross-border activities in the EU (see Table 1). We
have thus data with which we can reliably estimate the degree of cross-border insurance activities in
Europe. Data from the Helsinki List is confidential and can thus only be provided in aggregated form.
Tables A8 and A9 in the Statistical Annex show the aggregated data from the Helsinki List for 2011
and 2012.
3 Definition by EIOPA: “Enterprises with their head office in the country”.
7
Table 1 – Coverage of the available data in the EU
2011 2012
Total
GWP from sources 789,106 823,067
Total GWP 1,082,937 1,115,402
% 73% 74%
Cross-border
GWP from sources 346,631 365,411
Total GWP 387,548 402,020
% 89% 91%
Note: Percentage number display the % of Total GWP written in the European Union. GWP from sources
includes the Helsinki List, OECD Insurance Statistics and EIOPA’s Statistical Annex.
Source: Helsinki List, OECD Insurance Statistics, EIOPA Statistical Annex.
At the firm level, we examine the consolidated balance sheets and income statements of insurers in
Europe, North America and Asia. For Europe, we study the largest 25 Insurers between 2000 and
2012. To make a comparison between Europe, North America and Asia, we study the largest 20
insurers between 2000 and 2012 from those continents. All the just mentioned lists are established
based on GWP and updated yearly, according to that year’s Gross Written Premium. Company
financials used for this part of the geographic segmentation analysis are collected from insurers’
annual reports and end-of-year exchange rates are taken from the Online Statistics of the ECB.
2.3 Transforming Helsinki List to country level cross-border data
In our research of internationalisation at the country level we examine two aspects: 1) the number of
cross-border subsidiaries and branches and 2) the total amount of premiums written in Europe by
cross-border subsidiaries or branches. This section explains the methodology to transform the
Helsinki List data into cross-border data at the country level.
To compare the number of (cross-border) subsidiaries and branches across European countries, we
use the Statistical Annex to EIOPA’s Financial Stability Reports and OECD Insurance Statistics as a
starting point. Data on national enterprises are taken from the EIOPA Statistical Annex. To determine
how many of these enterprises are in foreign control, we combine data from the Helsinki List, the
OECD, EIOPA’s list on US insurance activity in Europe and EIOPA’s Register of Insurance
Undertakings. As illustration we take the case of Germany. In 2012, the number of foreign controlled
insurance undertakings from the OECD report is 50. However, with the detailed information from the
Helsinki and US Subsidiary List, we obtain 53 foreign controlled undertakings. This information is
assumed to be more accurate and is thus used instead of the OECD data. For branches a similar
methodology was performed. For instance, for Austria the EIOPA Statistical Annex reports 1 non-
EU/EEA branch in 2012, while we obtain 1 Swiss branch through the Helsinki List and 4 US Branches
from the US List. This adds up to 5 non-EU/EEA branches in 2012. Through this procedure, we fill
gaps in the data and thus improve the reliability.
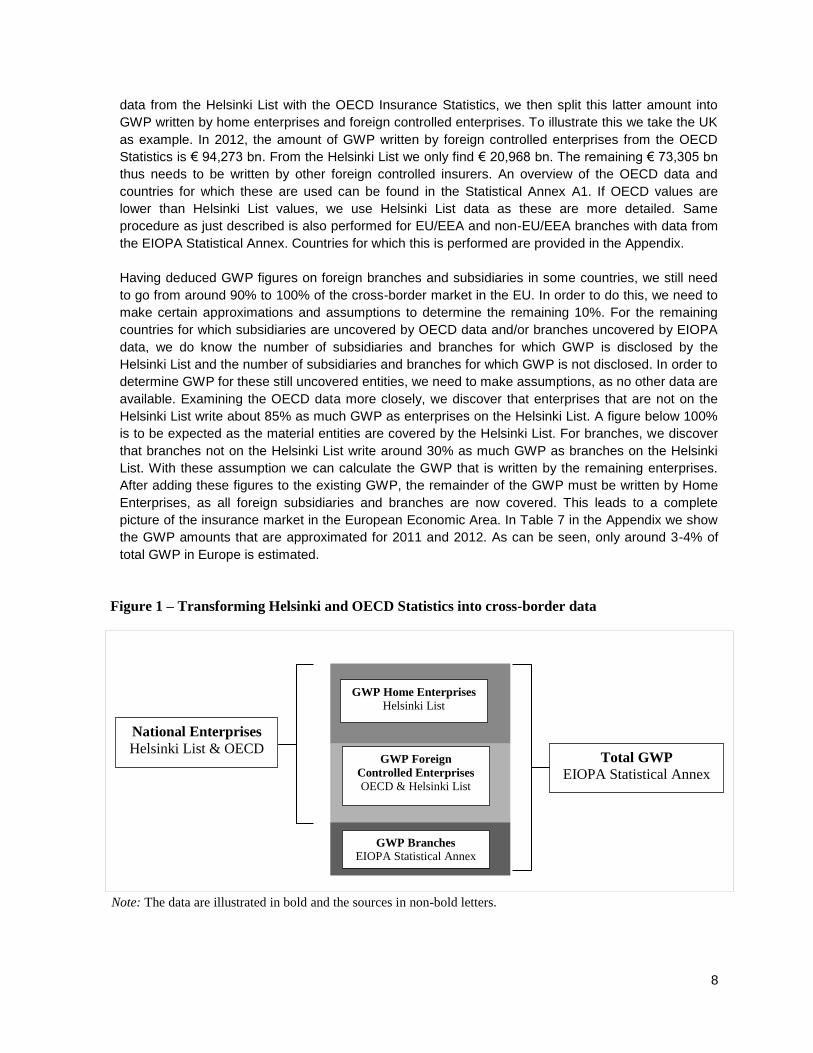
The case for the research on the (cross-border) GWP in Europe is more complicated. Figure 1
illustrates how we determine GWP for Home Enterprises and Foreign Controlled Enterprises (for
those countries for which OECD data are available). From EIOPA’s Statistical Annex, we take the
total amount of GWP per country and the amount written by national enterprises. By combining the
8
data from the Helsinki List with the OECD Insurance Statistics, we then split this latter amount into
GWP written by home enterprises and foreign controlled enterprises. To illustrate this we take the UK
as example. In 2012, the amount of GWP written by foreign controlled enterprises from the OECD
Statistics is € 94,273 bn. From the Helsinki List we only find € 20,968 bn. The remaining € 73,305 bn
thus needs to be written by other foreign controlled insurers. An overview of the OECD data and
countries for which these are used can be found in the Statistical Annex A1. If OECD values are
lower than Helsinki List values, we use Helsinki List data as these are more detailed. Same
procedure as just described is also performed for EU/EEA and non-EU/EEA branches with data from
the EIOPA Statistical Annex. Countries for which this is performed are provided in the Appendix.
Having deduced GWP figures on foreign branches and subsidiaries in some countries, we still need
to go from around 90% to 100% of the cross-border market in the EU. In order to do this, we need to
make certain approximations and assumptions to determine the remaining 10%. For the remaining
countries for which subsidiaries are uncovered by OECD data and/or branches uncovered by EIOPA
data, we do know the number of subsidiaries and branches for which GWP is disclosed by the
Helsinki List and the number of subsidiaries and branches for which GWP is not disclosed. In order to
determine GWP for these still uncovered entities, we need to make assumptions, as no other data are
available. Examining the OECD data more closely, we discover that enterprises that are not on the
Helsinki List write about 85% as much GWP as enterprises on the Helsinki List. A figure below 100%
is to be expected as the material entities are covered by the Helsinki List. For branches, we discover
that branches not on the Helsinki List write around 30% as much GWP as branches on the Helsinki
List. With these assumption we can calculate the GWP that is written by the remaining enterprises.
After adding these figures to the existing GWP, the remainder of the GWP must be written by Home
Enterprises, as all foreign subsidiaries and branches are now covered. This leads to a complete
picture of the insurance market in the European Economic Area. In Table 7 in the Appendix we show
the GWP amounts that are approximated for 2011 and 2012. As can be seen, only around 3-4% of
total GWP in Europe is estimated.
Figure 1 – Transforming Helsinki and OECD Statistics into cross-border data
Note: The data are illustrated in bold and the sources in non-bold letters.
Total GWP
EIOPA Statistical Annex
GWP Home Enterprises
Helsinki List
GWP Foreign
Controlled Enterprises
OECD & Helsinki List
GWP Branches
EIOPA Statistical Annex
National Enterprises
Helsinki List & OECD

9
To get a full picture of our methodology, Figure 2 illustrates the case for France 2012. From the
EIOPA’s Statistical Annex we obtain that GWP in France was € 200 bn, of which € 0.1 bn was written
by non EU/EEA branches and information on EU/EEA branches was not available. By adding up the
information from the Helsinki List we obtain GWP from 163 Domestic Insurers of € 140 bn, GWP from
35 Foreign Subsidiaries of € 33 bn, GWP from 8 EU-Branches of € 0.8 bn and GWP from 2 non-EU
branches of € 0.4 bn. The information so far is already more detailed than the EIOPA Statistical
Annex. However, comparing these figures to our established total number of branches and
subsidiaries, we find that we need to approximate GWP for 12 Foreign Subsidiaries, 10 non-EU/EEA
branches and 61 EU/EEA branches as these are not in the Helsinki List. With the assumption that
these subsidiaries write 85% as much as subsidiaries from the Helsinki List and the branches write
30% as much as branches from the Helsinki List, Figure 2 provides cross-border insurance data for
France.
Figure 2 – Overview for France
Source: EIOPA, OECD, Authors calculations.
The next step is to split the GWP that is approximated for some foreign subsidiaries and foreign
branches into GWP from EU/EEA and non-EU/EEA. Table 3 shows that in the European Economic
Area about 80% of the branches is from the EU/EEA and 20% from non-EU/EEA countries. We thus
assume that about 80% of the GWP that is approximated is written by EU/EEA enterprises and 20%
by non-EU/EEA enterprises. The overview for France at this stage is presented in Table 2.
Table 2 – Overview for France
France GWP (€ mn)
National Enterprises 200,337
Of which EU/EEA subsidiaries 36,385
Of which non-EU/EEA subsidiaries 5,792
EU/EEA branches 1,631
Non-EU/EEA branches 585
Total 202,553
Total Foreign
Subsidiaries (47):
€ 42,178 mn
Foreign Helsinki
Subsidiaries (35):
€ 32,640 mn
Other Foreign
Subsidiaries (12):
€9,518 mn
Write 85% compared to
Helsinki Subsidiaries
Foreign Helsinki
Branches (22):
€ 1,218 mn
Other Foreign
Branches (71):
€ 998 mn Write 30% compared to
Helsinki Branches
Total Foreign
Branches (93):
€ 2,217 mn
10
Finally, in order to compare the results with the results found for the banking sector, we need to
obtain the amounts written by EU Branches and EU Subsidiaries. We thus need to filter GWP from
EEA countries that are not in the EU (i.e. Iceland, Liechtenstein and Norway). We start this filtering
with the GWP amounts written by EEA insurers from the Helsinki List. These are only two insurers:
Storebrand and Gjensidige ASA from Norway. Secondly, we need to adjust our previously calculated
ratio of 80:20 that was used to approximate the GWP of EU/EEA to non-EU/EEA enterprises. Table 3
indicates that about 2% of the total GWP is written in EEA countries. Therefore, we adjust our ratio to
78:22 EU to non-EU, as the EU share needs to be slightly lower and the third country share
accordingly higher. Results do not change significantly but for the sake of completeness this
adjustment is performed.
Overall, our results have to be approached with some caution as the data are collected from different
sources.
3. Cross-border insurance in Europe In this section we present the findings on the current cross-border insurance activity in Europe. We
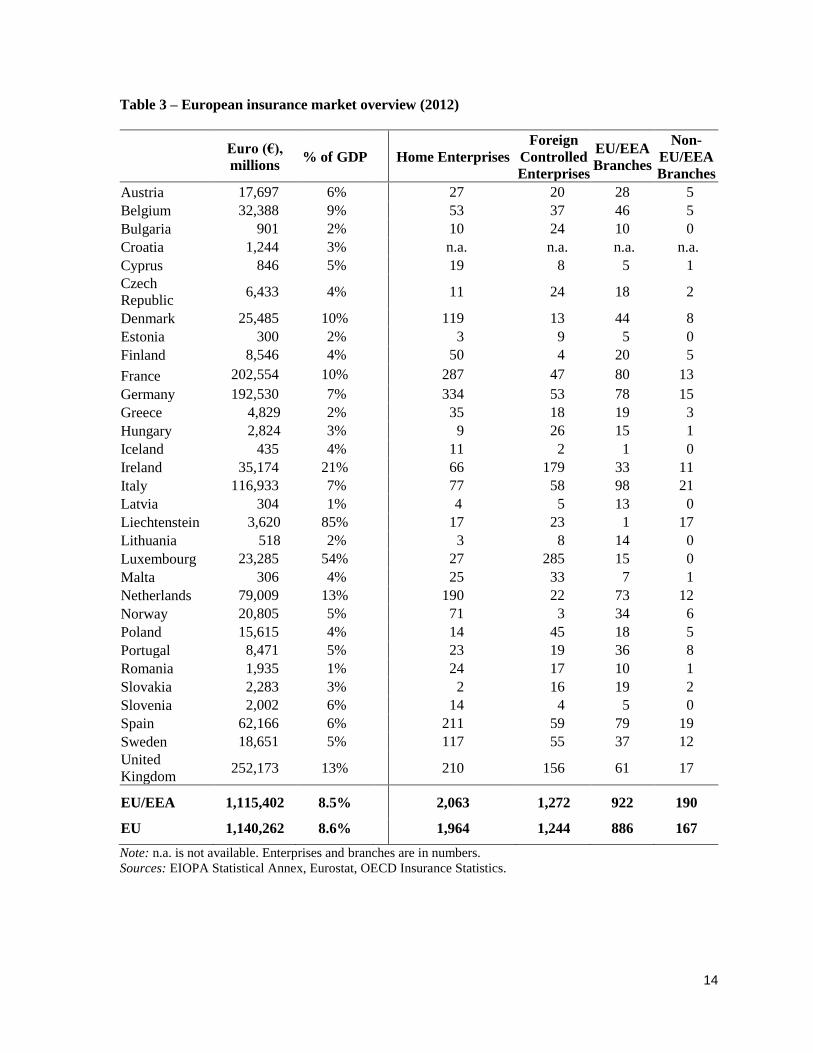
start by examining the size of the insurance markets in every European country in absolute terms and
in terms of Gross Domestic Product (GDP). Findings for 2012 can be found in Table 3. As could be
expected, the insurance industry in France, Germany, Italy, the Netherlands, Spain and the United
Kingdom are the largest in Europe in absolute terms. Combined they represent 76% of the European
market, including Switzerland, and 81% of all the insurance premiums written in the European Union.
In terms of relative size, countries such as Ireland, Liechtenstein and Luxembourg score extremely
high with written premiums being 21%, 85% and 54% of GDP. Legal and tax benefits, such as a
12.5% corporate tax rate in Ireland, can encourage insurers to locate insurance entities in such a
country. From Table 9 in the Appendix it can also be seen that the European insurance market has
grown from 2011 to 2012. This is in line with research from Insurance Europe (2014). Figures for
2011 can be found in the Statistical Annex A3.
We will now turn to the number of subsidiaries and branches in Europe and the GWP written by these
entities. In Tables A4 to A7 in the Statistical Annex, detailed figures are obtained for years 2007 to
2012. A few trends can be spotted. Due to consolidation and bankruptcies, the total amount of
national enterprises had a compounded annual growth rate (CAGR) of -3% between 2007 and 2012.
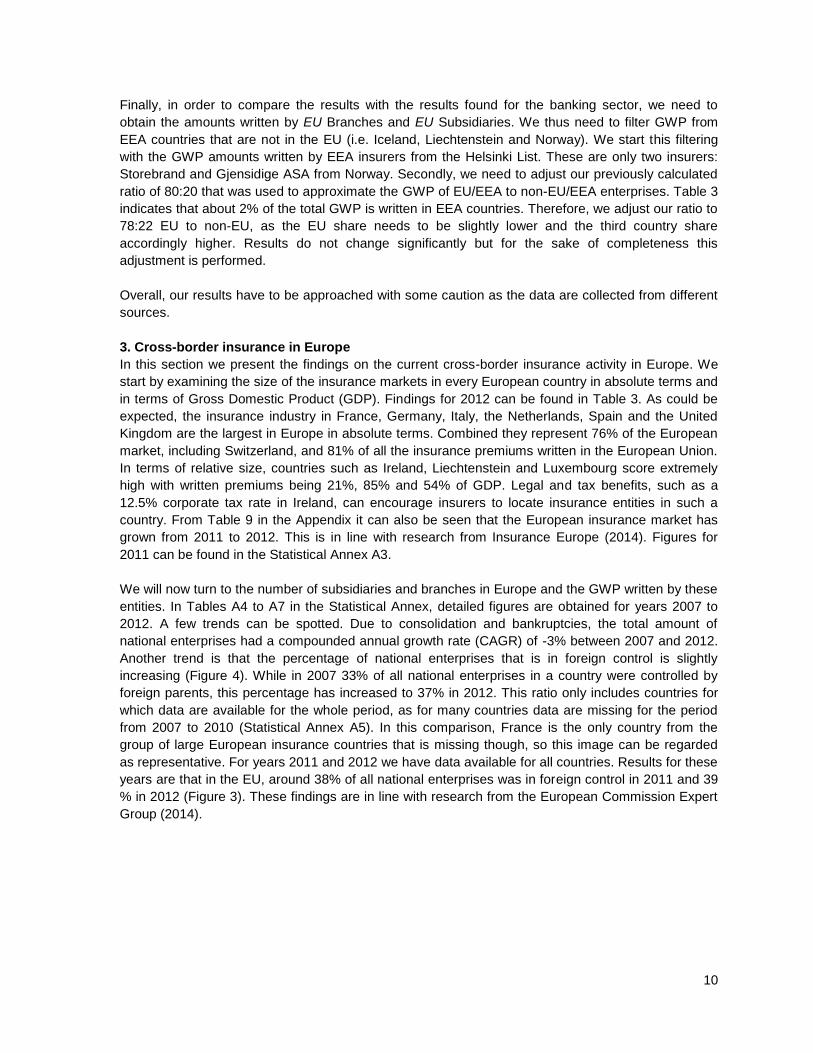
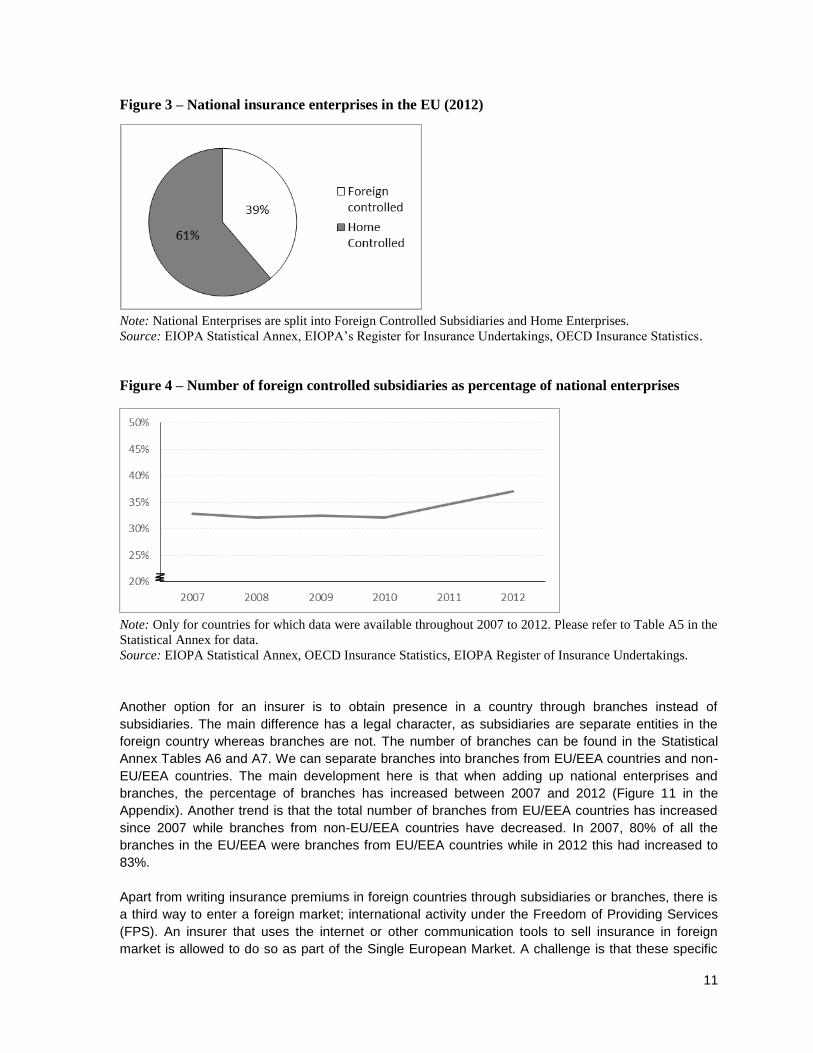
Another trend is that the percentage of national enterprises that is in foreign control is slightly
increasing (Figure 4). While in 2007 33% of all national enterprises in a country were controlled by
foreign parents, this percentage has increased to 37% in 2012. This ratio only includes countries for
which data are available for the whole period, as for many countries data are missing for the period
from 2007 to 2010 (Statistical Annex A5). In this comparison, France is the only country from the
group of large European insurance countries that is missing though, so this image can be regarded
as representative. For years 2011 and 2012 we have data available for all countries. Results for these
years are that in the EU, around 38% of all national enterprises was in foreign control in 2011 and 39
% in 2012 (Figure 3). These findings are in line with research from the European Commission Expert
Group (2014).
11
Figure 3 – National insurance enterprises in the EU (2012)
Note: National Enterprises are split into Foreign Controlled Subsidiaries and Home Enterprises.
Source: EIOPA Statistical Annex, EIOPA’s Register for Insurance Undertakings, OECD Insurance Statistics.
Figure 4 – Number of foreign controlled subsidiaries as percentage of national enterprises
Note: Only for countries for which data were available throughout 2007 to 2012. Please refer to Table A5 in the
Statistical Annex for data.
Source: EIOPA Statistical Annex, OECD Insurance Statistics, EIOPA Register of Insurance Undertakings.
Another option for an insurer is to obtain presence in a country through branches instead of
subsidiaries. The main difference has a legal character, as subsidiaries are separate entities in the
foreign country whereas branches are not. The number of branches can be found in the Statistical
Annex Tables A6 and A7. We can separate branches into branches from EU/EEA countries and non-
EU/EEA countries. The main development here is that when adding up national enterprises and
branches, the percentage of branches has increased between 2007 and 2012 (Figure 11 in the
Appendix). Another trend is that the total number of branches from EU/EEA countries has increased
since 2007 while branches from non-EU/EEA countries have decreased. In 2007, 80% of all the
branches in the EU/EEA were branches from EU/EEA countries while in 2012 this had increased to
83%.
Apart from writing insurance premiums in foreign countries through subsidiaries or branches, there is
a third way to enter a foreign market; international activity under the Freedom of Providing Services
(FPS). An insurer that uses the internet or other communication tools to sell insurance in foreign
market is allowed to do so as part of the Single European Market. A challenge is that these specific

12
data are difficult to obtain. Insurers do not specify in which way they write foreign insurance.
Supervisors and EIOPA have started to capture FPS of national enterprises, but do not specify the
location of these premiums. It thus remains impossible to deduce the country of origin of this FPS
activity. Table 11 in the Appendix shows the insignificance of the FPS data from EIOPA that are
available at this point. If added to our GWP figures, premiums through FPS would only add up to
about 3% of total GWP in 2011 and 2012. We thus do not include FPS figures in our research, which
implies that we are slightly understating cross-border insurance.
The most important aspect of this analysis is the challenge to establish the geographical
segmentation of the GWP written and whether it is written through subsidiaries or branches. Table 4
provides an overview of the GWP written in the European Union and European Economic Area. More
detailed figures can be found in Appendix Tables 8, 9 and 10. By adding up the GWP written by EU
enterprises, it appears that in the EU around 29% of the GWP is written by subsidiaries or branches
from other EU countries. Around 7% is written by foreign subsidiaries or branches from non-EU
countries. This means that 36% of total GWP in the EU is written by foreign controlled subsidiaries or
branches. Looking at individual countries, Figure 5 illustrates that countries such as the Czech
Republic, Ireland, Luxembourg and Slovakia are extremely internationally oriented with more than
80% of GWP written by foreign entities. Countries that are not very internationally oriented are
France, Germany, Netherlands, and Slovenia. Possibly, insurers do not try to enter some of the large
European insurance markets as the insurance density (i.e. the amount of GWP written per capita) is
already extremely high and competition is fierce. Large insurers from these countries in turn move to
Eastern-European countries to take advantage of the low density in those countries.
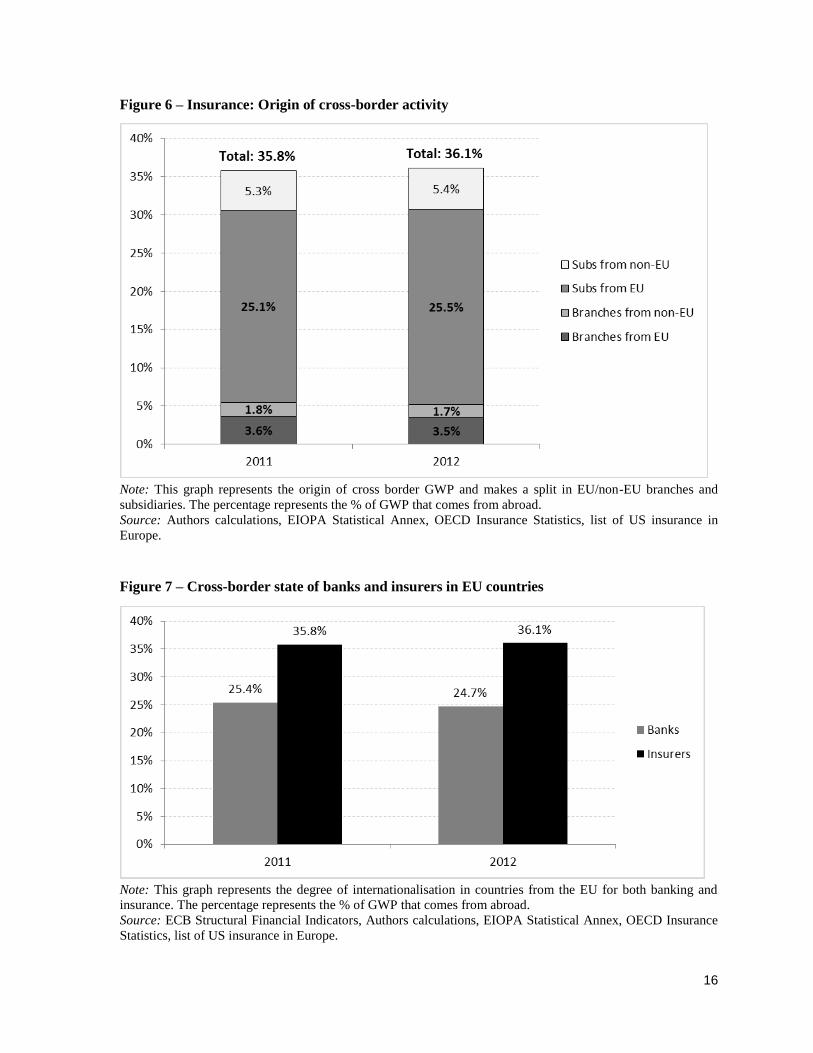
When studying the means through which cross-border premiums are written, it appears that in
general most of the GWP is written through subsidiaries and not through branches. In the EU, around
31% of the cross-border GWP is written through subsidiaries and only 5% through branches. See
Figure 6 for a graphical representation of results. Branches thus turn out to be a less attractive way
for an insurer to write cross-border premiums. Though in some countries such as Portugal, Norway,
Lithuania and Latvia, the GWP amount written through foreign branches is relatively high.
With respect to the difference between Euro and non-Euro countries, there is a relatively large
difference in internationalisation between these countries. In 2012, about 45% of GWP in non-Euro
countries was written by entities controlled from abroad while this was only 32% in Euro countries. In
order to understand this, we will have a look at the largest insurance companies from Europe in Table
5. When comparing the Euro area to the non-Euro area, the comparison depends on the large
countries. For the Euro area these countries are Germany, France, Italy, Spain and the Netherlands
and for the non-Euro area the United Kingdom and Sweden. In Table 5, we find that insurers from
non-Euro countries are very internationally oriented. Prudential obtains 77% of its GWP from abroad
and for RSA this is 64%. In the UK, the domestic insurers are very internationally focused. This could
explain the high degree of internationalisation.

13
Figure 5 – Degree of Internationalisation of European insurance markets (% of GWP)
Note: GWP from foreign subsidiaries and foreign branches is added together and divided by total GWP in order
to arrive at the degree of internationalisation for each country.
Source: Authors calculations, EIOPA Statistical Annex, OECD Insurance Statistics, List on US insurance in
Europe.
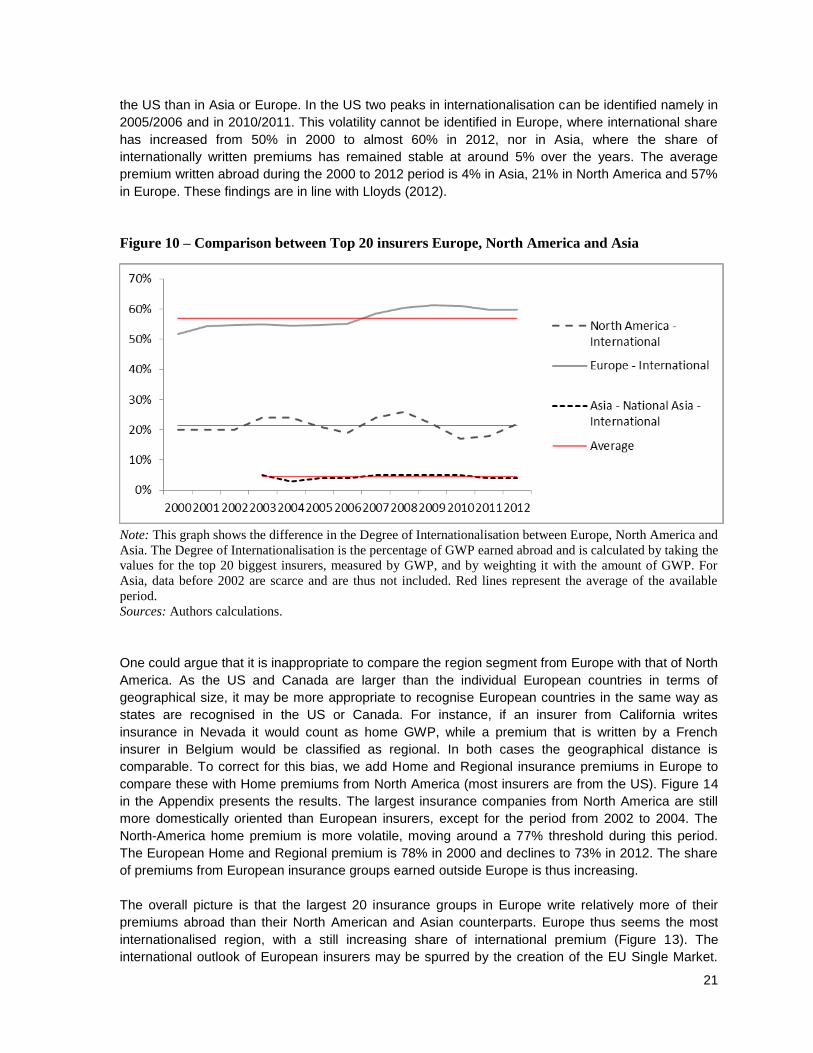
Finally, it would be interesting to examine the difference in Internationalisation with the banking
system. As described in Section 2, total foreign assets is often used to establish the degree of
Internationalisation for Banks. In Table A10 and A11 in the Statistical Annex, total assets for the
European banking system are split into foreign subsidiaries or branches. It appears that the same
countries as in the insurance market are the big players in Europe. These countries are Germany,
France, Italy, the Netherlands, Spain and the United Kingdom. The most striking fact however is that
the degree of internationalisation is lower than in the insurance market, with ‘only’ about 25% of
activity coming from the foreign market compared to 36% in the insurance market (Figure 7). This is
in line with findings of van de Zwet (2003) and Focarelli and Pozzolo (2008) which have found the
insurance sector to be more internationally oriented than the banking sector. Again, the non-Euro
area is more internationally oriented, the same as in the insurance industry. For a per country
comparison, please see Figure 12 in the Appendix. Surprisingly, the difference in internationalisation
in some countries is extremely high, with Ireland, Sweden and Portugal having a much more
internationally oriented insurance market and Finland, Belgium and Slovenia a much more
internationally oriented banking sector.
To summarise, we are able to establish a comprehensive overview of the European insurance market
through combining data from the Helsinki List, OECD Insurance Statistics and EIOPA’s Statistical
Annex. Results are that in 2012, around 36% of total GWP in the EU was written by foreign controlled
insurance entities. This is a very high degree, and much higher than in the banking industry (25%).
12%17%
22%25%
31% 32% 32% 34% 34% 36%38%
42%45%
52% 53%54%
61% 62% 64%65%
71%
76%77%
77%
84%
92% 94%96% 97%
99%
0%
10%
20%
30%
40%
50%
60%
70%
80%
90%
100%
14
Table 3 – European insurance market overview (2012)
Euro (€),
millions % of GDP
Home Enterprises
Foreign
Controlled
Enterprises
EU/EEA
Branches
Non-
EU/EEA
Branches
Austria 17,697 6% 27 20 28 5
Belgium 32,388 9% 53 37 46 5
Bulgaria 901 2% 10 24 10 0
Croatia 1,244 3% n.a. n.a. n.a. n.a.
Cyprus 846 5% 19 8 5 1
Czech
Republic 6,433 4%
11 24 18 2
Denmark 25,485 10% 119 13 44 8
Estonia 300 2% 3 9 5 0
Finland 8,546 4% 50 4 20 5
France 202,554 10% 287 47 80 13
Germany 192,530 7% 334 53 78 15
Greece 4,829 2% 35 18 19 3
Hungary 2,824 3% 9 26 15 1
Iceland 435 4% 11 2 1 0
Ireland 35,174 21% 66 179 33 11
Italy 116,933 7% 77 58 98 21
Latvia 304 1% 4 5 13 0
Liechtenstein 3,620 85% 17 23 1 17
Lithuania 518 2% 3 8 14 0
Luxembourg 23,285 54% 27 285 15 0
Malta 306 4% 25 33 7 1
Netherlands 79,009 13% 190 22 73 12
Norway 20,805 5% 71 3 34 6
Poland 15,615 4% 14 45 18 5
Portugal 8,471 5% 23 19 36 8
Romania 1,935 1% 24 17 10 1
Slovakia 2,283 3% 2 16 19 2
Slovenia 2,002 6% 14 4 5 0
Spain 62,166 6% 211 59 79 19
Sweden 18,651 5% 117 55 37 12
United
Kingdom 252,173 13%
210 156 61 17
EU/EEA 1,115,402 8.5% 2,063 1,272 922 190
EU 1,140,262 8.6% 1,964 1,244 886 167
Note: n.a. is not available. Enterprises and branches are in numbers.
Sources: EIOPA Statistical Annex, Eurostat, OECD Insurance Statistics.

15
Table 4 – Internationalisation in the European insurance market,
measured by GWP (2012)
GWP
Countries Home Region World International
Austria 66% 29% 5% 34%
Belgium 47% 46% 7% 53%
Bulgaria 36% 63% 0% 64%
Croatia 56% 39% 5% 44%
Cyprus 29% 53% 18% 71%
Czech Republic 1% 98% 1% 99%
Denmark 69% 28% 3% 31%
Estonia 3% 96% 1% 97%
Finland 62% 37% 1% 38%
France 78% 19% 3% 22%
Germany 75% 18% 7% 25%
Greece 46% 52% 2% 54%
Hungary 6% 92% 2% 94%
Iceland 87% 13% 0% 13%
Ireland 4% 61% 35% 96%
Italy 66% 29% 5% 34%
Latvia 23% 58% 20% 77%
Liechtenstein 16% 47% 38% 84%
Lithuania 23% 74% 3% 77%
Luxembourg 16% 68% 16% 84%
Malta 38% 44% 18% 62%
Netherlands 83% 14% 2% 17%
Norway 73% 26% 0% 27%
Poland 35% 63% 2% 65%
Portugal 39% 50% 10% 61%
Romania 24% 73% 3% 76%
Slovakia 8% 90% 3% 92%
Slovenia 88% 12% 0% 12%
Spain 68% 26% 6% 32%
Sweden 48% 38% 13% 52%
United Kingdom 58% 32% 10% 42%
Euro Area 68% 26% 6% 32%
Non Euro Area 55% 36% 9% 45%
EU 64% 29% 7% 36%
EU/EEA 64% 29% 7% 36%
Note: Regional is rest of EU, World is non-EU, International is Regional and World
combined. Due to rounding, figures will not always exactly add up to 100.
Source: Authors calculations, EIOPA Statistical Annex, OECD Insurance Statistics,
List on US insurance in Europe.
16
Figure 6 – Insurance: Origin of cross-border activity
Note: This graph represents the origin of cross border GWP and makes a split in EU/non-EU branches and
subsidiaries. The percentage represents the % of GWP that comes from abroad.
Source: Authors calculations, EIOPA Statistical Annex, OECD Insurance Statistics, list of US insurance in
Europe.
Figure 7 – Cross-border state of banks and insurers in EU countries
Note: This graph represents the degree of internationalisation in countries from the EU for both banking and
insurance. The percentage represents the % of GWP that comes from abroad.
Source: ECB Structural Financial Indicators, Authors calculations, EIOPA Statistical Annex, OECD Insurance
Statistics, list of US insurance in Europe.

17
4. Internationalisation of large insurance companies
Having found a high degree of internationalisation from a country perspective, we now turn to
internationalisation of insurance groups from a firm perspective. Extending earlier work from
Schoenmaker et al. (2008), this section looks at the largest insurers from Europe and their
international activities measured by GWP. This section also makes a comparison between the largest
insurers from Europe, North-America and Asia and investigates the internationalisation of the so-
called global systemically important insurers (G-SIIs).
4.1 Internationalisation of the largest European insurers
We start with constructing an overview of the largest insurers from Europe and their degree of
internationalisation in 2012. Following Schoenmaker et al. (2008), we classify insurers into ‘domestic’,
‘semi-international’, ‘regional’ and ‘global’. An insurer is ‘domestic’ if 75% or more of the premium is
written in the home country. A ‘semi-international’ insurer writes between 50 and 75% of its premium
in the home country. A ‘regional’ insurer writes less than 50% of its premium in the home country and
a majority of the remaining international premium in the rest of Europe. Finally, a ‘global’ insurer also
writes less than 50% in the home country but the majority of its international premium in the rest of
the world. Table 5 presents an overview of the largest 25 European insurers and their classification. It
appears that 15 out of the 25 of the large European insurers are very internationally oriented, with 9
European insurers classified as ‘global’ and 6 as ‘regional’. Furthermore, insurers from the
Netherlands and the United Kingdom are more internationally oriented that insurers from France, who
have more domestic insurers such as CNP, Covéa and Groupama. The 25 largest insurers write on
average 42% of GWP in the home country, 32% in the region and 26% in the rest of the world in
2012.
To examine the evolution of internationalisation, Table 12 in the Appendix provides an overview of the
biggest insurers and their GWP segmentation in the years 2000, 2007 and 2012. We can observe
that there are entries and exits of insurers in the Top 25 and ups and downs of the degree of
internationalisation of particular insurers. The largest insurers such as AXA, Allianz, Aviva and
Generali obtain most of their business from abroad throughout the 2000 to 2012 period. It also
appears that they have increased in size much faster than their competitors. In particular, AXA,
Allianz and Generali have grown substantially over the 2000-2012 period, while Aviva has decreased
in size through the divestment of its Dutch subsidiary, Delta Lloyd, in 2009.
Figures 8 and 9 show a graphical representation from 2000 to 2012. Figure 8 makes a split between
home, region and world, while Figure 9 combines region and world and thus shows an overall foreign
percentage GWP. The percentage of GWP that is written in the home country has decreased since
2000, although a slight increase can be identified between 2004 and 2006. The percentage of GWP
that is written at home has reduced from 46% in 2000 to only 42% in 2012. Accordingly, the
percentage of international GWP has increased from 54% of GWP in 2000 (30% from region and
24% from world) to 58% in 2012 (32% from region and 26% from world).
Next, it appears that the geographical share of world is increasing over the last few years and
‘catching up’ with the premium share from the region. Figure 8 illustrates that the share of world has
increased from 24% in 2009 to around 26% in 2012. In contrast, the share of region has decreased
from 35% in 2009 to 32% in 2012. Prudential, ACE, Allianz have all seen a decrease in the relative
importance of regional GWP, while these insurers as well as Zurich Financial Services, and MAPFRE
have greatly increased their presence in countries outside of Europe.

18
In sum, large insurers in Europe are very internationally oriented with about 58% of their GWP written
abroad in 2012. Since 2000 these insurers have increased their international presence from 54% to
58% and especially the percentage GWP written outside of Europe is increasing. Maybe somewhat
surprisingly, the 2008-2009 global financial crisis has not lead to a reduction of internationalisation.
Figure 8 – Geographical segmentation Top 25 insurers Europe
Note: This figure shows the geographical segmentation of the 25 biggest European insurance companies for the
years 2000-2012. The segmentation is established by assigning the Gross Written Premium per insurer to the
classes Home (Domestic), Region (Europe) and World (non-Europe). Calculations are made on a weighted
average basis.
Source: Authors calculations.

19
Table 5 – Classification of the largest European insurance groups (2012)
Global Insurance Groups Country GWP Total Assets H R W
Zurich Financial Services CH € 38,843 € 309,980 11% 40% 49%
Prudential UK € 36,812 € 380,165 23% 0% 77%
Talanx DE € 26,659 € 130,254 35% 32% 33%
MAPFRE ES € 21,579 € 56,983 37% 7% 56%
ING Group NL € 20,277 € 339,513 36% 23% 41%
AEGON NL € 19,526 € 366,118 19% 35% 46%
ACE CH € 21,593 € 70,094 18% 0% 82%
Royal & Sun Alliance [RSA] UK € 11,566 € 28,043 36% 30% 34%
SCOR FR € 9,514 € 32,590 22% 20% 58%
Regional
AXA FR € 84,592 € 761,849 23% 50% 27%
Allianz DE € 72,086 € 694,621 25% 44% 31%
Generali IT € 69,613 € 441,745 29% 65% 6%
BNP Paribas FR € 19,813 € 170,000 32% 45% 23%
Swiss Life CH € 9,978 € 125,787 49% 47% 4%
Vienna Insurance Group AT € 9,686 € 42,336 43% 57% 0%
Semi International
Aviva UK € 27,993 € 388,540 50% 34% 16%
Credit Agricole FR € 22,914 € 291,100 66% 30% 4%
Ageas BE € 9,947 € 97,113 64% 33% 3%
Domestic
Lloyds UK € 31,385 € 80,736 82% 5% 13%
CNP FR € 26,439 € 353,216 81% 8% 11%
Achmea NL € 20,455 € 94,817 94% 6% 0%
ERGO DE € 17,091 € 147,208 77% 18% 5%
Covéa FR € 14,815 € 87,334 89% 10% 1%
Groupama FR € 10,764 € 87,946 80% 20% 0%
Unipol Gruppo Finanziario IT € 11,925 € 83,109 100% 0% 0%
Top 25 Insurance Groups - € 26,635 € 226,448 42% 32% 26%
Note: This table classifies the largest 25 European Insurance Groups into Global, Regional, Semi International and
Domestic Groups. An insurer is Global if it has more than 50% of its premium from abroad with a majority of the
foreign premium from the rest of the world (W). If it has more in the rest of the region (R) category it is classified as
Regional. If an insurer has 50-75% of its revenue from the home country (H), it is Semi-International. An insurer is
Domestic if it obtains more than 75% of its GWP from the home market. In the last row the weighted average is taken
(internationalisation weighted by GWP).
Source: Authors calculations.

20
Figure 9 – Geographical segmentation Top 25 insurers Europe (2)
Note: This figure shows the geographical segmentation of the 25 biggest European insurance companies for the
years 2000-2012. The segmentation is established by assigning the Gross Written Premium per insurer to the
classes Home (Domestic), Region (Europe) and World (non-Europe). This graph adds up the segments Region
and World under the heading International. Calculations are made on a weighted average basis.
Source: Authors calculations.
4.2 Comparison between regions
Following the same methodology, we now look at the difference in degree of internationalisation
between the largest insurers from Europe, Asia and North America. Tables 13 and 14 in the Appendix
provide detailed figures for Asia and North America. Insurers from Asia are generally active in Japan,
India, China, South East Asia and Oceania, but very few have income from Europe or America. Table
13 shows that the largest insurers from Asia write almost all of their GWP in the home country.
Insurers such as Japan Post, Nippon Life, Zenkyoren (JA-Kyosairen), Ping An Insurance and Life
Insurance Corporation of India write more than 98% of their premiums at home.
In Northern America the largest insurers come from the United States and Canada (Table 14).
Results here are more diverse than in Asia, although still a majority of the insurers is very locally
oriented. Insurance groups such as Wellpoint Inc., United Health Group Inc., and Humana Inc. write
more than 95% of their premiums in the home country. More internationally oriented insurance groups
are Prudential of America, MetLife and American International Group (AIG) that wrote 77%, 35% and
30% of their premiums abroad in 2012.
Table 15 provides an overview of the weighted average premiums from the three continents. In Asia,
96% of the premiums are written at home. This percentage has remained stable over the years and
has even increased slightly from 95% in 2000 and 2007 to 96% in 2012. The share of premiums from
World and Region are both only 2% in Asia. This is in line with research from EY (2014) who find little
internationalisation in the Chinese Insurance Market. Findings from Asia are in contrast with the
current trend in Europe where an increasing amount of written premiums is coming from abroad. In
Northern America the share of domestic written premium is 78% in 2012. This is less than in Asia but
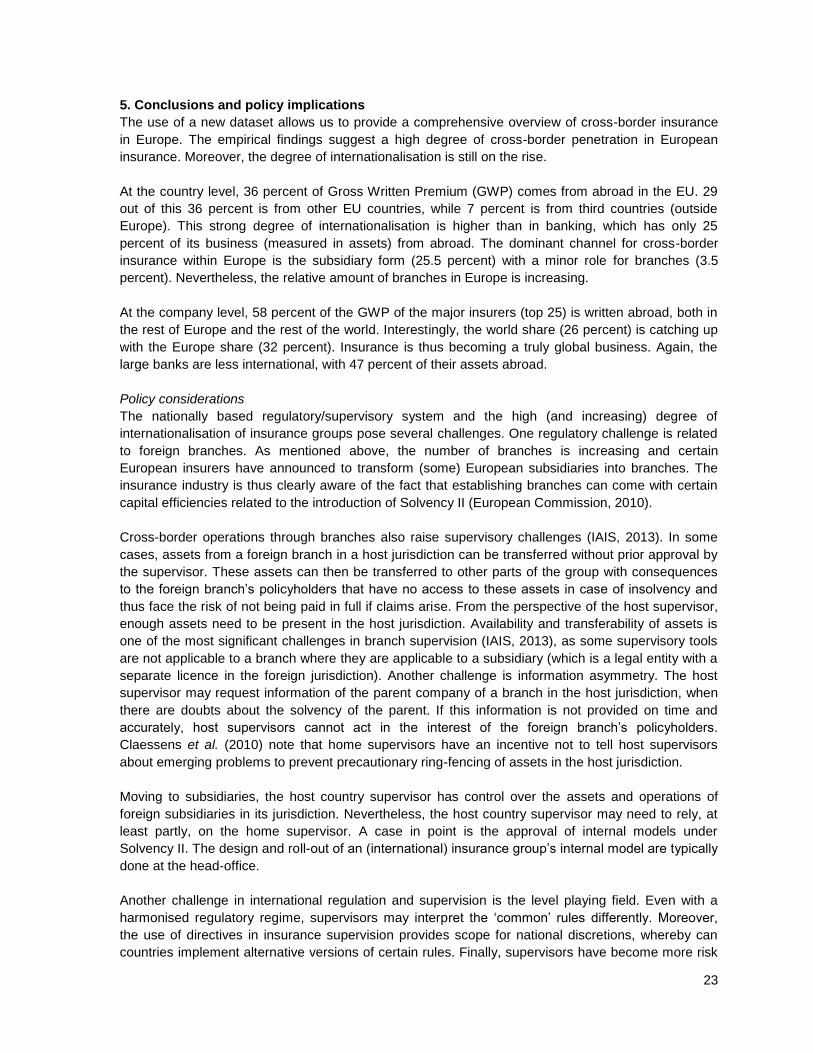
more than in Europe. Next, Figure 10 shows that the International share of GWP is more volatile in
21
the US than in Asia or Europe. In the US two peaks in internationalisation can be identified namely in
2005/2006 and in 2010/2011. This volatility cannot be identified in Europe, where international share
has increased from 50% in 2000 to almost 60% in 2012, nor in Asia, where the share of
internationally written premiums has remained stable at around 5% over the years. The average
premium written abroad during the 2000 to 2012 period is 4% in Asia, 21% in North America and 57%
in Europe. These findings are in line with Lloyds (2012).
Figure 10 – Comparison between Top 20 insurers Europe, North America and Asia
Note: This graph shows the difference in the Degree of Internationalisation between Europe, North America and
Asia. The Degree of Internationalisation is the percentage of GWP earned abroad and is calculated by taking the
values for the top 20 biggest insurers, measured by GWP, and by weighting it with the amount of GWP. For
Asia, data before 2002 are scarce and are thus not included. Red lines represent the average of the available
period.
Sources: Authors calculations.
One could argue that it is inappropriate to compare the region segment from Europe with that of North
America. As the US and Canada are larger than the individual European countries in terms of
geographical size, it may be more appropriate to recognise European countries in the same way as
states are recognised in the US or Canada. For instance, if an insurer from California writes
insurance in Nevada it would count as home GWP, while a premium that is written by a French
insurer in Belgium would be classified as regional. In both cases the geographical distance is
comparable. To correct for this bias, we add Home and Regional insurance premiums in Europe to
compare these with Home premiums from North America (most insurers are from the US). Figure 14
in the Appendix presents the results. The largest insurance companies from North America are still
more domestically oriented than European insurers, except for the period from 2002 to 2004. The
North-America home premium is more volatile, moving around a 77% threshold during this period.
The European Home and Regional premium is 78% in 2000 and declines to 73% in 2012. The share
of premiums from European insurance groups earned outside Europe is thus increasing.
The overall picture is that the largest 20 insurance groups in Europe write relatively more of their
premiums abroad than their North American and Asian counterparts. Europe thus seems the most
internationalised region, with a still increasing share of international premium (Figure 13). The
international outlook of European insurers may be spurred by the creation of the EU Single Market.

22
Our findings are in line with earlier research by Van der Zwet (2003) and Schoenmaker et al. (2008),
who find that European insurance groups have a stronger international presence than their American
or Asian peers. 4.3 Global systemically important insurers In July 2013 the Financial Stability Board (FSB) created a list with Global Systematically Important
Insurers (G-SIIs). This list was established with help of the International Association of Insurance
Supervisors (IAIS), who published a methodology to identify systematically important insurance
companies. Additional requirements for these systematically important insurers are in line with the
policy framework, which was published by the FSB in November 2011, originally intended for banks.
These measures include 1) requirements related to effective recovery and resolution planning of
failing insurers, 2) enhanced group wide supervision and 3) higher loss absorbency requirements
(FSB, 2013). The 2013 list is made up of the following insurance groups: Allianz, American
International Group, Generali, Aviva, AXA, Metlife, Ping An Insurance, Prudential Financial Inc., and
Prudential plc. Regarding the geographical segmentation of these insurers, there is one insurer from
Asia, three from North America and five from Europe. This is consistent with our findings that the
major European insurers are the most internationally oriented, followed by North America as medium-
international and Asia as very domestic.
Table 6 presents GWP, total assets and geographical segmentation of these insurance companies in
2012. Within the group of G-SIIs, the European insurance groups are generally larger than their North
American and Asian peers and more internationally oriented. Prudential is an exception with 77% of
its GWP written in Korea and Japan. Looking at the trend over time, it appears that the G-SIIs have
become more internationally oriented with 39% of premiums coming from home in 2012, down from
46% in 2003. Also the segment Region has lost ground, down from 36% of premiums in 2003 to 31%
in 2012. The degree of internationalisation has thus shifted to World, which increased from 18% in
2003 to 30% in 2012. We conclude that the nine Systematically Important Insurers (except for Ping
An Insurance from China) have become truly global players.
Table 6 – Systematically important insurance companies
Insurance Company Total Assets
2012 (€ mn)
GWP 2012
(€ mn)
2003 2012
H R W H R W
Allianz SE € 694,621 € 72,086 32% 47% 21% 25% 44% 31%
American International Group,
Inc. € 344,404 € 28,809 54% 37% 9% 70% 21% 9%
Generali S.p.A. € 441,745 € 69,613 39% 57% 4% 29% 65% 6%
Aviva plc. € 388,540 € 27,993 53% 37% 10% 50% 34% 16%
AXA S.A. € 761,849 € 84,592 26% 44% 31% 23% 50% 27%
MetLife, Inc. € 634,213 € 31,557 91% 1% 8% 65% 3% 32%
Ping An Insurance (Group)
Company of China, Ltd. € 143,071 € 37,152 99% 1% 0% 99% 1% 0%
Prudential Financial, Inc. € 204,577 € 52,420 54% 0% 46% 67% 0% 33%
Prudential plc. € 380,165 € 36,650 44% 2% 54% 23% 0% 77%
Weighted Average - - 46% 36% 18% 39% 31% 30%
Note: This table displays the 9 Systematically Important Insurance Companies listed by the Financial Stability Board.
Geographical segmentation numbers add up to 100% and show GWP from Home (H), Region (R) and World (W). In the
last row, degree of internationalisation is weighted by GWP.
Source: Authors calculations.
23
5. Conclusions and policy implications
The use of a new dataset allows us to provide a comprehensive overview of cross-border insurance
in Europe. The empirical findings suggest a high degree of cross-border penetration in European
insurance. Moreover, the degree of internationalisation is still on the rise.
At the country level, 36 percent of Gross Written Premium (GWP) comes from abroad in the EU. 29
out of this 36 percent is from other EU countries, while 7 percent is from third countries (outside
Europe). This strong degree of internationalisation is higher than in banking, which has only 25
percent of its business (measured in assets) from abroad. The dominant channel for cross-border
insurance within Europe is the subsidiary form (25.5 percent) with a minor role for branches (3.5
percent). Nevertheless, the relative amount of branches in Europe is increasing.
At the company level, 58 percent of the GWP of the major insurers (top 25) is written abroad, both in
the rest of Europe and the rest of the world. Interestingly, the world share (26 percent) is catching up
with the Europe share (32 percent). Insurance is thus becoming a truly global business. Again, the
large banks are less international, with 47 percent of their assets abroad.
Policy considerations
The nationally based regulatory/supervisory system and the high (and increasing) degree of
internationalisation of insurance groups pose several challenges. One regulatory challenge is related
to foreign branches. As mentioned above, the number of branches is increasing and certain
European insurers have announced to transform (some) European subsidiaries into branches. The
insurance industry is thus clearly aware of the fact that establishing branches can come with certain
capital efficiencies related to the introduction of Solvency II (European Commission, 2010).
Cross-border operations through branches also raise supervisory challenges (IAIS, 2013). In some
cases, assets from a foreign branch in a host jurisdiction can be transferred without prior approval by
the supervisor. These assets can then be transferred to other parts of the group with consequences
to the foreign branch’s policyholders that have no access to these assets in case of insolvency and
thus face the risk of not being paid in full if claims arise. From the perspective of the host supervisor,
enough assets need to be present in the host jurisdiction. Availability and transferability of assets is
one of the most significant challenges in branch supervision (IAIS, 2013), as some supervisory tools
are not applicable to a branch where they are applicable to a subsidiary (which is a legal entity with a
separate licence in the foreign jurisdiction). Another challenge is information asymmetry. The host
supervisor may request information of the parent company of a branch in the host jurisdiction, when
there are doubts about the solvency of the parent. If this information is not provided on time and
accurately, host supervisors cannot act in the interest of the foreign branch’s policyholders.
Claessens et al. (2010) note that home supervisors have an incentive not to tell host supervisors
about emerging problems to prevent precautionary ring-fencing of assets in the host jurisdiction.
Moving to subsidiaries, the host country supervisor has control over the assets and operations of
foreign subsidiaries in its jurisdiction. Nevertheless, the host country supervisor may need to rely, at
least partly, on the home supervisor. A case in point is the approval of internal models under
Solvency II. The design and roll-out of an (international) insurance group’s internal model are typically
done at the head-office.
Another challenge in international regulation and supervision is the level playing field. Even with a
harmonised regulatory regime, supervisors may interpret the ‘common’ rules differently. Moreover,
the use of directives in insurance supervision provides scope for national discretions, whereby can
countries implement alternative versions of certain rules. Finally, supervisors have become more risk

24
averse in the aftermath of the global financial crisis. They tend to require some extra capital cushion -
above the regulatory minimum- at foreign (as well as domestic) subsidiaries, which is not freely
available within the insurance group. Insurance groups can thus be confronted with different pockets
of ring-fenced excess capital within the group which they cannot use (see Cerutti and Schmieder
(2014) for examples of how ring-fencing can lead to extra capital needs in banking).
During the global financial crisis, the US has experienced the limits of state-based insurance
supervision. The Dodd-Frank Reform Act has established the Federal Insurance Office (FIO). This
agency is in charge of monitoring, possibly concerning, developments in the insurance industry and
their contribution to systemic risk. If the latter is identified, it discusses these findings with the
Financial Stability Oversight Council (FSOC). The FIO conducts its monitoring role mostly by
collecting information and data from state regulators and other bodies. If an insurer is identified as
systematically important, it can face higher capital requirements and tougher stress tests. Finally, the
FIO is also authorised to help the Treasury Secretary in the negotiation of agreements that enhance
prudential regulation regarding the insurance sector.
Moving to Europe, the European Insurance and Occupational Pensions Authority (EIOPA) has a
coordinating role in the supervision of international insurance groups. EIOPA takes the lead in setting
secondary rules and harmonising supervisory practices across Europe, in particular with regard to
Solvency II. Next, EIOPA participates in the so-called supervisory colleges of cross-border insurance
groups in order to contribute to the efficient, effective and consistent functioning of these colleges and
to foster coherent application of EU law among colleges. In the case of disagreement on the group
internal model in the supervisory college, for example, EIOPA can give advice (Article 231 of the
Solvency II Directive). Nevertheless, final authority rests with national supervisors in the EU.
The question arises whether this coordinating role of EIOPA is sufficient for the effective supervision
of the large cross-border European insurance groups. Another approach would be giving EIOPA the
role as central supervisor – working with the national supervisors – in a future Insurance Union. There
are several arguments in favour of centralised insurance supervision. First, large insurance groups
typically apply an integrated approach to asset management. Next, Solvency II internal models will be
applied group-wide. Moreover, it may be easier to assess the complexity and opacity of an insurance
group as a whole, as central supervisor than through supervisory colleges. Group supervision may
thus be more effective as well as efficient. Finally, centralised supervision may be an effective answer
to level playing issues. Some supervisors are tougher than others, for example on models or capital
levels. An unlevel playing field is not always visible, as one supervisor may, for example, apply more
conservative rules for valuations or more restrictive assumptions for models than another supervisor.
But there are equally strong arguments against centralisation. First, insurance is less subject to
systemic risk and thus less hounded by (cross-border) externalities. Cross-border externalities in
banking have been a major driver of the Banking Union (Schoenmaker, 2011). Next, insurance, in
particular for retail clients and SMEs, is local business, as products are attuned to national tax and
social security laws. More broadly, the national legal setting (e.g. liability law) is important for
insurance products.
The large, and still increasing, cross-border share of insurance in Europe may at some point tilt the
supervisory balance from coordination to centralisation. Moreover, the insurance industry may push
for an Insurance Union to address effectively level playing field issues.
25
Bibliography
Berger, A., R. Demsetz, and P. Strahan (1999), ‘The Consolidation of the Financial Services Industry: Causes, Consequences and Implications for the Future’, Journal of Banking & Finance, 23, 135-194.
Berger, A., Q. Dai, S. Ongena and D. Smith (2003), ‘To What Extent will the Banking Industry be Globalized? A Study of Bank Nationality and Reach in 20 European Nations’, Journal of Banking & Finance, 27, 383-415.
Cerutti, E. and C. Schmieder (2014), ‘Ring fencing and consolidated banks’ stress tests’, Journal of Financial Stability, 11, 1-12.
Cetorelli, N. and L. Goldberg (2011), ‘Global banks and international shock transmission: Evidence from the Crisis’, IMF Economic Review, 59, 41-76.
Claessens, S., R. Herring, and D. Schoenmaker (2010), A Safer World Financial System: Improving the Resolution of Systemic Institutions, 12th Geneva Report on the World Economy, ICMB, Geneva, and CEPR, London.
Claessens, S. and N. Horen (2014), ‘Foreign banks: Trends and impact’, Journal of Money, Credit and Banking, 46(s1), 295-326.
Cummins, J. D. and M.A. Weiss (2014), ‘Systemic risk and the US insurance sector’, Journal of Risk and Insurance, 81, 489-528.
Delios, A. and P.W. Beamish (2001), ‘Geographic scope, product diversification and the corporate performance of Japanese firms’, Japanese Subsidiaries in the New Global Economy, 47.
Eppink, D. J. and B.M. van Rhijn (1988), ‘The internationalisation of Dutch insurance companies’, Long Range Planning, 21(5), 54-60.
Ernst & Young (2014), Future Directions for foreign insurance companies in China, November 2014.
European Commission (2010), ‘Impact Assessment document to the White Paper on Insurance Guarantee Schemes’, SEC 2010 (828), p. 17.
European Commission (2014), ‘Final Report of the Commission Expert Group on European Insurance Contract Law’, Brussels.
Financial Stability Board (2013), ‘Global Systematical Important Insurers (G-SIIs) and the policy measures that will apply to them’, 18 July, Basel.
Focarelli, D. and A.F. Pozzolo (2005), ‘Where Do Banks Expand Abroad? An Empirical Analysis’, The Journal of Business, 78, 2435-2464.
Focarelli, D. and A.F. Pozzolo (2008), ‘Cross-border M&A’s in the financial sector: Is banking different from insurance?’, Journal of Banking & Finance, 32, 15-29.
Geneva Association (2010), ‘Systemic risk in Insurance: An Analysis of Insurance and Financial Stability’, Special Report of the Geneva Association Systemic Risk Working Group, Geneva.

26
Geringer, J.M., P.W. Beamish, and R.C. DaCosta (1989), ‘Diversification strategy and internationalization: implications for MNE performance’, Strategic Management Journal, 10, 109–119.
Gulamhussen, M. A., C. Pinheiro, and A.F. Pozzolo (2014), ‘International diversification and risk of multinational banks: evidence from the pre-crisis period’, Journal of Financial Stability, 13, 30-43.
Insurance Europe (2014), ‘European Insurance in Figures’, Statistics No. 48, February, Brussels.
IAIS (2010), ‘Position Statement on Key Financial Stability Issues’, International Association of Insurance Supervisors, 4 June, Basel.
IAIS (2013), ‘Issues paper on the supervision of cross-border operations through branches’, International Association of Insurance Supervisors, October, Basel.
Kim, W. C., P. Hwang, and W.P. Burgers (1989), ‘Global diversification strategy and corporate profit performance’, Strategic Management Journal, 10, 45-57.
Lloyds (2012), ‘Insurance Regulation: International Horizons’, Presentation at October 26, London.
Moshirian, F. (2006), ‘Aspects of international financial services’, Journal of Banking & Finance, 30, 1057–1064.
Nicoló, G. D., P. Bartholomew, J. Zaman, and M. Zephirin (2004), ‘Bank consolidation, internationalization, and conglomeration: Trends and implications for financial risk’, Financial markets, institutions & instruments, 13(4), 173-217.
Ramaswamy, K., K.G. Kroeck, and W. Renforth (1996), ‘Measuring the degree of internationalization of a firm: A comment’, Journal of International Business Studies, 27, 167-178.
Schoenmaker, D. (2011), ‘The Financial Trilemma’, Economics Letters, 111, 57-59.
Schoenmaker, D. (2013), ‘Post-crisis reversal in banking and insurance integration: An empirical survey’, Economic Papers No. 496, DG ECFIN, European Commission, Brussels.
Schoenmaker, D. and S. Oosterloo (2005), ‘Financial Supervision in an Integrating Europe: Measuring Cross‐Border Externalities’, International Finance, 8, 1-27.
Schoenmaker, D., S. Oosterloo, and O. Winkels (2008), ‘The Emergence of Cross-Border Insurance Groups within Europe with Centralised Risk Management’, The Geneva Papers on Risk and Insurance-Issues and Practice, 33, 530-546.
Schoenmaker, D., J. de Haan, and S. Oosterloo (2015), ‘Financial Markets and Institutions: A European Perspective’, Third Edition, Cambridge University Press, Cambridge, UK, forthcoming.
Slager, A. M. (2004), ‘Banking Across Borders: Internationalization of the World’s Largest Banks between 1980 and 2000’, PhD dissertation at Erasmus Research Institute of Management (ERIM), Erasmus University, Rotterdam.
Soussa, F. (2004), ‘A Note on Banking FDI in Emerging Markets: Literature Review and Evidence’, Working Paper, Bank of England, London.

27
Stopford, J. and L.T. Wells Jr. (1972), ‘Managing the Multinational Enterprise: Organization of the Firm and Ownership of the Subsidiary’, Basic Books, New York.
Stoyanova, R. and H. Gründl (2014), ‘Solvency II: A Driver for Merger and Acquisitions?’, The Geneva Papers on Risk and Insurance-Issues and Practice, 39, 417-439.
Sullivan, D. (1994), ‘Measuring the degree of internationalization of a firm’, Journal of International Business Studies, 25, 325-342.
Tallman, S. and J. Li (1996), ‘Effects of international diversity and product diversity on the performance of multinational firms’, Academy of Management Journal, 39, 179-196.
Weiss, G. and J. Mühlnickel (2014), ‘Why Do Some Insurers Become Systemically Relevant?’, Journal of Financial Stability, 13, 95-117.
Van der Zwet, A. (2003), ‘The blurring of distinctions between financial sectors: fact or fiction?’, DNB
Occasional Studies 1(2), 1–26.
28
Appendix
1. Data
1.1 Sources used to establish the number of Subsidiaries and Branches
- Statistical Annex to EIOPA Financial Stability Reports. This dataset contains statistical information
submitted by national authorities to EIOPA from 2005 to 2012. It reports the number of National
Enterprises (i.e. Enterprises with their head office in the country), the branches from EU/EEA and
branches from non-EU/EEA countries per country. For more information please consult:
https://eiopa.europa.eu/en/publications/financial-stability/statistics/index.html
- The EIOPA Register of Insurance Undertakings. This is the online register of EU registered
insurance undertakings. It states the number and details of the Domestic Undertakings (i.e. an
undertaking that has been granted the appropriate authorisation for the taking-up of the business of
direct insurance or reinsurance in the country where the undertaking has its legal seat), Third
Country Branches and EU/EEA branches. Two updates are used, as they are provided by EIOPA:
The Register June 2012 (in which the data are from January 2012) and the June 2013 update for
2012 data. These data are used to research the number of domestic undertakings that are
controlled by a foreign enterprise. Also it serves as double check of the EIOPA Financial Stability
Report Data. Information on the EIOPA Register can be found under the following link:
https://eiopa.europa.eu/en/publications/register-of-insurance-undertakings/index.html
- OECD Insurance Statistics 2005-2012. This report contains information for OECD countries on the
number of foreign controlled insurance entities. The data for each country is received from the
relevant national insurance authority. The report can be found under the following link:
http://www.keepeek.com/Digital-Asset-Management/oecd/finance-and-investment/oecd-insurance-
statistics-2013_ins_stats-2013-en#page1
- For France, a report called “2012, The French insurance market in Figures”, issued by the ACPR
Banque de France is used to obtain the number of Branches from EU/EEA countries.
- For the United Kingdom, Switzerland, Spain and Portugal, specific calculations are performed. For
the UK and Switzerland, the total number of Life and Non-Life companies and the market share of
foreign Life and Non-life companies are found in the OECD Insurance Statistics. The number of
foreign controlled entities is then calculated on the basis of market share. For Spain and Portugal,
the absolute changes in number of foreign controlled entities during the years 2007-2012 is taken
from the OECD report as these numbers are higher and more in detail.
- For a small number of years, proxies must be taken as no information is available. In most cases,
the proxy is the value of the number of branches or subsidiaries from the last available observation.
1.2 Sources used to establish the GWP split per country
- The basis for this part of the research is the Statistical Annex to EIOPA Financials Stability Reports.
In worksheet 2 of the Statistical Annex (Excel File), the Gross Written Premium in millions of Euro’s
can be found for life, non-life and composite enterprises. Figures used in this report are from the
row Total excluding Reinsurance. In this file, a split is made between National Enterprises (which
are Enterprises with their head office in the country, excluding gross premiums written abroad),
EU/EEA Branches and non-EU/EEA branches. A limitation of this dataset is that not all figures are
available (See for instance the Netherlands). In our research these gaps are filled with hand-
collected data and data from other sources/reports. Link of Statistical Annex:
https://eiopa.europa.eu/en/publications/financial-stability/statistics/index.html
- Also, the so called “Helsinki List” is used, which was kindly provided by EIOPA. The Helsinki List is
a relatively new data gathering source and as a result is only available for years 2011 and 2012.
The Helsinki List data are provided by national supervisory authorities to EIOPA. It covers all (92 in
2011 and 93 in 2012) insurance undertakings in Europe that have subsidiaries in foreign EU/EEA

29
countries. This list is established to improve the oversight of cross-border insurance groups in
Europe. Data from the Helsinki List are confidential and can thus only be provided at the aggregate
level. Please find these data in the Statistical Annex A8 and A9.
- OECD Insurance Statistics 2005-2012. In this report, the amount of GWP written by foreign
controlled insurance undertakings is provided for some OECD countries. Data and countries for
which these data are used can be found in Statistical Annex A1. http://www.keepeek.com/Digital-
Asset-Management/oecd/finance-and-investment/oecd-insurance-statistics-2013_ins_stats-2013-
en#page1
2. Methodology
2.1 Number of Subsidiaries and Branches
Some data from the EIOPA Statistical Annex and OECD Insurance Statistics are corrected as more
reliable data are found through own research. This mainly concerns data on foreign controlled
insurers and non-EU/EEA Branches. These data are obtained by using the Helsinki List in
combination with EIOPA data on US insurers active in Europe. By adding up the numbers found in
these documents, an upward adjustment of the data reported by the EIOPA Statistical Annex or
OECD Insurance Statistics is made.
The most important methodology aspect is made clear through the following example: For Germany
2011 and 2012, the number of foreign controlled insurance undertakings from the OECD report is 50
for both years. However, with the detailed information from the Helsinki and US Subsidiary List, we
obtain 53 foreign controlled undertakings for both years (for both years 51 from Helsinki List and 2 US
Subs). This information is assumed to be more accurate and is thus used instead of the OECD data.
The same holds for Italy 2011, Portugal 2011 and 2012 and Spain 2011 and 2012.
Apart from the information from the Helsinki List, EIOPA’s register provides detailed information for
the years 2011 and 2012. After having filtered the register to only Domestic Undertakings, research
on the country source of control of every undertaking is performed. As a result, the total amount of
Domestic Undertakings are split into Foreign and Domestic Controlled and certain gaps are filled.
For the number of EU/EEA Branches, the base of our research is once again the EIOPA Statistical
Annex. In combination with the January 2012 (for data concerning 2011) and June 2013 EIOPA
Register (for data for 2012), some data gaps are filled. For instance, EU/EEA Branches for the
Netherlands are not available in the EIOPA report. By using the EIOPA Register, we obtain 75 and 73
EU/EEA branches for 2011 and 2012 respectively.
Finally, also the number of branches from non-EU/EEA countries is taken from the EIOPA statistical
annex and adjusted or filled with data from the Helsinki List and the US Branch & Sub list. For
instance, for Austria the EIOPA Statistical Annex reports 1 third country branch in 2011 and 2012. We
obtain 1 Swiss branch through the Helsinki List and 4 US Branches from the US List. This adds up to
5 non-EU/EEA branches in 2012. As this information is only available for 2011 and 2012, the trend for
years 2007-2012 is taken from the EIOPA Statistical Annex, whereby the hand collected numbers are
taken for 2011 and 2012. Through this procedure, it is possible to adapt numbers for many countries
such as Belgium, Denmark, France, Germany, Ireland, Italy, Poland and the UK.
2.2 Gross Written Premium split per country
As described before, the premium written through a number of unknown branches is deduced from
the EIOPA Statistical Annex if the Helsinki List amount was lower than the Statistical Annex amount.
By doing this, the amounts for the EU/EEA branches are estimated for Cyprus, Estonia, Finland,

30
Germany, Iceland, Ireland, Italy, Lithuania, Luxembourg, Latvia, Poland, Sweden and Spain and for
non-EU/EEA branches for Cyprus, Greece and Ireland (all in 2012). In 2011 the countries for which
the GWP from EU Branches is used are Finland, Germany, Iceland, Ireland, Italy, Lithuania,
Luxembourg, Latvia, Poland, Sweden and Spain. For 2011 GWP written by non-EU/EEA branches,
EIOPA data is used for Cyprus and Ireland.
Figure 11 – Total insurance activity by number of branches in the EU (as a %)
Note: The total number of branches and national enterprises are added up and percentages are taken.
Source: EIOPA Statistical Annex, OECD Insurance Statistics, EIOPA’s Register of Insurance Undertakings,
Authors calculations.
Table 7 – Approximated GWP in Europe
Total GWP written
in the EU (€ mn)
GWP that had to be
approximated (€ mn) Percentage
2011 1,082,937 40,917 3.8%
2012 1,115,402 36,609 3.3%
Note: To arrive at the approximated GWP, we add up the GWP for branches and subsidiaries that have
to be estimated. The right column shows the percentage of total GWP in Europe. Figures in € million.
Including Switzerland.
Source: Authors calculations.
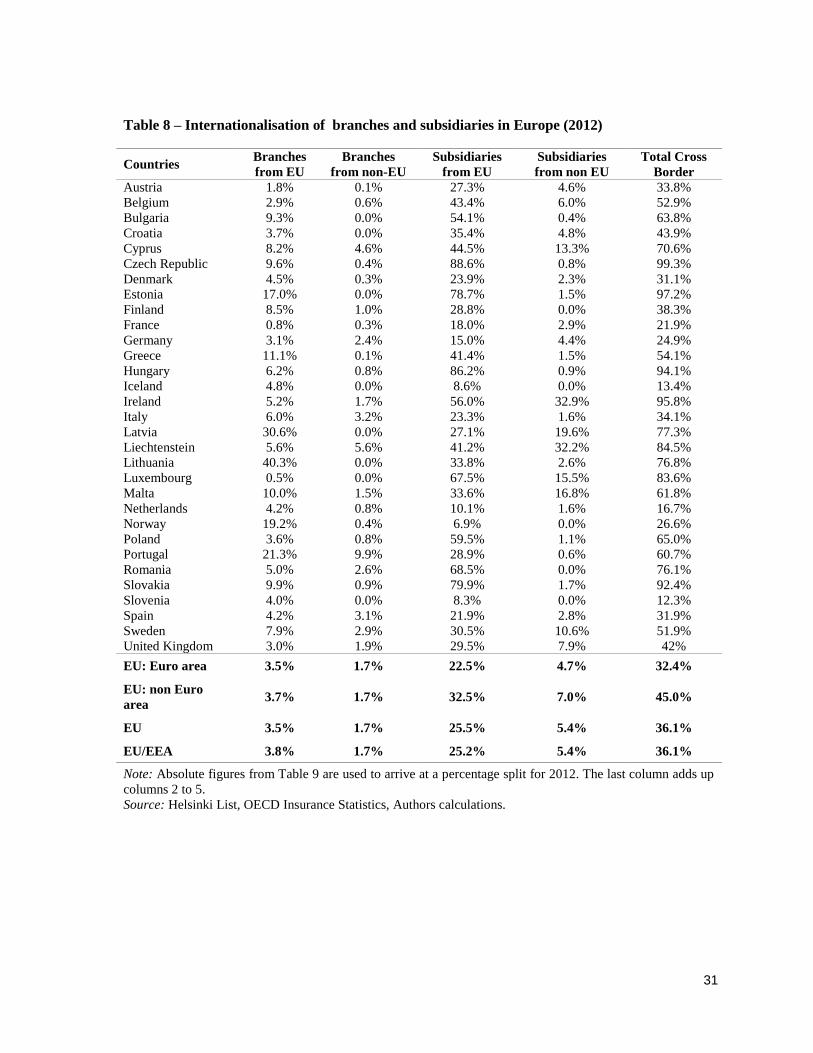
31
Table 8 – Internationalisation of branches and subsidiaries in Europe (2012)
Countries Branches
from EU
Branches
from non-EU
Subsidiaries
from EU
Subsidiaries
from non EU
Total Cross
Border
Austria 1.8% 0.1% 27.3% 4.6% 33.8%
Belgium 2.9% 0.6% 43.4% 6.0% 52.9%
Bulgaria 9.3% 0.0% 54.1% 0.4% 63.8%
Croatia 3.7% 0.0% 35.4% 4.8% 43.9%
Cyprus 8.2% 4.6% 44.5% 13.3% 70.6%
Czech Republic 9.6% 0.4% 88.6% 0.8% 99.3%
Denmark 4.5% 0.3% 23.9% 2.3% 31.1%
Estonia 17.0% 0.0% 78.7% 1.5% 97.2%
Finland 8.5% 1.0% 28.8% 0.0% 38.3%
France 0.8% 0.3% 18.0% 2.9% 21.9%
Germany 3.1% 2.4% 15.0% 4.4% 24.9%
Greece 11.1% 0.1% 41.4% 1.5% 54.1%
Hungary 6.2% 0.8% 86.2% 0.9% 94.1%
Iceland 4.8% 0.0% 8.6% 0.0% 13.4%
Ireland 5.2% 1.7% 56.0% 32.9% 95.8%
Italy 6.0% 3.2% 23.3% 1.6% 34.1%
Latvia 30.6% 0.0% 27.1% 19.6% 77.3%
Liechtenstein 5.6% 5.6% 41.2% 32.2% 84.5%
Lithuania 40.3% 0.0% 33.8% 2.6% 76.8%
Luxembourg 0.5% 0.0% 67.5% 15.5% 83.6%
Malta 10.0% 1.5% 33.6% 16.8% 61.8%
Netherlands 4.2% 0.8% 10.1% 1.6% 16.7%
Norway 19.2% 0.4% 6.9% 0.0% 26.6%
Poland 3.6% 0.8% 59.5% 1.1% 65.0%
Portugal 21.3% 9.9% 28.9% 0.6% 60.7%
Romania 5.0% 2.6% 68.5% 0.0% 76.1%
Slovakia 9.9% 0.9% 79.9% 1.7% 92.4%
Slovenia 4.0% 0.0% 8.3% 0.0% 12.3%
Spain 4.2% 3.1% 21.9% 2.8% 31.9%
Sweden 7.9% 2.9% 30.5% 10.6% 51.9%
United Kingdom 3.0% 1.9% 29.5% 7.9% 42%
EU: Euro area 3.5% 1.7% 22.5% 4.7% 32.4%
EU: non Euro
area 3.7% 1.7% 32.5% 7.0% 45.0%
EU 3.5% 1.7% 25.5% 5.4% 36.1%
EU/EEA 3.8% 1.7% 25.2% 5.4% 36.1%
Note: Absolute figures from Table 9 are used to arrive at a percentage split for 2012. The last column adds up
columns 2 to 5.
Source: Helsinki List, OECD Insurance Statistics, Authors calculations.
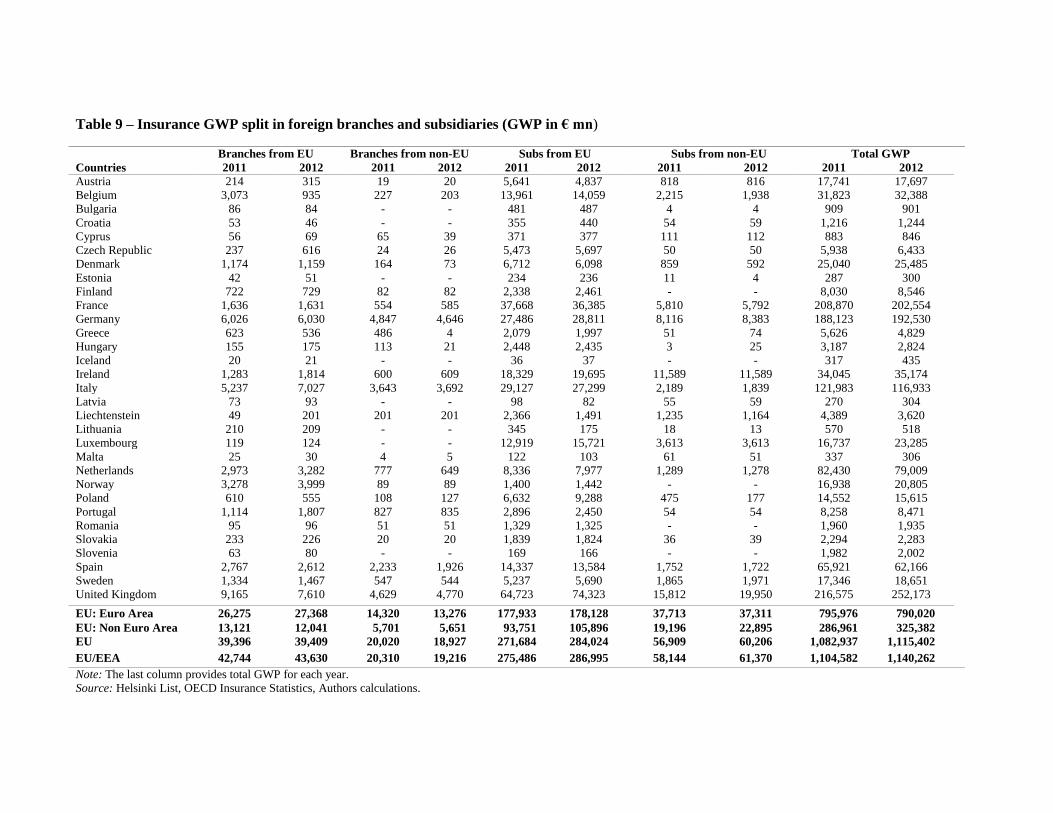
Table 9 – Insurance GWP split in foreign branches and subsidiaries (GWP in € mn)
Branches from EU Branches from non-EU Subs from EU Subs from non-EU Total GWP
Countries 2011 2012 2011 2012 2011 2012 2011 2012 2011 2012
Austria 214 315 19 20 5,641 4,837 818 816 17,741 17,697
Belgium 3,073 935 227 203 13,961 14,059 2,215 1,938 31,823 32,388
Bulgaria 86 84 - - 481 487 4 4 909 901
Croatia 53 46 - - 355 440 54 59 1,216 1,244
Cyprus 56 69 65 39 371 377 111 112 883 846
Czech Republic 237 616 24 26 5,473 5,697 50 50 5,938 6,433
Denmark 1,174 1,159 164 73 6,712 6,098 859 592 25,040 25,485
Estonia 42 51 - - 234 236 11 4 287 300
Finland 722 729 82 82 2,338 2,461 - - 8,030 8,546
France 1,636 1,631 554 585 37,668 36,385 5,810 5,792 208,870 202,554
Germany 6,026 6,030 4,847 4,646 27,486 28,811 8,116 8,383 188,123 192,530
Greece 623 536 486 4 2,079 1,997 51 74 5,626 4,829
Hungary 155 175 113 21 2,448 2,435 3 25 3,187 2,824
Iceland 20 21 - - 36 37 - - 317 435
Ireland 1,283 1,814 600 609 18,329 19,695 11,589 11,589 34,045 35,174
Italy 5,237 7,027 3,643 3,692 29,127 27,299 2,189 1,839 121,983 116,933
Latvia 73 93 - - 98 82 55 59 270 304
Liechtenstein 49 201 201 201 2,366 1,491 1,235 1,164 4,389 3,620
Lithuania 210 209 - - 345 175 18 13 570 518
Luxembourg 119 124 - - 12,919 15,721 3,613 3,613 16,737 23,285
Malta 25 30 4 5 122 103 61 51 337 306
Netherlands 2,973 3,282 777 649 8,336 7,977 1,289 1,278 82,430 79,009
Norway 3,278 3,999 89 89 1,400 1,442 - - 16,938 20,805
Poland 610 555 108 127 6,632 9,288 475 177 14,552 15,615
Portugal 1,114 1,807 827 835 2,896 2,450 54 54 8,258 8,471
Romania 95 96 51 51 1,329 1,325 - - 1,960 1,935
Slovakia 233 226 20 20 1,839 1,824 36 39 2,294 2,283
Slovenia 63 80 - - 169 166 - - 1,982 2,002
Spain 2,767 2,612 2,233 1,926 14,337 13,584 1,752 1,722 65,921 62,166
Sweden 1,334 1,467 547 544 5,237 5,690 1,865 1,971 17,346 18,651
United Kingdom 9,165 7,610 4,629 4,770 64,723 74,323 15,812 19,950 216,575 252,173
EU: Euro Area 26,275 27,368 14,320 13,276 177,933 178,128 37,713 37,311 795,976 790,020
EU: Non Euro Area 13,121 12,041 5,701 5,651 93,751 105,896 19,196 22,895 286,961 325,382
EU 39,396 39,409 20,020 18,927 271,684 284,024 56,909 60,206 1,082,937 1,115,402
EU/EEA 42,744 43,630 20,310 19,216 275,486 286,995 58,144 61,370 1,104,582 1,140,262
Note: The last column provides total GWP for each year.
Source: Helsinki List, OECD Insurance Statistics, Authors calculations.

33
Table 10 – Insurance GWP split in foreign branches and subsidiaries (% of GWP)
Branches from EU Branches from non-EU Subs from EU Subs from non-EU Total foreign GWP
Countries 2011 2012 2011 2012 2011 2012 2011 2012 2011 2012
Austria 1.2% 1.8% 0.1% 0.1% 31.8% 27.3% 4.6% 4.6% 37.7% 33.8%
Belgium 9.7% 2.9% 0.7% 0.6% 43.9% 43.4% 7.0% 6.0% 61.2% 52.9%
Bulgaria 9.5% 9.3% 0.0% 0.0% 52.9% 54.1% 0.4% 0.4% 62.8% 63.8%
Croatia 4.4% 3.7% 0.0% 0.0% 29.2% 35.4% 4.4% 4.8% 37.9% 43.9%
Cyprus 6.4% 8.2% 7.4% 4.6% 42.0% 44.5% 12.5% 13.3% 68.2% 70.6%
Czech Republic 4.0% 9.6% 0.4% 0.4% 92.2% 88.6% 0.8% 0.8% 97.4% 99.3%
Denmark 4.7% 4.5% 0.7% 0.3% 26.8% 23.9% 3.4% 2.3% 35.6% 31.1%
Estonia 14.6% 17.0% 0.0% 0.0% 81.5% 78.7% 3.7% 1.5% 99.8% 97.2%
Finland 9.0% 8.5% 1.0% 1.0% 29.1% 28.8% 0.0% 0.0% 39.1% 38.3%
France 0.8% 0.8% 0.3% 0.3% 18.0% 18.0% 2.8% 2.9% 21.9% 21.9%
Germany 3.2% 3.1% 2.6% 2.4% 14.6% 15.0% 4.3% 4.4% 24.7% 24.9%
Greece 11.1% 11.1% 8.6% 0.1% 37.0% 41.4% 0.9% 1.5% 57.6% 54.1%
Hungary 4.9% 6.2% 3.6% 0.8% 76.8% 86.2% 0.1% 0.9% 85.3% 94.1%
Iceland 6.3% 4.8% 0.0% 0.0% 11.4% 8.6% 0.0% 0.0% 17.7% 13.4%
Ireland 3.8% 5.2% 1.8% 1.7% 53.8% 56.0% 34.0% 32.9% 93.4% 95.8%
Italy 4.3% 6.0% 3.0% 3.2% 23.9% 23.3% 1.8% 1.6% 33.0% 34.1%
Latvia 26.9% 30.6% 0.0% 0.0% 36.1% 27.1% 20.5% 19.6% 83.4% 77.3%
Liechtenstein 1.1% 5.6% 4.6% 5.6% 53.9% 41.2% 28.1% 32.2% 87.7% 84.5%
Lithuania 36.8% 40.3% 0.0% 0.0% 60.6% 33.8% 3.1% 2.6% 100.5% 76.8%
Luxembourg 0.7% 0.5% 0.0% 0.0% 77.2% 67.5% 21.6% 15.5% 99.5% 83.6%
Malta 7.3% 10.0% 1.2% 1.5% 36.3% 33.6% 18.2% 16.8% 63.1% 61.8%
Netherlands 3.6% 4.2% 0.9% 0.8% 10.1% 10.1% 1.6% 1.6% 16.2% 16.7%
Norway 19.4% 19.2% 0.5% 0.4% 8.3% 6.9% 0.0% 0.0% 28.1% 26.6%
Poland 4.2% 3.6% 0.7% 0.8% 45.6% 59.5% 3.3% 1.1% 53.8% 65.0%
Portugal 13.5% 21.3% 10.0% 9.9% 35.1% 28.9% 0.7% 0.6% 59.2% 60.7%
Romania 4.8% 5.0% 2.6% 2.6% 67.8% 68.5% 0.0% 0.0% 75.2% 76.1%
Slovakia 10.2% 9.9% 0.9% 0.9% 80.2% 79.9% 1.6% 1.7% 92.8% 92.4%
Slovenia 3.2% 4.0% 0.0% 0.0% 8.5% 8.3% 0.0% 0.0% 11.7% 12.3%
Spain 4.2% 4.2% 3.4% 3.1% 21.7% 21.9% 2.7% 2.8% 32.0% 31.9%
Sweden 7.7% 7.9% 3.2% 2.9% 30.2% 30.5% 10.8% 10.6% 51.8% 51.9%
United Kingdom 4.2% 3.0% 2.1% 1.9% 29.9% 29.5% 7.3% 7.9% 43.6% 42.3%
EU: Euro Area 3.3% 3.5% 1.8% 1.7% 22.4% 22.5% 4.7% 4.7% 32.2% 32.4%
EU: Non Euro Area 4.6% 3.7% 2.0% 1.7% 32.7% 32.5% 6.7% 7.0% 45.9% 45.0%
EU 3.6% 3.5% 1.8% 1.7% 25.1% 25.5% 5.3% 5.4% 35.8% 36.1%
EU/EEA 3.9% 3.8% 1.8% 1.7% 24.9% 25.2% 5.3% 5.4% 35.9% 36.1%
Note: Absolute figures from Table 9 are used to arrive at a percentage split. The last columns add up columns for respective year.
Source: Helsinki List, OECD Insurance Statistics.

0%
10%
20%
30%
40%
50%
60%
70%
80%
90%
100%
Banks
Insurance
Figure 12 – Internationalisation of banks versus insurers (2012)
Note: This figure is a graphical representation of Tables 10 and A11 from the Appendix.
Source: Helsinki List, OECD Insurance Statistics, Authors calculations
Table 11 – Freedom of provision of services
2011 2012
Total International activity under FPS 38,208 43,128
Total GWP Europe (including FPS) 1,193,418 1,233,607
FPS as % of Total GWP 3.1% 3.5%
Note: The amount of GWP through Freedom of Provision of Services
(FPS) is estimated from EIOPA Statistical Annex and added to own
calculations. Next, the amount of FPS is divided by this total amount.
Figures in € million.
Source: EIOPA Statistical Annex, Helsinki List, OECD Insurance
Statistics, Authors calculations.
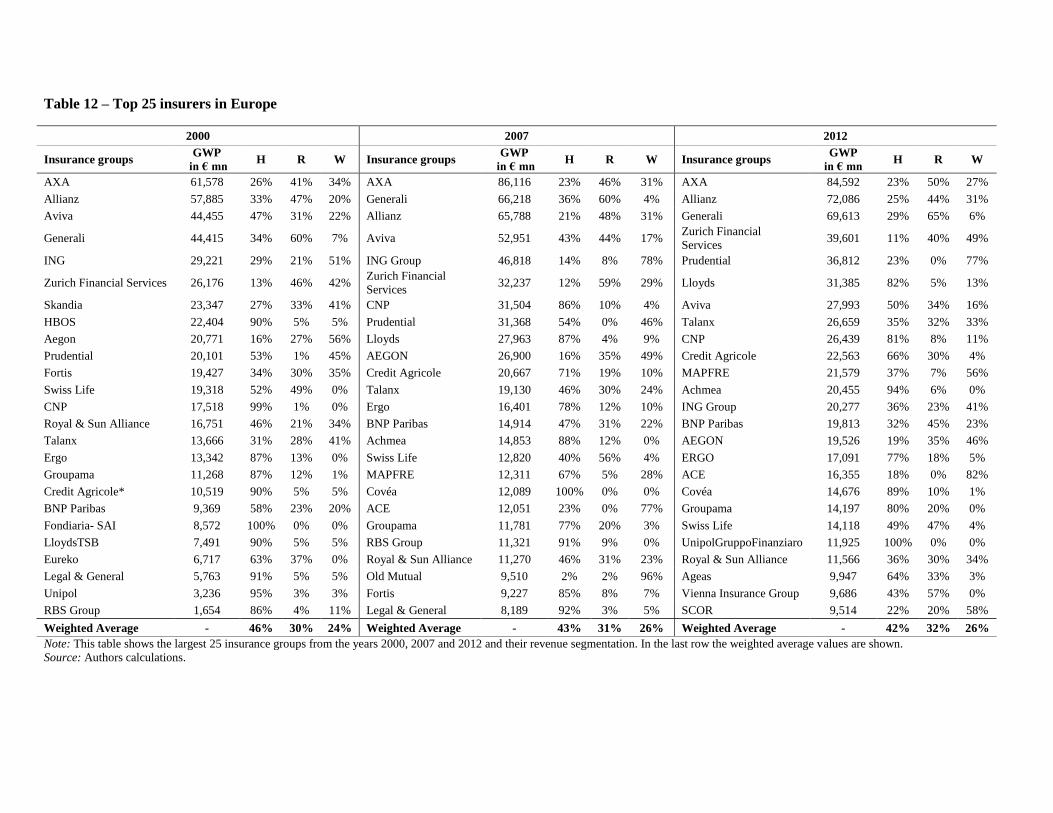
Table 12 – Top 25 insurers in Europe
2000 2007 2012
Insurance groups GWP
in € mn H R W Insurance groups
GWP
in € mn H R W Insurance groups
GWP
in € mn H R W
AXA 61,578 26% 41% 34% AXA 86,116 23% 46% 31% AXA 84,592 23% 50% 27%
Allianz 57,885 33% 47% 20% Generali 66,218 36% 60% 4% Allianz 72,086 25% 44% 31%
Aviva 44,455 47% 31% 22% Allianz 65,788 21% 48% 31% Generali 69,613 29% 65% 6%
Generali 44,415 34% 60% 7% Aviva 52,951 43% 44% 17% Zurich Financial
Services 39,601 11% 40% 49%
ING 29,221 29% 21% 51% ING Group 46,818 14% 8% 78% Prudential 36,812 23% 0% 77%
Zurich Financial Services 26,176 13% 46% 42% Zurich Financial
Services 32,237 12% 59% 29% Lloyds 31,385 82% 5% 13%
Skandia 23,347 27% 33% 41% CNP 31,504 86% 10% 4% Aviva 27,993 50% 34% 16%
HBOS 22,404 90% 5% 5% Prudential 31,368 54% 0% 46% Talanx 26,659 35% 32% 33%
Aegon 20,771 16% 27% 56% Lloyds 27,963 87% 4% 9% CNP 26,439 81% 8% 11%
Prudential 20,101 53% 1% 45% AEGON 26,900 16% 35% 49% Credit Agricole 22,563 66% 30% 4%
Fortis 19,427 34% 30% 35% Credit Agricole 20,667 71% 19% 10% MAPFRE 21,579 37% 7% 56%
Swiss Life 19,318 52% 49% 0% Talanx 19,130 46% 30% 24% Achmea 20,455 94% 6% 0%
CNP 17,518 99% 1% 0% Ergo 16,401 78% 12% 10% ING Group 20,277 36% 23% 41%
Royal & Sun Alliance 16,751 46% 21% 34% BNP Paribas 14,914 47% 31% 22% BNP Paribas 19,813 32% 45% 23%
Talanx 13,666 31% 28% 41% Achmea 14,853 88% 12% 0% AEGON 19,526 19% 35% 46%
Ergo 13,342 87% 13% 0% Swiss Life 12,820 40% 56% 4% ERGO 17,091 77% 18% 5%
Groupama 11,268 87% 12% 1% MAPFRE 12,311 67% 5% 28% ACE 16,355 18% 0% 82%
Credit Agricole* 10,519 90% 5% 5% Covéa 12,089 100% 0% 0% Covéa 14,676 89% 10% 1%
BNP Paribas 9,369 58% 23% 20% ACE 12,051 23% 0% 77% Groupama 14,197 80% 20% 0%
Fondiaria- SAI 8,572 100% 0% 0% Groupama 11,781 77% 20% 3% Swiss Life 14,118 49% 47% 4%
LloydsTSB 7,491 90% 5% 5% RBS Group 11,321 91% 9% 0% UnipolGruppoFinanziaro 11,925 100% 0% 0%
Eureko 6,717 63% 37% 0% Royal & Sun Alliance 11,270 46% 31% 23% Royal & Sun Alliance 11,566 36% 30% 34%
Legal & General 5,763 91% 5% 5% Old Mutual 9,510 2% 2% 96% Ageas 9,947 64% 33% 3%
Unipol 3,236 95% 3% 3% Fortis 9,227 85% 8% 7% Vienna Insurance Group 9,686 43% 57% 0%
RBS Group 1,654 86% 4% 11% Legal & General 8,189 92% 3% 5% SCOR 9,514 22% 20% 58%
Weighted Average - 46% 30% 24% Weighted Average - 43% 31% 26% Weighted Average - 42% 32% 26%
Note: This table shows the largest 25 insurance groups from the years 2000, 2007 and 2012 and their revenue segmentation. In the last row the weighted average values are shown.
Source: Authors calculations.
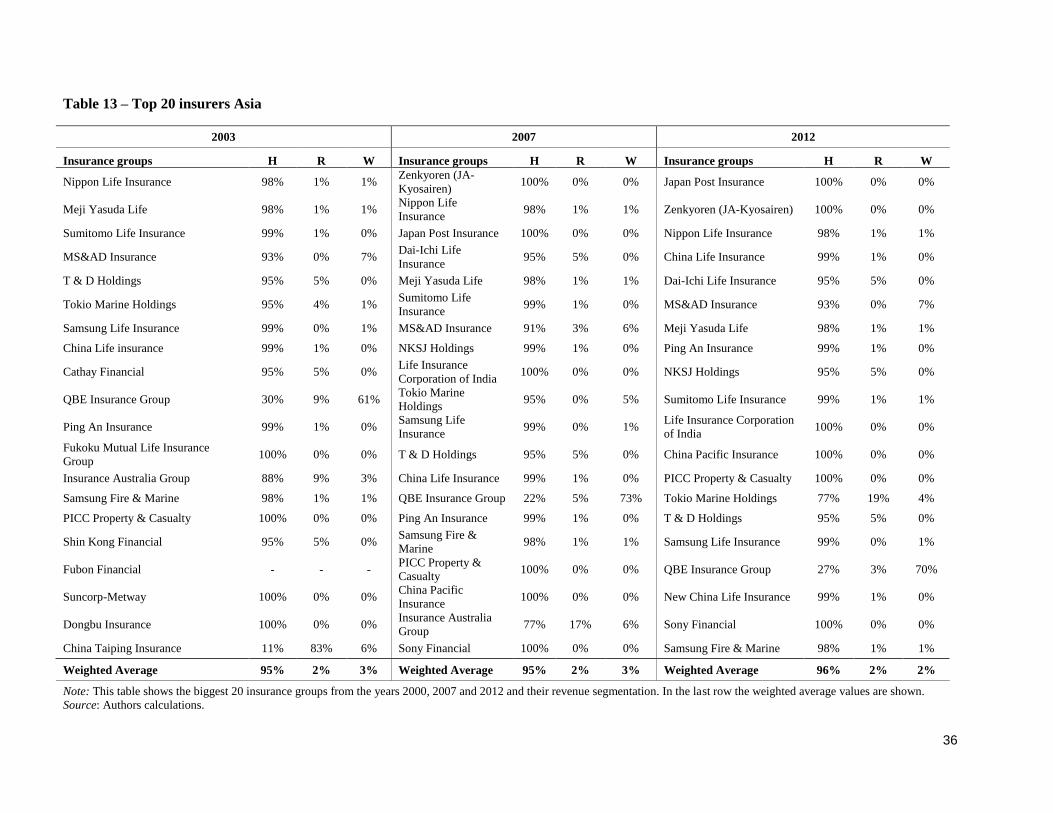
36
Table 13 – Top 20 insurers Asia
2003 2007 2012
Insurance groups H R W Insurance groups H R W Insurance groups H R W
Nippon Life Insurance 98% 1% 1% Zenkyoren (JA-
Kyosairen) 100% 0% 0% Japan Post Insurance 100% 0% 0%
Meji Yasuda Life 98% 1% 1% Nippon Life
Insurance 98% 1% 1% Zenkyoren (JA-Kyosairen) 100% 0% 0%
Sumitomo Life Insurance 99% 1% 0% Japan Post Insurance 100% 0% 0% Nippon Life Insurance 98% 1% 1%
MS&AD Insurance 93% 0% 7% Dai-Ichi Life
Insurance 95% 5% 0% China Life Insurance 99% 1% 0%
T & D Holdings 95% 5% 0% Meji Yasuda Life 98% 1% 1% Dai-Ichi Life Insurance 95% 5% 0%
Tokio Marine Holdings 95% 4% 1% Sumitomo Life
Insurance 99% 1% 0% MS&AD Insurance 93% 0% 7%
Samsung Life Insurance 99% 0% 1% MS&AD Insurance 91% 3% 6% Meji Yasuda Life 98% 1% 1%
China Life insurance 99% 1% 0% NKSJ Holdings 99% 1% 0% Ping An Insurance 99% 1% 0%
Cathay Financial 95% 5% 0% Life Insurance
Corporation of India 100% 0% 0% NKSJ Holdings 95% 5% 0%
QBE Insurance Group 30% 9% 61% Tokio Marine
Holdings 95% 0% 5% Sumitomo Life Insurance 99% 1% 1%
Ping An Insurance 99% 1% 0% Samsung Life
Insurance 99% 0% 1%
Life Insurance Corporation
of India 100% 0% 0%
Fukoku Mutual Life Insurance
Group 100% 0% 0% T & D Holdings 95% 5% 0% China Pacific Insurance 100% 0% 0%
Insurance Australia Group 88% 9% 3% China Life Insurance 99% 1% 0% PICC Property & Casualty 100% 0% 0%
Samsung Fire & Marine 98% 1% 1% QBE Insurance Group 22% 5% 73% Tokio Marine Holdings 77% 19% 4%
PICC Property & Casualty 100% 0% 0% Ping An Insurance 99% 1% 0% T & D Holdings 95% 5% 0%
Shin Kong Financial 95% 5% 0% Samsung Fire &
Marine 98% 1% 1% Samsung Life Insurance 99% 0% 1%
Fubon Financial - - - PICC Property &
Casualty 100% 0% 0% QBE Insurance Group 27% 3% 70%
Suncorp-Metway 100% 0% 0% China Pacific
Insurance 100% 0% 0% New China Life Insurance 99% 1% 0%
Dongbu Insurance 100% 0% 0% Insurance Australia
Group 77% 17% 6% Sony Financial 100% 0% 0%
China Taiping Insurance 11% 83% 6% Sony Financial 100% 0% 0% Samsung Fire & Marine 98% 1% 1%
Weighted Average 95% 2% 3% Weighted Average 95% 2% 3% Weighted Average 96% 2% 2%
Note: This table shows the biggest 20 insurance groups from the years 2000, 2007 and 2012 and their revenue segmentation. In the last row the weighted average values are shown.
Source: Authors calculations.

37
Table 14 – Top 20 insurers North America
2000 2007 2012
Insurance groups H R W Insurance groups H R W Insurance groups H R W
American International
Group 64% 0% 37%
American International
Group 42% 46% 12% United Health Group Inc 99% 1% 0%
Allstate Corp 100% 0% 0% United Health Group 99% 1% 0% Prudential of America 23% 0% 77%
Aetna Inc 88% 0% 12% WellpointInc 100% 0% 0% WellpointInc 100% 0% 0%
Berkshire Hathaway 77% 6% 17% Berkshire Hathaway 63% 9% 28% American International Group 70% 21% 9%
MetLife 96% 0% 4% Allstate Corp 98% 2% 0% Metlife 65% 3% 32%
Cigna Corp 88% 0% 12% MetLife 87% 1% 12% Humana Inc 95% 2% 3%
Hartford Insurance Group 96% 0% 4% Humana Inc 95% 0% 5% Berkshire Hathaway 75% 6% 19%
Prudential of America 89% 0% 11% Travelers Companies
Inc 94% 1% 5%
State Farm Mutual Automobile
Insurance 97% 3% 0%
Humana Inc 95% 2% 3% Hartford Insurance
Group 96% 0% 4% Aetna Inc 98% 1% 1%
Manulife Financial 31% 45% 24% Liberty Mutual 33% 52% 15% Liberty Mutual 81% 0% 19%
Travelers Companies Inc 100% 0% 0% Aetna Inc 75% 0% 25% Allstate Corp 97% 3% 0%
AflcaInc 18% 0% 82% Manulife Financial 100% 0% 0% Cigna Corp 86% 0% 14%
WellpointInc 100% 0% 0% Sun Life Financial 31% 54% 15% Travelers Companies Inc 96% 0% 4%
Unum Group 99% 0% 1% Prudential of America 51% 36% 13% Aflac Inc 23% 0% 77%
Sun Life financial 29% 53% 18% Cigna Corp 67% 0% 33% Massachusetts Mutual Life
Insurance Co 81% 0% 19%
Progressive Corp 99% 0% 1% Progressive Corp 90% 0% 10% Hartford Insurance Group 83% 0% 17%
Genworth Financial 90% 6% 4% Aflac Inc 99% 0% 1% Great West Lifeco 61% 2% 37%
Fairfax Financial 20% 80% 1% Canada Life Assurance 30% 0% 70% Nationwide Mutual Group 100% 0% 0%
Principal Financal Group 100% 0% 0% USAS Insurance
Group 55% 12% 33% Manulife Financial 20% 37% 42%
Lincoln 100% 0% 0% Unum Group 100% 0% 0% Northwestern Mutual 100% 0% 0%
Weighted Average 80% 5% 15% Weighted Average 76% 13% 11% Weighted Average 78% 3% 19%
Note: This table shows the biggest 20 insurance groups from the years 2000, 2007 and 2012 and their revenue segmentation. In the last row the weighted average values are shown.
Source: Authors calculations.

38
Table 15 – Degree of internationalisation of largest insurers Europe, Asia and North America
Continent Segment 2000 2001 2002 2003 2004 2005 2006 2007 2008 2009 2010 2011 2012
North America Home 80% 80% 80% 76% 76% 79% 81% 76% 74% 78% 83% 82% 78%
Region 5% 5% 4% 13% 13% 12% 11% 13% 11% 10% 7% 5% 3%
World 15% 15% 16% 11% 11% 9% 8% 11% 15% 12% 10% 13% 19%
Asia Home - - - 95% 97% 96% 96% 95% 95% 95% 95% 96% 96%
Region - - - 2% 1% 2% 2% 2% 2% 3% 3% 2% 2%
World - - - 3% 2% 2% 2% 3% 3% 2% 2% 2% 2%
Europe Home 48% 46% 45% 45% 45% 45% 45% 41% 40% 39% 39% 40% 40%
Region 30% 31% 32% 33% 34% 34% 33% 32% 34% 36% 35% 33% 33%
World 22% 24% 23% 22% 21% 21% 22% 26% 27% 25% 26% 27% 27%
Note: In this table, the Degree of Internationalisation is stated per continent. It is calculated by weighting every top 20 insurance company’s degree of
internationalisation (Percentage of GWP from domestic, region or world) by its GWP. Values add up to 100%.
Source: Authors calculations.

39
Figure 13 – Comparison between largest insurers Europe, North America and Asia (2)
Note: This graph shows the difference in the Degree of Internationalisation between Europe, North America and
Asia. The degree of Internationalisation is calculated by taking the values for the top 20 biggest insurers,
measured by GWP and by weighting it with the amount of GWP. For Asia, data before 2002 are scarce and thus
these years are not included.
Source: Authors calculations.
Figure 14 – Comparison between Europe and North America
Note: This graph shows a comparison between North America and Europe. For Europe, it shows the percentage
of GWP that is written in the Home country and in the Region (rest of Europe), while for North America only
the Home percentage of GWP is shown. Calculations are based on the 20 biggest insurers from that specific
continent and are performed by weighting the Degree of Internationalisation with GWP.
Source: Authors calculations.