disaster response and recovery needs of communities affected
TRANSCRIPT

Disaster Response and Recovery Needs of Communities
Affected by the Elk River Chemical Spill, West Virginia
April 2014

Page 2 of 66
Centers for Disease Control and Prevention
National Center for Environmental Health,
Division of Environmental Hazards and Health Effects
Health Studies Branch
April 2014

Page 3 of 66
Acknowledgements We would like to acknowledge the following persons for their contributions, without which, this endeavor would not have been possible. West Virginia Bureau for Public Health
Letitia Tierney
Loretta Haddy
Dee Bixler
Miguella Mark-Carew
Carrie Thomas
Erica Thomasson
Stephanie McLemore
Melissa Scott
Centers for Disease Control and Prevention
Sherry Burrer
Tesfaye Bayleyegn
Rebecca Noe
Ethan Fechter-Leggett
Joy Hsu
Nicole Nakata
Lauren Lewis
Amy Wolkin
Amy Schnall
Kathy Harben
Caroline Lagoy
Reba Griffith
David Olson
Dana Flanders
Interview Teams
Survey Respondents

Executive Summary
On January 9, 2014, a chemical spill of 4-methylcyclohexanemethanol (MCHM) and a mixture of
propylene glycol phenyl ethers (PPH), both known to have human health effects, contaminated
the water supply of approximately 100,000 West Virginia households. The West Virginia
Governor declared a State of Emergency, and the local water company issued a “Do Not Use”
water order for nine counties on January 9, 2014, which was lifted for all counties by January
19, 2014. Despite lifting the order, the community’s use of public water systems, information
sources, alternative sources of water, and perception of health impacts and public water
system safety were unclear. Early on, the West Virginia Bureau for Public Health (WVBPH)
requested assistance from the Centers for Disease Control and Prevention (CDC) to better
understand two separate aspects of the spill:
Symptoms experienced by community members in the immediate aftermath, and
The effectiveness of the emergency response and how to improve it in the future.
In collaboration with WVBPH, CDC conducted separate investigations to address these two
issues. To answer questions about symptoms experienced by household members immediately
following the spill, we reviewed emergency department medical records and released the
results in April:
http://www.wvdhhr.org/Elk%20River%20Chemical%20Spill%20Health%20Effects%20-
%20Findings%20of%20Emergency%20Department%20Record%20Review.pdf. WVBPH also
analyzed non-emergency health providers’ reports of patient visits:

Page 5 of 66
http://www.dhhr.wv.gov/News/chemical-spill/Documents/PRFindings.pdf. Both activities
resulted in similar findings.
To address the emergency response, the Community Assessment for Public Health Emergency
Response (CASPER) was conducted April 8-10 to help WVBPH evaluate the response and
improve future responses. The CASPER health questions were not designed or intended to
assess ongoing or current health issues related to the spill. This report describes the CASPER
and its findings.
Specifically, the CASPER looked at: 1) assessing perceived impact of the chemical spill on
households, 2) providing WVBPH with information on household water use and practices
before, during, and after the “Do Not Use” order, and 3) assessing communications to identify
effective approaches for the current and future events.
Interview teams were provided one full-day training and short briefings on safety and media
inquiries prior to conducting interviews over three days in the field. A total of 171 household
interviews were conducted. The major findings of the survey were as follows:
The main method of communication about the chemical spill and implementation and
lifting of the “Do Not Use” order was TV.
The majority of households considered TV as the most reliable source of information
about the chemical spill.
Almost three-fourths of households did not have a 3-day alternative source of water
supply for every person and pet in the household.

Page 6 of 66
The vast majority of households obtained an alternative source of water within less than
one day of trying to obtain an alternative source of water.
A potential challenge faced by households when trying to obtain alternative water
sources was stores being out of water.
Almost one in five households reported that a household member was told not to come
into work because of the chemical spill.
An estimated 21.7% of all households reported having one or more health issues (that
is, symptoms that occurred between the time of the spill and the time they were
interviewed) they felt were related to the chemical spill.
An estimated 3.5% of all households reported having one or more mental health issues
they felt were related to the chemical spill.
Approximately 37.4% of households affected by the “Do Not Use” order used West
Virginia American Water (WVAW) water during the “Do Not Use” order. More
households used WVAW water after the “Do Not Use” order was lifted (approximately
66.8%) than during the “Do Not Use” order, and approximately 98.3% of households
were using their household’s WVAW water at the time the questionnaire was
administered.
Approximately 36.1% of households affected by the “Do Not Use” order believe that
WVAW is safe since the “Do Not Use” order was lifted.
Based on these findings, CDC has made recommendations to WVBPH to guide ongoing recovery
efforts in the assessment area:

Page 7 of 66
1. Focus on TV for public messaging during disasters when communication infrastructure
remains intact, and also use multiple supplemental communication routes.
2. Encourage households to prepare a 3-day water supply to help them become prepared
for future emergencies or disasters of any type.
3. Identify additional ways of providing alternative sources of water supplies in future
emergencies to help reach household members without transportation or those who
cannot leave work. For example, using volunteer agencies (e.g. American Red Cross) to
deliver alternative water supplies.
4. Promote the availability of health and mental health resources to help affected
community members access needed services.
5. Increase community education on current water safety to help alleviate consumer
concerns.

Page 8 of 66
BACKGROUND
On January 9, 2014, a chemical spill into the Elk River 1.5 miles upstream from the Kanawha
County municipal water intake in Charleston, West Virginia contaminated the water supply of
an estimated 100,000 West Virginia households (approximately 300,000 residents). The
chemicals, 4-methylcyclohexanemethanol (MCHM) and a mixture of propylene glycol phenyl
ethers (PPH), have known human health effects including skin, eye, and respiratory tract
irritation. The West Virginia Governor declared a State of Emergency, and the local water
company issued a “Do Not Use” water order for nine counties at 6:00 PM on the evening of
January 9, 2014. The “Do Not Use” order was lifted at different times for different geographic
areas, but it was lifted for all counties by January 19, 2014. The Agency for Toxic Substances
and Disease Registry (ATSDR) in collaboration with the West Virginia Bureau for Public Health
(WVBPH) conducted an Assessment of Chemical Exposure (ACE) investigation reviewing
emergency department medical chart reviews of persons presenting because of exposure to
MCHM and conducted a survey of hospitals that cared for patients exposed to MCHM (1).
However, the affected populations’ use of public water systems, information sources,
alternative sources of water, and perception of health impacts and public water system safety
remained unclear. To move the recovery process forward and improve response capability for
future events, information on the aforementioned topics was urgently needed. The WVBPH
requested assistance from CDC in conducting a Community Assessment for Public Health
Emergency Response (CASPER) in the community affected by the “Do Not Use” order. On April
6, 2014, EIS Officers Ethan Fechter-Leggett and Joy Hsu, CDC staff Sherry Burrer, Rebecca Noe,

Page 9 of 66
and Tesfaye Bayleyegn, and ORISE Fellow Nicole Nakata departed for Charleston, West Virginia.
They joined WVBPH staff in conducting a rapid needs assessment in affected communities using
CASPER methodology.
CASPER is an epidemiologic technique designed to provide household-based information about
an affected community’s needs in a timely, inexpensive, and representative manner used to
assess public health needs in both disaster and non-disaster settings (2). This information can
then be used to initiate public health action, to facilitate disaster planning, and to assess new or
changing needs during the recovery period after a disaster. The specific goals of this CASPER
were the following: 1) assess perceived impact of the chemical spill on households, 2) provide
WVBPH with information on household water use and practices before, during, and after the
“Do Not Use” order, and 3) assess communications to identify effective approaches for the
current and future events.
METHODS AND MATERIALS
To accomplish these goals, WVBPH with assistance from CDC conducted a CASPER in West
Virginia on April 8–10, 2014. WVBPH and CDC, in consultation with CDC’s National Center for
Environmental Health, Division of Environmental Hazards and Health Effects water subject
matter expert, collaborated to develop a two-page data collection instrument (Appendix A).
The survey instrument collected information on demographics; information sources about the
chemical spill, “Do Not Use” order, and lifting of the “Do Not Use” order; alternative sources of
water; household impact of the chemical spill; health and mental health issues since the spill

Page 10 of 66
occurred on January 9, 2014, that household members felt were related to the chemical spill;
and trust of the public water supply.
We used a two-stage cluster sampling methodology to select a representative sample of
households to be interviewed within the sampling frame. The sampling frame was defined as
the area of WVAW company’s “Do Not Use” order, with a total of 122,339 housing units in the
2010 U.S. Census. First, using the Geographic Information Systems CASPER tool, 30 Census
blocks (clusters) were selected with a probability proportional to the number of housing units
within the clusters from the predefined sampling frame (GIS shapefiles of the “Do Not Use”
order area were provided to WVBPH by WVAW). Second, interview teams used systematic
random sampling to select seven households from each of the 30 selected clusters. Two-
person interview teams were assigned to one or two clusters, provided with detailed maps
from Google Earth of all of their cluster(s), instructed to select a random housing unit as the
starting point, and then go to every nth housing unit (where “n” is the total number of housing
units in the cluster divided by seven) to select the seven housing units to interview. Teams
were instructed to make three attempts at each selected household before replacement.
CDC provided the interview teams and additional trainees with an eight-hour training on
Monday, April 7, 2014 on the overall purpose of CASPER, household selection methods,
mapping, questionnaire content, interview techniques, safety, and logistics. On Tuesday, April
8, 2014, CDC provided the interview teams with a one-hour refresher on household selection
methods and data collection and provided answers to questions raised the previous day

Page 11 of 66
regarding questionnaire content. The interview teams also received a safety training from
Kanawha County Sherif’s Department and a media briefing by WVBPH. There were a total of 18
teams on the first and second interview days and 4 teams on the third interview day. All
interview teams had at least one state public health staff person, with assistance provided by
West Virginia University School of Public Health students and CDC staff. Teams conducted
interviews between 2:00pm and 7:30pm EST. Teams attempted to conduct seven interviews in
each of the 30 selected clusters, with a goal of 210 total interviews. All potential respondents
approached were given a copy of the consent sheet containing contact telephone numbers for
WVBPH and educational material from the Substance Abuse and Mental Health Services
Administration (SAMHSA) Disaster Distress Helpline. Documents available for handout to all
interested persons were the SAMHSA Disaster Distress Helpline brochure; a list of community
behavioral health center contacts prepared by WVBPH; a list of additional websites and phone
numbers to obtain more information on the governor’s state of emergency, the role of CDC and
WVBPH in the response efforts, poison center and National Disaster Distress Helpline contact
information, and water testing through private laboratories; and a signed letter from the West
Virginia Commissioner and State Health Officer for interviewer identity verification. Eligible
household respondents were 18 years of age or older and resided in the selected household.
Additionally, the interviewers were instructed to complete confidential referral forms
whenever they encountered urgent physical or mental health needs.
We conducted weighted cluster analysis to report the projected number and percent of
households with a particular response in the sampling frame. We calculated a weight for each

Page 12 of 66
interview to account for the probability that the responding household was selected. Data
analysis was conducted in EpiInfo 7.1.3 (CDC, Atlanta, 2013) to calculate the unweighted
frequencies, unweighted percentages with 95% confidence intervals, weighted frequencies
with 95% confidence intervals, and weighted percentages with 95% confidence intervals. Most
survey questions were asked of all households, regardless of “Do Not Use” order status
(Appendix A, questions highlighted in yellow); however some questions were asked of only
WVAW customers affected by the “Do Not Use” order (Appendix A, questions in white).
RESULTS
The 18 interview teams completed 171 surveys over three days for an overall completion rate
of 81.4% (Table 1). Teams completed interviews in 41.4% of houses approached. Of the
households with an eligible participant answering the door, 63.3% completed an interview.
For all results, unless otherwise stated, frequencies and percentages in the text represent
weighted frequencies and weighted percentages. For those questions asked of only WVAW
customers affected by the “Do Not Use” order, we have a smaller response number for those
questions (n≤128); for each of these question results, marked with an asterisk, we provide the
weighted point estimate, but these should be interpreted as approximate.
Household demographics (Tables 2–7)
The majority (79.7%) of households were single family homes, followed by mobile homes
(12.8%). Almost 81% of households were owned. The majority (87.9%) of households had at

Page 13 of 66
least one female in the household, and of households with at least one female, at least one
pregnant female was reported in 8 interviewed households (projected number of households:
5,127; weighted percent: 5.2% [1.4%–9.0%]*). Over three-fourths (77.4%) of households had at
least one person 18–64 years old, and only 6 interviewed households (projected number of
households: 3,728; weighted percent: 3.2% [0.3%–6.0%]*) had at least one person less than two
years old. Almost all households (99%) identified the ethnicity of household members as not
Hispanic/Latino. The most common race identified of household members was white (93.6%),
followed by black (4.8%). Of households reporting the highest level of education completed by
anyone in the household, 35.7% reported some college and 33.7% reported a bachelor’s or
advanced degree. More than half of households reported a total yearly income of $25,000–
$49,999 (25.9%) or $50,000–$99,999 (25.4%). Of all households, 62.1% reported ownership of
at least one pet; 73.8% (65.1%–82.5%)*of these households owned dogs and 58.1% (47.9%–
68.3%)* owned cats.
Of all households within the sampling frame, 78.5% were WVAW customers. However, 75.0%
of all households reported being affected by the “Do Not Use” order; the remaining 3.5%
mentioned their water came from a different WVAW plant than the plant affected by the
chemical spill and thus their household was not affected by the “Do Not Use” order.
Communications (Tables 8–17, Figures 2–5)
* Weighted point estimate to be interpreted as approximate.

Page 14 of 66
Almost 80% of households first learned about the chemical spill on January 9, 2014, the same
day the chemical spill occurred. By the next day, January 10, 2014, a total of 93.3% of
households had learned about the chemical spill. Of households that reported they learned of
the chemical spill on January 9, 2014, the most common time was in the evening (defined as
5:00PM–11:59PM), while of those that reported learning on January 10, 2014, the most
common time was morning (defined as 12:00AM–11:59AM). Most households (54.3%) first
learned about the chemical spill from TV. The next most common ways households learned
about the chemical spill, though substantially less than the percentage that learned from TV,
were face-to-face talking to people, commonly referred to as word of mouth (12.5%, most
commonly a co-worker), phone call on cell phone (9.3%, most commonly family/relative), and
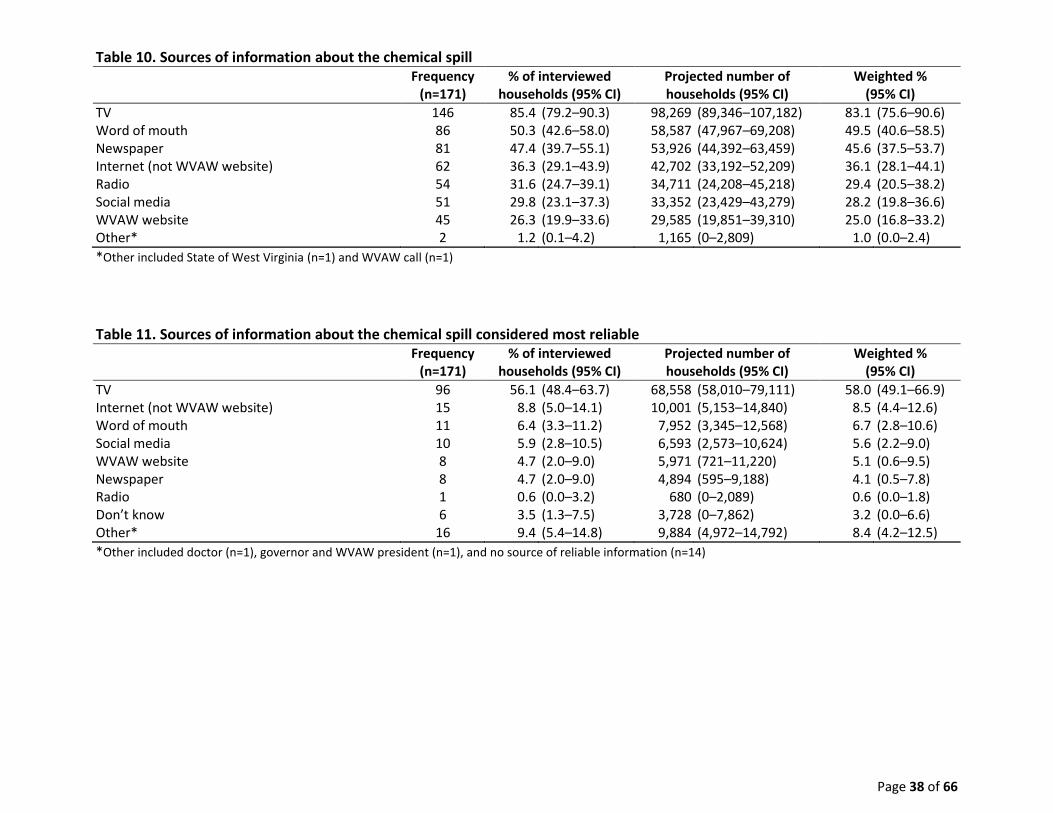
phone call on land line (8.2%, most commonly family/relative). The main sources from which
households received information about the chemical spill were TV (83.1%), word of mouth
(49.5%), and newspaper (45.6%). Only 25% of households cited WVAW website as a source of
information about the chemical spill. The majority (58.0%) of households considered TV as the
most reliable source of information about the chemical spill. The next most common
information sources considered reliable, though substantially less than the percentage that
considered TV the most reliable, were internet (not WVAW website) (8.5%), word of mouth
(6.7%), social media (5.6%), and WVAW website (5.1%). Of all households, regardless of “Do
Not Use” order status, 14 interviewed households (8.2% of interviewed households) stated that
there was no reliable source of information.

Page 15 of 66
Of households affected by the “Do Not Use” order, 65.9% (55.9%–75.8%)* learned about the
“Do Not Use” order on January 9, 2014, the day WVAW issued the order, and considerably
fewer households learned on January 10, 2014 or after. The most common way households
learned about the “Do Not Use” order was from TV (52.5% [44.6%–60.5%]*), followed by word
of mouth (13.8% [8.3%–19.3%]*) and phone call on cell phone (10.0% [3.9%–16.0%]*), both
most commonly from family/relative. Of households affected by the “Do Not Use” order that
tried to get an alternative source of water, the top sources of information about water
distribution sites were TV (38.1% [25.3%–50.9%]*), word of mouth (28.2% [19.5%–36.9%]*),
radio (13.8% [7.1%–20.6%]*), and social media (12.1% [6.0%–18.3%]*).
Of households affected by the “Do Not Use” order, 70.5% (59.9%–81.0%)* did not know the
date when the household first learned the “Do Not Use” order for their household was lifted.
Television was the most common way households learned the “Do Not Use” order for their
household was lifted (52.2% [42.4%–62.0%]*), followed by map on WVAW website (17.3%
[10.8%–23.7%]*) and phone call on land line (8.5% [2.4%–14.7%]*), most commonly from the
WVAW company. Television was also the most common source of information about
household plumbing flushing instructions (58.0% [48.2%–67.8%]*). Other sources of flushing
instructions were WVAW website (36.9% [27.0%–46.8%]*) and word of mouth (12.3% [5.6%–
19.0%]*); all other sources of flushing instructions accounted for less than 14% of households
each. Of households that received plumbing flushing instructions, 94.1% (89.4%–98.8%)*
thought they were easy to read and understand.

Page 16 of 66
Preparedness (Tables 18–19)
Water sources in the household at the time the household first heard about the chemical spill
were WVAW (77.5%; note that 2 of 132 households that were WVAW customers reported not
having WVAW in the household at the time the household first learned about the chemical
spill), purchased water (e.g., bottled water) (51.7%), other public water supply (17.8%), and well
water (1.5%). Almost three-quarters (74.4%) of households did not have a 3-day alternative
source of water supply for each household member and pet in the household. About 14.1% of
households had a 3-day alternative water supply for people only.
Alternative sources of water (Tables 20–27, Figures 6–8)
The vast majority (89.7% [81.8%–98.2%]*) of households affected by the “Do Not Use” order
reported using purchased water (e.g., bottled water) during the “Do Not Use” order; bottled
water from a water distribution site (56.3% [40.8%–71.7%]*) and water from a friend or relative
(42.5% [30.4%–54.6%]*) were also commonly used water sources during the “Do Not Use”
order. Almost all households affected by the “Do Not Use” order (97.5% [94.6%–100.0%]*)
reported trying to get an alternative source of water. Of households that tried to obtain an
alternative source of water, at least half first attempted to get an alternative source of water on
either January 9, 2014 (36.1% [26.4%–45.8%]*) or January 10, 2014 (40.0% [27.4%–52.6%]*) and
first successfully obtained an alternative source of water on January 9, 2014 (29.4% [20.3%–
38.5%]*) or January 10, 2014 (43.2% [30.2%–56.2%]*). The majority (83.6% [77.6%–89.6%]*) of
households successfully procured an alternative source of water the same day they attempted
to obtain it. Most households (72.8% [63.5%–82.1%]*) tried to acquire an alternative source of

Page 17 of 66
water from a large store or grocery (e.g., Wal-Mart, Kroger). Other places where households
tried to get an alternative source of water were a water distribution site in the household’s
town of residence (49.6% [33.8%–65.3%]*) and water from a friend or relative (41.3% [28.1%–
54.5%]*). Most households (70.8% [60.7%–80.8%]*) were able to obtain water from a large
store or grocery, while other places from where households were commonly able to obtain
water were a water distribution site in the household’s town of residence (47.3% [32.4%–
62.2%]*) and water from a friend or relative (45.0% [32.3%–57.7%]*). More households
reported not travelling outside of the affected area to get an alternative source of water (50.4%
[38.2%–62.5%]*) than those that did travel outside of the affected area to purchase water
(16.9% [9.4%–24.4%]*); however, some households (33.9% [20.5%–47.2%]*) reported travelling
and getting water from a friend or relative. The most common length of time households
reported being without any alternative source of drinking water was “never without an
alternative source of drinking water” (55.0% [42.0%–67.9%]*), followed by less than one day
(29.2% [18.7%–39.7%]*); other lengths of time of one day or more were much less frequently
reported. Of households reporting being without an alternative source of drinking water for
one or more days, 47.9% (19.5%–76.4%)* cited the reason was that the store was out of water.
Household impact (Tables 28–31)
Of households affected by the “Do Not Use” order, the majority (81.8% [73.7%–90.0%]*)
reported not staying overnight outside of the home for one or more days to have access to an
alternative source of water, and less than 7% paid money to stay elsewhere (e.g., hotel).
Among all households, regardless of the household’s “Do Not Use” order status, 21.2%

Page 18 of 66
reported their child(ren)s’ school or daycare closed due to the chemical spill; however, school
or childcare closures did not affect 65.8% of households, because they either did not have
children or their children did not go to school or daycare. Of households reporting school or
daycare closure, less than half reported they either took off work to care for their children
(19.2% [5.1%–33.4%]*), or someone was paid to supervise them (4.7% [0.0%–11.4%]*). About
10% of households owned a business, and only 4.8% (0.0%–15.3%)* of those households with a
business reported that the business was ordered to close as a result of the chemical spill. Of all
households, 18.1% claimed any member was told not to come into work because of the
chemical spill, 11.3% with paid leave and 6.8% with unpaid leave.
Health (Tables 32–36)
Of all households, regardless of the household’s “Do Not Use” order status, 21.7% reported
anyone in the household having health issues they felt were related to the chemical spill. Of all
households, regardless of the household’s “Do Not Use” order status, that reported health
issues they felt were related to the chemical spill, 89.6% (78.7%–100.0%)* stated the age of
affected household members was 18 years of age or older, and 14.9% (3.4%–26.5%)* stated the
age as less than 18 years old. Symptoms reported included rash (53.2% [32.9%–73.5%]*), skin
irritation/itching (41.6% [20.6%–62.6%]*), respiratory illness/cough (16.1% [2.6%–29.6%]*),
diarrhea (14.8% [2.0%–27.5%]*), and nausea (13.1% [1.5%–24.6%]*). When asked where
medical care was sought, the most common response was “did not seek medical care” (54.2%
[39.8%–68.6%]*). Of those who did not seek medical care, the most common reason was
because the health issues were not serious enough (66.8% [42.2%–91.4%]*). Of all households

Page 19 of 66
regardless of “Do Not Use” order status, 3.5% reported anyone in the household having
experienced any mental health issues they felt were related to the chemical spill. Of
households reporting mental health issues they felt were related to the chemical spill, 83.7%
(41.3%–100.0%)* mentioned anxiety or stress. Of households reporting any pet ownership,
2.2% (0.0%–5.3%)* reported pets having illness they felt was related to the chemical spill.
Public water supply: behaviors and beliefs (Tables 37–40)
Of households affected by the “Do Not Use” order, 37.4% (26.7%–48.2%)* reported using
WVAW water during the “Do Not Use” order. Of these households, the most common WVAW
water use during the “Do Not Use” order was showered/bathed (80.1% [71.4%–88.8%]*). Other
uses included washed hands (45.9% [28.8%–63.0%]*), washed clothes (37.7% [21.7%–53.6%]*),
ran dishwasher/hand-washed dishes (32.2% [15.5%–48.8%]*), and brushed teeth (31.8%
[18.9%–44.6%]*). Less than half of households participated in consumption behaviors during
the “Do Not Use” order; 26.9% (14.3%–39.4%)* ate or drank food prepared with water and
26.6% (14.1%–39.0%)* drank the water. Of the households reporting any pet ownership, 19.2%
(6.4%–32.0%)* gave WVAW water to pets during the “Do Not Use” order.
Of households affected by the “Do Not Use” order, 66.8% (57.3%–76.3%)* reported using
WVAW water after the “Do Not Use” order was lifted but before the end of January;
households were specifically asked about this time period in order to describe water uses soon
after the “Do Not Use” order was lifted. During this time, WVAW water uses of these
households included showering/bathing (91.8% [85.6%–98.1%]*), hand washing (74.2% [62.1%–

Page 20 of 66
86.3%]*), and brushing teeth (36.3% [22.6%–50.0%]*). Both washing clothes (93.8% [88.3%–
99.3%]*) and dishwashing (67.6% [54.8%–80.4%]*) uses were more than during the “Do Not
Use” order.
Of households affected by the “Do Not Use” order, 98.3% (95.9%–100.0%)* reported using their
household’s WVAW water at the time the questionnaire was administered. The vast majority
of these households reported using their household’s WVAW water at the time the
questionnaire was administered for showering/bathing (97.2% [94.0%–100.0%]*), washing
clothes (95.4% [90.9%–99.9%]*), hand washing (94.2% [90.1%–98.3%]*), and dishwashing
(90.6% [84.3%–96.8%]*). Using the water for cooking at the time the questionnaire was
administered (50.7% [41.0%–60.4%]*) was higher than during the “Do Not Use” order and after
the “Do Not Use” order was lifted but before the end of January. Less than half of the
households (33.5% [26.6%–40.4%]*) reporting using their household’s WVAW water for
drinking at the time the questionnaire was administered. Of households reporting any pet
ownership, 55.0% (42.6%–67.4%)* reported giving WVAW water to pets at the time the
questionnaire was administered.
Of households affected by the “Do Not Use” order, 85.6% (79.8%–91.3%)* reported that before
the chemical spill, they believed the WVAW water supply their household received was safe.
When asked, “Since the ‘Do Not Use’ order was lifted, do you believe that the WVAW water
supply your household receives is safe?” only 36.1% (27.8%–44.4%)* replied “Yes.”

Page 21 of 66
Discussion
These data represent the CASPER surveys conducted in West Virginia on April 8–10, 2014
during the recovery phase after a chemical spill into the Elk River. We anticipated the vast
majority of included households would be WVAW customers affected by the “Do Not Use”
order and that the proportion of households utilizing another public water supply would be
very small. Because only 75.0% of all households within the sampling frame were WVAW
customers affected by the “Do Not Use” order, this resulted in having a smaller sample size for
those questions asked only of WVAW customers affected by the “Do Not Use” order. However,
this may also mean that 25% of all households within the sampling frame were either not
WVAW customers or WVAW customers that were not affected by the “Do Not Use” order (due
to their water coming from a different WVAW plant), and hence were not faced with concerns
of seeking, obtaining, and using alternative sources of water and conducting household
plumbing flushing. We assume that responding households are representative of households
within the sampling frame.
Seven topic areas formed the basis of this CASPER: 1) demographics, 2) communications, 3)
emergency water preparedness, 4) obtainment of alternative sources of water, 5) household
impact of the chemical spill, 6) health and mental health issues felt to be related to the
chemical spill, and 7) public water supply behaviors and beliefs.
Demographics of the sampling frame were similar to the most recent census estimates of the
counties included in the sampling frame, which supports the sample of interviewed households

Page 22 of 66
being representative of the sampling frame (3).
It appears that people knew about the chemical spill and “Do Not Use” order very quickly, most
on the day of the chemical spill. The main methods of communication about the spill and “Do
Not Use” order status included TV and calling on cell phone and land lines, which is consistent
with a disaster or emergency that does not affect communication infrastructure. Word of
mouth was also a common method of communication about the chemical spill and “Do Not
Use” order, which may reflect the day of the week the chemical spill occurred (Thursday) and
time of day most people found out about the chemical spill (i.e., evening of the day the
chemical spill was announced and the following morning). In contrast, radio, social media, and
the internet were more common sources of information about water distribution sites than
they were for communicating information about the chemical spill, “Do Not Use” order, or
lifting of the “Do Not Use” order. Again, this is consistent with methods of information sharing
when communication infrastructure remains intact.
Almost three-fourths of households were not adequately prepared for a lack-of-water crisis and
did not have a 3-day alternative source of water supply while only 14.1% had a 3-day water
supply for each person in the household and were therefore adequately prepared (4). While
not directly comparable, these results seem considerably lower than the 2009 Federal
Emergency Management Agency (FEMA) Personal Preparedness in America report that found
53% of individuals reported “having supplies set aside in their home to be used only in the case
of a disaster,” and of those, 73% reported those supplies included bottled water (5). The vast

Page 23 of 66
majority of households obtained an alternative source of water within less than one day of
trying to obtain an alternative source, and of those who had difficulty obtaining an alternative
source of water, stores being out of water was a commonly cited reason. The percentage of
households that reporting using purchased water (e.g. bottled water) during the “Do Not Use”
order may be higher than the percentage of households reporting trying to get an alternative
source of water from a large store or grocery, because some households reported having water
delivered to them (for example, from church or family members) and may not have considered
this delivery of water an attempt to obtain an alternative source of water. In terms of
household impact, almost one in five households claimed any household member was told not
to come into work because of the chemical spill.
Less than one-quarter of households reported health issues they felt were related to the
chemical spill, and of those, the symptoms reported were similar to what have been reported in
the ACE investigation (1) and to the National Poison Data System (E. J. Scharman, Pharm.D,
email communication, May 2014) (6). If household respondents did not consider stress or
anxiety as a mental health issue, our study may have underestimated mental health issues that
households felt were related to the chemical spill. Symptoms that occurred between the time of
the spill through the time of the household interview were captured. The interview did not ask for dates
when symptoms occurred or when they were resolved.
The vast majority of households were using WVAW water at the time the questionnaire was
administered for many daily activities, including showering/bathing and washing clothes,

Page 24 of 66
dishes, and hands; however, it appears that less than half of households were using the water
for drinking at the time the questionnaire was administered. It is important to note that we do
not know baseline prevalence of drinking WVAW water before the chemical spill. However, we
do know that the majority thought WVAW water was safe before the chemical spill and less
than half think it is safe since the “Do Not Use” order has been lifted.
Recommendations
On the basis of this CASPER, we make the following recommendations to guide ongoing
recovery efforts in the assessment area:
1. Public messaging should focus on TV, while also employing multiple supplemental
communication routes, during disasters where communication infrastructure is intact.
Our results indicate that the most common source of information about the chemical spill and
implementation and lifting of the “Do Not Use” order was TV, and the majority of households
considered TV as the most reliable source of information about the chemical spill. In addition
to TV, this community also utilized a wide range of communication strategies for information
about the chemical spill, “Do Not Use” order status, and water distribution sites. Especially in
disasters and emergencies where communication infrastructure remains intact, projecting
consistent communication objectives through TV as well as multiple other supplemental
communication routes could help reach a broad audience.
2. Promote water preparedness for all households.
Encouraging households to prepare a 3-day water supply for each person and pet in the

Page 25 of 66
household would promote households taking an active role in the recovery process and help
them become prepared for future disasters. The website Ready.gov recommends storing at
least one gallon of water per person per day for drinking and sanitation; the website also details
water preparedness recommendations for special populations (e.g. children, nursing mothers)
and climates as well as methods of preparing and storing water (4).
3. Identify ways to provide alternative water supplies in future emergencies.
While the majority of households obtained an alternative water source the same day they
attempted to obtain it, a potential challenge of households reporting being without an
alternative source of drinking water for one or more days was because a store was out of
water, among other reasons. Despite information sharing about water distribution sites, some
households were without an alternative source of drinking water for one or more days because
they could not locate distribution sites or the distribution site was out of water. Additional
methods of providing alternative sources of water, such as leveraging community centers,
employers, volunteer agencies, and schools, as well as delivery of water to some homes could
help some households obtain water in future emergencies, especially those that cited “no
transportation” or “could not leave work” as reasons for being without water.
4. Publicize health and mental health resources.
Although less than one-quarter of households reported health issues they felt were related to
the chemical spill and 3.5% reported mental health issues they felt were related to the chemical
spill, those who are experiencing health or mental health issues need access to appropriate

Page 26 of 66
services. Promotion of the availability of resources such as local behavioral health centers can
help affected community members access the needed services.
5. Increase community education on current safety.
Our results indicate that less than half of the households affected by the “Do Not Use” order
believe WVAW water is safe since the “Do Not Use” order was lifted. Public messaging,
especially through the most trusted source of information (television), might help increase
community education about current water safety and alleviate some consumer concerns.

Page 27 of 66
References 1. West Virginia Bureau for Public Health (WVBPH) and Agency for Toxic Substances and Disease
Registry (ATSDR). Elk River Chemical Spill Health Effects: Findings of Emergency Department Record
Review. 2014 West Virginia Chemical Release. [Online] April 24, 2014. [Cited: April 30, 2014.]
http://www.wvdhhr.org/Elk%20River%20Chemical%20Spill%20Health%20Effects%20-
%20Findings%20of%20Emergency%20Department%20Record%20Review.pdf.
2. Centers for Disease Control and Prevention (CDC). Community Assessment for Public Health
Emergency Response (CASPER) Toolkit: Second edition. Atlanta (GA) : CDC, 2012.
3. West Virginia QuickFacts from the US Census Bureau. United States Census Bureau. [Online] 2014.
[Cited: April 27, 2014.] http://quickfacts.census.gov/qfd/maps/west_virginia_map.html.
4. Water | Ready.gov. Ready. [Online] April 9, 2014. [Cited: May 8, 2014.] http://www.ready.gov/water.
5. Federal Emergency Management Agency (FEMA) Community Preparedness Division and Citizen
Corps. Personal Preparedness Survey: 2009. Ready: Prepare. Plan. Stay Informed. [Online] August 8,
2013. [Cited: April 30, 2014.] http://www.ready.gov/personal-preparedness-survey-2009.
6. West Virginia Poison Center and MidAtlantic Center for Children's Health and the Environment. Fact
Sheet for Healthcare Providers. Children's National Medical Center. [Online] February 10, 2014. [Cited:
May 9, 2014.]
http://www.childrensnational.org/files/PDF/MACCHE/Charleston_WV_Health_Professionals_Factsheet.
pdf.

Figure 1. Sampling frame with selected clusters

Page 29 of 66
Demographics

Page 30 of 66
Table 1. Questionnaire response rates
Questionnaire response (%) Rate
Completion* 81.4 171/210
Cooperation† 63.3 171/270
Contact‡ 41.4 171/413
*Percent of surveys completed in relation to the standard CASPER goal of 210 (2) †Percent of contacted households that were eligible and willing to participate in the survey ‡Percent of randomly selected households which completed an interview Table 2. Household characteristics Frequency
(n=171) % of interviewed
households (95% CI) Projected number of households (95% CI)
Weighted % (95% CI)
Structure Single family home 134 78.4 (71.4–84.3) 94,288 (82,364–106,211) 79.7 (69.6–89.8) Mobile home 23 13.5 (8.7–19.5) 15,186 (5,747–24,626) 12.8 (4.9–20.8) Multi-unit (e.g., apartment, condo) 14 8.2 (4.6–13.4) 8,787 (0–17,848) 7.4 (0.0–15.1) Own or Rent Own 138 80.7 (74.0–86.3) 95,327 (83,746–106,902) 80.6 (70.8–90.4) Rent 32 18.7 (13.2–25.4) 22,351 (10,666–34,035) 18.9 (9.0–28.8) Other* 1 0.6 (0.0–3.2) 582 (0–1,786) 0.5 (0–1.5)
*Other type not specified

Page 31 of 66
Table 3. Household demographics Frequency
(n=171) % of interviewed
households (95% CI) Projected number of households (95% CI)
Weighted % (95% CI)
Sex* Male 140 83.8 (77.4–89.1) 97,327 (88,596–106,067) 84.0 (76.5–91.6) Female 148 88.6 (82.8–93.0) 101,784 (96,137–107,433) 87.9 (83.0–92.7) Pregnant† 8 5.6 (2.4–10.7) 5,127 (1,404–8,849) 5.2 (1.4–9.0) Male and female 121 72.5 (65.0–79.1) 83,278 (72,164–94,402) 71.9 (62.3–81.5) Age‡ Less than 2 years 6 3.5 (1.3–7.5) 3,728 (396–7,061) 3.2 (0.3–6.0) 2–17 years 42 24.7 (18.4–31.9) 29,691 (19,871–39,500) 25.3 (17.0–33.7) 18–64 years 130 76.5 (69.4–82.6) 90,735 (81,422–100,051) 77.4 (69.4–85.3) 65 years or older 61 35.9 (28.7–43.6) 40,372 (30,797–49,959) 34.4 (26.3–42.6) Ethnicity Hispanic/Latino 2 1.2 (0.1–4.2) 1,165 (0–2,809) 1.0 (0.0–2.4) Not Hispanic/Latino 169 98.8 (95.8–99.9) 117,096 (115,444–118,267) 99.0 (97.6–100.0) Race American Indian/Alaska Native 3 1.8 (0.4–5.0) 2,719 (0–7,071) 2.3 (0.0–6.0) Asian 2 1.2 (0.1–4.2) 1,165 (0–3,534) 1.0 (0.0–3,534) Black 7 4.1 (1.7–8.3) 5,622 (320–10,932) 4.8 (0.3–9.2) White 161 94.2 (89.5–97.2) 110,688 (103,119–118,248) 93.6 (87.2–100.0) Native Hawaiian/Pacific Islander 1 0.6 (0.0–3.2) 583 (0–1,786) 0.5 (0.0–1.5) Other§ 3 1.8 (0.4–5.0) 2,185 (0–4,775) 1.9 (0.0–4.0)
*Of households reporting sex of household member(s) (n=167) †Of households reporting female household member(s) and pregnancy status (n=144)
‡Of households reporting age of household member(s) (n=170)
§Other races included biracial black/white (n=1), Filipino (n=1), and Arabic (n=1)

Page 32 of 66
Table 4. Education level Frequency
(n=170*) % of interviewed
households (95% CI) Projected number of households (95% CI)
Weighted % (95% CI)
Did not complete high school/GED 9 5.3 (2.5–9.8) 7,418 (1,658–13,172) 6.3 (1.4–11.2) High school graduate or equivalent 39 22.9 (16.9–30.0) 27,390 (19,602–35,183) 23.4 (16.7–30.0) Some college (e.g., AA, AS / no degree) 63 37.1 (29.8–44.8) 41,867 (30,372–53,363) 35.7 (25.9–45.5) Bachelor’s degree (e.g., BA, BS, AB) 34 20.0 (14.3–26.8) 22,749 (14,900–30,607) 19.4 (12.7–26.1) Advanced degree (e.g., MD, MS, PhD, JD) 24 14.1 (9.3–20.3) 16,797 (9,712–23,867) 14.3 (8.3–20.4) Refused 1 0.6 (0.0–3.2) 1,019 (0–3,105) 0.9 (0.0–2.7)
*Missing=1
Table 5. Total yearly income Frequency
(n=171) % of interviewed
households (95% CI) Projected number of households (95% CI)
Weighted % (95% CI)
Less than $15,000 8 4.7 (2.0–9.0) 5,962 (1,055–10,870) 5.0 (0.9–9.2) $15,000–$24,999 27 15.8 (10.7–22.1) 18,331 (11,254–25,410) 15.5 (9.5–21.5) $25,000–$49,999 43 25.2 (18.8–32.3) 30,633 (21,016–40,257) 25.9 (17.8–34.0) $50,000–$99,999 44 25.7 (19.4–33.0) 30,080 (21,301–38,847) 25.4 (18.0–32.9) $100,000–$150,000 10 5.9 (2.8–10.5) 6,389 (2,159–10,623) 5.4 (1.8–9.0) More than $150,000 7 4.1 (1.7–8.3) 5,554 (0–11,611) 4.7 (0.0–9.8) Don’t know 9 5.3 (2.4–9.8) 6,107 (1,617–10,607) 5.2 (1.4–9.0) Refused 23 13.5 (8.7–19.5) 15,205 (7,390–23,013) 12.9 (6.3–19.5)
Table 6. Pet ownership and type Frequency
(n=171) % of interviewed
households (95% CI) Projected number of households (95% CI)
Weighted % (95% CI)
Any pet 106 62.0 (54.3–69.3) 73,462 (61,997–84,923) 62.1 (52.4–71.8) Dog(s)* 78 73.6 (64.1–81.7) 54,218 (47,818–60,623) 73.8 (65.1–82.5) Cat(s)* 60 56.6 (46.6–66.2) 42,702 (35,200–50,202) 58.1 (47.9–68.3) Other(s)*† 14 13.2 (7.4–21.2) 9,894 (5,316–14,469) 13.5 (7.2–19.7)
*Of households reporting any pet ownership (n=106) †Other pet types specified included bird (n=1), cattle (n=1), chickens (n=1), fish (n=3), horse (n=1), and sugar glider (n=1)

Page 33 of 66
Table 7. WVAW customers and those affected by the “do not use” order Frequency
(n=171) % of interviewed
households (95% CI) Projected number of households (95% CI)
Weighted % (95% CI)
WVAW customer Yes 132 77.2 (70.2–83.3) 92,774 (74,311–111,232) 78.5 (62.8–94.1) No 39 22.8 (16.8–29.8) 25,487 (7,028–43,952) 21.6 (5.9–37.2) WVAW customer affected by “do not use” order 128* 74.9 (67.7–81.2) 88,696 (69,217–108,175) 75.0 (58.5–91.5)
*4 households reported their WVAW water came from a different WVAW plant than the plant affected by the chemical spill and thus their households
were not affected by the “Do Not Use” order.

Page 34 of 66
Communications

Page 35 of 66
Table 8. Date when households first learned about the chemical spill Frequency
(n=171) % of interviewed
households (95% CI) Projected number of households (95% CI)
Weighted % (95% CI)
January 9, 2014 138 80.7 (74.0–86.3) 93,288 (85,211–101,374) 78.9 (72.1–85.7) January 10, 2014 22 12.9 (8.2–18.8) 17,001 (9,441–24,552) 14.4 (8.0–20.8) January 11, 2014 3 1.8 (0.4–5.0) 1,845 (0–3,953) 1.6 (0.0–3.3) Don’t know 8 4.7 (2.0–9.0) 6,127 (2,201–10,053) 5.2 (1.9–8.5)
Figure 2. Number of households that learned about the chemical spill by date learned
138
22
3 8
0
20
40
60
80
100
120
140
160
1/9/2014 1/10/2014 1/11/2014 Unknown Date
Nu
mb
er
of
Ho
use
ho
lds
Date n=171

Page 36 of 66
Figure 3. Percent of households that learned about the chemical spill by date and time first learned
7.2 4.5
66.7
22.7 33.3
23.9
13.6
33.3
2.2
59.1
33.3
0
10
20
30
40
50
60
70
80
90
100
1/9/2014 1/10/2014 1/11/2014
Pe
rce
nt
of
Ho
use
ho
lds
Date
Morning
Afternoon
Evening
Unknown Time
n=163; unknown date=8

Page 37 of 66
Table 9. How and from whom/where households first learned about the chemical spill Frequency
(n=171) % of interviewed
households (95% CI) Projected number of households (95% CI)
Weighted % (95% CI)
TV 92 53.8 (46.0–61.4) 64,199 (55,224–73,164) 54.3 (46.7–61.9) Face-to-face talking to people 23 13.5 (8.7–19.5) 14,729 (8,628–20,842) 12.5 (7.3–17.6) Co-worker* 7 30.4 (13.2–52.9) 4,777 (892–8,662) 32.4 (6.1–58.8) Friend/neighbor* 6 26.1 (10.2–48.4) 3,592 (734–6,451) 24.4 (5.0–43.8) Stranger* 5 21.7 (7.5–43.7) 3,010 (658–5,360) 20.4 (4.5–36.4) Family/relative* 3 13.0 (2.8–33.6) 1,748 (0–3,860) 11.9 (0.0–26.2) Other*† 2 8.7 (1.1–28.0) 1,602 (0–3,932) 10.9 (0.0–26.7) Phone call on cell phone 15 8.8 (5.0–14.1) 11,049 (5,453–16,653) 9.3 (4.6–14.1) Family/relative‡ 8 53.3 (26.6–78.7) 5,767 (2,723–8,811) 52.2 (24.6–79.7) Friend/neighbor‡ 6 40.0 (16.3–67.7) 4,602 (1,608–7,597) 41.7 (14.5–68.8) Co-worker‡ 1 6.7 (0.2–32.0) 680 (0–2,199) 6.2 (0.0–19.9) Phone call on land line 13 7.6 (4.1–12.7) 9,641 (3,122–16,168) 8.2 (2.6–13.7) Family/relative§ 9 69.2 (38.6–90.9) 6,777 (4,151–9,403) 70.3 (43.1–97.5) Friend/neighbor§ 2 15.4 (1.9–45.5) 1,262 (0–3,020) 13.1 (0.0–31.3) Co-worker§ 1 7.7 (0.2–36.0) 1,019 (0–3,504) 10.6 (0.0–36.3) Other§** 1 7.7 (0.2–36.0) 583 (0–1,979) 6.0 (0.0–20.5) Text message 9 5.3 (2.4–9.8) 5,806 (983–10,630) 4.9 (0.8–9.0) Friend/neighbor†† 3 33.3 (7.5–70.1) 1,981 (0–3,972) 34.1 (0.0–68.4) Family/relative†† 3 33.3 (7.5–70.1) 1,981 (0–3,972) 34.1 (0.0–68.4) Other††‡‡ 3 33.3 (7.5–70.1) 1,845 (0–5,082) 31.8 (0.0–5,082) Social media (e.g., Facebook, Twitter) 6 3.5 (1.3–7.5) 4,602 (838–8,372) 3.9 (0.7–7.1) Radio 4 2.3 (0.6–5.9) 2,427 (72–4,788) 2.1 (0.1–4.0) Internet 3 1.8 (0.4–5.0) 1,981 (0–4,285) 1.7 (0.0–3.6) Don’t know 2 1.2 (0.1–4.2) 1,495 (0–3,644) 1.3 (0.0–3.1) Other§§ 4 2.3 (0.6–5.9) 2,330 (75–4,586) 2.0 (0.1–3.9)
*Of households reporting face-to-face talking to people (n=23) †Other reported were restaurant staff (n=2)
‡Of households reporting phone call on cell phone (n=15)
§Of households reporting phone call on land line (n=13)
**Other reported was employer (n=1) ††
Of households reporting text message (n=9) ‡‡
Other reported were text message from news station (n=3) §§
Other included water odor (n=2), hospital (n=1), and store (n=1)
Page 38 of 66
Table 10. Sources of information about the chemical spill Frequency
(n=171) % of interviewed
households (95% CI) Projected number of households (95% CI)
Weighted % (95% CI)
TV 146 85.4 (79.2–90.3) 98,269 (89,346–107,182) 83.1 (75.6–90.6) Word of mouth 86 50.3 (42.6–58.0) 58,587 (47,967–69,208) 49.5 (40.6–58.5) Newspaper 81 47.4 (39.7–55.1) 53,926 (44,392–63,459) 45.6 (37.5–53.7) Internet (not WVAW website) 62 36.3 (29.1–43.9) 42,702 (33,192–52,209) 36.1 (28.1–44.1) Radio 54 31.6 (24.7–39.1) 34,711 (24,208–45,218) 29.4 (20.5–38.2) Social media 51 29.8 (23.1–37.3) 33,352 (23,429–43,279) 28.2 (19.8–36.6) WVAW website 45 26.3 (19.9–33.6) 29,585 (19,851–39,310) 25.0 (16.8–33.2) Other* 2 1.2 (0.1–4.2) 1,165 (0–2,809) 1.0 (0.0–2.4)
*Other included State of West Virginia (n=1) and WVAW call (n=1)
Table 11. Sources of information about the chemical spill considered most reliable Frequency
(n=171) % of interviewed
households (95% CI) Projected number of households (95% CI)
Weighted % (95% CI)
TV 96 56.1 (48.4–63.7) 68,558 (58,010–79,111) 58.0 (49.1–66.9) Internet (not WVAW website) 15 8.8 (5.0–14.1) 10,001 (5,153–14,840) 8.5 (4.4–12.6) Word of mouth 11 6.4 (3.3–11.2) 7,952 (3,345–12,568) 6.7 (2.8–10.6) Social media 10 5.9 (2.8–10.5) 6,593 (2,573–10,624) 5.6 (2.2–9.0) WVAW website 8 4.7 (2.0–9.0) 5,971 (721–11,220) 5.1 (0.6–9.5) Newspaper 8 4.7 (2.0–9.0) 4,894 (595–9,188) 4.1 (0.5–7.8) Radio 1 0.6 (0.0–3.2) 680 (0–2,089) 0.6 (0.0–1.8) Don’t know 6 3.5 (1.3–7.5) 3,728 (0–7,862) 3.2 (0.0–6.6) Other* 16 9.4 (5.4–14.8) 9,884 (4,972–14,792) 8.4 (4.2–12.5)
*Other included doctor (n=1), governor and WVAW president (n=1), and no source of reliable information (n=14)

Page 39 of 66
Table 12. Date when households first learned about the “do not use” order for their household Frequency
(n=128) % of interviewed
households (95% CI) Projected number of households (95% CI)
Weighted % (95% CI)
January 9, 2014 86 67.2 (58.3–75.2) 58,412 (49,621–67,197) 65.9 (55.9–75.8) January 10, 2014 17 13.3 (7.9–20.4) 13,224 (6,369–20,079) 14.9 (7.2–22.6) January 11, 2014 5 3.9 (1.3–8.9) 3,107 (0–6,423) 3.5 (0.0–7.2) January 12, 2014 3 2.3 (0.5–6.7) 2,185 (0–4,795) 2.5 (0.0–5.4) January 13, 2014 2 1.6 (0.2–5.5) 1,699 (0–4,179) 1.9 (0.0–4.7) January 16, 2014 1 0.8 (0.0–4.3) 583 (0–1,785) 0.7 (0.0–2.0) Don’t know 14 10.9 (6.1–17.7) 9,486 (2,922–16,041) 10.7 (3.3–18.1)
Figure 4. Number of households that learned about the “do not use” order for their household by date first learned
86
17
5 3 2 1
14
0
10
20
30
40
50
60
70
80
90
100
1/9/2014 1/10/2014 1/11/2014 1/12/2014 1/13/2014 1/16/2014 Unknown Date
Nu
mb
er
of
Ho
use
ho
lds
Date n=128

Page 40 of 66
Table 13. How and from whom/where households first learned about the “do not use” order for their household Frequency
(n=128) % of interviewed
households (95% CI) Projected number of households (95% CI)
Weighted % (95% CI)
TV 67 52.3 (43.3–61.2) 46,586 (39,518–53,659) 52.5 (44.6–60.5) Face-to-face talking to people 17 13.3 (7.9–20.4) 12,205 (7,333–17,078) 13.8 (8.3–19.3) Family/relative* 4 23.5 (6.8–49.9) 3,000 (148–5,853) 24.6 (1.2–48.0) Friend/neighbor* 4 23.5 (6.8–49.9) 2,961 (205–5,719) 24.3 (1.7–46.8) Co-worker* 4 23.5 (6.8–49.9) 2,796 (124–5,470) 22.9 (1.0–44.8) Stranger* 4 23.5 (6.8–49.9) 2,427 (127–4,728) 19.9 (1.0–38.7) Other*† 1 5.9 (0.2–28.7) 1,019 (0–3,206) 8.4 (0.2–26.3) Phone call on cell phone 12 9.4 (4.9–15.8) 8,836 (3,477–14,197) 10.0 (3.9–16.0) Family/relative‡ 6 50.0 (21.1–78.9) 4,369 (1,546–7,193) 49.5 (17.5–81.4) Friend/neighbor‡ 5 41.7 (15.2–72.3) 3,787 (1,023–6,549) 42.9 (11.6–74.1) Co-worker‡ 1 8.3 (0.2–38.5) 680 (0–2,277) 7.7 (0.0–25.8) Text message 9 7.0 (3.3–12.9) 6,583 (1,666–11,503) 7.4 (1.9–13.0) Friend/neighbor§ 3 33.3 (7.5–70.1) 2,757 (0–5,646) 41.9 (0–85.8) Family/relative§ 3 33.3 (7.5–70.1) 1,981 (0–4,020) 30.1 (0–61.1) WVAW§ 1 11.1 (0.3–48.3) 583 (0–1,973) 8.9 (0–30.0) Other§** 2 22.2 (2.8–60.0) 1,262 (0–3,573) 19.2 (0–54.3) Phone call on land line 7 5.5 (2.2–10.9) 4,641 (300–8,987) 5.2 (0.3–10.1) Family/relative†† 5 71.4 (29.0–96.3) 3,476 (1,297–5,655) 74.9 (27.9–100.0) Friend/neighbor†† 1 14.3 (0.4–57.9) 583 (0–2,136) 12.6 (0.0–46.0) Other††‡‡ 1 14.3 (0.4–57.9) 583 (0–2,381) 12.6 (0.0–51.3) Radio 6 4.7 (1.7–9.9) 3,592 (934–6,252) 4.1 (1.1–7.0) Social media (e.g., Facebook, Twitter) 3 2.3 (0.5–6.7) 1,845 (0–3,955) 2.1 (0.0–4.5) Internet 2 1.6 (0.2–5.5) 1,398 (0–3,425) 1.6 (0.0–3.9) Newspaper 1 0.8 (0.0–4.3) 583 (0–1,785) 0.7 (0.0–2.0) Don’t know 3 2.3 (0.5–6.7) 1,845 (0–4,588) 2.1 (0.0–5.2) Other§§ 1 0.8 (0.0–4.3) 583 (0–1,785) 0.7 (0.0–2.0)
*Of households reporting face-to-face talking to people (n=17) †Other reported was restaurant staff (n=1)
‡Of households reporting phone call on cell phone (n=12)
§Of households reporting text message (n=9)
**Other reported was new station (n=2) ††
Of households reporting phone call on land line (n=7) ‡‡
Other reported was employer (n=1) §§
Other was announcement in a store (n=1)

Page 41 of 66
Table 14. If visited a water distribution site, sources of information about the water distribution site location Frequency
(n=125*) % of interviewed
households (95% CI) Projected number of households (95% CI)
Weighted % (95% CI)
TV 47 37.6 (29.1–46.7) 32,944 (21,873–44,021) 38.1 (25.3–50.9) Face-to-face talking to people 36 28.8 (21.1–37.6) 24,400 (16,883–31,924) 28.2 (19.5–36.9) Radio 18 14.4 (8.8–21.8) 11,943 (6,103–17,782) 13.8 (7.1–20.6) Social media (e.g., Facebook, Twitter) 16 12.8 (7.5–20.0) 10,486 (5,176–15,788) 12.1 (6.0–18.3) Internet 12 9.6 (5.1–16.2) 8,253 (2,684–13,829) 9.5 (3.1–16.0) Newspaper 9 7.2 (3.4–13.2) 5,631 (1,454–9,812) 6.5 (1.7–11.3) Received phone call on cell phone 5 4.0 (1.3–9.1) 2,913 (0–5,892) 3.4 (0.0–6.8) Received phone call on land line 4 3.2 (0.9–8.0) 2,427 (83–4,767) 2.8 (0.1–5.5) Text message 3 2.4 (0.5–6.9) 2,524 (0–5,692) 2.9 (0.0–6.6) Other† 12 9.6 (51–16.2) 7,185 (1,915–12,451) 8.3 (2.2–14.4) Don’t know 1 0.8 (0.0–4.4) 1,019 (0–3,133) 1.2 (0.0–3.6) Not applicable 42 33.6 (25.4–42.6) 29,624 (17,750–41,504) 34.6 (20.5–48.0)
*3 households affected by the “do not use” order reported not trying to get an alternative source of water †Other included drive-by (n=10), EMS (n=1), and work (n=1)

Page 42 of 66
Table 15. Date when households first learned the “do not use” order for their household was lifted Frequency
(n=128) % of interviewed
households (95% CI) Projected number of households (95% CI)
Weighted % (95% CI)
January 13, 2014 1 0.8 (0.0–4.3) 583 (0–1,785) 0.7 (0.0–2.0) January 14, 2014 10 7.8 (3.8–1.9) 6,525 (1,724–11,319) 7.4 (1.9–12.8) January 15, 2014 5 3.9 (1.3–8.9) 4,224 (555–7,894) 4.8 (0.6–8.9) January 16, 2014 4 3.1 (0.9–7.8) 2,767 (0–5,544) 3.1 (0.0–6.3) January 17, 2014 2 1.6 (0.2–5.5) 1,165 (0–2,843) 1.3 (0.0–3.2) January 18, 2014 2 1.6 (0.2–5.5) 1,262 (0–3,084) 1.4 (0.0–3.5) January 19, 2014 1 0.8 (0.0–4.3) 816 (0–2,510) 0.9 (0.0–2.8) January 20, 2014 1 0.8 (0.0–4.3) 680 (0–2,082) 0.8 (0.0–2.4) January 22, 2014 3 2.3 (0.5–6.7) 2,282 (0–4,978) 2.6 (0.0–5.6) January 23, 2014 2 1.6 (0.2–5.5) 1,262 (0–3,084) 1.4 (0.0–3.5) January 24, 2014 1 0.8 (0.0–4.3) 583 (0–1,785) 0.7 (0.0–2.0) January 29, 2014 2 1.6 (0.2–5.5) 1,602 (0–3,983) 1.8 (0.0–4.5) January 30, 2014 2 1.6 (0.2–5.5) 1,262 (0–3,084) 1.4 (0.0–3.5) February 9, 2014 2 1.6 (0.2–5.5) 1,165 (0–3,597) 1.3 (0.0–4.0) Don’t know 90 70.3 (61.6–78.1) 62,519 (53,157–71,876) 70.5 (59.9–81.0)
Figure 5. Number of households that learned the “do not use” order for their household was lifted by date first learned
1
10 5 4 2 2 1 1 3 2 1 2 2 2
90
0
10
20
30
40
50
60
70
80
90
100
Nu
mb
er
of
Ho
use
ho
lds
Date n=128

Page 43 of 66
Table 16. How and from whom/where households first learned the “do not use” order for their household was lifted Frequency
(n=128) % of interviewed
households (95% CI) Projected number of households (95% CI)
Weighted % (95% CI)
TV 66 51.6 (42.6–60.5) 46,295 (37,644–54,953) 52.2 (42.4–62.0) Map on WVAW website 23 18.0 (11.7–25.7) 15,302 (9,587–21,021) 17.3 (10.8–23.7) Phone call on land line 11 8.6 (4.4–14.9) 7,573 (2,137–13,008) 8.5 (2.4–14.7) WVAW* 6 54.6 (23.4–83.3) 4,029 (1,567–6,491) 53.2 (20.7–85.7) Family/relative* 3 27.3 (6.0–61.0) 2,282 (227–4,336) 30.1 (3.0–57.3) Don’t know* 2 18.2 (2.3–51.8) 1,262 (0–3,088) 16.7 (0.0–40.8) Face-to-face talking to people 6 4.7 (1.7–9.9) 4,398 (238–8,557) 5.0 (0.3–9.7) Friend/neighbor† 2 33.3 (4.3–77.7) 1,602 (0–4,399) 36.4 (0.0–100.0) Co-worker† 2 33.3 (4.3–77.7) 1,398 (0–3,409) 31.8 (0.0–77.5) Family/relative† 1 16.7 (0.4–64.1) 816 (0–2,610) 18.5 (0.0–59.3) Other†‡ 1 16.7 (0.4–64.1) 583 (0–2,371) 13.3 (0.0–53.9) Newspaper 4 3.1 (0.9–7.8) 2,563 (64–5,063) 2.9 (0.1–5.7) Phone call on cell phone 3 2.3 (0.5–6.7) 2,185 (0–4,795) 2.5 (0.0–5.4) Friend/neighbor§ 2 66.7 (9.4–99.2) 1,602 (0–2,185) 73.3 (0.0–100.0) Family/relative§ 1 33.3 (0.8–90.6) 583 (0–2,184) 26.7 (0.0–100.0) Social media (e.g., Facebook, Twitter) 3 2.3 (0.5–6.7) 1,942 (0–4,161) 2.2 (0.0–4.7) Internet (other than WVAW website) 2 1.6 (0.2–5.5) 1,398 (0–3,425) 1.6 (0.0–3.9) Radio 2 1.6 (0.2–5.5) 1,165 (0–2,843) 1.3 (0.0–3.2) Text Message 2 1.6 (0.2–5.5) 1,165 (0–3,597) 1.3 (0.0–4.0) Don’t know 6 4.7 (1.7–9.9) 4,709 (827–8,590) 5.3 (0.9–9.7)
*Of households reporting phone call on land line (n=11) †Of households reporting face-to-face talking to people (n=6)
‡Other was unspecified (n=1)
§Of households reporting phone call on cell phone (n=3)

Page 44 of 66
Table 17. Household plumbing flushing instructions: source of information and were instructions easy to read and understand Frequency
(n=128) % of interviewed
households (95% CI) Projected number of households (95% CI)
Weighted % (95% CI)
Source of information TV 72 56.3 (47.2–65.0) 51,441 (42,775–60,101) 58.0 (48.2–67.8) WVAW website 50 39.1 (30.6–48.1) 32,721 (23,926–41,517) 36.9 (27.0–46.8) Face-to-face talking to people 17 13.3 (7.9–20.4) 10,904 (4,945–16,868) 12.3 (5.6–19.0) Newspaper 12 9.4 (4.9–15.8) 7,185 (2,277–12,095) 8.1 (2.6–13.6) Phone call on land line 9 7.0 (3.3–12.9) 6,544 (1,845–11,240) 7.4 (2.1–12.7) Internet (other than WVAW website) 9 7.0 (3.3–12.9) 5,534 (264–10,804) 6.2 (0.3–12.2) Social media (e.g., Facebook, Twitter) 7 5.5 (2.2–10.9) 4,612 (1,447–7,777) 5.2 (1.6–8.8) Radio 6 4.7 (1.7–9.9) 4,466 (0–9,401) 5.0 (0.0–10.6) Phone call on cell phone 5 3.9 (1.3–8.9) 3,010 (493–5,533) 3.4 (0.6–6.2) Did not receive information 4 3.1 (0.9–7.8) 3,204 (0–6,871) 3.6 (0.0–7.7) Text message 0 0.0 -- 0 -- 0.0 -- Other* 9 7.0 (3.3–12.9) 6,709 (982–12,444) 7.6 (1.1–14.0) Easy to read and understand† Yes 117 94.4 (88.7–97.7) 80,443 (76,453–84,440) 94.1 (89.4–98.8) No 7 5.7 (2.3–11.3) 5,049 (1,055–9,036) 5.9 (1.2–10.6)
*Other included flyer/sign near home or mail (n=4), family member (n=1), plumber (n=1), common sense (n=1), unspecified (n=1), and still have not received
correct information (n=1) †Of households that received household plumbing flushing instructions (n=124)

Page 45 of 66
Preparedness

Page 46 of 66
Table 18. Water sources present in households at the time households first learned about the chemical spill Frequency
(n=171) % of interviewed
households (95% CI) Projected number of households (95% CI)
Weighted % (95% CI)
West Virginia American Water 130* 76.0 (68.9–82.2) 91,069 (73,319–109,905) 77.5 (62.0–92.9) Purchased water (e.g., bottled water) 90 52.6 (44.9–60.3) 61,189 (53,503–68,876) 51.7 (45.2–58.2) Other public water supply 33 19.3 (13.7–26.0) 21,060 (5,832–36,282) 17.8 (4.9–30.7) Well water 3 1.8 (0.4–5.0) 1,748 (0–4,372) 1.5 (0.0–3.7)
*2 of 132 households that were WVAW customers reported not having WVAW in the household at the time the household first learned about the
chemical spill
Table 19. Availability of a 3-day alternative source of water supply (for drinking, preparing food, and hygiene) for each household member and pet in the household Frequency
(n=170*) % of interviewed
households (95% CI) Projected number of households (95% CI)
Weighted % (95% CI)
Yes, for people only 25 14.7 (9.8–20.9) 16,564 (8,925–24,213) 14.1 (7.6–20.6) Yes, for people and animals 17 10.0 (5.9–15.5) 11,438 (4,747–18,127) 9.7 (4.0–15.4) No 125 73.5 (66.2–80.0) 87,366 (75,047–99,679) 74.4 (63.9–84.9) Don’t know 2 1.2 (0.1–4.2) 1,262 (0–3,077) 1.1 (0.0–2.6) Refused 1 0.6 (0.0–3.2) 816 (0–2,514) 0.7 (0.0–2.1)
*Missing=1

Page 47 of 66
Alternative Sources of Water

Page 48 of 66
Table 20. Other water sources used during the “do not use” order Frequency
(n=125*) % of interviewed
households (95% CI) Projected number of households (95% CI)
Weighted % (95% CI)
Purchased water (e.g., bottled water) 112 89.6 (82.9–94.4) 77,549 (70,149–84,951) 89.7 (81.1–98.2) Bottled water from a water distribution site 72 57.6 (48.4–66.4) 48,673 (35,308–62,041) 56.3 (40.8–71.7) Water from a friend or relative 52 41.6 (32.9–50.8) 36,760 (26,317–47,196) 42.5 (30.4–54.6) Rainwater 22 17.6 (11.4–25.4) 14,030 (6,842–21,223) 16.2 (7.9–24.5) Filled container(s) at water distribution site 20 16.0 (10.1–23.6) 14,846 (5,999–23,687) 17.2 (6.9–27.4) Well water on premises 7 5.6 (2.3–11.2) 4,806 (0–9,967) 5.6 (0.0–11.5) Other† 15 12.0 (6.9–19.0) 9,603 (3,417–15,794) 11.1 (4.0–18.3)
*3 households affected by the “do not use” order reported not trying to get an alternative source of water †Other included work/employer (n=6), well not on premises (n=4), church (n=1), fire department (n=1), pool (n=1), school (n=1), private water company
(n=1) and natural source (creek) (n=1)

Page 49 of 66
Table 21. Households trying to get an alternative source of water and date when households first attempted Frequency
(n=128) % of interviewed
households (95% CI) Projected number of households (95% CI)
Weighted % (95% CI)
Tried to get an alternative source of water Yes 125 97.7 (93.3–99.5) 86,482 (83,929–88,700) 97.5 (94.6–100.0) No 3 2.3 (0.5–6.7) 2,214 (0–4,762) 2.5 (0.0–5.4) Date first attempted to get an alternative source of water* January 9, 2014 47 37.6 (29.1–46.7) 31,226 (22,839–39,607) 36.1 (26.4–45.8) January 10, 2014 46 36.8 (28.4–45.9) 34,585 (23,707–45,465) 40.0 (27.4–52.6) January 11, 2014 16 12.8 (7.5–20.0) 9,515 (4,225–14,810) 11.0 (4.9–17.1) January 12, 2014 2 1.6 (0.2–5.7) 1,398 (0–3,445) 1.6 (0.0–4.0) January 13, 2014 7 5.6 (2.3–11.2) 5,146 (0–10,572) 6.0 (0.0–12.2) January 14, 2014 1 0.8 (0.0–4.4) 583 (0–1,802) 0.7 (0.0–2.1) January 15, 2014 1 0.8 (0.0–4.4) 583 (0–1,802) 0.7 (0.0–2.1) Don’t know 5 4.0 (1.3–9.1) 3,447 (479–6,406) 4.0 (0.6–7.4)
*Of households that reporting trying to get an alternative source of water (n=125)
Figure 6. Number of households that first attempted to get an alternative source of water by date
47 46
16
2
7
1 1
5
0
5
10
15
20
25
30
35
40
45
50
1/9/2014 1/10/2014 1/11/2014 1/12/2014 1/13/2014 1/14/2014 1/15/2014 UnknownDate
Nu
mb
er
of
Ho
use
ho
lds
Date n=125

Page 50 of 66
Table 22. Date when households first successfully got an alternative source of water Frequency
(n=125*) % of interviewed
households (95% CI) Projected number of households (95% CI)
Weighted % (95% CI)
January 9, 2014 38 30.4 (22.5–39.3) 25,448 (17,567–33,323) 29.4 (20.3–38.5) January 10, 2014 50 40.0 (31.3–49.1) 37,352 (26,104–48,601) 43.2 (30.2–56.2) January 11, 2014 17 13.6 (8.1–20.9) 10,098 (4,102–16,086) 11.7 (4.7–18.6) January 12, 2014 3 2.4 (0.5–6.9) 1,981 (0–4,313) 2.3 (0.0–5.0) January 13, 2014 7 5.6 (2.3–11.2) 4,952 (0–10,502) 5.7 (0.0–12.2) January 14, 2014 1 0.8 (0.0–4.4) 583 (0–1,802) 0.7 (0.0–2.1) January 15, 2014 2 1.6 (0.2–5.7) 1,262 (0–3,073) 1.5 (0.0–3.6) January 16, 2014 1 0.8 (0.0–4.4) 680 (0–2,080) 0.8 (0.0–2.4) Don’t know 6 4.8 (1.8–10.2) 4,127 (392–7,864) 4.8 (0.5–9.1)
*3 households affected by the “do not use” order reported not trying to get an alternative source of water
Figure 7. Number of households that first successfully got an alternative source of water by date
38
50
17
3 7
1 2 1
6
0
10
20
30
40
50
60
Nu
mb
er
of
Ho
use
ho
lds
Date n=125

Page 51 of 66
Table 23. Number of days between household first attempting and first successfully getting an alternative source of water Frequency
(n=125*) % of interviewed
households (95% CI) Projected number of households (95% CI)
Weighted % (95% CI)
Same day 103 82.4 (74.6–88.6) 72,306 (67,150–77,460) 83.6 (77.6–89.6) 1 day 12 9.6 (5.1–16.2) 7,525 (3,141–11,910) 8.7 (3.6–13.8) 2 days 2 1.6 (0.2–5.7) 1,262 (0–3,073) 1.5 (0.0–3.6) 3 days 1 0.8 (0.0–4.4) 680 (0–2,080) 0.8 (0.0–2.4) 4 days 1 0.8 (0.0–4.4) 583 (0–1,810) 0.7 (0.0–2.1) Don’t know 6 4.8 (1.8–10.2) 4,127 (392–7,864) 4.8 (0.5–9.1)
*3 households affected by the “do not use” order reported not trying to get an alternative source of water
Figure 8. Number of households by length of time between trying and successfully getting an alternative source of water
103
12
2 1 1 6
0
20
40
60
80
100
120
same day 1 2 3 4 Don't know
Nu
mb
er
of
Ho
use
ho
lds
Number of Days Between Trying and Successfully Getting Alternative Water Source n=125

Page 52 of 66
Table 24. Where households tried to get alternative sources of water Frequency
(n=125*) % of interviewed
households (95% CI) Projected number of households (95% CI)
Weighted % (95% CI)
Large store or grocery (e.g., Wal-Mart, Kroger) 92 73.6 (65.0–81.1) 62,985 (54,954–71,016) 72.8 (63.5–82.1) Water distribution site in my town of residence 63 50.4 (41.3–59.5) 42,848 (29,262–56,425) 49.6 (33.8–65.3) Water from a friend or relative 51 40.8 (32.1–50.0) 35,711 (24,300–47,129) 41.3 (28.1–54.5) Nearby convenience store or gas station 34 27.2 (19.6–35.9) 25,060 (15,257–34,858) 29.0 (17.6–40.3) Water distribution site outside my town 32 25.6 (18.2–34.2) 23,623 (11,972–35,267) 27.3 (13.8–40.8) Rainwater 19 15.2 (9.4–22.7) 12,380 (5,162–19,605) 14.3 (6.0–22.7) Well water on premises 4 3.2 (0.9–8.0) 2,622 (0–6,967) 3.0 (0.0–8.1) Other† 14 11.2 (6.3–18.1) 9,253 (3,417–15,089) 10.7 (4.0–17.4)
*3 households affected by the “do not use” order reported not trying to get an alternative source of water †Other included church (n=5), employer (n=3), fire department (n=2), private water company (n=2), well not on premises (n=1), pool (n=1), natural
source (spring) (n=1), and not specified (n=1)
Table 25. Where households were able to get alternative sources of water Frequency
(n=125*) % of interviewed
households (95% CI) Projected number of households (95% CI)
Weighted % (95% CI)
Purchased from large store or grocery (e.g., Wal-Mart, Kroger)
90 72.0 (63.3–79.7) 61,189 (52,462–69,921) 70.8 (60.7–80.8)
Water distribution site in my town of residence 60 48.0 (39.0–57.1) 40,906 (28,014–53,798) 47.3 (32.4–62.2) Water from a friend or relative 55 44.0 (35.1–53.2) 38,945 (27,970–49,922) 45.0 (32.3–57.7) Water distribution site outside my town 32 25.6 (18.2–34.2) 23,526 (12,088–34,970) 27.2 (14.0–40.4) Purchased from nearby convenience store or gas station
23 18.4 (12.0–26.3) 17,293 (8,546–26,031) 20.0 (9.9–30.1)
Rainwater 18 14.4 (8.8–21.8) 11,603 (5,287–17,913) 13.4 (6.1–20.7) Well water on premises 4 3.2 (0.9–8.0) 2,622 (0–6,967) 3.0 (0.0–8.1) Don’t know 1 0.8 (0.0–4.4) 680 (0–2,080) 0.8 (0.0–2.4) Other† 15 12.0 (6.9–19.0) 10,104 (5,001–15,077) 11.6 (5.8–17.4)
*3 households affected by the “do not use” order reported not trying to get an alternative source of water †Other included church (n=3), employer (n=3), fire department (n=2), private water company (n=2), well not on premises (n=2), natural source
(spring/creek) (n=2), pool (n=1), school (n=1), and not specified (n=1)

Page 53 of 66
Table 26. Travelling outside of the affected area to get an alternative source of water Frequency
(n=125*) % of interviewed
households (95% CI) Projected number of households (95% CI)
Weighted % (95% CI)
Yes, to purchase water 20 16.0 (10.1–23.6) 14,632 (8,147–21,116) 16.9 (9.4–24.4) Yes, got water from friend/relative 41 32.8 (24.7–41.8) 29,284 (17,758–40,811) 33.9 (20.5–47.2) Yes, but did not get water 7 5.6 (2.3–11.2) 5,049 (415–9,679) 5.8 (0.5–11.2) No 64 51.2 (42.1–60.2) 43,547 (33,065–54,035) 50.4 (38.2–62.5) Don’t know 1 0.8 (0.0–4.4) 583 (0–1,802) 0.7 (0.0–2.1) Not applicable 1 0.8 (0.0–4.4) 1,019 (0–3,160) 1.2 (0.0–3.7)
*3 households affected by the “do not use” order reported not trying to get an alternative source of water
Table 27. How long households were without any alternative source of drinking water and reasons for being without Frequency
(n=128) % of interviewed
households (95% CI) Projected number of households (95% CI)
Weighted % (95% CI)
How long without alternative source of drinking water My household was never without with
alternative source of drinking water 71 55.5 (46.4–64.3) 48,761 (37,276–60,238) 55.0 (42.0–67.9)
Less than 1 day 37 28.9 (21.2–37.6) 25,895 (16,589–35,193) 29.2 (18.7–39.7) 1 day 9 7.0 (3.3–12.9) 6,000 (850–11,143) 6.8 (1.0–12.6) 2 days 5 3.9 (1.3–8.9) 3,243 (502–5,977) 3.7 (0.6–6.7) 4 days 1 0.8 (0.0–4.3) 680 (0–2,082) 0.8 (0.0–2.4) 5 days 1 0.8 (0.0–4.3) 1,019 (0–3,137) 1.2 (0.0–3.5) 7 days 3 2.3 (0.5–6.7) 2,515 (0–5,464) 2.8 (0.0–6.2) Don’t know 1 0.8 (0.0–4.3) 583 (0–1,785) 0.7 (0.0–2.0) Reasons for being without an alternative source of drinking water for one or more days* Store was out of water 10 52.6 (28.9–75.6) 6,447 (2,618–10,275) 47.9 (19.5–76.4) Could not locate distribution site 4 21.1 (6.1–45.6) 2,427 (0–4,886) 18.0 (0.0–36.3) No transportation 3 15.8 (3.4–39.6) 2,622 (0–6,061) 19.5 (0.0–45.0) Could not leave work 2 10.5 (1.3–33.1) 1,495 (0–3,700) 11.1 (0.0–27.5) Not enough money to purchase water 2 10.5 (1.3–33.1) 1,495 (0–3,311) 11.1 (0.0–24.6) Did not have clean containers for filling 2 10.5 (1.3–33.1) 1,359 (0–4,169) 10.1 (0.0–31.0) Distribution site was out of water 2 10.5 (1.3–33.1) 1,262 (0–3,029) 9.4 (0.0–22.5) Distribution site changed 0 0.0 -- 0 -- 0.0 -- Distribution site closed 0 0.0 -- 0 -- 0.0 -- Other† 5 26.3 (9.2–51.2) 3,340 (319–6,361) 24.8 (2.4–47.3)
*Of households reporting being without an alternative source of drinking water for one or more days (n=19) †Other included distribution site not open yet (n=1), not enough information/didn’t know about it (n=2), doesn’t drive at night (n=1), internet
down/slow (n=1)

Page 54 of 66
Household Impact

Page 55 of 66
Table 28. Staying overnight outside of the home for one or more days to have access to alternative source of water Frequency
(n=127*) % of interviewed
households (95% CI) Projected number of households (95% CI)
Weighted % (95% CI)
Yes, paid money to stay elsewhere (e.g., hotel) 4 3.2 (0.9–7.9) 2,767 (0–6,050) 3.1 (0.0–6.9) Yes, did not have to pay (e.g., stayed with a friend) 19 15.0 (9.3–22.4) 13,234 (7, 405–19,062) 15.0 (8.4–21.6) No 104 81.9 (74.1–88.2) 72,112 (64,945–79,279) 81.8 (73.7–90.0)
*Missing=1
Table 29. School and childcare closures and taking off from work to care for children Frequency
(n=169*) % of interviewed
households (95% CI) Projected number of households (95% CI)
Weighted % (95% CI)
Schools (K-12) or daycare closure Yes 35 20.7 (14.9–27.6) 24,681 (15,417–33,939) 21.2 (13.2–29.1) No 21 12.4 (7.9–18.4) 13,797 (7,237–20,349) 11.8 (6.2–17.4) Don’t know 1 0.6 (0.0–3.3) 583 (0–1,773) 0.5 (0.0–1.5) N/A (do not have children) 95 56.2 (48.4–63.8) 65,791 (53,802–77,772) 56.4 (46.1–66.7) N/A (children don’t go to school/daycare) 16 9.5 (5.5–14.9) 10,991 (5,713–16,273) 9.4 (4.9–13.9) Refused 1 0.6 (0.0–3.3) 816 (0–2,483) 0.7 (0.0–2.1) Had to take off from work to care for children† Yes 7 20.0 (8.4–36.9) 4,748 (1,259–8,235) 19.2 (5.1–33.4) No, unpaid friend/relative supervised 14 40.0 (23.9–57.9) 11,011 (5,619–16,402) 44.6 (22.8–66.5) No, they did not require supervision 11 31.4 (16.9–49.3) 7,175 (2,671–11,680) 29.1 (10.8–47.3) No, someone was paid to supervise them 2 5.7 (0.7–19.2) 1,165 (0–2,807) 4.7 (0.0–11.4) Other‡ 1 2.9 (0.1–14.9) 583 (0–1,823) 2.4 (0.0–7.4)
*Missing=2 †Of households reporting school or daycare closure (n=35)
‡Other reported was stay at home mom (n=1)

Page 56 of 66
Table 30. Business ownership and businesses ordered to close Frequency
(n=170*) % of interviewed
households (95% CI) Projected number of households (95% CI)
Weighted % (95% CI)
Own a business Yes 18 10.6 (6.4–16.2) 12,156 (7,029–17,283) 10.3 (6.0–14.7) No 150 88.2 (82.4–92.7) 103,687 (98,541–108,834) 88.1 (83.7–92.5) Don’t know 1 0.6 (0.0–3.2) 1,019 (0–3,095) 0.9 (0.0–2.6) Refused 1 0.6 (0.0–3.2) 816 (0–2,498) 0.7 (0.0–2.1) Business ordered to close† Yes 1 5.6 (0.1–27.3) 583 (0–1,863) 4.8 (0.0–15.3) No 17 94.4 (72.7–99.9) 11,574 (10,293–12,156) 95.2 (84.7–100.0)
*Missing=1 †Of households reporting owning a business (n=18)
Table 31. Told not to come into work because of the chemical spill Frequency
(n=169*) % of interviewed
households (95% CI) Projected number of households (95% CI)
Weighted % (95% CI)
Yes, with paid leave 19 11.2 (6.9–17.0) 13,176 (7,140–19,215) 11.3 (6.1–16.4) Yes, with unpaid leave 12 7.1 (3.7–12.1) 7,991 (4,204–11,778) 6.8 (3.6–10.1) No 110 65.1 (57.4–72.3) 76,976 (67,840–86,119) 65.8 (58.0–73.6) Don’t know 3 1.8 (0.4–5.1) 1,748 (0–4,387) 1.5 (0.0–3.7) Not applicable 22 13.0 (8.3–19.0) 15,127 (7,116–23,137) 12.9 (6.1–19.8) Other† 2 1.2 (0.1–4.2) 1,165 (0–2,809) 1.0 (0.0–2.4) Refused 1 0.6 (0.0–3.3) 816 (0–2,476) 0.7 (0.0–2.1)
*Missing=2 †Other reported was yes, but unsure about leave (n=2)

Page 57 of 66
Health

Page 58 of 66
Table 32. Households with members with health issues they felt were related to the chemical spill and age of affected Frequency
(n=171) % of interviewed
households (95% CI) Projected number of households (95% CI)
Weighted % (95% CI)
Health issues Yes 39 22.8 (16.8–29.8) 25,623 (17,062–34,177) 21.7 (14.4–28.9) No 126 73.7 (66.4–80.1) 88,715 (79,767–97,655) 75.0 (67.5–82.6) Don’t know 5 2.9 (1.0–6.7) 3,107 (0–6,254) 2.6 (0.0–5.3) Refused 1 0.6 (0.0–3.2) 816 (0–2,485) 0.7 (0.0–2.1) Age of affected household members* Less than 18 years 6 15.4 (5.9–30.5) 3,826 (869–6,782) 14.9 (3.4–26.5) 18 years or older 35 89.7 (75.8–97.1) 22,963 (20,163–25,762) 89.6 (78.7–100.0)
*Of households reporting household members with health issues (n=39)
Table 33. Health issues symptoms and onset Frequency
(n=39) % of interviewed
households (95% CI) Projected number of households (95% CI)
Weighted % (95% CI)
Symptom reported Rash 21 53.9 (37.2–69.9) 13,632 (8,419–18,846) 53.2 (32.9–73.5) Skin irritation/itching 17 43.6 (27.8–60.4) 10,671 (5,291–16,053) 41.6 (20.6–62.6) Respiratory illness/cough 6 15.4 (5.9–30.5) 4,127 (674–7,581) 16.1 (2.6–29.6) Diarrhea 5 12.8 (4.3–27.4) 3,787 (520–7,053) 14.8 (2.0–27.5) Nausea 5 12.8 (4.3–27.4) 3,350 (394–6,307) 13.1 (1.5–24.6) Sore throat 4 10.3 (2.9–24.2) 2,864 (97–5,631) 11.2 (0.4–22.0) Headache 4 10.3 (2.9–24.2) 2,767 (164–5,370) 10.8 (0.6–21.0) Vomiting 2 5.1 (0.6–17.3) 1,699 (0–4,187) 6.6 (0.0–16.3) Abdominal pain 2 5.1 (0.6–17.3) 1,262 (0–3,113) 4.9 (0.0–12.2) Eye irritation/pain 2 5.1 (0.6–17.3) 1,165 (0–2,785) 4.6 (0.0–10.9) Other* 9 23.1 (11.1–39.3) 6,214 (2,882–9,547) 24.3 (11.2–37.3) Symptom onset Before the “do not use” order 6 15.4 (5.9–30.5) 3,932 (841–7,022) 15.4 (3.3–27.4) During the “do not use” order 18 46.2 (30.1–62.8) 12,525 (7,081–17,971) 48.9 (27.6–70.1) After the “do not use” order was lifted 19 48.7 (32.4–65.2) 11,593 (6,931–16,258) 45.2 (27.0–63.4)
*Other symptoms reported included dizziness (n=3), dry skin (n=2), cellulitis (n=1), “chest on fire” (n=1), rapid heat beat (n=1), and unspecified (n=1)

Page 59 of 66
Table 34. Medical care sources and reasons for not seeking medical care Frequency
(n=39) % of interviewed
households (95% CI) Projected number of households (95% CI)
Weighted % (95% CI)
Medical care source Did not seek medical care 22 56.4 (39.6–72.2) 13,885 (10,202–17,566) 54.2 (39.8–68.6) Primary care physician/provider 6 15.4 (5.9–30.5) 3,592 (916–6,270) 14.0 (3.6–24.5) Emergency room 4 10.3 (2.9–24.2) 3,301 (0–6,704) 12.9 (0.0–26.2) Admitted to the hospital 3 7.7 (1.6–20.9) 2,185 (0–4,568) 8.5 (0.0–17.8) Urgent care 1 2.6 (0.1–13.5) 583 (0–1,782) 2.3 (0.0–6.9) Other* 5 12.8 (4.3–27.4) 3,680 (381–6,980) 14.4 (1.5–27.2) Reasons for not seeking medical care† Not serious enough to seek medical care 15 68.2 (45.1–86.1) 9,273 (5,854–12,691) 66.8 (42.2–91.4) Concerned about cost of seeking care 3 13.6 (2.9–34.9) 1,748 (0–3,810) 12.6 (0.0–27.4) No transportation 2 9.1 (1.1–29.2) 1,165 (0–3,548) 8.4 (0.0–25.6) No insurance 1 4.6 (0.1–22.8) 583 (0–1,772) 4.2 (0.0–12.8) Other‡ 6 27.3 (10.7–50.2) 4,127 (237–8,016) 29.7 (1.7–57.7)
*Other medical care sources included specialist (n=1) and unspecified type (n=4) †Of households reporting medical care was not sought (n=22)
‡Other reasons reported for not seeking medical care included never or rarely going to the doctor (n=2), resolved on its own (n=1), inability to treat because
“nothing known about the chemical” (n=1), and other information sources including calling poison center (n=2)
Table 35. Households with members with mental health issues they felt were related to the chemical spill and symptoms Frequency
(n=171) % of interviewed
households (95% CI) Projected number of households (95% CI)
Weighted % (95% CI)
Mental health issues Yes 7 4.1 (1.7–8.3) 4,175 (829–7,522) 3.5 (0.7–6.4) No 163 95.3 (91.0–98.0) 113,270 (109,669–116,871) 95.8 (92.7–98.8) Refused 1 0.6 (0.0–3.2) 816 (0–2,485) 0.7 (0.0–2.1) Symptoms reported* Anxiety or stress 6 85.7 (42.1–99.6) 3,495 (1,724–4,175) 83.7 (41.3–100.0) Agitated behavior 1 14.3 (0.4–57.9) 583 (0–2,142) 14.0 (0.0–51.3) Difficulty concentrating 1 14.3 (0.4–57.9) 583 (0–2,142) 14.0 (0.0–51.3) Loss of appetite 1 14.3 (0.4–57.9) 583 (0–2,142) 14.0 (0.0–51.3) Trouble sleeping/nightmares 1 14.3 (0.4–57.9) 583 (0–2,142) 14.0 (0.0–51.3) Alcohol/drug use 0 0.0 -- 0 -- 0.0 -- Witnessed or experienced violence 0 0.0 -- 0 -- 0.0 --
*Of households reporting household members with mental health issues (n=7)

Page 60 of 66
Table 36. Households with pets with illness they felt were related to the chemical spill, symptoms, and veterinary care Frequency
(n=106) % of interviewed
households (95% CI) Projected number of households (95% CI)
Weighted % (95% CI)
Pet illness Yes 3 2.8 (0.6–8.1) 1,845 (0–3,889) 2.2 (0.0–5.3) No 101 95.3 (89.3–98.5) 70,219 (67,512–72,920) 95.6 (91.9–99.3) Don’t know 1 0.9 (0.0–5.1) 583 (0–1,785) 0.8 (0.0–2.4) Refused 1 0.9 (0.0–5.1) 816 (0–2,502) 1.1 (0.0–3.4) Symptoms reported* Diarrhea 1 33.3 (0.8–90.6) 680 (0–1,845) 36.8 (0.0–100.0) Vomiting 1 33.3 (0.8–90.6) 583 (0–1,845) 31.6 (0.0–100.0) Other† 1 33.3 (0.8–90.6) 583 (0–1,845) 31.6 (0.0–100.0) Veterinary care sought* Yes 1 33.3 (0.8–90.6) 680 (0–1,845) 36.8 (0.0–100.0) No 2 66.7 (9.4–99.2) 1,165 (0–1,845) 63.2 (0.0–100.0)
*Of households reporting pet with illness (n=3) †Other symptoms reported were fish died (n=1)

Page 61 of 66
Public Water Supply: Behaviors and Beliefs

Page 62 of 66
Table 37. WVAW use during the “do not use” order and how water was used
Frequency (n=127*)
% of interviewed households (95% CI)
Projected number of households (95% CI)
Weighted % (95% CI)
WVAW use during “do not use” order Yes 47 37.0 (28.6–46.0) 32,983 (23,525–42,445) 37.4 (26.7–48.2) No 79 62.2 (53.2–70.7) 54,548 (45,048–64,040) 61.9 (51.1–72.7) Don’t know 1 0.8 (0.0–4.3) 583 (0–1,805) 0.7 (0.0–2.0) How water was used
Showered/bathed in water† 37 78.8 (64.3–89.3) 26,429 (23,566–29,292) 80.1 (71.4–88.8)
Washed hands† 22 46.8 (32.1–61.9) 15,137 (9,489–20,787) 45.9 (28.8–63.0)
Washed clothes† 19 40.4 (26.4–55.7) 12,418 (7,173–17,664) 37.7 (21.7–53.6)
Ran dishwasher/hand-washed dishes† 16 34.0 (20.9–49.3) 10,612 (5,118–16,104) 32.2 (15.5–48.8)
Brushed teeth† 16 34.0 (20.9–49.3) 10,476 (6,244–14,711) 31.8 (18.9–44.6)
Ate or drank food prepared with water† 13 27.7 (15.6–42.6) 8,865 (4,731–12,997) 26.9 (14.3–39.4)
Drank the water† 13 27.7 (15.6–42.6) 8,768 (4,658–12,879) 26.6 (14.1–39.0)
Gave water to pets‡ 6 19.4 (7.5–37.5) 4,224 (1,407–7,040) 19.2 (6.4–32.0)
Watered plants† 4 8.5 (2.4–20.4) 2,757 (0–5,708) 8.4 (0.0–17.3)
*Missing=1 †Of households reporting WVAW use during the “do not use” order (n=47)
‡Of households reporting WVAW use during the “do not use” order and any pet ownership (n=31)

Page 63 of 66
Table 38. WVAW use after “do not use” order was lifted but before the end of January and how water was used
Frequency (n=128)
% of interviewed households (95% CI)
Projected number of households (95% CI)
Weighted % (95% CI)
WVAW use after lifting of “do not use” order but before the end of January Yes 86 67.2 (58.3–75.2) 59,237 (50,813–67,656) 66.8 (57.3–76.3) No 39 30.5 (22.7–39.2) 27,614 (19,620–35,613) 31.1 (22.1–40.1) Don’t know 3 2.3 (0.5–6.7) 1,845 (0–4,588) 2.1 (0.0–5.2) How water was used Washing clothes* 81 94.2 (87.0–98.1) 55,557 (52,308–58,805) 93.8 (88.3–99.3) Showering/bathing* 79 91.9 (84.0–96.7) 54,392 (50,678–58,108) 91.8 (85.6–98.1) Hand washing* 62 72.1 (61.4–81.2) 43,955 (36,792–51,118) 74.2 (62.1–86.3) Dishwashing* 59 68.6 (57.7–78.2) 40,032 (32,466–47,598) 67.6 (54.8–80.4) Brushing teeth* 30 34.9 (24.9–45.9) 21,487 (13,371–29,605) 36.3 (22.6–50.0) Watering plants* 25 29.1 (19.8–39.9) 17,700 (10,950–24,451) 29.9 (18.5–41.3) Cooking* 18 20.9 (12.9–31.1) 13,195 (7,958–18,426) 22.3 (13.4–31.1)
Giving water to pets† 12 21.8 (11.8–35.0) 8,972 (4,781–13,165) 23.5 (12.5–34.4)
Drinking* 12 14.0 (7.4–23.1) 8,457 (4,573–12,337) 14.3 (7.7–20.8)
*Of households reporting WVAW use after the “do not use” order was lifted but before the end of January (n=86) †Of households reporting WVAW use after the “do not use” order was lifted but before the end of January and any pet ownership (n=55)
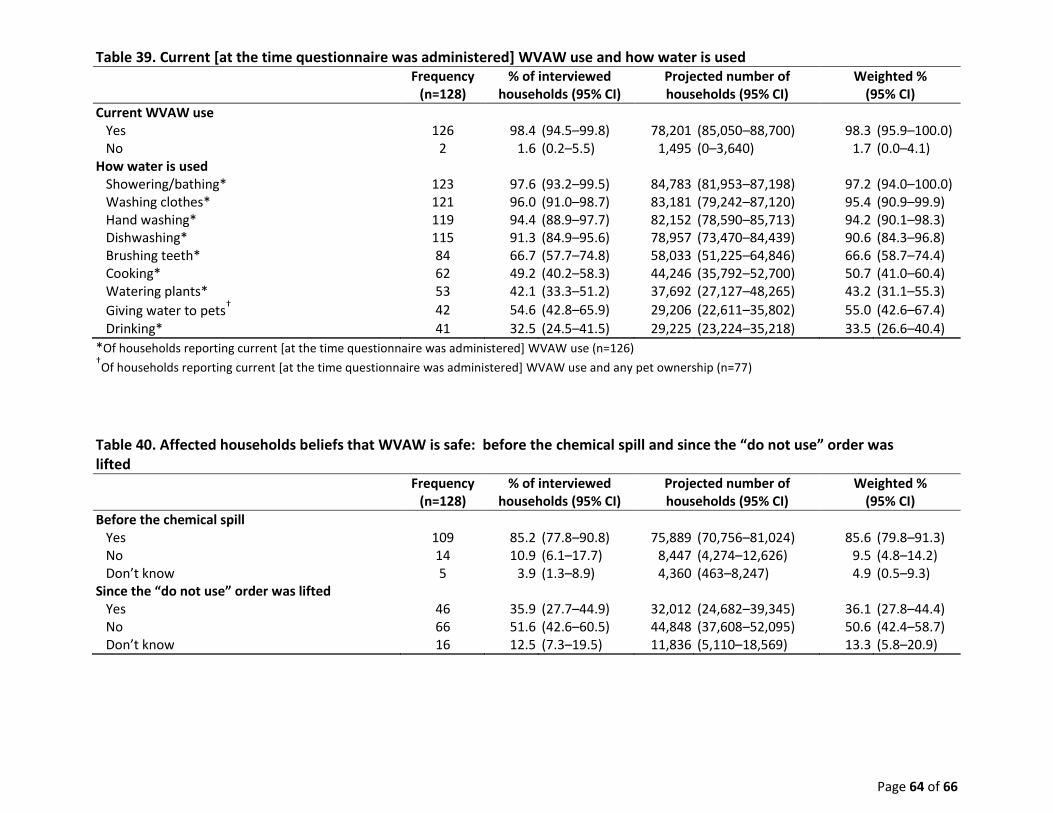
Page 64 of 66
Table 39. Current [at the time questionnaire was administered] WVAW use and how water is used
Frequency (n=128)
% of interviewed households (95% CI)
Projected number of households (95% CI)
Weighted % (95% CI)
Current WVAW use Yes 126 98.4 (94.5–99.8) 78,201 (85,050–88,700) 98.3 (95.9–100.0) No 2 1.6 (0.2–5.5) 1,495 (0–3,640) 1.7 (0.0–4.1) How water is used Showering/bathing* 123 97.6 (93.2–99.5) 84,783 (81,953–87,198) 97.2 (94.0–100.0) Washing clothes* 121 96.0 (91.0–98.7) 83,181 (79,242–87,120) 95.4 (90.9–99.9) Hand washing* 119 94.4 (88.9–97.7) 82,152 (78,590–85,713) 94.2 (90.1–98.3) Dishwashing* 115 91.3 (84.9–95.6) 78,957 (73,470–84,439) 90.6 (84.3–96.8) Brushing teeth* 84 66.7 (57.7–74.8) 58,033 (51,225–64,846) 66.6 (58.7–74.4) Cooking* 62 49.2 (40.2–58.3) 44,246 (35,792–52,700) 50.7 (41.0–60.4) Watering plants* 53 42.1 (33.3–51.2) 37,692 (27,127–48,265) 43.2 (31.1–55.3)
Giving water to pets† 42 54.6 (42.8–65.9) 29,206 (22,611–35,802) 55.0 (42.6–67.4)
Drinking* 41 32.5 (24.5–41.5) 29,225 (23,224–35,218) 33.5 (26.6–40.4)
*Of households reporting current [at the time questionnaire was administered] WVAW use (n=126) †Of households reporting current [at the time questionnaire was administered] WVAW use and any pet ownership (n=77)
Table 40. Affected households beliefs that WVAW is safe: before the chemical spill and since the “do not use” order was lifted
Frequency (n=128)
% of interviewed households (95% CI)
Projected number of households (95% CI)
Weighted % (95% CI)
Before the chemical spill Yes 109 85.2 (77.8–90.8) 75,889 (70,756–81,024) 85.6 (79.8–91.3) No 14 10.9 (6.1–17.7) 8,447 (4,274–12,626) 9.5 (4.8–14.2) Don’t know 5 3.9 (1.3–8.9) 4,360 (463–8,247) 4.9 (0.5–9.3) Since the “do not use” order was lifted Yes 46 35.9 (27.7–44.9) 32,012 (24,682–39,345) 36.1 (27.8–44.4) No 66 51.6 (42.6–60.5) 44,848 (37,608–52,095) 50.6 (42.4–58.7) Don’t know 16 12.5 (7.3–19.5) 11,836 (5,110–18,569) 13.3 (5.8–20.9)

This set of questions asks for some basic information about your household.
Q1. What is your type of residence: [ ]Single family home [ ]Multi-unit (e.g. apt,condo) [ ]Mobile home [ ]Other_______________
Q4. How many people in your household are: [ ]Male __#__ [ ]Female__#__ [ ] Ref
Q5. What is the highest level of education completed by anyone in your household? [ ]Did not complete high school/GED [ ]High school graduate or equivalent [ ]Some college (e.g. AA, AS /no degree) [ ]Bachelor’s degree (e.g. BA, BS, AB) [ ]Advanced degree (e.g. MD, MS, PhD, JD) [ ]D/K [ ]Ref
Q4a. How many people in your household are: [ ]__#__ less than 2 years [ ]__#__65+ years [ ]__#__2-17 years [ ] D/K [ ]__#__18-64 years [ ]Ref
Q2. Is your place of residence owned or rented? [ ]Own [ ]Rent [ ]Other_______ [ ]D/K [ ]Ref
Q3. How many pets are in your household? [ ]Dogs __#__ [ ]Cats __#__ [ ]Other__#__ [ ]D/K [ ]Ref [ ]N/A Q4b. Any pregnant women in your household?
[ ]Yes__#__ [ ]No [ ]D/K [ ]Ref
Q6. Please identify the ethnicity of household members. CATA. [ ]Hispanic/Latino [ ]Not Hispanic or Latino [ ]Other_____________________________ [ ]D/K [ ]Ref
Q6a. Please identify the race of household members. CATA. [ ]American Indian/Alaska Native [ ] Asian [ ]Black [ ]White [ ]Native Hawaiian/ Pacific Islander [ ]Other________________ [ ]D/K [ ]Ref
This set of questions is about messaging and source(s) of water during the chemical spill into the Elk River that occurred on Thursday, January 9th
, 2014.
Q7. Are you a West Virginia American Water (WVAW) customer? [ ]Yes [ ]No [ ]D/K [ ]Ref
Q8. When did anyone in your household first learn about the chemical spill into the Elk River? (show calendar) Date: 01 / /2014 Time of day: [ ]Morning [ ]Afternoon [ ]Evening [ ] D/K [ ]Ref [ ]N/A
Q9. How did your household FIRST LEARN about the chemical spill? Choose only ONE. [ ]Phone call on land line [ ]Phone call on cell phone [ ]Text message [ ]Face-to-face talking to people [ ]Social media (e.g. Facebook, Twitter) [ ]Radio [ ]TV [ ]Newspaper [ ]Internet [ ]Other:____________________________________ [ ] D/K [ ]Ref [ ]N/A
Q9a. From whom or where did your household FIRST LEARN about the chemical spill (by the method in the previous question)? Choose only ONE. [ ]WVAW [ ]Friend/neighbor [ ]Family/relative [ ]Co-worker [ ]Stranger [ ]Internet (specify site):__________________ [ ]Radio (specify station):________ [ ]TV (specify station):________ [ ]Newspaper(specify):__________ [ ]Other:__________ [ ] D/K [ ]Ref [ ]N/A
Just to verify, you FIRST LEARNED about the chemical spill from (Q9a answer) by (Q9 answer), is this correct?
Q10. Please list all sources of water that you had in your household at the time you first heard about the chemical spill. CATA. [ ]WVAW [ ]Other public water supply [ ]Well water [ ]Purchased water (e.g. bottled water) [ ]Other: ________________ [ ]D/K [ ]Ref
Q10a.Previous to the spill, was there a 3-day alternative source of water supply (for drinking, preparing food, and hygiene) for each household member and pet at your home (1 day supply = 1 gallon/person or pet/day)? [ ]Yes, for people only [ ]Yes, for people and animals [ ]No [ ]D/K [ ]Ref
Q11. Where have members of your household received information about the chemical spill since the event occurred? CATA. [ ]D/K [ ]Ref [ ]Word of mouth [ ]Social media [ ]Radio [ ]TV [ ]Newspaper [ ]WVAW website [ ]Internet (not WVAW website) [ ] Other: _________ [ ]N/A
Q11a. In your opinion, what was the most reliable source for information about the chemical spill? Choose only ONE. [ ]D/K [ ]Ref [ ]Word of mouth [ ]Social media [ ]Radio [ ]TV [ ]Newspaper [ ]WVAW website [ ]Internet (not WVAW website) [ ] Other: _________ [ ]N/A
Q12. When did anyone in your household first learn the ‘do not use’ order was in effect for your household? Date: 01/ /2014 [ ]D/K [ ]Ref [ ]N/A
Q13. How did your household FIRST LEARN about the ‘do not use’ order for your household? Choose only ONE. [ ]Phone call on land line [ ]Phone call on cell phone [ ]Text message [ ]Face-to-face talking to people [ ]Social media (e.g. Facebook, Twitter) [ ]Radio [ ]TV [ ]Newspaper [ ]Internet [ ]Other:__________________________________ [ ] D/K [ ] Ref [ ]N/A
Q13a. From whom or where did your household FIRST LEARN about the ‘do not use’ order for your household? Choose only ONE. [ ]WVAW [ ]Friend/neighbor [ ]Family/relative [ ]Co-worker [ ]Stranger [ ]Internet (specify site):__________________ [ ]Radio (specify station):________ [ ]TV (specify station):________ [ ]Newspaper(specify):__________ [ ]Other:__________ [ ] D/K [ ]Ref [ ]N/A
Just to verify, you FIRST LEARNED about the ‘do not use’ order for your household from (Q13a answer) by (Q13 answer), is this correct?
Q14. Did anyone in your household use WVAW in your home at any point during the time that the ‘do not use’ order was in effect for your household (other than flushing the toilet or trying to put out a fire)? [ ]Yes [ ]No [ ]D/K [ ]Ref [ ]N/A
IF YES to Q14 →Q14a. How was the water used? CATA. [ ]Drank the water [ ]Washed hands [ ]Brushed teeth [ ]Ate or drank food prepared with water [ ]Washed clothes [ ] Watered plants [ ]Ran dishwasher/hand-washed dishes [ ]Gave water to pets [ ]Showered/bathed in water [ ]Other ________________ [ ]D/K [ ]Ref [ ]N/A
Q15. After the chemical spill, did anyone in your household try to get water from an alternative source to your WVAW water? [ ]Yes [ ]No [ ]D/K [ ]Ref [ ]N/A
IF YES to Q15→Q15a. When did anyone from your household FIRST ATTEMPT to get an alternative source of water for the household? Date: 01 / /2014 [ ]D/K [ ]Ref [ ]N/A
IF YES to Q15→Q15b. When did anyone from your household FIRST SUCCESSFULLY get an alternative source of water for the household? Date: 01 / /2014 [ ]D/K [ ]Ref [ ]N/A
IF YES to Q15→Q15c. What other water source(s) did your household USE during the ‘do not use order?’ CATA. [ ]Purchased water (e.g. bottled water) [ ]Filled container(s) at water distribution site [ ]Well water on premises [ ]Rainwater [ ]Water from a friend or relative [ ]Bottled water from a water distribution site [ ]Other: ___________________ [ ]D/K [ ]Ref [ ]N/A
IF YES to Q15→Q15d. Where did your household TRY TO GET alternative source(s) of water from during the ‘do not use order?’ CATA. [ ]Large store or grocery (e.g. Wal-Mart, Kroger) [ ]Water distribution site in my town of residence [ ]Well water on premises [ ]Nearby convenience store or gas station [ ]Water distribution site outside of my town of residence [ ]Rainwater [ ]Water from a friend or relative [ ]Other: __________________________________ [ ]D/K [ ]Ref [ ]N/A
IF YES to Q15→Q15e. Where was your household ABLE TO GET alternative source(s) of water during the ‘do not use order?’ CATA. [ ]Purchased from large store or grocery (e.g. Wal-Mart, Kroger) [ ]Water distribution site in my town of residence [ ]Well water on premises [ ]Purchased from nearby convenience store or gas station [ ]Water distribution site outside of my town of residence [ ]Rainwater [ ]Water from a friend or relative [ ]Other: ____________________________________ [ ]D/K [ ]Ref [ ]N/A
IF YES to Q15→Q15f. If anyone in your household visited a water distribution site, how did you find out about the location? CATA. [ ]Received phone call on land line [ ]Received phone call on cell phone [ ]Text message [ ]Face-to-face talking to people [ ]D/K [ ]Social media (e.g. Facebook, Twitter) [ ]Radio [ ]TV [ ]Newspaper [ ]Internet [ ]Other:_____________ [ ]Ref [ ]N/A
IF YES to Q15→Q15g. Did anyone in your household travel outside of the area affected by the chemical spill to get alternative source(s) of water during the ‘do not use’ order? CATA .[ ]Yes, to purchase water [ ]Yes, got water from friend/relative [ ]Yes, but did not get water [ ]No [ ]D/K [ ]Ref [ ]N/A
Q16. How long was your household without ANY alternative source of drinking water during the ‘do not use’ order? [ ]My household was never without an alternative source of drinking water [ ]less than 1 day [ ]__#__ days [ ]D/K [ ]Ref [ ]N/A
Q16a. If your household was without an alternative source of drinking water for one or more days, what was the reason for this? CATA. [ ]Not enough money to purchase water [ ]No transportation [ ]Store was out of water [ ]Distribution site was out of water [ ]Could not locate distribution site [ ]Distribution site changed [ ]Distribution site closed [ ]Did not have clean containers for filling [ ]Could not leave work [ ]Other __________________________________________ [ ]D/K [ ]Ref [ ]N/A
Continued on the back page →
Public reporting burden of this collection of information is estimated to average 20 minutes per response, including the time for reviewing instructions, searching existing data sources, gathering and maintaining the data needed, and completing and reviewing the collection of information. An agency may not conduct or sponsor, and a person is not required to respond to a collection of information unless it displays a currently valid OMB control number. Send comments regarding this burden estimate or any other aspect of this collection of information including suggestions for reducing this burden to CDC/ATSDR Reports Clearance Officer; 1600 Clifton Road NE, MS E-11 Atlanta, Georgia 30333; ATTN: PRA (0920-0008)
Appendix A: West Virginia CASPER Questionnaire – April 2014
West Virginia Community Assessment for Public Health Emergency Response - Elk River Chemical Spill, January 9th, 2014 D/K=don’t know Ref=refused N/A=not applicable CATA= Check all that apply WVAW= West Virginia American Water
Date: ____/_______/2014 Cluster No.: _______________ Interview No.: ___________________ Interviewers initials: _________________
Form Approved OMB No. 0920-0008
Exp Date: 07/31/2014

Page 66 of 66
This next set of questions is about the impact of the chemical spill on your household.
Q17.Did anyone in your household stay overnight outside of your home for one or more days in order to have access to an alternative source of water? [ ]Yes, paid money to stay elsewhere (e.g. hotel) [ ]Yes, but did not have to pay (e.g., stayed with a friend) [ ]No [ ]D/K [ ]Ref [ ]N/A
Q18. If you have children in your household in daycare or grades K-12, did any of their schools or daycares close due to the chemical spill? [ ]Yes [ ]No [ ]D/K [ ]Ref [ ]N/A (children do not go to school or daycare) [ ]N/A (do not have children)
IF YES TO Q18→Q18a. Did anyone in the household have to take off from work to care for them? CATA. [ ]Yes [ ]No, they did not require supervision [ ]No, unpaid friend/relative was able to supervise them [ ]No, someone was paid to supervise them [ ]Other ___________________________________________ [ ]D/K [ ]Ref [ ]N/A
Q19. Does anyone in the household own a business? [ ]Yes [ ]No [ ]D/K [ ]Ref IF YES to Q19→Q19a. Was the business ORDERED to close as a result of the chemical spill? [ ]Yes [ ]No [ ]D/K [ ]Ref [ ]N/A
Q20. Was any member of your household told not to come in to work because of the chemical spill? [ ]Yes, with paid leave [ ]Yes, with unpaid leave [ ]No [ ]Other: ______________________ [ ]D/K [ ]Ref [ ]N/A
This next set of questions is about the health of members of your household.
Q21. Since the chemical spill on January 9th
(show calendar), did anyone in your household have any health issues they felt were related to the chemical spill? [ ]Yes [ ]No [ ]D/K [ ]Ref
IF YES to Q21.→Q21a. How many people in your household feel they had health issues related to the chemical spill? [ ] __#__ less than 18 years [ ]__#__ 18 years old or older [ ]D/K [ ]Ref [ ]N/A
IF YES to Q21.→Q21b. What type of health issues did you or your household members have? (Do NOT read list aloud; wait for interviewee to list & CATA) [ ]Nausea [ ]Vomiting [ ]Abdominal pain [ ]Diarrhea [ ]Rash [ ]Skin irritation/itching [ ]Headache [ ] Eye irritation/pain [ ]Sore throat [ ]Respiratory illness/cough [ ]Other: ________________________ [ ]D/K [ ]Ref [ ]N/A
IF YES to Q21.→Q21c. When did the symptom(s) start? CATA. [ ]Before the ‘do not use’ order [ ]During the ‘do not use’ order [ ]After the ‘do not use’ order was lifted [ ]Other:______ [ ]D/K [ ]Ref [ ]N/A
IF YES to Q21.→Q21d. Where was medical care sought? CATA. [ ]Did not seek medical care [ ]Primary care physician/provider [ ]Urgent care [ ]Emergency room [ ]Was admitted to the hospital [ ] Other: __________________________ [ ]D/K [ ]Ref [ ]N/A
IF YES to Q21.→Q21e. If household members did NOT seek medical care, what were reason(s) for not doing so? CATA. [ ]Health issues were not serious enough to seek medical care [ ]No insurance [ ]No transportation [ ]Concerned about the cost of seeking medical care [ ]Other: _______________________________________________ [ ]D/K [ ]Ref [ ]N/A
Q22. Since the chemical spill, has anyone in your household experienced any mental health issues they felt were related to the chemical spill? [ ]Yes [ ]No [ ]D/K [ ]Ref
IF YES to Q22 →Q22a. What kinds of mental health issues? (Do NOT read list aloud; wait for interviewee to list, then CATA) [ ]Agitated behavior [ ]Anxiety or stress [ ]Difficultly concentrating [ ]Loss of appetite [ ]Trouble sleeping/nightmares [ ]Alcohol/drug use [ ]Witnessed or experienced violence [ ]Other: _______________________________________________________ [ ]D/K [ ]Ref [ ]N/A
Q23. Did any of your pets have any illness that you felt was related to the chemical spill? [ ]Yes [ ]No [ ]D/K [ ]Ref [ ]N/A
IF YES to Q23→Q23a. What type of symptoms did your pets have? (Do NOT read list aloud; wait for interviewee to list, then CATA) [ ]Vomiting [ ]Diarrhea [ ]Rash [ ]Skin irritation/itching [ ]Eye irritation [ ]Respiratory illness/cough [ ]Other: ___ [ ]D/K [ ]Ref [ ]N/A
IF YES to Q23→Q23b. Did you seek veterinary care for your animal(s)? [ ]Yes [ ]No [ ]D/K [ ]Ref [ ]N/A
This next set of questions is about your household after the ‘do not use order’ was lifted.
Q24. When did anyone in your household first learn that the ‘do not use’ order was lifted for your household? Date: 01/ /2014 [ ]D/K [ ]Ref [ ]N/A
Q25. How did your household FIRST LEARN that the ‘do not use’ order was lifted? Choose only ONE. [ ]Phone call on land line [ ]Phone call on cell phone [ ]Text message [ ]Face-to-face talking to people [ ]Social media (e.g. Facebook, Twitter) [ ]Radio [ ]TV [ ]Newspaper [ ]Map on WVAW website [ ]Internet (other than WVAW website) [ ]Other:__________ [ ] D/K [ ]Ref [ ]N/A
Q25a. From whom or where did your household FIRST LEARN that the ‘do not use’ order was lifted? Choose only ONE. [ ]WVAW [ ]Friend/neighbor [ ]Family/relative [ ]Co-worker [ ]Stranger [ ]Internet (specify site):__________________ [ ]Radio (specify station):________ [ ]TV (specify station):________ [ ]Newspaper(specify):__________ [ ]Other:__________ [ ] D/K [ ]Ref [ ]N/A
Just to verify, you FIRST LEARNED that the ‘do not use’ order was lifted from (Q25a answer) by (Q25 answer), is this correct?
Q26. How did your household receive information on how to flush your household plumbing system? CATA. [ ]Phone call on land line [ ]Phone call on cell phone [ ]Text message [ ]Face-to-face talking to people [ ]Social media (e.g. Facebook, Twitter) [ ]Radio [ ]TV [ ]Newspaper [ ]WVAW website [ ]Internet (other than WVAW website) [ ]Did not receive information [ ]Other:________________________________________ [ ] D/K [ ]Ref [ ]N/A
Q27. Was the information on how to flush your home plumbing system easy to read and understand? [ ]Yes [ ]No [ ]D/K [ ]Ref [ ]N/A
Q28. After the ‘do not use’ order was lifted, did anyone in your household begin using water from WVAW before the end of January? [ ]Yes [ ]No [ ]D/K [ ]Ref [ ]N/A
IF YES to Q28 →Q28a. For what purposes? CATA. [ ]Drinking [ ]Hand washing [ ]Brushing teeth [ ]Cooking [ ]Washing clothes [ ]Showering/bathing [ ]Dishwashing [ ]Giving water to pets [ ]Watering plants [ ]Other ___________________________________ [ ] D/K [ ]Ref [ ]N/A
Q29. Is anyone in your household currently using water from WVAW? [ ]Yes [ ]No [ ]D/K [ ]Ref [ ]N/A
IF YES to Q29 →Q29a. For what purposes? CATA. [ ]Drinking [ ]Hand washing [ ]Brushing teeth [ ]Cooking [ ]Washing clothes [ ]Showering/bathing [ ]Dishwashing [ ]Giving water to pets [ ]Watering plants [ ]Other __________________________________ [ ] D/K [ ]Ref [ ]N/A
Q30. BEFORE the chemical spill, did you believe that the WVAW water supply your household received was safe? [ ]Yes [ ]No [ ]D/K [ ]Ref [ ]N/A
Q31. SINCE the ‘do not use’ order was lifted, do you believe that the WVAW water supply your household receives is safe? [ ]Yes [ ]No [ ]D/K [ ]Ref [ ]N/A
Q32. What is the total yearly income for your household? [ ]less than $15,000 [ ]$15,000-$24,999 [ ]$25,000–$49,999 [ ]$50,000-$99,999 [ ]$100,000- $150,000 [ ]$150,000+ [ ]D/K [ ]Ref
Q33. Is there anything else you would like to share with us related to the chemical spill?
West Virginia Community Assessment for Public Health Emergency Response - Elk River Chemical Spill, January 9th, 2014 D/K=don’t know Ref=refused N/A=not applicable CATA= Check all that apply WVAW= West Virginia American Water
Form Approved OMB No. 0920-0008
Exp Date: 07/31/2014