discerning prey from predator in dragonflies
TRANSCRIPT

Union CollegeUnion | Digital Works
Honors Theses Student Work
6-2011
Discerning Prey from Predator in DragonfliesMelanie LolierUnion College - Schenectady, NY
Follow this and additional works at: https://digitalworks.union.edu/theses
Part of the Neuroscience and Neurobiology Commons
This Open Access is brought to you for free and open access by the Student Work at Union | Digital Works. It has been accepted for inclusion in HonorsTheses by an authorized administrator of Union | Digital Works. For more information, please contact [email protected].
Recommended CitationLolier, Melanie, "Discerning Prey from Predator in Dragonflies" (2011). Honors Theses. 1022.https://digitalworks.union.edu/theses/1022

DISCERNING PREY FROM PREDATOR IN DRAGONFLIES
By
Melanie Lolier
*********
Submitted in partial fulfillment
of the requirements for
Honors in the Department of Neuroscience
UNION COLLEGE
June, 2011
08 Fall

i
ABSTRACT LOLIER, MELANIE Discerning Prey from Predator in Dragonflies. Department of
Neuroscience, June 2011.
ADVISOR: [Professor Robert Olberg]
The dragonfly is a visual predator that feeds on small flying insects. Because of
their high rate of hunting success, dragonflies must have the ability to efficiently discern
prey and predator from natural surroundings. In this study, we investigated the extent to
which visual flight-control neurons in dragonflies are able to differentiate stimuli that
simulate prey items from those that simulate predators. To do this, we presented fourteen
sets of rectangular stimuli varying in height, width, speed, and moved in four directions
while recording extracellular neuronal responses from the ventral nerve cord. Each of the
rectangular stimulus patterns was moved in two ways: (1) along its long axis (a “worm”
stimulus) and (2) perpendicular to its long axis (an “antiworm” stimulus). Our
preliminary results show that dragonflies respond best to smaller stimuli, particularly the
4° target, with speed having no significant effect on the neural responses. Further
research is necessary and ongoing to determine trends related to changes in stimuli size
and velocity.

ii
ACKNOWLEDGEMENTS
I would like to acknowledge and thank my thesis advisor, Professor Rob Olberg, for his
help in completing this thesis from beginning to end. It was an honor and privilege to
work with an advisor who is highly knowledgeable about his line of research. I appreciate
his sacrifice of time, his patience, and his guidance. I also appreciate the help and work of
my lab mates, Autumn Arons and Tori Mathieu.

Table of Contents
Introduction ..................................................................................................................... 1
Methods and Materials................................................................................................... 4
Animals .................................................................................................................................................................... 4
Animal Preparation and Electrophysiology....................................................................................... 4
Stimuli design ...................................................................................................................................................... 5
Receptive Field Analysis ................................................................................................................................ 7
Results ............................................................................................................................... 8
Upward movement ........................................................................................................................................... 9
Contralateral Movement .............................................................................................................................11
Ipsilateral Movement ....................................................................................................................................12
Downward Movement...................................................................................................................................14
Discussion .......................................................................................................................16
Works Cited .....................................................................................................................19
1
Introduction
The relationship between prey and predator is one of the oldest and most complex
relationships in nature. The inability for one to protect itself from a predator has deadly
consequences and the inability to effectively and efficiently hunt has similar results.
Evolution of particular features such as paired appendages (Ruvinsky, Oates, Silver, &
Ho, 2000), are selected for to help the hunted escape. Theories about what makes
something a valuable prey item have been devised, referred to as predator-prey models,
and have been offered to explain this seemingly random choice. One of the pioneers of
the predator- prey model was Ivlev (Eggers, 1977). Ivlev, who worked with fishes,
created a mathematical equation, shown below, to support his hypothesis that the rate of
an animal’s consumption depends on how hungry it is.
r = R [1- exp (-P)] (1)
In the equation (1), R is maximum amount of food that can be ingested by the predator, P
is the prey density, r is the ingested ration and is a constant. For this equation, Ivlev
was criticized (Rashevsky, 1959), for not taking into account factors such as physical and
physiological properties of the predator, vision, and effects of hunger. Despite the
shortcomings of Ivlev’s equation, his efforts helped others create models to better
understand prey-predator interactions.
In 1966, Holling (Eggers, 1977) developed another prey-predator model that
included variable degrees of hunger as well as the time needed for the predator to hunt,
kill and consume its prey before hunting again. Another researcher, Nakamura (1974),
building off of both Ivlev and Holling’s work, confirmed that hunger was a basic

2
component of predation. The reasons for hunting a particular prey, as summarized by
Pyke et al in 1977 (Armstrong & Stamp, 2003) are: 1) the quality of the prey in
comparison with other prey 2) quantity of prey available and 3) if capturing the prey
maximizes the predator’s energy gain.
To be able to escape a predator, one must be able to identify the threat. The three
primary ways in which an animal may detect information about its environment are
mechanical, visual and chemical (Dicke & Grostal, 2001). In dragonfly larvae, chemical
recognition is primarily used to identify its surroundings (Chivers, Wisenden, & Smith,
1996). By adulthood, dragonflies are visual predators that intercept their prey mid-flight.
Their prey capture flights are short, often less than 200ms from takeoff to prey
interception (Olberg, Seaman, Coats, & Henry, 2007), and highly accurate, with success
rates as high as 97% (Olberg, Worthington, & Venator, Prey pursuit and interception in
dragonflies, 2000).
Earlier research concerning dragonfly vision highlight the presence of select
neurons, known as target-selective descending neurons (TSDNs), located in the ventral
nerve cord that respond to stimuli with directional selectivity and size (Frye & Olberg,
1995). These 8 bilateral pairs of neurons fall into one of two general size preferences.
Most TSDNs respond to a wide range of sizes (MDT1, MDT2, MDT3, MDT5, DIT2,
DIT3), while the two remaining neurons (DIT1, MDT4) respond best to smaller targets.
All TSDNs show some directional selectivity while others, such as DIT1 and MDT4, are
strongly selective. These feature detectors are believed to steer the dragonfly while it
hunts for prey, keeping the image of the prey item in a fixed position on the retina.

3
Evidence for neurons that respond to targets with particular features are found
throughout the animal kingdom. In some insects, such as the hoverfly, there is data that
support object selectivity for targets smaller than 1°(Nordström & O'Carroll, 2006).
Studies in cats show the presence of neurons with a preference for edges (Pettigrew &
Freeman, 1973). Amphibians, particularly the common toad (Bufo bufo), have also been
studied and are found to have neurons, called T5(2) cells, which are used in prey
recognition (Ewert J. , 1980).
Learning about the existence of T5(2) cells came as a result of recording neural
responses of the toad to various predators, in the optic tectum region of the brain(Ewert J.
, 1980). In 1979, Ewert and Traud tested the behavioral responses of Bufo bufo in the
presence of known predators. They exposed the toads to predators such as a Buzzard
(Buteo buteo), a leech (Hirudo medicinalis), giant ant (componotus herculeanus),
hedgehog (Erinaceus europaeus) and a ringsnake (Natrix natrix). Certain features from
the toad’s main predators, the hedgehog and ringsnake, were used to create artificial
stimuli mimicking them to help determine what characteristics influenced behavior. The
parameters of the stimuli included velocity and direction of motion, direction of stimulus,
background contrast, stimulus size, and stimulus configuration (Ewert & Traud, 1979).
Researchers determined that the best response was from small targets that moved
in a worm-like manner(Ewert & Traud, 1979). This study then inspired further research
with only 2-dimensional stimuli that moved in a worm-like manner (moving parallel to
the direction of motion), and had a worm-like shape, such as a rectangle, compared with
anti-worm stimuli, which was a rectangle moving perpendicular to the direction of
motion. The purpose of the study was to determine how the shape of the stimulus and its

4
movement influenced the toad’s behavioral response, as measured by turns per minute as
well as its neural response, measured in impulses. In nature, toads generally turn toward
potential prey and turn away from a potential predator. Therefore it was expected in this
study that the more turns per minute, the higher the likelihood that the toad would
respond to the stimulus as it would a potential prey item. From these behavioral
responses, researchers were able to match them with corresponding neural responses,
particularly from T5(2) cells (Ewert J. , 1980). These cells are most responsive to
rectangles between 8° and 16° in length, and moving parallel to their long axis. Ewert
concluded that the relationship between shape and movement, particularly movement of
stimuli in the direction of the long axis, was the most effective stimulus. Separately
neither shape nor direction proved most effective, suggesting that effective prey
recognition in toads form as a result of adding separate stimulus properties.
The study mentioned above led us to question how dragonflies discern prey from
predator. In a similar experiment, we exposed dragonflies to worm and anti-worm stimuli
and measured their neural responses. We also manipulated the velocity of the stimuli to
determine whether or not this added dimension affected dragonfly response.
Methods and Materials
Animals Adult male and female dragonflies (family Aeshnidae) captured from central New
York were used in this study.
Animal Preparation and Electrophysiology

5
The dragonfly preparation began with chilling the insect, after which the legs
were removed. The leg-less insect was then waxed onto a rod with a beeswax/rosin
mixture, ventral side up. The cuticle between the prothoracic and mesothoracic area was
carefully dissected, exposing the 2 connectives of the ventral nerve cord. One of the two
connectives was cut and then allowed to heal for 15minutes. The rod was then placed in a
holder, at a 45°, with the dragonfly positioned ventral side up, facing a 600x600 pixel
screen, about 16 centimeters away. A suction electrode was then applied to the
descending end of the severed connective. The extracellular signal from a bundle of
axons was taken up by the electrode that was amplified (AM Systems Model XXXX),
digitized (PowerLab by AD Instruments) and recorded on a Macintosh computer for
offline analysis. All data were collected at room temperature. The spike signals were
sorted in a clustering program (Dataview, by William Heitler).
Stimuli design
On the computer screen one of 7 stimuli were displayed, shown in Figure 1. Each
stimulus appeared on-screen, starting at the top and making 7 sweeps to the bottom of the
screen, Figure 2. The stimuli then moved contralaterally (moving in the direction away
from the severed nerve-connective), up, and ispilaterally(moving in the direction toward
the severed nerve-connective), each making 7 sweeps. Each stimulus moved at a normal
speed, 140°/second and then again at a faster speed, 280°/second.
6
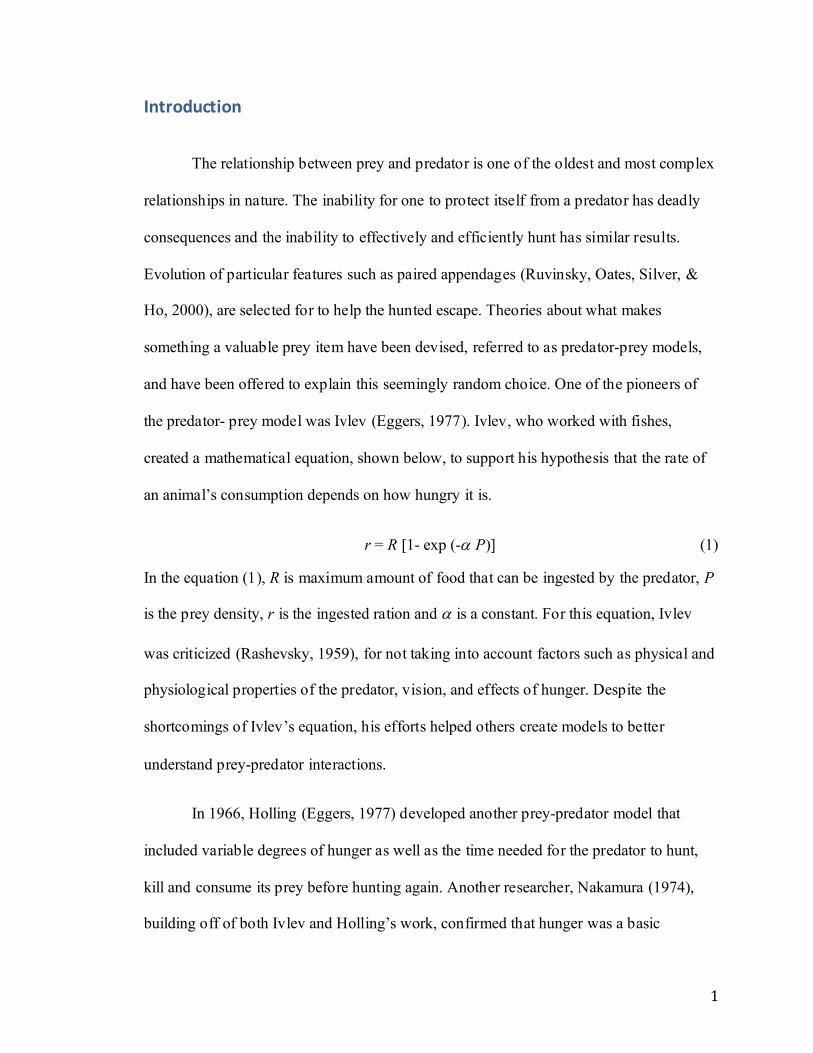
Figure 1. Four types of stimuli presented to the dragonfly. The stimulus was determined to be either worm or anti-worm based on the direction it was moving. When the 8° rectangle on the left moves vertically, it is an anti-worm stimulus because the shape is perpendicular to the motion. When moving horizontally, the stimulus behaves as a worm because its shape is parallel to the
direction of movement.
The stimuli presented to the dragonfly were specifically designed to test how
pattern expansion either in the direction of movement or perpendicular to the direction of
movement affected neural responses. The first stimulus created was a 4° square, used as
our control. The worm stimuli we created were based on horizontal growth of their
leading edge, that is, increasing the length of the horizontal rectangle (8°, 16° and 32°)
while keeping the width (4°) the same. The logarithmic increase in length was meant to
test how the neurons responded to both edges and size. In the same way, manipulating the
height (8°, 16°, and 32°) of a vertical rectangle while keeping the width (4°) constant was
how the anti-worm stimuli were created. Although this was how the stimuli were created
and labeled assuming it was only moving horizontally, the worm and anti-worm label
varied based on the shape of the stimulus in relation to its motion. An example of this is
the stimulus on the left in Figure 1. The stimulus was created as a worm, which is that
case if it is moved horizontally, but becomes an anti-worm if it moves vertically. Also,
the stimuli were black and presented onto a white background.
7
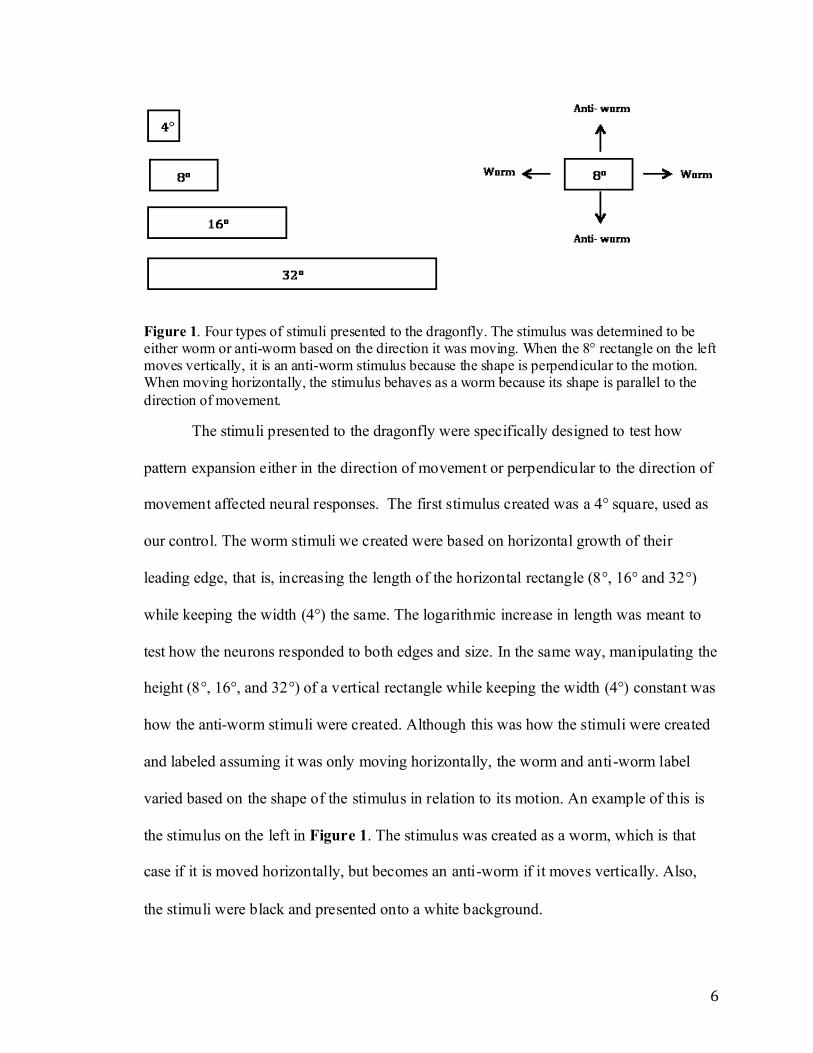
Figure 2. Movement of stimuli on screen. Each stimulus moved in 7 parallel sweeps, 1 movement at a time, 10° apart. The stimuli moving at 140°/second (normal) moved down the screen in 500ms. The stimuli moving at 280°/secong (fast) moved down the screen in 250 ms. This particular example shows downward movement, however, stimuli in each of the other
directions (up, ipsilateral, and contralateral) also moved 10° apart in 7 parallel sweeps.
Receptive Field Analysis
To determine receptive field, that is the area of the dragonfly’s visual field that
issues the best response, we used a 4° circle that moved across screen, with 7 sweeps in 4
directions (up, down, left, right) as depicted in Figure 2. This data was then analyzed
using a MatLab program that plotted neural activity caused by each stimulus, and then
sorted by direction. An example of this is shown in Figure 3, where this particular

8
neuron prefers ipsilateral (moving in the direction of the cut nerve connective)
movement.
Figure 3. Receptive fields were used to determine directional preference for each unit. Receptive fields such as this was made for each unit to determine directional selectivity. In this particular
example, the unit responds best to ipsilateral movement.
Results
We collected data from 18 Aeshnidae dragonflies, both male and female, and
analyzed the data from 3 of the best trials. The recorded neural responses were classified
as TSDNs based on strong responses to the size and direction of target movements. The
data plotted below have length or height of stimulus, for worm or anti-worm respectively,

9
on the x-axis, showing progressive stimulus growth. On the y-axis is the spike count,
which corresponds to the number of neural responses for that stimulus.
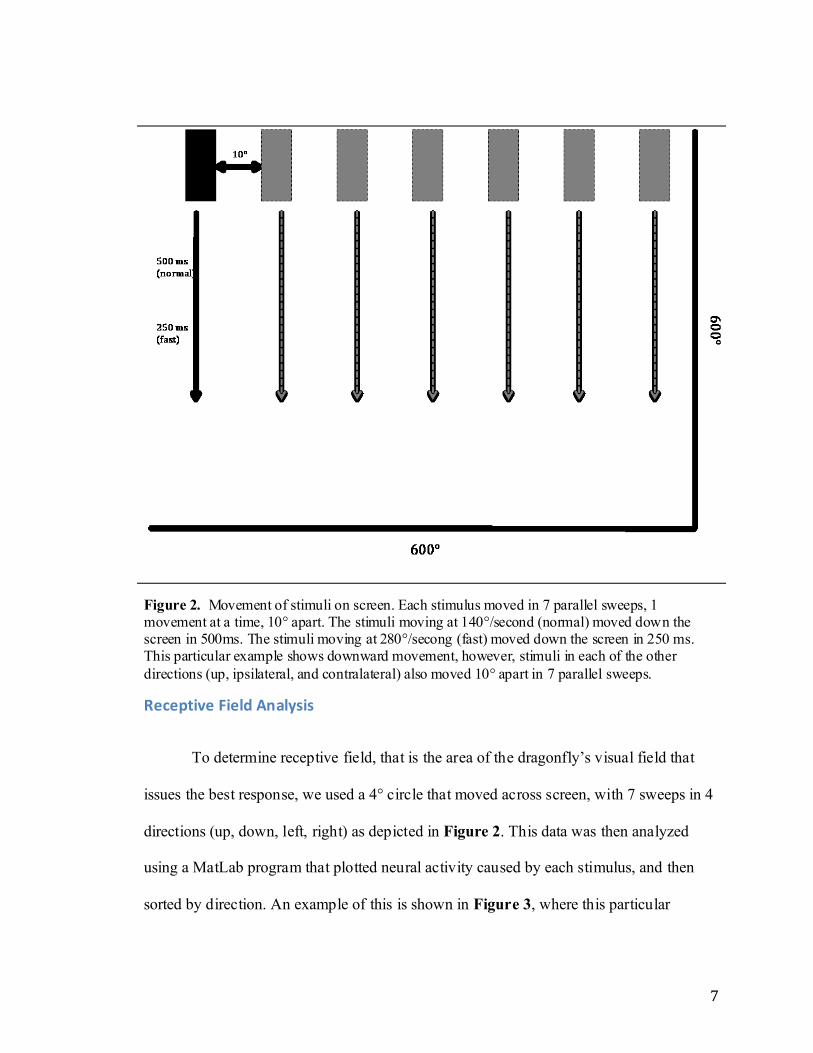
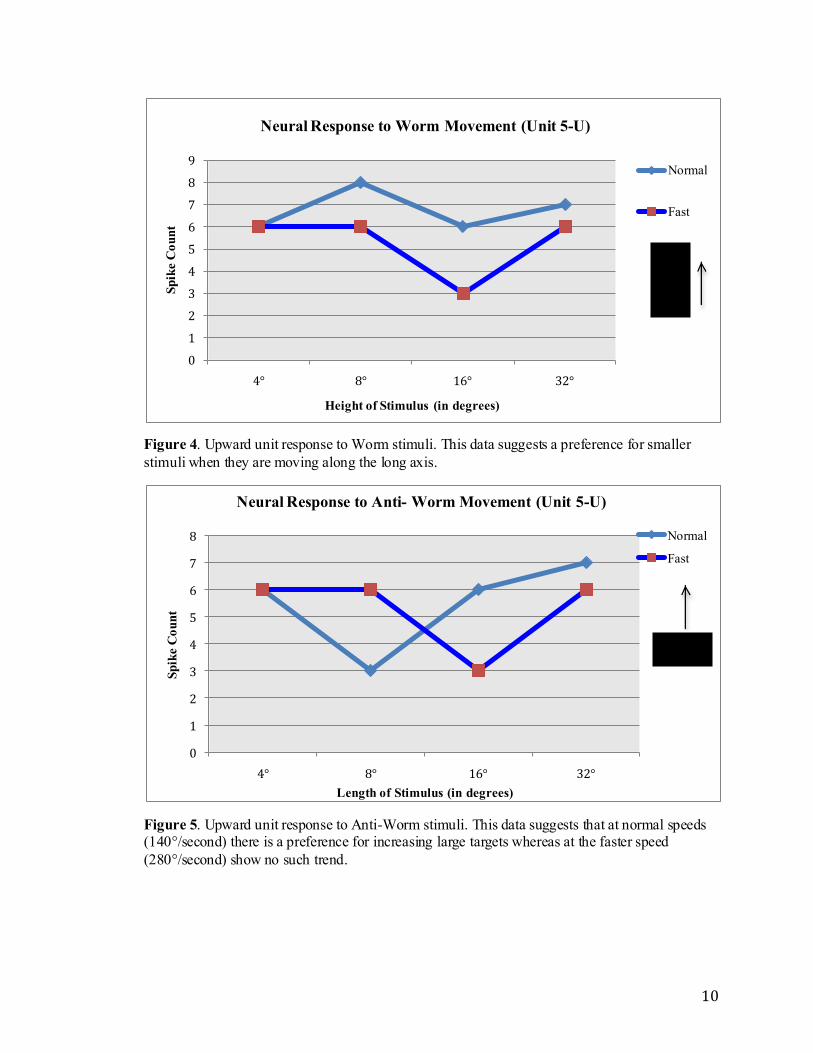
Upward movement
Putatively, we believe that the TSDN corresponds with the pattern of preference
for upward movement is DIT3 (Frye & Olberg, 1995). From Frye and Olberg (1995), we
know that DIT3 prefers upward movement and looming stimuli. Looming stimuli can be
characterized as a target that appears to be approaching. Neurons that respond to looming
targets have also been studied in locusts (Rind & Santer, 2004), with results that show the
closer the approach of the stimulus, the more observable spike activity. Here, in response
to normal speed (140°/second), no consistent trend for stimuli size emerges, with the best
worm response to the 8° target moving at the normal speed and the best anti-worm
response to the 32° target. Worm data, at both speeds, shows a preference for smaller
targets whereas anti-worm data shows preference for increasingly large stimuli (normal
speed). There is a noticeable trend for the faster speed (280°/second), in which there is a
consistent number of responses to the 4°, 8°, and 32° targets and a response half the spike
count for the 16° target for both worm and anti-worm data.
10
Figure 4. Upward unit response to Worm stimuli. This data suggests a preference for smaller
stimuli when they are moving along the long axis.
Figure 5. Upward unit response to Anti-Worm stimuli. This data suggests that at normal speeds (140°/second) there is a preference for increasing large targets whereas at the faster speed
(280°/second) show no such trend.
0
1
2
3
4
5
6
7
8
9
4° 8° 16° 32°
Sp
ike C
ou
nt
Height of Stimulus (in degrees)
Neural Response to Worm Movement (Unit 5-U)
Normal
Fast
0
1
2
3
4
5
6
7
8
4° 8° 16° 32°
Sp
ike C
ou
nt
Length of Stimulus (in degrees)
Neural Response to Anti- Worm Movement (Unit 5-U)
Normal
Fast

11
Contralateral Movement The unit that responds best to contralateral movement, defined as moving in the
direction opposite of the connective cut, and smaller stimuli we hypothesize to be DIT1
(Frye & Olberg, 1995). DIT1 responds strongly to smaller targets along the midline and
contralateral motion. At normal speeds (140°/second) for both worm and anti-worm data
we see a fall off response as the target gets larger. More specifically, for the worm
stimuli, there are stronger responses to both the 4° and 8° targets whereas in the anti-
worm stimuli, there is a dramatic decrease from the activity in the 4° target to the 8°
target. As in the upward selective unit, the faster speed (240°/second) had a consistent
response in both the worm and anti-worm data; there was a parabolic response to the
increasing stimuli. For this unit, neural activity favors the worm stimuli.
Figure 6. Contralateral unit response to worm stimuli. At the normal speed (140°/second) there is a stronger response than at the faster speed (280°/second). At both speeds there is a decrease in
neural activity as the size of the stimulus increases.
0
5
10
15
20
25
30
35
40
4° 8° 16° 32°
Sp
ike C
ou
nt
Length of Stimulus (in degrees)
Neural Response to Worm Movement(Unit 1-C)
Normal
Fast

12
Figure 7. Contralateral unit response to anti-worm stimuli. The contralateral unit, believed to be
DIT1, has a decrease in spike count, in both speeds as the height of the stimulus increases.
Ipsilateral Movement
The data from the ipsilateral movement is not clear enough to suggest only one
possible TSDN responding, rather, the unit responding may either be MDT2 or DIT2 or
some combination of the two. MDT2 responds better to smaller targets, whereas DIT2
responds to a wider range of stimuli size(Frye & Olberg, 1995). However both prefer
movements away from the midline and have large lateral receptive fields. At the normal
speed (140°/second) for both worm and anti-worm data, there is a decrease in response as
the stimulus gets larger. Similar to the contralateral unit, there is a larger decrease from
the 4° target response to the 8° target response in the anti-worm data as compared with
the worm data. Similarly, for the faster speed (280°/second) there is a decrease in
response to increasing target size. The trend for both normal and fast speed in the worm
0
5
10
15
20
25
30
35
40
4° 8° 16° 32°
Sp
ike C
ou
nt
Height of Stimulus (in degrees)
Neural Response to Anti-Worm Movement (Unit 1-C)
Normal
Fast

13
data show a continued decrease to increasing worm size. For the anti-worm data, there is
a peak response to the 8° stimulus at the faster speed whereas the normal speed shows a
general decline to growing anti-worm stimuli. MDT2 appears to be responding to the
worm movement because of the strong selectivity for the smaller targets. However, in the
anti-worm movement, it is unclear whether MDT2 is responding on its own, or if there is
input from DIT2.
Figure 8. Ispilateral response to worm stimuli. Both speeds have a decline in response to
increasing worm size.
0
2
4
6
8
10
12
4° 8° 16° 32°
Sp
ike C
ou
nt
Length of Stimulus (in degrees)
Neural Response to Worm Movement (Unit 5-I)
Normal
Fast

14
Figure 9. Ispilateral unit response to anti-worm stimuli. The normal speed response immediately declines as the target size increases. In the faster speed, there is first a peak response to the 8°
target before there is a decline.
Downward Movement
Based on the unit’s preference for downward motion and smaller targets, we
hypothesize that MDT4 may be responding (Frye & Olberg, 1995). The normal speed
(140°/second) of the stimuli for both worm and anti-worm data show a very similar and
almost identical decrease in response to an increasing target size. In both instances, there
is about a 25 spike count difference between the 4° stimulus and the 8°. Similarly, the
fast speed (280°/second) also has a fall off in response for both worm and anti-worm
data, however the decline is not as steep. Overall, for both worm and anti-worm data,
there is a consistent decline, and therefore neither stimulus appears to be preferred.
0
1
2
3
4
5
6
7
8
9
4° 8° 16° 32°
Sp
ike C
ou
nt
Height of Stimulus (in degrees)
Neural Response to Anti-Worm Movement (Unit 5-I)
Normal
Fast
15
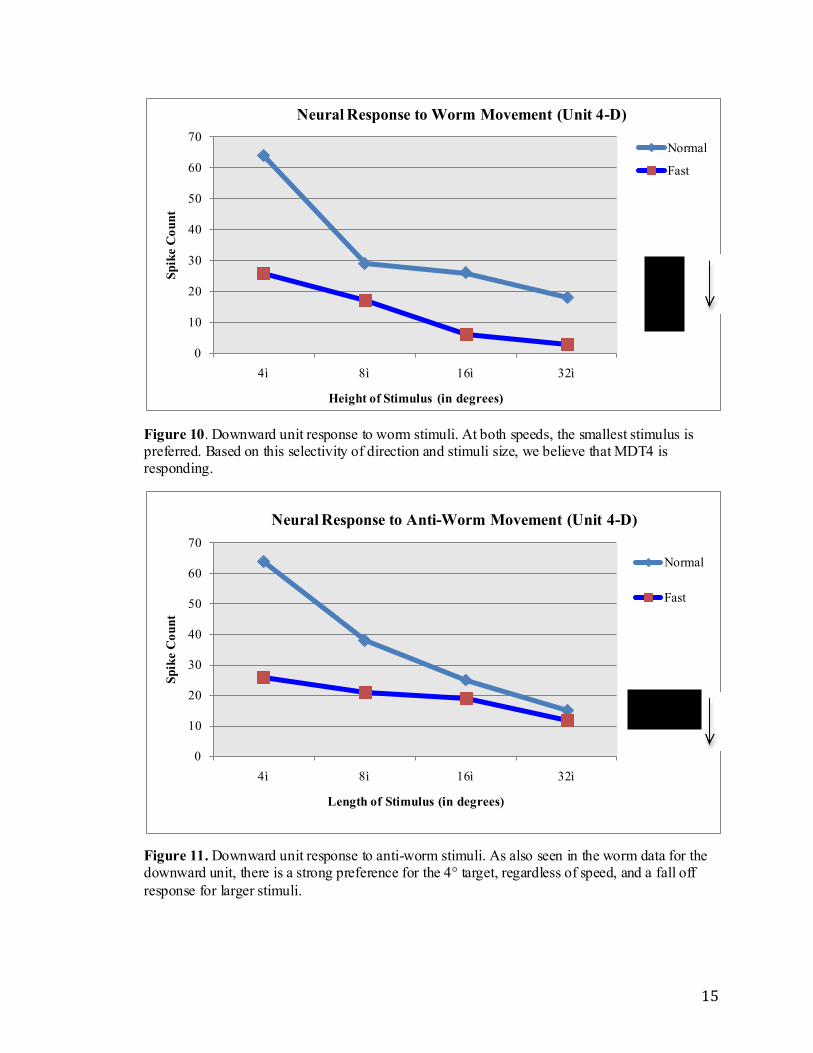
Figure 10. Downward unit response to worm stimuli. At both speeds, the smallest stimulus is preferred. Based on this selectivity of direction and stimuli size, we believe that MDT4 is responding.
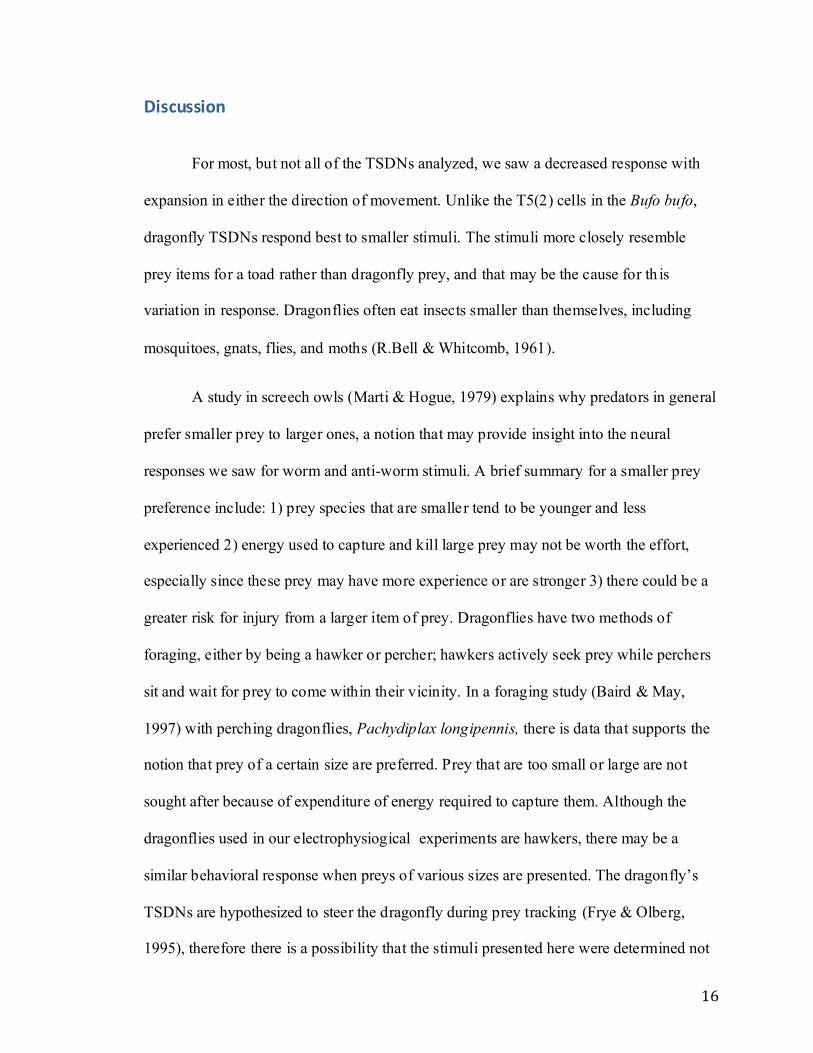
Figure 11. Downward unit response to anti-worm stimuli. As also seen in the worm data for the downward unit, there is a strong preference for the 4° target, regardless of speed, and a fall off
response for larger stimuli.
0
10
20
30
40
50
60
70
4° 8° 16° 32°
Sp
ike C
ou
nt
Height of Stimulus (in degrees)
Neural Response to Worm Movement (Unit 4-D)
Normal
Fast
0
10
20
30
40
50
60
70
4° 8° 16° 32°
Sp
ike C
ou
nt
Length of Stimulus (in degrees)
Neural Response to Anti-Worm Movement (Unit 4-D)
Normal
Fast
16
Discussion
For most, but not all of the TSDNs analyzed, we saw a decreased response with
expansion in either the direction of movement. Unlike the T5(2) cells in the Bufo bufo,
dragonfly TSDNs respond best to smaller stimuli. The stimuli more closely resemble
prey items for a toad rather than dragonfly prey, and that may be the cause for th is
variation in response. Dragonflies often eat insects smaller than themselves, including
mosquitoes, gnats, flies, and moths (R.Bell & Whitcomb, 1961).
A study in screech owls (Marti & Hogue, 1979) explains why predators in general
prefer smaller prey to larger ones, a notion that may provide insight into the neural
responses we saw for worm and anti-worm stimuli. A brief summary for a smaller prey
preference include: 1) prey species that are smaller tend to be younger and less
experienced 2) energy used to capture and kill large prey may not be worth the effort,
especially since these prey may have more experience or are stronger 3) there could be a
greater risk for injury from a larger item of prey. Dragonflies have two methods of
foraging, either by being a hawker or percher; hawkers actively seek prey while perchers
sit and wait for prey to come within their vicinity. In a foraging study (Baird & May,
1997) with perching dragonflies, Pachydiplax longipennis, there is data that supports the
notion that prey of a certain size are preferred. Prey that are too small or large are not
sought after because of expenditure of energy required to capture them. Although the
dragonflies used in our electrophysiogical experiments are hawkers, there may be a
similar behavioral response when preys of various sizes are presented. The dragonfly’s
TSDNs are hypothesized to steer the dragonfly during prey tracking (Frye & Olberg,
1995), therefore there is a possibility that the stimuli presented here were determined not
17
to be worth taking, since there is less response to both worm and anti-worm rectangles
versus that of the 4°square.
In some insects, such as the fly, butterfly and locust, there is data that support the
presence of neurons that are either ‘fast’ or ‘slow’ (Horridge & Marcelja, 1992) in
response to certain frequencies, a factor indirectly studied in this experiment. In our
experiment we manipulated the speed of our stimuli, either at normal speed
(140°/second) or faster speed (280°/second). The stimuli moving at the faster speed
appeared onscreen for a half the amount of time as the normal speed, 250ms for faster
and 500 ms for slower. To fairly compare the obtained results at the different speeds, we
doubled the spike count for the fast data so that the onscreen time would be the same. As
a result, there was a greater response to both worm and anti-worm stimuli for faster
speeds than normal speeds, however, the response to 4° targets were still the strongest.
From a study by Horridge and Marcelja (1992), we learn that fast neurons respond to a
peak frequency at 15-29 Hz while responses of slow neurons peak at 1-10 Hz. With this
specialization of cells, we can hypothesize that speed, much like size and direction, is
another important factor in an animal’s evaluation of prey pursuit.
The ability to differentiate prey from predator is a basic survival skill. Although
thousands of years of evolution appears to have selected for animals that can efficiently
and effectively use their senses to help them escape from danger, the process by which
this occurs remains a mystery. There are several theories to explain how we can identify
our environment, and objects in it that may or may not be harmful. These theories include
objection recognition, recognition neurons, and spatiotemporal pattern recognizers. The
object recognition theory has its basis in the belief that the brain contains a list of feature
18
detecting neurons that recognizes a whole object, even at different angles, instead of a
combination of its parts. The theory of recognition neurons (Haber & Hershenson, 1980)
involves the brain recognizing certain features and associating them with particular
objects to help identify it. The final and most probable hypothesis is that of
spatiotemporal pattern recognizer in which a limited group of neurons would all be
activated by all perceived objects, but in a different temporal pattern. Such may be the
case when Bufo bufo and dragonflies perceive stimuli.
Future research on discerning prey from predator may be able to better address
some of the shortcomings of this experiment. Perhaps behavior studies can be carried out
to get a better understanding of how the dragonfly will respond or interact with such
objects instead of only collecting data from its neurons. This behavioral study may be
achieved by allowing the animal to move freely. Additionally, studies that manipulate
stimuli size, perhaps decreasing stimuli size instead of increasing it are worth
considering. Finally, considering how recently the dragonfly has been fed may be another
factor worth considering; if the dragonfly has not recently eaten, it may be more apt to
respond to a wide range of stimuli sizes.

19
Works Cited
Armstrong, T. R., & Stamp, N. E. (2003). Effects of Prey Quantity on Predatory Wasps (Polistes dominulus) When Patch Quality Differs. Behavioral Ecology and Sociobiology ,
54 (3), 310-319.
Baird, J. M., & May, M. L. (1997). Foraging behavior of Pachydiplax longipennis
(Odonata: Libellulidae). Journal of Insect Behavior , 655-677.
Camhi, J. M. (1984). Neuroethology: Nerve Cells and the Natural Behavior of Animals.
Sunderland, MA: Sinauer Associates Inc. Publishers.
Chivers, D., Wisenden, B., & Smith, R. (1996). Damselfly larvae learn to recognize predators from chemical cues in the predator's diet. Animal Behaviour , 315-320.
Dicke, M., & Grostal, P. (2001). Chemical Detection of Natural Enemies by Arthropods: An Ecological Perspective. Annual Review of Ecology and Systematics , 32, 1-23.
Eggers, D. M. (1977). The Nature of Prey Selection by Planktivorous Fish. Ecology , 58, 46-59.
Ewert, J. (1980). Neuroethology. New York, NY: Springer-Verlag.
Ewert, J. -P., & Traud, R. (1979). Releasing Stimuli for Antipredator Behaviour in the Common Toad Bufo bufo (L.). Behaviour , 68, 170-180.
Frye, M., & Olberg, R. (1995). Visual receptive field properties of feature detecting neurons in the dragonfly. The Journal of Comparative Physiology A , 569-576.
Haber, R., & Hershenson, M. (1980). The Psychology of Visual Perception. New York, NY: Holt, Rinehart and Winston.
Horridge, G. A., & Marcelja, L. (1992). On the Existence of 'Fast' and 'Slow"
Directionally Sensitive Motion Detector Neurons in Insects. Proceedings: Biological Sciences , 248, 47-54.
Marti, C. D., & Hogue, J. G. (1979). Selection of Prey by Size in Screech Owls. The Auk , 96, 319-327.
Nordström, K., & O'Carroll, D. C. (2006, May). Small Object Detection Neurons in Female Hoverflies. Proceedings: Biological Sciences , 1211-1216.
Olberg, R. M., Seaman, R. C., Coats, M. I., & Henry, A. F. (2007). Eye movements and target fixation during dragonfly prey-interception flights. The Journal of Comparative
Physiology A , 685-693.
Olberg, R. M., Worthington, A., & Venator, K. (2000). Prey pursuit and interception in dragonflies. The Journal of Comparative Physiology A , 155-162.
Pettigrew, J., & Freeman, R. (1973). Visual Experience without Lines: Effect on Developing Cortical Neurons. Science , 599-601.

20
R.Bell, & Whitcomb, W. (1961). Erythemis simplicicollis (Say), a Dragonfly Predator of the Bollworm Moth. The Florida Entomologist , 44, 95-97.
Rashevsky, N. (1959). Mathematical biology of social behavior. Chicago: University of
Chicago Press.
Rind, F. C., & Santer, R. D. (2004). Collision Avoidance and a Looming Sensitive
Neuron: Size Matters but Biggest Is Not Necessarily Best. Proceedings: Biological Sciences , S27-S29.
Ruvinsky, I., Oates, A. C., Silver, L. M., & Ho, R. K. (2000). The evolution of paired appendages in vertebrates: T-box genes in zebrafish. Development Genes and Evolution ,
82-91.