disciplinary categories, majors, and undergraduate ... et al (2011c).pdf · disciplinary...
TRANSCRIPT

Disciplinary Categories, Majors, and UndergraduateAcademic Experiences: Rethinking Bok’s‘‘Underachieving Colleges’’ Thesis
Steven Brint • Allison M. Cantwell • Preeta Saxena
Received: 28 July 2010� Springer Science+Business Media, LLC 2011
Abstract Using data from the 2008 University of California Undergraduate Experience
Survey, we show that study time and academic conscientiousness were lower among
students in humanities and social science majors than among students in science and
engineering majors. Analytical and critical thinking experiences were no more evident
among humanities and social sciences majors than among science and engineering majors.
All three academically beneficial experiences were, however, strongly related to partici-
pation in class and interaction with instructors, and participation was more common among
humanities and social sciences students than among science and engineering students.
Bok’s (Our underachieving colleges: A candid look at how much students learn and whythey should be learning more. Princeton and Oxford: Princeton University Press, 2006)
influential discussion of ‘‘underachievement’ in undergraduate education focused on
institutional performance. Our findings indicate that future discussions should take into
account differences among disciplinary categories and majors as well.
Keywords Academic disciplines � Educational experiences � Research universities
Post-war higher education advocates spoke of ‘‘talent waste’’ (Wolfle 1954), because many
young people who might have profited from higher education were denied access for lack
of financial support or places in the system. Today, the term ‘‘talent waste’’ has a second
meaning. Although issues of access have not been solved, most students who complete
high school degrees do go on for post-secondary work (Bound et al. 2009). However,
relatively few spend their time in college focusing on their studies or developing their core
academic skills. Instead, social life dominates the time of most college students. For this
reason, talent waste is now also a product of a higher education system that demands
relatively little of most of its undergraduate students.
The amount of time students spend on their studies in and out of class has fallen by
about 15 hours a week since the early 1960s, controlling for socio-demographic and
S. Brint (&) � A. M. Cantwell � P. SaxenaUniversity of California, Riverside, CHASS Dean’s Office, 3405 HMNSS, Riverside, CA 92521, USAe-mail: [email protected]
123
Res High EducDOI 10.1007/s11162-011-9227-2
institutional affiliations, and the average now registers at a little over 25 hours per week
(Babcock and Marks 2010). Only one-third of University of California students say they
complete as much as 80% of the required reading for their courses (Brint et al. 2010). By
contrast, the average college student spends 40 or more hours per week on social and
recreational activities (Babcock and Marks 2010; Brint and Cantwell 2010).
National assessments of student learning have demonstrated that these low levels of
investment in learning lead to limited results. In a recent study of students’ academic skill
development at 24 U.S. four-year colleges and universities, 36% of participating students
showed no statistically significant gains on the College Learning Assessment between their
freshman and senior years (Arum and Roksa 2011). Although the wage advantage of
college over high school education remains high, and has been growing over time (Goldin
and Katz 2008), given the limited engagement of college students with their studies, actual
human capital development may be exaggerated by the frequent assumption among
economists that it is closely associated with the college wage premium.
Former Harvard President Derek Bok (2006) has used the term ‘‘under-achievement’’ to
characterize the performance of American colleges and universities in undergraduate edu-
cation. We accept the term ‘‘underachievement’’ as frequently apt, but we question the use of
the term as a blanket characterization of all undergraduate majors in U.S. colleges and
universities. As we will show, hours of study and conscientious study behaviors vary greatly
among undergraduates depending on their disciplinary category and major. Analytical and
critical thinking experiences also vary by major, albeit in a less pronounced way. Partici-
pation in class and interaction with professors is strongly associated with each of these
academically beneficial experiences, and it too varies by disciplinary category and major.
Research universities are a strategic site for studying undergraduate academic outcomes
because of long-standing concerns about the quality of the undergraduate academic
experience found in these institutions (see, e.g., Barzun 1945; Boyer Commission 1998),
including occasionally frank admissions by university administrators that undergraduate
education is a low priority for research university faculty and administrators (see, e.g., Kerr
1962, pp. 64–65; Cole 2009, p. 4). These concerns are supported by empirical studies that
cast doubt on the quality of the undergraduate experience in research universities (Hu and
Kuh 2001; Kuh 2003a).
Using data drawn from a large sample of University of California upper-division stu-
dents surveyed in 2008, we examine disciplinary category and major differences on three
academic behavior and experience measures—(1) study time, (2) academic conscien-
tiousness, and (3) analytical and critical thinking. This study provides the first systematic
comparison of disciplinary categories and majors on these important measures of the
student academic experience. Our analyses confirm the great importance of participation
(measured as frequency of classroom participation and interaction with professors) as a
correlate of academically beneficial experiences (see Kuh 2003a). At the same time, we
establish that disciplinary category and major differences remain significant, even after
participation is statistically controlled. We also show that the academic achievements and
socio-demographic backgrounds of students in different fields do not account for much of
the variation in the three academic experience measures.
Previous Literature
As practiced by disciplinary experts, all disciplines involve highly sophisticated intellec-
tual understandings. These understandings differ between the disciplines, with some
Res High Educ
123

disciplines requiring more sophistication in quantitative skills and other disciplines
requiring more sophistication in interpretive skills. Our focus is not on the skills of experts,
but rather on the academic experiences of novices who are just beginning to learn the
subject matter of their disciplines and how experts think in relation to this subject matter.
The disciplinary classification scheme we adopt in this paper emphasizes differences
between ‘‘high paradigm’’ and ‘‘low paradigm’’ fields (Biglan 1973a, b; Braxton and
Hargens 1996; Braxton et al. 1998).1 The distinction refers to the level of consensus among
scholars about the accepted findings, theories, methods, and principles of analysis in the
field. The natural sciences and engineering are primary examples of high-paradigm (or
‘‘hard’’) fields in which knowledge is cumulative and students are expected to master an
established set of conceptual frameworks, principles, and methods. The non-quantitative
social sciences, the humanities, and the arts are primary examples of low-paradigm (or
‘‘soft’’) fields in which a much larger proportion of the knowledge corpus is subject to
reinterpretation based on the development of new forms of criticism and new analytical
perspectives.
Scholars have established that differences in epistemological assumptions and educa-
tional goals lead to differences in students’ learning experiences in the hard and soft
disciplines. Donald (1983) found that hard fields had tightly structured course content with
highly related concepts and principles, while soft fields were more often characterized by
open course structures and looser organization. Braxton (1995) found that hard disciplines
placed greater importance on student career preparation and emphasized learning facts,
principles, and concepts. Soft disciplines, by contrast, placed greater importance on broad
general knowledge, on student character development, and on developing students’ critical
thinking skills. Similarly, Hativa (1997) found that soft fields placed greater importance on
creativity of thinking and oral and written expression, while hard fields placed greater
emphasis on ability to apply methods and principles. Assessments of student learning
reflect these differing curricular emphases. In their assessments, hard disciplines require
memorization and application of course materials, while soft disciplines are more likely to
favor exam prompts requiring analysis and synthesis of course content (Braxton 1995;
Smart and Ethington 1995).2
Scholarly doubts about the quality of the undergraduate experience in humanities and
social sciences disciplines stems from important characteristics of learning environments
in science and engineering fields that are not shared by the humanities and social science
disciplines. First, the science and engineering disciplines are selective; not all who wish to
study these fields are allowed to do so. Nationally, failure rates in gateway mathematics
and science courses have ranged in recent decades from 30 to 50% (Gainen 1995; Tall
1 The best known disciplinary typology, sometimes known as the Biglan-Becher typology (Neumann 2001),is a four-fold classification, dividing fields on one axis by their emphasis on paradigmatic development (the‘‘hard-soft’’ axis) and, on a second, by their focus on basic or applied subject matter (the ‘‘pure-applied’’axis) (Biglan 1973a, b; Becher 1989). The ‘‘pure-applied’’ axis is less important for our purposes. Mostundergraduate education in the University of California, as well as in other leading research universities,focuses on ‘‘pure’’ subjects. Some important fields in research universities, such as business (a ‘‘hard-applied’’ field) and education (a ‘‘soft-applied’’ field), are offered at only a small number of UC campusesand are therefore not included in these analyses. We do not consider the third dimension of the originalBiglan scheme (‘‘life-non-life’’) except in so far as it is incorporated into our disciplinary categories (as lifesciences) and major categories (as biology, cell and molecular biology, and environmental science).2 Recent studies confirming differences in teaching styles and academic goals by level of paradigmaticdevelopment include Braxton and Hargens (1996), Braxton et al. (1998), Becher (1994), Hativa (1997),Lattuca and Stark (1994), Smart and Umbach (2007), Smart et al. (2000), and Umbach (2007b). For anoverview, see Neumann (2001).
Res High Educ
123

1997). These disciplines not only require demonstrated mastery of complex concepts and
quantitatively challenging course materials, but grading is also more stringent than in the
social sciences and humanities (Gainen 1995; Johnson 2003). Moreover, these disciplines
are more closely linked than other fields to high-wage labor market opportunities
(Arcidiacono 2003). Previous studies have suggested that these four factors—selection
pressures, curricular rigor, stringent grading, and labor market rewards—combine to
promote greater effort and conscientiousness on the part of undergraduate students
studying ‘‘hard’’ disciplines (Arcidiacono 2003; Brint and Cantwell 2010; Johnson 2003).
Historically, proponents of the humanities and social sciences have often claimed that
these disciplines offer an important compensating advantage: greater opportunities for
analytical and critical thinking experiences. Ideal representations of liberal arts education
emphasize that professors should seek to expose students to multiple conceptual schemes,
competing interpretations, rigorous investigation of the quality of evidence and arguments,
and a more pronounced critical approach to materials. These are the types of cognitive
experiences that liberal arts proponents have long hoped colleges and universities would
provide for students (see, e.g. Bloom 1956; Shulman 1997).
Recently, however, some scholars have raised doubts about the quality of experience of
students in the humanities and social sciences, even in this area of assumed strength. These
doubts stem from concerns about the effects of low academic standards on the quality of
classroom experiences (Babcock and Marks 2010, Johnson 2003), the effects of the
dominance of time spent on social and recreational activities as an influence on students’
commitment and learning (Arum and Roksa 2011; Brint and Cantwell 2010), and even the
possibly stultifying effects of socio-political orthodoxy in some humanities and social
science fields (Rothman et al. 2005; Wood 2003; cf. Gross and Simmons 2007).
Within the context of the University of California system, our research suggests that recent
doubts about educational experiences in the humanities and social sciences have some
validity. Zero-order differences among the disciplinary categories were marginal on the
analytical and critical thinking scale. When academic achievement and socio-demographic
background variables were controlled, physical and life science students scored as high
as humanities and social science students on the scale. When frequency of participation
was controlled as well, science and engineering students scored marginally higher than
humanities and social science students (cf. Pascarella and Terenzini 2005, pp. 174–176,
604–608). Students majoring in one discipline, economics, stood out as scoring low on this
scale, but students in no majors clearly distinguished themselves as scoring high.
Data and Methods
Study Population
The study is based on responses of upper-division students to the University of California
Undergraduate Experiences Survey (UCUES) fielded in spring 2008. UCUES is admin-
istered biannually at each of the nine University of California undergraduate campuses as a
census of all students. Because of the small number of respondents from UC Merced, this
campus was excluded from the study. The UC system is the largest system of publicly
supported research universities in the country. In 2008, UCUES response rates on the
campuses in our study varied from a low of 31 to a high of 50%. Previous studies indicate
that respondents have higher grade point averages than non-respondents, but that parameter
estimates are unbiased due to the large size of the sample (Chatman 2006).
Res High Educ
123

Students must graduate in the top 12.5% of high school students statewide to be eligible
for admission into the University of California. The sample, therefore, constitutes a rela-
tively high-achieving group of students (Douglass 2007). Nonetheless, high levels of
variability exist within the population—in student grades, student behaviors conducive to
academic success, and student background and experience characteristics related to aca-
demic achievement. While mean scores on variables undoubtedly differ between UC
undergraduates and the population of all college students, we expect the form of key
relationships observed for UC students to generalize to the population of students attending
relatively selective research universities.
UCUES has been operating for 9 years as a web-based census. Incentives are provided
to students for participation in the survey. All participating students complete a set of core
items and, in addition, one of five randomly-assigned modules. Data on student back-
grounds, high school records, SAT scores, and UC GPA are appended to the data file by
UC staff.
Because we are interested in disciplinary categories and majors, we included only
upper-division students in the study population. Upper-division transfer students do not
have UC GPAs that date from freshman year, and we therefore also excluded transfer
students from the study population. The census approach adopted in UCUES yields a large
sample (more than 17,500 respondents for analyses of disciplinary categories and more
than 16,000 respondents for analyses of majors) in spite of these exclusions. Sizable
numbers of respondents were located across each of the eight UC campuses, six disci-
plinary categories, and 18 majors we studied.
Dependent Variables
We focus on three dependent variables. We computed study time from the sum of time spent in
class attending lectures, sections, and labs and time spent studying or preparing for class each
week. For the UCUES upper-division sample as a whole, this variable had a mean of
27.8 hours and a standard deviation of 11.7 hours. We computed academic conscientious-ness as a factor-weighted scale composed of five items measuring the frequency with which
students reported efforts to improve their academic performance through behaviors that
contribute to subject matter mastery: by raising their standards, revising their papers, seeking
help to understand course materials, working with fellow students on course materials, and
explaining course materials to others. The scale had an alpha reliability of .72 and, when
standardized, ranged from -2.76 to 2.49. Both grades and post-graduate aspirations have
been strongly related to high scores on the academic conscientiousness scale (Brint and
Cantwell 2010). We computed analytical and critical thinking as a factor-weighted scale
consisting of nine items measuring the frequency with which students reported having
experiences that contribute to cognitive development: by recalling and using facts, explaining
and solving problems, analyzing course materials, evaluating and assessing methods,
incorporating ideas from class in assignments, and reconsidering their own opinions based on
class materials. The analytical and critical thinking scale had an alpha reliability of .87 and
ranged, when standardized, from -4.13 to 1.60. The frequency measures for items on the two
scales ranged from 1 (never) to 6 (very often).
This study is based on students’ self-reported academic behaviors and experiences, not
on measured learning outcomes. At the same time, more frequent and conscientious study
behaviors and more frequent analytical and critical thinking experiences are undoubtedly
conducive to learning for most students (Arum and Roksa 2011). Indeed, for less prepared
and less able students, they may be a precondition for learning.
Res High Educ
123

Because our data consist of students’ self reports, they are potentially susceptible to
social response bias. If students tend to inflate their reports of time spent on study or the
frequency of academically beneficial experiences, the results reported in this study will
present a more positive picture of the undergraduate academic experience than is war-
ranted. Psychometric studies have shown that student self-reports of study behaviors and
experiences during the college years are valid and reliable, when survey items are clearly
worded and represent activities with which student have had recent experiences. Under
these conditions, student responses accurately represent the frequency of their behaviors
and experiences (Kuh 2003b; Ouimet et al. 2004; Pace 1985, 1995). UCUES survey items
meet these requirements. It is possible that some types of students tend to overstate or
understate the frequency of academically beneficial experiences. To the extent that sys-
tematic biases are found in the data, parameter estimates for particular categories of
students will be unreliable. The existing literature, which focuses on racial-ethnic differ-
ences (Bowman 2008; Brint et al. 2010) suggests that the major findings of this study are
unaffected by such biases.3
Selection bias represents another potential limitation of the UCUES survey data. Stu-
dents may select themselves into research universities for reasons that are not measured but
nevertheless affect the results of this study. Students may also select themselves into
certain majors that potentially play to their strengths. We control for a variety of student
characteristics, including their socio-demographic backgrounds and academic achieve-
ments. Even so, we cannot rule out the possibility that unmeasured student characteristics,
such as motivation to study a major, influence our results.
Independent Variables
We compared students in six broad disciplinary categories: (1) engineering, (2) physical
sciences, (3) life sciences, (4) social sciences, (5) humanities, and (6) arts. Because
engineering is an applied rather than a pure field, we treated engineering students sepa-
rately from physical sciences students. Physical sciences consist of students majoring in
chemistry, geology and earth sciences, mathematics, physics, and statistics. Life sciences
consist of biology, biochemistry, cell and molecular biology, environmental science, and
related disciplines. Social sciences consist of anthropology, area studies, economics,
political science, psychology, sociology, and related fields. Humanities consist of art
history, American studies, classics, English, media and cultural studies/communications,
foreign languages and literatures, history, philosophy, and related fields. The arts consist of
creative writing, dance, drama, film, music, and studio arts. In our analyses of disciplinary
categories, we used social sciences as our reference category, because the social sciences
are often characterized as lying between the natural sciences and humanities in the extent
of their reliance on quantitative methods and in their more positivistic epistemological
orientations.
Similarities among disciplinary categories may mask substantial differences between
the majors that make up these categories. Moreover, majors are a primary source of
identity and interest among university students (Chatman 2007). We therefore also
3 Thus far, studies have focused on over and under-estimates by students in different racial-ethnic groups.These studies suggest that Asian students may underestimate the frequency of academically beneficialexperiences, as well as their levels of academic proficiency, while students from other racial-ethnic groupsmay over-estimate their levels of academic proficiency (Bowman 2008; Brint et al. 2010). Racial-ethnicdifferences do not figure prominently in the findings of this research, however.
Res High Educ
123
compared students in 18 high enrollment majors. In the sciences and engineering category,
we examined the following eight majors: (1) biology, (2) cell and molecular biology
(including biochemistry), (3) chemistry, (4) computer science, (5) engineering, (6) envi-
ronmental science, (7) mathematics and statistics, and (8) physics. Several other science
majors, such as neuroscience and earth science, were too small or not widely represented
enough across all UC campuses to be included. In the humanities, arts, and social sciences
group, we examined the following 10 majors: (1) anthropology (2) arts, (3) English, (4)
economics, (5) foreign languages and literatures, (6) history, (7) philosophy, (8) political
science, (9) psychology, and (10) sociology. Again, several humanities and social science
majors, such as religious studies and media and cultural studies, were too small or not
widely represented enough on UC campuses to be included.4
We used economics majors as our reference category in analyses of study time and
academic conscientiousness. Economics emphasizes quantitative methods to a greater
degree than other social science and humanities majors. It is, in this respect, the most
‘‘science-like’’ of the humanities and social science majors and a natural midpoint between
‘‘soft’’ and ‘‘hard’’ majors on behaviors and experiences that distinguish the two categories.
We used sociology majors as the reference category in our analyses of analytical and
critical thinking experiences. Economics students score lower on this measure than stu-
dents in any other major and therefore do not help us to distinguish high and low scoring
majors. We used sociology students because they score in the middle of humanities and
social sciences category and therefore provide a meaningful reference point between high
and low scoring majors.
We used academic achievement and socio-demographic controls to isolate the net
influence of disciplinary categories and majors on our dependent variables. We introduced
the following academic achievement control variables: UC cumulative grade point average
(UC GPA) and Scholastic Assessment Test (SAT) math and verbal scores. We introduced
the following socio-demographic control variables: gender, race-ethnicity (measured in six
nominal categories), self-identified social class (measured as an ordinal scale with five
categories), and immigrant generation (measured in three nominal categories).5 We also
introduced hours of paid employment per week as a control variable. Most recent studies
find that long hours of paid employment, whether on or off campus, are correlated with
weaker academic commitment and lower grades among undergraduate students (see, e.g.,
Brint and Cantwell 2010; DeSimone 2008; Pike et al. 2009). We measured this variable as
the midpoint of eight categories ranging from ‘‘0’’ to ‘‘more than 30.’’
A large body of literature has established that higher levels of classroom participation
and interaction with professors are associated with more conscientious and effective study
behaviors (for an overview, see Kuh 2003a). In our final set of analyses, we therefore
introduced students’ frequency of classroom participation and interaction with instructors
as a control variable. We measured participation frequency as a factor-weighted scale
consisting of seven items measuring the frequency during the last year that students report
communicating with faculty either face-to-face or electronically, contributing to class
discussion, asking ‘‘insightful’’ questions, and finding courses interesting enough to do
4 Our categorizations of disciplinary categories and majors are available by request.5 Some UC campuses have the reputation as more demanding academic environments than others. How-ever, in unreported results we found that campus showed minimal effects net of covariates in our model.One campus did stand out for higher average levels of study time, but inclusion of campus covariates did notimprove model fit on any of the three dependent variables.
Res High Educ
123

more work than required. The scale had an alpha reliability of .89 and ranged, when
standardized, from -2.10 to 2.60.
Details concerning the independent and dependent variables included in these analyses
are reported in Table 1.
Method of Analysis
We analyzed the data using ordinary least square regression with a specification of stan-
dard errors based on intra-group correlations, in this case by campus, to account for the
possibility of artificially small standard errors in a nested data structure like UCUES
(Thomas and Heck 2001).6 We conducted separate regressions on disciplinary categories
and majors for each of the three dependent variables. In Model 1, we examined only
disciplinary categories or majors as predictors of academic experience outcomes. In Model
2, we introduced the battery of academic achievement, socio-demographic background,
and paid employment variables to determine the extent to which disciplinary category and
major differences were an artifact of the composition of students pursuing degrees in the
different fields. In Model 3, we introduced the participation frequency scale as a final
control. We used a constant N based on students with scores on all variables in Model 3 as
the sample base in each of the analyses.7 In tables we report standardized regression
coefficients. Because of the large sample populations in the UCUES data, we focus on
effect sizes above .10 and variables with p values less than .001.
Results
We report results in three sections corresponding to the three dependent variables. In each
section, we first report results for disciplinary categories. We then report results for majors,
showing how the latter results can be used to make finer distinctions among disciplinary
categories. We focus on disciplinary categories and majors and discuss only the most
noteworthy effects for control variables.
Study Time
Disciplinary Categories
Mean scores on study hours per week, in and out of class, ranged from 24.4 in humanities
to 32.0 in engineering. The profile of social science students closely resembled that of
6 In ordinary least squares regression, it is possible that standard errors may be artificially small due to thenested structure of the data (individual students nested in disciplines and majors nested in campuses). Toaccount for this possibility, we used intra-group correlations, in this case by campus, when specifyingstandard errors. When compared to ordinary least squares regressions, coefficients in the models wereunaffected by this specification.7 We used list-wise deletion of missing data. We lost 15.7% of freshmen entry upper division studentsthrough list-wise deletion. The distribution of cases by disciplinary category and major for students includedin the study reflect the distribution of cases across the University of California, including students excludedfrom the study. The means and standard deviations of variables contributing to the factor scores of ourdependent variables, as well as those for the variables in the participation frequency scale, were notsignificantly different from those reported in Table 1. We are consequently confident that our estimatesaccurately represent freshmen entry upper-division UC students.
Res High Educ
123

Table 1 Descriptive statistics of dependent and independent variables
N Mean Std Dev. Min. Max. Loading
Dependent variables
Study time (sum of 2-items) 20,910 27.78 11.69 0.00 66.44
Time allocation: attend classes,sections, or labs (coded to themidpoint)
21,014 15.16 5.95 0.00 32.68
Time allocation: study and otheracademic activities outside ofclass (coded to the midpoint)
20,919 12.63 8.07 0.00 33.76
Academic conscientiousness 20,445 0.00 1.00 -2.76 2.49 a = .72
In this academic year: raisedstandard for acceptable effortdue to high standards of afaculty member
20,714 3.71 1.29 1 (Never) 6 (Very often) .42
In this academic year: extensivelyrevised a paper at least oncebefore submitting to be graded
20,792 3.75 1.50 1 6 .49
In this academic year: soughtacademic help from instructoror tutor
20,724 3.33 1.42 1 6 .58
In this academic year: workedwith group of students outsideof class
20,800 3.63 1.40 1 6 .70
In this academic year: helpedclassmate understand materialbetter
20,816 3.73 1.32 1 6 .72
Analytical/critical thinking 20,047 0.00 1.00 -4.13 1.60 a = .87
Frequency of courserequirements: recall facts,terms, concepts
20,706 5.12 1.05 1 (Never) 6 (Very often) .44
Frequency of courserequirements: explain and solveproblems
20,625 4.99 1.14 1 6 .56
Frequency of courserequirements: analyze
20,611 4.55 1.32 1 6 .72
Frequency of courserequirements: evaluate methodsand conclusions
20,608 4.51 1.33 1 6 .77
Frequency of courserequirements: generate newideas or products
20,625 4.20 1.43 1 6 .68
Frequency of courserequirements: use facts andexamples to support viewpoint
20,643 4.95 1.14 1 6 .65
Frequency of courserequirements: incorporate ideasfrom different courses
20,586 4.55 1.23 1 6 .68
Frequency of courserequirements: examine andassess other methods andconclusions
20,585 4.18 1.37 1 6 .75
Res High Educ
123

Table 1 continued
N Mean Std Dev. Min. Max. Loading
Frequency of courserequirements: reconsider ownposition after assessing otherarguments
20,608 4.11 1.31 1 6 .68
Independent variables: continuous
Participation frequency 20,847 0.00 1.00 -2.10 2.60 a = .89
In this academic year:communicated with a facultymember by email or in person
20,729 3.92 1.36 1 (Never) 6 (Veryoften)
.62
In this academic year: talked withthe instructor outside of classabout course material
20,733 2.96 1.48 1 6 .70
In this academic year: interactedwith faculty during lecture classsessions
20,696 3.01 1.47 1 6 .78
In this academic year: contributedto a class discussion
20,803 3.74 1.38 1 6 .83
In this academic year: brought upideas or concepts from differentcourses during class discussions
20,742 3.18 1.45 1 6 .83
In this academic year: asked aninsightful question in class
20,727 3.13 1.40 1 6 .85
In this academic year: found acourse so interesting that you didmore work than was required
20,693 2.92 1.37 1 6 .61
Time allocation: paidemployment total (codedto midpoint)
20,792 9.36 9.10 0.00 33.60
UC GPA (Spring 2008) 20,378 3.23 .45 0.00 4.00
SAT Math 21,045 640.18 88.34 270 800
SAT Verbal 21,045 608.20 91.66 210 800
Social Class 20,561 2.94 .98 1 (Low income/poor)
5 (Wealthy)
N Percent
Independent variables: categorical
Sociodemographics
Female 18,023 57.4
Male 13,391 42.6
African American 754 2.4
Hispanic 4,148 13.2
Asian American 11,499 36.5
White 11,649 37.0
Other (includes multi-racial and unknown) 2,655 8.4
International students 766 2.4
Student immigrant 7,026 23.0
Parent(s) immigrant(s) 11,333 37.0
Student & parent(s) U.S. born 12,246 40.0
Res High Educ
123

humanities students.8 In bivariate regressions, students in each of the three science and
engineering categories scored higher on study time than either humanities or social science
students.
The introduction of academic achievement and socio-demographic background vari-
ables improved model fit. Net of covariates, students majoring in the sciences and engi-
neering continued to report longer study hours compared to humanities and social science
students. Not surprisingly, UC grades were another predictor of study time. By contrast,
students scoring high on the SAT verbal studied less on average, net of covariates, perhaps
indicating that these students can learn material faster than others or can rely on their test-
taking abilities as a substitute for longer hours of study.
Table 1 continued
SampleN Percent N Percent
Disciplines
Physicalsciences
4,902 6.0 1,118 6.3
Life sciences 18,255 22.5 4,608 25.8
Engineering 10,603 13.1 2,799 15.7
Social sciences 31,311 38.6 6,198 34.7
Humanities 11,412 14.1 2,251 12.6
Arts 4,557 5.6 871 4.9
N Percent N Percent
Departments
Anthropology 1,678 2.3 269 1.7
Economics 6,981 9.5 1,285 8.0
Psychology 7,599 10.4 1,630 10.1
Political science 4,625 6.3 975 6.0
Sociology 5,057 6.9 922 5.7
English 3,759 5.1 766 4.7
Foreign language & literatures 2,111 2.9 514 3.2
Philosophy 1,014 1.4 118 0.7
History 3,879 5.3 712 4.4
Arts 4,557 6.2 871 5.4
Biology 10,914 14.9 2,700 16.7
Cell/molecular biology 4,433 6.0 1,146 7.1
Chemistry 1,694 2.3 407 2.5
Environmental science and ecology 2,054 2.8 550 3.4
Computer science 2,299 3.1 548 3.4
Engineering 8,011 10.9 2,156 13.3
Math/statistics 1,776 2.4 365 2.3
Physics 892 1.2 228 1.4
8 Because of our clustering of standard errors, the standardized regression coefficient for humanities stu-dents was marginally higher than that of social science students.
Res High Educ
123

The introduction of participation frequency further improved model fit. Participation
frequency showed a net effect on study time similar in size to UC GPA. Disciplinary
differences remained largely unaffected, however (see Table 2).
Majors
Humanities and social science majors showed little differentiation in the major-specific
regressions of Model 1. All science and engineering majors reported longer hours of study
than humanities and social science majors. However, students in the science and engi-
neering majors also varied among themselves; biology, chemistry, and engineering majors
reported longer study hours than other science majors.
The introduction of controls for academic achievement and socio-demographic back-
ground did not greatly improve model fit or substantially alter the zero-order relationships
reported in Model 1. Students in science majors that stood out in Model 1 for their longer
hours of study continued to stand out in Model 2. UC GPA continued to be associated with
longer hours of study each week, and SAT verbal scores continued to be associated with
fewer hours of study.
Once again the introduction of the participation frequency scale in Model 3 improved
model fit. However, differences among majors in the sciences and engineering persisted.
UC GPA and SAT verbal scores also continued to show sizable and highly significant net
effects on study time, in a positive direction for UC GPA and in a negative direction for
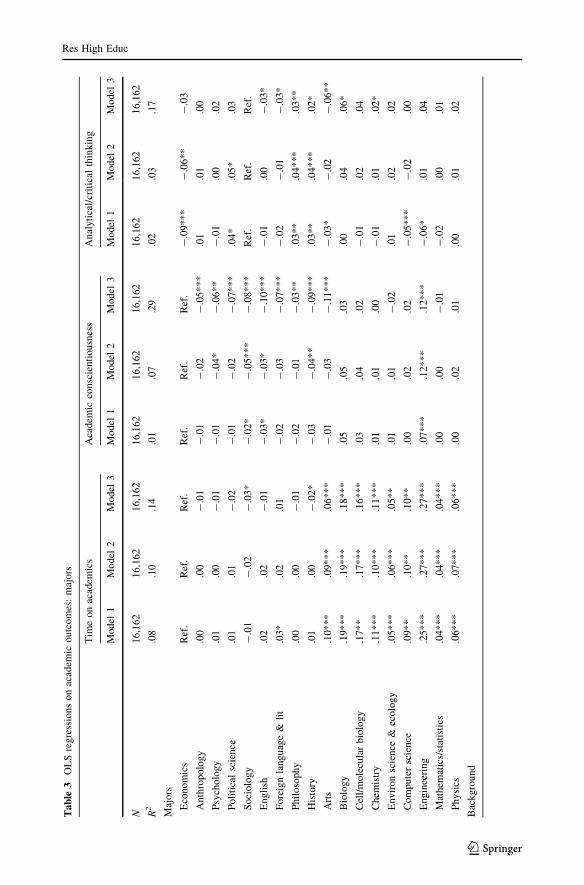
SAT verbal scores (see Table 3).
Academic Conscientiousness
Disciplinary Categories
Disciplinary categories explained very little variation on the academic conscientiousness
scale. Life science and engineering students scored marginally higher than social science
students on academic conscientiousness and humanities students scored marginally lower.
The introduction of academic achievement and socio-demographic background control
variables in Model 2 improved model fit. The introduction of these controls accentuated
disciplinary differences, with life science and engineering students showing higher net
scores on conscientiousness. As with study time, UC GPA showed a sizable and highly
significant net positive association with conscientiousness, while SAT verbal showed a
sizable and highly significant net negative association. In these regressions, SAT math also
showed a sizable and highly significant net negative association.
R2 improved dramatically with the introduction of participation frequency in Model 3—
from seven to 28% of the variance explained. Participation frequency proved to be a much
stronger predictor of conscientiousness than any other variable in the analysis, including
disciplinary categories. At the same time, disciplinary categories remained highly differ-
entiated from one another. At similar levels of participation humanities and arts students
reported fewer net conscientious behaviors than life science and engineering students.
Effect sizes for UC GPA and SAT math were attenuated in Model 3, but effect sizes for
SAT verbal continued to be sizable and highly significant, indicating that at similar levels
of participation students with high SAT verbal scores were less conscientious about their
studies.
Res High Educ
123

Ta
ble
2O
LS
regre
ssio
ns
on
acad
emic
outc
om
es:
dis
cipli
nar
yca
tegori
es
Tim
eon
acad
emic
sA
cadem
icco
nsc
ienti
ousn
ess
Anal
yti
cal/
crit
ical
thin
kin
g
Mo
del
1M
odel
2M
od
el3
Mo
del
1M
odel
2M
od
el3
Mo
del
1M
odel
2M
odel
3
N1
7,8
45
17
,84
51
7,8
45
17
,84
51
7,8
45
17
,84
51
7,8
45
17
,84
51
7,8
45
R2
.07
.10
.13
.01
.07
.28
.00
.02
.16
Dis
cip
lin
es
So
cial
scie
nce
sR
ef.
Ref
.R
ef.
Ref
.R
ef.
Ref
.R
ef.
Ref
.R
ef.
Ph
ysi
cal
scie
nce
s.1
1*
**
.13
**
*.1
3**
*.0
1.0
5*
*.0
5**
-.0
1.0
2*
.02
*
Lif
esc
ien
ces
.21
**
*.2
2**
*.2
3**
*.0
6**
.10
**
*.1
2**
*.0
1.0
4*
.06
**
Engin
eeri
ng
.24***
.27***
.28***
.07**
.15***
.18***
-.0
5*
**
.01
.04
**
Hum
anit
ies
.02
.02*
.00
-.0
3**
-.0
2*
-.0
7**
*.0
3**
.02
*-
.02
Art
s.0
9*
**
.09
**
*.0
7**
*.0
0-
.01
-.0
5**
*-
.02
-.0
2*
-.0
6**
*
Bac
kgro
un
d
UC
GP
A.1
5**
*.1
2**
*.1
5*
**
.07
**
*.0
5**
*-
.01
SA
Tm
ath
-.0
7*
-.0
4-
.11
**
*-
.04
**
-.1
1**
*-
.05
**
SA
Tv
erb
al-
.09
**
*-
.10
**
*-
.17
**
*-
.19
**
*-
.01
-.0
2**
Mal
e-
.01
-.0
3*
-.0
4**
-.0
9**
*-
.05
*-
.07
**
*
Wh
ite
Ref
.R
ef.
Ref
.R
ef.
Ref
.R
ef.
Afr
ican
Am
eric
an.0
0.0
0.0
1.0
0.0
2-
.01
His
pan
ic-
.01
.00
-.0
1.0
2.0
6.0
3*
*
Asi
anA
mer
ican
.02
.05
**
*-
.03
*.0
5**
-.0
4.0
4*
Inte
rnat
ional
.01
.01
-.0
1.0
0-
.10
-.0
1
Oth
er.0
2*
.02
*-
.01
.00
.00
.00
So
cial
Cla
ss-
.01
-.0
2*
.07
**
*.0
4**
.02
-.0
1
Stu
den
tan
dp
aren
t(s)
U.S
.b
orn
Ref
.R
ef.
Ref
.R
ef.
Ref
.R
ef.
Stu
den
tim
mig
ran
t.0
4*
.02
.06
**
.02
.05
-.0
1
Res High Educ
123

Ta
ble
2co
nti
nu
ed
Tim
eon
acad
emic
sA
cadem
icco
nsc
ienti
ousn
ess
Anal
yti
cal/
crit
ical
thin
kin
g
Mo
del
1M
od
el2
Mo
del
3M
odel
1M
odel
2M
odel
3M
od
el1
Mo
del
2M
odel
3
Par
ent(
s)im
mig
ran
t(s)
.02
.01
.05
**
.03
*.0
4*
.00
Act
ivit
ies
Pai
dem
plo
ym
ent
-.0
1-
.03
*.0
3*
-.0
2.0
6**
*.0
2
Par
tici
pat
ion
freq
uen
cy.2
1***
.50***
.40***
*p\
.05
,*
*p\
.01
,*
**
p\
.00
1
Res High Educ
123
Ta
ble
3O
LS
reg
ress
ion
so
nac
adem
ico
utc
om
es:
maj
ors
Tim
eon
acad
emic
sA
cadem
icco
nsc
ienti
ousn
ess
Anal
yti
cal/
crit
ical
thin
kin
g
Mo
del
1M
od
el2
Mo
del
3M
od
el1
Mo
del
2M
od
el3
Mo
del
1M
odel
2M
odel
3
N1
6,1
62
16
,16
21
6,1
62
16
,16
21
6,1
62
16
,16
21
6,1
62
16
,16
21
6,1
62
R2
.08
.10
.14
.01
.07
.29
.02
.03
.17
Maj
ors
Eco
no
mic
sR
ef.
Ref
.R
ef.
Ref
.R
ef.
Ref
.-
.09
**
*-
.06
**
-.0
3
An
thro
po
log
y.0
0.0
0-
.01
-.0
1-
.02
-.0
5*
**
.01
.01
.00
Psy
cho
log
y.0
1.0
0-
.01
-.0
1-
.04
*-
.06
**
-.0
1.0
0.0
2
Po
liti
cal
scie
nce
.01
.01
-.0
2-
.01
-.0
2-
.07
**
*.0
4*
.05
*.0
3
So
cio
log
y-
.01
-.0
2-
.03
*-
.02
*-
.05
**
*-
.08
**
*R
ef.
Ref
.R
ef.
En
gli
sh.0
2.0
2-
.01
-.0
3*
-.0
3*
-.1
0*
**
-.0
1.0
0-
.03
*
Fo
reig
nla
ngu
age
&li
t.0
3*
.02
.01
-.0
2-
.03
-.0
7*
**
-.0
2-
.01
-.0
3*
Ph
ilo
soph
y.0
0.0
0-
.01
-.0
2-
.01
-.0
3*
*.0
3**
.04
**
*.0
3**
His
tory
.01
.00
-.0
2*
-.0
3-
.04
**
-.0
9*
**
.03
**
.04
**
*.0
2*
Art
s.1
0*
**
.09
**
*.0
6*
**
-.0
1-
.03
-.1
1*
**
-.0
3*
-.0
2-
.06
**
Bio
log
y.1
9*
**
.19
**
*.1
8*
**
.05
.05
.03
.00
.04
.06
*
Cel
l/m
ole
cula
rbio
logy
.17**
.17***
.16***
.03
.04
.02
-.0
1.0
2.0
4
Chem
istr
y.1
1***
.10***
.11***
.01
.01
.00
-.0
1.0
1.0
2*
En
vir
on
scie
nce
&ec
olo
gy
.05
**
*.0
6**
*.0
5*
*.0
1.0
1-
.02
.01
.02
.02
Co
mp
ute
rsc
ien
ce.0
9*
*.1
0**
.10
**
.00
.02
.02
-.0
5**
*-
.02
.00
Engin
eeri
ng
.25***
.27***
.27***
.07***
.12***
.12***
-.0
6*
.01
.04
Mat
hem
atic
s/st
atis
tics
.04***
.04***
.04***
.00
.00
-.0
1-
.02
.00
.01
Ph
ysi
cs.0
6*
**
.07
**
*.0
6*
**
.00
.02
.01
.00
.01
.02
Bac
kgro
un
d
Res High Educ
123

Ta
ble
3co
nti
nu
ed
Tim
eon
acad
emic
sA
cadem
icco
nsc
ienti
ousn
ess
Anal
yti
cal/
crit
ical
thin
kin
g
Mo
del
1M
od
el2
Mo
del
3M
od
el1
Mo
del
2M
od
el3
Mo
del
1M
odel
2M
odel
3
UC
GP
A.1
5**
*.1
2*
**
.15
**
*.0
7**
*.0
4**
-.0
1
SA
Tm
ath
-.0
7*
-.0
5-
.12
**
*-
.06
**
*-
.09
**
*-
.04
*
SA
Tv
erb
al-
.09
**
*-
.09
**
*-
.17
**
*-
.18
**
*-
.02
-.0
3*
*
Mal
e.0
0-
.02
-.0
4**
-.0
9*
**
-.0
4**
*-
.08
**
*
Wh
ite
Ref
.R
ef.
Ref
.R
ef.
Ref
.R
ef.
Afr
ican
Am
eric
an.0
0.0
0.0
2.0
1.0
0-
.01
His
pan
ic-
.01
.00
-.0
1.0
2.0
1.0
3**
Asi
anA
mer
ican
.01
.04
**
-.0
4*
.04
*-
.03
.04
*
Inte
rnat
ional
.01
.01
-.0
1*
-.0
1-
.01
*-
.01
Oth
er.0
1.0
2-
.01
.00
-.0
1.0
0
So
cial
clas
s-
.01
-.0
2.0
7*
**
.03
*.0
2.0
0
Stu
den
tan
dp
aren
t(s)
U.S
.b
orn
Ref
.R
ef.
Ref
.R
ef.
Ref
.R
ef.
Stu
den
tim
mig
ran
t.0
4**
.02
.06
**
.02
.01
-.0
1
Par
ent(
s)im
mig
ran
t(s)
.02
.01
.05
**
.03
*.0
1-
.01
Act
ivit
ies
Pai
dem
plo
ym
ent
-.0
1-
.03
*.0
3*
-.0
2.0
5**
*.0
2
Par
tici
pat
ion
freq
uen
cy.2
1***
.51***
.40***
*p\
.05
,*
*p\
.01
,*
**
p\
.00
1
Res High Educ
123

Majors
Major differences explained little of the variance in the academic conscientiousness scale.
Majors were also weakly differentiated on this scale.
As in the regressions on disciplinary categories, model fit improved with the intro-
duction of academic achievement and socio-demographic background controls. Net of
covariates, engineering students showed higher scores on conscientiousness. Again, UC
GPA and SAT scores showed sizable and highly significant effects.
The introduction of participation frequency again improved model fit considerably; R2
increased from seven to 29%. At similar levels of participation, students majoring in
several of the humanities and social science disciplines reported lower levels of consci-
entiousness than economics majors, while engineering students continued to report higher
levels of conscientiousness. As in the regressions on disciplinary categories, the effects of
UC GPA and SAT math scores were attenuated in Model 3, while the effects of SAT verbal
scores persisted.
Analytical and Critical Thinking
Disciplinary Categories
Disciplinary differences explained very little variance in the analytical and critical thinking
scale, and differences among disciplinary categories were marginal.
The introduction of academic achievement and socio-demographic background vari-
ables did not greatly improve model fit. Disciplinary categories remained weakly differ-
entiated. Math SAT scores were the only variable to show sizable and highly significant net
effects; they were associated with fewer reported experiences of analytical and critical
thinking.
The introduction of participation frequency improved model fit considerably—R2
increased from two to 16%. Disciplinary categories continued to show only marginal
differences from one another. The introduction of participation frequency led to attenuation
of the math SAT effects and to little change in other coefficients. While participation
frequency was strongly associated with high scores on the analytical and critical thinking
scale, no other variables in the model showed sizable effects.
Majors
Majors showed slightly more differentiation than disciplinary categories, but continued to
explain very little variance. Relative to sociology students, economics majors scored
significantly lower on the scale. As a group, science and engineering majors scored no
lower than humanities and social science majors and higher than economics students.
The introduction of academic achievement and socio-demographic background vari-
ables improved model fit only marginally. The introduction of these variables attenuated
the effect of economics and computer science, suggesting that zero-order relations may be
largely a function of the higher math SAT scores found in these majors. High SAT math
scores showed sizable net negative effects on the analytical and critical thinking scale.
The introduction of the participation frequency scale again improved model fit con-
siderably—R2 increased from three to 17%. Participation frequency showed sizable and
highly significant effects net of covariates, while majors continued to show little
Res High Educ
123

differentiation from one another. The introduction of the participation scale led to atten-
uation of the negative effect of SAT math scores.
Discussion
The paper makes two key contributions to the study of the undergraduate academic
experience in U.S. research universities. First, the findings challenge the notion that, while
humanities and social science majors require less study, they offer the compensating
advantage of fostering more frequent opportunities for analytical and critical thinking
experiences. Instead, we found weak zero-order differences between disciplinary catego-
ries and majors. Nor did better controlled models lead to high levels of differentiation
among disciplinary categories or majors on the analytical and critical thinking scale.
Second, the findings demonstrate that, in areas related to work effort and conscientious
behaviors, disciplinary categories and majors do matter. Students in science and engi-
neering fields studied longer hours than students in the humanities and social sciences.
Biology, chemistry, and engineering majors stood out, in particular, for their longer hours
of study. Engineering majors stood out, in addition, on the academic conscientiousness
scale.
Bok (2006) used the term ‘‘under-achievement’’ to characterize the performance of
colleges and universities in undergraduate education. Based on 2008 data from the Uni-
versity of California, we accept Bok’s term as frequently apt. However, our findings
suggest that Bok’s emphasis on institutional performance is at least partly misdirected.
Universities are made up of a variety of majors, and student learning is strongly keyed to
the content knowledge of majors. Many students also see their majors as closely connected
to their identities and interests (Chatman 2007). In the University of California not all
disciplinary categories and majors were under-achieving in every important dimension of
the undergraduate education. Future discussions of underachievement in undergraduate
education should therefore be framed to include variation among disciplinary categories
and majors.
At the same time, the institutional level of analysis remains relevant where institution-
wide problems exist. A recent study based on the Collegiate Learning Assessment showed
that more than one-third of college students nationwide made no significant gains in
analytical and critical thinking skills over the course of 4 years in college (Arum and
Roksa 2011). In the University of California, we found that no disciplines stood out for
promoting analytical and critical thinking experiences. These data suggest that institution-
wide problems may exist in the effectiveness with which majors help students to develop
their analytical and critical thinking skills. If future studies confirm these findings, Bok’s
focus on the institutional level would be appropriate in relation to this important area of
educational purpose.
In the remainder of our discussion, we will consider what our data suggest about the
causes of under-achievement in undergraduate education. We will also discuss the pros-
pects and means for improving the academic experience of undergraduate students.
Causes of Under-Achievement
Our findings suggest that a large source of under-achievement in unde-
rgraduate education stems from the failure of instructors to maximize classroom
Res High Educ
123

participation.9 In our analyses participation frequency was the most important influence on
the academic conscientiousness scale, net of covariates, as well as on the analytical and
critical thinking scale. It was also an important influence on study time (see also Braxton
et al. 1998; Brint et al. 2008; Kuh 2003a; Umbach and Wawrzynski 2005). Of course, we
cannot establish causality based on cross-sectional data. Nevertheless it seems clear that
instructors in research universities should work to provide ample opportunities for students
to participate in their classes and to interact with them outside of class.
Overall, humanities and social science majors do a better job of encouraging classroom
participation and interaction than disciplines in the sciences or engineering. Students in
particular majors—notably, political science, history, English, and arts—were more likely
to report that they participated actively in their classes than most science and engineering
students (see Table 4). In this respect, instructors in the sciences and engineering have
much to learn from their colleagues in humanities and social sciences.
Our findings suggest that undemanding learning environments may be another impor-
tant cause of under-achievement in undergraduate education. In our analyses science and
engineering students scored significantly higher on study time and academic conscien-
tiousness than humanities and social science students, in spite of their low average levels of
participation frequency. These findings lead us to believe that learning environments in
humanities and social science classrooms are less demanding overall than those in science
and engineering classrooms (see also Brint et al. 2008; Johnson 2003). We define unde-
manding learning environments as those in which performance expectations are low and
requirements are unchallenging. In so far as demanding learning environments are asso-
ciated with higher levels of performance, instructors in humanities and social sciences have
much to learn from their colleagues in science and engineering.
Prospects and Means for Improvement
Although we are skeptical that any major constituency within research universities has a
strong interest in bringing about the changes that would be required for a major
improvement in undergraduate education (see also Arum and Roksa 2011),10 we do think it
9 Under-achievement in social science and humanities education has sometimes been attributed to largeclass sizes or an over-reliance on lecturers (see, e.g., Nelson and Watt 1999, pp. 84–98), but these argumentsappear to lack face validity, given the similar conditions found in the life sciences in many researchuniversities. Nor have empirical studies provided support for these factors as primary influences on students’academic outcomes. (On class size, see Martins and Walker 2006; Pinto et al. 2008; on lecturers, seeBettinger and Long 2004; Umbach 2007a) While larger class sizes and over-reliance on lecturers may not bebeneficial in the long run for undergraduate education in the research university, it appears that effectivelearning environments can be constructed even where class sizes are large and lecturers teach many courses.10 Arum and Roksa (2011) argue that the primary source of institutional underachievement has been animplicit treaty among students, faculty, and administrators to limit work demands. In their view, studentculture fails to place a premium on learning, as compared to enjoyment of the college experience, and thesocial side of college life consequently takes priority over academics for all but a minority of high achievers.Faculty members, for their part, are often more interested in research and their own socio-professionalinvolvements than in offering challenging, high-participation classes to undergraduates. Student evaluationsthat reward instructors for low expectations and high grades help to reinforce this pattern (Babcock 2010).Moreover, pressures to achieve high ratings on student evaluations may be particularly strong for temporaryinstructors whose extensions often depend on maintaining high teaching evaluations. Administrators areresponsible for the economic and political well-being of their institutions, and many must, by the nature oftheir jobs, be at least as concerned with meeting enrollment targets as they are with the quality of theundergraduate educational experience. This implicit treaty, Arum and Roksa argue, has had the consequenceof limiting students’ cognitive development during the college years.
Res High Educ
123

Table 4 OLS regressions on participation frequency
Disciplines Departments
Model 1 Model 2 Model 1 Model 2
N 17,845 17,845 16,162 16,162
R2 .05 .11 .07 .13
Disciplines
Social sciences Ref. Ref.
Physical sciences -.03 -.01
Life sciences -.08*** -.05*
Engineering -.10*** -.08***
Humanities .12*** .09***
Arts .10*** .09***
Departments
Economics Ref. Ref.
Anthropology .07*** .06***
Psychology .04** .04*
Political science .14*** .11***
Sociology .07*** .07***
English .16*** .14***
Foreign language & literatures .10*** .09***
Philosophy .05*** .05***
History .12*** .10***
Arts .17*** .15***
Biology .02 .03
Cell/molecular biology .02 .03
Chemistry .00 .01
Environ science & ecology .06*** .05***
Computer science .00 .00
Engineering -.01 .00
Mathematics/statistics .03 .03*
Physics .04 .02**
Background characteristics
UC GPA .14*** .14***
SAT math -.13*** -.11***
SAT verbal .03 .02
Male .09*** .10***
White Ref. Ref.
African American .02 .02
Hispanic -.05** -.06***
Asian American -.17*** -.17***
International -.02* -.02
Other -.02 -.02
Social class .05*** .06***
Student and parent(s) U.S. born Ref. Ref.
Student immigrant .06*** .07***
Parent(s) immigrant(s) .03* .03**
Res High Educ
123

likely that some individual institutions and many individual professors will be interested in
improving academic experiences for their students, if information about the troubled state
of undergraduate education in research universities becomes more widely known.
Accordingly, we offer the following suggestions for improvement as contributions to an
ongoing discussion.11
Our findings suggest that institutions can begin the process of improvement by
emphasizing techniques for increasing students’ classroom participation. Even in larger
lecture classes, professors can engage students with a steady stream of questions and ask
them to perform what they are learning through presentations of key concepts or back-
ground reports, debates about issues raised by course materials, presentations of group
research projects, and in-class problem solving. Some evidence exists that increasing
numbers of faculty members are already using these techniques for stimulating partici-
pation (see DeAngelo et al. 2007). It will be more difficult to encourage research university
faculty members to interact with undergraduate students, but institutions can help
instructors to do so by providing awards for mentoring undergraduate students, and by
providing more ample opportunities and encouragement for undergraduate research.
The creation of more demanding learning environments is a particular issue in the
humanities and social sciences and one that will be difficult to develop, given professors’
realistic concerns about the effects of higher standards on their teaching evaluations and
their time for research. In research universities, professors in the humanities and social
sciences also teach more than those in the sciences and engineering (Schuster and Fin-
kelstein 2006, p. 89), and it would be understandable if they resisted calls to increase
graded work requirements for this reason alone. Nevertheless, a goal worthy of discussion
would be to increase students’ average study time in the humanities and social sciences by
a few hours per week. In the University of California, a change of five hours per week
would lead to increases in average weekly study time (including time in class) from
approximately 25 to approximately 30 hours per week, as well as the reduction of students’
mean hours spent on social and recreational activities to just under 40 hours per week.
This goal could be achieved through a variety of means. Some classes may not be
sufficiently challenging and would require augmentation of assignments; others may
appear to be sufficiently challenging on paper, but do not in practice require students to do
the assigned work in order to pass. Regular short-answer homework assignments and
unannounced quizzes on the day’s reading can help to improve students’ motivation to
complete assignments (Ballard and Johnson 2004; Chung and Chow 2006; Geist and
Soehren 1997). Another change worthy of consideration would be the introduction of
stricter standards for grading, including movement back toward a bell-shaped grading
curve in courses where grade inflation has become pronounced.12
11 Among the key documents in the recent U.S. discussion of the reform of undergraduate teaching andlearning are the following: American Association of Colleges & Universities (2002, 2004), Bok (2006),Boyer Commission on Educating Undergraduates in Research Universities (1998), Chickering and Gamson(1987), Ewell (2001), Ewell and Miller (2005), National Governors Association (1986), National Institute ofEducation Study Group (1984), and the essays collected in Shulman (2004).12 Such a reform would require instructors to show clearly the types of work that yield grades at differentpoints on the curve. It would also require that institutions provide ways to protect instructors from negativeperformance appraisals simply because they maintain high grading standards (Babcock 2010). Becausemany students see themselves as entitled to high grades for self-perceived effort (Greenberger et al. 2008), itwill be important for professors to communicate clearly that self-perceived effort is not in itself sufficient toyield a high grade (Benton 2006).
Res High Educ
123

Educators can also study the practices of high-performing disciplines and majors in
order to adapt practices that lead to academically beneficial experiences for use in their
own fields. Our findings suggest that educators can look to biology, chemistry, and
engineering for ways to create higher levels of student work effort. Some part of the
intensity characteristic of these majors stems from the demands they make on students to
master relatively complex concepts and applications. Another part of the intensity char-
acteristic of these disciplines likely stems from the labs and projects that require public
performances of understanding and ‘‘hands-on’’ applications of knowledge (see Shulman
1997). The arts too emphasize public accountability through peer-led critiques and prep-
aration for public performances and exhibitions. Not surprisingly, students in the arts also
reported longer hours of study.
Educators will, however, need to look to the practices of particular instructors, rather
than to the practices of disciplines, for guidance about how to enhance students’ analytical
and critical thinking experiences. Our findings suggest that no disciplines in the University
of California stand out in this area, and none (with the exception of economics) perform
significantly below the norm. Analytical and critical thinking skills are developed when
students attempt to solve complex, incompletely structured problems. They are also
developed through close inspection and comparison of texts, methods, and research results.
These skills can be developed by instructors who require students to break down complex
arguments into their analytical components. They can be developed also by requiring
students to apply principles, concepts, or ideas to new problems or phenomena. Instructors
can also require students to compare divergent methods of analysis or to explain conflicting
findings in the literature. They can encourage students to think often about what does and
does not make for convincing evidence in support of a thesis (see King and Kitchener
1994).
In sum, undergraduate education in research universities can begin to shed its reputation
for under-achievement if instructors make the effort to offer ample opportunities for
participation, including public performances of understanding and application of knowl-
edge; and if they create meaningful and challenging assignments requiring serious indi-
vidual effort. Some disciplines do better than others in promoting participation, while
others do well in creating demanding learning environments. These disciplines can serve as
models. Efforts to improve the analytical and critical thinking skills of undergraduate
students would be equally desirable, but for improvement to occur in this area educators
will need to study the practices of exemplary instructors rather than exemplary disciplines,
because no disciplines appear to stand out in this domain.
References
American Association of Colleges & Universities. (2002). Greater expectations: National panel report.Washington, DC: American Association of Colleges & Universities.
American Association of Colleges & Universities. (2004). Our students’ best work: A framework foraccountability worthy of our mission. Washington, DC: American Association of Colleges &Universities.
Arcidiacono, P. (2003). Ability sorting and the returns to the college major. Journal of Econometrics, 121,343–375.
Arum, R., & Roksa, J. (2011). Academically adrift: Limited learning on college campuses. Chicago: Uni-versity of Chicago Press.
Babcock, P. (2010). Real costs of nominal grade inflation? New evidence from student course evaluations.Economic Inquiry, 48, 983–996.
Res High Educ
123

Babcock, P., & Marks, M. (2010). The falling time cost of college: Evidence from a half century of time usedata. NBER Working Paper No. 15954. www.nber.org/papers/w15954.pdf. Retrieved July 10, 2010.
Ballard, C. L., & Johnson, M. F. (2004). Basic math skills and performance in an introductory economicsclass. Journal of Economic Education, 35, 3–24.
Barzun, J. (1945). Teacher in America. Boston: Little-Brown.Becher, T. (1989). Academic tribes and territories: Intellectual inquiry and the culture of disciplines.
Briston, PA: The Society for Research in Higher Education and Open University Press.Becher, T. (1994). The significance of disciplinary differences. Studies in Higher Education, 6, 109–122.Benton, T. H. (2006). A tough-love manifesto for professors. The Chronicle of Higher Education, 52(40):
C1. www.chronicle.com. Retrieved July 10, 2010.Bettinger, E., & Long, B. T. (2004). Do college instructors matter? The effects of adjuncts and graduate
assistants on students’ interests and success. NBER Working Paper No. 10370. www.nber.org/papers/w10370.pdf. Retrieved May 28, 2010.
Biglan, A. (1973a). The characteristics of subject matter in different academic areas. Journal of AppliedPsychology, 57, 195–203.
Biglan, A. (1973b). Relationships between subject matter characteristics and the structure and output ofuniversity departments. Journal of Applied Psychology, 57, 204–213.
Bloom, B. S. (1956). Taxonomy of educational objectives: The classification of educational goals.New York: Longmans, Green.
Bok, D. (2006). Our underachieving colleges: A candid look at how much students learn and why theyshould be learning more. Princeton: Princeton University Press.
Bound, J., Lovenheim, M. F., & Turner, S. (2009). Increasing time to baccalaureate degree in the UnitedStates. NBER Working Paper No. 15892. www.nber.org/papers/w158932. Retrieved July 10, 2010.
Bowman, N. A. (2008, November). Can college students provide accurate self-reports about their learningand development? Paper presented at the annual meeting of the Association for the Study of HigherEducation. Jacksonville, FL.
Boyer Commission on Educating Undergraduates in Research Universities. (1998). Reinventing under-graduate education: A blueprint for America’s research universities. Princeton: Carnegie Foundationfor the Advancement of Teaching.
Braxton, J. M. (1995). Disciplines with an affinity for the improvement of undergraduate education. InN. Hativa & M. Marincovich (Eds.), Disciplinary differences in teaching and learning: Implicationsfor practice (pp. 59–64). San Francisco: Jossey-Bass.
Braxton, J. M., & Hargens, L. L. (1996). Variation among academic disciplines: Analytical frameworks andresearch. In J. C. Smart (Ed.), Higher education: Handbook of theory and research (Vol. 11,pp. 11–46). Dordrecht: Springer.
Braxton, J. M., Olsen, D., & Simmons, A. (1998). Affinity disciplines and the use of principles of goodpractice for undergraduate education. Research in Higher Education, 39, 299–318.
Brint, S., & Cantwell, A. M. (2010). Undergraduate time use and academic outcomes: Evidence fromUniversity of California Undergraduate Experience Survey 2006. Teachers College Record, 112.www.tcrecord.org/Content.asp?ContentId=15953. Retrieved July 1, 2010.
Brint, S., Cantwell, A. M., & Hanneman, R. A. (2008). The two cultures of undergraduate academicengagement. Research on Higher Education, 49, 383–402.
Brint, S., Douglass, J. A., Thomson, G., & Chatman, S. (2010). Engaged learning in the research university:The general report of UCUES 2008. Berkeley: Center for Studies in Higher Education.
Chatman, S. (2006). Analysis of response bias in UCUES 2006. Unpublished paper, Berkeley: Center forStudies in Higher Education
Chatman, S. (2007). Institutional versus academic discipline measures of student experiences: A matter ofrelative validity. Berkeley: Center for Studies in Higher Education. http://cshe.berkeley.edu/publications/publication.php?id-263
Chickering, A. W., & Gamson, Z. (1987). Seven principles for good practice in undergraduate education.AAHE Bulletin, 39, 3–7.
Chung, E. P., & Chow, S. L. (2006, July). Effectiveness of unannounced electronic assessment quizzes toenhance student learning. Paper presented at the annual mmeting of the American Association ofColleges of Pharmacy. San Diego.
Cole, J. R. (2009). The great American university: Its rise to preeminence, its indispensable national role,why it must be protected. New York: Public Affairs Books.
DeAngelo, L., Hurtado, S., Prior, J. H., Nelly, K. R., Santos, J. L., & Korn, W. S. (2007). American collegeteacher: National norms for the 2007–2008 HERI faculty survey. Los Angeles: Higher EducationResearch Institute.
Res High Educ
123

DeSimone, J. (2008). The impact of employment during school on college student academic performance.NBER Working Paper No. 14006. Cambridge, MA: National Bureau of Economic Research.www.nber.org/paper/w140006.pdf. Retrieved June 25, 2010.
Donald, J. G. (1983). Knowledge structures: Methods for exploring course content. Journal of HigherEducation, 54, 31–41.
Douglass, J. A. (2007). The conditions of admission: Access, equity and the social contract of publicuniversities. Stanford: Stanford University Press.
Ewell, P. T. (2001). Accreditation and student learning outcomes: A proposed point of departure. Wash-ington, DC: Council on Higher Education Accreditation.
Ewell, P. T., & Miller, M. A. (2005). Measuring up on college-level learning. San Jose: National Center forPublic Policy in Higher Education.
Gainen, J. (1995). Barriers to success in quantitative gatekeeper courses’’. New Directions for Teaching andLearning, 61, 5–14.
Geist, J. R., & Soehren, S. E. (1997). The effect of frequent quizzes on short and long-term academicperformance. Journal of Dental Education, 61, 339–345.
Goldin, C. D., & Katz, L. F. (2008). The race between education and technology. Cambridge, MA: BelknapPress of Harvard University Press.
Greenberger, E., Lessard, J., Chen, C., & Farrugggio, S. P. (2008). Self-entitled college students: Contri-butions of personality, parenting, and motivational factors. Journal of Youth and Adolescence, 37,1193–1204.
Gross, N., & Simmons, S. (2007). The social and political views of American professors. Unpublished paper,Department of Sociology, Harvard University and Department of Political Science, George MasonUniversity.
Hativa, N. (1997, March 24–28). Teaching in a research university: Professors’ conceptions, practices, anddisciplinary differences. Paper presented at the annual meeting of the American Educational ResearchAssociation. Chicago.
Hu, S., & Kuh, G. D. (2001). Learning productivity at research universities. Journal of Higher Education,72, 1–28.
Johnson, V. E. (2003). Grade inflation: A crisis in college education. New York: Springer-Verlag.Kerr, C. (1962). The uses of the university. Cambridge, MA: Harvard University Press.King, P. M., & Kitchener, K. S. (1994). Developing reflective judgment: Understanding and promoting
intellectual growth and critical thinking in adolescents and adults. San Francisco: Jossey-Bass.Kuh, G. D. (2003a). What we are learning about student engagement from NSSE? Change, 35(2), 24–32.Kuh, G. D. (2003b). The National Survey of Student Engagement: Conceptual framework and overview of
psychometric properties. Bloomington: Indiana University Center for Postsecondary Research andPlanning.
Lattuca, L., & Stark, J. S. (1994). Will disciplinary perspectives impede curricular reform? Journal ofHigher Education, 65, 401–426.
Martins, P. S., & Walker, I. (2006). Student achievement and university classes: Effects of attendance, size,peers, and teachers. IZA Discussion Paper No. 2490.
National Governors Association. (1986). A time for results: The governors’ 1991 report on education.Washington, DC: National Governors’ Association.
National Institute of Education Study Group on the Conditions of Excellence in American Higher Educa-tion. (1984). Involvement in learning: Realizing the potential of American higher education. Wash-ington, DC: National Institute of Education.
Nelson, C., & Watt, S. (1999). Academic keywords: A devil’s dictionary for Higher education. New York:Routledge.
Neumann, R. (2001). Disciplinary differences and university teaching. Studies in Higher Education, 26,135–146.
Ouimet, J. A., Bunnage, J. C., Carini, R. M., Kuh, G. D., & Kennedy, J. (2004). Using focus groups, expertadvice and cognitive interviews to establish the validity of a college student survey. Research inHigher Education, 45, 233–250.
Pace, C. R. (1985). The credibility of student self-reports. Los Angeles: UCLA Center for Evaluation(November).
Pascarella, E. T., & Terenzini, P. T. (2005). How college affects students. San Francisco: Jossey-Bass.Pike, G. R. (1995). The relationship between self reports of college experiences and achievement test scores.
Research in Higher Education, 36, 1–22.Pike, G. R., Kuh, G. D., & Massa-McKinley, R. (2009). First year students employment, engagement and
academic achievement: Untangling the relation between work and grades. NASPA Journal, 45,560–582.
Res High Educ
123

Pinto, M., Mathilde, M., & Vera-Hernandez, M. (2008). Does class size affect the academic performance offirst year college students? Unpublished paper, Department of Economics, Universidad Carlos II deMadrid.
Rothman, S., Lichter, S. R., & Neville, N. (2005). Politics and the professional advancement of collegefaculty. The Forum 3. www.bepress.com/forum/vol3/iss1/art2. Retrieved June 26, 2010.
Schuster, J. H., & Finkelstein, M. L. (2006). The American faculty: The restructuring of academic work andcareers. Baltimore: Johns Hopkins University Press.
Shulman, L. S. (1997). Professing the liberal arts. In R. Orrill (Ed.), Education and democracy: Re-imagining liberal learning in America (pp. 151–173). New York: College Board Publications.
Shulman, L. S. (2004). Teaching as community property: Essays on higher education. San Francisco andMenlo Park: Jossey-Bass and Carnegie Foundation for the Advancement of Teaching.
Smart, J. C., & Ethington, C. A. (1995). Disciplinary and institutional differences in undergraduate edu-cation goals. New Directions for Teaching and Learning, 64, 49–57.
Smart, J. C., Feldman, K. A., & Ethington, C. A. (2000). Academic disciplines: Holland’s theory and thestudy of college students and faculty. Nashville: Vanderbilt University Press.
Smart, J. C., & Umbach, P. D. (2007). Faculty and academic environments: Using Holland’s theory toexplore differences in how faculty structure undergraduate courses. Journal of College StudentDevelopment, 48, 183–195.
Tall, D. (1997). Functions and calculus. In A. J. Bishop (Ed.), International handbook of mathematicseducation (pp. 289–325). Dordrecht: Kluwer.
Thomas, S. L., & Heck, R. H. (2001). Analysis of large-scale secondary data in higher education research:Potential perils associated with complex sampling designs. Research in Higher Education, 42,517–540.
Umbach, P. D. (2007a). How effective are they? Exploring the impact of contingent faculty on under-graduate education. Review of Higher Education, 30, 91–123.
Umbach, P. D. (2007b). Faculty cultures and college teaching. In R. P. Perry & J. C. Smart (Eds.), Thescholarship of teaching and learning in higher education: An evidence-based perspective. New York:Springer.
Umbach, P. D., & Wawrzynski, M. R. (2005). Faculty do matter: The role of college faculty in studentlearning and engagement. Research in Higher Education, 46, 153–184.
Wolfle, D. L. (1954). America’s resources of specialized talent: A current appraisal and a look ahead. NewYork: Harper.
Wood, P. (2003). Diversity: The invention of a concept. San Francisco: Encounter Books.
Res High Educ
123