disciplined growth + shareholder returns · 2019-02-07 · $0.00 $1.00 $2.00 $3.00 $4.00 $5.00...
TRANSCRIPT

1Corporate Presentation | March 2017Corporate Presentation | February 2019 1
Disciplined Growth +
Shareholder Returns
www.parexresources.com | TSX:PXT | Corporate Presentation | February 2019

2Corporate Presentation | March 2017Corporate Presentation | February 2019 2
Operating results 2017 2018E 2019E(1)
Production (boe/d) FY Average 35,541 ~44,400 ~53,000
Capital Expenditures(2) - US$ million $212 ~$320 ~$215
Drilling Program (# wells) 38 55-60 ~45
Reserves (2018 Year-End)
2P Reserves (Dec. 31)(3) - Mmboe 185
2P Reserve Life Index - years 10.3
Capital structure
Net Working Capital(4) ~US$215MM
US$200 MM Undrawn Credit Facility No Debt
Market Capitalization(5) ~C$3Bn
Common Shares Basic Outstanding (TSX listed) 155MM
CORPORATE SNAPSHOT
(1) 2019E mid-point production guidance (2) Mid-point guidance assuming Brent oil price: US$72/bbl for 2018 and US$60/bbl for 2019(3) Parex’ working interest, as per the independent reserve report prepared by GLJ Petroleum Consultants effective Dec. 31, 2018(4) 2018 year-end net working capital estimate (5) $19 share price See “Advisories” at the end of this presentation

3Corporate Presentation | March 2017Corporate Presentation | February 2019 3
WHY INVEST IN PAREX?
1. No debt and positive 2018 WC estimated at ~US$215MM
2. High margins
o Q4’18E Operating Netback→ ~US$32/boe @ Brent ~$68/bbl
3. Ability to grow within cash flow:
o 2017 Production Growth: 20% self-funded
o 2018E Production Growth: ~25% self-funded
o 2019E Production Growth: ~20% self-funded
4. Focused management
o Ability to grow within a single country → Colombia
Delivering Shareholder Value
$-
$50
$100
$150
$200
$250
$300
$350
$400
$450
$500
$550
$600
$650
$700
Cash Sources Cash Uses
Working Capital
CFO at $60/bbl
CFO at $55/bbl
CFO at $50/bbl
BRENT
Returning Capital(Shares Repurchases)
Bus. Dev
Exploration
Development
Maintenance

4Corporate Presentation | March 2017Corporate Presentation | February 2019 4
Production Growth & Free Cash
Flow
New Growth:Tight Oil
&Exploration
Shareholder Return:
NCIB
Deliver Top Quartile Per
Share Growth
Replenish & Diversify Portfolio
Return Free Cash Flow to Shareholders
2019 2020 - 2022
WHERE DO WE GO FROM HERE?
Our focus is on profitable future growth & delivering shareholder returns

5Corporate Presentation | March 2017Corporate Presentation | February 2019 5
-
200
400
600
800
1,000
1,200
1,400
1,600
2014 2015 2016 2017 2018
MB
OE/
MM
B
ASI
C S
HA
RES
2P RESERVES PER SHARE (DEBT ADJUSTED)
-
50
100
150
200
250
300
350
2014 2015 2016 2017 2018
BO
E/M
ILLI
ON
WA
BA
SIC
SH
AR
ES
PRODUCTION PER SHARE (DEBT ADJUSTED)
DELIVERING CONSISTENT SHAREHOLDER VALUE
See advisories at the end of this presentation2018E FFO/share adjusted to exclude cost of the voluntary tax restructuring
$0
$20
$40
$60
$80
$100
$120
$-
$0.50
$1.00
$1.50
$2.00
$2.50
$3.00
$3.50
$4.00
2014 2015 2016 2017 2018E*B
REN
T P
RIC
E (U
SD/B
BL)
FUN
DS
FLO
W P
ER S
HA
RE
(USD
/BA
SIC
SH
AR
E)
FUNDS FLOW PER SHARE (BASIC)
FUNDS FLOW PER SHARE (USD/BASIC SHARE) BRENT (USD/BBL)
15%
34%
66%
7%
-10%-16%
-25%
40%
-11%
-29%
-40%
-20%
0%
20%
40%
60%
80%
2014 2015 2016 2017 2018
TOTA
L R
ETU
RN
PXT VS. S&P/TSX ENERGY INDEX (TTEN)
PXT S&P/TSX Energy Index
6Corporate Presentation | March 2017Corporate Presentation | February 2019 6
-
5,000
10,000
15,000
20,000
25,000
30,000
35,000
40,000
45,000
50,000
55,000
-
50
100
150
200
250
300
350
400
450
500
550
Mar
-15
Jun
-15
Sep
-15
Dec
-15
Mar
-16
Jun
-16
Sep
-16
Dec
-16
Mar
-17
Jun
-17
Sep
-17
Dec
-17
Mar
-18
Jun
-18
Sep
-18
Dec
-18
Mar
-19
BO
E/M
ILLI
ON
BA
SIC
WA
SH
AR
ES
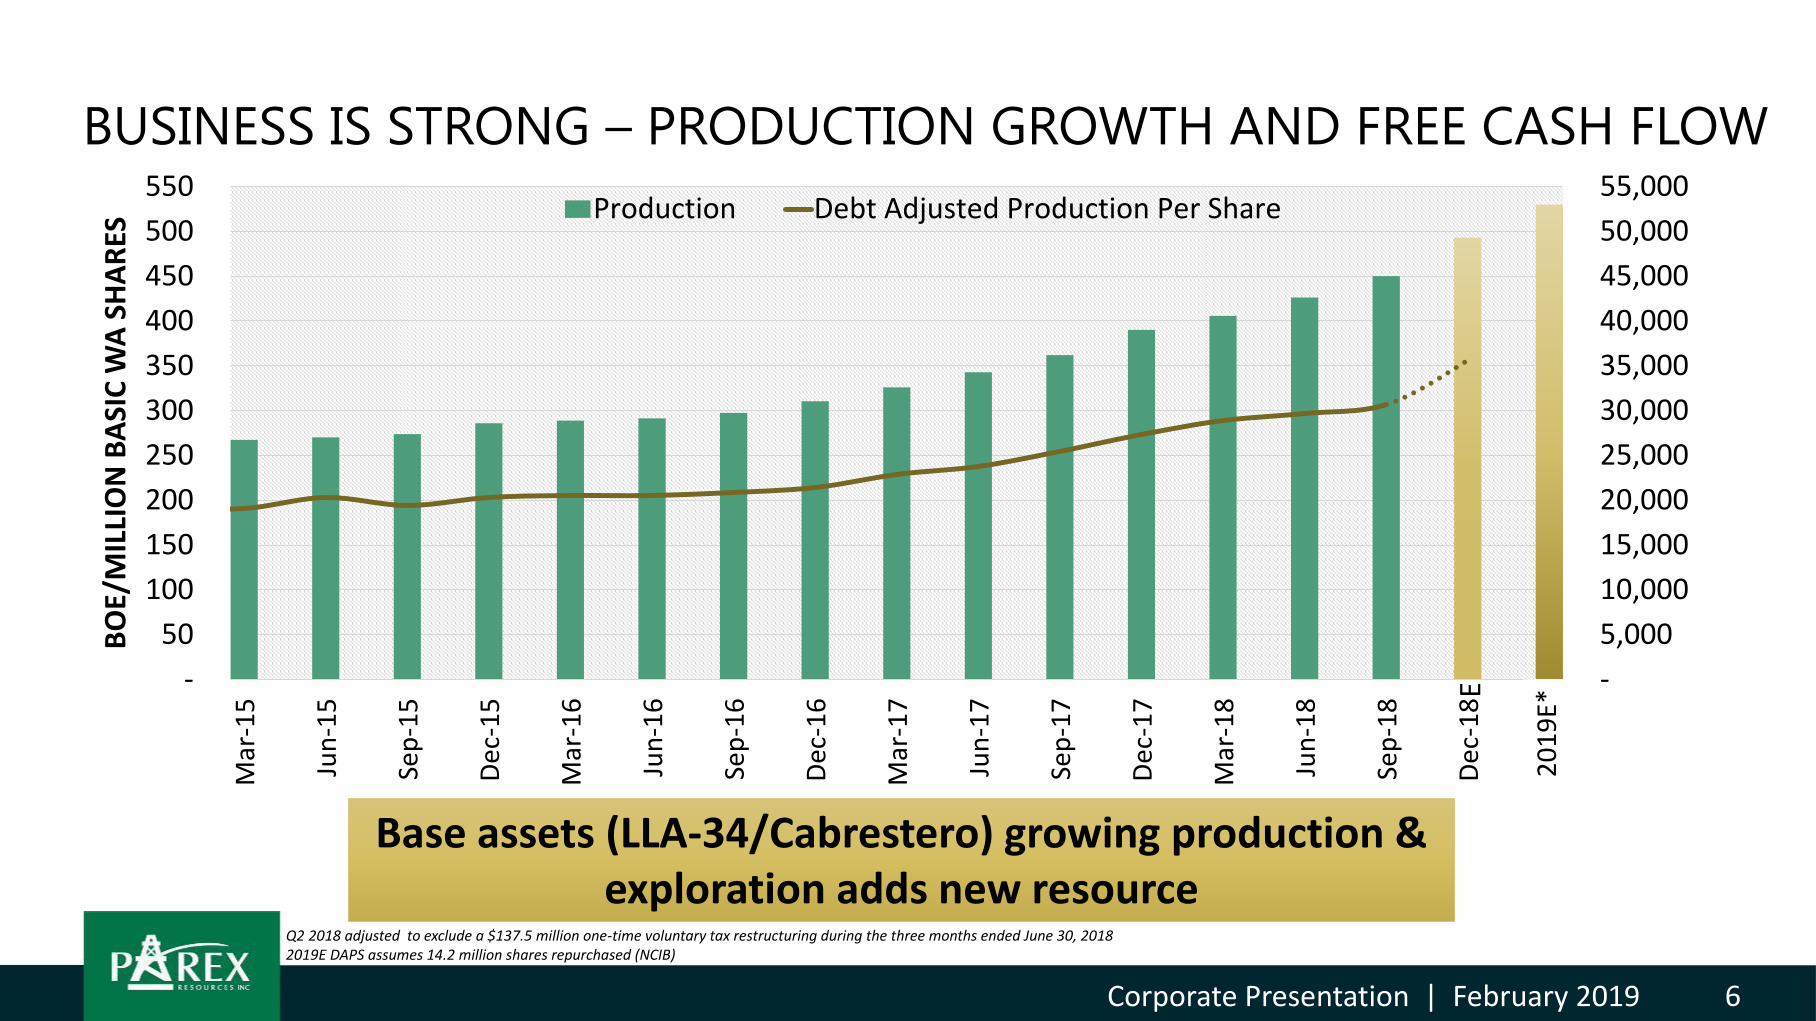
Production Debt Adjusted Production Per Share
E
20
19
E*
Base assets (LLA-34/Cabrestero) growing production & exploration adds new resource
BUSINESS IS STRONG – PRODUCTION GROWTH AND FREE CASH FLOW
Q2 2018 adjusted to exclude a $137.5 million one-time voluntary tax restructuring during the three months ended June 30, 20182019E DAPS assumes 14.2 million shares repurchased (NCIB)

7Corporate Presentation | March 2017Corporate Presentation | February 2019 7
GUIDANCE: CASH FLOW FUNDED GROWTH
ASSUMPTIONS
2018FY 2019FY(1)
Oil (Brent)(US/bbl) $72 $60
FFO netback(2)(3)(4) (US/boe) $32 $25
Production (Boe/d) 44,400 53,000
Capex (midpoint)(US$ MM) $320 $215
FFO (midpoint)(US$ MM)(4) $525 $475
YOY Production growth/share 25% 25%
(1) Mid-point 2019 guidance(2) FFO netback is defined as Funds Flow From Operations (“FFO”) per bopd.(3) Netback is a non-GAAP Measure.(4) Excluding decommissioning/environmental liabilities. 2018FY adjusted to exclude a $137.5 million cost of the
voluntary tax restructuring during Q2 2018
Capex
Capex by Type
Capex
Capex By Block
Exploration
Development
Maintenance SoCa
Aguas Blancas
Capachos
Fortuna
Bus. Dev
OtherBus. Dev
DeMares/Playon

8Corporate Presentation | March 2017Corporate Presentation | February 2019 8
2019 PLAN: HIGH NETBACKS ENABLE SHAREHOLDER RETURNS
$0
$50
$100
$150
$200
$250
$300
$350
$400
$450
$500
$550
$600
$650
$700
Sources of Cash Maintenance Development Exploration Bus Dev. NCIB Column1
OPTIONALITY
(1) Estimated working capital of ~$215MM at December 31, 2018(2) Normal issuer course bid assumes up to ~14.2 million shares repurchased at ~$20/share on average using a 2019E USD-CAD average rate of 1.32
(2)
Working Capital (1)
CFO at $60/bblCFO at
$55/bbl
CFO at$50/bbl
BRENT
Capex: ~$215
~$75
~$75
~$215(2)
~$15
~$50
9Corporate Presentation | March 2017Corporate Presentation | February 2019 9
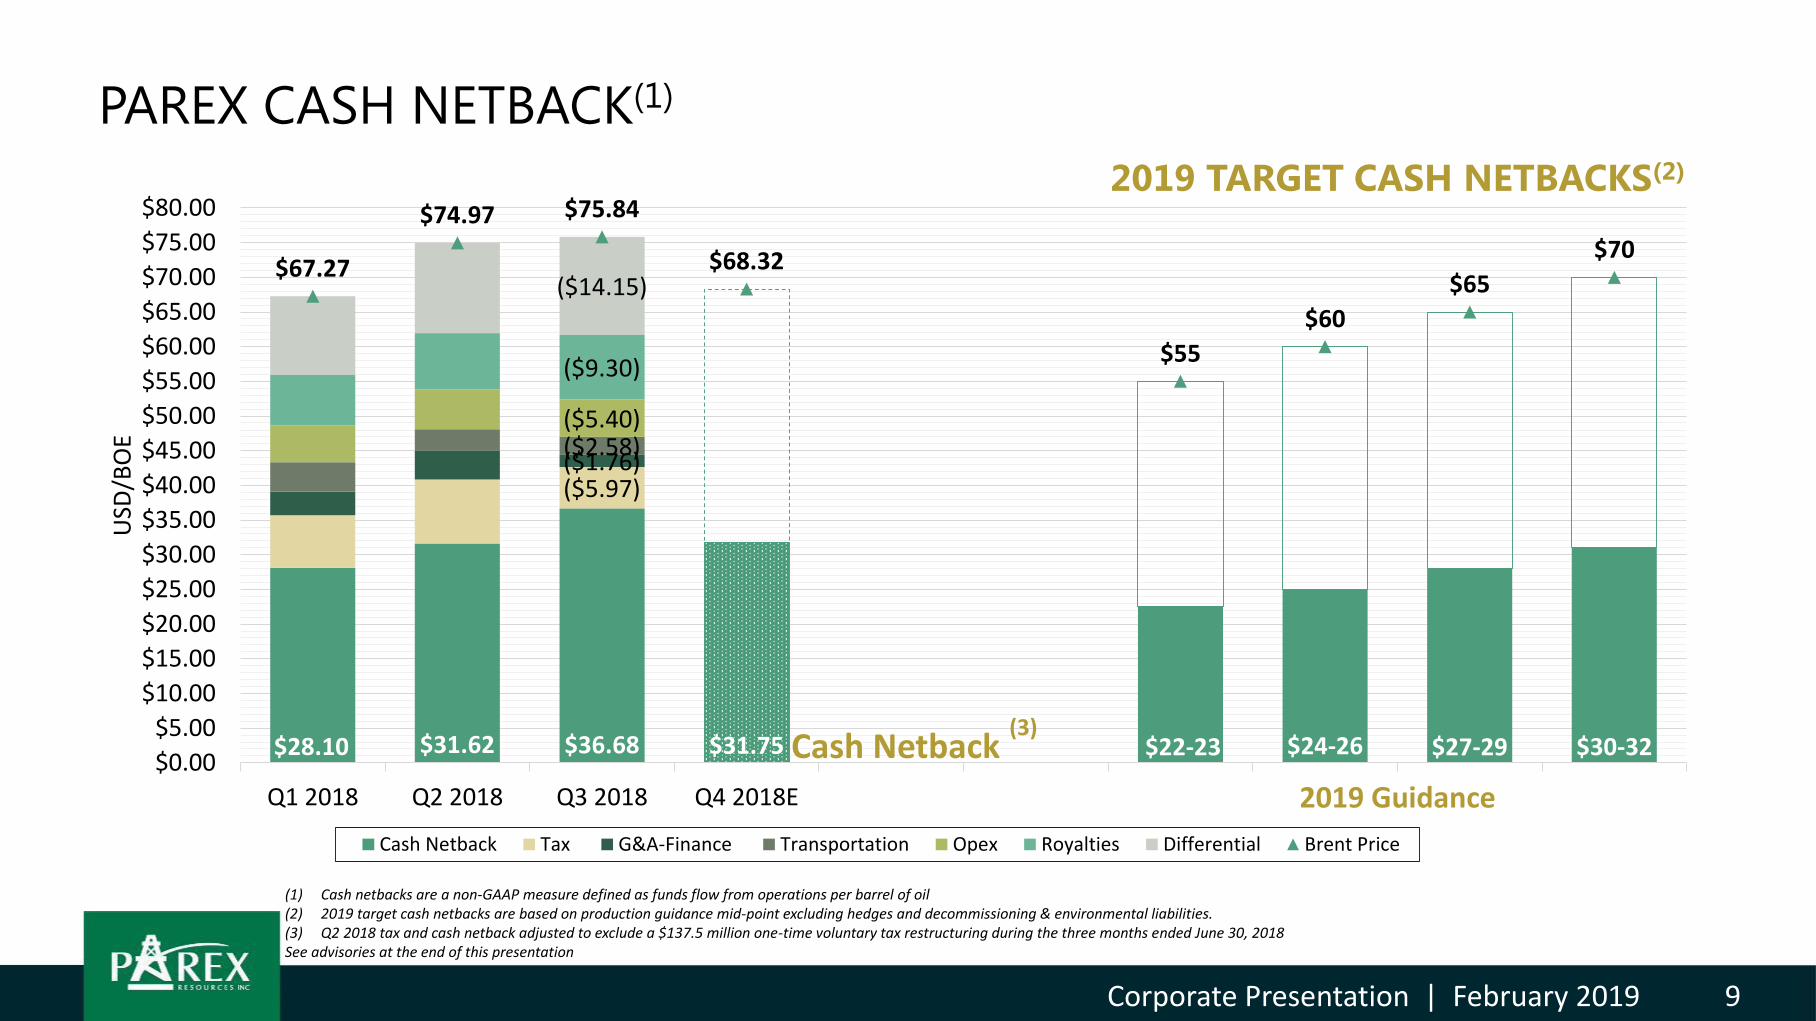
PAREX CASH NETBACK(1)
$28.10 $31.62 $36.68 $31.75 $22-23 $24-26 $27-29 $30-32
($5.97)($1.76)($2.58)($5.40)
($9.30)
($14.15)$67.27
$74.97 $75.84
$68.32
$55
$60
$65
$70
$0.00
$5.00
$10.00
$15.00
$20.00
$25.00
$30.00
$35.00
$40.00
$45.00
$50.00
$55.00
$60.00
$65.00
$70.00
$75.00
$80.00
Q1 2018 Q2 2018 Q3 2018 Q4 2018E
USD
/BO
E
Cash Netback Tax G&A-Finance Transportation Opex Royalties Differential Brent Price
2019 TARGET CASH NETBACKS(2)
Cash Netback (3)
(1) Cash netbacks are a non-GAAP measure defined as funds flow from operations per barrel of oil (2) 2019 target cash netbacks are based on production guidance mid-point excluding hedges and decommissioning & environmental liabilities.(3) Q2 2018 tax and cash netback adjusted to exclude a $137.5 million one-time voluntary tax restructuring during the three months ended June 30, 2018See advisories at the end of this presentation
2019 Guidance

10Corporate Presentation | March 2017Corporate Presentation | February 2019 10
2019 DRILLING PROGRAM: 45 GROSS WELLS PLANNED
Llanos Basin # wells
o Capachoso SoCao CPO-11
1211
COLOMBIA
Capachos
CPO-11
SoCa
Fortuna
Aguas Blancas
DeMares
Playon
VIM-1
Middle Magdalena # wells
o Aguas Blancas o DeMares/Playon o Fortuna
1533
VIM-1: Lower Magdalena
o La Belleza well

11Corporate Presentation | March 2017Corporate Presentation | February 2019 11
Dec. 31, Proved + Probable+ Possible
Proved +Probable
Proved Annual Production
2P Reserve Life Index
Millions of Barrels of Oil EquivalentBased on Annualized
Q4 Production
2014 104 68 40 8 7 years2015 125 82 46 10 8 years2016 169 112 64 11 10 years 2017 241 162 96 13 11 years2018 262 185 122 16 10 years
TRACK RECORD OF PROGRESSING RESERVES* FROM 3P TO CASH FLOW
*Per the independent reserve reports prepared by GLJ Petroleum Consultants Ltd. effective December 31 of the reported year. Future development capital (FDC) included in the 2018 GLJ Report are: 1P US$297 mm, 2P US$412 mm & 3P US$518 mmSee advisories at the end of this presentation
SOLID FOUNDATION SUPPORTS GROWTH
262 Mmboe → ~ 72,000 boe/d & ~10 yr RLI

12Corporate Presentation | March 2017Corporate Presentation | February 2019 12
$0.00
$1.00
$2.00
$3.00
$4.00
$5.00
$6.00
$7.00
$8.00
$9.00
2016 2017 2018
2P
FD
&A
(U
SD/B
OE)
1 Year $/boe 3 Year $/boe
CONVENTIONAL OIL RESERVES GENERATE VALUE
Total Company - 2018YE ProvedProved + Probable
Proved+Probable+
Possible
FD&A USD/boe(1) $7.04 $7.29 $7.60
Recycle Ratio (FD&A)(1) 4.5x 4.4x 4.2x
After Tax NPV10% - CAD/sh(2) $21.25 $30.18 $40.69
Working Capital - CAD/Sh(3) $1.89 $1.89 $1.89
Total CAD/Sh(3) $23.14 $32.07 $42.59
(1) Per the independent reserve reports prepared by GLJ Petroleum Consultants Ltd. effective Dec. 31 of the reported year, includingFuture Development Cost. Recycle Ratio is calculated using estimated Q4 2018 Funds Flow From Operations per barrel divided byannual F&D or FD&A as applicable.
(2) Based on GLJ Petroleum Consultants Ltd. price forecast, as at January 1, 2019, which assumes $70.30/bbl over 2019-2023(3) Working Capital of US$215 million (CAD 293 million) and 155 million shares at December 31, 2018See advisories at the end of this presentation
(1)

13Corporate Presentation | March 2017Corporate Presentation | February 2019 13
As per the independent reserve report prepared by GLJ Petroleum Consultants Ltd. effective Dec. 31/18
Explore core position, appraise & develop discoveries, and leverage Parex’ costs & exploration
strengths
2019 Plan: ~21 wells
SOCA: FOUNDATION FOR GROWTH
Akira
Tua
Tarotaro
Aruco
Bacano
Curucucu
Jacamar
Cabrestero
Tilo
Tigana
Jacana
LLA-34Chachalaca
Chiricoca
Max
Totoro
Tigui
FaultsGLJ 3P (2018YE) Upcoming WellsExploration Wells

14Corporate Presentation | March 2017Corporate Presentation | February 2019 14
SOCA– FOUNDATION FOR FUTURE GROWTH
3-5 years of production growth*Per the independent reserve reports prepared by GLJ Petroleum Consultants Ltd. effective Dec. 31 of the reported year. See advisories at the end of this presentation
0
10,000
20,000
30,000
40,000
50,000
2014 2015 2016 2017 2018E
BO
E/D
NET WORKING INTEREST PRODUCTION
As per the independent reserve report prepared by GLJ Petroleum Consultants Ltd. effective Dec. 31/18
Faults GLJ 3P (2018YE) 2019 Exploration
0
50
100
150
200
250
2014 2015 2016 2017 2018
RES
ERV
ES (
MM
BO
E)
NET WORKING INTEREST RESERVES* – LAST 5 YEARS
1P 2P 3P
LLA-32
LLA-34Chachalaca
Tilo
Tigana
Jacana
Akira
Tua
Tarotaro
Aruco
Kananaskis
Calona
Chiricoca
Bacano
Curucucu
Jacamar
Cabrestero
Carmentea
Max
Totoro
Tigui
GUACO
AZOGUE

15Corporate Presentation | March 2017Corporate Presentation | February 2019 15
ANDINA-1
CAPACHOS-2
CAPACHOS SUR-2
GUADALUPE DEPTH STRUCTURECAPACHOS DEVELOPMENT AND EXPLORATION POTENTIAL
CAPACHOS (50% WI, Operator)
• Producing at restricted rate of ~2,100 gross bopd o Capachos-2: Guadalupe on production
o Andina-1: Guadalupe on production
o Andina-2: Successfully tested
• Drilling Andina Norte-1 exploration well
• Phase-1 gas processing facility on line in Q1/19
ANDINA NORTE-1
ANDINA-2
Future exploration
App/Dev well
Legacy wells
Parex wells Facility/Pad
Flowline

16Corporate Presentation | March 2017Corporate Presentation | February 2019 16
CAPACHOS: ANDINA WELLS
• Andina Norte prospect will test the next fault compartment in 2019
• Prospective zones:
Andina-1 Andina-2
Mirador Untested Untested
Guadalupe Producing ~1,000 bopd(restricted)
-
Upper Guad. Untested 1,606 bopd & 0.8 MMcf/d (gross)
Lower Guad. 2,570 bopd & 1.2 MMcf/d (gross)
2,195 bopd & 0.9 MMcf/d (gross)
Une 2,545 bopd + 8.7 MMcf/d (gross)
Untested
Andina-2Andina Norte Prospect
Mirador
Guadalupe
Une
Andina-1

17Corporate Presentation | March 2017Corporate Presentation | February 2019 17
CPO-11: EXPANDING LLANOS INVENTORY
• Farm-in: drill remaining 1 well & acquire 2D seismic to earn 50% WI
• Apply key learnings from Cabrestero & LLA-34
• Numerous additional leads and prospects being evaluated
Cabrestero
CPO-11
LLA-34LLA-32
Rubiales

18Corporate Presentation | March 2017Corporate Presentation | February 2019 18
MAGDALENA BASIN: NEXT GROWTH PLATFORM
(1) Subject to regulatory approvalSee advisories at the end of this presentation
De MARES• Evaluate follow-up drilling
locations• 2 exploration wells planned
PLAYON• Drill Boranda-2 in 2019
AGUAS BLANCAS• Light oil opportunity• 2019 Plan - drill ~15 wells
VIM-1• Identifying gas prospects from 3D
Seismic data using AVO• Drill La Belleza
FORTUNA(1)
• 3 wells planned in 2019
Barrancabermeja
Vasconia
Monterrey
Terminal Covenas
Hidrocasanare
Cusiana
Trucking
Parex Blocks
Pipeline
River
VIM-1
DE MARES
VMM-9
AGUAS BLANCAS
Cartagena
FORTUNA
CAPACHOS
CPO-11
PLAYON
SOCA

19Corporate Presentation | March 2017Corporate Presentation | February 2019 19
FORTUNA & PLAYON
Fortuna (100%WI) • Acquired for $17MM • 2019 Plan
o Drill 2 exploration wells & 1 development well
o Acquire seismic
• Target Lisama and La Luna Formations
Playon (50% WI)
• Drill Boranda-2
Fortuna
Playon
Midas (Acordianero)

20Corporate Presentation | March 2017Corporate Presentation | February 2019 20
2019 PLANNINGAGUAS BLANCAS EXECUTION
1. 2019 Plan:o D&C 15 new wells
o Tie-in existing & new pads to water injection facility
o Tie-in and sell gas production to nearby pipeline
2. Infill producer-injector patterns in the Phase II Area with 12 wells
3. Appraise West Area with 3 new wells from another new pad under construction - Q2’19
4. Continue executing cost reduction with higher productivity through advancing drilling & completion techniques
.
West Area (FW)
East Area (HW)
Phase II Dev. Area
D/E Planned Appraisal
Existing Injector
Existing Producer
Existing Standing Well
Waterflood Pattern
2019 Development

21Corporate Presentation | March 2017Corporate Presentation | February 2019 21
VIM-1: TARGET GAS
• Proven play on Porquero Formation sandstone reservoirs
• Applying 3D seismic Amplitude Variation with Offset (AVO) has achieved a very high success rate identifying gas sweet spots
20 km
La Creciente
La Belleza Prospect
Esperanza
Existing facilitiesGas Fields
Gas pipelines
22Corporate Presentation | March 2017Corporate Presentation | February 2019 22
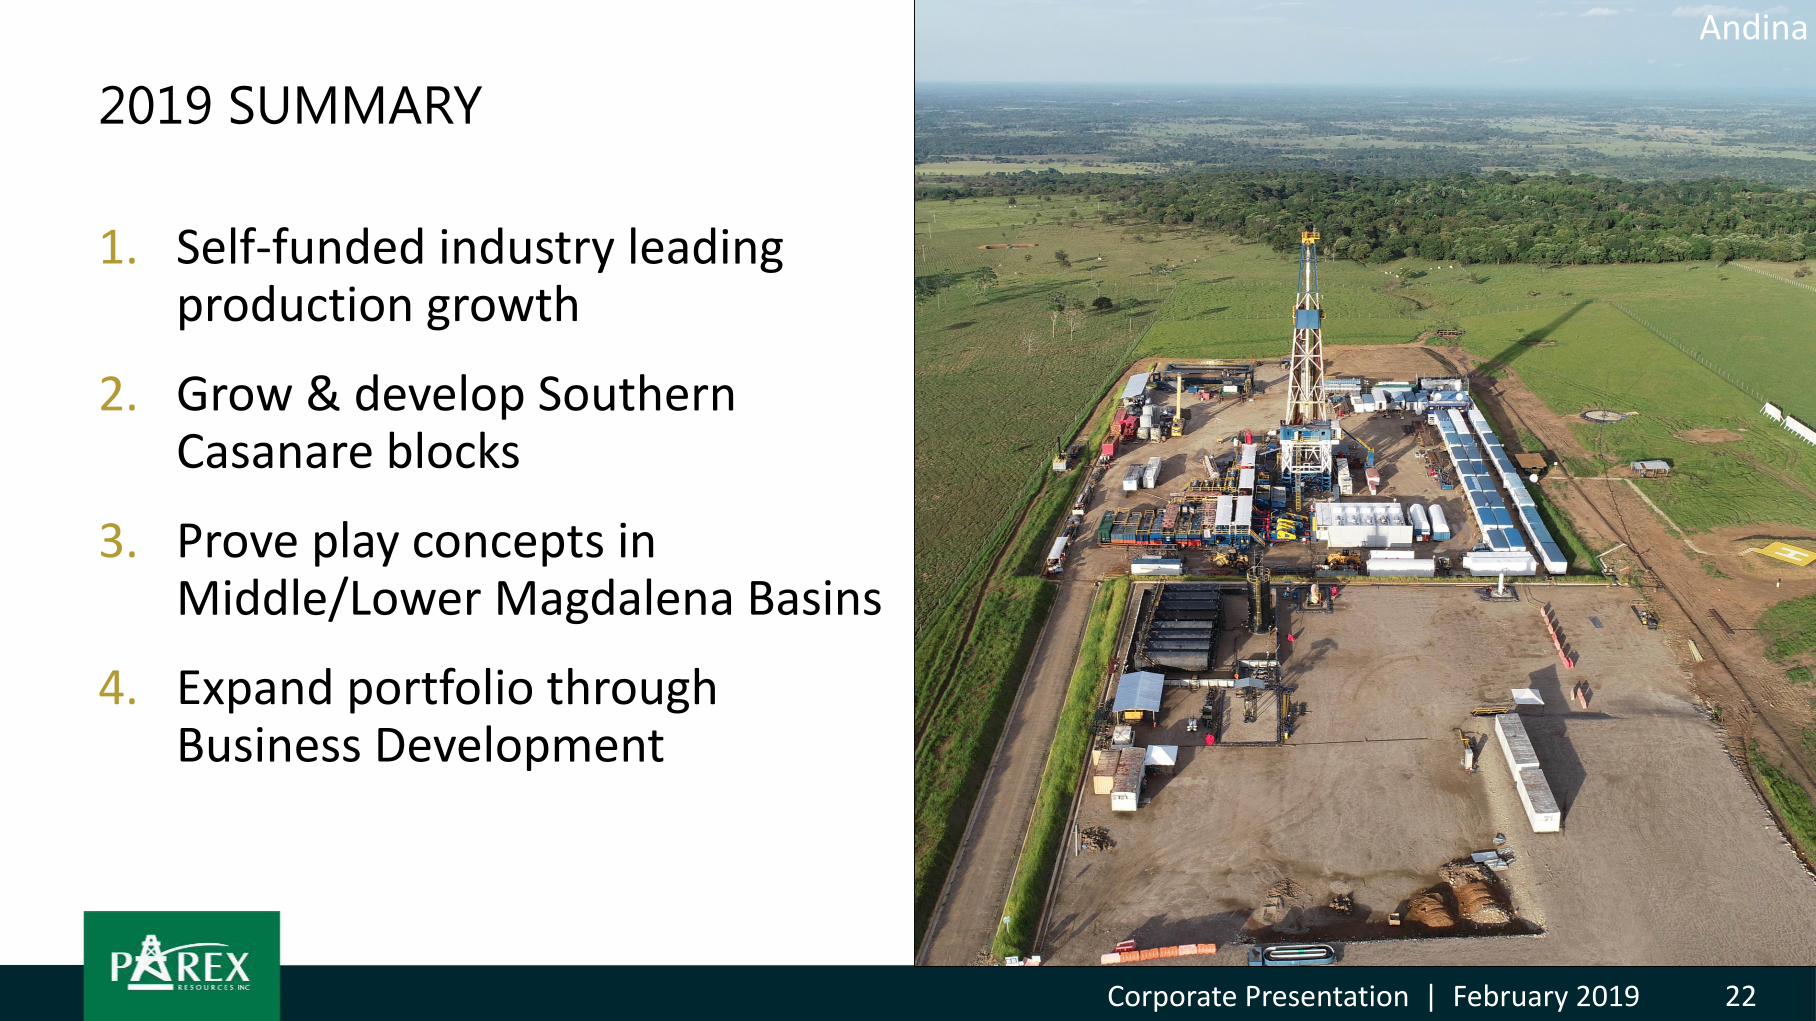
2019 SUMMARY
1. Self-funded industry leading production growth
2. Grow & develop Southern Casanare blocks
3. Prove play concepts in Middle/Lower Magdalena Basins
4. Expand portfolio through Business Development
Andina

23Corporate Presentation | March 2017Corporate Presentation | February 2019 23
APPENDIX – BLOCK SUMMARY# Block Operated/Non-Operated Working Interest Partners Gross Acres(1) Basin1 LLA-10 (2) Operated 50% Gran Tierra 189,544 Llanos
2 LLA-16 Operated 100% N/A 10,057 Llanos
3 LLA-26 Operated 100% N/A 93,376 Llanos
4 LLA-29 Operated 100% N/A 69,915 Llanos
5 LLA-30 Operated 100% N/A 117,322 Llanos
6 LLA-32 Operated 87.5% Geopark 57,040 Llanos
7 LLA-34 Non-operated 55% Geopark 63,530 Llanos
8 LLA-40(3) Operated 100% N/A 82,422 Llanos
9 Balay Non-operated 10% Perenco 4,500 Llanos
10 Cabrestero Operated 100% N/A 7,605 Llanos
11 Capachos(2) Operated 50% Ecopetrol 64,073 Llanos
12 CPO-11(2) Operated(2) 50% Hupecol Meta CCL 570,276 Llanos
13 Los Ocarros Operated 100% N/A 31,066 Llanos
14 VIM-1 Operated 100% N/A 223,651 Lower Magdalena
15 Aguas Blancas(2) Operated 50% Ecopetrol 13,386 Middle Magdalena
16 De Mares(2) Operated 50% Ecopetrol 174,387 Middle Magdalena
17 Fortuna(2) Operated 100% N/A 26,206 Middle Magdalena
18 Morpho(3) Operated 100% N/A 51,420 Middle Magdalena
19 Playon(2) Operated 50% Ecopetrol 43,200 Middle Magdalena
20 Sogamoso Operated 100% N/A 3,695 Middle Magdalena
21 VMM-9 Operated 100% N/A 152,412 Middle Magdalena
22 VMM-11(4) Operated 100% N/A 116,826 Middle Magdalena
1) Exploration properties deemed non-commercial will be relinquished in due course. Accordingly, the gross acres described above may decrease as non-commercial lands are relinquished2) Lands are subject to farm-in agreement earning terms and/or regulatory approval 3) Morpho is subject to a 4% Net Profit Interest4) The Company plans to relinquish VMM-11 in 2018.

24Corporate Presentation | March 2017Corporate Presentation | February 2019 24
APPENDIX – SUMMARY OF QUARTERLY RESULTS(1)
(1) All values are round up or down to the nearest dollar figure (2) 2017 transportation expense on a gross dollar and per boe basis were restated as a result of the Company adopting IFRS 15(3) Including a $ 137.5 million voluntary tax, Q2 2018 adjusted cash netback was $31.62 and adjusted funds flow from operations was $122 million (4) EBITDA is defined as net income (loss) + interest+ taxes + DDA + Impairment (5) Net Debt is defined as Bank Debt - Working Capital
(Unaudited Results) 2018 2017 2016
Q3 Q2 Q1 FY Q4 Q3 Q2 Q1 FY Q4 Q3 Q2 Q1
OPERATING
Production (thousands of boe/d) 45.0 42.6 40.6 35.5 39.0 36.2 34.3 32.6 29.7 31.1 29.8 29.1 28.9
Brent Price ($/bbl) 76 75 67 55 62 52 51 55 45 51 47 47 35
Average realized prices, prior to hedging ($/boe) 62 62 56 43 50 41 40 42 38 45 40 40 27
Royalties ($/boe) 9 8 7 5 6 4 4 4 3 4 3 3 2
Opex ($/boe) 5 6 5 5 5 6 5 5 5 6 5 5 5
Transportation ($/boe)(2) 3 3 4 4 4 4 4 5 12 11 12 12 12
Operating Netback ($/boe) 44 45 39 29 35 28 27 28 18 24 21 20 8
Funds Flow Netback ($/boe)(3) 37 (4) 28 22 26 20 17 23 13 19 16 13 5
FINANCIAL(millions of USD, except per share amounts)
Funds flow from operations(3)
147 (16) 101 280 94 66 52 68 144 52 45 32 16
Net income (loss) 89 189 72 155 56 56 4 40 (46) (45) 6.8 (0.2) (8)
EBITDA(4)
173 153 123 314 113 73 59 71 134 56 43 30 6
Cash and cash equivalents 361 323 295 235 235 196 203 185 149 149 132 94 92
Working Capital 143 66 206 163 163 140 128 131 93 93 118 98 80
Net Debt (Surplus)(5) (143) (66) (206) (163) (163) (140) (128) (131) (93) (93) (118) (98) (80)
Capital Expenditures 67 101 58 212 66 51 59 36 112 67 26 14 5
Bank Credit Facility 100 100 100 100 100 100 100 175 175 175 175 175 200
Weighted average shares outstanding 155 156 155 154 155 155 154 153 152 153 153 152 152
TRADING STATISTICS (CAD) – PXT(based on intra-day trading)
Share Price
High 26.78 25.70 19.87 18.46 18.46 16.14 18.19 17.73 18.22 18.22 17.40 14.61 11.96
Low 18.25 17.52 16.82 12.19 14.64 12.19 13.59 14.64 7.74 14.86 12.00 10.50 7.74
Close (end of period) 21.95 24.82 18.12 18.16 18.16 15.05 14.75 16.95 16.90 16.90 16.65 12.51 10.95
Average daily volume (thousands) 1,332 1,034 983 762 790 847 606 808 693 679 547 678 970

25Corporate Presentation | March 2017Corporate Presentation | February 2019 25
COLOMBIA – CURRENT LAND BASE
Source: ArcGIS, Parex Resources – November 2018

26Corporate Presentation | March 2017Corporate Presentation | February 2019 26
ADVISORIES HOW TO REACH USThis presentation is provided for informational purposes only as of February 7, 2019 is not complete, andmay not contain certain material information about Parex Resources Inc. ("Parex" or the "Company"),including important disclosures and risk factors associated with an investment in Parex. Thispresentation does not take into account the particular investment objectives or financial circumstancesof any specific person who may receive it and does not constitute an offer to sell or a solicitation of anoffer to buy any security in Canada, the United States or any other jurisdiction. The contents of thispresentation have not been approved or disapproved by any securities commission or regulatoryauthority in Canada, the United Sates or any other jurisdiction, and Parex expressly disclaims any duty onParex to make disclosure or any filings with any securities commission or regulatory authority, beyondthat imposed by applicable laws.
Forward-Looking Statements and FOFI
Certain information regarding Parex set forth in this document contains forward-looking statements thatinvolve substantial known and unknown risks and uncertainties. The use of any of the words "plan","expect", “prospective”, "project", "intend", "believe", "should", "anticipate", "estimate" or other similarwords, or statements that certain events or conditions "may" or "will" occur are intended to identifyforward-looking statements. Such statements represent Parex' internal projections, estimates or beliefsconcerning, among other things, future growth, results of operations, production, future capital andother expenditures (including the amount, nature and sources of funding thereof), plans for and resultsof drilling activity, business prospects and opportunities. These statements are only predictions andactual events or results may differ materially. Although the Company’s management believes that theexpectations reflected in the forward-looking statements are reasonable, it cannot guarantee futureresults, levels of activity, performance or achievement since such expectations are inherently subject tosignificant business, economic, competitive, political and social uncertainties and contingencies. Manyfactors could cause Parex' actual results to differ materially from those expressed or implied in anyforward-looking statements made by, or on behalf of, Parex.
In particular, forward-looking statements contained in this document include, but are not limited to,statements with respect to the performance characteristics of the Company's oil properties; theCompany's vision, strategy and values; Parex' estimated 2018 and 2019 capital budgets, including theexpected allocation of such budget to the number of wells and capital expenditures for each ofdevelopment/appraisal in existing fields, exploration, appraisal and maintenance;
PAREX RESOURCES INC.
2700 Eighth Avenue Place, West Tower
585 8th Avenue SW Calgary
AB T2P 1G1 Canada
Tel: 403-265-4800
Fax: 403-265-8216
Email: [email protected]
Website: www.parexresources.com
MIKE KRUCHTEN
Vice President, Capital Markets & Corporate Planning

27Corporate Presentation | March 2017Corporate Presentation | February 2019 27
ADVISORIESthe Company's forecasted 2018 and 2019 average production; the Company's estimated average daily production for full year 2018 & full year 2019; the Company's planned capital program, includinganticipated amounts focused on existing discoveries and the appraisal programs and the timing of drilling key exploration prospects, seismic programs and development drilling; anticipated cash flow, cash flowper share, funds flow from operations netback, capital expenditures, percentage of cash flow growth, cash netbacks, and funds flow from operations for 2018 and 2019; the Company's exploration, developmentand appraisal program for 2019 including anticipated number and type of wells, drill ready prospects, the focus of development/appraisal drilling and the potential for drilling of additional follow-up appraisalwells and facilities in 2019; exploration prospects; the Company's exploration schedule; the Company's drilling plans and production capability/potential; anticipated drilling locations, including the Company'sdelineation and drilling plans; the Company's plans to target additional growth opportunities; the Company's future plans for its business, including plans to complete further acquisitions and increaseproduction; financial and business prospects and financial outlook; and activities to be undertaken in various areas. Statements relating to "reserves" or "resources" are forward-looking statements, as theyinvolve the implied assessment, based on estimates and assumptions that the reserves and resources described exist in the quantities predicted or estimated and can be profitably produced in the future.
• These forward-looking statements are subject to numerous risks and uncertainties, including but not limited to, the impact of general economic conditions in Canada and Colombia; industry conditions includingchanges in laws and regulations including adoption of new environmental laws and regulations, and changes in how they are interpreted and enforced, in Canada and Colombia; competition; lack of availabilityof qualified personnel; the results of exploration and development drilling and related activities; risks related to obtaining required approvals of regulatory authorities, in Canada and Colombia and partner andcommunity approvals in Colombia; risks associated with negotiating with foreign governments as well as country risk associated with conducting international activities; volatility in market prices for oil;fluctuations in foreign exchange or interest rates; environmental risks; changes in income tax laws, tax rates and/or incentive programs relating to the oil industry; changes to pipeline capacity; ability to accesssufficient capital from internal and external sources; failure of counterparties to perform under the terms of their contracts; risk that Parex’ evaluation of its existing portfolio of assets and exploration anddevelopment opportunities is not consistent with its expectation’s; that production test results may not be indicative of long-term performance or ultimate recovery and other factors, many of which are beyondthe control of the Company. Readers are cautioned that the foregoing list of factors is not exhaustive. Additional information on these and other factors that could effect Parex' operations and financial resultsare included in reports on file with Canadian securities regulatory authorities and may be accessed through the SEDAR website (www.sedar.com).
• Although the forward-looking statements contained in this document are based upon assumptions which management believes to be reasonable, the Company cannot assure investors that actual results will beconsistent with these forward-looking statements. With respect to forward-looking statements contained in this document, Parex has made assumptions regarding, among other things: current commodityprices and royalty regimes; availability of skilled labour; timing and amount of capital expenditures; future exchange rates; the price of oil, including the anticipated Brent oil price; the impact of increasingcompetition; conditions in general economic and financial markets; availability of drilling and related equipment; effects of regulation by governmental agencies; receipt of partner, regulatory and communityapprovals; royalty rates; future operating costs; effects of regulation by governmental agencies; uninterrupted access to areas of Parex' operations and infrastructure; recoverability of reserves and futureproduction rates; the status of litigation; timing of drilling and completion of wells; on-stream timing of production from successful exploration wells; operational performance of non-operated producing fields;pipeline capacity; that Parex will have sufficient cash flow, debt or equity sources or other financial resources required to fund its capital and operating expenditures and requirements as needed; that Parex'conduct and results of operations will be consistent with its expectations; that Parex will have the ability to develop it's oil and gas properties in the manner currently contemplated; current or, where applicable,proposed industry conditions, laws and regulations will continue in effect or as anticipated as described herein; that the estimates of Parex' reserves volumes and the assumptions related thereto (includingcommodity prices and development costs) are accurate in all material respects; that Parex will be able to obtain contract extensions or fulfill the contractual obligations required to retain its rights to explore,develop and exploit any of its undeveloped properties; and other matters.
• Management has included the above summary of assumptions and risks related to forward-looking information provided in this document in order to provide shareholders with a more complete perspective onParex' current and future operations and such information may not be appropriate for other purposes. Parex' actual results, performance or achievement could differ materially from those expressed in, orimplied by, these forward-looking statements and, accordingly, no assurance can be given that any of the events anticipated by the forward-looking statements will transpire or occur, or if any of them do, whatbenefits Parex will derive. These forward-looking statements are made as of the date of this document and Parex disclaims any intent or obligation to update publicly any forward-looking statements, whether asa result of new information, future events or results or otherwise, other than as required by applicable securities laws. The forward-looking statements contained in this presentation are expressly qualified bythis cautionary statement.

28Corporate Presentation | March 2017Corporate Presentation | February 2019 28
ADVISORIES• This document also contains a financial outlook, in particular the information set forth on slides 2-3 & 5-9. Such financial outlook has been prepared by Parex' management to provide an outlook of the
Company's activities and results. The financial outlook has been prepared based on a number of assumptions including the assumptions discussed above and assumptions with respect to the costs andexpenditures to be incurred by the Company, capital equipment and operating costs, foreign exchange rates, taxation rates for the Company, general and administrative expenses and the prices to be paid forthe Company's production. Management does not have firm commitments for all of the costs, expenditures, prices or other financial assumptions used to prepare the financial outlook or assurance that suchoperating results will be achieved and, accordingly, the complete financial effects of all of those costs, expenditures, prices and operating results are not objectively determinable. The actual results ofoperations of the Company and the resulting financial results will likely vary from the amounts set forth in the analysis presented in this presentation, and such variation may be material. The Company and itsmanagement believe that the financial outlook has been prepared on a reasonable basis, reflecting the best estimates and judgments, and represent, to the best of management's knowledge and opinion,Parex's expected expenditures and results of operations. However, because this information is highly subjective and subject to numerous risks including the risks discussed above, it should not be relied on asnecessarily indicative of future results. Except as required by applicable securities laws, Parex undertakes no obligation to update such financial outlook.
Oil and Gas Information
• The estimates of Parex' December 31, 2018 reserves set forth in this presentation have been prepared by GLJ Petroleum Consultants Ltd. ("GLJ") as of December 31, 2018 with a preparation date of February7, 2019 (the "GLJ 2017 Report") in accordance with National Instrument 51-101 – Standards of Disclosure for Oil and Gas Activities ("NI 51-101") and the Canadian Oil and Gas Evaluations Handbook (the"COGEH") and using GLJ's forecast prices and costs as at January 1, 2019. The estimates of Parex' December 31, 2017 reserves set forth in this presentation have been prepared by GLJ as of December 31, 2017with a preparation date of February 2, 2018 in accordance with NI 51-101 and the COGEH and using GLJ's forecast prices and costs as at January 1, 2018. The estimates of Parex' December 31, 2016 reservesset forth in this presentation have been prepared by GLJ as of December 31, 2016 with a preparation date of February 6, 2017 in accordance with NI 51-101 and the COGEH and using GLJ's forecast prices andcosts as at January 1, 2017. The estimates of Parex' December 31, 2015 reserves set forth in this presentation have been prepared by GLJ as of December 31, 2015 with a preparation date of February 5, 2016in accordance with NI 51-101 and the COGEH and using GLJ's forecast prices and costs as at January 1, 2016. The estimates of Parex' December 31, 2014 reserves set forth in this presentation have beenprepared by GLJ as of December 31, 2014 with a preparation date of February 13, 2015 in accordance with NI 51-101 and the COGEH and using GLJ's forecast prices and costs as at January 1, 2015.
• “Proved" or "1P" reserves are those reserves that can be estimated with a high degree of certainty to be recoverable. It is likely that the actual remaining quantities recovered will exceed the estimated provedreserves.
• "Probable" reserves are those additional reserves that are less certain to be recovered than proved reserves. It is equally likely that the actual remaining quantities recovered will be greater or less than thesum of the estimated proved plus probable" reserves.
• “Possible” reserves are those additional reserves that are less certain to be recovered than probable reserves. There is a 10 percent probability that the quantities actually recovered will equal or exceed thesum of proved plus probable plus possible reserves. It is unlikely that the actual remaining quantities recovered will exceed the sum of the estimated proved plus probable plus possible reserves.
• "2P" means Proved Plus Probable reserves.
• "3P" means Proved Plus Probable Plus Possible reserves.
• Estimates of the net present value of the future net revenue from Parex' reserves do not represent the fair market value of Parex' reserves. The estimates of reserves and future net revenue from individualproperties or wells may not reflect the same confidence level as estimates of reserves and future net revenue for all properties and wells, due to the effects of aggregation.

29Corporate Presentation | March 2017Corporate Presentation | February 2019 29
ADVISORIES• This presentation contains certain oil and gas metrics, including F&D, FD&A, FD&A/boe, reserves life index (or RLI), operating netbacks, cash netbacks, funds flow from operations netback, CAGR, and recycle
ratios, which do not have standardized meanings or standard methods of calculation and therefore such measures may not be comparable to similar measures used by other companies and should not beused to make comparisons. Such metrics have been included herein to provide readers with additional measures to evaluate the Company's performance; however, such measures are not reliable indicators ofthe future performance of the Company and future performance may not compare to the performance in previous periods and therefore such metrics should not be unduly relied upon. Management usesthese oil and gas metrics for its own performance measurements and to provide investors with measures to compare the Company's operations over time.
• Readers are cautioned that the information provided by these metrics, or that can be derived from the metrics presented herein, should not be relied upon for investment or other purposes. A summary of thecalculations of such metrics are as follows:
o Finding and development (“F&D”) costs are calculated by dividing capital expenditures by the change in reserves within the applicable reserves category. F&D costs, including FDC, include all capitalexpenditures in the year as well as the change in FDC required to bring the reserves within the specified reserves category on production.
o Finding, development and acquisition ("FD&A”) costs represent the costs of property acquisition, exploration, and development incurred. The aggregate of the exploration and development costsincurred in the most recent financial year and the change during that year in estimated future development costs generally will not reflect total finding and development costs related to reservesadditions for that year.
o FD&A costs are calculated as capital expenditures plus net acquisition costs plus change in FDC. FD&A per boe is calculated as FD&A costs divided by reserves additions for the applicable period.
o Reserves life index is calculated by dividing the applicable reserves category by the annualized fourth quarter production.
o Funds Flow from Operations per boe is calculated by dividing Funds Flow from Operations by sales volume for the period.
o Operating netback is calculated as oil & gas revenue less expenses (royalties, production and transportation) divided by production for the period.
o CAGR is calculated as:
i. (2018E debt adjusted production per share divided by 2014 debt adjusted production per share)1/4 – 1, and
ii. (2018 2P reserves per share divided by 2014 2P reserves per share)1/4 - 1
• "BOEs" may be misleading, particularly if used in isolation. A BOE conversion ratio of six thousand cubic feet of natural gas to one barrel of oil equivalent (6 mcf: 1 bbl) is based on an energy equivalencyconversion method primarily applicable at the burner tip and does not represent a value equivalency at the wellhead. Given that the value ratio based on the current price of crude oil as compared to naturalgas is significantly different from the energy equivalency of 6:1, utilizing a conversion on a 6:1 basis may be misleading as an indication of value.
• All of Parex’ crude oil reserves disclosed herein are located in Colombia. The Company has light, medium and heavy crude oil and natural gas liquids product types. The recovery and reserve estimates ofreserves provided in this document are estimates only, and there is no guarantee that the estimated reserves will be recovered. Actual reserves may eventually prove to be greater than, or less than, theestimates provided herein. All evaluations and reviews of future net revenue contained in GLJ's reports are stated prior to any provision for interest costs or general and administrative costs and after thededuction of royalties, development costs, production costs, well abandonment costs and estimated future capital expenditures for wells to which reserves have been assigned.
• Certain information in this document may constitute "analogous information" as defined in NI 51-101. Such information includes production estimates, drilling results, test rates, reserves estimates and otherinformation retrieved from other publicly available sources. Management of Parex believes the information is relevant as it may help to define the reservoir characteristics and production profile of lands inwhich Parex may hold an interest. Parex is unable to confirm that the analogous information was prepared by a qualified reserves evaluator or auditor and is unable to confirm that the analogous information
30Corporate Presentation | March 2017Corporate Presentation | February 2019 30
ADVISORIES
was prepared in accordance with NI 51-101. Such information is not an estimate of the production, reserves or resources attributable to lands held or to be held by Parex and there is no certainty that theproduction, reserves or resources data and economic information for the lands held or to be held by Parex will be similar to the information presented herein. The reader is cautioned that the data relied uponby Parex may be in error and/or may not be analogous to such lands held or to be held by Parex.
• Certain other information contained in this presentation has been prepared by third-party sources, which information has not been independently audited or verified by Parex. No representation or warranty,express or implied, is made by Parex as to the accuracy or completeness of the information contained in this document, and nothing contained in this presentation is, or shall be relied upon as, a promise orrepresentation by Parex.
• This presentation contains references to type well production and economics, which are derived, at least in part, from available information respecting the well economics of other companies and, as such,there is no guarantee that Parex will achieve the stated or similar results, capital costs and return costs representative per well.
• References in this presentation to initial production test rates, initial "flow" rates, initial flow testing, and "peak" rates are useful in confirming the presence of hydrocarbons, however such rates are notdeterminative of the rates at which such wells will commence production and decline thereafter and are not indicative of long term performance or of ultimate recovery. While encouraging, investors arecautioned not to place reliance on such rates in calculating the aggregate production for Parex. Parex has not conducted a pressure transient analysis or well-test interpretation on the wells referenced in thispresentation. As such, all data should be considered to be preliminary until such analysis or interpretation has been done.
Financial Matters
• The Company discloses several financial measures that do not have any standardized meaning prescribed under International Financial Reporting Standards ("IFRS"). These financial measures includeoperating netbacks, cash netbacks, funds flow netbacks, funds flow per share, free cashflow, and funds flow from operations. Management believes that these financial measures are useful supplementalinformation to analyze operating performance and provide an indication of the results generated by the Company’s principal business activities. Investors should be cautioned that these measures should notbe construed as an alternative to net income or other measures of financial performance as determined in accordance with IFRS. Parex’s method of calculating these measures may differ from othercompanies, and accordingly, they may not be comparable to similar measures used by other companies. Please see the Company’s most recent Management’s Discussion and Analysis, which is available atwww.sedar.com for additional information about these financial measures.

31Corporate Presentation | March 2017Corporate Presentation | February 2019 31