disclaimer a journal devoted to railway …irieen.indianrailways.gov.in/uploads/files/irieen journal...
TRANSCRIPT
A JOURNAL DEVOTED TO RAILWAY ELECTRICAL ENGINEERINGA JOURNAL DEVOTED TO RAILWAY ELECTRICAL ENGINEERING
otjYee<e : (0253) 2407499, 2407399
HewÀkeÌme : (0253) 2462548
F&-cesue : [email protected]
JesyemeeFì : www.irieen.indianrailways.gov.in
A JOURNAL DEVOTED TO RAILWAY ELECTRICAL ENGINEERINGA JOURNAL DEVOTED TO RAILWAY ELECTRICAL ENGINEERINGA JOURNAL DEVOTED TO RAILWAY ELECTRICAL ENGINEERINGA JOURNAL DEVOTED TO RAILWAY ELECTRICAL ENGINEERING
VOL. 25 No. 3 July - September 2014
DISCLAIMERThe views contained in articles published in this
journal are the views of Authors and not of IRIEEN
aPrinted by : B. P. Verma, Dy. Chief Manager, Printing & Stationery, Central Railway Printing Press, Byculla, Mumbai-27.

India Railways Institute of Electrical Engineering, Nasik Road
Jee@u³etce ë 25pegueeF& - j 2014efmelecye DebkeÀ ë 3
Yeejleer³e jsue efJeÐegle Fbpeerefve³eefjbie mebmLeeve, veeefmekeÀ jes[
( jsue efJeÐegle keÀe³ee&ue³ees ces efveMegëukeÀ efJelejCe nsleg )
mebj#ekeÀÞeer. [er. jeceemJeeceer
efveosMekeÀ
keÀe³e&keÀejer mebHeeokeÀÞeer efovesMe kegÀceej
Je. He´eO³eeHekeÀ (ìerSue De@C[ Smeer)
men-mebHeeokeÀÞeer Jemeble kegÀceejve
mene.ie´b. SJeb met.DeefOekeÀejer
PLEASE ACKNOWLEDGE AFTER RECEIVING THE JOURNAL
FRONT COVER : IRIEEN MAIN BUILDING
uesKeeW ceW efo³es ie³es efJe®eej uesKekeÀ kesÀ nQ, Fjerve kesÀ veneR~ VIEWS EXPRESSED IN ARTICLES ARE OF AUTHORS, NOT OF IRIEEN
uesKe mebHeke&À SJeb He$ee®eej nsleg Helee
Fjerve Hees. yee@. veb. 223
veeefmekeÀ jes[ - 422 101
otjYee<e :(0253) 2407499, 2407356 HewÀkeÌme : (0253) 2462548
F&-cesue : [email protected] JesyemeeFì : www.irieen.indianrailways.gov.in
efveosMekeÀ
•
India Railways Institute of Electrical Engineering, Nasik Road
Fvmeguesìj - Þeer efJekeÀeme yeOesue, keÀ. DevegJeeokeÀ, Fjerve, veeefmekeÀ jes[ ............................................................................. 38
(mebkeÀueve - Þeer Heer. Sme. {esieue)
• mebHeeokeÀer³e ............................................................................................................................................................................................................... 1
• ....................................................................................... 2SELF GENERATION Vs END ON GENERATION SYSTEMS
Cost Benefit Analysis Specific to LHB Rakes - By : Shri Dinesh Kumar, Sr. Prof. / IRIEEN / Nasik Road
USE OF SOLAR POWER IN PASSENGER COACHES• ............................................................................................... 14
Green Initiative on Rail Coaches - By : Shri Sudhir Garg, CESE / NR
COST OF ELECTRIC TRAIN OPERATION• ................................................................................................................... 17
Sensitivity Analysis - ECRly Perspective - By : Shri A. K. Chattopadhyay, CELE / ECR
• ............................. 30SAFETY SYSTEMS PROVIDED IN TUNNEL T-23 AND T-25 ON UDHAMPUR-KATRA SECTION
An Illustration - By : R. K. Chaudhary, CEE / USBRL Project

IRIEEN JOURNAL VOL-24, NO.3, 2014 IRIEEN JOURNAL VOL-24, NO.3, 2014
12. EMU Technology in Indian Railways - Rs. 250/-
140 1

IRIEEN JOURNAL VOL-24, NO.3, 2014 IRIEEN JOURNAL VOL-24, NO.3, 2014
SELF GENERATION Vs. END ON GENERATION SYSTEMSCOST BENEFIT ANALYSIS SPECIFIC TO LHB RAKES
1.0 INTRODUCTION
1.1 Power supply systems for passenger trains
Power Supply systems in use at present for the IR passenger trains are Self Generation (SG) System, End On Generation (EOG) system and Head on Generation (HOG) system. Out of these , SG and EOG systems are predominant. While fully air-conditioned trains like Rajdhani, Shatabadi and Duronto trains, mainly use EOG systems, the conventional Mail/Express and Passenger trains use SG system.
In EOG system , full train load (Hotel load) is fed in bulk by DA sets installed on Generator vans on train ends. In SG system, load of each coach is independently catered by axle driven brushless alternators mounted on coach bogies. In HOG system, traction power available in locomotive is appropriately converted and utilized for train load.
End on Generation (EOG) rakes, are now mostly using LHB design coaches which have numerous superior technical and commercial features. Owing to superior features, there are plans to expeditiously switch over to 100% LHB design coaches .
1.2 Mixed Mail/Express trains on EOG system
Of late, IR have decided to run LHB design EOG coaches in mixed mail/express trains consisting of both AC and TL coaches, apart from in ful ly air-condit ioned Rajdhani/Shatabadi/Duronto trains.
2.0 NEED FOR COST BENEFIT ANALYSIS OF LHB SG VS LHB EOG SYSTEM FOR MIXED TRAINS
Prima facie, running of EOG mixed trains appears to the
costly preposition. However, from the cost benefit analysis done in this article, it can be seen that there is no appreciable financial difference between two systems.
3.0 METHODOLOGY FOR COST BENEFIT ANALYSIS
A rake of mixed Mail/Express EOG train generally has 22 coaches, out of which 5-7 coaches are Air Conditioned coaches. Thus, cost benefit analysis, as per following rake composition has been considered –
SG System - 5 AC + 15 Non AC + 2 SLR (22 coaches)
EOG System - 5 AC + 15 Non AC + 2 Power Car (22 coaches)
Overall cost of a system (SG/EOG), broadly depend on the cost of equipment, cost of maintenance, weight of the equipment/ haulage cost (based on the comparative weight), cost of electrical energy, passenger carrying capacity etc.
Cost benefit analysis for both the Power Supply systems (SG and EOG) has been thus done based on the following –
(i) Life cycle capital cost of equipment.
(ii) Overall weight/haulage cost based on their comparative weight.
(iii) Cost of electrical energy for the connected load of the rake.
(iv) Cost impact on account of passenger carrying capacity.
(v) Maintenance cost
(vi) Cost impact of escorting staff.
Dinesh KumarSr. Prof./IRIEENNasik Road
As can be inferred from the above data, for AC coach, electrical equipment cost in SG system is higher than the cost in EOG system both in terms of initial cost as well as life cycle cost.
System Equipment exclusive to the system
Cost per coach(In Rs. Lakhs)
No. of replacements during coach
life
Life cycle cost (In Rs. Lakhs)
SG
2x30 kW PM Alternator & Accessories + Controller with battery charger
22
2.5
55
2X25 kVA Inverter
9.2
2
18.4
2X650 Ah Battery
12
7.5
90
Total
43.2
163.4
EOG
ZS Coupler
2.4
2
4.8
Feeder Junction box
1.19
2
2.38
Feeder cables with AL. conduits
2.1
2.5
5.25
70 Ah Battery
0.66
7.5
4.95
60 kVA Transformer
2.3
2
4.6
RCB+ECB
1.16
3
3.48
Total
9.81
25.46
Cost difference (SG-EOG)
33.39
137.94
4.0 COST BENEFIT ANALYSIS – LHB SG vs. EOG SYSTEMS
4.1 Life cycle Capital cost of Electrical & AC equipment
Life cycle capital cost of the equipment which are exclusive to two systems under comparison has been considered and cost of the common equipment has not been taken into account for the analysis.
(a) For AC Coaches
32

IRIEEN JOURNAL VOL-24, NO.3, 2014 IRIEEN JOURNAL VOL-24, NO.3, 2014
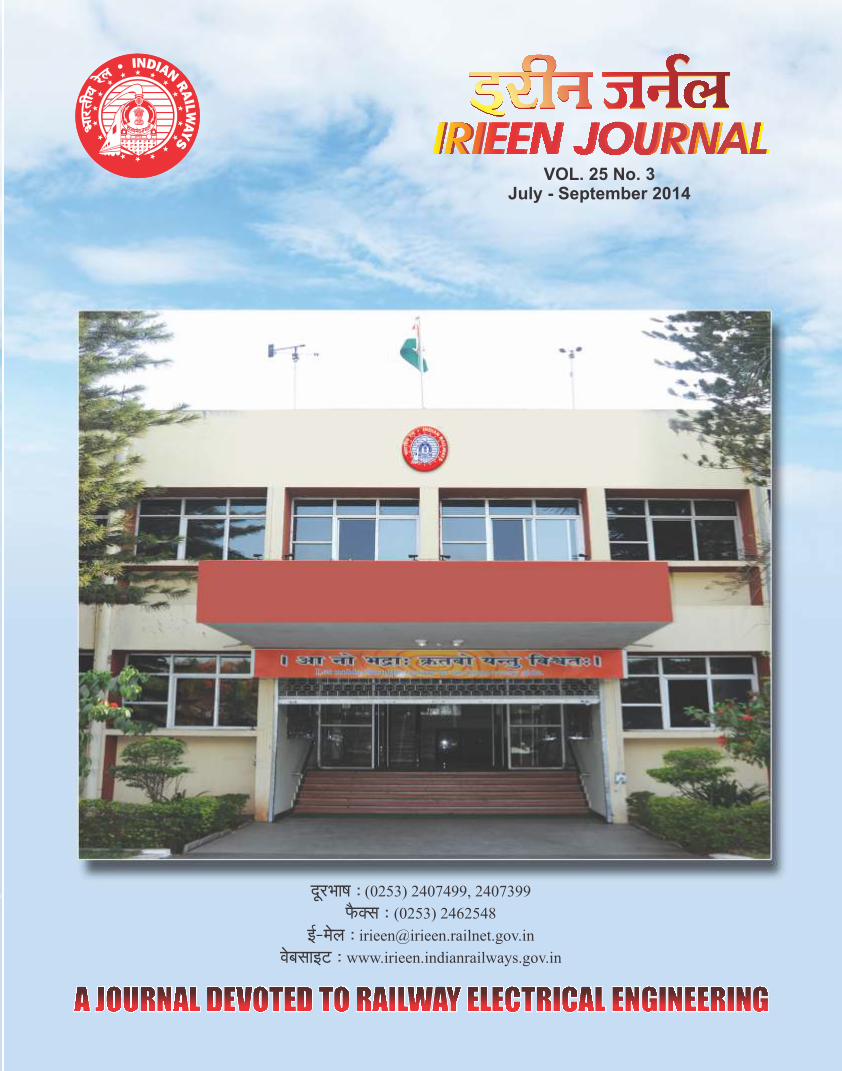
(b) For Non AC Coaches
As can be inferred from the above data, for Non- AC coach, electrical equipment cost in SG system is less than the cost in EOG system both in terms of initial cost as well as life cycle cost.
Note:
1. For LHB SG AC coaches, 30 kW permanent magnet alternator has been under development, as the conventional 25 kW alternator can not be mounted on FIAT bogie. Similarly, 2 sets of 650 Ah VRLA battery sets are necessary, as permanent magnet alternators are not designed to work in parallel.
2 Equipment for SGAC and non AC EOG coaches are at present under development.
Costs of these equipment thus appear to be on higher side. Costs are expected to come down with the bulk manufacturing of such coaches.
System
Equipment exclusive to the system
Cost per coach(In Rs. Lakhs)
No. of replacements
during coach life
Life cycle cost(In Rs. Lakhs)
SG
4.5 kW Alternator+Belt+ RRU
1.25
2.5
3.125
Fuse cum rotary switch panel
0.1
2.5
0.25
Total
1.35
3.375
EOG
ZS Coupler
2.4
2
4.8
Feeder Junction box
1.19
2
2.38
Feeder cables with AL. conduits
2.1
2.5
5.25
Switch board cabinet (Underslung)
3.35
2.5
8.375
9 kVA Transformer 1.05 2 2.1
RBC 0.83 3 2.49
Total 10.92 25.395
Cost difference (SG-EOG)
-9.57
-22.02
(c) For Power Cars/SLR Coaches
As can be inferred from the above data, for SLR coach, electrical equipment cost in SG system is less than the cost in Power car of EOG system, both in terms of initial cost as well as life cycle cost.
Note : For mixed EOG train, only one DA set per power car would be adequate. Analysis has therefore been done with only 1 DA set per Power Car.
System Equipment exclusive to the system
Cost per coach(In Rs. Lakhs)
No.of replacements during coach
life
Life cycle cost
(In Rs. L akhs )
SG
4.5 kW Alternator+Belt+RRU
1.25
2.5
3.125
Fuse cum rotary switch panel
0.1
2.5
0.25
Total
1.35
3.375
EOG
1X500 k VA DA S ets
35
2
70
DA set control panel and accessories
12.5
2
25
Switch board cabinet and other equipment
10
1
10
RMPU with controller
6
1
6
2X60 kVA Transformer
4.56
2
9.12
ZS Coupler
2.4
2
4.8
Feeder Junction box
1.19
2
2.38
Feeder cables with AL.conduits
2.1
2.5
5.25
Total
73.75
132.55
Cost difference
(SG -EOG)
-72.40
-129.18
54

IRIEEN JOURNAL VOL-24, NO.3, 2014 IRIEEN JOURNAL VOL-24, NO.3, 2014
(d) Life cycle capital cost for a rake
Type of coach Life cycle cost (in Rs Lakhs)
Cost Difference
in Rs. lakhs
[SG-EOG]
SG System EOG System
Per
Coach
Per rake Per
Coach
Per rake
AC (5 Nos)
163.4
817.00
25.46
127.30
689.7
N on AC (15 Nos)
3.375
50.63
25.395
380.93
-330.3
SLR/Power Car (2 Nos)
3.375
6.75
132.55
265.10
-258.35
Total
874.38
773.33
Life cycle capital cost difference
(SG-EOG)
-101.05
From the above, it may be seen that cost of the equipment in a rake specific to the systems is dependent on the number of AC coaches in the rake. Even for a rake having coach composition as 5 AC+15 Non AC+2 Power Car (with single DA set each)/SLR, the cost of equipment on the life cycle basis for EOG system is lower by Rs. 101.05 lakhs.
4.2 Overall weight/Haulage Cost
Weight of the equipment exclusive to two systems under comparison has been considered and weight of the equipment which are common to both the systems has not been taken into account for the analysis.
(a) For AC Coaches
Equipment exclusive to SG System
Weight (in Tonnes)
Equipment exclusive to EOG System
Weight(in Tonnes)
2x30 kW PM Alternator &
Accessories + Controller
with battery charger
1.44
ZS Coupler
0.1 0
2X25 kVA Inverter
0.98
Feeder Junction box
0.13
2X650 Ah Battery
5.28
Feeder cables with
AL. conduits
0.33
70 Ah Battery
0.24
60 kVA Transformer
0.45
RCB+ECB
0.1 0
Total 7.7 0 1.35
Weight difference (SG-EOG) 6.35
(b) For Non AC Coaches
(C) For Power cars/SLR Coaches
Equipment exclusive to SG
System
Weight
(in Tonnes)
Equipment exclusive to
EOG System
Weight
(in Tonnes)
4.5 kW Alternator +Belt + RRU 0.50 ZS Coupler 0.10
Fuse cum rotary switch panel 0.01 Feeder Junction box 0.13
Feeder cables with AL.
conduits 0.33
Switch board cabinet
(Underslung) 0.27
9 kVA T ransformer 0.20
RBC 0.06
Total 0.51 1.09 Weight difference (SG-EOG) -0.58
Equipment LHB SG SLR with 2x4
Tonnes Luggage (in Tonnes)
LHB EOG Power Car with 4 Tonnes Luggage(in Tonnes )
Each coach Weight 39 55 Weight per Rake 78 110 Weight difference (SG-EOG) per Rake
-32
Type of coach Overall weight (in Tonnes)
Weight
Difference
[SG-EOG]
In Tonnes
SG SYSTEM EOG SYSTEM
Per Coach
Per rake Per Coach
Per rake
AC (5) 7.7 38.50 1.35 6.75 31.75
NON AC (15)
0.51 7.65 1.09 16.35 -8.70
SLR/Power Car (2)
39 78 55 110 -32
TOTAL 124.15 133.10 Weight difference of a rake (SG-EOG)
-8.95
(D) Overall weight of a rake
76

IRIEEN JOURNAL VOL-24, NO.3, 2014 IRIEEN JOURNAL VOL-24, NO.3, 2014
Weight of the equipment for a rake (SG or EOG) would be dependent on the number of AC coaches in a rake. For a rake with considered composition and with 1 DA set per Power car, the overall weight of equipment for EOG system is higher by 8.95 Ton.
(E) Haulage cost for weight difference
As overall weight of the rake in EOG configuration is higher, the haulage cost in EOG system shall be more vis-à-vis SG system.
Haulage cost calculation are given as under:-
Haulage cost per Annum = Wt. in Tonnes x Av. Kms. earned/ day x No. of trips/ Month x 12 xSp. Energy consumption (KWH/ 1000 GTKm) x rate of Electrical traction energy (Rs./ KWH)
Difference in Weight (SG-EOG ) of the rake a1 -8.95 Tonnes
Coach km per day a2 558 km
No. of trips per month a3 24 trips/month
Cost of Electric Traction (2013-14) a4 Rs 6.90 per kwh
Specific Energy consumption (SEC) kwh / 1000 GTKM a5 18.9 kwh/1000 GTKM
Difference in haulage cost per rake -Rs. 1.87 Lakhs (a1*a2*a3*a4*a5*12/1000) (SG-EOG)
Note: Overall weight and Haulage cost of EOG rake will however reduce if number of AC coaches are increased.
4.3 Cost of electrical energy for the rake connected load
(a) Connected load details
Type of coaches
No. of coaches
per rake
Connected load of the Rake
(in kW)
SG EOG
SG EOG
Per C oach Per
Rake
Per
coach Per Rake
AC 5 5 48 240 37.5 187.5
NON AC 15 15 2.24 33.6 2.24 33.6
SLR 2 0 2.24 4.48 0
POWER CAR 0 2 0 60.5 121
Total 22 22 278.08 342.1
(b) Electrical energy cost of the Rake
Per unit cost of electricity for SG system - Rs. 12.23Per unit cost of electricity for EOG system - Rs. 16.31
System
Connected
load
Load with 0.8
Diversity factor
Annual en ergy
consumption
( in KWh)
Annual energy cost
(In Rs lakhs)
SG 278.08 222.46 798307.62 97.63
EOG 342.10 273.68 982095.21 160.18
Energy Cost Difference (SG-EOG) -183787.59 -62.55
With the assumption that only for a period of 70% in a year, air conditioning (which constitutes major portion of the connected load) will work.
It may be seen that annual energy consumption in EOG system will be higher than the SG system mainly owing to Power cars. Energy cost of rake in EOG configuration shall be higher by Rs. 107.57 lakhs per annum vis-à-vis SG configuration.
Calculation details for electrical energy cost
Annual energy consumption for the rake = Connected load Diversity factor (DF) Hrs per day (17.8 ) No. of trips per month (24 ) 12
Per unit energy cost for SG and EOG system
For SG SYSTEM
Traction Energy cost 6.9 Rs/unit
Net Efficiency of SG System [i.e. 0.98 (traction transformer effy.) 0.5643
* 0.90 (loco effy) * 0.90(draw bar effy.) * 0.90 (V belt effy.)
* 0.85 (PM alternator effy.) * 0.93(inverter effy.)]
Per unit cost i.e. Traction Energy Cost/System Efficiency 12.23 Rs.
For EOG System
SFC of diesel engine for power car engine ( 160 Grm./BHP/hr) 0.16kg/bhp/Hr
Specific gravity of fuel 0.82 Kg/Ltr
Alternator efficiency 0.9
98

IRIEEN JOURNAL VOL-24, NO.3, 2014 IRIEEN JOURNAL VOL-24, NO.3, 2014
1 BHP 0.746 KW
Fuel consumption (ltr/kwh of electricity generated =
0.160/(0.82 0.9 .746) 0.29 Ltr/kwh * *
Cost of HSD oil 55 Rs./Ltr
Cost of fuel in Rs.per KWH 15.98 Rs./Kwh
Per unit cost of electricity with transformer efficiency 0.98 16.31
Note:
1. Cost of energy generated in EOG system is directly dependent on cost of HSD , rates of which are widely varying presently.
4.4 COST IMPACT ON ACCOUNT OF PASSENGER CARRYING CAPACITY
4.4.1 There shall be reduction in the passenger carrying capacity of the rake in EOG configuration by dint of using two Power Cars (with luggage compartment of 4 T). While in SG system, replacement of two Power Cars with two SLR coaches (having 6 T luggage compartment in each) will enhance the passenger carrying capacity of the rake atleast by 80 passengers (40 passenger per SLR).
Thus, there shall be additional earning in SG system for additional carrying capacity as under:-
Increase in Berths in SG rake formation on account of SLRs in place of Power cars a1 80 Nos.
Avg. Per day per SLR coach 558 Km
No. of trips /Month a2 24
Fare /Paggenger for 558 Kms for SLR coach a3 164 Rs.
Difference in earning /Rake/Annum (a1 a2 a3 12) -37.78 Rs. (in lakhs)* * *
4.4.2 IOH / POH Schedules
IOH and POH interval of LHB EOG coaches is twice of SG coaches and also cycle time of IOH and POH coaches of LHB (EOG) is relatively less. It means, these coaches will be available for service for about 12 days more per year as compared to SG coaches.
Impact of additional availability on earnings is given below:
Type of coach
Number of
coaches per rake Earnings per
annum per coach
(in Lakhs)
Proportionate 12
days earning per
coach type
Proportionate
earning per rake
(in Lakhs)
AC coaches 5
126
4.14
20.71
Non AC coaches 15 66.12 2.17 32.55
Total 53.26
*Assumed to be 90% of Non AC (SG)
4.5.1 It is pertinent to mention here that with the introduction of EOG rakes , staff requirements on account of train passing duties will also get reduced substantially. However ,it could not be quantified for the want of data.
4.5.2 Maintenance cost on account of spares/consumables for two systems under comparison can reasonably be considered same.
4.4.3 Moreover, if space released by 1 DA set in each Power car is converted into additional luggage room , it is expected to fetch annual revenue to the tune of Rs 28.80 lakhs. (@ Rs 5000 per trip per Power car).
4.4.4 Besides the above one more factor which goes in favour of EOG system is manufacturing cycle time of EOG rake which will be less than SG rake. However, it has not been possible to quantify it for the want of authentic data from production units.
Note:1. Since for mixed train, only one DA set per power car will suffice the load requirements, it would be feasible to remove
one of the DA set from power car and convert released space into luggage compartment. 2. It would not be advisable to consider passenger accommodation in power car from passenger comfort point of view.
4.5 MAINTENANCE COST
Maintenance cost has following two components. i) Men power cost ii) Spares/consumables cost
Comparison of Men power requirements for Primary and secondary maintenance of two system's coaches as per prevalent yardsticks of Railway Board is as under
Type of Coach
Yardsticks Number of coaches per rake
Staff requiredper rakePrimary Secondary Total
SGAC (RMPU) 1.4 0.70
2.1
5
1 0.5
EOG AC (RMPU) 1.0 0.50 1.50 5 7.50
Non AC (SG) 0.30 0.15 0.45 17 7.65
Non AC (EOG) * 0.27 0.13 0.40 15 6.00
Power Car 1.2 1.2
2
2.4
Difference in staff requirements per rake (SG -EOG )= 18.15 -13.50 = 4.65
Cost implications of maintenance staff per rake ( SG -EOG)= 4.65x5=23.25 Lakhs
1110
IRIEEN JOURNAL VOL-24, NO.3, 2014 IRIEEN JOURNAL VOL-24, NO.3, 2014
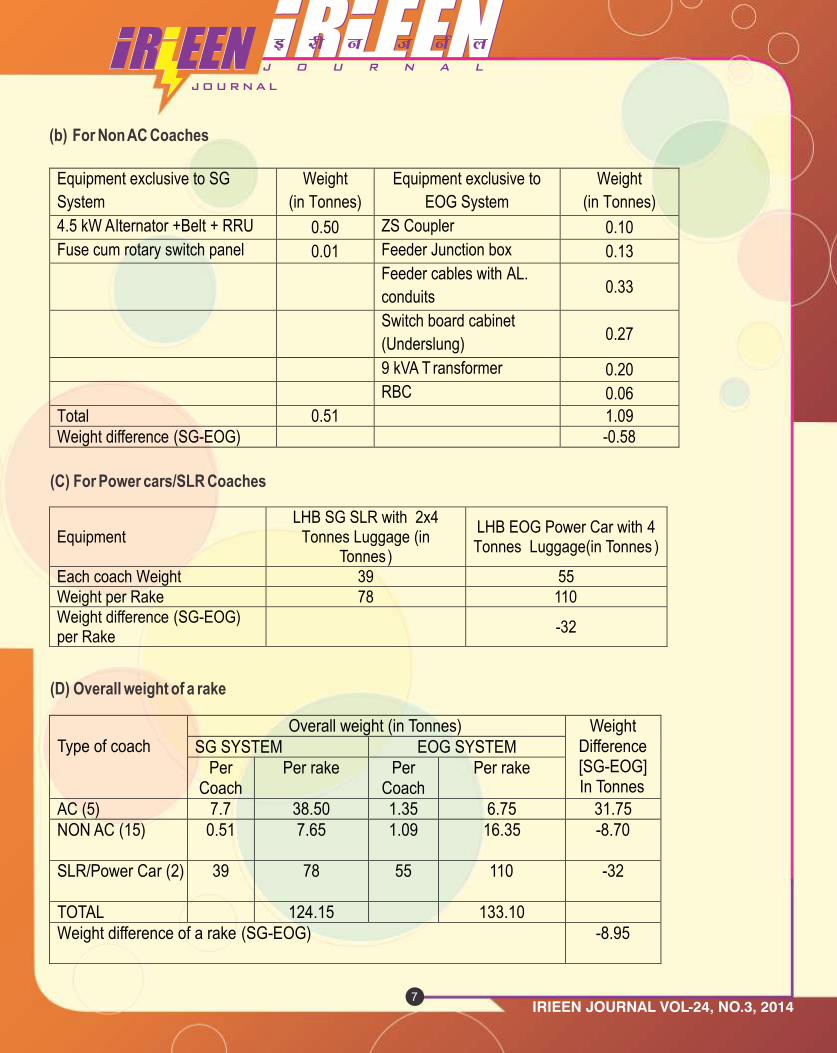
4.6 COST IMPACT OF ESCORTING STAFF FOR EOG RAKEIn EOG configuration of the rake, additional staff shall be required for manning of Power Cars. Cost impact of additional escorting staff is given as under:-
Minimum No. of persons employed for running of two power cars 04Average No. of persons per rake employed taking into account rest, leave, working roster, etc. 06Number of AC mechanics not required in EOG system 02Average wage per employee including TA & other allowances Rs. 5 LakhsCost of additional escorting staff for power cars in EOG system Rs. 20 Lakhs
Note:i) AC mechanics deputed on SG coaches @ 1 per 3-4 coaches can be merged with power car escorting staff in
EOG system. ii) Staff requirements for Primary and Secondary maintenance will get reduced as brought out in para 4.5iii) There will also be reduced requirement of train passing duty staff in case of running of EOG rakes.
5.0 COMPARATIVE SUMMARY (per annum) (All figures in Lakhs Rs.)
SG systemEOG
system Variation (SG-EOG)
Life cycle cost 29.15 25.78 3.37
Haulage cost - 1.87 - 1.87
Electrical energy cost 97.63 160.18 - 62.55
Impact on Earnings
Passengers in SLRs 37.78 - 37.78
Additional luggage in Power cars
- 28.80 28.80
Increased availability due to reduced IOH/POH 53.26 53.26
Savings in Maintenance/
escorting Man power
20.00 23.25 - 3.25
Net 69.00 82.51 - 13.51
As can be seen from the above, there is meager financial gap of Rs 13.51 Lakhs per annum per rake between two systems. Even this gap of Rs 13.51 Lakhs (in favour of SG system) will get bridged, if following is duly evaluated financially in respect of EOG system;
i. Reduced man power required for the manufacturing of EOG coaches
ii. Elimination of train passing duty staff
iii. Cost of converting SG coaches into HOG system coaches subsequently on adoption of HOG system
iv. Increase in average speed of the trains (max speed of EOG mixed train can be upto 130 kmph)
v. Separate provision of AC mechanics (@2 per rake) is not required in EOG rakes as their duties can be entrusted to Power car escorting staff
vi. Provision of enhanced passenger amenities like mini pantry etc in EOG system
6.0 CONCLUSIONS/SUGGESTIONS
1. EOG system is comparable with SG system on all accounts except cost of energy which can be reduced to some extent by introducing CNG for DA sets.
2. Since EOG coaches are fit to run at higher speed, EOG mixed trains should run at max. speed of atleast 125 kmph. Presumably, air conditioning is desirable only if speed exceeds 130 kmph to avoid dust ingress beyond tolerable limits.
3. Mixed EOG trains should run with only 1 DA set per power car and space released by 1 DA set shall be utilized as additional luggage space.
4. In EOG mixed rakes, AC mechanics should not be deputed separately. Power car escorting staff should be entrusted with their duties.
5. In EOG mixed trains additional passenger amenities like mini pantry appliances can be offered which would be a value addition towards passenger satisfaction.
6. Since HOG system is under adoption , it would be most appropriate to continue with EOG system so as
to obivate the conversion of SG system into HOG system. It is pertinent to mention that it has been decided to manufacture only 3 phase locos from 2016-17 onwards which means speedy adoption of HOG system. Conversion of SG coaches into HOG coaches will be cost intensive beside time consuming.
7. Since LHB SGAC variant is different from conventional SGAC and still under development, it would not be advisable to pursue it further from functionality / maintainability point of view.
8. It is felt that introduction and continuance of LHB EOG mixed trains seem to be technically and financially in order and is the right step towards expediting and facilitating adoption of HOG system.
(Acknowledgement : Majority of input data has been taken from the Project report submitted by Sh. A.K Gupta, CEDE/RCF during course on “ Technological advances in Railway Electrics” from 08.12.14 to 30.01.15)
1312

IRIEEN JOURNAL VOL-24, NO.3, 2014 IRIEEN JOURNAL VOL-24, NO.3, 2014
Synopsis :
The article presents application of Solar Photovoltaic (SPV) panel on the roof top of coach. Trail on one NR BG GS coach provided with SPV panel on roof showed how the technology can be applied to harness renewable energy. Economics of cost of power with SPV generation vis-à-vis conventional Self-Generating or End on Generating system for coach is also computed. The financial viability of SPV on roof top of coach with LED lights and BLDC fans inside is also given for appreciation.
stN.Rly for the 1 time over Indian Railway took up the challenge and provided solar panels on roof with LED lights in 15 Narrow Gauge (NG) coaches of Kalka-Shimla section & 4 NG coaches of Kangra Valley section to harness the conventional solar energy.. After success of the trial in NG coaches, one non AC BG GS coach provided with solar panels is under trial.
Details of Broad Gauge Solar Powered coach
1 Coach No. 20022 GSNR/DLI division2 Technical Details: 12 Panels of 300W each = 3.6kW Battery capacity = 120Ah Rating of Charge Controller = 110V, 30A (Voltage range 90-135VDC) Modules have 72 cells (0.416V) 4 in series & 3 in parallel Panel voltage = 120 V Weight of the system: Modules = 264 Kgs @ 22Kgs per module Controller = 5 Kgs Total = 269 Kgs 2
Roof Area available on the coach = 40 m 2
Area covered by 12 panels = 24 m 2 Area left uncovered = 16 m (Eight more panels can be provided)
How Solar panels works:
The solar photo voltaic modules are installed on the roof top of the coach. Photo voltaic cells of modules in the solar array generate DC electricity in proportion to the amount of sun light available, generating most power on a clear day when the sun is at a normal angle to the array. Solar modules convert light energy in to electrical energy and charge the existing 110 V, 120Ah battery bank during the day time. The power generated from the Solar Photovoltaic (SPV) modules are supplied to the load through 110V, 30A Charge controller, which protects the battery bank from over charging/ deep discharging. The solar power will be directly feed to the load when battery is fully charged.
The module mounting structure is made up of suitable sections of MS angle, channel, tubes etc & designed for holding the modules. The array structure is designed in such a way that it occupies minimum space and sustains wind speed. Gas welding is done for fixing the structures on the roof. Wind barriers are made on both ends to avoid lifting of these panels due to wind.
Trial run of the coach was conducted on 01.12.2014 from Delhi to Rewari & back in train no. 54085/86. Load of 1.5 kW heater & 7 FTLs of 20watt was given during the trial. It is observed that about 13.5 Amp is generated during full sun varying from 1.5 Amps at sun rise.
Average current comes about 6.5 Amps
Generation period = 6 Hrs (10.00 to 16.00 Hrs)
Power generated = V x I x t = 112 x 6.5 x 6
= 4.37 kWh = A
Power requirement during winter season if the coach is provided with LED lights
Sudhir GargCESE / NR
Use of Solar Power in passenger coaches(Green Initiative on Rail coaches)
28 LED lights of 9W each = 28 x 9 = 252 W
2 LED gang way light of 6W each = 2 x 6 = 12 W
Total power requirement = 252 + 12 = 264 W per hour
Total power requirement per day
= 264 x 16 = 4.22 kWh = B
From A & B above, it can be concluded that solar power system can cater the requirement of TL coach during winters when fans are not required and hence alternators can be disconnected.
Power requirement during summer season if the coach is provided with LED lights & BLDC fans
28 LED lights of 9W each = 28 x 9 = 252 W
2 LED gang way light of 6W each = 2 x 6 = 12 W
27 BLDC Fans of 32W = 27 x 32 = 864W
Total power requirement
= 252 + 12 + 864 = 1128 W per hour
· Total power requirement per day = 264 x 16 + 864 x 24
= 4.22 + 20.74 kWh = 25 kWh = C
From A & C above, it can be concluded that solar power system can cater 17.5% of the total power requirement of TL coach during summers when fans run round the clock.
Existing power generation system provided in a TL coach
4.5 kW alternators, through the load requirement of a non AC coach provided with LED lights & BLDC fans during peak summers is 1.13 kW only.
To harness the benefits of solar power a system can be adopted wherein alternate coaches are provided with solar panels and their alternators are disconnected and whenever power is required these can be fed from the adjoining coach through EFT.
Coach with
Solar panel
without
alternator
Normal Coach
with 4.5 kW
alternator
Coach with
Solar panel
without
alternator
Normal
Coach with
4.5 kW
alternator
Financial viability:
Cost of provision of solar panel = Rs 3.95 Lacs
per coach
Cost of provision of LED lights = Rs
25000.00 per coach @ Rs 900.00 per LED light
Cost of providing BLDC fans = Rs 22400.00 per
coach taking difference of DC carriage & BLDC
fans as Rs 800.00 per fan
Total capital required = 3.95 + 0.25 + 0.224 = Rs
4.424 Lacs per coach.
Energy saving:
i) Saving in electrical wattage in one coach due to
retrofitment of LED lights & BLDC fans = 1.6 – 1.1
= 500 W
ii) Average running hours of the coach = 12hrs/day
iii) Energy saving per day = 12 x 500 = 6000 Watt hr =
6 kWh = 6 Units/Coach
iv) Average cost of energy = Rs. 15.88 per unit
(Details as Ann-A)
v) Saving = 15.88 x 6 = Rs 95.28 per day/coach =
34777.20 (say Rs 34777/coach/annum)
vi) Additional saving in coach with solar panel 6 hrs
per day = 4.37 kWh
vii) Saving = 4.37 x 15.88 = 69.39 per day/coach
= 25329.39 (say Rs 25329/coach/annum)
viii) Total saving of solar coach = Rs 60106.00 per
coach/year due to energy conservation
ix) Saving due to maintenance in solar coach
1. Alternator will be released = Rs 9000.00
(Taking cost as Rs 90000.00 @ codal life as
10 years)
2. RRU/ERRU will be released = Rs 4000.00
(Taking cost as Rs 40000.00 @ codal life as
10 years)
3. V-belts will not be required (Average 2 sets
1514

IRIEEN JOURNAL VOL-24, NO.3, 2014 IRIEEN JOURNAL VOL-24, NO.3, 2014
300Wp 300Wp
300Wp 300Wp
300Wp 300Wp
300Wp
300Wp
300Wp
300Wp
300Wp
300Wp
JUNCTION BOX
BATTERY BANK, 110V, 120Ah
CHARGE CONTROLLER, 110V, 30A
LOAD
5. For a rake of 20 coaches at least 2 skilled & 2
unskilled staff are deputed for underframe =
0.1 skilled & 0.1 unskilled staff per day per
coach = 0.1 x 35000 + 0.1 x 25000 = 3500 +
2500 =6000.00 per month = 12 x 6000 =
72000.00 per year per coach
x) Effective saving in a solar coach = 60106 + 72000
= Rs 132106.00 per annum.
xi) ROR = 27% i.e theoretically pay back will be about
4 years.
Solar Module
4 modules of 300 Wp each in series to form an array & 3 arrays in parallel to generate 3.6kWp
Solar Panel
Fixing arrangement
Charge
Controller
Calculation of energy cost
1 In diesel traction for SG coaches
As per all India average heat rate in kCal/kWh
1 kg of HSD used in diesel traction = 10500 kCal
However, 1 kWh of electricity requires = 2952 kCal
Therefore 1 kg HSD = 10500/2952 kWh = 3.56 kWh
1 Litre = 910 grms
I Gm = 1/910 Ltrs
1 kg = 1000/910 = 1.098 Ltrs = 1.1 Ltrs
Cost of HSD as on 01.08.2013 = Rs 51.40 per Ltrs
Cost of 1 kg HSD = 1.1 x 51.40 = Rs 56.54
Therefore
3.56 kWh energy costs = Rs 56.54
1 kWh energy will cost = 56.54/3.56 = Rs. 15.88
Schematic Diagram
1716

IRIEEN JOURNAL VOL-24, NO.3, 2014 IRIEEN JOURNAL VOL-24, NO.3, 2014
INTRODUCTION
Indian Rlys (IR) are the biggest and largest transport provider of GOODS and PASSENGER service in INDIA. Like any other transporter, IR earns bulk of its revenue from transportation of Goods service. Rlys are the most energy efficient and eco-friendly than any other mode of transport. However capacity, quality and performance are crucial to decide mode of transport. Over the years transportation sector has seen many significant changes, as a result there has been a paradigm shift in various modes of transportation in India. IR has shifted its focus from all kinds of transportation ,Bulk and Small ,to only Bulk transportation in freight sector.
Planning commission set up a committee to develop long term National Transport Policy in 2013, with 20 yrs horizon, under the Chairmanship of Dr Rakesh Mohan, to facilitate overall growth and efficiency in the Transport sector, minimising energy requirement as well as adverse effect on Climate change. NTDPC published its report on 15th April 2014.This report is in 3 volumes, of which Vol III, Part 1 is on Railways, Road and other transport sector. The NTDPC mentioned that share of IR on originating traffic dropped from 89% in 50-51 to about 30 % in 2007-08. Share of Passenger transport for IR dropped from 74% in 50-51 to about 13% in 2007-08. While share of Road transport has gone up from 26% to 87% during the same period.
Projection made by NTDPC (National Transport Development Policy Committee) in its report indicated that Rail transport share in originating freight( in Ton), may drop further from 30% as on 2007-08 to about 25% in 2020. For efficient, better and balanced mode of
transport, share by Rail should be 46% . It is a fact that any shift in mode of transport from road to Rail will result in substantial saving in energy consumption and can reduce social cost. NTDPC in its report mentioned that social cost( all inclusive cost) advantage of rail, over Urban area, w.r.t base year of 2000 , is Rs 2.8 per NTKM and Rs 1.7 per PKM . For non suburban area , it is Rs 2.5 and 1.7 respectively. Freight transport is projected to grow by 6 to 7 times and Passenger transport by 15 to 16 times over the next two decades over IR ,with assumption and presumption that Economy growth of 7 to 9% per annum. NTDPC has also projected usage of Steel to go up by factor of 8,and, Coal, which is half the trade volume for IR, will go up by 2.5 times by 2030.
Originating Passenger traffic on IR has increased 6 times from 1.3 Billion in 50-51 to 7.6 Billion in 2010-11. During the last decade 2001-11, Non- suburban Pass traffic growth was 6.2% ,while 3.6% on sub-urban Pass growth.PKM has also increased by 15 times during the period 50-51 to 2010-11. Non suburban PKM is 86% of total PKM of IR. In Sub-urban sector ,the avg. lead of Pass has gone up from 16 to 34 km, while in non-suburban sector it has gone up from 66 km to 234 km. Interestingly the Pass lead in upper class of Non-suburban sector has been the highest ( from 132 to 623km). High speed transportation in Passenger service is therefore, the new focus of attention for IR.
Whatever may be the change in philosophy of transportation adopted by IR on Freight and Passenger services , Customer expectations remain same i.e Fast, Safe and Cheap transport across India. In the face of competition coming from Road and Air, IR has made
COST OF ELECTRIC TRAIN OPERATIONSENSITIVITY ANALYSIS ‐ ECRly PERSPECTIVE
A. K. CHATTOPADHYAY CELE, ECR
many policy changes using up graded modern technology to meet the basic objective of safe ,quick and cheap transport. However, like any commercial organisation, Cost- benefit analysis has been the basic criteria in IR, while adopting to any change or up gradations. Introduction of state of the art 3-phase technology in Electric traction in 1992 was one such revolutionary step adopted by IR on Up gradation to save cost of transportation. This paper will try to analyse the effect of 3-phase technology on Electric train operation.
If we look back ,in the last 67 years after Independence , IR has not been seen as commercial organisation by common man in India, but as a basic core Industrial sector essential for Development of the country. It is a fact that total all round development of the country is possible if Rail connectivity is made available for common man at every small corner of our country at an affordable price. Therefore, for the need of development of the country, IR has to undertake Rail infrastructure development at all corners. Sometimes such Rail connectivity appears Economically unviable and transportation of Goods and Passenger is done at a loss. Sometimes cost of transportation of Rail services are deliberately kept low in order to content inflation and to provide basic welfare services specially during Natural disaster and supply of essential items specially food grain, drinking water etc .Therefore, IR can not be considered as a commercial organisation which has to find its own resources for funding new project/ modernisation. It is for this reason , cost of Transportation by IR and effort to reduce cost has assumed significance.
This paper has been prepared to sensitise all concerned ,on factors which affect cost of transportation, its sensitivity and impact. This paper is not aimed at comparing cost by various modes of transportation in IR , e.g Diesel or Electric, because transportation by Electric traction is not only cheap but also saves consumption of Diesel and reduce import cost on crude oil. However from strategic point of view, mix of Diesel and Electric traction
is a must even if Diesel traction is at higher cost.
I have taken ECR's cost of operation and various elements which influence such cost to carry out sensitivity analysis.
COST OF ELECTRIC TRAIN OPERATION
Share of Electric traction in Freight sector, in GTKM, over IR is 67.7% during 2012-13, it increased at an average rate of 1% every year since 2009-10. Share of Electric traction, in GTKM, in Passenger service in IR ,however, has remained almost same at 48.5% over the last 4 years. However share in cost of energy between Diesel and Electric traction in IR, during 2012-13, was 66:34. In other words, Electric traction transported 2/3rd total Freight at nearly 1/3rd cost of energy.
The reason behind no change in Passenger Electric GTKM is on account of conversion of DSL loco hauled trains to MEMU/EMU services during the last 4 years over newly electrified section. Growth of MEMU/EMU GTKM is more than 23% during the last 4 years. In order to keep our focus on major impact on cost of transportation, we are keeping our discussion limited to Loco haul train operation only, MEMU service is kept out of scope of present discussion.
In order to analyse various elements which constitute the cost of operation, we have identified each such elements and expressed them in one unit of cost for analysis e.g each element cost expressed in Rs/1000 GTKM for both Freight and Passenger service.
Elements of cost for analysis are:-
Maintenance cost
Cost of Energy
Cost of Running staff etc
Cost of OHE maintenance
All cost references have been taken from ASS (Annual Statistical Statement) and RAR (Revenue Allocation Register) of ECR for the year 2012-13 and 2013-14.
1918

IRIEEN JOURNAL VOL-24, NO.3, 2014 IRIEEN JOURNAL VOL-24, NO.3, 2014
ITEM YEAR (RS/1000GTKM) SENSITIVITY INDEX (%) 2012-13 2013-14 2012-13 2013-14
MAINTENACE COST
8.127 9.276 13.65 14.73
ENERGY COST 33.19 32.75 55.74 52.01
COST OF RUNNING STAFF
13.08 15.20 21.97 24.17
OHE MAINTENANCE COST
5.146 5.74 08.64 09.12
TOTAL 59.543 62.966
SUMMARY COST FOR ELECTRIC FREIGHT OPERATION ( RS/1000GTKM)
SUMMARY COST OF ELECTRIC PASSENGER TRAIN OPERATION ( RS/1000GTKM)
ITEM YEAR (RS/1000GTKM) SENSITIVITY INDEX (%)
2012 -13 2013 -14 2012 -13 2013 -14
MAINTENACE COST
17.42 18.64 11.14 11. 44
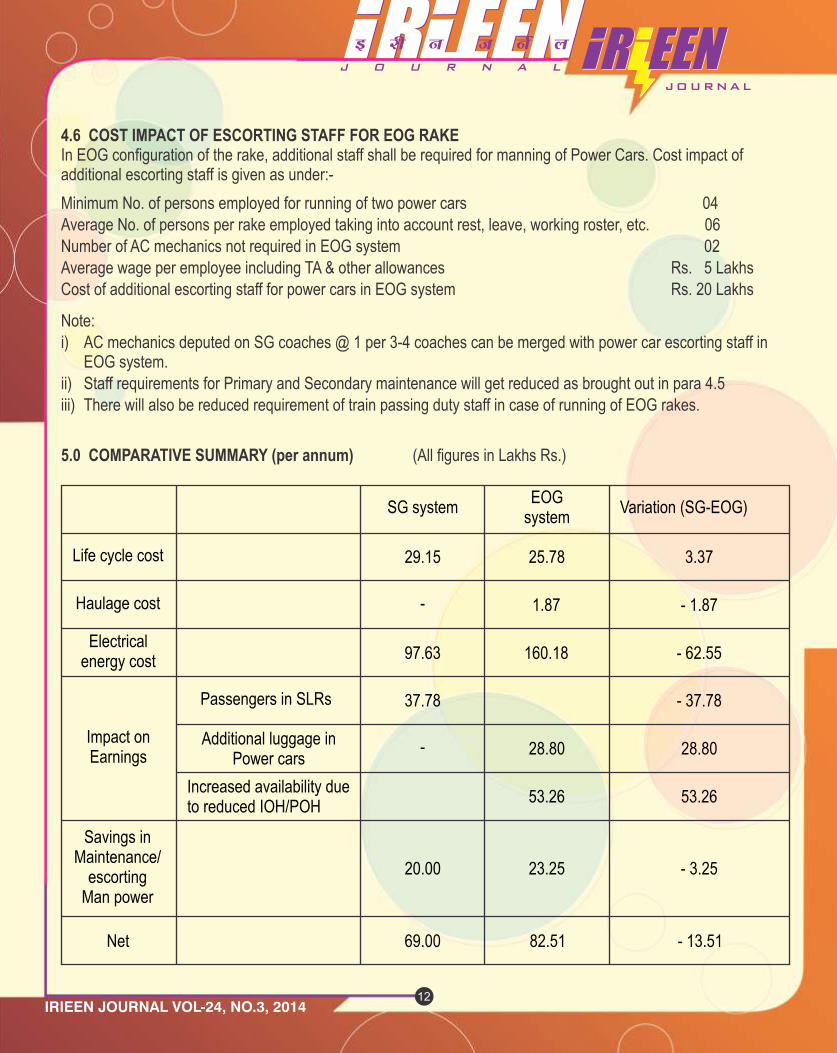
ENERGY COST 105.36 108.78 67.4 66.77
COST OF RUNNING STAFF
28.59 29.84 18.29 18.32
OHE MAINTENANCE COST
4.95 5.66 03.17 03.47
TOTAL 156.32 162.92
ANALYSIS AND CALCULATION OF COST OF OPERATION
A. COST OF MAINTENANCE
As per ASS & RAR of ECR all costs incurred for maintenance of locomotives over ECR are subdivided under various sub-heads/elements. The subhead wise cost are given in Annexure -1.
The expenditure for Maintenance of Locomotive in two sheds of ECR for the year 2012-13 and 2013-14 are considered and apportioned equally for Goods and
Passenger locos over the respective year. The cost incurred on maintenance of locomotive resulted in certain Loco outage for Freight and Passenger locos by ECR. However , requirement of loco on Territorial basis over ECR during 2012-13 & 2013-14 for Goods and Pass service was more than the shed outage maintained by ECR . Hence cost of maintenance for locos used in Freight and Passenger service on territorial basis are proportionally increased to match territorial outage for analysis. Moreover territorial GTKM is earned by locomotives available/ utilised on territorial basis over the
year. Hence cost of maintenance / loco is calculated and total cost of maintenance of locos on territorial outage (proportionately increased ) to earn Freight/Pass GTKM are calculated. Here we have assumed uniform cost of maintenance of locos by all sheds of IR.
COST OF MAINTENANCE/LOCO AS INCURRED BY ECR SHEDS TO MAINTAIN OUTAGE, GOODS & PASS
YEAR MAINTENANCE
COST
LOCO OUTAGE BY SHEDS TOTAL COST/LOCO
Rs Cr
GOODS
PASS
Rs Cr
2012-13 95.993
221.27
69.79
291.06
0.3298
2013-14 118.454
233.23
76.02
309.25
0.383
TOTAL COST OF MAINTENANCE OF LOCO AS INCURRED TO MAINTAIN TERRITORIAL OUTAGE
YEAR
COST/LOCO
TERRITORIAL LOCO
OUTAGE OVER ECR
TOTAL COST OF LOCO TO
MAINTAIN TERRITORIAL
OUTAGE ( Rs Cr) Rs Cr
GOODS
PASS
GOODS
PASS
2012-13 0.3298
246.74
89.5
81.376
29.517
2013-14 0.383 248.84 89.5 95.314 34.28
UNIT COST OF MAINTENANCE ( Rs /1000GTKM)
YEAR
GTKM OVER ECR BY ELECTRIC LOCO( IN 1000GTKM)
MAINTENANCE COST
Rs/1000GTKM
GOODS
PASS
GOODS
PASS
2012 - 13 100130017.6 16943319.04 08.127 17.42 2013 - 14 102749020.32 18389627.0 09.276 18.64
It may be seen that cost of Maintenance of Pass locos per 1000 GTKM is double that of Freight locos
2120

IRIEEN JOURNAL VOL-24, NO.3, 2014 IRIEEN JOURNAL VOL-24, NO.3, 2014
ITEM YEAR (RS/1000GTKM) SENSITIVITY INDEX (%) 2012-13 2013-14 2012-13 2013-14
MAINTENACE COST
8.127 9.276 13.65 14.73
ENERGY COST 33.19 32.75 55.74 52.01
COST OF RUNNING STAFF
13.08 15.20 21.97 24.17
OHE MAINTENANCE COST
5.146 5.74 08.64 09.12
TOTAL 59.543 62.966
SUMMARY COST FOR ELECTRIC FREIGHT OPERATION ( RS/1000GTKM)
SUMMARY COST OF ELECTRIC PASSENGER TRAIN OPERATION ( RS/1000GTKM)
ITEM YEAR (RS/1000GTKM) SENSITIVITY INDEX (%)
2012 -13 2013 -14 2012 -13 2013 -14
MAINTENACE COST
17.42 18.64 11.14 11. 44
ENERGY COST 105.36 108.78 67.4 66.77
COST OF RUNNING STAFF
28.59 29.84 18.29 18.32
OHE MAINTENANCE COST
4.95 5.66 03.17 03.47
TOTAL 156.32 162.92
ANALYSIS AND CALCULATION OF COST OF OPERATION
A. COST OF MAINTENANCE
As per ASS & RAR of ECR all costs incurred for maintenance of locomotives over ECR are subdivided under various sub-heads/elements. The subhead wise cost are given in Annexure -1.
The expenditure for Maintenance of Locomotive in two sheds of ECR for the year 2012-13 and 2013-14 are considered and apportioned equally for Goods and
Passenger locos over the respective year. The cost incurred on maintenance of locomotive resulted in certain Loco outage for Freight and Passenger locos by ECR. However , requirement of loco on Territorial basis over ECR during 2012-13 & 2013-14 for Goods and Pass service was more than the shed outage maintained by ECR . Hence cost of maintenance for locos used in Freight and Passenger service on territorial basis are proportionally increased to match territorial outage for analysis. Moreover territorial GTKM is earned by locomotives available/ utilised on territorial basis over the
year. Hence cost of maintenance / loco is calculated and total cost of maintenance of locos on territorial outage (proportionately increased ) to earn Freight/Pass GTKM are calculated. Here we have assumed uniform cost of maintenance of locos by all sheds of IR.
COST OF MAINTENANCE/LOCO AS INCURRED BY ECR SHEDS TO MAINTAIN OUTAGE, GOODS & PASS
YEAR MAINTENANCE
COST
LOCO OUTAGE BY SHEDS TOTAL COST/LOCO
Rs Cr
GOODS
PASS
Rs Cr
2012-13 95.993
221.27
69.79
291.06
0.3298
2013-14 118.454
233.23
76.02
309.25
0.383
TOTAL COST OF MAINTENANCE OF LOCO AS INCURRED TO MAINTAIN TERRITORIAL OUTAGE
YEAR
COST/LOCO
TERRITORIAL LOCO
OUTAGE OVER ECR
TOTAL COST OF LOCO TO
MAINTAIN TERRITORIAL
OUTAGE ( Rs Cr) Rs Cr
GOODS
PASS
GOODS
PASS
2012-13 0.3298
246.74
89.5
81.376
29.517
2013-14 0.383 248.84 89.5 95.314 34.28
UNIT COST OF MAINTENANCE ( Rs /1000GTKM)
YEAR
GTKM OVER ECR BY ELECTRIC LOCO( IN 1000GTKM)
MAINTENANCE COST
Rs/1000GTKM
GOODS
PASS
GOODS
PASS
2012 - 13 100130017.6 16943319.04 08.127 17.42 2013 - 14 102749020.32 18389627.0 09.276 18.64
It may be seen that cost of Maintenance of Pass locos per 1000 GTKM is double that of Freight locos
2120

IRIEEN JOURNAL VOL-24, NO.3, 2014 IRIEEN JOURNAL VOL-24, NO.3, 2014
B. COST OF ENERGY
Cost of Energy or Fuel cost is the most important element of cost for any mode of transportation. 24% of working expanses of IR budget are towards energy bill. To understand impact of fuel bill on IR train operation, figs of energy cost vs-a-vis performance in terms of GTKM for DSL & ELECT transportation are appended below ;-
YEAR PASS GTKM (000) FREIGHT GTKM (000) COST OF FUEL (000) DSL ELECT DSL ELECT DSL ELECT
2009-10 27,94,25,129 26,41,80,745 39,53,04,004 69,22,39,009 8137,87,90 4599,15,97 2012-13 33,12,78,870 31,19,22,898 41,95,40,071 83,55,71,360 13527,46,83 7076,97,50
% SHARE 48.9% on Elect as on 12-13 66.65% on Elect as on 12-13 34.35% on Elect as on 12-13
On ECR perspective , when we analyse Energy bill on traction for DSL and ELCT vis-a-vis performance in terms of GTKM, we find Cost of electric energy is only 33.03% of total Fuel bill of ECR while carrying 83.55% of total ( Freight) GTKM. Pass GTKM is almost same for DSL and Elect in ECR. Details are as below:-
YEAR PASS GTKM (000) FREIGHT GTKM (000) COST OF FUEL (000)
DSL ELECT DSL ELECT DSL ELECT
2013-14 198,28,745 183,89,627 202,36,324 1027,49,020 1140,79,24,193 562,69,46,723 % SHARE 48.13% of total on Elect 83.55% of total on Elect 33.03% of total on Elect
Electric energy bill received every month for each TSS over ECR are compiled . This element of cost is reflected under subhead H-300(331 TO 338)in ASS. It excludes cost of energy supplied to other than traction. Total energy consumed for traction is then subdivided amongst various Electric traction services, as per guidelines issued by RDSO ( Ref : NO EL/2.5.2/2 Dt 17/08/2000). Detail break-up being,
5% of total energy is set aside for Signalling service and Station lighting( AT supply).
19 KWH/1000GTKM for MEMU Service
17 KWH/1000GTKM for Mail/Exp trains upto 105 kmph
18.5 KWH/1000GTKM for Mail/Exp trains upto 110 kmph
21 KWH/1000GTKM for Mail/Exp trains above 120 kmph
26 KWH/1000GTKM for slow moving Pass trains/Specials etc
Accordingly cost of Energy for Goods and Pass service for 2012-13 and 2013-14 are as below
FREIGHT SERVICE
YEAR ENERGY CONSUMED (107 KWH)
GTKM EARNED(
1010 GTKM)
SEC KWH/1000
GTKM)
UNIT RATE AVG (Rs)
COST OF ENERGY/1000GTKM
(Rs/1000GTKM) 2012-13 61.918 10.013 6.18 5.37 33.19 2013-14 60.603 10.275 5.90 5.55 32.75
YEAR ENERGY CONSUMED (107 KWH)
GTKM EARNED(
1010 GTKM)
SEC KWH/1000
GTKM)
UNIT RATE AVG (Rs)
COST OF ENERGY/1000GTKM
(Rs/1000GTKM) 2012-13 33.534 1.694 19.79 5.37 105.36 2013-14 36.043 1.839 19.60 5.55 108.78
PASSENGER SERVICE
It is important to note here that total net electric energy consumed during 2013-14, in Freight service was less than that of 2012-13 by about 2.12 % despite the fact that Freight GTKM earned during 2013-14 was more than that of 2012-13 by 2.6%. It is also a fact that ECR achieved 3% additional loading compared to 2012-13.ECR also registered an increase in territorial holding of Electric locos and substantial increase in 3- phase loco holding in 2013-14 compared to 2012-13. Holding of 3- phase loco increased by more than 5 in 2013-14, compared to 2012-13 on hourly basis over ECR. This aspect will be further discussed in the Sensitivity analysis later.
In Pass service , during the same period net energy consumption increased by 7.4% while Pass GTKM increased by 8.5%. Here also increase in Pass energy consumption is proportionately less than increase in GTKM during 2013-14. Besides deployment of more 3 -phase locos in Pass service during 2013-14 and taking over of 7 pairs of Mail/Exp trains on Electric traction during 2013-14, caused increase in net energy consumption on Electric Pass train operation.
From the table above ,it is clear that irrespective of Freight or Pass service cost of Energy is the vital cost of Electric train operation. Any step to reduce energy cost will have bigger impact on Electric train operation. This will be further discussed in the sensitivity analysis later.
C. COST OF RUNNING STAFF
Operating expanse of Electric train has many components and sub-head wise cost are detailed in Annexure -2.
Operating expenses have various elements of cost, like cost of running staff, cost of yard staff , cost of supervision of Running staff & cost of lubricants etc. These expenses are generally incurred for operation of trains over the Zone hence this expenditure has also been converted to same unit price of Rs/1000GTKM. Further , distribution of operating expanse between Freight and Pass service over ECR has been proportionately divided based on their territorial holding over the year. For this analysis we have not bifurcated operating expanse further to include MEMU service, since it is very small compared to the total crew utilised for Freight and Pass service in ECR. Similarly for simplicity of calculation, I have not corrected territorial holding by number of Multiple units being operated since total number of MU locos over ECR territory has been insignificant.
PROPORTIONATE TERRITORIAL HOLDING FREIGHT & PASSENGER SERVICE
YEAR TERRITORIAL OUTAGE TOTAL PROPORTIONATE HOLDING FREIGHT PASS FREIGHT PASS
2012-13 246.74 89.5 336.24 0.73 0.27 2013-14 248.84 89.5 338.34 0.74 0.26
2322
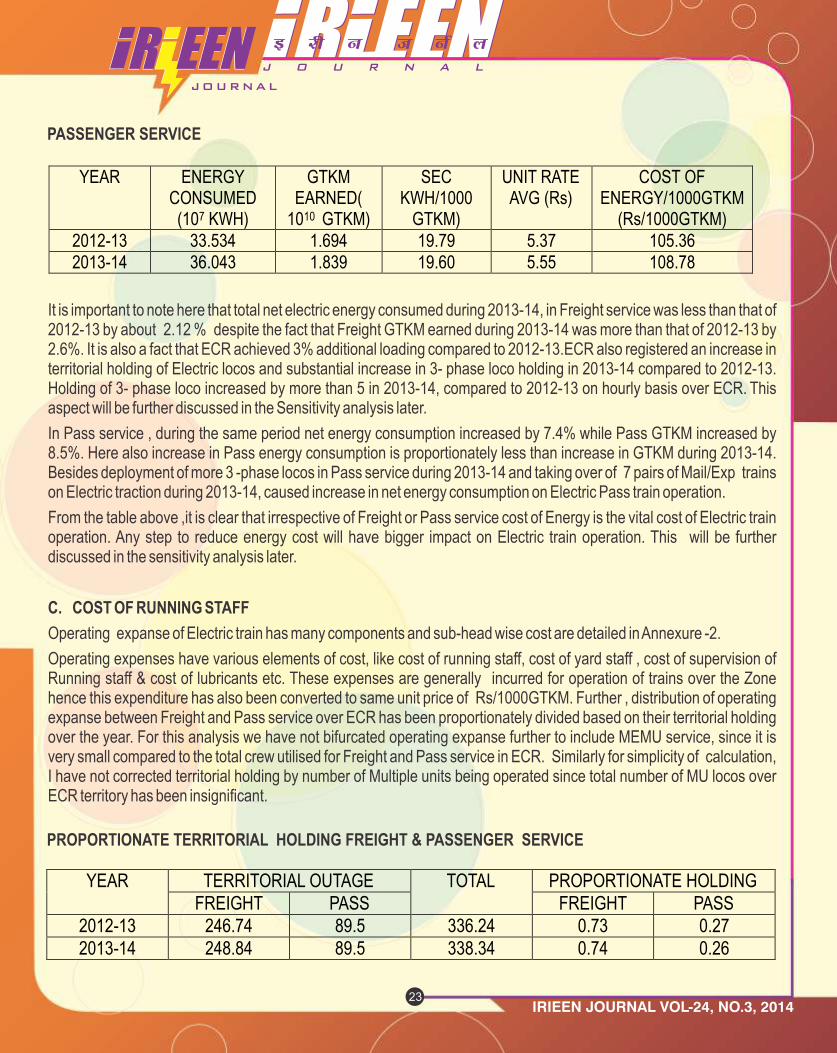

IRIEEN JOURNAL VOL-24, NO.3, 2014 IRIEEN JOURNAL VOL-24, NO.3, 2014
ANALYSIS ON OPERATING EXPANSE FREIGHT & PASS SERVICE
YEAR TOTAL OPERATIN
G EXPANSE (Rs Cr)
PROPOERTIONATE TERRITORIAL
HOLDING
PROPORTIONATE COST (Rs Cr)
TOTAL GTKM x(1010)
OPERATING COST/1000GTKM
GOODS PASS GOODS PASS GOODS PASS GOODS PASS 2012-13 179.445 0.73 0.27 131.681 47.764 10.013 1.694 13.08 28.59 2013-14 211.087 0.74 0.26 155.249 55.838 10.275 1.839 15.20 29.84
Freight trains all over the world have found it beneficial to operate longer and heavier trains to lower unit cost of operation. Dedicated Freight corridor in Australia, Brazil, Canada, and China operate Freight trains of 20,000 to 50,000 T trailing load/train. With commissioning of DFC in India, Freight load per train may reach 12,000 T. Speed of Freight trains have not improved much in the last three decades ( from 25 to 29 kmph) ,primarily on account of very low ratio of hauling H.P to trailing load. If the trailing load per train increases in near future, operation cost /1000 GTKM will come down and so does the total cost of Electric train operation. Cost of operation is the 2nd highest cost after energy in Electric train operation and saving in cost on this account will have bigger impact on Electric train operation cost.
D. COST OF OHE MAINTENANCE
Cost of maintenance of OHE is a fixed cost to be incurred in all Electrified territory. This cost has to be incurred even when the section is not used by Electric traction. It is therefore important that DSL traction is reduced to bare minimum in all Electrified territory.
Railway safety committee recommended deployment of 20% of total holding of locomotive on territorial basis ,should be diesel. DSL train operation under wire have increased more than 20% on account of other factors like( avoid) traction changing and detentions. Since DSL operation under OHE results in higher operating cost, it is worthwhile to review this order and fine tune / modify the order in the best interest of IR.
This element of cost becomes insignificant with increase in Electric traffic density . This cost has been apportioned equally between Freight and Pass service for this analysis . It may be noted here that OHE maintenance cost has not been apportioned with MEMU service, since MEMU GTKM is insignificant ,in the context of ECR ,compared to the total GTKM.
Elements which constitute total expanses on OHE maintenance along with their sub-heads are given in ANNEXURE -3
YEAR TOTAL COST OF OHE MAINT
(Rs Cr)
GTKM X 1010 PROPORTIONATE
(GTKM )TERRITORIAL
COST OF OHE MAINTENANCE /1000GTKM
(Rs /1000GTKM) GOODS PASS GOODS PASS GOODS PASS
2012-13 59.911 10.013 1.694 0.86 0.14 5.14 4.95
2013-14 69.406 10.275 1.839 0.85 0.15 5.74 5.66
ANALYSIS
E. SENSITIVITY ANALYSIS
From the above analysis , we know that Energy cost is the most significant cost for Electric train operation and constitutes more than 50% of the cost. Total cost of Electric train operation during 2013-14 over ECR was Rs 961.61 Cr. While ECR had spend around Rs 110 Cr and Rs 130 Cr on maintenance of locomotive during 2012-13 and 2013-14 respectively and money spend on energy is around Rs 512 Cr & Rs 536 Cr during the same period on Freight and Pass service . Table below gives comparative cost under four major heads of Electric train operation cost for Freight and Pass service. All costs are on Territorial basis for ECR separately for Goods and Pass service(Electric traction only)
YEAR COST OF ENERGY (Rs Cr)
OPERATING EXPANSE (Rs Cr)
LOCO MAINTENANCE COST ( Rs Cr)
OHE MAINTENANCE COST (Rs Cr)
GOODS PASS GOODS PASS GOODS PASS GOODS PASS
2012-13 332.5 180.08 131.681 47.764 81.376 29.517 51.523 8.387
2013-14
336.35
200.04
155.249
55.838
95.314
34.281
58.995
10.41
This also signifies that money spent in energy was nearly 5 times more than that of maintenance expenditure. Which also means Energy cost is most sensitive to Electric train operation. A reduction in maintenance cost by 10 % will reduce cost of Electric train operation by 1.3 to 1.4%, while 10% reduction in cost of energy can reduce the cost of Electric train operation by 5.2%.
In ECR we observed reduction of Electric SEC for Freight operation from 6.18 during 2012-13 to 5.90 units/1000GTKM, in 2013-14, which is a reduction by 4.5% , while reduction in Electric SEC for Pass operation during 2013-14 was 0.96% compared to 2012-13( from 19.79 in 2013-14 to 19.60 in 2012-13).Such reduction in Electric SEC for Goods and Pass service means saving in Energy bill. Therefore reduction in SEC when converted to money value terms , it shows saving of nearly Rs 16.7 Cr in Freight Operation and Rs 1.939 Cr in Pass operation in 2013-14 compared to previous year.( Savings= Reduction in SEC X GTKM X Rate). Total saving in Energy bill is Rs 18.639 Cr.
In ECR , during 2013-14, budget for maintenance against procurement of material under PU 27,28,32 & 33 in aggregate ,was Rs 66.28 Cr, against total allotment of fund for direct maintenance of Rs 110 Cr ,hence material cost constitutes nearly 60% . Considering that PU 27, 28 ,32 and 33 constitutes bulk of expenditure on material ,
proportionate expenditure on manpower is nearly 40% of maintenance budget allotment. In case Maintenance staff strength is required to be increased due to increase in holding of locos in a shed by 12.5%, from 4.0/ loco to 4.5 /loco or increase in staff strength by 194( Avg holding of loco over ECR as on 2013-14 was 360, and total staff strength is 1426 or avg. staff per loco is 3.96), it will have direct impact on the cost of maintenance, which may go up annually by Rs 118.45 X 0.4 X 0.125= Rs 5.92 Cr or ,nearly Rs 6 Cr annually but will have very little impact on cost of Electric train operation.
Requirement of additional staff for maintenance of Electric rolling stock has assumed more significance in the light of report submitted by NTDPC committee set up by Planning commission, in April 2014, which has projected the following additional traffic for IR in the next two decades:-
8 Times increase in consumption of steel
2.5 Times increase in consumption of coal
In order to meet this projected traffic, NTDPC has projected requirement of Rolling stock :-
Increase in Electric loco holding from 3849 to 28,000
Increase in Diesel loco holding from 5000 to 15,000
Increase in EMU / MEMU holding from 6694 to 30,000
2524
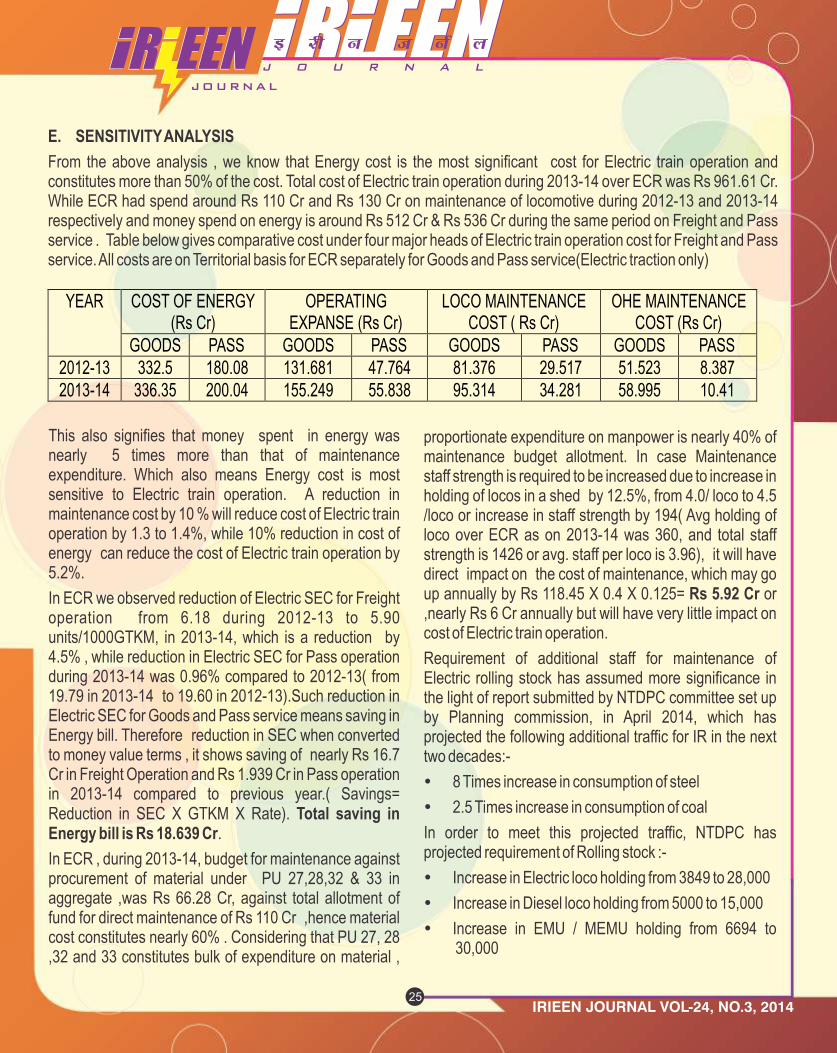

IRIEEN JOURNAL VOL-24, NO.3, 2014 IRIEEN JOURNAL VOL-24, NO.3, 2014
In order to build up and sustain proper infrastructure for maintenance with qualified skill labour, we need to create additional posts for artesian staff at shops and sheds.
However we have to find financial viability behind creation of additional posts, as we all know that 'staff bank' 'kitty' is empty in all zones in Electrical department.
It will be interesting to understand how much IR earns from Freight service based on the present tariff structure ( Ref IRCA Goods Tariff No 47 Pt I (Vol-II).
Considering an avg. lead of 450 km for transportation of one rake load ( 58 BOXNHL with CC+8+2 T), of additional loading for 200 days in a year, additional revenue that IR can earn will be , Rs 48.64 Cr (approx).
Earning= 70*58*599*200= 48,63,88,000 (approx)
In ECR perspective , every million Ton of additional loading per year , ECR earns around Rs 60 Cr. It is therefore clear that cost on account of additional staff requirement (Rs 6Cr) is quite substantial to the earning on account of additional loading of coal over a year. Therefore , justification for additional cost has to be from internal resources by cutting down cost of operation and limiting all such additional expenditure to the savings achieved .
It may be seen that saving in cost due to saving in energy achieved during 2013-14, through deployment of energy saving 3- phase Electric locos over ECR is much more than additional expenditure expected by increase in staff strength to maintain those additional locos. Moreover such increase in manpower will also take care of reliability and availability of locos.
There is a very high impact due to increase in cost of operation. Impact of increase in Running staff strength , yard staff strength, cost of supervision of Running staff and cost of lubricants has 2nd highest sensitivity to the cost of Electric train operation and is more than cost of maintenance of locos. Reduction in road hrs of Freight trains by increasing H.P to train load ratio to 2 and higher trailing load per train thro operation via DFC can reduce cost of running .
SUGGESTIONS
Use of 3-phase loco for Freight and Pass train operation by phasing out conventional locos. Manufacture only IGBT locos at CLW, since these locos are more energy efficient than GTO based locos and have higher starting tractive effort because of higher co-efficient of adhesion. Increase in axle load of G9 H locomotive can reduce requirement of Multi unit locos thus becoming more energy efficient . Such WAG9 H locos can bring more operational flexibility to the system.
With increase in population of WAG9 locos over electrified section , there are chances of re-generation of energy during braking operation, offsetting consumption of power by other locomotives of the system, in which condition power will flow back to the grid and earn through sale of energy . At present energy meters available at TSS can measure only power being consumed by Electric traction (uni-directional) but cannot measure reverse flow of power (power flowing back to the grid from IR system). An experiment conducted in one TSS ( KODERMA) in DHN div to measure power flow in reverse direction, over a period of 24 hrs ,during 2013-14,reveal that with nearly 18% population of 3 phase locos in the system, it measured few units of reverse power flow ( energy had flown back to the grid from that TSS after meeting all requirement of energy by the IR system during that period over that section). In case population of 3- phase locos becomes significant, a large quantity of power will flow back to the grid without it being accounted for unless measures are taken. To measure and account this huge reverse power flow, we have to provide bi-directional meters at all TSS in a phased manner. In order to implement automatic adjustment of energy flow into the grid from Rly system, we need to have our agreement with SEBs modified, the dialogue must start now.
There is an increase in operation of Long-haul trains over IR, WAG9 locos are often used at the middle of such long-haul trains, depriving it from using regenerative braking . A rough estimate of loss of energy by one long haul loaded train of 5000T, in one trip, over a distance of 100 Km, will be 324.5 Units OR in money value terms= Rs 5.55 X 324.5= Rs 1800 ( Saving= SEC X 5000 X 100 X 0.11/1000= 324.5 Units ). From data for regeneration of power by G9 locos as maintained by GMO shed, it has been found that WAG9 locos regenerative energy is nearly 11% of total consumption. IR therefore , has to prevent use of WAG9 class of locos in the middle of long-haul trains by educating Controllers , Yard staff and station staff. Such action will go a long way in saving energy.
Use of twin pipe in all freight stock help quick release of brakes after application. In absence of twin pipe working, brake application will be longer because of late release, which will increase traction energy during acceleration after braking, making it energy inefficient . Incidentally Rly Bd vide letter no 2010/M(N)/60/1/pt II, Dt 15/10/2013 had advised all Zonal Rlys to use twin pipe system in all freight stock.
There is acute shortage of manpower in almost all loco sheds of IR. Proposal for creation of post get stuck up for non availability of matching surrender. Electrical department with expanding activity of additional locos, additional Electrified section due to new Electrification getting added every year and additional AC service being added with introduction of Superfast and Premium service, finds it difficult to create and maintain new infrastructure without creation of additional post. The policy of matching surrender for creation of post does not sound financially convincing because creation of new post and manning the same will only increase overall expenditure to IR on year to year comparison. This is because any creation of post by providing
only matching surrender of post, taken from staff bank , which were dormant over the past years, will only increase overall expenditure for IR. In fact, creation of post should be directly related to direct saving in overall expenditure for same GTKM of transportation in successive years of train operation over the zone. It should get delinked to availability of posts in staff bank. For example, if use of state of the art 3-phase Electric locos have reduced expenditure on energy compared to the previous year, such savings achieved in money value terms can be used ( at least 50% of it) for creation of post for TRD and Loco maintenance.
In ECR during 2013-14, reduction in SEC for Freight service was 4.5% ( 6.18 during 2012-13 and 5.90 during 2013-14),while in Passenger service saving was 0.96% (19.79 during 2012-13 and 19.60 in 2013-14). In money value terms, this amounts to saving of Rs 18.639 Cr
( For Freight :- Savings= Difference in SEC X UNIT RATE X GTKM earned during 2013-14 =
70.28X 5.55 X 10.275 x 10 = Rs 16.70 Cr7For Pass:- Savings= 0.19 X 5.55 X 1.839 X 10 =
Rs 1.939 Cr)
This saving in expenditure has been achieved because of use of energy efficient locos, at least 50% of this saving can be used for creation of post. Such creation will not affect overall expenditure on Electric train operation yet it will help maintaining additional locos in sheds and TRD assets.
IR need to think on these lines for maintaining financial viability as a commercial organisation and also to fulfil aspiration of common man.
2726

IRIEEN JOURNAL VOL-24, NO.3, 2014 IRIEEN JOURNAL VOL-24, NO.3, 2014
SL NO ITEM SUB HEAD 2012-13 2013-14 1 Running repair in shed C 510 66,00,05,494 79,60,72,143 2 Running repair in shed /
workshop C 520 8,16,49,297 13,69,37,009
3 POH cost in Workshop C 530 20,13,56,634 23,70,32,598 4 IOH cost C 540 0.00 0.00 5 Special repair &
Overhauling C 550 1,07,46,491 1,40,32,339
6 Other repairs C 560 0.00 0.00 7 Misc charges C 570 0.00 0.00 8 Repairs like Break
Equipment C 580 0.00 0.00
9 Adjustment C 590 0.00 0.00 10 Plant and Equipment in
shed E 440 (443) 65,35,318 2,36,622
11 Credit of material released from Work
C 920, E 930 - 3,63,632 - 1,36,837
12 TOTAL 95,99,29,602 118,41,73,874
ANNEXURE 1
COMPONENT OF REPAIR & MAINTENANCE COST OF LOCO FOR 2012-13 & 2013-14(AS PER RAR OF ECR)
(In Rs)
SL NO ITEM SUB HEAD 2012-13 2013-14 1 Direct supervision of
Running Staff F 311 7,28,56,919 7,55,09,620
2 Loco Running staff and crew
F 312 162,77,63,670 193,17,52,557
3 Shed and yard staff F 321 73,93,424 85,54,205 4 Examiner & Cleaner F 322 6,56,72,966 6,64,78,661 5 Lubricants F 331 9,04,088 39,14,721 6 Operating stores F 332 1,15,06,216 1,56,50,456 7 Contingent Expenses F 333 80,57,598 87,57,280 8 Misc Expenses F 340 2,95,716 2,56,182 TOTAL 179,44,50,597 211,08,73,682
ANNEXURE 2
COMPONENT OF OPERATING EXPENDITURE FOR 2012-13 & 2013-14(AS PER RAR OF ECR)
(In Rs)
ANNEXURE - 3
OHE MAINTENANCE COST INCLUDING PLANT AND EQUIPMENT FOR 2012-13 & 2013-14(AS PER RAR OF ECR)
(In Rs)
SL NO
ITEM SUB HEAD 2012-13 2013-14
1 Direct supervision of OHE Plant & Equipment
E 141 2,39,83,740 2,26,22,823 2 E 142 0.00 0.00 3 E 143 1,85,09,544 1,57,26,106 4 E 144 0.00 0.00 5 E 151 10,78,02,706 12,17,29,678 6 E 152 0.00 0.00 7 E 153 78,94,575 95,59,020 8 E 158 0.00 0.00 9 E 160 47,27,486 62,62,577 10 OHE Maintenance E 410 - 85,643 - 81,900 11 Normal Maintenance &
Repair E 411 38,79,23,824 44,50,24,228
12 Modification to OHE E 412 90,000 50,00 13 PSI E 420 1,94,827 8,00,573 14 Power supply Equipment
,Traction E 420 4,80,64,523 7,24,17,998
15 Other Plants and Equipment for Traction
E 470 20,144 16,087
16 Credit for released material E 930 0.00 0.00 17 TOTAL 59,91,25,726 69,40,82,190
2928

IRIEEN JOURNAL VOL-24, NO.3, 2014 IRIEEN JOURNAL VOL-24, NO.3, 2014
R. K. ChaudharyCEE / USBRL Project
1.0 Introduction:-
Udhampur-Shri Mata Vaishno Devi Katra section of USBRL Project has been dedicated to Nation by Hon'ble
thPrime Minister on 4 July 2014. This section connects two important towns of Jammu Province i.e. Udhampur and Katra via Chakrakhwal. Shri Mata Vaishno Devi Shrine has religious importance of National level where pilgrimage come from all parts of India. This Railway alignment passes through the unstable geological formations and hilly undulating & difficult terrain of Shivalik and Trikuta range of Himalayas. This section has 9 major Bridges, 29 minor Bridges, 12 ROB/RUBs and 10 Tunnels. The total length of tunnels is 10.936 km i.e. 42.7% of total 25.6 km route. The Tunnel T-23 is the longest tunnel with ballastless track (BLT) and having a length of 3.120 km. T-25 is the second longest tunnel having length of 2.49 km on this section. These two tunnels have artificial forced ventilation systems.
2.0 Safety Systems provided in Tunnels:-
All the tunnels on this section were constructed between 2000- 2007 except the diversion of 1.7 km of Tunnel T-23. No guidelines regarding safety measures were available at that time. All these tunnels have been constructed as per the prescribed schedule of dimensions with conservative cross section to curtail cost of construction where even retro-fitment of safety equipments become difficult as the same may cause infringement to SOD's. Through it was a difficult task to provide the safety equipments as per the guidelines of UIC/NFPA, efforts have been made to provide most of the safety items in these tunnels as described below:-
2.1 Ventilation system for Tunnels T-23 and T-25:-
Ventilation and illumination systems of tunnel T-23 and T-
Safety Systems provided in Tunnel T‐23 and T‐25 on Udhampur‐Katra sectionAn Illustration.
25 has been designed and provided based on the systems provided in Tunnel T-7 on Jammu -Udhampur section which is operational since April 2005, similar to systems in Konkan Railway, and based on simulation studies done for tunnels on Udhampur- Katra section in2006 by Dr.Bent A. Borresen & Dr.Bard Venasof M/S Norconsult, Norway. The Technical approval in principle for ventilation and illumination schemes for T-23 & T-25 has been conveyed by CEE/N.Rly.
(a)Ventilation in Tunnel T-23:-
24 Nos. of 22 KW, 840 mm diameter bi-directional Jet fans at a spacing of 126 m have been provided in Tunnel to achieve proper ventilation, keep CO level and temperature within limits. The total load of jet fans is 528 KW. CO level is to be maintained below 50 PPM & temperature level within 40˚C.
(b)Ventilation in Tunnel T-25:-
20 Nos. of 22 KW, 840 mm diameter bi-directional Jet fans at a spacing of 120 m have been provided in Tunnel to
achieve proper ventilation, keep CO level and temperature within limits. The total load of jet fans is 440 KW. CO level is to be maintained below 50 PPM & temperature level within 40˚C.
2.2 Power Supply System:
(a) Power Supply System for T-23:-
11 KV Power supply from PDD is taken for power supply System of illumination and ventilation of T-23, 2x1000KVA, 11KV/415V and 2x750KVA, 415V/3.3KV transformers have been provided in main substation building at Katra end portal. DG set of 500KVA has been provided for emergency supply for maintaining reliable supply for ventilation & lighting system. A 82.5KVA DG set has been provided for lighting purpose only. 2KVA UPS provided for emergency backup of sensors for 90 minutes. 1x300KVA, 3.3KV/415V transformer is provided in remote substation building at Udhampur end. 1x300 KVA, 3.3 KV/415V transformer has been provided in middle substation inside the tunnel.
(b) Power Supply System for T-25:-
11 KV Power supply from PDD is taken for power supply System of illumination and ventilation of T-25, 2x750KVA, 11KV/415V and 2x500KVA, 415V/3.3KV transformers have been provided in main substation building at Udhampur end portal. DG set of 500KVA is provided for emergency supply for maintaining reliable supply for ventilation & lighting system. A 82.5KVA DG set has been provided for lighting purpose only. 2KVA UPS provided for emergency backup of sensors for 90 minutes. 1x300 KVA, 3.3KV / 415V transformer has been provided in remote substation building at Katra end. 1x300 KVA, 3.3 KV/415V transformer has been provided in middle substation inside the tunnel.
3130

IRIEEN JOURNAL VOL-24, NO.3, 2014 IRIEEN JOURNAL VOL-24, NO.3, 2014
2.3Illumination Systems:-
All the 10 Tunnels on UHP-Katra section have been provided with Illumination systems for General Lighting in the tunnels. The Tunnels T-23 and T-25 which are provided with Ventilation systems, have been provided 55 W CFLs on both sides of tunnel to achieve minimum 10 Lux Illumination level. These lighting systems have been provided on 500 kVA DG set when Ventilation system is working and 82.5 kVA DG set when Ventilation system is not required as standby power to PDD Power Supply.
Rest of the tunnels have been provided with 70W/ 150W MH lighting fixtures. All major bridges have been provided with lighting arrangements for patrolling during night, taking supply from PDD/J&K.
2.4 Monitoring of Environmental Conditions:-
In Tunnel T-23 and T-25 for monitoring of environmental conditions/pollutants, CO Sensors, Visibility Sensors, Train Location Sensors, Temperature Sensors and Wind Velocity Sensors have been provided inside tunnels with preset threshold values. The data of these sensors is transmitted to the computer provided in Tunnel Control Room through dupeline communication. The Tunnel Control Rooms are manned round the clock where the tunnel operator can take the action as required as per the condition monitoring of the tunnel environment.
2.5Communication Systems:-
Communication systems comprising of following items have been provided in both the tunnels:-
(a)Emergency communication to train crew and maintenance staff:-
Emergency sockets have been provided at every 250 mtrs inside the tunnel. If the train comes to halt inside the tunnel the Train Driver/Guard can talk with the Tunnel Control centres as well as with Section control Firozpur and inform them of any eventuality inside the tunnel.
(b)Mobile Communication:-
Mobile communication is active inside throughout the Tunnel in collaboration with M/s Bharti Airtel. Base Trans-receiver Station (BTS) along with antenna and Power Supply unit of Airtel has been installed at 960 mtrs inside the tunnel from Katra end Portal of tunnel T-23 and at 700 mtrs form Udhampur end Portal in Tunnel T-25.
E-1 Connectivity inside the tunnels for Airtel communication has been provided on Railway OFC at the BTS location. Proper signages have been marked on the BTS to alarm the persons of the Non-ionised radiations from the antenna. Mobile communication will be an important tool with the Train Crew as well as to the passengers on board the train to contact Section Controller/ Emergency Services/ ASM etc., in case of accident or emergency inside the tunnel.
(c) Public address system:-
Public Address system has been provided inside of both the Tunnels T-23 & T-25. Tunnel controller who stationed at Tunnel Control Centres can make any emergency announcement inside the tunnel to guide the passengers to avoid panic and chaos. In tunnels loudspeakers have been provided at every 200m and suitably adjusted to produce uniform sound columns inside the tunnel audible even in the noise of Train Engine.
(d) Siren for emergency :
In each tunnel T-23 and T-25, 3 Nos. sirens have been provided to alert passengers/train crew/ maintenance staff for any emergency in tunnel.
3332

IRIEEN JOURNAL VOL-24, NO.3, 2014 IRIEEN JOURNAL VOL-24, NO.3, 2014
2.3Illumination Systems:-
All the 10 Tunnels on UHP-Katra section have been provided with Illumination systems for General Lighting in the tunnels. The Tunnels T-23 and T-25 which are provided with Ventilation systems, have been provided 55 W CFLs on both sides of tunnel to achieve minimum 10 Lux Illumination level. These lighting systems have been provided on 500 kVA DG set when Ventilation system is working and 82.5 kVA DG set when Ventilation system is not required as standby power to PDD Power Supply.
Rest of the tunnels have been provided with 70W/ 150W MH lighting fixtures. All major bridges have been provided with lighting arrangements for patrolling during night, taking supply from PDD/J&K.
2.4 Monitoring of Environmental Conditions:-
In Tunnel T-23 and T-25 for monitoring of environmental conditions/pollutants, CO Sensors, Visibility Sensors, Train Location Sensors, Temperature Sensors and Wind Velocity Sensors have been provided inside tunnels with preset threshold values. The data of these sensors is transmitted to the computer provided in Tunnel Control Room through dupeline communication. The Tunnel Control Rooms are manned round the clock where the tunnel operator can take the action as required as per the condition monitoring of the tunnel environment.
2.5Communication Systems:-
Communication systems comprising of following items have been provided in both the tunnels:-
(a)Emergency communication to train crew and maintenance staff:-
Emergency sockets have been provided at every 250 mtrs inside the tunnel. If the train comes to halt inside the tunnel the Train Driver/Guard can talk with the Tunnel Control centres as well as with Section control Firozpur and inform them of any eventuality inside the tunnel.
(b)Mobile Communication:-
Mobile communication is active inside throughout the Tunnel in collaboration with M/s Bharti Airtel. Base Trans-receiver Station (BTS) along with antenna and Power Supply unit of Airtel has been installed at 960 mtrs inside the tunnel from Katra end Portal of tunnel T-23 and at 700 mtrs form Udhampur end Portal in Tunnel T-25.
E-1 Connectivity inside the tunnels for Airtel communication has been provided on Railway OFC at the BTS location. Proper signages have been marked on the BTS to alarm the persons of the Non-ionised radiations from the antenna. Mobile communication will be an important tool with the Train Crew as well as to the passengers on board the train to contact Section Controller/ Emergency Services/ ASM etc., in case of accident or emergency inside the tunnel.
(c) Public address system:-
Public Address system has been provided inside of both the Tunnels T-23 & T-25. Tunnel controller who stationed at Tunnel Control Centres can make any emergency announcement inside the tunnel to guide the passengers to avoid panic and chaos. In tunnels loudspeakers have been provided at every 200m and suitably adjusted to produce uniform sound columns inside the tunnel audible even in the noise of Train Engine.
(d) Siren for emergency :
In each tunnel T-23 and T-25, 3 Nos. sirens have been provided to alert passengers/train crew/ maintenance staff for any emergency in tunnel.
3333

IRIEEN JOURNAL VOL-24, NO.3, 2014 IRIEEN JOURNAL VOL-24, NO.3, 2014
(e) Hotline System:
At the Tunnel Control Centre, exclusive Hot lines have been provided with the adjacent stations for exchanging information before passage of trains through the tunnels. One Railway phone and one FWT (Fixed Wireless Terminal) has also been provided for STD connectivity.
(f)Ventilation Maintenance Communication System:
In addition to above, for maintenance of Ventilation system, the telephone sockets have been provided below each jet fan to communicate between the Tunnel Control Room and the maintenance staff.
2.6Fire Fighting systems:-
Since these tunnels were constructed before the issue of UIC guidelines, no fire fighting system were planned at the time of construction. As retro fitment measures, following systems have been provided/planned.
(a)In Tunnel No T-23 and T-25, 9 Ltr Back Pack Water Mist Fire Extinguishers and 50 Ltr trolley mounted Water
Mist Fire Extinguishers, 1 No each on each portal of both the tunnels have been provided. Based on the recommendation by DIG/Fire/CISF, the 9/10 Ltr Back Pack and 50 Ltr trolley mounted water mist fire extinguishers are required to be provided in alternate trolley refuges of the tunnel for which necessary action has been initiated. The water mist fire extinguishers are suitable for all kind of fires including electrical fire upto 33 kV voltage system.
(c) Since the Electrical Panels provided at Electrical Sub-stations are unmanned, the provision for Auto Fire Detection and Auto Extinguishing gas tube based fire-fighting system has been planned and the same will be provided to prevent the fire in Electrical Panels which are a major source of fire due to make/break action in switchgears.
(d) 20 Nos Fire Safety Gears have been ordered which can be used by the staff while entering in the tunnel for fire fighting. 5 sets of Fire Safetygears will be kept on each portal of Tunnel T-23 and T-25 with GRP staff at their Security Huts.
(e) DRDO has made a study tour of all the tunnels for suggesting the measures to be taken for fire fighting arrangements in the tunnels, for which report is awaited.
(f) DIG/FIRE/CISF has recommended for provision of Water Mist Fixed Installation for Tunnels T-23 & T-25 with a working pressure of 15 Bar. The Water Mist system should be integrated with Linear Heat Sensing (LHS) cable to activate it automatically. The decision for making the retro fitment of fire fighting equipment based on the recommendation of DIG/FIRE/CISF and DRDO, will be reviewed and a appropriate action based on the risk analysis versus cost of the systems need to be taken.
(b)Electrical Sub-stations at Tunnel Portals, Middle Sub-stations and Remote Sub-Stations have been provided with Powder Type Fire Extinguishers for fire fighting of electrical equipments.
2.7 Guidance Signages:
(a) In Tunnel T-23 and T-25, referrective distance signages showing the nearest/farthest of escape route of portals have been provided at a distance of 50m intervals, alternatively on both walls of the tunnels.
(b)Contact Details of emergency services have been displayed on each tunnel portal faces of both the tunnels and in the Tunnel Control Room of both the tunnels. These can be used by the Emergency Rescue Services/Railway staff/Passengers, in case of any emergency to seek the help for rescue/ restoration.
2.8 Staff Training:-
The Tunnel Safety Manual for Tunnel T-23 and T-25 describing the procedure for evacuation of passengers in case of emergency and working Instructions for operation of Ventilation and Illumination systems for Tunnel T-23 and T-25 on Udhampur-Katra section has been issued giving the working instructions for train crew, Operating staff and Tunnel Control Operator in case of normal operation as well as in emergency. Necessary training has been imparted to open line staff of Operating Department and Electrical Department for familiarising with working of various systems and understanding their responsibilities.
2.9 Appendix
(A)Comparison of UIC-779R requirement with compliance in Tunnels T-23 & T-25.
(B)Comparison of NFPA-130 requirement with compliance in Tunnels T-23 & T-25.
Refer : Tunnel Safety Manual (Procedure for evacuation of passengers in case of emergency and working instructions).
3534

IRIEEN JOURNAL VOL-24, NO.3, 2014 IRIEEN JOURNAL VOL-24, NO.3, 2014
Systems Details UIC Cl. of UIC 779-9R
Fire protection requirement for structures
Tunnel structure design.
~ ~ √ I-22 Not designed as per ISO-834 & Eurocode 1
*
Escape Routes/ Lateral/ Vertical exits/cross
passage.
Every 1000 meter/Parallel service
Tunnel.
~
T-23
~
T-25
√
I-40,I-43, I-44, I-45, I-46 & I-47.
Remarks
Not Provided **
Track Drainage System
Remove water from Tunnel.
√
√
√
I-26
Provided
Power Supply System
Two dependent power supplies
√
√
√
I 65 & I-67
one source from PDD & other from DG set.
Diesel Generator
√
√
~
Substation on Portals & inside Tunnel.
√
√
~
Design requirement
Three sub-stations.
UPS for Critical feature
√
√
√
I-67 (60min)
90 mins.
Lighting System
Tunnel Lighting
√
√
~
55 W CFL-15 lux
Emergency Lighting
√
√
√
I-41
55 W CFL-(15 lux) on DG set.
Fire Detection system
Alarm Push Button
√
√
~
Audio Visual alarm
provided.
Somke Detector √ √ √ I-23 CO sensors Provided
Control system √ √ √ I-68, Integration with main control centre.
Fire Fighting in Tunnel.
Water Line & Hydrants
~
~
√
I-64
Not Provided ***
Fire fighting for Equipment Room
CO2 dry powder fire extinguisher provided.
√
√
√
I-24
Manual operationSystems on UPS
Emergency Lighting
~
~
√
I-41
On DG set.
Escape Signs
√
√
√
I-40
Provided
Emergency Phone
√
√
√
I-42
Provided
Train detection system
√
√
√
I-3
Provided
Radio / Speaker System
√
~
√
I-66
Provided
Ventilation Control
Regular
operation
(air-
quality)
√
√
√
I-25
Provided
Emergency Option (detection, velocity)
√
√
√
I-25
Provided
Notes
* Tunnels have concrete lining of 30 cm throughout the length as in case of T -80 where fire safety tests were ratified.
** 1) Railway Board's letter No. 2010/W-2/NR/J&K/05 dated 01.09.2010 exempts provision of any escape tunnel upto 3 kms.
2) Specifically for T-23 Railway Boards despention vide letter No.2013/W-2/NR/NL/14 dated 15.01.2014 is available.
*** Please refer to Railway Board's letter 2013/W-2/NR/NL/14 as per which disaster management plan to be done for future tunnels.
Comparison of Provisions in T-23 &T-25 with respect to UIC 779-9R
Infrastructure (I) Reference to Code
Provision as per NFPA 130
Provided for Tunnel T-23 &
T-25
Remarks
Warning Signs
3.1.3
Required
Provided
11 KV & 415 V danger signs provided.
Emergency Telephone
3.1.4
Required
Provided
Provided throughout the tunnels and control rooms.
Structural Requirement
3.2.1
Required
Provided
Ventilation System for Fire Emergency
3.2.2
Required
Provided
24 Nos. Jet fans have been provided in T-23 and 20 Nos. Jet fans have been provided in T-25, work in forward/reverse direction.
Emergency Lighting
3.2.4.7
Required
Provided
Every light fitting provided is fed from DG set.
Portable Fire Extinguishers
3.2.7.4
Required
Provided
Provided in Main Sub-station, Middle Sub-station, Remote Sub-
station
and in tunnel niches.Ventilation fan fire
suitability
4.3.1
& 4.3.2
250 ˚
for one
hour
Provided
Provided suitable for 250˚ for two hour.
Emergency Ventilation System
Control
4.6
Required
Provided
Operation of emergency ventilation system through
software and hardware. Fire Protection for
Emergency Ventilation System
4.7.3
Required
Provided
FRLS cables have been provided (as per IS 7098 Pt-II)
All Insulation suitability
4.7.5
90˚
Provided
Provided accordingly
Emergency Procedures
7.2
Required
Provided
Tunnel Safety Manual for Passenger evacuation plan made
.Participating
Agencies
7.5
Required
Informed
Agencies involved for emergency informed.
Central Supervising Station
7.6
&
8.2
Required
Provided
Tunnel Control Centre provided at Katra end of T-23 and Udhampur end of T-25.
Radio Communication.
8.3
Required
Provided
Mobile Phone connectivity provided.
Telephones
8.4
Required
Provided
BSNL, Railway control phones provided.
Public Address system
8.7
Required
Provided
Provided inside tunnels.
Temperature Control
B-1.1
Required
Complied
Temperature monitoring done through temperature sensors.
CO Sensors - - Provided Ventilation control strategy planned for threshold value 50
ppm.DPM Sensors - - Provided Ventilation control strategy
planned accordingly.AVM Sensors - - Provided Ventilation control strategy
planned after measurement of direction & relative velocity of air
w.r.t. train.
NFPA 130 (2000 Edition) recommendations & their applications for TunnelsT-23 & T-25 on Udhampur-Katra section of USBRL Project
Appendix A Appendix B
3736

IRIEEN JOURNAL VOL-24, NO.3, 2014 IRIEEN JOURNAL VOL-24, NO.3, 2014
Fvmeguesìj
(Insulator):
Jen HeoeLe& pees SkeÀ efveefM®ele Jeesuìspe Hej DeHeves ceW mes keÀjvì
(FueskeÌì^esvme) keÀes yenves veneR oslee nw Gmes Fvmeguesìj ³ee kegÀ®eeuekeÀ keÀnles nQ~
ceeFkeÀe, Heesme&efueve keÀeB®e, jye[, yewkesÀueeFì Fl³eeefo kegÀí De®ís Fvmeguesìjes
kesÀ GoenjCe nQ~ Fvmeguesìj ceW FueskeÌì^e@ve v³etefkeÌue³eme (veeefYekeÀ) kesÀ meeLe
cepeyetleer mes Heeme-Heeme yebOes nesles nQ~ FmeceW mJelev$e FueskeÌì^e@ve yengle keÀce
nesles nQ Deewj DeCegDeeW kesÀ yeer®e ceW FuewkeÌì^e@veeW keÀe Deeoeve-He´oeve yengle Lees[e
neslee nw~ FmeefueS Fvmeguesìj cesb mes FuewefkeÌì^keÀ keÀjbì veneR iegpejleer nw Deewj
³eefo FmekesÀ efmejeW Hej yengle DeefOekeÀ Jeesuìspe oer pee³es lees yengle keÀce keÀjbì
iegpejleer nw~
Fvmeguesefìbie cewìerefj³eue kesÀ iegCe
(Qualities of Insulationg Materials):
De®ís FvmegueseEìie HeoeLe& kesÀ efvecveefueefKele cegK³e iegCe nQ pees efkeÀmeer SkeÀ
efJeMes<e keÀe ®egveeJe keÀjles mece³e O³eeve ceW jKeves ®eeefnS :
1. ³en ue®eeruee nesvee ®eeefnS ~
2. FmekeÀer ³eebef$ekeÀ (cewkesÀefvekeÀue) MeefkeÌle De®íer nesveer ®eeefnS~
3. ³en veceer keÀe Mees<ekeÀ veneR nesvee ®eeefnS~
4. ³en Deemeeveer mes efkeÀmeer Yeer DeekeÀej ceW {euee pee mekesÀ~
5. ³en DepJeueveMeerue nesvee ®eeefnS~
6. ³en Sefme[ ³ee SukeÀueer mes He´YeeefJele veneR nesvee ®eeefnS~
7. keÀjbì ueerkesÀpe keÀer mecYeeJevee keÀes keÀce keÀjves kesÀ efueS FmekeÀer mHesefmeefHeÀkeÀ
jsefpemìQme DeefOekeÀ nesveer ®eeefnS~ FmeceW G®®e leeHekeÀ^ce Hej keÀece keÀjves
keÀer #ecelee nesveer ®eeefnS ke̳eeWefkeÀ Fvmeguesìj keÀe leeHeceeve ye{eves mes
Fvmeguesìj kesÀ Fvmeguesefìbie iegCe-veä nes peeles nQ~
8. FmekeÀer [eF& FuewefkeÌì^keÀ mì^svLe DeefOekeÀ nesveer ®eeefnS~
1 efce.ceer. ceessìer Fvmeguesìj keÀer Huesì keÀes oer peeves Jeeueer Jeesuìspe keÀe Jen
ceeve efpeme Hej Fvmeguesìj kesÀ FvmegueseEìie iegCe veä nes pee³es, Fvmeguesìj
mì^svLe keÀnueeleer nw~ Fvmeguesìj keÀer [eF&-FuesefkeÌì^keÀ mì^svLe keÀes
efkeÀueesJeesuì/efce. ceer. ceesìeF& cesb veeHee peelee nQ~
meeceev³e Fvmeguesefìbie cewìsefj³eue, GvekesÀ iegCe Deewj Ghe³eesie
(Common Insulating Materials, their Properties and
Uses):
FuewefkeÌì^keÀue Deewj FuewkeÌì^e@efvekeÌme kesÀ keÀeceeW kesÀ efueS efvecveefueefKele
Fvmeguesìj DeefOekeÀebMe He´³eesie efkeÀ³es peeles nQ~
1. ceeFkeÀe :
³en SkeÀ yengle De®íe Fvmeguesìj nw Deewj FuewefkeÌì^keÀue Deewj FuewkeÌì^e@efvekeÀ
keÀe³eeX kesÀ efueS SkeÀ FvmegueseEìie HeoeLe& keÀer lejn DeefOekeÀlej He´³eesie efkeÀ³ee
peelee nw~ FmekeÀer mHesefmeefHeÀkeÀ jsefpemìQme Deewj [eF-FuewefkeÌì^keÀ mì^svLe yengle
DeefOekeÀ nesleer nw~ ³en DeefivejesOekeÀ nw Deewj veceer keÀes Meesef<ele veneR keÀjlee nw~
ceeFkeÀe ye[er-ye[er MeerìeW ceW KeeveeW mes efvekeÀeuee peelee nw~ FmekeÀer
0.0125mm ceesìeF& keÀer Heleueer MeerìW Yeer He´eHle keÀer pee mekeÀleer nQ~ Heleueer
MeerìeW ceW GHeueyOe nesves kesÀ keÀejCe FmekesÀ jesue yevee³es pee mekeÀles nw Deewj Ssmes
mLeeveeW Hej He´³eesie efkeÀ³ee pee mekeÀlee nw peneB Hej efkeÀ peien meerefcele nes~ ceeFkeÀe
1200 Hej vejce nesvee Meg© nes peelee nw~ kegÀí Yeer nes 60o oC 0 C Hej ³en
yengle efìkeÀeT nw~ ceeFkeÀe keÀes FuewefkeÌì^keÀ Dee³ejve (He´sme), keÀc³egìsìj
efmeicesvìme, DeefOekeÀ Jeesuìspe keÀer ceMeerveeW kesÀ muee@ì FvmeguesMeve, keÀv[svmej
Deewj FuewefkeÌì^keÀue Deewj FuewkeÌì^e@efvekeÌme kesÀ keÀF& otmejs keÀe³eex ceW SkeÀ Fvmeguesìj
keÀer lejn He´³eesie efkeÀ³ee peelee nw~
2. jye][ :
jye][ MegOo ©He ceW yengle vece& nesleer nw Deewj Fmes keÀþesj yeveeves kesÀ efueS
FmeceW 5% meuHeÀj Deewj kegÀí otmejs Keefvepe HeoeLe& efceuee³es peeles nQ~ leye ³en
JeukesÀveeFp[ jye][ keÀnueelee nw~ ³en kegÀí meercee lekeÀ veceer keÀes Meesef<ele vener
keÀjlee nw~ FmeefueS Fmes efYeVe-efYeVe He´keÀej kesÀ FuewefkeÌì^keÀue GHekeÀjCeeW, uees
leLee ceeref[³ece leejeW kesÀ FvmeguesMeve, jye][ kesÀ omleeves, yewìjer kesÀ keÀþesj
jye][ keÀvìsvej Fl³eeefo ceW Fvmeguesefìbie cewìerefj³eue keÀer lejn He´³eesie efkeÀ³ee
peelee nw~
3. Heesueer efJevee³eue keÌueesjeF[ (P.V.C.):
³en SkeÀ jemee³eefvekeÀ HeoeLe& nw~ FmekesÀ FvmegueseEìie iegCe yengle De®ís nQ
Deewj Deye ³en ìsyeue kesÀ kewÀye ìeFHe FvmeguesMeve mes De®íe peevee peelee nw~
Fmes efkeÀmeer Yeer DeekeÀej ceW {euee pee mekeÀlee nw~ ³en keÀF& jbieeW ceW GHeueyOe neslee
nw~ ³en veceer keÀes Meesef<ele veneR keÀjlee nw Deewj Fme Hej lesue, ie´erme, Decue keÀe
He´YeeJe veneR He[lee nw~ P.V.C. kesÀ FvmegueseEìie iegCe yengle De®ís nQ Deewj
DeepekeÀue ³en kesÀJeue FvmeguesMeve kesÀ efueS jye][ kesÀ mLeeve Hej He´³eesie efkeÀ³ee
pee jne nw~
4. SsyeesveeFì ³ee JegukeÀsveeFì :
³en SkeÀ De®íe Fvmeguesìj nw Deewj ³en efkeÀmeer Yeer DeekeÀej ceW {euee pee
mekeÀlee nw~ JegukesÀveeFp[ jye][ ceW 30 mes 50% meuHeÀj efceueekeÀj Fmes 3 mes
4 Iebìs lekeÀ 15 o0 C Hej iece& keÀjves Hej yevee³ee peelee nw~ ³en keÀþesj HeoeLe& nw oDeewj 70 C Hej vejce nes peelee nw~ Fmes jsefpemìQme yee@keÌme kesÀ keÀJej, ues[
Sefme[ yewì^er kesÀ keÀvìsvej, Hewveue He´sÀce Fl³eeefo keÀes yeveeves kesÀ efueS He´³eesie efkeÀ³ee
peelee nw~
5. yewkesÀueeFì :
³en SkeÀ Yetjs jbie keÀe efmevLesefìkeÀ HeoeLe& nw~ ³en í[eW, ìîetye, Meerì Deewj
efkeÀmeer efJeMes<e keÀece kesÀ efueS efkeÀmeer Yeer DeekeÀej ceW {euee pee mekeÀlee nw~
SyeesveeFì keÀer DeHes#ee FmekeÀe keÀece keÀjves keÀe leeHeceeve DeefOekeÀ neslee nw Deewj
Fme Hej veceer lesue Deewj Decue keÀe He´YeeJe veneR He[lee nw~ ³en yengle De®íe
FvmegueseEìie HeoeLe& nw Deewj Fmes efmJe®eeW, nesu[jeW, Jeeue mee@kesÀì, meerueeRie jespe
Fl³eeoer keÀes yeveeves kesÀ efueS He´³eesie efkeÀ³ee peelee nw~
6. Ssmeyesmìme :
³en SkeÀ meHesÀo HeÀeFyej HeoeLe& nw Deewj ³en DepJeueveMeerue
(Incombustible) nw~ ³en G<cee keÀe kegÀ®eeuekeÀ nw~ Fmes jmmeeW ìsHe, Meerì
Deewj mueerJme (sleeves) cesW yevee³ee peelee nw~ Fmes YeefƳeeW (Ovens),
FuewefkeÌì^keÀ Dee³ejve, kesÀleueer, meefke&Àì ye´skeÀj keÀs DeekeÀ& ®ewcyej cesb FvmeguesMeve
kesÀ efueS Meerì kesÀ DeekeÀej ceW He´³eesie efkeÀ³ee peelee nw~
7. iueeme :
³en SkeÀ HeejoMe&keÀ Fvmeguesìj nw Deewj Fme Hej jemee³eefvekeÀ yee<He keÀe
He´YeeJe veneR He[lee nw~ Fmes Yeer, efkeÀmeer Yeer DeekeÀej ceW {euee pee mekeÀlee nw
Deewj ³en DeefOekeÀ leeHeceeve Hej Yeer keÀe³e& keÀj mekeÀlee nw ~ Fmes FuesefkeÌì^keÀ
uewcHe, ìîetye, cejke̳etjer DeekeÀ& jsefkeÌìHeÀe³ej keÀs iueeme yeuye, DeesJej-
nw[ueeFve Fvmeguesìj Fl³eeefo keÀes yeveeves cesWb He´³eesie efkeÀ³ee peelee nw ~ Fmes iueeme
ìsHe, Deecesx®ej JeeFbef[bie keÀer mueerJme Fl³eeefo keÀes yeveeves cebs Yeer He´³eesie efkeÀ³ee
peelee nw ~
8. Heesme&efueve ë
³en ®eerveer efceìdìer Deewj keÌJeeì&pe (HelLej) mes yevee³ee peelee nw ~ Deewj
efkeÀmeer Yeer DeekeÀej cesW {euee pee mekeÀlee nw ~ ³en meHeÀso ³ee Yetjs jbie keÀes neslee nw
Deewj ³en iueeme keÀer lejn YetjYetje venerR nw ~ ³en jemee³eefvekeÀ Jee<He Deewj
JeeleeJejCe Üeje He´YeeefJele venerR neslee nw ~ Heesme&efueve keÀes veceer jesOekeÀ yeveeves keÀs
efueS Fmes iuesp[ (Glazed) keÀj efo³ee peelee nw ~ Fmes DeesJejnw[ ueeFve keÀs
uees, ceeref[³ece leLee neF& ìsvmeve Fvmeguesìj, efmJe®eesW keÀer yesme, efkeÀìkeÀwì
Heîetpe, nesu[me&, ì^ebmeHeÀe@jcej yegefMebie Fl³eeefo keÀes yeveeves keÀs efueS He´³eesie efkeÀ³ee
peelee nw ~
9. HesHej ë
³en veceer keÀes Meesef<ele keÀjlee nw uesefkeÀve peye Fvmeguesefìbie Dee@³eue ³ee JeskeÌme
(ceesWce) cesb [gyees efo³ee peelee nw leye ³en De®íe Fvmeguesìj yeve peelee nw ~ ³en
jye]æ[ keÀer DeHes#ee memlee Deewj Dee@³eue HeÀeru[ HeeJej keÀsyeume cesW jye]æ[
FvmeguesMeve keÀs mLeeve Hej He´³eesie efkeÀ³ee peelee nw ~ Fmes keÀsyeue keÀer leejesW keÀes
3938

IRIEEN JOURNAL VOL-24, NO.3, 2014 IRIEEN JOURNAL VOL-24, NO.3, 2014
12. EMU Technology in Indian Railways - Rs. 250/-
140 1

A JOURNAL DEVOTED TO RAILWAY ELECTRICAL ENGINEERINGA JOURNAL DEVOTED TO RAILWAY ELECTRICAL ENGINEERING
otjYee<e : (0253) 2407499, 2407399
HewÀkeÌme : (0253) 2462548
F&-cesue : [email protected]
JesyemeeFì : www.irieen.indianrailways.gov.in
A JOURNAL DEVOTED TO RAILWAY ELECTRICAL ENGINEERINGA JOURNAL DEVOTED TO RAILWAY ELECTRICAL ENGINEERINGA JOURNAL DEVOTED TO RAILWAY ELECTRICAL ENGINEERINGA JOURNAL DEVOTED TO RAILWAY ELECTRICAL ENGINEERING
VOL. 25 No. 3 July - September 2014
DISCLAIMERThe views contained in articles published in this
journal are the views of Authors and not of IRIEEN
aPrinted by : B. P. Verma, Dy. Chief Manager, Printing & Stationery, Central Railway Printing Press, Byculla, Mumbai-27.