disclaimer - marketscreener.com · ∞boost digital marketing and social media presence...
TRANSCRIPT


Disclaimer
2
This presentation does not constitute an offer of securities for sale in the United States of America or any other jurisdiction.
Certain information contained in this document may include projections and forecasts. They express objectives based on current assessments and estimates of the Group’s executive management which are subject to numerous factors, risks and uncertainties. Consequently, reported figures and assessments may differ significantly from projected figures. The following factors among others set out in the Reference Document (Document de Référence) filed with the French Financial Markets Authority (Autorité des Marchés Financiers - AMF) on April 9, 2014 which is available on Kering’s website at www.kering.com may cause actual figures to differ materially from projected figures: any unfavourable development affecting consumer spending in the activities of the Group in France and abroad, notably for products and services sold by the Luxury Goods and Sport & Lifestyle brands, the events, crises, fears, and resulting costs of complying with environmental, health and safety regulations and all other regulations with which Group companies are required to comply; the competitive situation on each of our markets; exchange rate and other risks related to international activities; risks arising from current or future litigation. Kering gives no commitment to updating and/or revising and/or commenting any projections and forecasts, or their impact on the results and perspectives of the Group, which may be contained in this presentation.
The information contained in this document has been selected by the Group’s executive management to present Kering’s Full-year 2014 results. This document has not been independently verified. Kering makes no representation or undertaking as to the accuracy or completeness of such information. None of the Kering or any of its affiliates representatives shall bear any liability (in negligence or otherwise) for any loss arising from any use of this presentation or its contents or otherwise arising in connection with this presentation.
IN NO WAY DOES KERING ASSUME ANY RESPONSIBILITY FOR ANY INVESTMENT OR OTHER DECISIONS MADE BASED UPON THE INFORMATION PROVIDED IN THIS PRESENTATION. READERS ARE ADVISED TO REVIEW THE COMPANY'S REFERENCE DOCUMENT AND THE COMPANY'S APPLICABLE AMF FILINGS BEFORE MAKING ANY INVESTMENT OR OTHER DECISION.

3
François-Henri Pinault Chairman & CEO

4
2 0 1 4 , b u i l d i n g u p
Jean-François Palus
2014 annual results
Group Managing Director

Our multi-brand model – virtuous and distinctive
5
Group revenue dynamic (comparable growth, in %)
Group revenue breakdown (by region, and comparable growth in %)
Group EBITDA (in €m and change in %)
Free cash flow from operations (reported change, in €m)
Steady revenue growth quarter after quarter, higher comparable consolidated EBIT
Western
Europe
31% (+2%)
North America
21% (+6%) Japan
10% (+7%)
Asia Pacific
26% (+5%)
RoW
12% (+6%)
2014 Comparable
FX change
Net impact of
currencies*
2013
1,991
-7.1%
2,043
+4.5%
1,078
+26%
2013 2014
857
(*) Combined currency and hedging impact
FY 14:
+4.5% FY 13:
+4.0% 2014 €10bn
4.2% 4.1%
4.6%
4.9%
Q1 14 Q2 14 Q3 14 Q4 14
2 0 1 4 , b u i l d i n g u p

Growth by segment (comparable revenue growth, in %)
Breakdown of Luxury revenues (by region, and comparable growth, in %)
Western
Europe
32% (+2%)
North America
19% (+6%) Japan
10% (+13%)
Asia Pacific
31% (+5%)
RoW
8% (+6%)
2014 €6.8bn
6.4%
5.5%
3.8% 4.3%
-0.2%
1.1%
6.1% 6.4%
Q1 14 Q2 14 Q3 14 Q4 14
Luxury Sport & Lifestyle
Well-balanced, resilient profile; multiple opportunities
Luxury: plentiful growth opportunities
Geographic expansion
∞ Huge growth drivers in key markets
Complementary stages of maturity
∞ Significant potential
APAC: 22% of Saint Laurent revenues
North America: 13% of Bottega Veneta
revenues
Distribution channels
∞ Confirmed growth momentum
Luxury retail sales: +8% comparable
Luxury e-commerce: +20% comparable
∞ Opportunities from directly operated
stores
61% of Saint Laurent revenues
39% of Other Luxury Brands revenues
Product offer
∞ Clear positioning of each brand
Complementary brand portfolio
∞ Significant potential
Ready-to-wear and shoes: 11% of
Bottega Veneta revenues
Build strength in watches
6
Analysis of opportunities guiding capital allocation, ensuring sustainable performances
2 0 1 4 , b u i l d i n g u p

Integrated, pragmatic, responsive operational model
7
∞ Increasingly relevant value proposition for our customers
∞ Ongoing adaptation of the structure and effectiveness of our collections
∞ Constant search for product categories whose potential remains underexploited
∞ An innovative model: Kering Eyewear
∞ Adapted expansion of our geographic footprint
∞ Priority given to directly operated stores
∞ Flexible, down-to-earth approach to Wholesale
∞ Focus on consolidating Group digital leadership
∞ Gradual expansion of shared services model
∞ Development of Supply Chain across all entities
∞ Broad-based project to modernize and optimize our information systems
Distribution
Creation and products
Operating processes
Th
ree
actio
n a
rea
s
2 0 1 4 , b u i l d i n g u p
Kering Eyewear, a strategic initiative
8
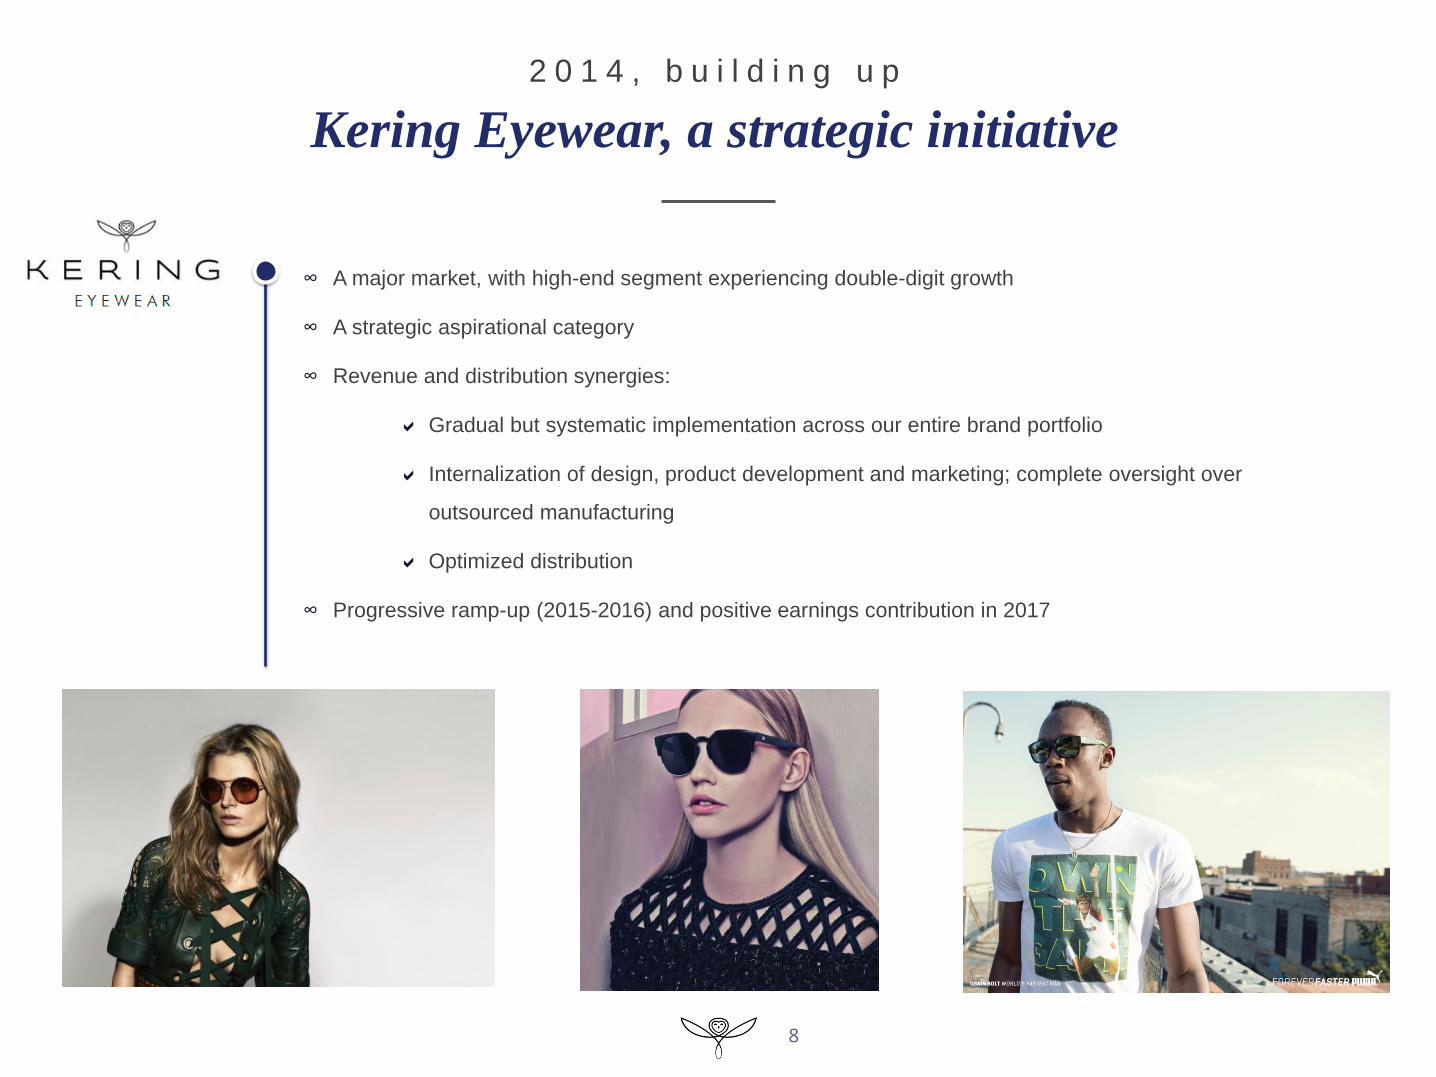
∞ A major market, with high-end segment experiencing double-digit growth
∞ A strategic aspirational category
∞ Revenue and distribution synergies:
Gradual but systematic implementation across our entire brand portfolio
Internalization of design, product development and marketing; complete oversight over
outsourced manufacturing
Optimized distribution
∞ Progressive ramp-up (2015-2016) and positive earnings contribution in 2017
2 0 1 4 , b u i l d i n g u p

Integrated, pragmatic, responsive operational model
9
∞ Increasingly relevant value proposition for our customers
∞ Ongoing adaptation of the structure and effectiveness of our collections
∞ Constant search for product categories whose potential remains underexploited
∞ An innovative model: Kering Eyewear
∞ Adapted expansion of our geographic footprint
∞ Priority given to directly operated stores
∞ Flexible, down-to-earth approach to Wholesale
∞ Focus on consolidating Group digital leadership
∞ Gradual expansion of shared services model
∞ Development of Supply Chain across all entities
∞ Broad-based project to modernize and optimize our information systems
Distribution
Creation and products
Operating processes
Th
ree
actio
n a
rea
s
2 0 1 4 , b u i l d i n g u p

∞ Brand-by-brand customization according to client requirements: in-store product availability, exchanges, store pickup...
∞ Gradual launch of new functions
∞ New site functionalities to improve client experience, traffic and conversion
∞ Boost digital marketing and social media presence
∞ Optimized tablet and smartphone applications
Reinforce the Group’s digital leadership
10
Build online presence for
the Group’s brands 1
3
Enhance the Group
brands’ online presence 2
Omni-channel and
CRM 4
Our clients
are
increasingly
…
Develop cross-channel
platforms
∞ All Group brands (apart from Boucheron, Sowind and Ulysse Nardin) run an e-commerce site
∞ Broad product, language and country coverage
∞ e-commerce now accounts for 2% of Group Luxury revenues
∞ Redefinition and uniformization of POS solutions
∞ Investment in systems and CRM favoring convergence of online and offline databases
∞ Impact on logistics
global … and seamless connected asking for
customization
2 0 1 4 , b u i l d i n g u p

Integrated, pragmatic, responsive operational model
11
∞ Increasingly relevant value proposition for our customers
∞ Ongoing adaptation of the structure and effectiveness of our collections
∞ Constant search for product categories whose potential remains underexploited
∞ An innovative model: Kering Eyewear
∞ Adapted expansion of our geographic footprint
∞ Priority given to directly operated stores
∞ Flexible, down-to-earth approach to Wholesale
∞ Focus on consolidating Group digital leadership
∞ Gradual expansion of shared services model
∞ Development of Supply Chain across all entities
∞ Broad-based project to modernize and optimize our information systems
Distribution
Creation and products
Operating processes
Th
ree
actio
n a
rea
s
2 0 1 4 , b u i l d i n g u p

12
Jean-Marc Duplaix Group Chief Financial Officer
A n a l y s i s o f r e s u l t s
2014 annual results

2 0 1 4 o p e r a t i n g p e r f o r m a n c e s
13
Group revenue (in €m)
Gross profit (in €m, Gross margin as % of revenue)
Recurring Operating Income (in €m, Operating margin as % of revenue)
EBITDA (in €m, EBITDA margin as % of revenue)
2014 10,038
9,656 2013
2014 6,296
6,041 2013
62.7%
62.6%
2014 1,664
1,751 2013
16.6%
18.1%
2014 1,991
2,043 2013
19.8%
21.2%
+4.5%
% Change
Reported Comparable
+4.0%
+3.0%
% Change
Reported Comparable
-5.0%
+7.5%
% Change
Reported Comparable
+4.2%
+4.5%
% Change
Reported Comparable
-2.6%

In €m 2014
Reported
change
Revenue 6,759 +6.0%
Recurring operating income Recurring operating income margin
1,666 24.6%
-1.1% -1.8pt
EBITDA EBITDA margin
1,919 28.4%
+0.4%
Gross CAPEX 372 -14.0%
2 0 1 4 r e v e n u e : + 4 . 9 % c o m p a r a b l e
Robust revenue growth and EBIT performance
∞ Sales growth fueled by directly operated stores (+8%), with more sustained growth in mature countries
∞ Pertinence of multibrand strategy resulting in healthy …
– Sales growth, consistent throughout the year
– EBITDA performance, unchanged from 2013
– Recurring operating income
∞ Lower CAPEX, reflecting adaptation of capital allocation to
– Sector cycle
– Maturity and development priorities of each brand
Luxury activities
14
X%: comparable growth
Royalties
-3%
Wholesale
0%
Retail
+8%
Scope
+2%
FX impact
-1%
2013
6,378
2014
6,759
15
P r o g r e s s i o n o f L u x u r y c o m p a r a b l e r e c u r r i n g o p e r a t i n g i n c o m e S i g n i f i c a n t c u r r e n c y i m p a c t i n 2 0 1 4
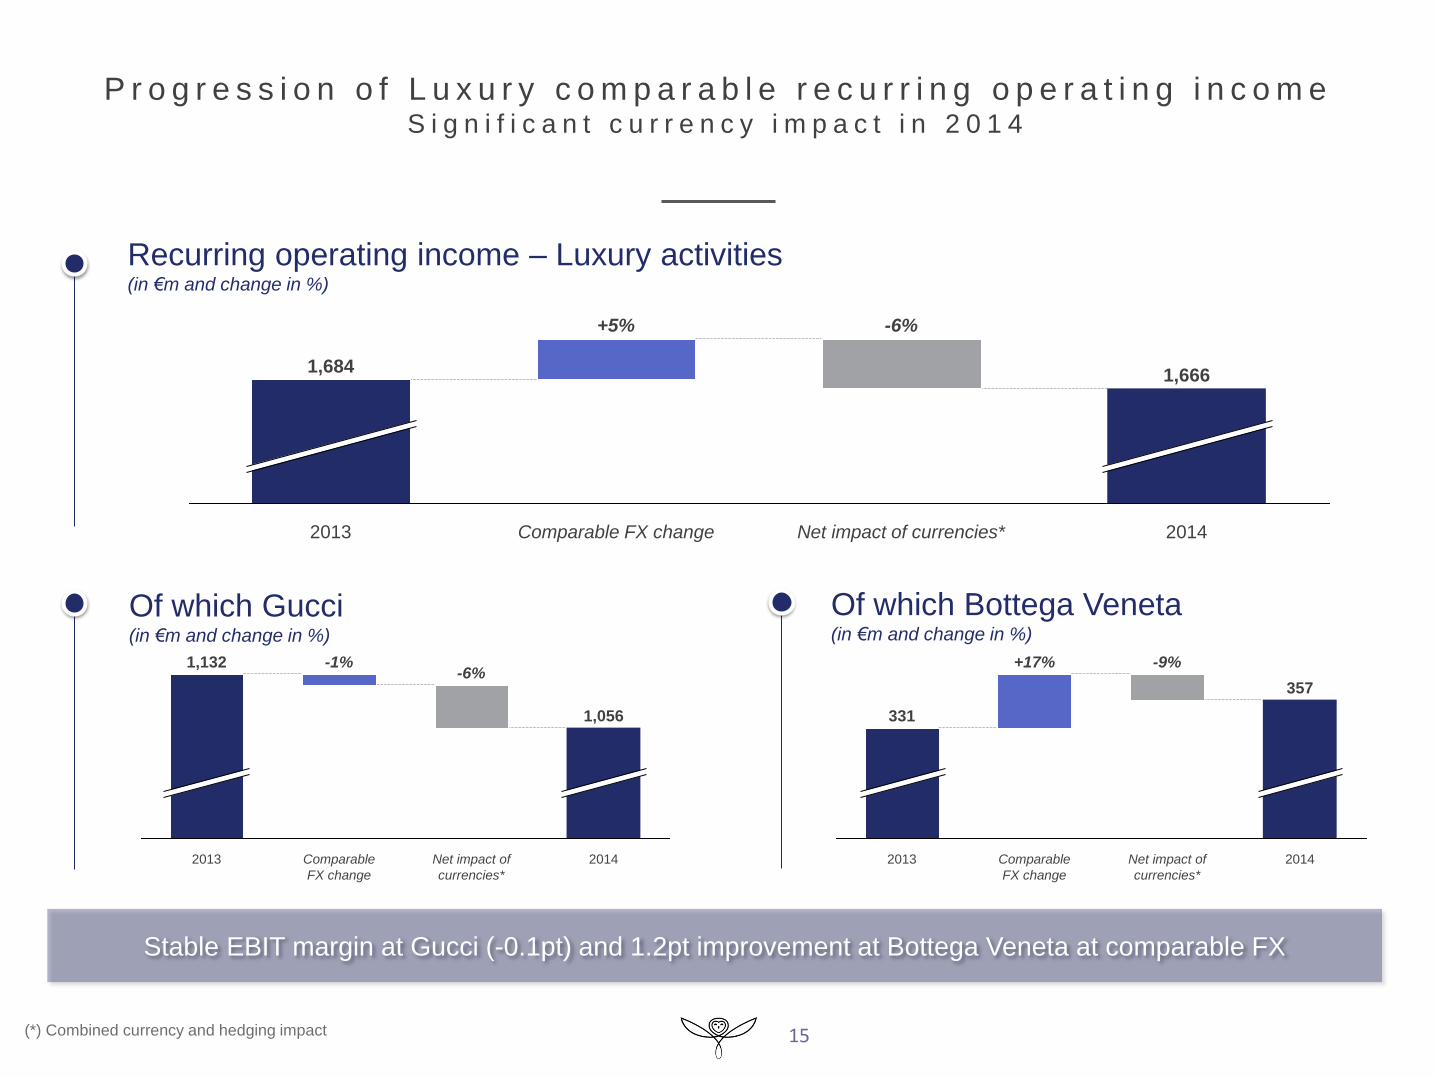
Recurring operating income – Luxury activities (in €m and change in %)
Stable EBIT margin at Gucci (-0.1pt) and 1.2pt improvement at Bottega Veneta at comparable FX
2014
1,666
Net impact of currencies*
-6%
Comparable FX change
+5%
2013
1,684
Of which Gucci (in €m and change in %)
Of which Bottega Veneta (in €m and change in %)
2014
1,056
Net impact of
currencies*
-6%
Comparable
FX change
-1%
2013
1,132
2014
357
Net impact of
currencies*
-9%
Comparable
FX change
+17%
2013
331
(*) Combined currency and hedging impact

16
2 0 1 4 r e v e n u e : - 1 . 1 % c o m p a r a b l e
Sturdy EBIT margin in mixed environment
In €m 2014
Reported
change
Revenue 3,497 -1.8%
Recurring operating income Recurring operating income margin
1,056 30.2%
-6.7% -1.6pt
EBITDA EBITDA margin
1,199 34.3%
-6.0%
Gross CAPEX 186 -13.1%
3,497
Retail (79% of sales): +2%
2014 Royalties
-9%
Wholesale
-11%
RoW
+18%
Asia
Pacific
2013
3,561
Western
Europe
+5%
North
America
+10%
Japan
-3% +1%
X%: comparable growth
∞ Contrasted sales momentum
– Good performance from directly operated stores (+2%), notably in mature markets (+4.4%, 55% of revenue), driven
by handbags, ready-to-wear and shoes
– Tougher environment in Asia Pacific, steady deterioration of the economic climate in H2
– Gradual improvement in wholesale: exclusivity strategy and increased control over distribution
∞ Resilient EBIT margin in constant FX
– Positive gross margin momentum
– Tight OPEX control despite rising rents
∞ Adapted CAPEX
– Slower pace of store openings, further optimization of store network

17
2 0 1 4 r e v e n u e : + 1 2 . 6 % c o m p a r a b l e
Growth plan on track
In €m 2014
Reported
change
Revenue 1,131 +11.3%
Recurring operating income Recurring operating income margin
357 31.6%
+8.0% -0.9pt
EBITDA EBITDA margin
389 34.4%
+9.6%
Gross CAPEX 41 -34.2%
X%: comparable growth
2014
Retail (80% of sales): +11%
1,131
Royalties
+14%
Wholesale
+20%
RoW
+14%
Asia
Pacific
+10%
Japan
+17%
North
America
+9%
Western
Europe
+10%
2013
1,016
∞ Another year of significant revenue growth
– Double-digit growth in directly operated stores, reflecting systematic implementation of operating excellence strategy
– Outstanding wholesale momentum while maintaining exacting selectivity
– Slowdown in Asia Pacific toward year end
∞ EBIT margin maintained at very high level and increase in recurring operating income in line with medium-
term growth roadmap
∞ Tight CAPEX control
– Slower DOS opening pace (+15 net store openings, well balanced between mature and emerging markets) following
heavy investments in stores and operations in 2013

18
2 0 1 4 r e v e n u e : + 2 7 . 2 % c o m p a r a b l e
Contribution to Group growth and profitability now significant
In €m 2014
Reported
change
Revenue 707 +27.0%
Recurring operating income Recurring operating income margin
105 14.9%
+37.2% +1.1pt
EBITDA EBITDA margin
131 18.5%
+40.8%
Gross CAPEX 54 -17.0%
X%: comparable growth
2014
707
Royalties
+8%
Wholesale
+11%
RoW
+86%
Asia
Pacific
+44%
Japan
+43%
North
America
+46%
Western
Europe
+28%
2013
557
Retail (61% of sales): +40%
∞ Sales doubled over 3 years, reflecting Saint Laurent’s successful brand positioning
– Growth fueled by retail sales across all regions and all product categories (leather goods +40%, ready-to-wear +34%)
∞ Recurring operating income up 37%, EBIT margin up 110bp
– Strong gross margin momentum
– Operating leverage driven by same-store sales growth and scale effect
∞ CAPEX remaining at high level (7.7% of revenue)
– Continued selective network expansion (13 net store openings)
– Renovations in line with new concept

Other luxury brands
19
2 0 1 4 r e v e n u e : + 6 . 0 % c o m p a r a b l e
Solid performance of Couture and Leather Goods
In €m 2014
Reported
change
Revenue 1,424 +14.4%
Recurring operating income Recurring operating income margin
147 10.3%
+1.8% -1.3pt
EBITDA EBITDA margin
200 14.1%
+7.1%
Gross CAPEX 91 +0.1%
X%: comparable growth
1,424
2014 Royalties
+6%
Wholesale
+2%
Retail
+13%
Scope
+8%
FX impact
0%
2013
1,244
∞ Couture and Leather Goods: solid revenue growth (+9%)
– Double-digit increases at Balenciaga, Alexander McQueen, Stella McCartney and Christopher Kane
– Satisfactory growth of retail at Brioni, penalized by drop in Russian tourism
∞ Watches and Jewelry: volatile market conditions
– Positive performances in Jewelry:
• Improving year-end trends at Boucheron
• Solid reception of new collections at Pomellato Group
– Watches: pressure on Sowind, in environment marked by caution from distributors
∞ Slight drop in EBIT margin, primarily due to Sowind
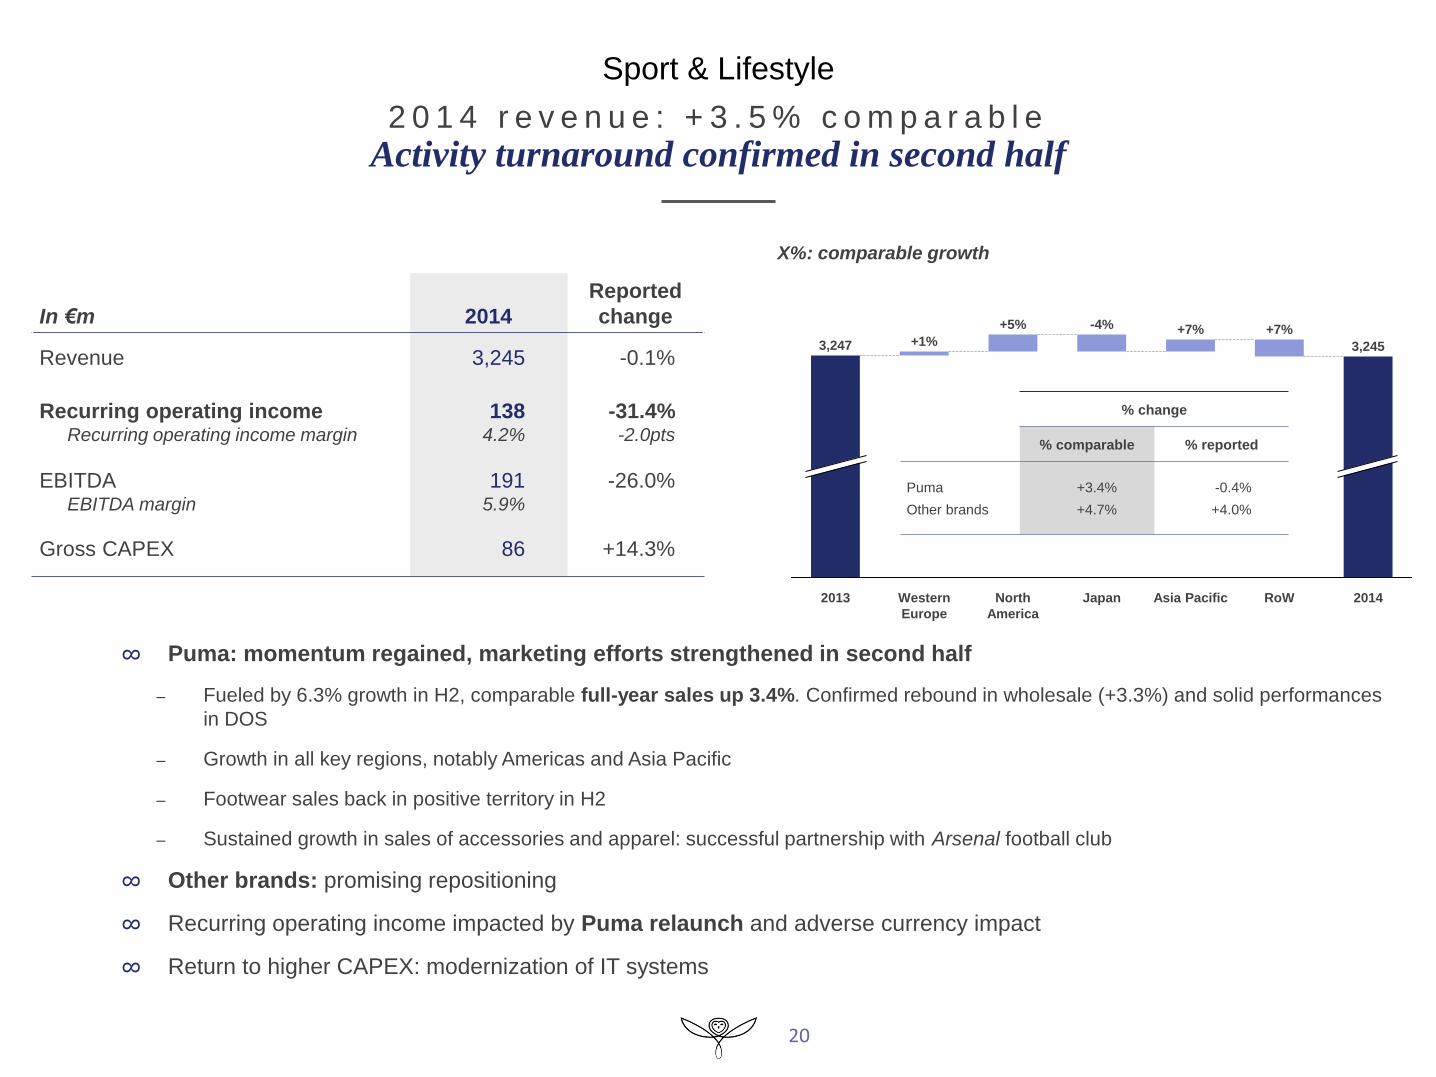
Sport & Lifestyle
20
Puma €1,474m
Puma €1,386m
2 0 1 4 r e v e n u e : + 3 . 5 % c o m p a r a b l e
Activity turnaround confirmed in second half
In €m 2014
Reported
change
Revenue 3,245 -0.1%
Recurring operating income Recurring operating income margin
138 4.2%
-31.4% -2.0pts
EBITDA EBITDA margin
191 5.9%
-26.0%
Gross CAPEX 86 +14.3%
2014
3,245
RoW
+7%
Asia Pacific
+7%
Japan
-4%
North
America
+5%
Western
Europe
+1%
2013
3,247
X%: comparable growth
∞ Puma: momentum regained, marketing efforts strengthened in second half
– Fueled by 6.3% growth in H2, comparable full-year sales up 3.4%. Confirmed rebound in wholesale (+3.3%) and solid performances
in DOS
– Growth in all key regions, notably Americas and Asia Pacific
– Footwear sales back in positive territory in H2
– Sustained growth in sales of accessories and apparel: successful partnership with Arsenal football club
∞ Other brands: promising repositioning
∞ Recurring operating income impacted by Puma relaunch and adverse currency impact
∞ Return to higher CAPEX: modernization of IT systems
% change
% comparable % reported
Puma
Other brands
+3.4%
+4.7%
-0.4%
+4.0%

F i n a n c i a l p e r f o r m a n c e
In €m 2014 2013
Recurring operating income 1,664 1,751
Other non-recurring operating income and expenses
Net financial charges
Corporate income tax
Share in earnings of associates
Net loss from discontinued operations
(112)
(197)
(326)
(1)
(479)
(441)
(210)
(237)
2
(825)
Consolidated net income
Of which: net income, Group share
549
529
40
50
Net income, Group share, from continuing operations
excluding non-recurring items 1,177 1,231
Net income, Group share, per share (in euro)
Net income per share from continuing operations, Group share,
excluding non-recurring items (in euro)
4.20
9.35
0.39
9.77
21
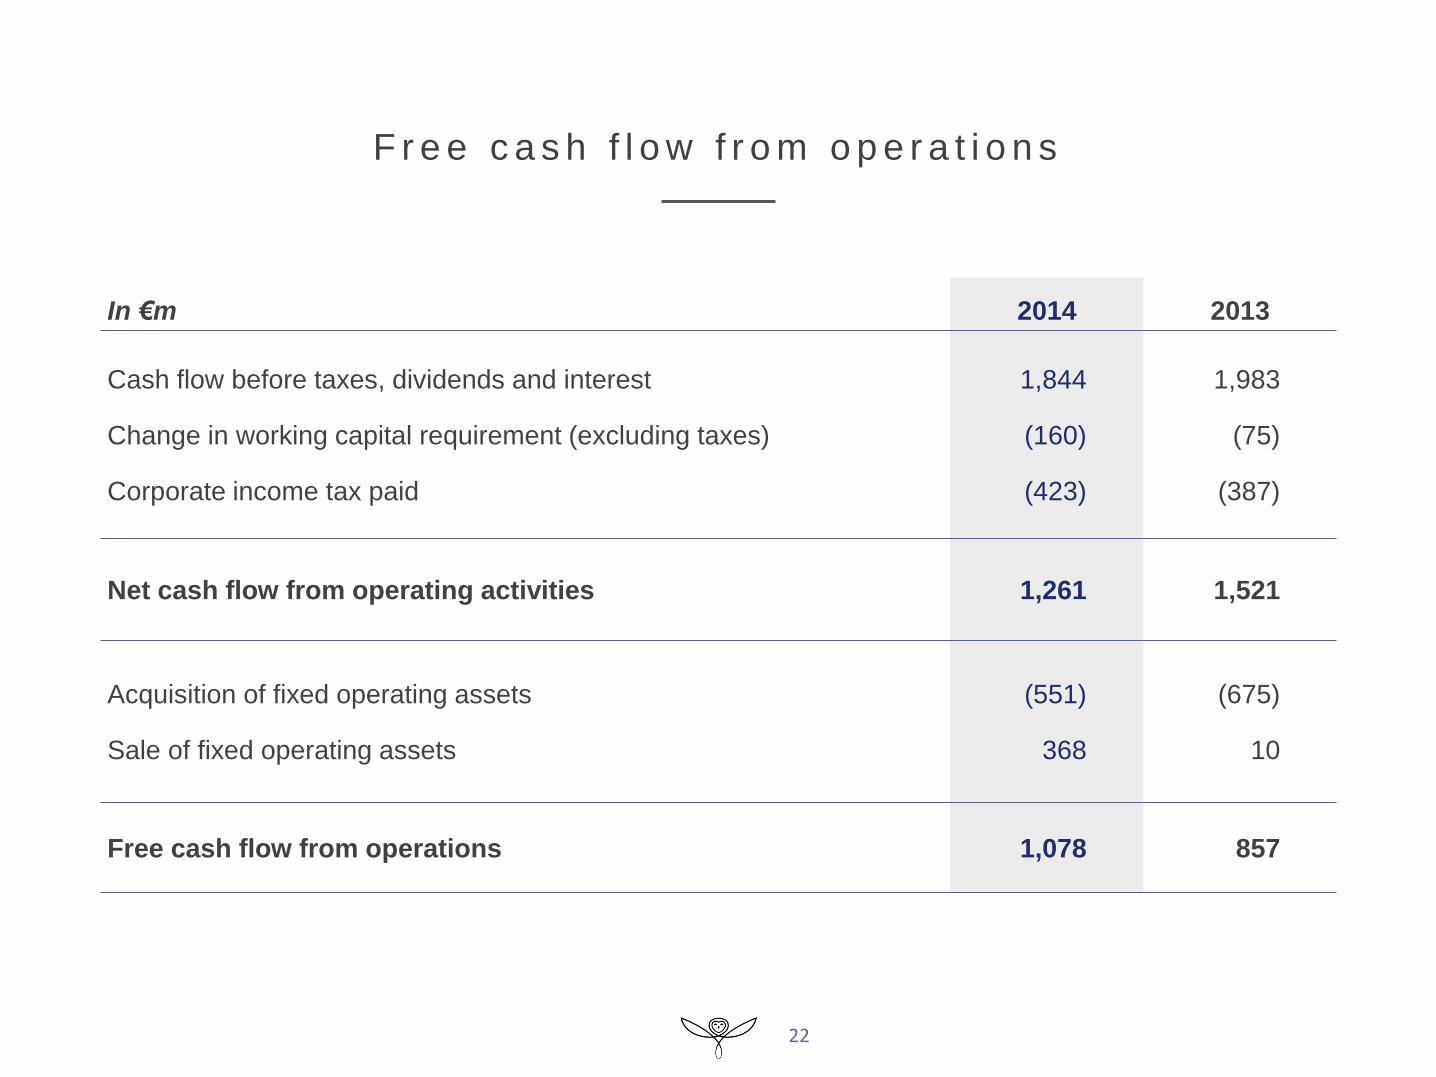
F r e e c a s h f l o w f r o m o p e r a t i o n s
In €m 2014 2013
Cash flow before taxes, dividends and interest
Change in working capital requirement (excluding taxes)
Corporate income tax paid
1,844
(160)
(423)
1,983
(75)
(387)
Net cash flow from operating activities 1,261 1,521
Acquisition of fixed operating assets
Sale of fixed operating assets
(551)
368
(675)
10
Free cash flow from operations 1,078 857
22
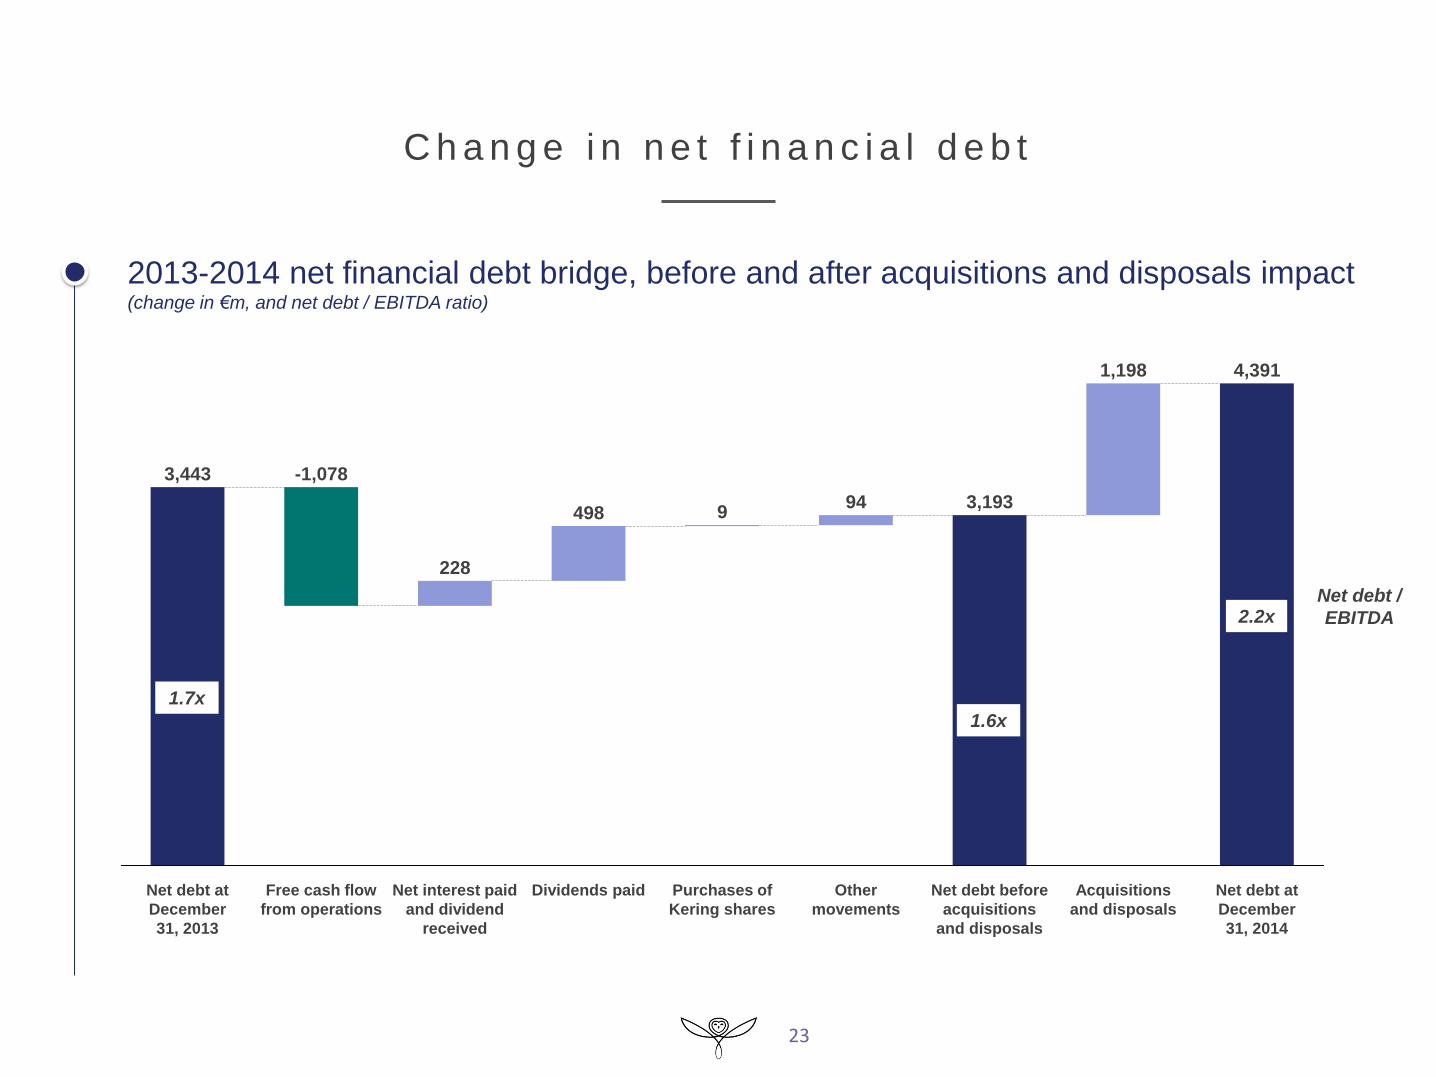
C h a n g e i n n e t f i n a n c i a l d e b t
23
Acquisitions
and disposals
Net debt at
December
31, 2014
4,391 1,198
Net debt before
acquisitions
and disposals
3,193
Other
movements
94
Purchases of
Kering shares
9
Dividends paid
498
Net interest paid
and dividend
received
228
Free cash flow
from operations
-1,078
Net debt at
December
31, 2013
3,443
1.7x
2.2x Net debt /
EBITDA
2013-2014 net financial debt bridge, before and after acquisitions and disposals impact (change in €m, and net debt / EBITDA ratio)
1.6x
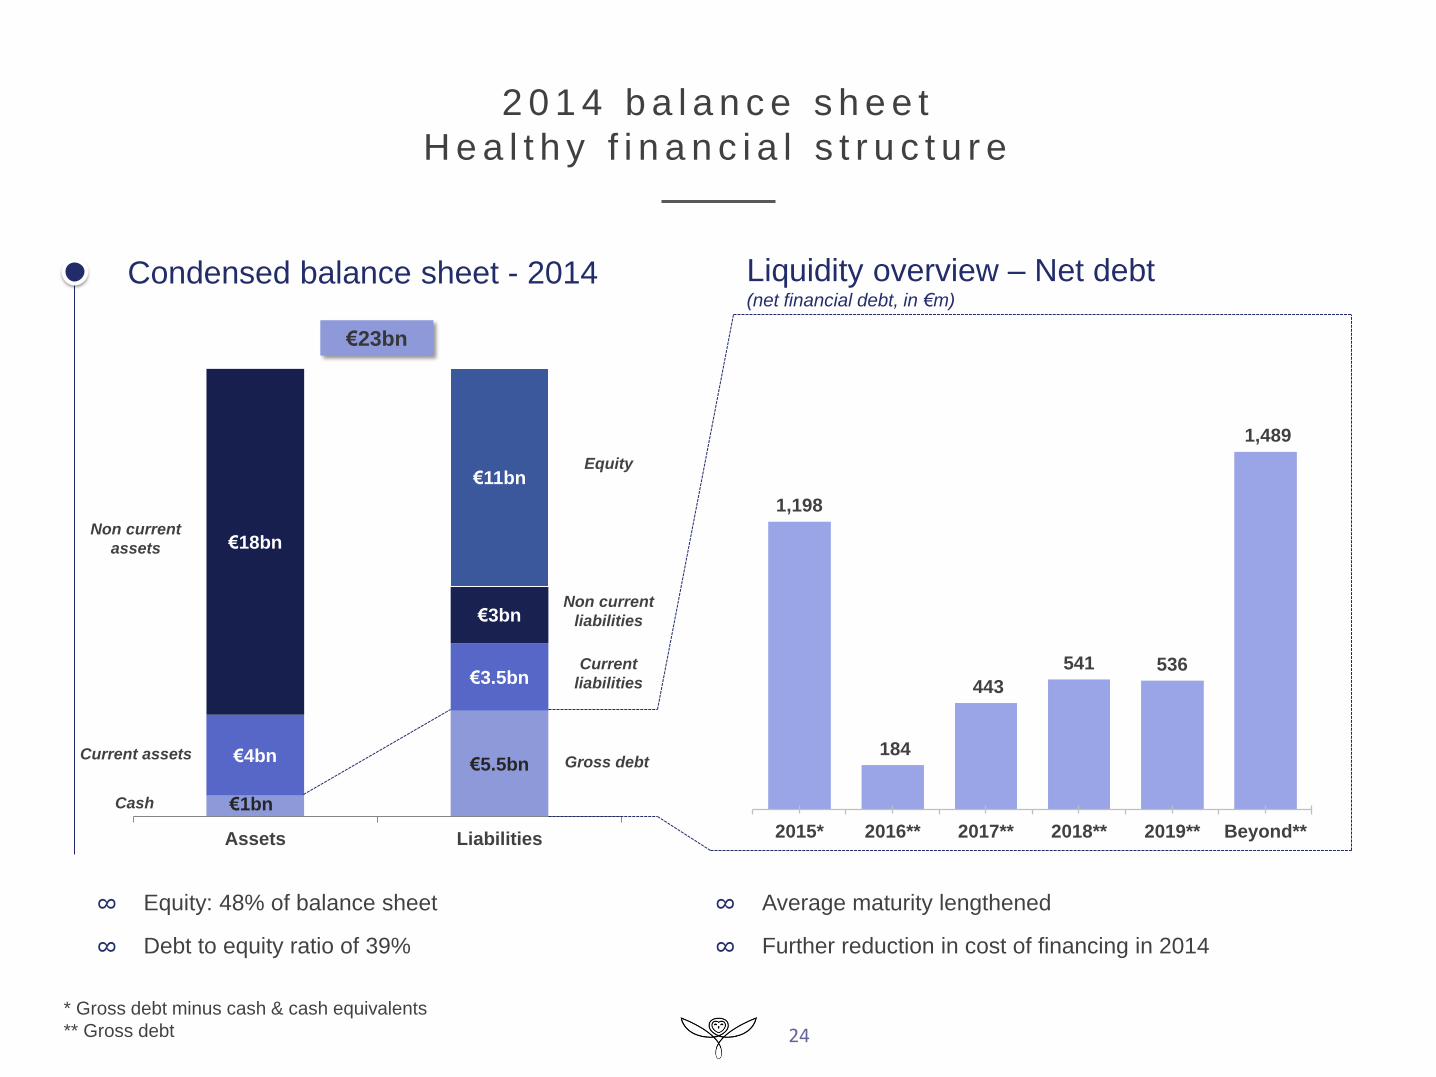
€5.5bn
€1bn
€3.5bn
€4bn
€3bn
€18bn
€11bn
Assets Liabilities
€23bn
∞ Equity: 48% of balance sheet
∞ Debt to equity ratio of 39%
∞ Average maturity lengthened
∞ Further reduction in cost of financing in 2014
Non current
assets
Current assets
Cash
Equity
Non current
liabilities
Current
liabilities
Gross debt
1,198
184
443
541 536
1,489
2015* 2016** 2017** 2018** 2019** Beyond**
Condensed balance sheet - 2014 Liquidity overview – Net debt (net financial debt, in €m)
24
* Gross debt minus cash & cash equivalents
** Gross debt
2 0 1 4 b a l a n c e s h e e t
H e a l t h y f i n a n c i a l s t r u c t u r e
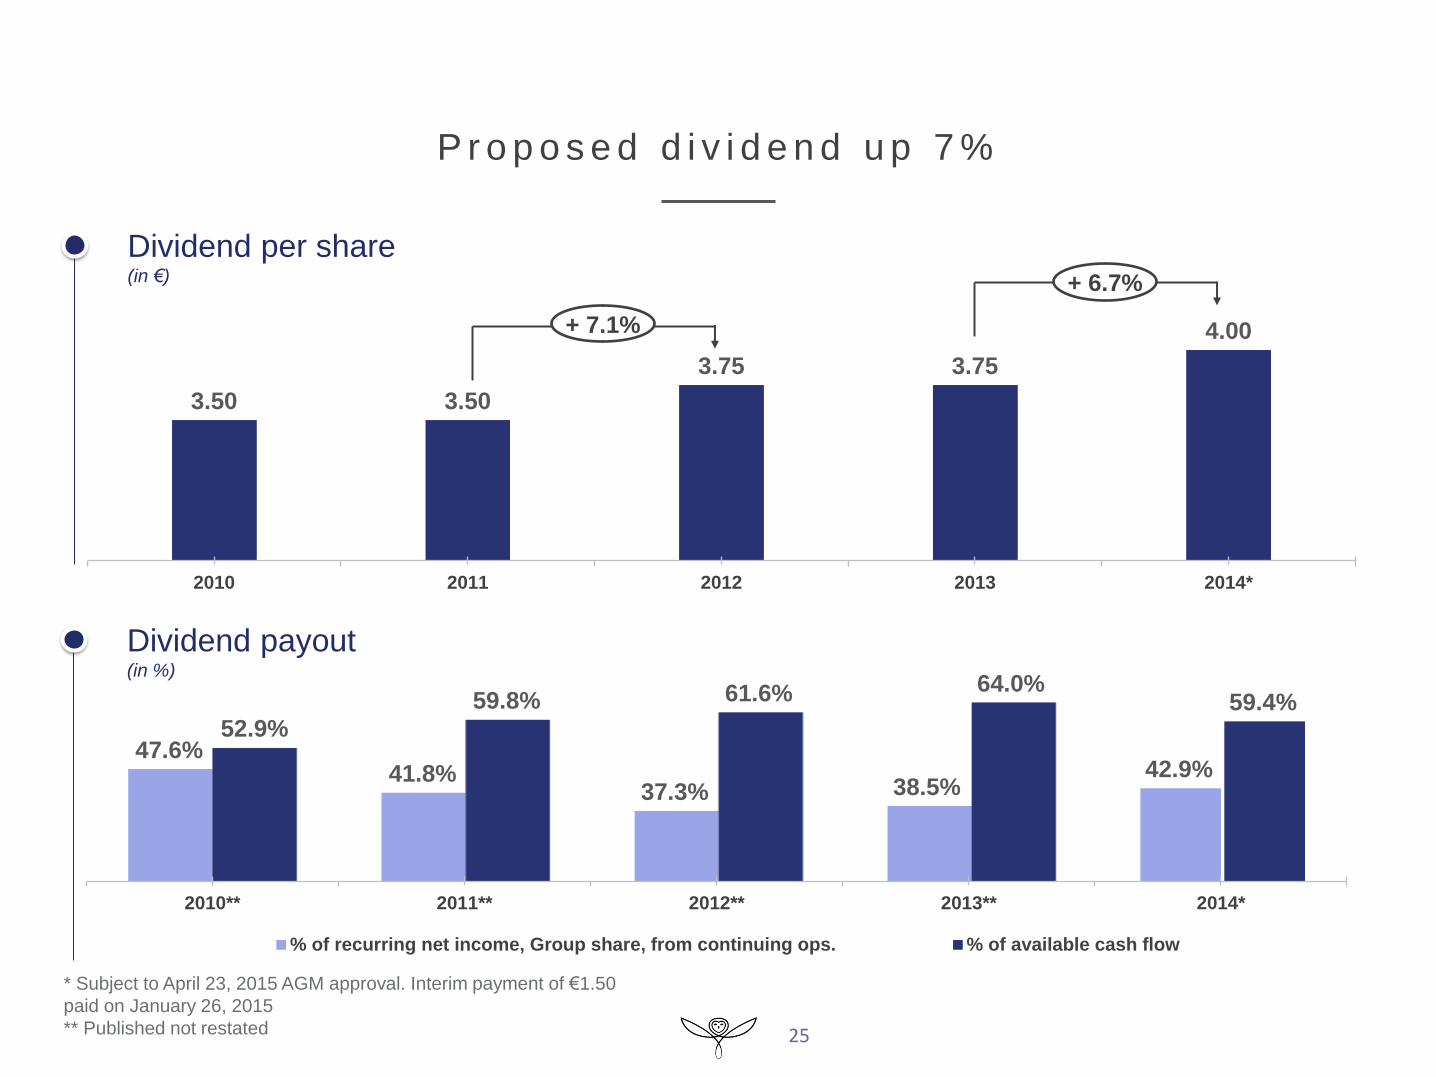
47.6% 41.8%
37.3% 38.5% 42.9%
52.9% 59.8% 61.6% 64.0%
59.4%
2010** 2011** 2012** 2013** 2014*
% of recurring net income, Group share, from continuing ops. % of available cash flow
* Subject to April 23, 2015 AGM approval. Interim payment of €1.50
paid on January 26, 2015
** Published not restated
3.50 3.50
3.75 3.75
4.00
2010 2011 2012 2013 2014*
+ 7.1%
25
P r o p o s e d d i v i d e n d u p 7 %
+ 6.7%
Dividend per share (in €)
Dividend payout (in %)

François-Henri Pinault Chairman & CEO
26
Strategy and Out look
2014 annual results

27
S t r a t e g y a n d o u t l o o k
High-potential Group in fast-growing sector
Luxury is a sector expected to enjoy long-
term structural growth
∞ Driven by favorable economic and demographic factors, tourism
∞ New consumer trends
∞ New growth levers
1
3
2 Group brands have huge organic growth
potential
∞ An ensemble of brands with complementary maturity cycles and
positionings
∞ Significant growth potential
∞ Enhanced steering structures to better support the growth of our
brands: business expertise and synergies, renewed teams
With a strong entrepreneurial culture, Kering
is integrating to create more value
∞ Short-term responsiveness, long-term investments
∞ Disciplined oversight, brand managers fully accountable

S t r a t e g y a n d O u t l o o k
Gucci, new momentum
Two key directions
Revitalize Accelerate
28
1. Identity and Creativity
Rejuvenate the brand and
revitalize our product offer
Appealing, modern identity
Radical contemporary vision fully
embracing our heritage
2. Communications
Express a consistent brand image
Clear brand narrative, conveyed globally
and meticulously
3. Store network
Adapt and consolidate
Ad hoc expansion and fine-tuning,
adaptation of store concept taking into
account the specific needs of each
location
1. Store excellence Intensify existing programs
Client service culture to drive our
new momentum
2. Organization
Simplify to boost efficiency
Accelerated redefinition of functions
to enable regional directions to focus
on operations

29
S t r a t e g y a n d O u t l o o k
Puma, five clear priorities
1. Consolidate relaunch
∞ Focus on Sport Performance and women’s fitness…
∞ … notably in footwear
2. Accelerate product innovation
∞ Boost pipeline of products with highly innovative content
3. Pursue distribution upgrading
∞ Enhance sales quality to support virtuous gross margin momentum
4. Optimize organization
∞ Update information and management systems; redesign supply
chain
5. Minimize negative impact of currency fluctuation

30
S t r a t e g y a n d o u t l o o k
2015 outlook
∞ Environment
– Macroeconomic environment still unsettled, but new growth drivers
∞ Currency fluctuations
– Weaker Euro supporting sales, but mixed impact on Group results
∞ Beyond cycles, a sector experiencing sharp underlying growth
∞ Integrated, pragmatic, responsive Group
– Action plans focusing on organic growth
– Short-term responsiveness and long-term investments
– Disciplined management and allocation of resources
– No acquisition plans in the short term
∞ Steady, profitable growth trajectory, focus on cash flow generation to gradually reduce debt and support
attractive dividend payout

31
2014 annual results
A p p e n d i c e s

2 0 1 4 r e v e n u e
Change
In €m, continuing operations 2014 2013 €m %
Gucci
Bottega Veneta
Saint Laurent
Other brands
3,497.2
1,130.5
707.3
1,423.6
3,560.8
1,015.8
556.9
1,244.0
(63.6)
114.7
150.4
179.6
-1.8%
+11.3%
+27.0%
+14.4%
Luxury 6,758.6 6,377.5 381.1 +6.0%
Puma
Other brands
2,990.2
254.9
3,001.9
245.1
(11.7)
9.8
-0.4%
+4.0%
Sport & Lifestyle 3,245.1 3,247.0 (1.9) -0.1%
Corporate & Others 33.8 31.2 2.6 +8.3%
Kering 10,037.5 9,655.7 381.8 +4.0%
32

Leather Goods Ready to Wear Footwear Other categories*
56% 12% 14% 18%
87% 5% 6% 2%
47% 23% 19% 11%
22% 34% 6% 38%
37% 43% 20%
76% 5% 19%
Lu
xu
ry
33
2 0 1 4 r e v e n u e
b y p r o d u c t c a t e g o r y
Other brands
Other brands
* Watches, Jewellery and licensing revenue (for Luxury); Licensing
revenue and accessories (for Sport & Lifestyle)
Sport
&
Lif
esty
le
33

2 0 1 4 r e v e n u e : € 6 , 7 5 9 m + 4 . 9 % c o m p a r a b l e ; + 6 . 0 % r e p o r t e d
Western
Europe
32%
North America
19%
Japan
10%
Asia Pacific
31%
RoW
8%
Number of directly operated stores
288
195 224
389
312
206 226
442
Western Europe North America Japan Emerging markets
Year end 2013: 1096 Year end 2014: 1186
34
Revenue y-o-y change
in €m % comparable % reported
Q1 14
Q2 14
Q3 14
Q4 14
1,582
1,611
1,656
1,909
+6.4%
+5.5%
+3.8%
+4.3%
+5.3%
+5.1%
+4.0%
+9.1%
Luxury activities

+14% € 838m
Western
Europe
27%
North America
20%
Japan
10%
Asia Pacific
36%
RoW
7%
Number of directly operated stores
35
Revenue y-o-y change
in €m % comparable % reported
Q1 14
Q2 14
Q3 14
Q4 14
838
838
851
970
+0.3%
(2.4%)
(1.9%)
(0.5%)
(3.2%)
(5.7%)
(1.6%)
+3.0%
2 0 1 4 r e v e n u e : € 3 , 4 9 7 m - 1 . 1 % c o m p a r a b l e ; - 1 . 8 % r e p o r t e d
109 116
66
183
116 117
65
207
Western Europe North America Japan Emerging markets
Year end 2013: 474 Year end 2014: 505
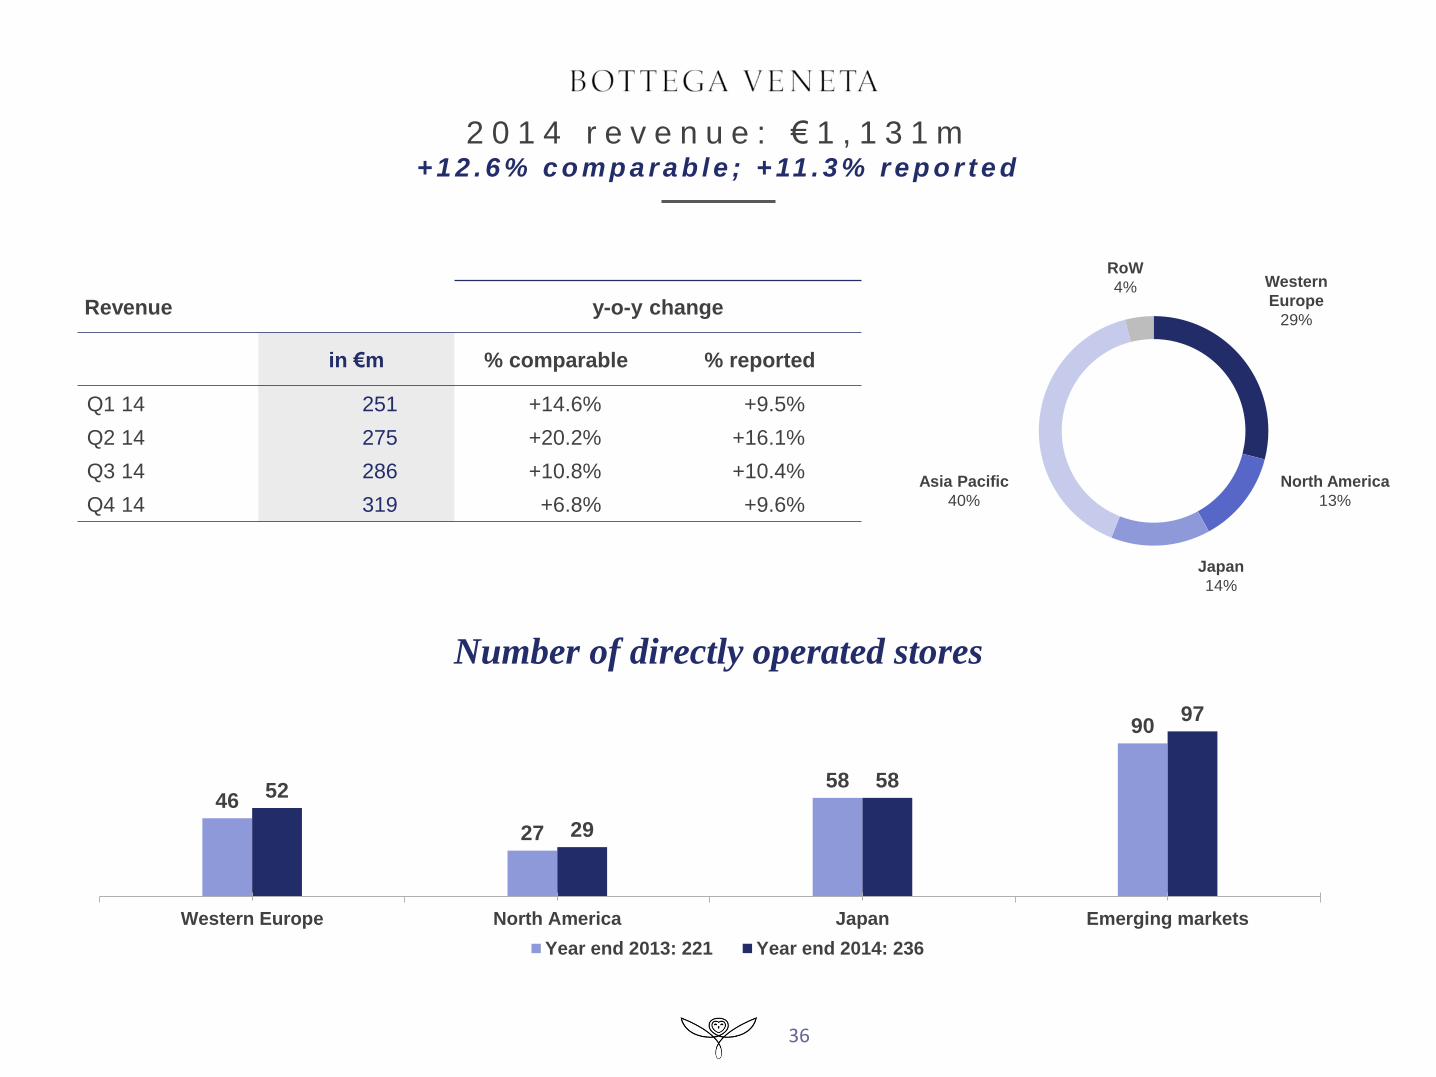
Western
Europe
29%
North America
13%
Japan
14%
Asia Pacific
40%
RoW
4%
Number of directly operated stores
36
Revenue y-o-y change
in €m % comparable % reported
Q1 14
Q2 14
Q3 14
Q4 14
251
275
286
319
+14.6%
+20.2%
+10.8%
+6.8%
+9.5%
+16.1%
+10.4%
+9.6%
46
27
58
90
52
29
58
97
Western Europe North America Japan Emerging markets
Year end 2013: 221 Year end 2014: 236
2 0 1 4 r e v e n u e : € 1 , 1 3 1 m + 1 2 . 6 % c o m p a r a b l e ; + 11 . 3 % r e p o r t e d

Western
Europe
41%
North America
22%
Japan
7%
Asia Pacific
22%
RoW
8%
Number of directly operated stores
37
Revenue y-o-y change
in €m % comparable % reported
Q1 14
Q2 14
Q3 14
Q4 14
158
163
178
209
+27.1%
+29.4%
+27.5%
+25.3%
+24.2%
+26.9%
+27.6%
+28.7%
31
17 21
46
33
22 21
52
Western Europe North America Japan Emerging markets
Year end 2013: 115 Year end 2014: 128
2 0 1 4 r e v e n u e : € 7 0 7 m + 2 7 . 2 % c o m p a r a b l e ; + 2 7 . 0 % r e p o r t e d

Other Luxury brands
Western
Europe
45%
North America
19%
Japan
8%
Asia Pacific
17%
RoW
11%
Number of directly operated stores
38
Revenue y-o-y change
in €m % comparable % reported
Q1 14
Q2 14
Q3 14
Q4 14
335
336
341
412
+8.9%
+6.9%
+3.3%
+5.4%
+19.4%
+20.2%
+3.8%
+15.9%
102
35
79 70
111
38
82 86
Western Europe North America Japan Emerging markets
Year end 2013: 286 Year end 2014: 317
2 0 1 4 r e v e n u e : € 1 , 4 2 4 m + 6 . 0 % c o m p a r a b l e ; + 1 4 . 4 % r e p o r t e d
Western
Europe
30%
North America
26%
Japan
9%
Asia Pacific
14%
RoW
21%
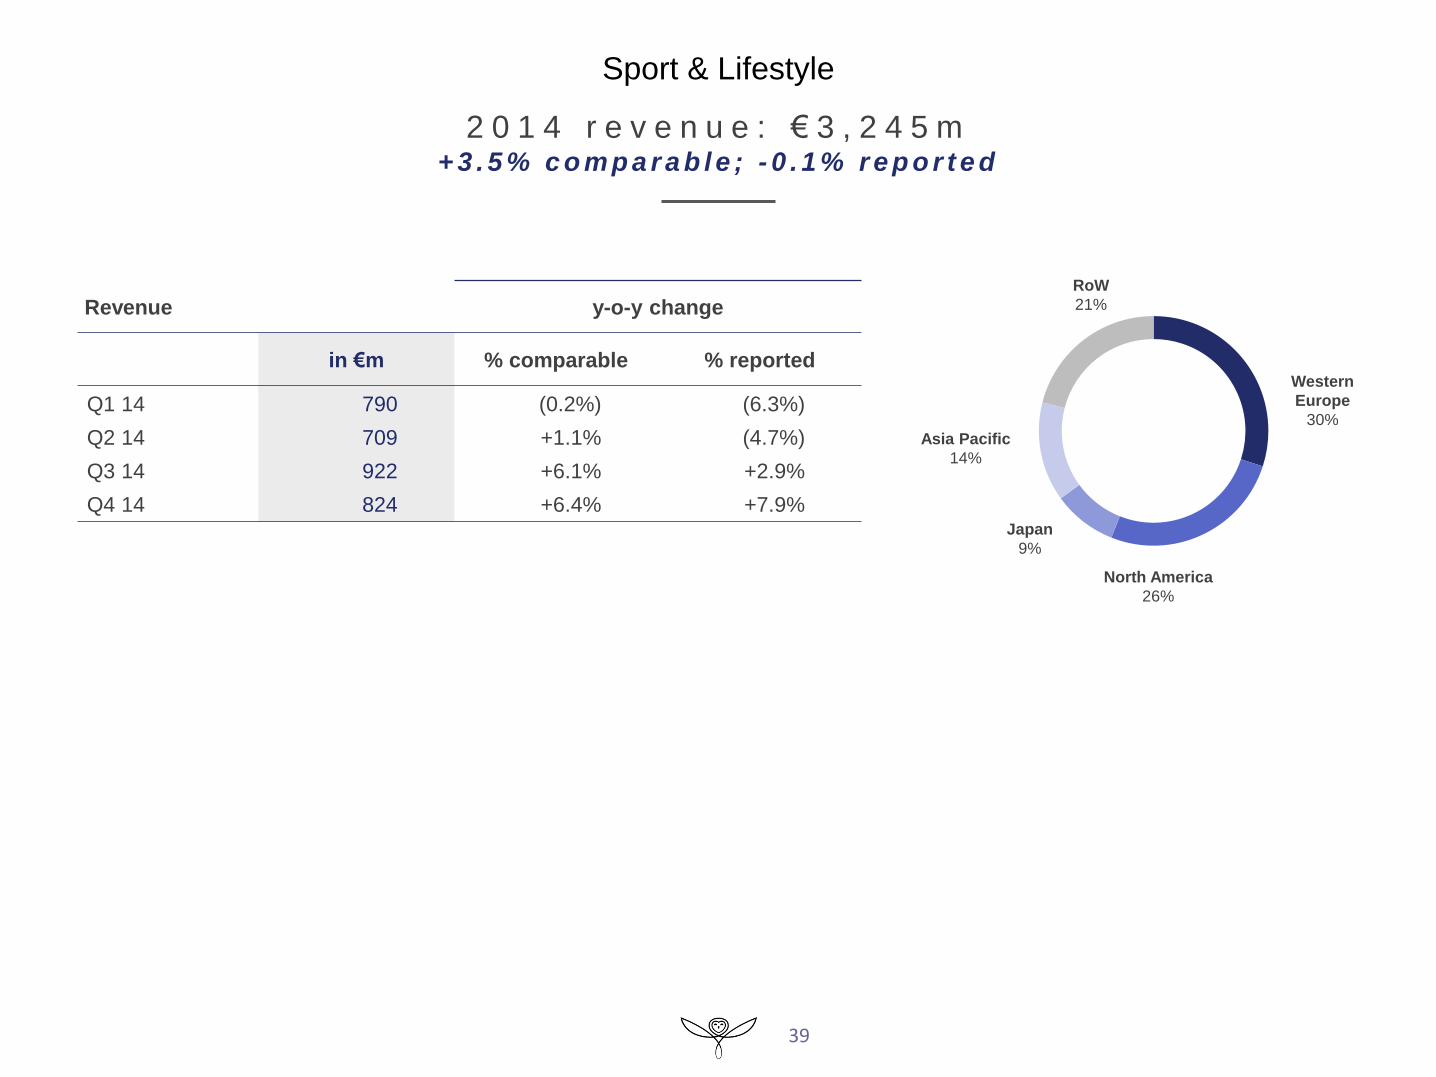
39
Revenue y-o-y change
in €m % comparable % reported
Q1 14
Q2 14
Q3 14
Q4 14
790
709
922
824
(0.2%)
+1.1%
+6.1%
+6.4%
(6.3%)
(4.7%)
+2.9%
+7.9%
Sport & Lifestyle
2 0 1 4 r e v e n u e : € 3 , 2 4 5 m + 3 . 5 % c o m p a r a b l e ; - 0 . 1 % r e p o r t e d

2 0 1 4 r e c u r r i n g o p e r a t i n g i n c o m e
Change
In €m, continuing operations 2014 2013 €m %
Gucci
Bottega Veneta
Saint Laurent
Other brands
1,056.0
357.2
105.1
147.3
1,131.8
330.6
76.6
144.7
(75.8)
26.6
28.5
2.6
-6.7%
+8.0%
+37.2%
+1.8%
Luxury 1,665.6 1,683.7 (18.1) -1.1%
Puma
Other brands
128.0
9.5
191.9
8.5
(63.9)
1.0
-33.3%
+11.8%
Sport & Lifestyle 137.5 200.4 (62.9) -31.4%
Corporate & Others (139.1) (132.9) (6.2) -4.7%
Kering 1,664.0 1,751.2 (87.2) -5.0%
40

Change
In €m, continuing operations 2014 2013 €m %
Gucci
Bottega Veneta
Saint Laurent
Other brands
1,199.2
388.8
130.9
200.3
1,275.8
354.8
93.0
187.1
(76.6)
34.0
37.9
13.2
-6.0%
+9.6%
+40.8%
+7.1%
Luxury 1,919.2 1,910.7 8.5 +0.4%
Puma
Other brands
178.6
12.6
246.4
11.9
(67.8)
0.7
-27.5%
+5.9%
Sport & Lifestyle 191.2 258.3 (67.1) -26.0%
Corporate & Others (119.7) (125.7) 6.0 -4.8%
Kering 1,990.7 2,043.3 (52.6) -2.6%
41
2 0 1 4 E B I T D A

2 0 1 4 n e t f i n a n c i a l c o s t s
a n d i n c o m e t a x
In €m 2014 2013
Cost of net debt
Other financial income and expenses
(151)
(46)
(174)
(36)
Financial costs (net) (197) (210)
In €m 2014 2013
Tax on recurring income
Tax on non-recurring items
(268)
(58)
(268)
31
Total tax charge (326) (237)
Effective tax rate 24.0% 21.5%
Recurring tax rate 18.3% 17.4%
42

2 0 1 4 c o n d e n s e d c o n s o l i d a t e d b a l a n c e s h e e t
In €m 2014 2013
Goodwill, brands & other intangible assets - Net
Other net non-current assets
Net current assets
Provisions
14,788
310
924
(394)
14,473
(120)
836
(366)
CAPITAL EMPLOYED 15,628 14,823
Net assets held for sale 25 (184)
SHAREHOLDERS’ EQUITY 11,262 11,196
NET DEBT 4,391 3,443
43

