disclaimer - home - enroll my experience
TRANSCRIPT

DISCLAIMER
The Suggested Answers hosted in the website do not constitute the basis for evaluation of the students’ answers in the examination. The answers are prepared by the Faculty of the Board of Studies with a view to assist the students in their education. While due care is taken in preparation of the answers, if any errors or omissions are noticed, the same may be brought to the attention of the Director of Studies. The Council of the Institute is not in anyway responsible for the correctness or otherwise of the answers published herein.
© The Institute of Chartered Accountants of India

PAPER – 5: ADVANCED MANAGEMENT ACCOUNTING
No statistical or other table will be distributed along with this question paper. Situations given in theory questions need not be copied into the answer books.
Working Notes should form part of the answer. Question No.1 is compulsory.
Attempt any five questions from the remaining six questions.
Question 1 (a) PQR Ltd., a manufacturer of tool kits has just completed XY’s domestic order of 100 kits
at a price of ` 1,650 per kit. The details of cost for XY's order are:
Cost (` )
Direct Material 90,000 Direct Labour 32,000 Tools and Consumables 16,400 Variable overheads 9,600 Fixed overheads (allocated) 15,000 Total 1,63,000
The company wishes to evaluate a special export order from Expo Ltd. of similar 300 kits at ` 1,600 per kit. For the export order, special packing has to be done at ` 20 per kit. An additional fixed inspection cost specific to this export order has to be incurred. The allocation of fixed overheads will be revised to increase by ` 25,000. Tools, and Consumables above include special purpose tools costing ` 10,000 incurred for XY’s order and these can be reused for the export order and the remaining portion is variable. PQR Ltd. wishes to accept the export order at 10% profit on the selling price.
What should be the maximum amount that can be incurred as inspection cost for making such an acceptance possible?
If Expo Ltd. offers to take the products without inspection, what is the maximum discount (as a percentage of the existing export price) that PQR Ltd. can offer to retain its 10% profit on the revised selling price? (Round off calculations to two decimal places). (5 Marks)
(b) A company processes different products from a certain raw material. The raw material is processed in process I (where normal loss is 10% of input) to give products A and B in the ratio 3 : 2. B is sold directly. A is processed further in process II (where normal loss is 12.5% of output) to give products C and D in the ratio 5:3. At this point C and D have sale values ` 55 and ` 40 per kg respectively. C can be processed further in process III with processing cost ` 3,95,600 and normal wastage 5% of input and then be sold at
© The Institute of Chartered Accountants of India

2 FINAL EXAMINATION: MAY, 2014
` 66 per kg. D can be processed further in process IV with processing cost ` 3,82,500 and normal wastage 12.5% of output and then be sold at ` 55 per kg. The normal wastage of each process has no realizable value. During the production period, 2,00,000 kgs of raw material is to be introduced into Process I.
Using incremental cost-revenue approach, advise whether sale at split off or further processing is better for each of the products C and D. (5 Marks)
(c) A Ltd. is going to introduce Total Quality Management (TQM) in its company. State whether and why the following are valid or not for the successful implementation of TQM. (i) Some departments serve both the external and internal customers. These
departments have been advised to focus on satisfying the needs of the external customers.
(ii) Hold a training program at the beginning of a production cycle to ensure the implementation of TQM.
(iii) Implement Management by Objectives for faster achievement of TQM. (iv) Appoint the Head of each department as the person responsible to develop
improvement strategies and performance measures. (v) Eliminate wastage of time by avoiding documentation and procedures. (5 Marks)
(d) A salesman has to visit five cities. He wishes to start from a particular city, visit each city once and then return to his starting point. Cost (in ` '000) of travelling from one city to another is given below You are required to find out the least cost route.
From To
P Q R S T
P - 6 12 4 6 Q 6 - 10 4 6 R 12 10 - 12 8 S 4 4 12 - 12 T 6 6 8 12 -
(5 Marks)
Answer (a) Statement Showing Permissible Cost per kit
Items of Cost (`)
Direct Material 90,000100
⎛ ⎞⎜ ⎟⎝ ⎠
`
kits 900
© The Institute of Chartered Accountants of India

PAPER – 5 : ADVANCED MANAGEMENT ACCOUNTING 3
Direct Labour 32,000100
⎛ ⎞⎜ ⎟⎝ ⎠kits
` 320
Consumables 16,400 - 10,000100
⎛ ⎞⎜ ⎟⎝ ⎠kits
` ` 64
Variable Overheads 9,600100
⎛ ⎞⎜ ⎟⎝ ⎠kits
` 96
Existing Variable Cost per kit 1,380 Add: Special Packing Cost per kit 20 Total Variable Cost per kit 1,400 Export Offer Price per kit 1,600 Expected Profit (10% on Selling Price) 160 Total Permissible Cost per kit 1,440
Maximum Inspection Cost per kit for making export offer acceptable is `40 …(`1,440 − `1,400)
As Total Cost excluding Inspection Cost is `1,400 so the Selling Price will be `1,555.56
… 1001,400 x90
⎛ ⎞⎜ ⎟⎝ ⎠`
Maximum Possible Discount on the Revised Selling Price is ` 44.44 … (`1,600 − `1,555.56)
Percentage of Discount is 2.77%
… 44.44 ×1001,600
⎛ ⎞⎜ ⎟⎝ ⎠
``
Hence Maximum Discount of 2.78 percent can be offered to retain 10% Profit on the Revised Selling Price.
Allocated Fixed Overheads amounting to ` 25,000 and Reusable Special Tools amounting to `10,000 are irrelevant and hence ignored in the decision making process.
This question can be solve by ‘Total Cost & Revenue’ approach.
(b) Statement Showing Decision on Sale at - Split-off Point or After Further Processing Product Product - C Product - D Quantity at Split off Point (Kg.) 60,000 36,000
© The Institute of Chartered Accountants of India

4 FINAL EXAMINATION: MAY, 2014
Selling Price at Split off Point (`) 55 40 Sales Revenue (`) … [A] 33,00,000
(60,000 Kg. × `55) 14,40,000
(36,000 Kg × `40) Quantity if Processed Further (Kg.) 57,000
(60,000 Kg. × 95%) 32,000
36,000Kg.×100112.5
⎛ ⎞⎜ ⎟⎝ ⎠
Selling Price (`) per unit 66 55 Sales Revenue (`) …[B] 37,62,000
(57,000 Kg. × `66) 17,60,000
(32,000 Kg. × `55) Incremental Revenue …[C] = [B] − [A] 4,62,000 3,20,000 Incremental Cost (`) …[D] 3,95,600 3,82,500 Profit / (Loss) …[C] − [D] 66,400 (62,500) Decision Process
Further Sale at Split-off
Point
Workings:
It is not necessary to show above presentation.
Process - I Input - 2,00,000 Kg.
Normal Loss 20,000 Kg.
(2,00,000 Kg. × 10%)
Product - A 1,08,000 Kg.
(1,80,000 Kg. × 3/5)
Product - B 72,000 Kg.
(1,80,000 Kg. × 2/5)
Normal Loss 12,000 Kg.
1,08,000Kg. ×12.50112.50
⎛ ⎞⎜ ⎟⎝ ⎠
Product - C 60,000 Kg.
(96,000 Kg. × 5/8)
Product - D 36,000 Kg.
(96,000 Kg. × 3/8)
Process- II
© The Institute of Chartered Accountants of India

PAPER – 5 : ADVANCED MANAGEMENT ACCOUNTING 5
(c) Point Valid/ Invalid Reason
(i) Invalid TQM advocates focus to be given on both external and internal customers. Hence, focus satisfying the needs of the external customers only will not be valid for the successful implementation of TQM.
(ii) Valid Training at the beginning would improve productivity by bringing standardization in work habits and eliminating variations in production.
(iii) Invalid For implementation of TQM, Management by Objectives should be eliminated as targets of production will encourage delivery of poor quality goods and thus will defeat the collective nature of TQM.
(iv) Invalid Appointing the head of each department as the responsible person is not valid for the successful implementation of TQM as Total Employee Involvement (TIE) principle is an important part of TQM.
(v) Invalid Documentation, procedures and awareness of current best practice are essential in TQM implementation. If documentation and procedures are in place then only improvement can be monitored & measured and consequently deficiency can be corrected.
Conceptually correct brief reason along with the validity of recommendation (Valid or Invalid) is sufficient.
(d) Row Operation
Cities P Q R S T
P - 2 8 0 2 Q 2 - 6 0 2 R 4 2 - 4 0 S 0 0 8 - 8 T 0 0 2 6 -
© The Institute of Chartered Accountants of India

6 FINAL EXAMINATION: MAY, 2014
Column Operation
Cities P Q R S T
P - 2 6 0 2
Q 2 - 4 0 2
R 4 2 - 4 0
S 0 0 6 - 8
T 0 0 0 6 -
Since the minimum number of lines covering all zeros is equal to 4 which is less than the number of columns / rows (=5), the above table will not provide optimal solution. Subtract the minimum uncovered element (=2) from all uncovered elements and add to the elements lying on the intersection of two lines, we get the following matrix-
Cities P Q R S T
P - 0 4 0 2
Q 0 - 2 0 2
R 2 0 - 4 0
S 0 0 6 - 10
T 0 0 0 8 - Or
Cities P Q R S T
P - 0 4 0 2
Q 0 - 2 0 2
R 2 0 - 4 0
S 0 0 6 - 10
T 0 0 0 8 -
The routes and their associated costs are as follows:
From To Cost (`) P Q 6,000 Q S 4,000 R T 8,000
© The Institute of Chartered Accountants of India
PAPER – 5 : ADVANCED MANAGEMENT ACCOUNTING 7
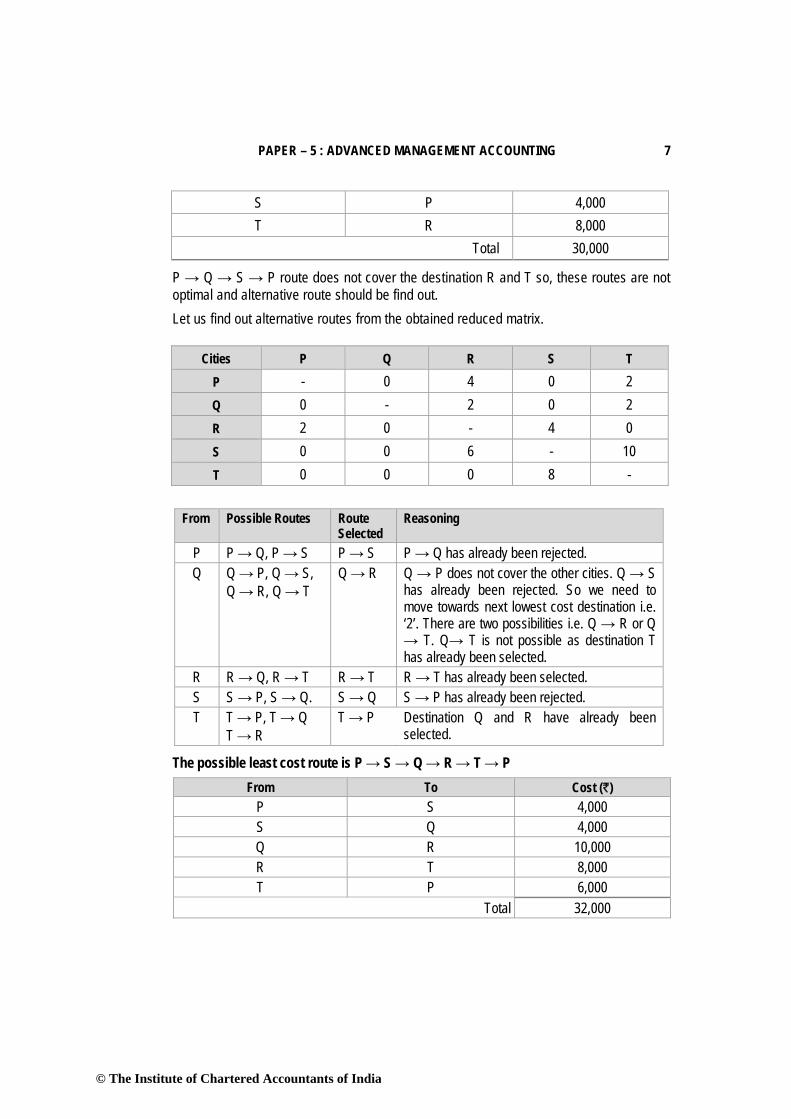
S P 4,000 T R 8,000
Total 30,000
P → Q → S → P route does not cover the destination R and T so, these routes are not optimal and alternative route should be find out.
Let us find out alternative routes from the obtained reduced matrix.
From Possible Routes Route
Selected Reasoning
P P → Q, P → S P → S P → Q has already been rejected. Q Q → P, Q → S,
Q → R, Q → T Q → R Q → P does not cover the other cities. Q → S
has already been rejected. So we need to move towards next lowest cost destination i.e. ‘2’. There are two possibilities i.e. Q → R or Q → T. Q→ T is not possible as destination T has already been selected.
R R → Q, R → T R → T R → T has already been selected. S S → P, S → Q. S → Q S → P has already been rejected. T T → P, T → Q
T → R T → P Destination Q and R have already been
selected.
The possible least cost route is P → S → Q → R → T → P From To Cost (`)
P S 4,000 S Q 4,000 Q R 10,000 R T 8,000 T P 6,000
Total 32,000
Cities P Q R S T
P - 0 4 0 2 Q 0 - 2 0 2 R 2 0 - 4 0 S 0 0 6 - 10 T 0 0 0 8 -
© The Institute of Chartered Accountants of India

8
Question 2 (a) AXE Ltd
for a pro
SellingMateriLabou As MaVariablabourMaxim
Total fixof outpu
Produ(any cZero t1,00,01,50,0
Product
Path Show
d. manufactuoduction perio
g price rial cost ur cost ssembly Dept. achine Dept. @ble overheadsr hour in asse
mum external
xed cost is deut:
uction units combination oto 1,00,000 un001 to 1,50,00001 to 2,00,00
tion facilities c
Q
R
T
FINAL E
wn in Solution:
Possible Lea
res four prodod:
@ ` 10 per ho@ ` 12 per hous @ ` 4 per embly dept. demand (uni
ependent on t
of one or morenits 00 units 00 units
can be interc
P
S
Q
EXAMINATION
ast Cost is ` 3
ducts A, B ,C
A 10040
our 15 ur 18
6
its) 40,00
the output lev
e of any A, B,
hangeably us
N: MAY, 2014
Alte
2,000 in both o
C and D. The
B 0 109 42
20 24
8
00 55,00
vel and is tabu
C or D)
sed among th
T
R
ernative Path:
of the cases.
following det
C 121
46
15 36
6
00 36,000
ulated below
Tota
he products.
T
Q
S
P
tails are avai
D 124 40
20 30
8
0 30,000
at different le
al fixed cost (`
8,43,0012,50,0016,00,00
ilable
0
evels
` )
00 00 00
© The Institute of Chartered Accountants of India

PAPER – 5 : ADVANCED MANAGEMENT ACCOUNTING 9
Labour availability in the assembly department is limited to 2,20,000 hours for the production period. A local firm has offered to make any quantity of any of the products on a sub-contract basis at the following rates:
A B C D
Sub-contract Price (` /unit) 85 95 101 100
(i) Advise the management on how many units of each product are to be manufactured or subcontracted to fulfill maximum market demand. What would be the corresponding profits?
(ii) What is the minimum number of units to be produced to achieve break-even point? (iii) What would you advise as the best strategy to maximize profits if assembly labour is
not a limiting factor and if there is no compulsion to fulfill market demand? (Only relevant figures need to be discussed. A detailed profitability statement is not required). (10 Marks)
(b) A computer service centre services laptops. It is proposed to study the arrival and servicing pattern of the service centre. The following in information was collected, over a period of 100 days.
No. of computers Frequency of arrival Frequency of service
8 10 15 9 25 20
10 20 25 11 15 16 12 18 14 13 12 10
Simulate the arrival and servicing pattern for 10 days and find out the average number of laptops held for more than one day for service. Assume FIFO method is followed for service/repair and there is one laptop held from previous day for repair at the beginning of the first day.
Use the following series of random numbers:
Arrivals 69 45 46 10 82 16 35 70 57 92
Service 52 36 62 49 68 77 55 66 51 88
(6 Marks)
© The Institute of Chartered Accountants of India

10 FINAL EXAMINATION: MAY, 2014
Answer (a) (i) Assembly Labour is a Limiting Factor & to fulfill Maximum Market Demand:
Statement Showing Contribution per unit as well as Contribution per assembly hour
Demand (Units) 40,000 55,000 36,000 30,000
A B C D Selling Price (`/u) 100 109 121 124 Material Cost (`/u) 40 42 46 40 Labour Cost (`/u) Assembly Dept. 15 20 15 20 Machine Dept. 18 24 36 30 Variable Overheads (`/u) 6 8 6 8 Contribution (`/u) 21 15 18 26 Assembly Hours per unit 1.5 2 1.5 2 Contribution (`/hr.) 14 7.5 12 13 Rank [Contribution (`/hr.)] I IV III II Sub-Contract Price (`/u) 85 95 101 100 Contribution (`/u) [Sub-Contract] 15 14 20 24
It is more profitable to sub-contract C, since contribution is higher in sub -contracting. Allocation of Assembly Hours on the basis of ranking Produce A as much as possible = 40,000 units Hours Required = 60,000 hrs (40,000 units × 1.5 hrs.) Balance Hours Available = 1,60,000 hrs (2,20,000 hrs. − 60,000 hrs.)
Produce the Next Best = 30,000 units of D Hours Required = 60,000 hrs (30,000 units × 2 hrs.) Balance Hours Available = 1,00,000 hrs (1,60,000 hrs. − 60,000 hrs.)
Produce the Next Best = 50,000 units of B 1,00,000 hrs2 hrs / u
⎛ ⎞⎜ ⎟⎝ ⎠
© The Institute of Chartered Accountants of India

PAPER – 5 : ADVANCED MANAGEMENT ACCOUNTING 11
Statement Showing Profit on the basis of ranking
Product Particulars Contribution/unit (`)
Contribution (`)
A Produce: 40,000 units 21 8,40,000 Subcontract: NIL units 15 ---
B Produce: 50,000 units 15 7,50,000 Subcontract: 5,000 units 14 70,000
C Produce: NIL units 18 --- Subcontract: 36,000 units 20 7,20,000
D Produce: 30,000 units 26 7,80,000 Subcontract: NIL units 24 ---
Total Contribution 31,60,000 Less: Fixed Cost 12,50,000 Net Profit 19,10,000
Decision: However AXE Ltd. can save fixed cost of ` 4,07,000 (` 12,50,000 − ` 8,43,000) if it
keeps its production limited to 1,00,000 units. But in this case AXE Ltd. has to subcontract 20,000 units of B to fulfill maximum market demand. Contribution Lost from subcontracting of 20,000 units is amounting to ` 20,000 [20,000 units × (` 15 − ` 14)]. Hence optimum profit would be ` 22,97,000 [` 19,10,000 + ` 4,07,000 − ` 20,000].
Statement Showing Production Vs Sub Contract (units) and Profit – Best Strategy
Prod Produced [Units]
Sub-Contract [Units]
Contribution [Production]
(`)
Contribution [Sub-Contract]
(`)
Total Contribution
(`)
A 40,000 --- 8,40,000 --- 8,40,000 B 30,000 25,000 4,50,000 3,50,000 8,00,000 C --- 36,000 --- 7,20,000 7,20,000 D 30,000 --- 7,80,000 --- 7,80,000
Total Contribution 31,40,000 Less: Fixed Cost 8,43,000 Net Profit 22,97,000
© The Institute of Chartered Accountants of India

12 FINAL EXAMINATION: MAY, 2014
(ii) Break Even Point: Statement Showing Recovery of Fixed Cost
Particulars Amount (`) Fixed Cost (at Best Strategy) 8,43,000 Less: Recovered from Product ‘D’ (`26 × 30,000 units) 7,80,000 Balance 63,000
Less: Recovered from Product ‘A’ 63,000 3,000units21
⎛ ⎞=⎜ ⎟⎝ ⎠
`
` 63,000
Minimum number of units to be produced to achieve break-even point: Product D = 30,000 units Product A = 3,000 units Accordingly, earliest BEP at 33,000 units (iii) Assembly Labour is Not a Limiting Factor & No Requirement to Fulfill Max. Market
Demand: Statement Showing Comparison of Contribution per unit
(Make Vs Sub-Contracting) Demand (Units)
40,000 55,000 36,000 30,000 A B C D
Contribution (`/u) [Make] 21 15 18 26 Contribution (`/u) [Sub-Contract] 15 14 20 24 Best Strategy Make Make Sub
Contracting Make
Ranking for Production II III --- I
Decision: From the above comparison table it can be seen manufacturing of product A, B and D
gives higher contribution per unit as compared to sub-contracting. Therefore, AXE Ltd. should manufacture the entire quantity of product A, B and D and Subcontract the production of product C. However AXE Ltd. can save fixed cost of `4,07,000 (`12,50,000 − `8,43,000) by limiting its production level to 1,00,000 units only. In this case AXE Ltd. will make 30,000 units, 40,000 units and 30,000 units of product D, A and B respectively. But in this case AXE Ltd. has to subcontract 25,000 units of B to earn maximum profit.
© The Institute of Chartered Accountants of India

PAPER – 5 : ADVANCED MANAGEMENT ACCOUNTING 13
Statement Showing Production Vs Sub Contract (units) and Profit – Best Strategy
Prod. Produced [Units]
Sub-Contract [Units]
Contribution [Production]
(`)
Contribution [Sub-Contract]
(`)
Total Contribution
(`)
A 40,000 --- 8,40,000 --- 8,40,000 B 30,000 25,000 4,50,000 3,50,000 8,00,000 C --- 36,000 --- 7,20,000 7,20,000 D 30,000 --- 7,80,000 --- 7,80,000
Total Contribution 31,40,000 Less: Fixed Cost 8,43,000 Net Profit 22,97,000
It may not be necessary to prepare ‘Statement Showing Production Vs Sub Contract (units) and Profit – Best Strategy’ for part (iii), but only relevant figures need to be shown.
(b) The arrival patterns yield the following probability distribution. The numbers 00–99 are allocated in proportion to the probabilities associated with each event.
Random No. Coding for Arrival No. of Laptops Probability Cumulative Probability Random Numbers
8 0.10 0.10 00 – 09 9 0.25 0.35 10 – 34 10 0.20 0.55 35 – 54 11 0.15 0.70 55 – 69 12 0.18 0.88 70 – 87 13 0.12 1.00 88 – 99
The service patterns yield the following probability distribution. The numbers 00–99 are allocated in proportion to the probabilities associated with each event.
© The Institute of Chartered Accountants of India

14 FINAL EXAMINATION: MAY, 2014
Random No. Coding for Service
No. of Laptops Probability Cumulative Probability Random Numbers 8 0.15 0.15 00 – 14 9 0.20 0.35 15 – 34
10 0.25 0.60 35 – 59 11 0.16 0.76 60 – 75 12 0.14 0.90 76 – 89 13 0.10 1.00 90 – 99
Let us simulate the arrival and service of laptops for the next ten days using the given random numbers / information.
Simulation Sheet Day R. No. of
Arrival No. of Laptops
Arrived Opening
Job R. No. of Service
No. of Laptops Serviced*
Closing Job
1 69 11 1 52 10 2 2 45 10 2 36 10 2 3 46 10 2 62 11 1 4 10 9 1 49 10 0 5 82 12 0 68 11 1 6 16 9 1 77 12 0 7 35 10 0 55 10 0 8 70 12 0 66 11 1 9 57 11 1 51 10 2 10 92 13 2 88 12 3
Total 12
* This represents the service capacity of service centre.
Average No. of Laptops held for more than one day = Totalof Clo singJobsNo.of Days
= 12Laptops10Days
= 1.2 Laptops per day
© The Institute of Chartered Accountants of India

PAPER – 5 : ADVANCED MANAGEMENT ACCOUNTING 15
Question 3 (a) RST Ltd. has provided the following summarized results for two years:
Year ended (` In lacs)
31-03-2013 31-3-2014 Sales 3,000 3,277.50 Material 2,000 2,357.50 Variable overheads 500 525.00 Fixed overheads 300 367.50 Profit 200 27.50
During the year ended 31-3-2014 sale price has increased by 15% whereas material and overhead prices have increased by 15% and 5% respectively. You are required to analyse the variances of revenue and each element of cost over the year in order to bring out the reasons for the change in profit. Present a profit reconciliation statement starting from profits in 2012-13 showing the factors responsible for the change in profits in 2013-14.
(10 Marks) (b) A factory produces 3 products X1 , X2 and X3. Each of these products is processed in two
departments, machining and Assembly. The processing time in hours for each product in each department and the total available time in hours in the departments and contribution per unit are given below:
Product Processing time (in hours)
Contribution ` /unit Machining
Department Assembly
Department X1 4 3 8 X2 4 2 6 X3 6 4 5
Available time (hours) 384 288
Exactly 30 units of X3 must be produced. (i) Determine the optimal product mix using simplex method and find the optimal profit. (ii) Comment on the solution, objective function and the constraints. (6 Marks)
© The Institute of Chartered Accountants of India

16 FINAL EXAMINATION: MAY, 2014
Answer (a) Statement Showing Reconciliation Between
Budgeted Profit [F.Y. 2012-13] & Actual Profit [F.Y. 2013-14] Particulars (` in lacs) (` in lacs) Budgeted Profit 200.00 Sales Margin Variances: Price 427.50 (F) Volume 10.00 (A) 417.50 (F) Direct Material Variances: Price 307.50 (A) Usage 150.00 (A) 457.50 (A) Variable Overheads Variances: Expenditure 25.00 (A) Efficiency 25.00 (A) 50.00 (A) Fixed Overheads Variances: Expenditure 67.50 (A) Volume 15.00 (A) 82.50 (A) Actual Profit 27.50
Computation of Variances (` In Lacs) Sales Variances Price Variance = Actual Sales – Standard Sales = `3,277.50 – `2,850.00 = `427.50 (F) Volume Variance = Standard Sales – Budgeted Sales = `2,850.00 – `3,000.00 = `150 (A) Sales Margin Variances Sales Margin Price = Sales Price Variance Variance = `427.50 (F)
© The Institute of Chartered Accountants of India

PAPER – 5 : ADVANCED MANAGEMENT ACCOUNTING 17
Sales Margin Volume = Sales Volume Variance × Budgeted Net Profit Ratio Variance
= `150 (A) × 2003,000
⎛ ⎞⎜ ⎟⎝ ⎠
`
`
= `10 (A) Material Variances Material Price Variance = Standard Cost of Actual Quantity – Actual Cost = `2,050.00 – `2,357.50 = `307.50 (A) Material Usage Variance = Standard Cost of Standard Quantity for Actual Output –
Standard Cost of Actual Quantity = `1,900 – `2,050 = `150 (A) Variable Overhead Variances Expenditure Variance = Budgeted Variable Overheads for Actual Hours – Actual
Variable Overheads Or = Std. Rate per unit × Expected Output for Actual Hours
Worked – Actual Variable Overheads = `500 – `525 = `25 (A) Efficiency Variances = Standard Variable Overheads for Production – Budgeted
Variable Overheads for Actual Hours Or = Std. Rate per unit × Actual Output – Std. Rate per
unit × Expected Output for Actual Hours Worked = `475 – `500 = `25 (A) Fixed Overhead Variances Expenditure Variance = Budgeted Fixed Overheads – Actual Fixed Overheads. = `300.00 – `367.50 = `67.50 (A)
© The Institute of Chartered Accountants of India

18 FINAL EXAMINATION: MAY, 2014
Volume Variance = Absorbed Fixed Overheads – Budgeted Fixed Overheads = `285 – `300 = ̀ 15 (A) Working Notes (` in lacs) Note-1:
Sales in F.Y. 2013-2014 3,277.50 Less: Increase due to price rise [`3,277.50 lacs × 15/115] 427.50 Sales in F.Y. 2013-2014 at F.Y. 2012-2013 Prices [Standard Sales] 2,850.00 Sales in F.Y. 2012-2013 3,000.00 Fall in Sales in F.Y. 2013-2014 [`3,000 lacs − `2,850 lacs] 150.00 Percentage fall 5%
Note-2: Material Cost In F.Y. 2012-2013 2,000.00 Less: 5% for Decrease in Volume 100.00 ‘Standard Material Usage’ at F.Y. 2012-13 Prices 1,900.00 (Standard Cost of Standard Quantity for Actual output) Actual Material Cost F.Y. 2013-2014 2,357.50 Less: 15% Increase in Prices [`2,357.50 lakhs × 15/115] 307.50 Actual Materials Used, at F.Y. 2012-2013 Prices 2,050.00 (Standard Cost of Actual Quantity)
Note-3:
Variable Overheads Cost in F.Y. 2012-13 500.00 Less: 5% due to fall in Volume of Sales in F.Y. 2013-14 25.00 "Standard Overheads for Production" in F.Y. 2013-14 475.00 Actual Variable Overheads Incurred in F.Y. 2013-14 525.00 Less: 5% for Increase in Price [`525 lacs × 5 / 105] 25.00 Amount Spent in F.Y. 2013-14 at F.Y. 2012-13 Prices (Budgeted Variable Overheads for Actual Hours)
500.00
Note-4: Fixed Overheads Cost in F.Y. 2012-13 300.00 Less: 5% due to fall in Volume of Sales in F.Y. 2013-14 15.00 "Standard Overheads for Production" in F.Y. 2013-14. (Absorbed Fixed Overheads)
285.00
© The Institute of Chartered Accountants of India

PAPER – 5 : ADVANCED MANAGEMENT ACCOUNTING 19
This question can also be solve by ‘Contribution’ approach. (b) (i) Let x1, x2, and x3 represent the number of units of products X1, X2 and X3
respectively then the mathematical formulation of the linear programming problem based on the above data will be as follows:
Maximize Z = 8x1 + 6x2 + 5x3 Subject to the Constraints: 4x1 + 4x2+ 6x3 ≤ 384 3x1 + 2x2+ 4x3 ≤ 288 x3 = 30 x1, x2, x3 ≥ 0 Or Maximize Z = 8x1 + 6x2 + 5 x 30 Subject to the Constraints: 4x1 + 4x2+ 6 x 30 ≤ 384 3x1 + 2x2+ 4 x 30 ≤ 288 x1, x2 ≥ 0 Or Maximize Z = 8x1 + 6x2 + 150 Subject to the Constraints: 4x1 + 4x2 ≤ 204 3x1 + 2x2 ≤ 168 x1, x2 ≥ 0 By introducing slack variables in the above constrains, we get: Maximize Z = 8x1 + 6x2 + 150 + 0s1 + 0s2 Subject to: 4x1 + 4x2 + s1 = 204
© The Institute of Chartered Accountants of India

20 FINAL EXAMINATION: MAY, 2014
3x1 + 2x2 + s2 = 168 x1, x2, s1, s2 ≥ 0 We shall prepare the simplex tableau as follows:
SIMPLEX TABLEAU-I Cj 8 6 0 0 Min.
Ratio CB Basic Variable (B)
Value of Basic Variables b(=XB)
x1 x2 s1 s2
0 s1 204 4 4 1 0 51 0 s2 168 3 2 0 1 56
Zj = Bi jC X∑ 0 0 0 0
Cj − Zj 8 6 0 0
SIMPLEX TABLEAU-II Cj 8 6 0 0
CB Basic Variable (B)
Value of Basic Variables b(=XB)
x1 x2 s1 s2
8 x1 51 1 1 1/4 0 0 s2 15 0 −1 −3/4 1
Zj = Bi jC X∑ 8 8 2 0
Cj − Zj 0 −2 −2 0
Since all numbers in the Cj – Zj row are either negative or zero, the optimum solution to the given problem has been obtained and is given by x1 = 51 units, x2 = 0 units and x3 = 30 units (already given).
Maximum Contribution = `8 × 51 units + `6 × 0 units + `5 × 30 units = `558 (ii) Solution, Objective Function and The Constraints ‘When a non basic variable in the final tableau (showing optimal solution) to a
problem has a net zero contribution then optimal solution to given problem is not one but multiple’
and Multiple optimal solutions can occur when the objective function parallel to a
constraint.
© The Institute of Chartered Accountants of India

PAPER – 5 : ADVANCED MANAGEMENT ACCOUNTING 21
In the above case x2 and s1 are non basic variables in the optimal table (Simplex Tableau-II) and have Cj − Zj ≠ 0. Hence, LPP has no multiple optimal solutions. Accordingly objective function is also not parallel to constraint.
This question can also be solve by taking ‘Artificial Variable’ for Equation x3 = 30.
Question 4 (a) PQR Ltd. specializes in the distribution of pharmaceutical products. It buys from
pharmaceutical companies and resells to each of the three different markets: (i) General Supermarket Chains (ii) Drug Store Chains (iii) Chemist Shops
The company plans to use activity based costing for analyzing the profitability of its distribution channels. The following data for the quarter ending March 2014 is given:
General Supermarket Chains
Drug Store Chains
Chemist Shop
Average sales per delivery ` 96,500 ` 32,450 ` 6,225 Average cost of goods sold per delivery ` 94,650 ` 31,800 ` 5,950
Number of deliveries 960 2,470 8,570 Total number of orders 1,000 2,650 9,500 Average number of cartons shipped per delivery 250 75 12
Average number of hours of shelf stocking per delivery 2 0.5 0.1
The following information is available in respect of operating costs (other than cost of goods sold) for the quarter ending March 2014:
Activity Area Cost Driver Total Cost (` ) Customer purchase order processing
Purchase order by customers
5,91,750
Customer store delivery Number of deliveries 9,60,000 Cartons dispatched to customer stores
Number of Cartons dispatched to customer stores
7,92,135
Shelf stocking at customer store Hours of shelf stocking 80,240
© The Institute of Chartered Accountants of India

22 FINAL EXAMINATION: MAY, 2014
Compute the operating income of each distribution channel for the quarter ending March 2014 using activity based costing. (8 Marks)
(b) The following table relates to a network:
Activity Normal Time (Days)
Crash Time (Days)
Normal Cost (`)
Crash (`)
1-2 5 4 30,000 40,000 2-3 6 4 48,000 70,000 2-4 8 7 1,25,000 1,50,000 2-5 9 6 75,000 1,20,000 3-4 5 4 82,000 1,00,000 4-5 7 5 50,000 84,000
The overhead cost per day is ` 5,000 and the contract includes a penalty clause of ` 15,000 per day if the project is not completed in 20 days. (i) Draw the network and calculate the normal duration and its cost. (ii) Find out:
(1) the lowest cost and the associated time. (2) the lowest time and the associated cost.
Answer (a) Statement Showing Operating Income of Distribution Channels of PQR Ltd.
Particulars General Supermarket
Chains (`)
Drug Store Chains
(`)
Chemist Shops
(`)
Total
(`) Sales (Number of Deliveries × Average Sales per delivery)
9,26,40,000 (960 × `96,500)
8,01,51,500 (2,470 × `32,450)
5,33,48,250 (8,570 × `6,225)
22,61,39,750
Less: Cost of Goods Sold (Number of Deliveries × Average Cost of Goods Sold per delivery)
9,08,64,000 (960 × `94,650)
7,85,46,000 (2,470 × `31,800)
5,09,91,500 (8,570 × `5,950)
22,04,01,500
Gross Margin 17,76,000 16,05,500 23,56,750 57,38,250 Less: Operating Costs 5,20,200 6,19,425 12,84,500 24,24,125 Operating Income 12,55,800 9,86,075 10,72,250 33,14,125
© The Institute of Chartered Accountants of India

PAPER – 5 : ADVANCED MANAGEMENT ACCOUNTING 23
Workings: Statement Showing Operating Cost of Distribution Channels of PQR Ltd.
Particulars General Supermarket
Chains
Drug Store Chains
Chemist Shops
Total
(`) (`) (`) (`) Customer Purchase Order Processing
45,000 (`45 × 1,000)
1,19,250 (`45 × 2,650)
4,27,500 (`45 × 9,500)
5,91,750
Customer Store Delivery
76,800 (`80 × 960)
1,97,600 (`80 × 2,470)
6,85,600 (`80 × 8,570)
9,60,000
Cartons Dispatched to Customer Stores
3,60,000 (`1.5 × 2,40,000)
2,77,875 (`1.5 × 1,85,250)
1,54,260 (`1.5 × 1,02,840)
7,92,135
Shelf Stocking at Customer Store
38,400 (`20 × 1,920)
24,700 (`20 × 1,235)
17,140 (`20 × 875)
80,240
5,20,200 6,19,425 12,84,500 24,24,125
Computation of Rate Per Unit of Cost Allocation Base
Activity Activity Cost
[a]
Activity Driver No. of Units of Activity Driver
[b]
Cost Driver Rate
[a] / [b] (`) (`) Customer Purchase Order Processing
5,91,750 Purchase Order by Customers
13,150 45.00
Customer Store Delivery
9,60,000 Number of Deliveries
12,000 80.00
Cartons Dispatched to Customer Stores
7,92,135 Number of Cartons Dispatched to Customer Stores
5,28,090 1.50
Shelf Stocking at Customer Store
80,240 Hours of Shelf Stocking
4,012 20.00
No. of Units of Activity Driver Purchase Order by Customers = 1,000 + 2,650 + 9,500 = 13,150
© The Institute of Chartered Accountants of India
24 FINAL EXAMINATION: MAY, 2014
Number of Deliveries = 960 + 2,470 + 8,570 = 12,000 Number of Cartons Dispatched to Customer Stores = Number of Deliveries × Average Number of
Cartons Shipped per delivery = (960 × 250) + (2,470 × 75) + (8,570 × 12) = 2,40,000 + 1,85,250 + 1,02,840 = 5,28,090 Hours of Shelf Stocking = Number of Deliveries × Average Number of
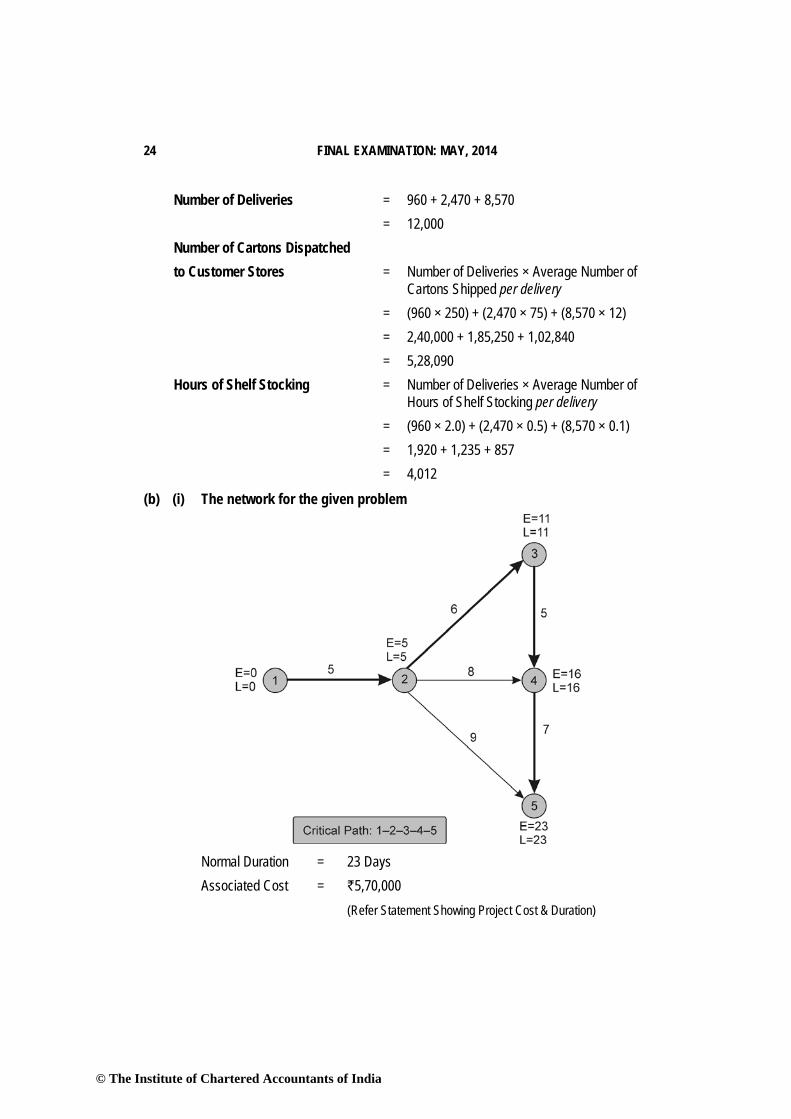
Hours of Shelf Stocking per delivery = (960 × 2.0) + (2,470 × 0.5) + (8,570 × 0.1) = 1,920 + 1,235 + 857 = 4,012 (b) (i) The network for the given problem
Normal Duration = 23 Days Associated Cost = `5,70,000 (Refer Statement Showing Project Cost & Duration)
© The Institute of Chartered Accountants of India

PAPER – 5 : ADVANCED MANAGEMENT ACCOUNTING 25
(ii) Lowest Cost = ` 5,42,000 Associated Time = 20 Days (Refer Statement Showing Project Cost & Duration)
Lowest Time = 17 Days Associated Cost = ` 5,79,000 (Refer Statement Showing Project Cost & Duration)
Workings: Statement Showing Project Cost & Duration
Project Length Days
Job Crashed
Crashing Cost
Normal Cost
Indirect Cost
Penalty Total Cost
23 – – `4,10,000
`1,15,000 (`5,000 × 23 Days)
`45,000 (`15,000 ×
3 Days)
`5,70,000
22 1–2 `10,000 (`10,000 × 1 Day)
`4,10,000
`1,10,000 (`5,000 × 22 Days)
`30,000 (`15,000 ×
2 Days)
`5,60,000
20 2–3 `32,000 (`10,000 + `11,000
× 2 Days)
`4,10,000
`1,00,000 (`5,000 × 20 Days)
`0 (`15,000 ×
0 Days)
`5,42,000
18 4–5 `66,000 (`32,000 + `17,000
× 2 Days)
`4,10,000
`90,000 (`5,000 × 18 Days)
`0 (`15,000 ×
0 Days)
`5,66,000
17 3–4 `84,000 (`66,000 + `18,000
× 1 Day)
`4,10,000
`85,000 (`5,000 × 17 Days)
`0 (`15,000 ×
0 Days)
`5,79,000
Statement Showing Cost Slope of each activity Activity Normal Crash Cost Slopes
Duration (Days)
Cost (`)
Duration (Days)
Cost (`)
ΔT (Days)
ΔC (`)
ΔC/ΔT (`)
1-2 5 30,000 4 40,000 1 10,000 10,000 2-3 6 48,000 4 70,000 2 22,000 11,000 2-4 8 1,25,000 7 1,50,000 1 25,000 25,000 2-5 9 75,000 6 1,20,000 3 45,000 15,000 3-4 5 82,000 4 1,00,000 1 18,000 18,000 4-5 7 50,000 5 84,000 2 34,000 17,000
Total 4,10,000
© The Institute of Chartered Accountants of India
26 FINAL EXAMINATION: MAY, 2014
Question 5
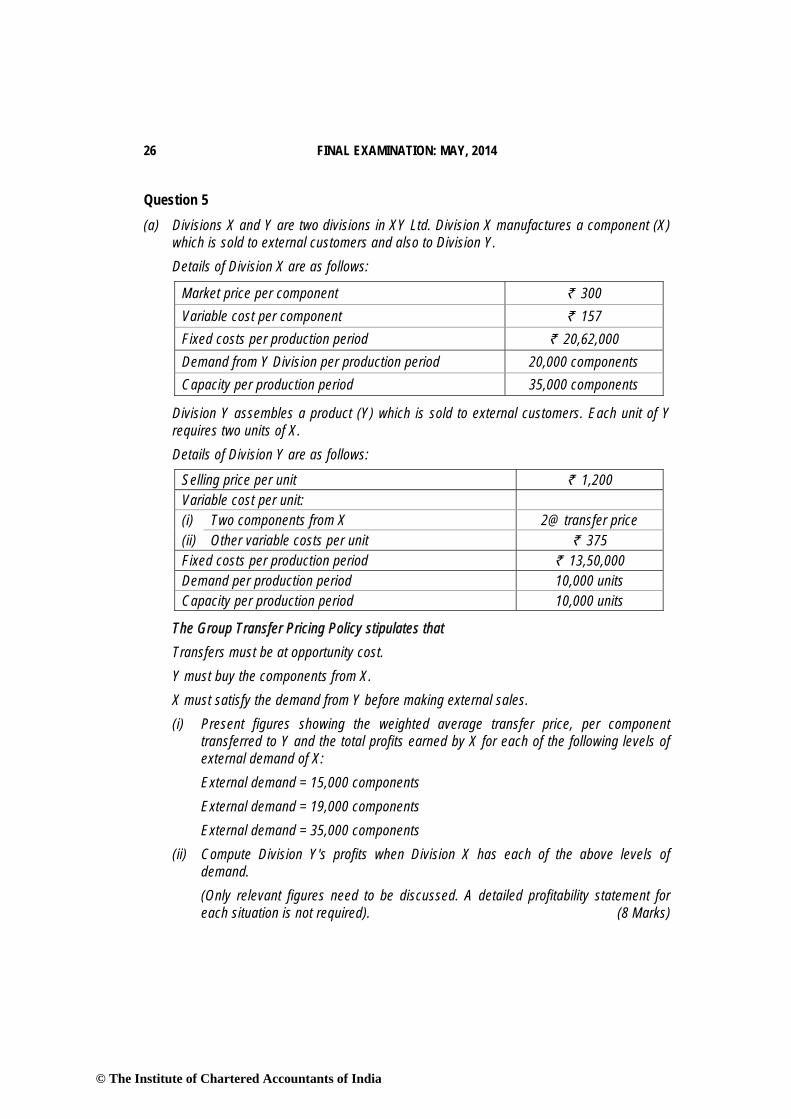
(a) Divisions X and Y are two divisions in XY Ltd. Division X manufactures a component (X) which is sold to external customers and also to Division Y.
Details of Division X are as follows:
Market price per component ` 300 Variable cost per component ` 157 Fixed costs per production period ` 20,62,000 Demand from Y Division per production period 20,000 components Capacity per production period 35,000 components
Division Y assembles a product (Y) which is sold to external customers. Each unit of Y requires two units of X.
Details of Division Y are as follows:
Selling price per unit ` 1,200 Variable cost per unit: (i) Two components from X 2@ transfer price (ii) Other variable costs per unit ` 375 Fixed costs per production period ` 13,50,000 Demand per production period 10,000 units Capacity per production period 10,000 units
The Group Transfer Pricing Policy stipulates that Transfers must be at opportunity cost. Y must buy the components from X. X must satisfy the demand from Y before making external sales.
(i) Present figures showing the weighted average transfer price, per component transferred to Y and the total profits earned by X for each of the following levels of external demand of X:
External demand = 15,000 components External demand = 19,000 components External demand = 35,000 components (ii) Compute Division Y's profits when Division X has each of the above levels of
demand. (Only relevant figures need to be discussed. A detailed profitability statement for
each situation is not required). (8 Marks)
© The Institute of Chartered Accountants of India

PAPER – 5 : ADVANCED MANAGEMENT ACCOUNTING 27
(b) Buildico, a company that builds houses presents the following facts relating to a certain housing contract that it wishes to undertake:
The CEO's and Marketing Director's food and hotel expenses of ` 3,750 were incurred for a meeting with a prospective client.
1,200 kgs of raw material Z will be required for the house. Inventory of Z available is 550 kg. It was purchased at ` 580 per kg. It is used by Buildico in other projects. Its current market price is ` 650 per kg. Its resale value is ` 350 per kg.
The house will require 90 hours of engineer's time. The engineers are paid a fixed monthly salary of ` 47,500 per engineer who can work 150 hours a month. Spare time is not available now and an engineer has to be hired for this house for one month. He cannot be used in any other project once he does this contract.
Buildico will use a special earthquake proof foundation material. This was developed by Buildico at a cost of ` 30,000 for some other project that had to be abandoned. If it does not use it in this project, it can use it in some other project and charge the client ` 50,000 for it.
A list of items is given below. You are required to name the type of cost and state whether it is relevant or not in calculating the cost of the given housing project:
S. No.
Item Type of Cost Relevant (R)/ Irrelevant (IR)
1 Food and hotel expenses ` 3,750 2. (i) Material Z : 550 kg × ` 580/kg (ii) Material Z : 550 kg × ` 650 per kg 3. (i) Engineer's salary ` 47,500 (ii) Engineer's free time cost 60 × 47,500
150`
4. (i) Design cost ` 30,000 (ii) Design cost ` 50,000
(8 Marks)
Answer (a) (i) Computation of Weighted Average Transfer Price
Particulars External Demand 15,000
Components
External Demand 19,000
Components
External Demand 35,000
Components Component’s Transfer Price
Variable Cost Variable Cost plus Opportunity Cost for
Variable Cost plus Opportunity Cost for
© The Institute of Chartered Accountants of India

28 FINAL EXAMINATION: MAY, 2014
(Base) 4,000 Components 20,000 Components Variable Cost `157.00 `157.00 `157.00 Opportunity Cost
0 `28.60 4,000 × 14320,000
⎛ ⎞⎜ ⎟⎝ ⎠
`
`143.00 20,000 × 14320,000
⎛ ⎞⎜ ⎟⎝ ⎠
`
Transfer Price `157.00 `185.60 `300.00
Opportunity Cost for a Component is the Contribution forgone by not Selling it to the market.
Contribution = Market Selling Price – Variable Cost = `300 – `157 = `143
Statement Showing Profitability of Division- X
Particulars External Demand 15,000
Components (`)
External Demand 19,000
Components (`)
External Demand 35,000
Components (`)
Sales : Division-Y 31,40,000
(`157 × 20,000) 37,12,000
(`185.60 × 20,000) 60,00,000
(`300 × 20,000) Market 45,00,000
(`300 × 15,000) 45,00,000
(`300 × 15,000) 45,00,000
(`300 × 15,000) Total Revenue 76,40,000 82,12,000 1,05,00,000 Less: Variable Cost (`157 × 35,000)
54,95,000 54,95,000 54,95,000
Less: Fixed Cost 20,62,000 20,62,000 20,62,000 Profit 83,000 6,55,000 29,43,000
(ii) Statement Showing Profitability of Division- Y Particulars External Demand
15,000 Components
(`)
External Demand 19,000
Components (`)
External Demand 35,000
Components (`)
Selling Price per unit 1,200.00 1,200.00 1,200.00 Less: Variable Cost per unit:
314.00 (`157 × 2)
371.20 (`185.60 × 2)
600.00 (`300 × 2)
© The Institute of Chartered Accountants of India

PAPER – 5 : ADVANCED MANAGEMENT ACCOUNTING 29
Component –X Others 375.00 375.00 375.00 Contribution per unit 511.00 453.80 225.00 No. of units 10,000 10,000 10,000 Total Contribution 51,10,000 45,38,000 22,50,000 Less: Fixed Cost 13,50,000 13,50,000 13,50,000 Profit 37,60,000 31,88,000 9,00,000
(b) Sl. No. Item Type of Cost Relevant (R) /
Irrelevant (IR) 1 Food and hotel expenses `3,750 Sunk Cost Irrelevant
2(i) Material Z: 550 kg × `580/kg Historical Cost / Sunk Cost
Irrelevant
(ii) Material Z: 550 kg × `650 per kg Replacement Cost Relevant 3(i) Engineer’s salary `47,500 Period Cost Relevant (ii) Engineer’s free time cost
60/ 150 × `47,500 Committed Cost / Unavoidable Cost
Irrelevant
4(i) Design cost `30,000 Sunk Cost Irrelevant (ii) Design cost `50,000 Opportunity Cost Relevant
Question 6 (a) DEF Ltd manufactures and sells a single product and has estimated sales revenue of
` 397.80 lacs during the year based on 20% profit on selling price. Each unit of product requires 6 kg of material A and 3 kg of material B and processing time of 4 hours in machine shop and 2 hours in assembly shop. Factory overheads are absorbed at a blanket rate of 20% of direct labour. Variable selling & distribution overheads are ` 6 per unit sold and fixed selling & distribution overheads are estimated to be ` 7,20,000.
The other relevant details are as under: Purchase Price Material A ` 16 per kg Materials B ` 10 per kg Labour Rate Machine Shop ` 14 per hour Assembly Shop ` 7 per hour
Finished Stock Material A Material B Opening Stock 25,000 units 75,000 kg 40,000 kg Closing Stock 30,000 units 80,000 kg 55,000 kg
© The Institute of Chartered Accountants of India

30 FINAL EXAMINATION: MAY, 2014
You are required to calculate: (i) Number of units of product proposed to be sold and selling price per unit. (ii) Production budget in units. (iii) Material purchase budget in units. (7 Marks)
(b) Y Limited is a manufacturer of Cardboard boxes. An analysis of its operating income between 2012 and 2013 shows the following:
Income Statement (amount in 2012)
Revenue & Cost effect of Growth component in 2013
Revenue & Cost effect of Price recovery component in 2013
Cost effect of productivity component in 2013
Income Statement (amount in 2013)
Revenue (` ) 40,00,000 2,00,000(F) 4,20,000(F) - 46,20,000 Cost (` ) 29,20,000 60,000 (A) 2,56,000(A) 58,000(F) 31,78,000 Operating Income (` )
10,80,000 1,40,000(F) 1,64,000(F) 58,000(F) 14,42,000
Y limited sold 4,00,000 boxes and 4,20,000 boxes in 2012 and 2013 respectively. During 2013 the market for cardboard boxes grew 3% in terms of number of units and all other changes are due to company's differentiation strategy and productivity. Compute how much of the change in operating income from 2012 to 2013 is due to the industry market size factor, productivity and product differentiation and also reconcile the profit of both years due to these factors. (5 Marks)
(c) Can there be (i) more than one dummy row or column or (ii) one dummy row and a dummy column in a given problem of (a) assignment (b) transportation? Why? (In other words, state whether and why each of situations A, B, C and D is possible or not):
Assignment Transportation More than one dummy row or column A B One dummy row and one dummy column C D
(4 Marks) Answer (a) (i) Workings:
Statement Showing Total Variable Cost for the year Particulars Amount
(`) Estimated Sales Revenue 3,97,80,000 Less: Desired Profit Margin on Sale @ 20% 79,56,000
© The Institute of Chartered Accountants of India

PAPER – 5 : ADVANCED MANAGEMENT ACCOUNTING 31
Estimated Total Cost 3,18,24,000 Less: Fixed Selling and Distribution Overheads 7,20,000 Total Variable Cost 3,11,04,000
Statement Showing Variable Cost per unit Particulars Variable Cost p.u.
(`) Direct Materials: A: 6 Kg. @ `16 per Kg. 96 B: 3 Kg. @ `10 per Kg. 30 Labour Cost: Machine Shop: 4 hrs. @ `14 per hour 56 Assembly Shop: 2 hrs. @ `7 per hour 14 Factory Overheads: 20% of (`56 + `14) 14 Variable Selling & Distribution Expenses 6 Total Variable Cost per unit 216
Number of Units Sold = Total Variable Cost / Variable Cost per unit = `3,11,04,000 / `216 = 1,44,000 units Selling Price per unit = Total Sales Value / Number of Units Sold = `3,97,80,000 / 1,44,000 units = `276.25 (ii) Production Budget (units)
Particulars Units Budgeted Sales 1,44,000 Add: Closing Stock 30,000 Total Requirements 1,74,000 Less: Opening Stock 25,000 Required Production 1,49,000
© The Institute of Chartered Accountants of India

32 FINAL EXAMINATION: MAY, 2014
(iii) Materials Purchase Budget (Kg.) Particulars Material Material A B Requirement for Production 8,94,000 4,47,000 (1,49,000 units × 6 Kg.) (1,49,000 units × 3 Kg.)
Add: Desired Closing Stock 80,000 55,000 Total Requirements 9,74,000 5,02,000 Less: Opening Stock 75,000 40,000 Quantity to be purchased 8,99,000 4,62,000
(b) Reconciliation of Operating Income
Particulars Amount (`) Operating Income in 2012 10,80,000 Add: Change Due to Industry Market Size Factor (W.N.-1) 84,000 Changes Due to Productivity (W.N.-2) 58,000 Changes Due to Product Differentiation (W.N.-3) 2,20,000 Operating Income in 2013 14,42,000
Workings: Total Increase in Sale of Cardboard Boxes 20,000 Boxes (4,20,000 Boxes – 4,00,000 Boxes).
Out of this increase in Sales of 20,000 Boxes,12,000 Boxes (3% of 4,00,000) is due to growth in market size, and the remaining 8,000 Boxes (20,000 Boxes – 12,000 Boxes) are due to an increase in market share .
W.N.1 Effect of the Industry Market Size Factor on operating income: = Revenue and Cost Effect of Growth Component in 2013 ×
Increase in Sales Unit Due to Market GrowthTotal Growth in Sales Unit (from2012to 2013)
= ` 1,40,000 × 12,000Boxes20,000Boxes
= ` 84,000 (F) W.N.2. Effect of Productivity on operating income: = Cost Effect of Productivity Component in 2013 = `58,000 (F)
© The Institute of Chartered Accountants of India

PAPER – 5 : ADVANCED MANAGEMENT ACCOUNTING 33
W.N.3 Effect of Product Differentiation on operating income: Particulars Amount (`) Increase in the Selling Price (Revenue Effect of the Price Recovery Component)
4,20,000 (F)
Increase in Prices of Inputs (Cost Effect of the Price Recovery Component)
2,56,000 (A)
Growth in Market Share Due to Product Differentiation* ⎛ ⎞⎜ ⎟⎝ ⎠
8,000 Boxes1,40,000 x 20,000 Boxes
` 56,000 (F)
Total 2,20,000 (F)
* Revenue and Cost Effect of Growth Component in 2013 ×
Increase in Sales Unit Due to Product Differentiation
Total Growth in Sales Unit (from 2012 to 2013)
(c) Situation Assignment Transportation
More than one Dummy row or column
A: Possible Reason: In assignment problem, the pay off matrix should be square matrix i.e. no. of rows should be equal to no. of column. In case of unbalanced assignment problem where pay off matrix is not square matrix, either dummy rows or dummy columns, which may be one or more than one, would be added to make it a square matrix.
B: Not Possible Reason: Requirement to solve a transportation problem is that the problem should be balanced i.e. total capacity (or supply) should be equal to total requirement (or demand). In case of a unbalanced transportation problem, a dummy destination or a dummy origin in form of either only one dummy row or one dummy column is introduced in the transportation table to absorb excess capacity or excess demand and to find solution
One Dummy row and one Dummy column
C: Not Possible Reason: As explained in situation- A either dummy rows or dummy columns would be added to transform unbalanced payoff matrix into square matrix, both row and column cannot be added together otherwise problem would remain unbalanced, thus remain unsolved.
D: Not Possible Reason: In case of unbalanced transportation problem, there would be mismatch of demand and supply. To solve this one problem, either one dummy row or one dummy column is required to absorb either excess demand or excess supply.
© The Institute of Chartered Accountants of India

34 FINAL EXAMINATION: MAY, 2014
Conceptually correct brief reason along with the possibility of situation (Possible or Not Possible) is sufficient.
Question 7 Answer any four out of the following five questions: (a) How is Pareto analysis helpful in pricing of products in the case of a firm dealing with
multiple products? (b) Discuss the benefits of Customer Profitability Analysis. (c) Classify the following items appropriately under the three measures used in the Theory of
Constraints: (i) Research and Development Cost (ii) Rental/Utilities (iii) Finished Goods Inventory (iv) Depreciation (v) Labour Cost (vi) Stock of Raw Materials (vii) Sales (viii) Cost of Equipment and Buildings
(d) Will the solution for a minimization problem obtained by Vogel's Approximation Method and Least Cost Method be the same? Why?
(e) In a 3 x 4 transportation problem for minimizing costs, will the R2C1 cell (at the intersection of the 2nd row and 1st column) always figure in the initial solution by the North West Corner Rule? Why? (4 x 4 = 16 Marks)
Answer (a) Role of Pareto Analysis in Pricing of Product in the case of firm dealing with
multiple products In the case of firm dealing with multi products, it would not be possible for it to analyse
price-volume relationship for all of them. Pareto Analysis is used for analysing the firm’s estimated sales revenue from various products and it might indicate that approximately 80% of its total sales revenue is earned from about 20% of its products. Such analysis helps the top management to delegate the pricing decision for approximately 80% of its products to the lower level of management, thus freeing them to concentrate on the pricing decisions for products approximately 20% of which is essential for the company’s survival. Thus, a firm can adopt more sophisticated pricing methods for small proportion of products that jointly account for 80% of total sales revenue. For the remaining 80%
© The Institute of Chartered Accountants of India

PAPER – 5 : ADVANCED MANAGEMENT ACCOUNTING 35
products, which account for 20% of the total sales value the firm may use cost based pricing method.
(b) Benefits of Customer Profitability Analysis (i) It helps the supplier to identify which customers are eroding overall profitability and
which customers are contributing to it. (ii) It can help to provide a basis for constructive dialogue between buyer and seller to
improve margins. (iii) It enhances decision making related to customers. (iv) It helps in effective cost reporting, communication and information. (v) It helps to find out the value and profitability of each customer segment.
(c) Three Measures of Theory of Constraints Item Throughput Contribution (vii) Sales Investments (i) Research and Development Cost
(iii) Finished Goods Inventory (vi) Stock of Raw material (viii) Cost of Equipment and Building
Operating Costs (ii) Rent/Utilities (iv) Depreciation (v) Labour Cost
(d) The initial solution need not be the same under both methods. Vogel’s Approximation Method (VAM) uses the differences between the minimum and the
next minimum costs for each row and column. This is the penalty or opportunity cost of not utilising the next best alternative. The highest penalty is given the 1st preference. This need not be the lowest cost.
For example if a row has minimum cost as 2, and the next minimum as 3, penalty is 1; whereas if another row has minimum 4 and next minimum 6, penalty is 2, and this row is given preference. But Least Cost Method gives preference to the lowest cost cell, irrespective of the next cost. Solution obtained using Vogel’s Approximation Method is more optimal than Least Cost Method.
Initial solution will be same only when the maximum penalty and the minimum cost coincide. (e) The Initial solution obtained by the North-West Corner Rule in transportation need not
always contain the R2C1 cell. In the North-West Corner Rule the first allocation is made at R1C1 cell and then it only moves towards R2C1 cell when the resources at the first row
© The Institute of Chartered Accountants of India

36 FINAL EXAMINATION: MAY, 2014
i.e. R1 is exhausted first than the resources of first column i.e. C1. On the contrary if resources at first column i.e. C1 is exhausted first then the next allocation will be at R1C2.
For example the resource availability at first row (R1) is 1,500 units and the demand in first column (C1) is 1,000 units. In this case resource availability of first row (R1) will be exhausted to the extent of the demand in first column (C1) first and then the remaining resource availability at first row (R1) will be used to meet the demand of the second column (C2). In this example cell R2C1 will not come in initial solution obtained by the North-West Corner Rule.
© The Institute of Chartered Accountants of India