disclaimer · pasir gudang, tanjung langsat, tebrau, tampoi larkin, plentong senai, kulai, air...
TRANSCRIPT


DisclaimerThe data and information in this report represent a fair and reasonable overview of the Piped Gas Distribution Industry. Every effort has been made to verify, validate and accurately represent the information in this report, based on the daily, monthly and yearly reports which were submitted by licensees pursuant to their licence conditions.
The Energy Commission in good faith publishes this information for the consumption of the general public, in line with its functions stipulated under the Act. The Energy Commission disclaims all or any responsibility whatsoever to anyone for information contained in this report or for any representation or statement herein, whether expressed or implied, or for any replies given in response to any queries in relation to this report

BackgrounD1.1 Gas Supply Act 1993 61.2 Functions of the Energy Commission 71.3 Gas Specifications 81.4 Gas Distribution System 11
PiPeD gas suPPly & consumPtion2.1 Overview Of Natural Gas Supply in the Peninsula and Sabah 182.2 Overview of Liquefied Petroleum Gas (LPG) Supply in 23 the Peninsula & Sabah
reliaBility anD suPPly service Quality3.1 Gas Malaysia Berhad (GMB) Performance Indicators 263.2 Complaints and Inquiries Received by Gas Malaysia Berhad (GMB) 28 3.3 Gas Malaysia Berhad (GMB) Client’s Charter Performance 293.4 Sabah Energy Corporation (SEC) Client’s Charter Performance 31
natural gas tariff anD liQuefieD Petroleum gas Prices4.1 Natural Gas Tariff in the Peninsula 364.2 Liquefied Petroleum Gas Prices in the Peninsula 374.3 Natural Gas Prices in Sabah & Labuan 37
gas licensees5.1 Gas Utility Licence (GUL) 405.2 Private Gas Licence (PGL) 40
1.0
2.0
3.0
4.0
5.0
Contents

gas reticulation system6.1 Approval to Install (ATI) and Approval to 44 Operate (ATO)6.2 Inspection and Testing of Gas Installations 47
gas comPetency7.1 Gas Competency Examinations 507.2 Accreditation of Gas Competency Courses 517.3 Gas Competent Person Certifications 527.4 Gas Contractor Registrations 537.5 Gas Responsible Persons for Commercial Premises 53
gas fittings, gas aPPliances 56& gas eQuiPment aPProvals
energy commission contact information9.1 Headquarters 609.2 Regional Offices 61
gas utility licensees contact information10.1 Gas Malaysia Berhad (GMB) 6410.2 Sabah Energy Corporation Sdn. Bhd. (SEC) 66
6.0
7.0
8.0
9.0
10.0


1.0 BACKGROUND

Energy Commission
6
BACKGROUND1.1 gas suPPly act 1993
The government introduced the Gas Supply Act 1993 (Act 501) and Gas Supply Regulations 1997 to regulate piped gas supply and utilisation activities. The main objective is to protect the interests of the consumers and the public who are affected by the supply activities whilst at the same time ensuring continued viability of the gas supply businesses. Act 501 prescribes the administrative and technical standards in the aspects of safety, reliability, economy, efficiency and quality.
In Act 501 gas is defined as methane, ethane, propane, butane or hydrocarbons which may consist of one or more of the above gases in the form of gas or liquid. Natural gas is mainly methane with a small
percentage of other hydrocarbons and non-hydrocarbon gases whereas Liquefied Petroleum Gas (LPG) comprises of mainly propane and butane. Other types of gases, such as oxygen, nitrogen and acetylene used in the industrial sector are not covered by Act 501.
The act is not applicable throughout the gas supply chain. Its scope covers only the supply of natural gas through pipeline downstream of the last flange of the city gate station or the supply of LPG from the filling point of storage tanks or cylinders to gas appliances. Natural gas transmission and lateral pipeline systems (up to and including the city gate stations) are outside the scope of Act 501. Presently, Act 501 is only applicable in the Peninsula and Sabah.

2014 PIPED GAS DISTRIBUTION INDUSTRY STATISTICS
7
1.2 functions of tHe energy commission unDer act 501
i. To ensure a licensee satisfies all reasonable demands for gas through pipelines.
ii. To ensure a licensee could finance the provision of gas supply services.
iii. To protect the interests of consumers of gas supplied through pipelines in respect of
• Thepriceschargedandtheother terms of supply.
• Thecontinuityofsupply.
• The quality of the gassupply services provided.
iv. To regulate the composition, pressure, purity and volume of gas supplied through pipelines.
v. To promote efficiency and economy to supply gas through pipelines and the efficient use of gas supplied through pipelines.
vi. To protect the public from dangers arising from the distribution of gas through pipelines or from the use of gas supplied through pipelines.
vii. To enable persons to compete effectively in the supply of gas through pipelines.
viii. To investigate any accident or fire involving any gas pipeline or installation.

Energy Commission
8
1.3 gas sPecifications
1.3.1 Peninsular malaysia
Average composition of natural gas supplied by Gas Malaysia Berhad (GMB) to consumers in the peninsula.
table 1: average natural gas composition supplied by gas malaysia Berhad (gmB)
gas composition mt-JDa gas (mole (%)) kerteh (mole (%))
CH4 85.86 95.17
C2H6 4.99 2.47
C3H8 1.54 0.43
iC4H10 0.12 0.02
nC4H10 0.09 0.02
iC5H12 + 0.08 0.01
nC5H12 + 0.04 0.01
C6H14 + 0.02 0.01
CO2 5.38 1.23
N2 1.88 0.63
table 2: typical natural gas characteristics by gas malaysia Berhad (gmB)
natural gas Property mt-JDa kerteh
Specific Gravity 0.66 0.60
Gross Calorific Value, (kcal/Sm3) 9,326 9,534
Burning Velocity, (m/s) 0.28 0.31
Upper Flammability Limit, (%) 15.3 15.4
Lower Flammability Limit, (%) 4.3 4.5
Auto-ignition Temperature, (˚C) 628 640
Theoretical Air Requirement, (m3/m3) 9.71 9.74

2014 PIPED GAS DISTRIBUTION INDUSTRY STATISTICS
9
table 3: average liquefied Petroleum gas (lPg) composition in the Peninsula
gas mole (%)
C3H8 40.0
iC4H10 30.0
nC4H10 30.0
table 4: typical lPg characteristics
typical lPg characteristics
Specific Gravity 1.65
Gross Calorific Value, (kcal/Sm3) 28,059
Burning Velocity, (m/s) 0.46
Upper Flammability Limit, (%) 8.5
Lower Flammability Limit, (%) 1.9
Auto-ignition Temperature, (˚C) 510
Theoretical Air Requirement, (m3/m3) 28.81

Energy Commission
10
1.3.2 sabah & labuan
table 5: average natural gas composition supplied by sabah energy corporation sdn. Bhd. (sec)
gas compositionmole (%)
kota kinabalu, sabahmole (%)labuan
CH4 92.62 92.43
C2H6 3.37 3.29
C3H8 1.46 1.25
iC4H10 0.29 0.25
nC4H10 0.34 0.29
iC5H12 + 0.14 0.11
nC5H12 + 0.09 0.08
C6H14 + 0.17 0.15
CO2 1.36 1.29
N2 0.15 0.86
table 6: typical natural gas characteristics supplied by sabah energy corporation sdn. Bhd. (sec)
typical natural gas characteristicskota kinabalu,
sabahlabuan
Specific Gravity 0.61 0.62
Gross Calorific Value, (kcal/Sm3) 9,536.58 10,109.14
Burning Velocity, (m/s) >0.39 >0.39
Upper Flammability Limit, (%) 14.0 14.0
Lower Flammability Limit, (%) 4.0 4.0
Auto-ignition Temperature, (˚C) >630 >630
Theoretical Air Requirement, (m3/m3 ) 9.87 9.87

2014 PIPED GAS DISTRIBUTION INDUSTRY STATISTICS
11
1.4
ga
s D
istr
iBu
tio
n s
yste
m
tabl
e 7
: n
atur
al g
as &
lP
g s
uppl
ied
are
as in
the
Pen
insu
la b
y g
as m
alay
sia
Ber
had
(gm
B)
type
of
gas
reg
ion
nor
thc
entr
als
outh
eas
t
nat
ural
gas
Kam
unti
ng, K
ulim
, P
arit
B
unta
r, N
ibon
g Te
bal,
Pra
i, K
anga
r, S
eri M
anju
ng,
Sun
gai P
etan
i, S
etia
wan
,Lu
mut
, Tr
onoh
, P
adan
g Te
rap,
Chu
ping
Kua
la L
umpu
r, P
etal
ing
Jaya
, B
atu
Cav
es,
Sel
ayan
g,
Sha
h A
lam
, K
lang
, S
epan
g,S
alak
Tin
ggi,
Puc
hong
, B
anti
ng, N
ilai,
Ser
dang
, B
alak
ong,
Sun
gai B
uloh
,D
aman
sara
, K
elan
a Ja
ya,
Put
raja
ya, K
LIA
, B
angi
, C
yber
jaya
, D
engk
il, K
ajan
g,
Che
ras,
Telu
k P
angl
ima
Gar
ang,
Ber
anan
g, B
esta
ri
Jaya
, Je
ram
, N
orth
Por
t,
Ban
dar
Sul
tan
Sul
aim
an,
Pan
dam
aran
, Ij
ok,
Ser
i Kem
bang
an,
Sem
enyi
h,
Kun
dang
, R
awan
g, W
est
Por
t
Pas
ir G
udan
g, T
anju
ng
Lang
sat,
Teb
rau,
Tam
poi
Lark
in,
Ple
nton
g S
enai
, K
ulai
, A
ir H
itam
, K
luan
gS
enaw
ang,
Che
ng,
Ser
emba
n, A
lor
Gaj
ah,
Aye
r K
eroh
, C
heng
, Ta
ngga
Bat
u,B
atu
Ber
enda
m,
Buk
it
Ram
bai,
Ser
emba
n 2
Geb
eng,
Tel
uk K
alon
g,
Kam
aman
, K
erte
h, K
uant
an
Por
t, G
amba
ng
lPg
Pul
au P
inan
g, S
unga
i P
etan
i, Ip
oh, S
eri M
anju
ng,
Telu
k In
tan,
Ser
i Isk
anda
r, M
ergo
ng
Dam
ansa
ra, K
elan
a Ja
ya,
Pet
alin
g Ja
ya,B
atu
Cav
es,
Kla
ng, P
ucho
ng, S
hah
Ala
m,
Kaj
ang,
Kua
la L
umpu
r, A
mpa
ng, S
elay
ang
Joho
r B
haru
, G
elan
g P
atah
, Ta
mpo
i, B
anda
r M
elak
a,
Nus
ajay
a
Kua
ntan

Energy Commission
12
1.4 gas DistriBution system
figure 1: natural gas Distribution Pipeline in the Peninsula
KANGAR
KULIM
PRAI
SERI MANJUNG
KEMUNTING
KUALA LUMPUR
KLANG
BANGI
JOHOR BAHRUPASIR GUDANG
KUANTAN
PAKA
KERTEHGAS PROCESSINGPLANT
PUTRAJAYA
PORT DICKSON
AYER KEROHALOR GAJAH
SHAH ALAM
SEGAMAT
SENAWANG

2014 PIPED GAS DISTRIBUTION INDUSTRY STATISTICS
13
1.4 gas DistriBution system
figure 2: natural gas supply areas in sabah and labuan
LABUAN
KOTA KINABALU
SABAH
SARAWAK

Energy Commission
14
Transmission Pipeline
Cit
y G
ate
Sta
tion
Odo
rise
rS
tati
onD
istr
ict
Sta
tion
Feed
er L
ine
(15
0 -
26
0 p
sig)
Dis
trib
utio
nLi
ne
(35
- 5
0 p
sig)
Ser
vice
Sta
tion
Ser
vice
Sta
tion
> 2
0 p
sig
> 2
0 p
sig
0.4
3 p
sig
4.3
psi
g
4.3
psi
g
Sin
gle
Dev
elop
men
t
CommercialResidentialIndustry
Ser
vice
Sta
tion
Gas
Sup
ply
Act
19
93
Are
aS
tati
on
Reg
ulat
ing
Sta
tion
= G
as M
eter
The
Last
Fla
nge
of C
ity
Gat
e S
tati
on
figu
re 3
: ty
pica
l nat
ural
gas
Dis
trib
utio
n s
yste
m

2014 PIPED GAS DISTRIBUTION INDUSTRY STATISTICS
15
ManifoldedSystem
InternalPiping
Commercial
Residential
InternalPiping
Bulk TankSystem
Gas Meter First Stage Regulator Second Stage Regulator
80
-10
0 p
sig
M
R2
R2
M
M
R1
R1
figure 4: typical lPg Distribution system
Energy Commission
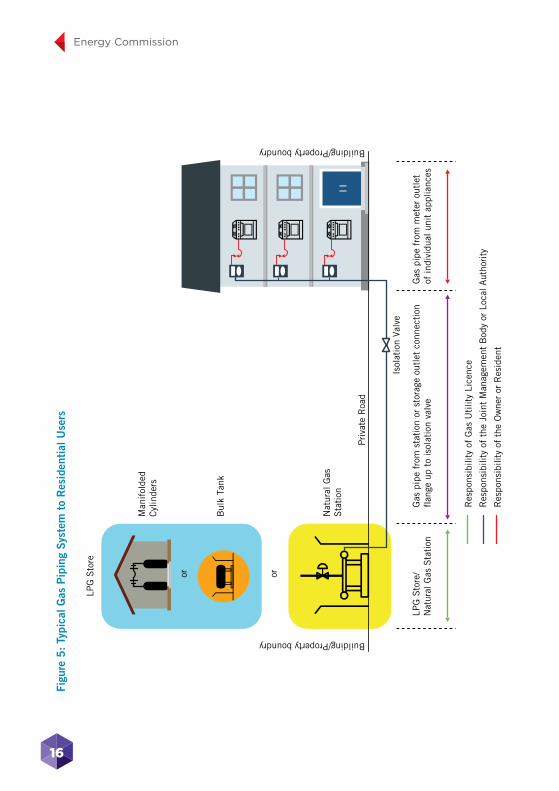
16
LPG
Sto
re
oror
Man
ifol
ded
Cyl
inde
rs
Bul
k Ta
nk
LPG
Sto
re/
Nat
ural
Gas
Sta
tion
Gas
pip
e fr
om s
tati
on o
r st
orag
e ou
tlet
con
nect
ion
flan
ge u
p to
isol
atio
n va
lve
Gas
pip
e fr
om m
eter
out
let
of in
divi
dual
uni
t ap
plia
nces
Pri
vate
Roa
d
Isol
atio
n Va
lve
Building/Property boundry
Building/Property boundry
Nat
ural
Gas
Sta
tion
Res
pons
ibili
ty o
f G
as U
tilit
y Li
cenc
e
Res
pons
ibili
ty o
f th
e Jo
int
Man
agem
ent
Bod
y or
Loc
al A
utho
rity
Res
pons
ibili
ty o
f th
e O
wne
r or
Res
iden
t
figu
re 5
: ty
pica
l gas
Pip
ing
sys
tem
to
res
iden
tial
use
rs
2.0 PIPED GAS SUPPLY AND CONSUMPTION

Energy Commission
18
2.1 overvieW of natural gas suPPly in tHe Peninsula anD saBaH
figure 6: natural gas consumption in the Peninsula
figure 7: average monthly natural gas consumption according to region in the Peninsula
PIPED GAS SUPPLY AND CONSUMPTION
Gas
Cons
umpt
ion
(mm
BTU
)(S
uppl
ied
by G
MB)
Year
20,000,000
0
40,000,000
60,000,000
80,000,000
100,000,000
120,000,000
140,000,000
160,000,000
2006 2007 2008 2009 2010 2011 2012 2013 2014
96
,72
9,5
58
10
6,3
69
,91
0
11
1,6
25
,21
4
10
7,3
13
,11
6
11
7,6
06
,16
2
12
4,6
28
,93
9
12
7,3
80
,25
3
13
8,2
44
,28
8
14
7,3
42
,49
0
Gas
Cons
umpt
ion
(mm
BTU
)(S
uppl
ied
by G
MB)
Region
1,000,000
North Central East South
0
2,000,000
3,000,000
4,000,000
5,000,000
6,000,000
2,6
29
,28
2
5,2
25
,53
9
76
7,8
01
3,6
65
,91
9

2014 PIPED GAS DISTRIBUTION INDUSTRY STATISTICS
19
figure 8: natural gas consumption in sabah & labuan
table 8: average natural gas composition supplied by gas malaysia Berhad (gmB)
region
north central east south
Average Monthly NG Usage Rate (mmBtu/month)
2,629,282 5,225,539 767,801 3,655,919
Number of City Gates 10 9 4 11
Number of Industrial Customers 136 330 36 269
Number of Commercial Customers 0 797 1 1
Number of Residential Customers 0 12,460 108 0
Gas
Cons
umpt
ion
(mm
BTU
)(S
uppl
ied
by S
EC)
Year
50,000
0
100,000
150,000
200,000
250,000
2006 2007 2008 2009 2010 2011 2012 2013 2014
17
1,5
98
17
8,5
51
18
5,3
88
52
,33
5
62
,23
6
66
,79
5
74
,68
4
93
,58
2
23
3,7
23

Energy Commission
20
figure 9: natural gas consumption by user category in the Peninsula
figure 10: natural gas consumption by industry sub-sectors in the Peninsula in 2014
Gas
Cons
umpt
ion
(mm
BTU
)(S
uppl
ied
by G
MB)
Category
20,000,000
Industry Commercial Residential
0
40,000,000
60,000,000
80,000,000
100,000,000
160,000,000
140,000,000
120,000,0001
46
,31
1,9
39
99
2,9
35
37
,61
6
Gas
Cons
umpt
ion
(mm
BTU
)(S
uppl
ied
by G
MB)
2014
5,000,000
0
10,000,000
20,000,000
30,000,000
45,000,000
Non-Metalic Industry40,000,000
35,000,000
25,000,000
15,000,000 13
,49
4,1
49
10
,87
4,9
86
2,0
27
,95
8
24
6,2
15
41
,48
9,2
34
40
,74
3,0
34
4,6
21
,39
7
11
,33
3,5
11
8,1
19
,99
4
14
,21
2,0
54
Basic Metal Industry
Electrical & Electronic
Machinery & Equipment
Rubber Products
Food, Beverages & Tobacco
Fabricated metal Products
Chemicals Products
Glass Products
Others

2014 PIPED GAS DISTRIBUTION INDUSTRY STATISTICS
21
figure 11: number of natural gas users in the Peninsula
Num
ber
of N
atur
al G
as U
sers
Year
2,000
0
4,000
6,000
8,000
10,000
12,000
14,000
2006
65
73
35
6,6
79
2007
64
24
38
8,8
87
2008
63
04
64
7,0
32
2009
64
04
56
7,9
60
2010
68
64
89
10
,43
3
2011
70
45
36
10
,54
1
20126
57
33
56
,67
92013
70
95
65
11
,39
2
2014
77
17
99
12
,56
8
Industry Commercial Residential
Num
ber
of N
atur
al G
as U
sers
Year
20
468
12
16
2018
14
10
2006
8
0 0
2007
11
0 0
2008
13
0 0
2009
11
0 0
2010
11
0 0
2011
12
0 0
2012
12
0 0
2013
18
0 0
2014
20
0 0
Industry Commercial Residential
figure 12: number of natural gas users in sabah & labuan
Energy Commission
22
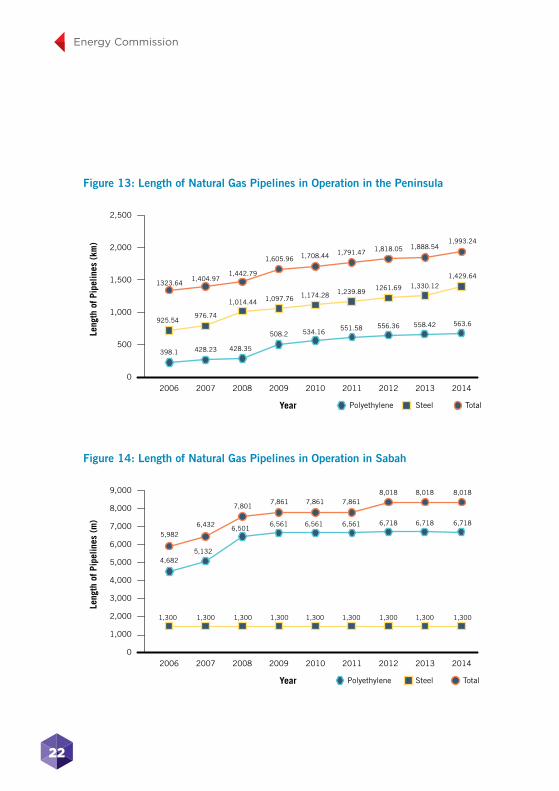
figure 13: length of natural gas Pipelines in operation in the Peninsula
figure 14: length of natural gas Pipelines in operation in sabah
Leng
th o
f Pip
elin
es (
km)
500
0
1,000
2,000
2,500
1323.64
925.54
398.1
1,404.97
976.74
428.23 428.35
508.2
1,442.79
1,014.44
1,605.96
1,097.76
1,708.44
1,174.28
534.16
1,791.47
1,239.89
551.58
1,818.05
1261.69
556.36
1,888.54
1,330.12
558.42
1,993.24
1,429.64
563.6
2006
Polyethylene
2007 2008 2009 2010 2011 2012 2013 2014
1,500
Steel TotalYear
Leng
th o
f Pip
elin
es (
m)
1,000
0
2,000
5,000
4,000
9,000
8,000
7,000
6,0005,982
1,300
4,682
6,432
1,300
5,132
6,5016,561
7,801
1,300
7,861
1,300
7,861
1,300
6,561
7,861
1,300
6,561
8,018
1,300
6,718
8,018
1,300
6,718
8,018
1,300
6,718
2006
Polyethylene
2007 2008 2009 2010 2011 2012 2013 2014
3,000
Steel TotalYear

2014 PIPED GAS DISTRIBUTION INDUSTRY STATISTICS
23
2.2 overvieW of liQuefieD Petroleum gas (lPg) suPPly in Peninsula anD saBaH
figure 15: lPg consumption in the Peninsula
Gas
Cons
umpt
ion
(mm
BTU
)(S
uppl
ied
by G
MB)
Year
50,000
0
100,000
150,000
200,000
250,000
300,000
2006 2007 2008 2009 2010 2011 2012 2013 2014
14
5,7
20
17
7,1
11
19
1,1
58
21
1,4
23
22
8,9
27
25
4,9
04
26
0,4
31
27
8,6
24
27
8,3
24
Gas
Cons
umpt
ion
(mm
BTU
)Su
pplie
d by
GM
B
Year
50,000
0
100,000
150,000
200,000
250,000
2006
1,8
41
79
,35
86
4,5
21
2007
65
61
12
,02
46
4,4
31
2008
50
51
34
,14
35
6,5
10
2009
44
51
53
,21
85
7,7
60
2010
32
21
71
,29
95
7,3
06
2011
41
51
99
,05
05
5,4
39
2012
51
02
05
,91
25
4,0
09
2013
27
52
19
,06
75
9,2
82
2014
02
23
,02
75
5,2
97
Industry Commercial Residential
figure 16: lPg consumption in the Peninsula according to user’s category

Energy Commission
24
Num
ber
of L
PG U
sers
Supp
lied
by G
MB
Year
5,000
0
10,000
15,000
20,000
30,000
25,000
2006
14
63
25
,60
4
2007
17
13
25
,70
4
2008
07
78
23
,32
1
2009
08
50
22
,66
1
2010
09
84
21
,53
1
2011
01
,12
52
0,7
60
2012
01
,17
02
1,0
58
2013
01
,20
42
2,4
80
2014
01
,19
52
2,9
85
Industry Commercial Residential
figure 18: length of operational lPg Pipelines in the Peninsula
Leng
th o
f Pip
elin
es (
km)
0
10
20
30
40
50
60
70
80
90
79.82
0.52
80.34
80.12
0.52
80.64 80.64 80.64
80.12
0.52
80.12
0.52
80.12
0.52
80.64
71.62
0.52
72.14
71.62
0.29
71.91
71.62
0.29
71.91
71.62
0.29
71.91
2006
Polyethylene
2007 2008 2009 2010 2011 2012 2013 2014
Steel TotalYear
figure 17: number of lPg users in the Peninsula

3.0 RELIABILITY AND SUPPLY SERVICE QUALITY

Energy Commission
26
3.1 gas malaysia BerHaD (gmB) Performance inDicators
figure 19: gmB’s saiDi from 2010 to 2014
figure 20: gmB’s saifi from 2010 to 2014
RELIABILITY AND SUPPLY SERVICE QUALITY
SAID
I (M
Inut
es/C
usto
mer
/Yea
r)
Year
0.1000
2010 2011 2012
0.0000
0.2000
0.3000
0.4000
0.5000
0.8000
0.7000
0.6000
0.6
29
9
2013
0.1
48
0
2014
0.1
49
20.3
63
0
0.7
48
9
SAIF
I (Di
srup
tion/
Cust
omer
/yea
r)
Year
0.0005
2010 2011 2012
0.0000
0.0010
0.0015
0.0020
0.0025
0.0040
0.0035
0.0030 0.0
03
7
2013
0.0
02
2
2014
0.0
02
1
0.0
03
9
0.0
02
9
*Note*For figure 19 and figure 20, lower is better

2014 PIPED GAS DISTRIBUTION INDUSTRY STATISTICS
27
figure 21: gmB’s caiDi from 2010 to 2014
figure 22: gmB’s Pipeline leakages index from 2010 to 2014
CAID
I (M
Inut
es/D
isru
ptio
n)
Year
50.00
2010 2011 2012
0.00
100.00
150.00
300.00
250.00
200.00
16
9.2
7
20136
6.8
32014
70
.71
90
.96
26
0.9
0
Leak
age
Inde
x
Year
1.0000
2.0000
4.0000
2010 2011 2012
0.0000
3.0000
5.0000
8.0000
7.0000
6.0000
7.2
34
3
6.7
98
3
5.4
33
8 6.6
60
1
3.7
39
2
4.9
51
2
2.0
63
2
4.0
17
1
2.4
65
9
5.4
37
9
2013 2014
Leakage from the gas pipeline for every 1000km
Leakage at station and customer premises for every 1000 customers
*Note*For figure 21 and figure 22, lower is better
Energy Commission
28
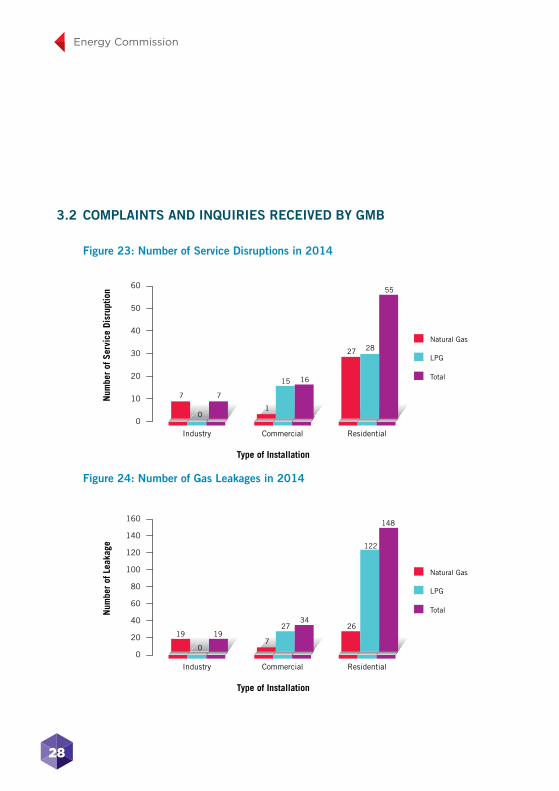
3.2 comPlaints anD inQuiries receiveD By gmB
figure 23: number of service Disruptions in 2014
Num
ber
of S
ervi
ce D
isru
ptio
n
20
Industry
0
10
30
60
50
40
7 7
Commercial
1
15 16
Residential
27 28
55
0
Type of Installation
Natural Gas
LPG
Total
figure 24: number of gas leakages in 2014
Num
ber
of L
eaka
ge
40
Industry
0
20
60
160
140
120
100
80
19 19
Commercial
7
2734
Residential
26
122
148
0
Type of Installation
Natural Gas
LPG
Total

2014 PIPED GAS DISTRIBUTION INDUSTRY STATISTICS
29
3.3 gas malaysia BerHaD (gmB) client’s cHarter Performance
table 9: complaints
item client’s chartercomplaint received
complied to client’s charter
Percentage of compliance (%)
Written complaint 5 working days after the complaint is received
17 17 100
complaint & inquiry via the telephone
24 hours after the call is made
8 8 100
table 10: Bill Payment
item client’s chartercomplaint received
complied to client’s charter
Percentage of compliance (%)
Bill accuracy 5 working days 0 NA NA
table 11: refund
a) Deposit
refund type customer client’s charter
no. of service termination
complied to client’s charter
Percentage of compliance
(%)
Deposit industry Returned within 1 month after service termination
4 0 0
commercial Returned within 1 month after service termination
316 302 96
residential Returned within 2 month after service termination
1,626 1,437 88

Energy Commission
30
table 11: refund (cont’d)
b) Bank Guarantee
refund type client’s charter no. of Bank guarantee
complied to client’s charter
Percentage of compliance (%)
Bank guarantee To be released within 1 month after service termination
5 2 40
table 12: emergency response
item client’s charter no. of call received
complied to client’s charter
Percentage of compliance (%)
emergency response
To send an emergency response team within 90 minutes after a call is received
775 775 100
table 13: third Party supervision
item client’s charter no. of Permits issued
complied to client’s charter
Percentage of compliance (%)
third Party supervision
Written notice at least 3 days before commencement of work
9,450 9,450 100
table 14: identification of gas Pipeline location
item client’s charter no. of requests for Pipeline
location information
complied to client’s charter
Percentage of compliance (%)
identification of gas Pipeline location
4 days after application is received
601 601 100
2014 PIPED GAS DISTRIBUTION INDUSTRY STATISTICS
31
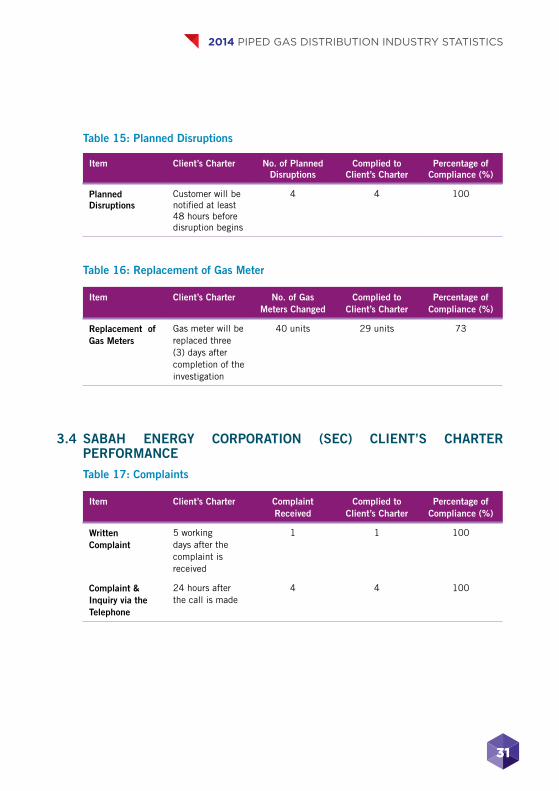
table 15: Planned Disruptions
item client’s charter no. of Planned Disruptions
complied to client’s charter
Percentage of compliance (%)
Planned Disruptions
Customer will be notified at least 48 hours before disruption begins
4 4 100
table 16: replacement of gas meter
item client’s charter no. of gas meters changed
complied to client’s charter
Percentage of compliance (%)
replacement of gas meters
Gas meter will be replaced three (3) days after completion of the investigation
40 units 29 units 73
3.4 saBaH energy corPoration (sec) client’s cHarter Performance
table 17: complaints
item client’s charter complaint received
complied to client’s charter
Percentage of compliance (%)
Written complaint
5 working days after the complaint is received
1 1 100
complaint & inquiry via the telephone
24 hours after the call is made
4 4 100

Energy Commission
32
table 18: Bill Payment
item client’s charter complaint received
complied to client’s charter
Percentage of compliance (%)
Bill accuracy 5 working days 0 NA NA
table 19: refund
Deposit
refund type customer client’s charter
no. of service
termination
complied to client’s charter
Percentage of compliance (%)
Deposit Industry Returned within 1 month after service termination
0 NA NA
table 20: emergency response
item client’s charter no. of call received
complied to client’s charter
Percentage of compliance (%)
emergency response
To send an emergency response team within 45 minutes after a call is received
0 NA NA
table 21: third Party supervision
item client’s charter no. of Permits issued
complied to client’s charter
Percentage of compliance (%)
third Party supervision
Written notice at least 4 days before commencement of work
0 NA NA

2014 PIPED GAS DISTRIBUTION INDUSTRY STATISTICS
33
table 22: identification of gas Pipeline location
item client’s charter no. of requests for Pipeline
location information
complied to client’s charter
Percentage of compliance (%)
identification of gas Pipeline location
4 days after application is received
0 NA NA
table 23: Planned Disruptions
item client’s charter no. of Planned Disruptions
complied to client’s charter
Percentage of compliance (%)
Planned Disruptions
Customer will be notified at least 48 hours before disruption begins
5 5 100
table 24: replacement of gas meter
item client’s charter no. of gas meters changed
complied to client’s charter
Percentage of compliance (%)
replacement of gas meters
Gas meter will be replaced three (3) days after completion of the investigation
1 unit 1 unit 73

4.0 NATURAL GAS TARIFF AND LPGPRICES
Energy Commission
36
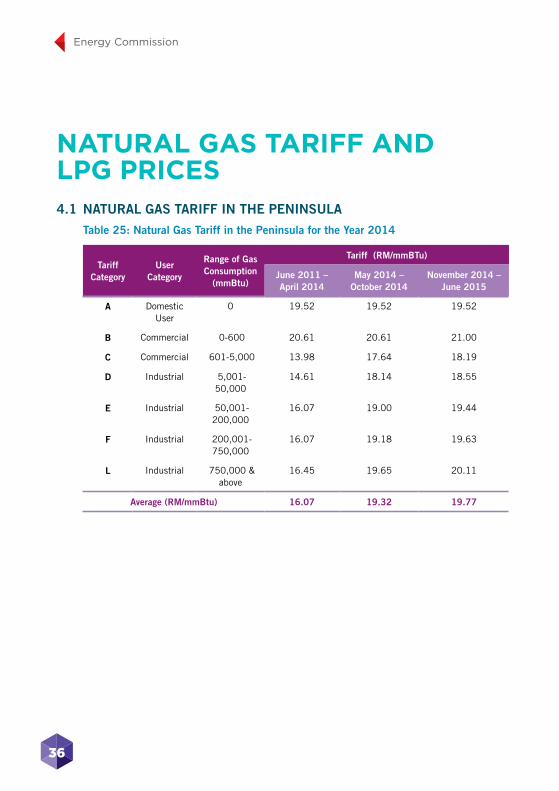
NATURAL GAS TARIFF AND LPG PRICES4.1 natural gas tariff in tHe Peninsula
table 25: natural gas tariff in the Peninsula for the year 2014
tariff category
usercategory
range of gas consumption
(mmBtu)
tariff (rm/mmBtu)
June 2011 – april 2014
may 2014 – october 2014
november 2014 – June 2015
a Domestic User
0 19.52 19.52 19.52
B Commercial 0-600 20.61 20.61 21.00
c Commercial 601-5,000 13.98 17.64 18.19
D Industrial 5,001-50,000
14.61 18.14 18.55
e Industrial 50,001-200,000
16.07 19.00 19.44
f Industrial 200,001-750,000
16.07 19.18 19.63
l Industrial 750,000 & above
16.45 19.65 20.11
average (rm/mmBtu) 16.07 19.32 19.77
2014 PIPED GAS DISTRIBUTION INDUSTRY STATISTICS
37
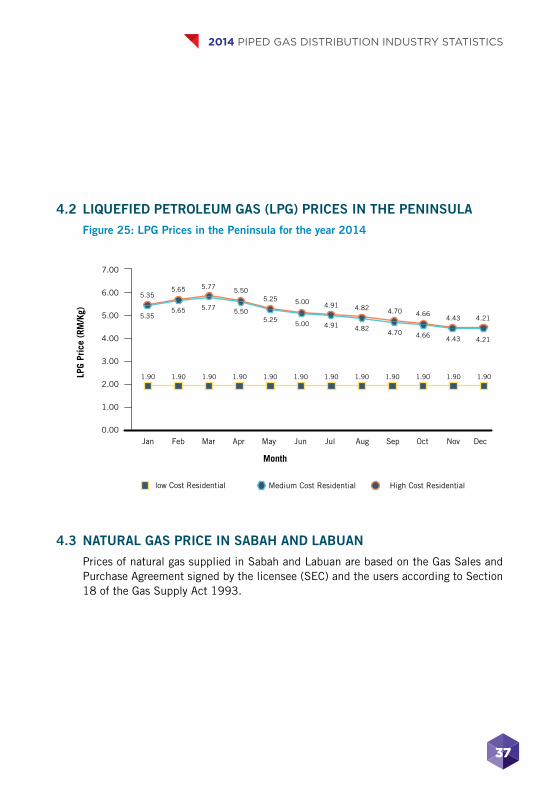
4.2 liQuefieD Petroleum gas (lPg) Prices in tHe Peninsula
figure 25: lPg Prices in the Peninsula for the year 2014
4.3 natural gas Price in saBaH anD laBuan
Prices of natural gas supplied in Sabah and Labuan are based on the Gas Sales and Purchase Agreement signed by the licensee (SEC) and the users according to Section 18 of the Gas Supply Act 1993.
LPG
Pric
e (R
M/K
g)
0.00
1.00
2.00
3.00
4.00
5.00
6.00
7.00
1.90 1.90 1.90 1.90 1.90 1.90 1.90 1.90 1.90 1.90 1.90 1.90
5.355.65 5.77 5.50
5.25 5.00 4.91 4.82 4.70 4.664.43 4.21
Jan
Medium Cost Residential High Cost Residential
Feb Mar Apr May Jun Jul Aug Sep Oct Nov Dec
low Cost Residential
Month
5.355.65 5.77 5.50
5.255.00 4.91 4.82
4.70 4.66 4.43 4.21


5.0 GAS LICENSEES

Energy Commission
40
GAS LICENSEES
5.1 gas utility licence (gul)
table 26: list of licensees
type of gas licensee effective Date validity
natural gas GMB 1 September 1998 30 Years
lPg GMB 15 December 2000 20 Years
natural gas SEC 1 September 1998 30 Years
5.2 Private gas licence (Pgl)
figure 26: number of Private gas licensees from 2008-2014
No.
of P
GL Is
sued
200
0
400
800
1,200
1,000
715
477
238
637
391
246340
386
877
537 590626
362
976
672
416
988
1,088 1,015
640
375
2008
New
2009 2010 2011 2012 2013 2014
600
Renewal TotalYear

2014 PIPED GAS DISTRIBUTION INDUSTRY STATISTICS
41
figure 27: number of Private gas licensees by user category in 2014
Number of Private Gas Licensees by User Category in 2014
163 Educational Institution
189 Others
196 Restaurant
68 Resort/Club
137 Hotel
128 Hospital
134 Shopping Complex


6.0 GAS RETICULATION SYSTEM

Energy Commission
44
GAS RETICULATION SYSTEM
6.1 aPProval to install (ati) anD aPProval to oPerate (ato)
figure 28: approval to install (ati) issued from 2008 - 2014
No.
of A
TI Is
sued
200
0
400
800
1,400
1,200
1,000840
658
182
732
629
103150
108
1,031
881 869906
146
977
941
147
1,052 1,088
1,255
1,046
209
2008
NG
2009 2010 2011 2012 2013 2014
600
LPG TotalYear
figure 29: approval to install (ati) issued based on locations of installation in 2014
ATI Issued Based on Location of Installation
53 Residential
86 Industry1,116 Commercial

2014 PIPED GAS DISTRIBUTION INDUSTRY STATISTICS
45
figure 30: approval to install (ati) issued based on installation classes in 2014
No.
of A
TI Is
sued
Class
200
400
Class I Class II Class III
0
600
1,200
1,000
800
532 24 38
132
1,006
NG LPG
figure 31: approval to operate (ato) issued from 2008 - 2014
No.
of A
TO Is
sued
200
0
400
800
1,200
1,000
767
580
187
580
425
155133 131
812
679709 711
102
840
837
158
813
955
1,033
847
186
2008
NG
2009 2010 2011 2012 2013 2014
600
LPG Total
Year
Energy Commission
46
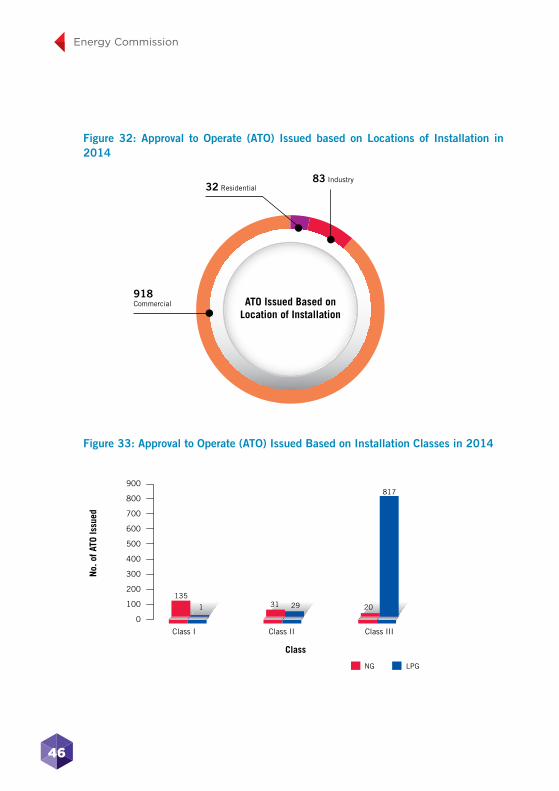
figure 32: approval to operate (ato) issued based on locations of installation in 2014
ATO Issued Based on Location of Installation
83 Industry32 Residential
918 Commercial
figure 33: approval to operate (ato) issued Based on installation classes in 2014
No.
of A
TO Is
sued
Class
100
200
400
600
300
Class I Class II Class III
0
500
900
800
700
135
1 31 29 20
817
NG LPG

2014 PIPED GAS DISTRIBUTION INDUSTRY STATISTICS
47
6.2
in
sP
ec
tio
n a
nD
te
sti
ng
of
ga
s i
ns
tall
atio
ns
ta
ble
27
: in
spec
tion
, te
stin
g an
d e
nfor
cem
ent
act
ivit
ies
type
of
act
ivit
y2
00
72
00
82
00
92
01
02
01
12
01
22
01
32
01
4
insp
ecti
on &
tes
t1
13
04
24
02
39
26
82
06
44
5
gas
tas
kfor
ce a
t s
hopp
ing
mal
l-
--
--
15
(M
alls
)3
61
(O
utle
ts)
16
1
(Out
lets
)
not
ice
to r
epai
r or
D
isco
ntin
ue o
pera
tion
of
gas
Pip
ing
sys
tem
10
29
33
02
26
62
70
30
01
,93
8
S
how
n ab
ove
are
stat
isti
cs o
n th
e im
plem
enta
tion
of
gas
safe
ty m
easu
res
by t
he f
ood
and
beve
rage
s (F
&B
) ou
tlet
s op
erat
ing
in r
etai
l com
plex
es in
spec
ted
by t
he C
omm
issi
on’s
gas
tas
k fo
rce.

Energy Commission
48
figure 34: statistics on the implementation of gas safety measures in 2014
Perc
enta
ge o
f Im
plem
enta
tions
(%
)
10
20
ON/OFFlabel on gasappliances
Installationof gas
detector
Installationof solenoid
valve
0
30
40
70
60
50
33
.33
Pilot flameoperating
pressure reducedto 0.5 psi
65
.31
Installation offlame failuredevice at gas
appliance
29
.93
49
.32
63
.89
Gas Safety Measures

7.0 GAS COMPETENCY

Energy Commission
50
7.1 gas comPetency eXaminations
figure 35: number of gas competency examination and interview sessions from 2011-2014
figure 36: number of gas competency examination and interview candidates from 2011-2014
GAS COMPETENCY
No.
of E
xam
inat
ion
Sess
ions
Year
5
15
2011 2012 2013
0
10
20
35
30
25
2014
Written Eximination Interview
14
24
19
32
22
1 0
No.
of E
xam
inat
ion
Cand
idat
es
Year
10
30
2011 2012 2013
0
20
40
90
80
70
60
50
2014
Written Eximination Interview
3
68
54
81
60
5 04

2014 PIPED GAS DISTRIBUTION INDUSTRY STATISTICS
51
7.2
ac
cr
eD
itat
ion
of
ga
s c
om
Pe
ten
cy
co
ur
se
s
ta
ble
28
: a
ccre
dite
d g
as c
ompe
tenc
y in
stit
utio
ns a
nd c
ours
es in
20
14
nam
e &
add
ress
of
inst
itut
ion
con
tact
inf
orm
atio
nc
ours
e o
ffer
eds
tudy
mod
e
ins
titu
t k
em
aH
ira
n m
ar
a (
ikm
)Ja
lan
Tero
ka O
ff J
alan
Dat
in H
alim
ah,
Kar
ung
Ber
kunc
i 84
8,
80
99
0 J
ohor
Bha
ru, Jo
hor
Tel
: +
60
7 2
37
00
01
/ +
60
7 2
36
11
29
Fax
: +
60
7 2
36
42
89
Web
: w
ww
2.ik
m.e
du.m
y/jb
i.
Gas
Fit
ter
Cla
ss I
Full
Tim
e
Pu
sat
te
kn
olo
gi
ga
s (
ga
ste
g)
Faku
lti K
ejur
uter
aan
Pet
role
um d
an
Tena
ga d
iPer
baha
rui,
Uni
vers
iti T
ekno
logi
Mal
aysi
a (U
TM),
81
31
9 S
kuda
i, Jo
hor
Tel
: +
60
7 5
53
56
53
Fax
: +
60
7 5
54
56
67
Web
: w
ww
.utm
.my/
petr
oleu
m/g
aste
g
i.
Gas
Eng
inee
r/
Sup
ervi
sor
ii.
Gas
Fit
ter
Cla
ss I
iii.
Gas
Fit
ter
Cla
ss I
Iiv
. G
as F
itte
r C
lass
III
Par
t Ti
me
ko
leJ
an
tar
aB
an
gs
a t
ek
no
log
i &
P
ro
fes
ion
al
(kat
Pm
) P
er
lis
Pet
i Sur
at 4
0,K
m 5
, Ja
lan
Pad
ang
Bes
ar,
01
00
0 K
anga
r, P
erlis
Tel
: +
60
4 9
77
91
77
Fax
: +
60
4 9
77
12
00
Web
: w
ww
.kat
p.ed
u.m
y
i.
Gas
Fit
ter
Cla
ss I
IIFu
ll Ti
me

Energy Commission
52
7.3 gas comPetent Person certifications
figure 37: gas competent Persons certifications from 1998 - 2014
figure 38: gas competent Person registrations in 2014
No.
of C
ompe
tenc
y Is
sued
(19
98 -
201
4)
Type of Competency
100
GasEngineer
GasSupervisor
Gas FitterClass I
Gas FitterClass II
Gas FitterClass III
Total
0
200
300
400
500
900
800
700
600
81
278 228
92153
832
No.
of R
egis
trat
ions
Type of Competency
10
20
40
GasEngineer
GasSupervisor
Gas FitterClass I
Gas FitterClass II
Gas FitterClass III
0
30
50
100
90
70
80
60
0
26
0
94
1
96
0
21
7
33
New Registration Renewal

2014 PIPED GAS DISTRIBUTION INDUSTRY STATISTICS
53
7.4 gas contractor registrations
figure 39: gas contractor registrations in 2014
7.5 resPonsiBle Person for commercial Premises
figure 40: registered responsible Persons for commercial Premises in 2014
No.
of R
egis
trat
ion
Class
5
15
Class A Class B Class C
0
10
20
40
35
30
25
Class D
RenewalNew
1 1 3
13
6
3
40
37
No.
of P
rem
ises
vs
Resp
onsi
ble
Pero
sn
Type of Licence
50
Gas Utility Licence Private Gas Licence
0
250
200
150
100
No. of Premises No. of Responsible Person
220200
116 105


8.0 GAS FITTINGS, GAS APPLIANCES AND GAS EQUIPMENT APPROVALS

Energy Commission
56
GAS FITTINGS, GAS APPLIANCES AND GAS EQUIPMENT APPROVALS
figure 41: approvals to manufacture or import gas fittings, gas appliances and gas equipment from 1998-2014
No.
of A
ppro
val I
ssue
d
Year
10
20
0
30
40
50
60
70
80
90
1998-2006 2007 2008 2009 2010 2011 2012 2013 2014
Approval to ManufactureGas Fittings, Gas Appliances or Gas Equipment
Approval to Import Gas Fittings, Gas Appliances or Gas Equipment
32
82
5 3 0 1
14
0 1 5 1 5 2 2 6
27
04

2014 PIPED GAS DISTRIBUTION INDUSTRY STATISTICS
57
figure 42: approvals issued for gas fittings, gas appliances and gas equipment from 1998-2014
No.
of A
ppro
vals
Issu
ed
Year
50
100
150
250
300
0
200
350
400
450
1998-
2006
2007 2008 2009 2010 2011 2012 2013 2014
428
32 11
83
29
110
43 27 37


9.0 ENERGY COMMISSION CONTACT INFORMATION

Energy Commission
60
ENERGY COMMISSION CONTACT INFORMATION
9.1 HeaDQuarters
suruHanJaya tenaga No. 12, Jalan Tun Hussein, Presint 2 62100, Putrajaya.
GPS Coordinate: 2.919175, 101.688459
1-800-2222-78 (ST)
(603) 8870 8500
(603) 8888 8637
www.st.gov.my

2014 PIPED GAS DISTRIBUTION INDUSTRY STATISTICS
61
9.2 regional offices
address Phone no. and fax
Pulau Pinang, keDaH & PerlisTingkat 10, Bangunan KWSP13700 Seberang Jaya, Butterworth, Pulau Pinang
tel : 04 - 398 8255fax : 04 - 390 0255
PerakTingkat 1, Bangunan KWSPJalan Greentown30450 Ipoh, Perak
tel : 05 - 253 5413fax : 05 - 255 3525
kelantan & terengganuTingkat 6, Bangunan KWSPJalan Padang Garong15000 Kota Bharu, Kelantan
tel : 09 - 748 7390fax : 09 - 744 5498
PaHangTingkat 7, Kompleks TeruntumJalan Mahkota25000 Kuantan, Pahang
tel : 09 - 514 2803fax : 09 - 514 2804
selangor, kuala lumPur & PutraJayaTingkat 10, Menara PKNSNo. 17, Jalan Yong Shook Lin46050 Petaling Jaya, SELANGOR
tel : 03 - 7955 8930fax : 03 - 7955 8939
JoHorSuite 18A, Aras 18Menara ANSAR 65Jalan Trus80000 Johor Bahru, Johor
tel : 07 - 224 8861fax : 07 - 224 9410
Pantai Barat negeri saBaHTingkat 7, Bangunan BSNJalan Kemajuan88000 Kota Kinabalu, Sabah
tel : 088 - 232 447fax : 088 - 232 444
Pantai timur negeri saBaHTingkat 3, Wisma Sabah KM12W.D.T. No. 2590500 Sandakan, Sabah
tel : 089 - 666 695fax : 089 - 660 279
negeri semBilan & melakaTingkat 4, Wisma PerkesoJalan Persekutuan, MITC75450 Ayer Keroh, Melaka
tel : 06 - 231 9594fax : 06 - 231 9620


10.0 GAS UTILITY LICENSEES CONTACT INFORMATION

Energy Commission
64
GAS UTILITY LICENSEES CONTACT INFORMATION10.1 gas malaysia BerHaD
HeaDQuarters
No. 5, JalanSerendah 26/17 Seksyen 26, Peti Surat 7901 40732 Shah Alam, Selangor
tel : 03 5192 3000fax : 03 5192 6766Website : www.gasmalaysia.com
occ Hotline: 1-800-88-9119 or 1-800-5656occ e-mail: [email protected]
occ = Operations Control Centre
regional office
soutHPLO 343, Jalan Emas TigaKawasan Perindustrian Pasir Gudang81700 Pasir Gudang, Johor
tel : 07 252 2314fax : 07 252 2561
eastLot 104, Gebeng Industrial Area26080 Kuantan, Pahang
tel : 09 583 6340fax : 09 583 6339
nortHNo. 27, Jalan Todak 4Pusat Bandar Seberang Jaya13700 Seberang JayaPulau Pinang
tel : 04 398 1727 / 1757fax : 04 398 2636

2014 PIPED GAS DISTRIBUTION INDUSTRY STATISTICS
65
District office
selangorBangiNo. 30, Jalan 4/12B 43650 Bandar Baru Bangi Selangor
tel : 07 252 2314fax : 07 252 2561
selangorshah alamNo. 1, Jalan 13/15 Sekyen 1340000 Shah Alam, Selangor
tel : 03 5511 9914fax : 03 5511 9912
Perakseri manjung9 PSN PM7, Pusat Bandar Seri Manjung32040 Seri Manjung, Perak
tel : 04 976 8400fax : 04 976 0625
kuala lumPurJalan gurneyNo. 20, Jalan Gurney54100 Kuala Lumpur
tel : 03 9206 7800fax : 03 9287 4282
WP PutraJayaPutrajayaNo. 1, Jalan P9 B/1, Precinct 9, 62250 Putrajaya
tel : 03 8888 5264 /5224fax : 03 8888 3990
JoHorkluangNo. 9, Jalan 53BTaman Kluang Barat86000 Kluang, Johor
tel : 07 771 2105fax : 07 777 2108
negeri semBilansenawangNo. 34, Jalan Bunga Raya 9Pusat Perniagaan SenawangTaman Tasik Jaya70400 Seremban Negeri Sembilan
tel : 06 678 1995 / 5348fax : 06 678 6937

Energy Commission
66
10.2 saBaH energy corPoration sDn. BHD.
HeaDQuarters
1st, 2nd & 3rd Floors,Wisma Bandaraya, Jalan Mesjid LamaLocked Bag No. 288990 Kota Kinabalu, Sabah
tel : 088 311290 / 299fax : 088 311361Website : www.sabahenergycorp.com
regional office
laBuan unitSaguking Warehouse D8P. O. Box 8024487012 Labuan, Wilayah Persekutuan
tel : 087 418 060 / 417 162fax : 087 413 877


