disclaimer: this document is a translation of the japanese
TRANSCRIPT
Disclaimer: This document is a translation of the Japanese original. The Japanese original has been disclosed in Japan in accordance with Japanese accounting standards and the Financial Instruments and Exchange Act. This document does not contain or constitute any guarantee and the Company will not compensate any losses and/or damage stemming from actions taken based on this document. In the case that there is any discrepancy between the Japanese original and this document, the Japanese original is assumed to be correct.
Summary of Financial Statements for the Year Ended March 31, 2021 [Japanese Standards]
May 17, 2021 Listed Company Name: Nisshin Seifun Group Inc. Registered on Tokyo Stock Exchange Code: 2002 URL: https://www.nisshin.com Representative: Nobuki Kemmoku, Representative Director and President Contact: Reiko Adachi, General Manager, Public Communications Department (General Administration Division) Tel.: +81-3-5282-6650 Date to hold the Ordinary General Meeting of Shareholders to approve results: June 25, 2021 Date to start distributing dividends: June 28, 2021 Date to submit the Securities Report: June 25, 2021 Supplementary materials for this summary of financial statements: Yes Results briefing for financial results: Yes (for analysts and institutional investors)
(Figures shown are rounded down to the nearest million yen.)
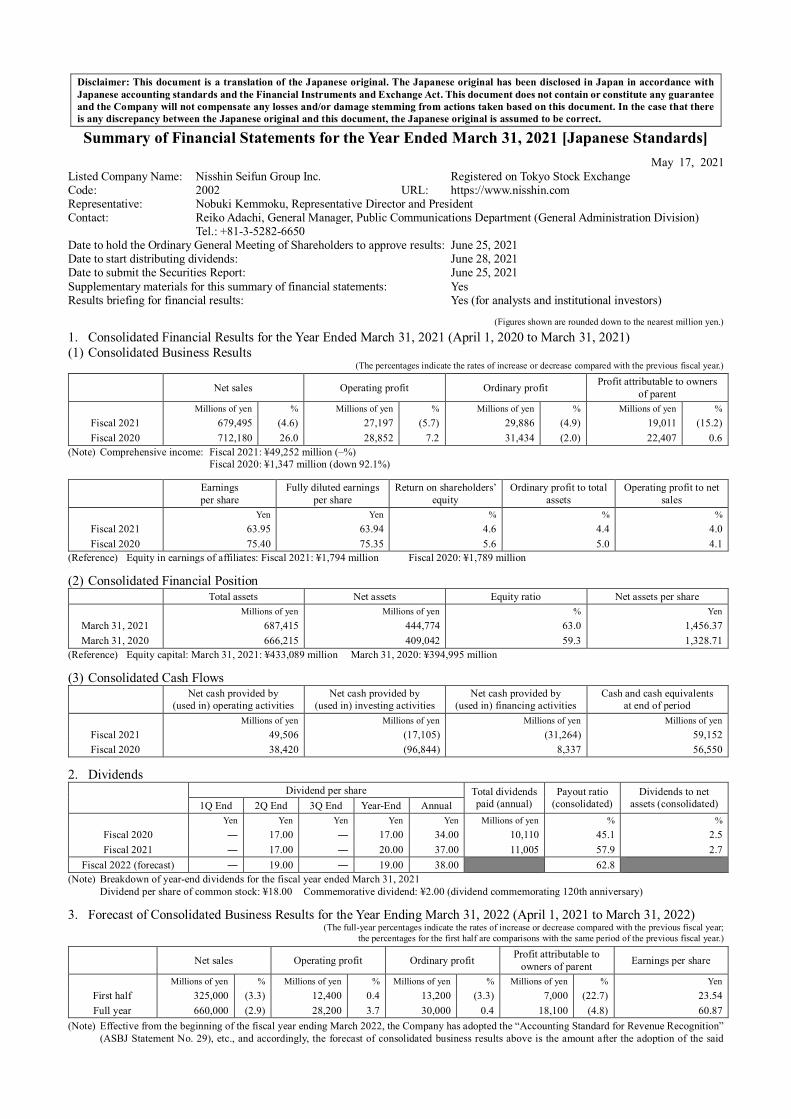
1. Consolidated Financial Results for the Year Ended March 31, 2021 (April 1, 2020 to March 31, 2021) (1) Consolidated Business Results
(The percentages indicate the rates of increase or decrease compared with the previous fiscal year.)
Net sales Operating profit Ordinary profit Profit attributable to owners of parent
Millions of yen % Millions of yen % Millions of yen % Millions of yen % Fiscal 2021 679,495 (4.6) 27,197 (5.7) 29,886 (4.9) 19,011 (15.2) Fiscal 2020 712,180 26.0 28,852 7.2 31,434 (2.0) 22,407 0.6
(Note) Comprehensive income: Fiscal 2021: ¥49,252 million (–%) Fiscal 2020: ¥1,347 million (down 92.1%)
Earnings per share
Fully diluted earnings per share
Return on shareholders’ equity
Ordinary profit to total assets
Operating profit to net sales
Yen Yen % % % Fiscal 2021 63.95 63.94 4.6 4.4 4.0 Fiscal 2020 75.40 75.35 5.6 5.0 4.1
(Reference) Equity in earnings of affiliates: Fiscal 2021: ¥1,794 million Fiscal 2020: ¥1,789 million
(2) Consolidated Financial Position Total assets Net assets Equity ratio Net assets per share Millions of yen Millions of yen % Yen
March 31, 2021 687,415 444,774 63.0 1,456.37 March 31, 2020 666,215 409,042 59.3 1,328.71
(Reference) Equity capital: March 31, 2021: ¥433,089 million March 31, 2020: ¥394,995 million
(3) Consolidated Cash Flows Net cash provided by
(used in) operating activities Net cash provided by
(used in) investing activities Net cash provided by
(used in) financing activities Cash and cash equivalents
at end of period Millions of yen Millions of yen Millions of yen Millions of yen
Fiscal 2021 49,506 (17,105) (31,264) 59,152 Fiscal 2020 38,420 (96,844) 8,337 56,550
2. Dividends
Dividend per share Total dividends
paid (annual) Payout ratio
(consolidated) Dividends to net
assets (consolidated) 1Q End 2Q End 3Q End Year-End Annual Yen Yen Yen Yen Yen Millions of yen % %
Fiscal 2020 ― 17.00 ― 17.00 34.00 10,110 45.1 2.5 Fiscal 2021 ― 17.00 ― 20.00 37.00 11,005 57.9 2.7
Fiscal 2022 (forecast) ― 19.00 ― 19.00 38.00 62.8 (Note) Breakdown of year-end dividends for the fiscal year ended March 31, 2021
Dividend per share of common stock: ¥18.00 Commemorative dividend: ¥2.00 (dividend commemorating 120th anniversary)
3. Forecast of Consolidated Business Results for the Year Ending March 31, 2022 (April 1, 2021 to March 31, 2022) (The full-year percentages indicate the rates of increase or decrease compared with the previous fiscal year;
the percentages for the first half are comparisons with the same period of the previous fiscal year.)
Net sales Operating profit Ordinary profit Profit attributable to owners of parent Earnings per share
Millions of yen % Millions of yen % Millions of yen % Millions of yen % Yen First half 325,000 (3.3) 12,400 0.4 13,200 (3.3) 7,000 (22.7) 23.54 Full year 660,000 (2.9) 28,200 3.7 30,000 0.4 18,100 (4.8) 60.87
(Note) Effective from the beginning of the fiscal year ending March 2022, the Company has adopted the “Accounting Standard for Revenue Recognition” (ASBJ Statement No. 29), etc., and accordingly, the forecast of consolidated business results above is the amount after the adoption of the said
accounting standard, etc. The accounting standard, etc., have not been applied to prior-year and same-period figures used to calculate the percent changes.
* Notes (1) Changes in important subsidiaries during the fiscal year ended March 31, 2021 (changes in specified subsidiaries
involving a change in the scope of consolidation): None
(2) Changes in accounting policies, changes in accounting estimates and revisions restated 1) Changes in accounting policies associated with the revisions of accounting standards, etc.: None 2) Changes in accounting policies other than the above: None 3) Changes in accounting estimates: None 4) Revisions restated: None
(3) Number of shares issued and outstanding (common stock) 1) Number of shares issued and outstanding
(including treasury shares) As of March 31, 2021 304,357,891 As of March 31, 2020 304,357,891
2) Number of treasury shares As of March 31, 2021 6,983,147 As of March 31, 2020 7,079,592 3) Average number of shares outstanding Fiscal 2021 297,292,370 Fiscal 2020 297,187,439
* This Summary of Financial Statements is not subject to review by certified public accountants or independent
account auditors.
* Statement regarding the proper use of financial forecasts and other special remarks (1) The statements contained in this document are based on various assumptions and do not constitute any guarantee
or definite promise that projections of future performance or related business policies will actually be realized. For details of assumptions for financial forecasts and other related matters, please refer to “I. Review of Business Performance (4) Outlook” on page 6 of the Attachment.
(2) Supplementary materials for this report and results briefing materials can be found on the Company’s website.
1
ATTACHMENT Contents
I. Review of Business Performance ..................................................................................................................... 2 (1) Business Performance ............................................................................................................................... 2 (2) Financial Position ...................................................................................................................................... 5 (3) Cash Flows ............................................................................................................................................... 5 (4) Outlook ..................................................................................................................................................... 6 (5) Basic Policy on Profit Distribution and Dividends for Fiscal 2021 and Fiscal 2022 .................................... 7
II. Basic Policy Regarding Selection of Accounting Standards .............................................................................. 8 III. Consolidated Financial Statements and Related Notes ...................................................................................... 9
(1) Consolidated Balance Sheets ..................................................................................................................... 9 (2) Consolidated Statements of Income and Comprehensive Income ..............................................................11
[Consolidated Statements of Income] ...................................................................................................... 11 [Consolidated Statements of Comprehensive Income] ............................................................................. 12
(3) Consolidated Statements of Changes in Net Assets .................................................................................. 13 (4) Consolidated Statements of Cash Flows .................................................................................................. 15 (5) Notes on Consolidated Financial Statements ............................................................................................ 16
[Going Concern Considerations] ............................................................................................................. 16 [Changes in Disclosure] .......................................................................................................................... 16 [Consolidated Statements of Income] ...................................................................................................... 16 [Segment Information, etc.] ..................................................................................................................... 18 [Per Share Information] ........................................................................................................................... 20 [Material Subsequent Events] .................................................................................................................. 21
2
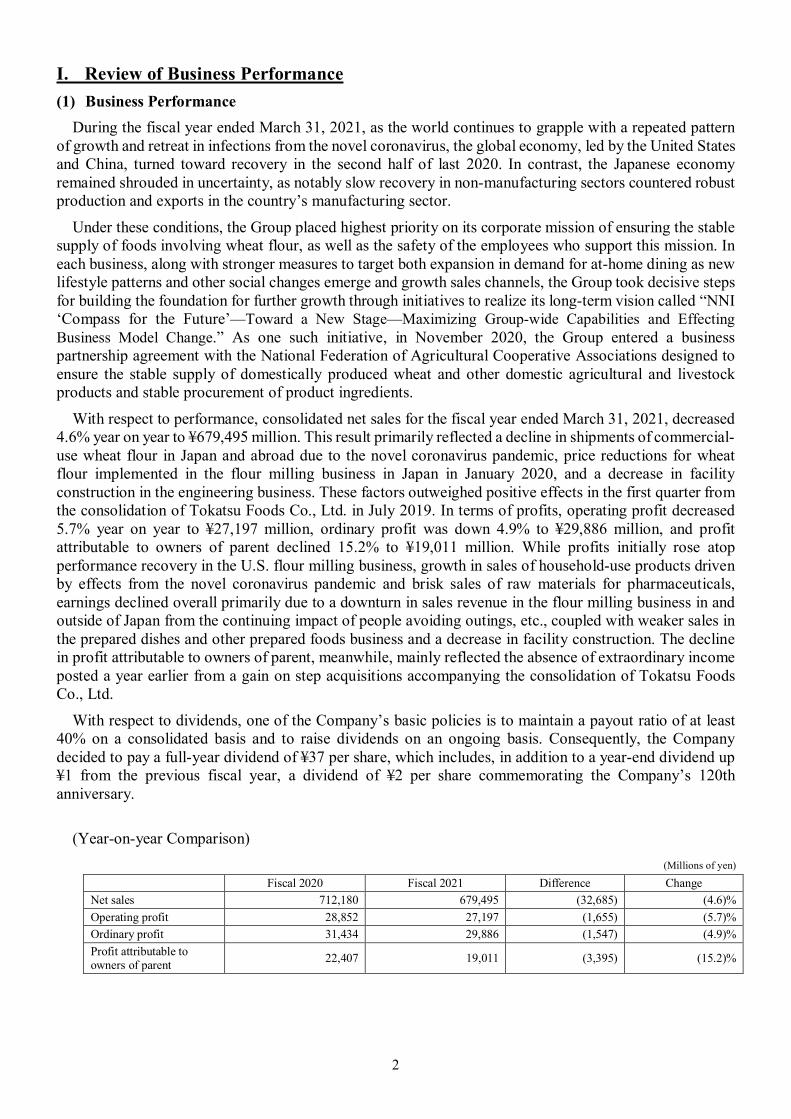
I. Review of Business Performance (1) Business Performance
During the fiscal year ended March 31, 2021, as the world continues to grapple with a repeated pattern of growth and retreat in infections from the novel coronavirus, the global economy, led by the United States and China, turned toward recovery in the second half of last 2020. In contrast, the Japanese economy remained shrouded in uncertainty, as notably slow recovery in non-manufacturing sectors countered robust production and exports in the country’s manufacturing sector.
Under these conditions, the Group placed highest priority on its corporate mission of ensuring the stable supply of foods involving wheat flour, as well as the safety of the employees who support this mission. In each business, along with stronger measures to target both expansion in demand for at-home dining as new lifestyle patterns and other social changes emerge and growth sales channels, the Group took decisive steps for building the foundation for further growth through initiatives to realize its long-term vision called “NNI ‘Compass for the Future’—Toward a New Stage—Maximizing Group-wide Capabilities and Effecting Business Model Change.” As one such initiative, in November 2020, the Group entered a business partnership agreement with the National Federation of Agricultural Cooperative Associations designed to ensure the stable supply of domestically produced wheat and other domestic agricultural and livestock products and stable procurement of product ingredients.
With respect to performance, consolidated net sales for the fiscal year ended March 31, 2021, decreased 4.6% year on year to ¥679,495 million. This result primarily reflected a decline in shipments of commercial-use wheat flour in Japan and abroad due to the novel coronavirus pandemic, price reductions for wheat flour implemented in the flour milling business in Japan in January 2020, and a decrease in facility construction in the engineering business. These factors outweighed positive effects in the first quarter from the consolidation of Tokatsu Foods Co., Ltd. in July 2019. In terms of profits, operating profit decreased 5.7% year on year to ¥27,197 million, ordinary profit was down 4.9% to ¥29,886 million, and profit attributable to owners of parent declined 15.2% to ¥19,011 million. While profits initially rose atop performance recovery in the U.S. flour milling business, growth in sales of household-use products driven by effects from the novel coronavirus pandemic and brisk sales of raw materials for pharmaceuticals, earnings declined overall primarily due to a downturn in sales revenue in the flour milling business in and outside of Japan from the continuing impact of people avoiding outings, etc., coupled with weaker sales in the prepared dishes and other prepared foods business and a decrease in facility construction. The decline in profit attributable to owners of parent, meanwhile, mainly reflected the absence of extraordinary income posted a year earlier from a gain on step acquisitions accompanying the consolidation of Tokatsu Foods Co., Ltd.
With respect to dividends, one of the Company’s basic policies is to maintain a payout ratio of at least 40% on a consolidated basis and to raise dividends on an ongoing basis. Consequently, the Company decided to pay a full-year dividend of ¥37 per share, which includes, in addition to a year-end dividend up ¥1 from the previous fiscal year, a dividend of ¥2 per share commemorating the Company’s 120th anniversary.
(Year-on-year Comparison) (Millions of yen)
Fiscal 2020 Fiscal 2021 Difference Change Net sales 712,180 679,495 (32,685) (4.6)% Operating profit 28,852 27,197 (1,655) (5.7)% Ordinary profit 31,434 29,886 (1,547) (4.9)% Profit attributable to owners of parent 22,407 19,011 (3,395) (15.2)%
3
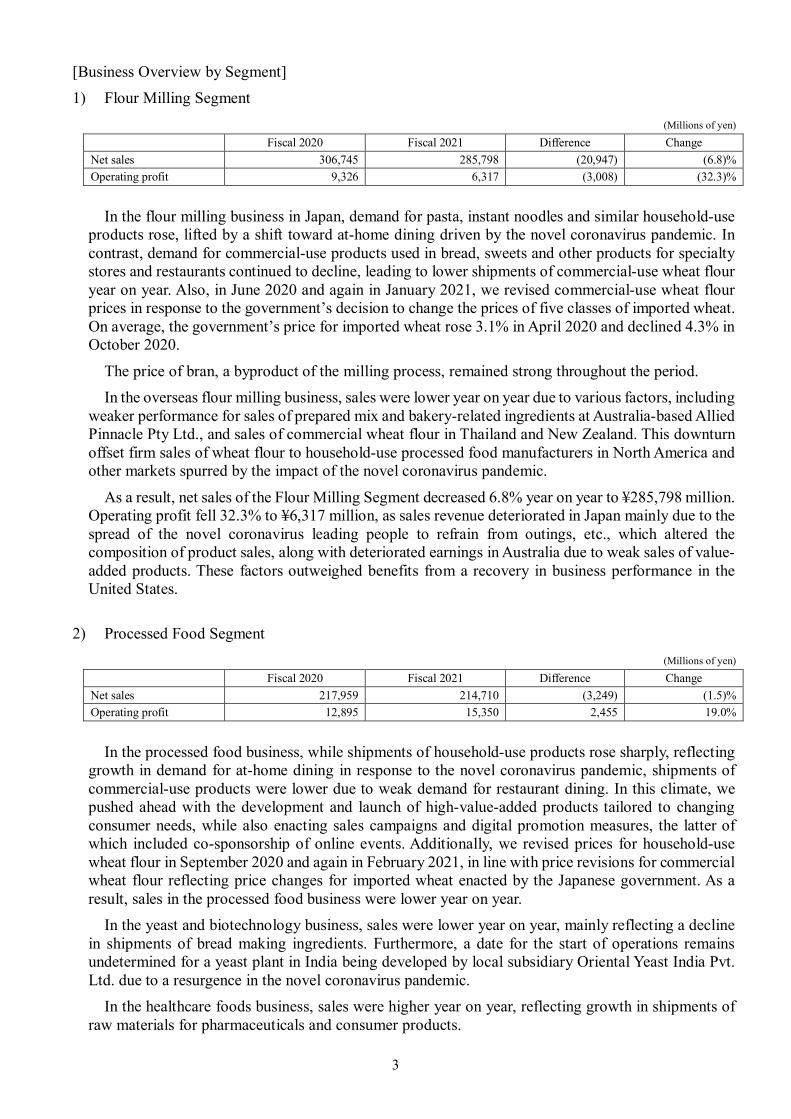
[Business Overview by Segment] 1) Flour Milling Segment
(Millions of yen)
Fiscal 2020 Fiscal 2021 Difference Change Net sales 306,745 285,798 (20,947) (6.8)% Operating profit 9,326 6,317 (3,008) (32.3)%
In the flour milling business in Japan, demand for pasta, instant noodles and similar household-use
products rose, lifted by a shift toward at-home dining driven by the novel coronavirus pandemic. In contrast, demand for commercial-use products used in bread, sweets and other products for specialty stores and restaurants continued to decline, leading to lower shipments of commercial-use wheat flour year on year. Also, in June 2020 and again in January 2021, we revised commercial-use wheat flour prices in response to the government’s decision to change the prices of five classes of imported wheat. On average, the government’s price for imported wheat rose 3.1% in April 2020 and declined 4.3% in October 2020.
The price of bran, a byproduct of the milling process, remained strong throughout the period. In the overseas flour milling business, sales were lower year on year due to various factors, including
weaker performance for sales of prepared mix and bakery-related ingredients at Australia-based Allied Pinnacle Pty Ltd., and sales of commercial wheat flour in Thailand and New Zealand. This downturn offset firm sales of wheat flour to household-use processed food manufacturers in North America and other markets spurred by the impact of the novel coronavirus pandemic.
As a result, net sales of the Flour Milling Segment decreased 6.8% year on year to ¥285,798 million. Operating profit fell 32.3% to ¥6,317 million, as sales revenue deteriorated in Japan mainly due to the spread of the novel coronavirus leading people to refrain from outings, etc., which altered the composition of product sales, along with deteriorated earnings in Australia due to weak sales of value-added products. These factors outweighed benefits from a recovery in business performance in the United States.
2) Processed Food Segment
(Millions of yen)
Fiscal 2020 Fiscal 2021 Difference Change Net sales 217,959 214,710 (3,249) (1.5)% Operating profit 12,895 15,350 2,455 19.0%
In the processed food business, while shipments of household-use products rose sharply, reflecting
growth in demand for at-home dining in response to the novel coronavirus pandemic, shipments of commercial-use products were lower due to weak demand for restaurant dining. In this climate, we pushed ahead with the development and launch of high-value-added products tailored to changing consumer needs, while also enacting sales campaigns and digital promotion measures, the latter of which included co-sponsorship of online events. Additionally, we revised prices for household-use wheat flour in September 2020 and again in February 2021, in line with price revisions for commercial wheat flour reflecting price changes for imported wheat enacted by the Japanese government. As a result, sales in the processed food business were lower year on year.
In the yeast and biotechnology business, sales were lower year on year, mainly reflecting a decline in shipments of bread making ingredients. Furthermore, a date for the start of operations remains undetermined for a yeast plant in India being developed by local subsidiary Oriental Yeast India Pvt. Ltd. due to a resurgence in the novel coronavirus pandemic.
In the healthcare foods business, sales were higher year on year, reflecting growth in shipments of raw materials for pharmaceuticals and consumer products.

4
As a result, net sales of the Processed Food Segment decreased 1.5% year on year to ¥214,710 million. Operating profit rose 19.0% to ¥15,350 million, reflecting growth in shipments of household-use products and raw materials for pharmaceuticals, as well as a decline in advertising and promotion expenses.
3) Prepared Dishes and Other Prepared Foods Segment
(Millions of yen)
Fiscal 2020 Fiscal 2021 Difference Change Net sales 129,967 142,747 12,779 9.8% Operating profit 1,736 1,278 (457) (26.4)%
In the prepared dishes and other prepared foods business, sales were higher year on year, as positive
effects in the first quarter from the consolidation of Tokatsu Foods Co., Ltd. in July 2019 outweighed lower sales mainly in urban areas and tourist resorts owing to a rise in the percentage of people working from home and fewer opportunities for outings due to the spread of the novel coronavirus.
As a result, net sales of the Prepared Dishes and Other Prepared Foods Segment increased 9.8% year on year to ¥142,747 million. Operating profit, however, fell 26.4% to ¥1,278 million, reflecting the sizeable impact of lower sales due to the novel coronavirus pandemic. This came despite improved production efficiency and higher sales of seasonal New Year dishes.
4) Others Segment
(Millions of yen)
Fiscal 2020 Fiscal 2021 Difference Change Net sales 57,507 36,240 (21,267) (37.0)% Operating profit 4,698 4,240 (458) (9.8)%
In the engineering business, sales were lower year on year due to a decline in facility construction. In the mesh cloths business, sales declined year on year due to lower shipments of chemical products
mainly for automotive components, amid a global slump in automobile production volume from the effects of the novel coronavirus pandemic. This decline came despite brisk sales of antiviral and related products.
In the pet food business, while we remained involved in the outsourced production of pet food following transfer of the sales business at the end of March 2020, this outsourced production work concluded at the end of March 31, 2021.
As a result, net sales of the Others Segment decreased 37.0% year on year to ¥36,240 million, and operating profit decreased 9.8% to ¥4,240 million.
5
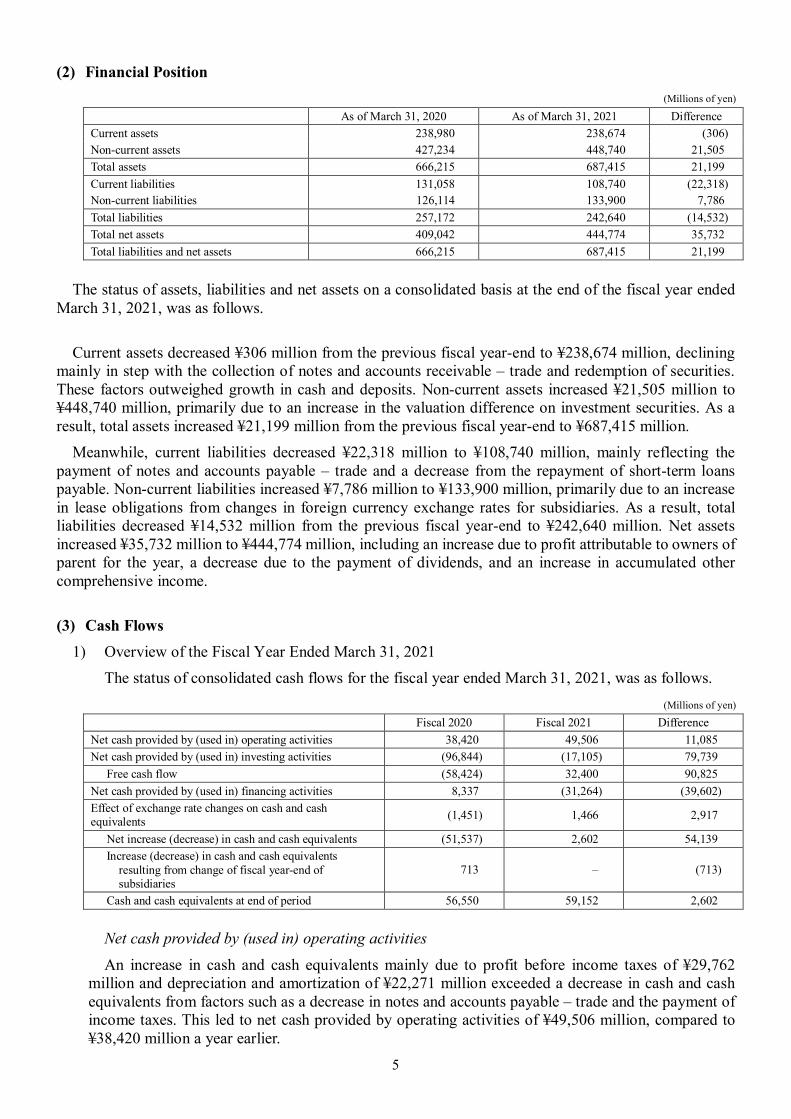
(2) Financial Position (Millions of yen)
As of March 31, 2020 As of March 31, 2021 Difference Current assets 238,980 238,674 (306) Non-current assets 427,234 448,740 21,505 Total assets 666,215 687,415 21,199 Current liabilities 131,058 108,740 (22,318) Non-current liabilities 126,114 133,900 7,786 Total liabilities 257,172 242,640 (14,532) Total net assets 409,042 444,774 35,732 Total liabilities and net assets 666,215 687,415 21,199
The status of assets, liabilities and net assets on a consolidated basis at the end of the fiscal year ended
March 31, 2021, was as follows.
Current assets decreased ¥306 million from the previous fiscal year-end to ¥238,674 million, declining mainly in step with the collection of notes and accounts receivable – trade and redemption of securities. These factors outweighed growth in cash and deposits. Non-current assets increased ¥21,505 million to ¥448,740 million, primarily due to an increase in the valuation difference on investment securities. As a result, total assets increased ¥21,199 million from the previous fiscal year-end to ¥687,415 million.
Meanwhile, current liabilities decreased ¥22,318 million to ¥108,740 million, mainly reflecting the payment of notes and accounts payable – trade and a decrease from the repayment of short-term loans payable. Non-current liabilities increased ¥7,786 million to ¥133,900 million, primarily due to an increase in lease obligations from changes in foreign currency exchange rates for subsidiaries. As a result, total liabilities decreased ¥14,532 million from the previous fiscal year-end to ¥242,640 million. Net assets increased ¥35,732 million to ¥444,774 million, including an increase due to profit attributable to owners of parent for the year, a decrease due to the payment of dividends, and an increase in accumulated other comprehensive income. (3) Cash Flows
1) Overview of the Fiscal Year Ended March 31, 2021 The status of consolidated cash flows for the fiscal year ended March 31, 2021, was as follows.
(Millions of yen)
Fiscal 2020 Fiscal 2021 Difference Net cash provided by (used in) operating activities 38,420 49,506 11,085 Net cash provided by (used in) investing activities (96,844) (17,105) 79,739
Free cash flow (58,424) 32,400 90,825 Net cash provided by (used in) financing activities 8,337 (31,264) (39,602) Effect of exchange rate changes on cash and cash equivalents (1,451) 1,466 2,917
Net increase (decrease) in cash and cash equivalents (51,537) 2,602 54,139 Increase (decrease) in cash and cash equivalents
resulting from change of fiscal year-end of subsidiaries
713 – (713)
Cash and cash equivalents at end of period 56,550 59,152 2,602
Net cash provided by (used in) operating activities
An increase in cash and cash equivalents mainly due to profit before income taxes of ¥29,762 million and depreciation and amortization of ¥22,271 million exceeded a decrease in cash and cash equivalents from factors such as a decrease in notes and accounts payable – trade and the payment of income taxes. This led to net cash provided by operating activities of ¥49,506 million, compared to ¥38,420 million a year earlier.

6
Net cash provided by (used in) investing activities
¥17,359 million was used for the purchase of property, plant, and equipment and intangible assets, mainly as investments related to rationalization and labor-saving efforts. Consequently, net cash used in investing activities was ¥17,105 million, compared to ¥96,844 million a year earlier.
Subtracting net cash used in investing activities from net cash provided by operating activities, free
cash flow came to an inflow of ¥32,400 million, compared to an outflow of ¥58,424 million a year ago.
Net cash provided by (used in) financing activities ¥14,422 million was used for the repayment of short-term loans payable, coupled with ¥10,111
million used for dividends to distribute profits to shareholders. This led to net cash used in financing activities of ¥31,264 million, compared to net cash provided of ¥8,337 million a year earlier.
As a result, consolidated cash and cash equivalents at the end of the fiscal year ended March 31,
2021 were ¥59,152 million.
2) Cash-flow Indicators The main cash flow indicators for the Nisshin Seifun Group are as follows:
Fiscal 2018 Fiscal 2019 Fiscal 2020 Fiscal 2021 Equity ratio (%) 67.5 67.9 59.3 63.0 Market value–based equity ratio (%) 105.9 126.9 80.4 80.0 Ratio of interest-bearing debt to operating cash flow (years) 0.4 0.4 1.4 0.8
Interest coverage ratio (times) 197.2 154.9 12.1 17.8
Notes: Equity ratio = Equity capital / Total assets Market value-based equity ratio = Market capitalization / Total assets Ratio of interest-bearing debt to operating cash flow = Interest-bearing debt / Operating cash flow Interest coverage ratio = Operating cash flow / Interest expense 1. All of the above cash-flow indicators are calculated on a consolidated basis. 2. Market capitalization is calculated by multiplying the closing share price on the final trading day of the fiscal year by
the total number of outstanding shares (excluding treasury shares) as of the corresponding fiscal year-end. 3. Operating cash flow equals net cash provided by operating activities as stated in the consolidated statements of cash
flows. Interest-bearing debt refers to bonds and debt as stated in the consolidated balance sheets. Interest expense is equal to interest payments as stated in the consolidated statements of cash flows.
(4) Outlook
1) Outlook for the Fiscal Year Ending March 31, 2022 The pandemic spread of the novel coronavirus has shrouded social and economic conditions, both
domestically and globally, in extreme uncertainty. Under these circumstances, the entire Group is working together to continue adapting to this changing business environment and to achieving the objectives outlined in the Group’s long-term vision, “NNI ‘Compass for the Future’,” in a staunch commitment to its social mission of ensuring the stable supply of food staples and social contribution through the creation of added value. In addition to rising health consciousness in line with today’s aging society and more diverse eating habits, demand surrounding food takeout and delivery, as well as e-commerce and mail-order sales, is growing in step with the emergence of new lifestyle patterns,
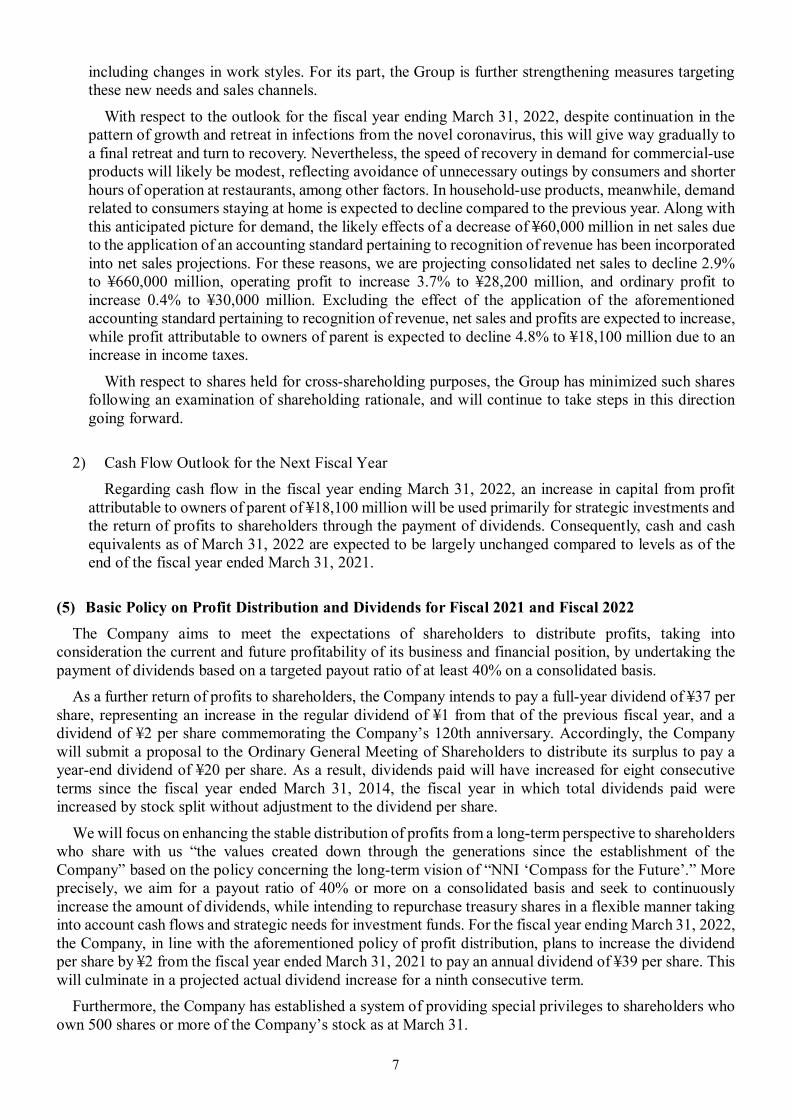
7
including changes in work styles. For its part, the Group is further strengthening measures targeting these new needs and sales channels.
With respect to the outlook for the fiscal year ending March 31, 2022, despite continuation in the pattern of growth and retreat in infections from the novel coronavirus, this will give way gradually to a final retreat and turn to recovery. Nevertheless, the speed of recovery in demand for commercial-use products will likely be modest, reflecting avoidance of unnecessary outings by consumers and shorter hours of operation at restaurants, among other factors. In household-use products, meanwhile, demand related to consumers staying at home is expected to decline compared to the previous year. Along with this anticipated picture for demand, the likely effects of a decrease of ¥60,000 million in net sales due to the application of an accounting standard pertaining to recognition of revenue has been incorporated into net sales projections. For these reasons, we are projecting consolidated net sales to decline 2.9% to ¥660,000 million, operating profit to increase 3.7% to ¥28,200 million, and ordinary profit to increase 0.4% to ¥30,000 million. Excluding the effect of the application of the aforementioned accounting standard pertaining to recognition of revenue, net sales and profits are expected to increase, while profit attributable to owners of parent is expected to decline 4.8% to ¥18,100 million due to an increase in income taxes.
With respect to shares held for cross-shareholding purposes, the Group has minimized such shares following an examination of shareholding rationale, and will continue to take steps in this direction going forward.
2) Cash Flow Outlook for the Next Fiscal Year
Regarding cash flow in the fiscal year ending March 31, 2022, an increase in capital from profit attributable to owners of parent of ¥18,100 million will be used primarily for strategic investments and the return of profits to shareholders through the payment of dividends. Consequently, cash and cash equivalents as of March 31, 2022 are expected to be largely unchanged compared to levels as of the end of the fiscal year ended March 31, 2021.
(5) Basic Policy on Profit Distribution and Dividends for Fiscal 2021 and Fiscal 2022
The Company aims to meet the expectations of shareholders to distribute profits, taking into consideration the current and future profitability of its business and financial position, by undertaking the payment of dividends based on a targeted payout ratio of at least 40% on a consolidated basis.
As a further return of profits to shareholders, the Company intends to pay a full-year dividend of ¥37 per share, representing an increase in the regular dividend of ¥1 from that of the previous fiscal year, and a dividend of ¥2 per share commemorating the Company’s 120th anniversary. Accordingly, the Company will submit a proposal to the Ordinary General Meeting of Shareholders to distribute its surplus to pay a year-end dividend of ¥20 per share. As a result, dividends paid will have increased for eight consecutive terms since the fiscal year ended March 31, 2014, the fiscal year in which total dividends paid were increased by stock split without adjustment to the dividend per share.
We will focus on enhancing the stable distribution of profits from a long-term perspective to shareholders who share with us “the values created down through the generations since the establishment of the Company” based on the policy concerning the long-term vision of “NNI ‘Compass for the Future’.” More precisely, we aim for a payout ratio of 40% or more on a consolidated basis and seek to continuously increase the amount of dividends, while intending to repurchase treasury shares in a flexible manner taking into account cash flows and strategic needs for investment funds. For the fiscal year ending March 31, 2022, the Company, in line with the aforementioned policy of profit distribution, plans to increase the dividend per share by ¥2 from the fiscal year ended March 31, 2021 to pay an annual dividend of ¥39 per share. This will culminate in a projected actual dividend increase for a ninth consecutive term.
Furthermore, the Company has established a system of providing special privileges to shareholders who own 500 shares or more of the Company’s stock as at March 31.

8
II. Basic Policy Regarding Selection of Accounting Standards
Regarding the voluntary adoption of international financial reporting standards (IFRS), in light of a variety of available information, the Nisshin Seifun Group’s policy at this time is to continue to investigate eventual adoption, with close consideration of the potential impact of the global comparability and application of financial data.
9
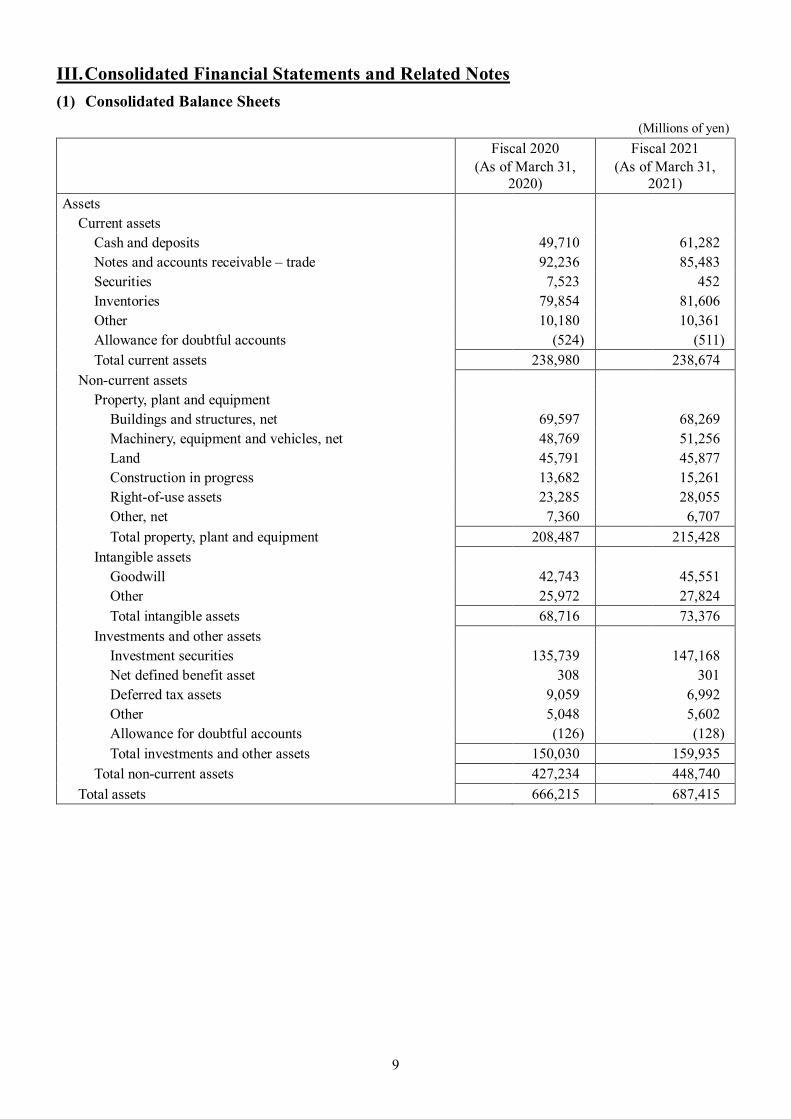
III. Consolidated Financial Statements and Related Notes (1) Consolidated Balance Sheets
(Millions of yen)
Fiscal 2020
(As of March 31, 2020)
Fiscal 2021 (As of March 31,
2021) Assets
Current assets Cash and deposits 49,710 61,282 Notes and accounts receivable – trade 92,236 85,483 Securities 7,523 452 Inventories 79,854 81,606 Other 10,180 10,361 Allowance for doubtful accounts (524) (511) Total current assets 238,980 238,674
Non-current assets Property, plant and equipment
Buildings and structures, net 69,597 68,269 Machinery, equipment and vehicles, net 48,769 51,256 Land 45,791 45,877 Construction in progress 13,682 15,261 Right-of-use assets 23,285 28,055 Other, net 7,360 6,707 Total property, plant and equipment 208,487 215,428
Intangible assets Goodwill 42,743 45,551 Other 25,972 27,824 Total intangible assets 68,716 73,376
Investments and other assets Investment securities 135,739 147,168 Net defined benefit asset 308 301 Deferred tax assets 9,059 6,992 Other 5,048 5,602 Allowance for doubtful accounts (126) (128) Total investments and other assets 150,030 159,935
Total non-current assets 427,234 448,740 Total assets 666,215 687,415
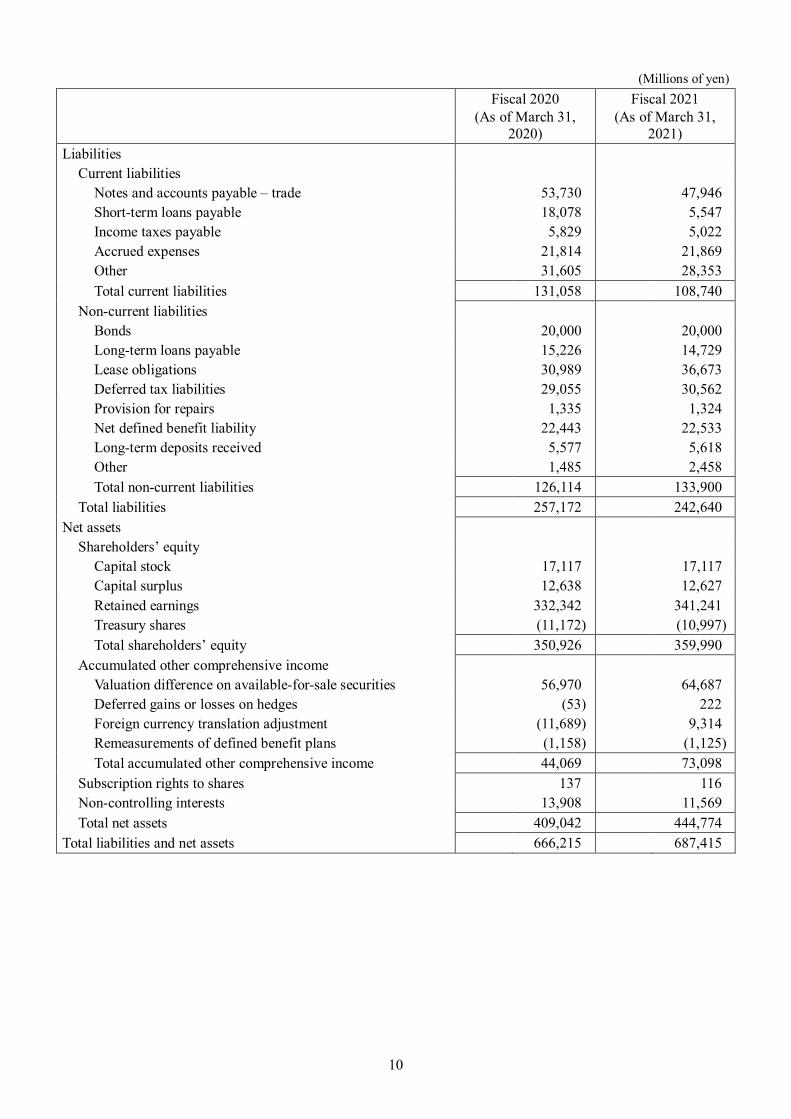
10
(Millions of yen)
Fiscal 2020
(As of March 31, 2020)
Fiscal 2021 (As of March 31,
2021) Liabilities
Current liabilities Notes and accounts payable – trade 53,730 47,946 Short-term loans payable 18,078 5,547 Income taxes payable 5,829 5,022 Accrued expenses 21,814 21,869 Other 31,605 28,353 Total current liabilities 131,058 108,740
Non-current liabilities Bonds 20,000 20,000 Long-term loans payable 15,226 14,729 Lease obligations 30,989 36,673 Deferred tax liabilities 29,055 30,562 Provision for repairs 1,335 1,324 Net defined benefit liability 22,443 22,533 Long-term deposits received 5,577 5,618 Other 1,485 2,458 Total non-current liabilities 126,114 133,900
Total liabilities 257,172 242,640 Net assets
Shareholders’ equity Capital stock 17,117 17,117 Capital surplus 12,638 12,627 Retained earnings 332,342 341,241 Treasury shares (11,172) (10,997) Total shareholders’ equity 350,926 359,990
Accumulated other comprehensive income Valuation difference on available-for-sale securities 56,970 64,687 Deferred gains or losses on hedges (53) 222 Foreign currency translation adjustment (11,689) 9,314 Remeasurements of defined benefit plans (1,158) (1,125) Total accumulated other comprehensive income 44,069 73,098
Subscription rights to shares 137 116 Non-controlling interests 13,908 11,569 Total net assets 409,042 444,774
Total liabilities and net assets 666,215 687,415

11
(2) Consolidated Statements of Income and Comprehensive Income [Consolidated Statements of Income]
(Millions of yen)
Fiscal 2020
(April 1, 2019 to March 31, 2020)
Fiscal 2021 (April 1, 2020 to March 31, 2021)
Net sales 712,180 679,495 Cost of sales 512,356 490,410 Gross profit 199,824 189,084 Selling, general and administrative expenses 170,971 161,887 Operating profit 28,852 27,197 Non-operating income
Interest income 496 159 Dividend income 2,867 2,811 Share of profit of entities accounted for using equity method 1,789 1,794 Rent income 295 317 Other 846 713 Total non-operating income 6,294 5,797
Non-operating expenses Interest expenses 3,163 2,782 Other 547 324 Total non-operating expenses 3,711 3,107
Ordinary profit 31,434 29,886 Extraordinary income
Gain on sales of non-current assets 104 427 Gain on sales of investment securities 212 1,421 Gain on step acquisitions 7,272 – Gain on sale of businesses 1,336 – Total extraordinary income 8,925 1,849
Extraordinary losses Loss on retirement of non-current assets 599 608 Impairment loss (note 1) 5,224 (note 1) 977 Business restructuring expenses (note 2) 1,028 (note 2) 388 Other 212 – Total extraordinary losses 7,064 1,974
Profit before income taxes 33,296 29,762 Income taxes – current 11,040 10,671 Income taxes – deferred (1,414) (863) Total income taxes 9,625 9,807 Profit 23,670 19,954 Profit attributable to non-controlling interests 1,263 943 Profit attributable to owners of parent 22,407 19,011
12
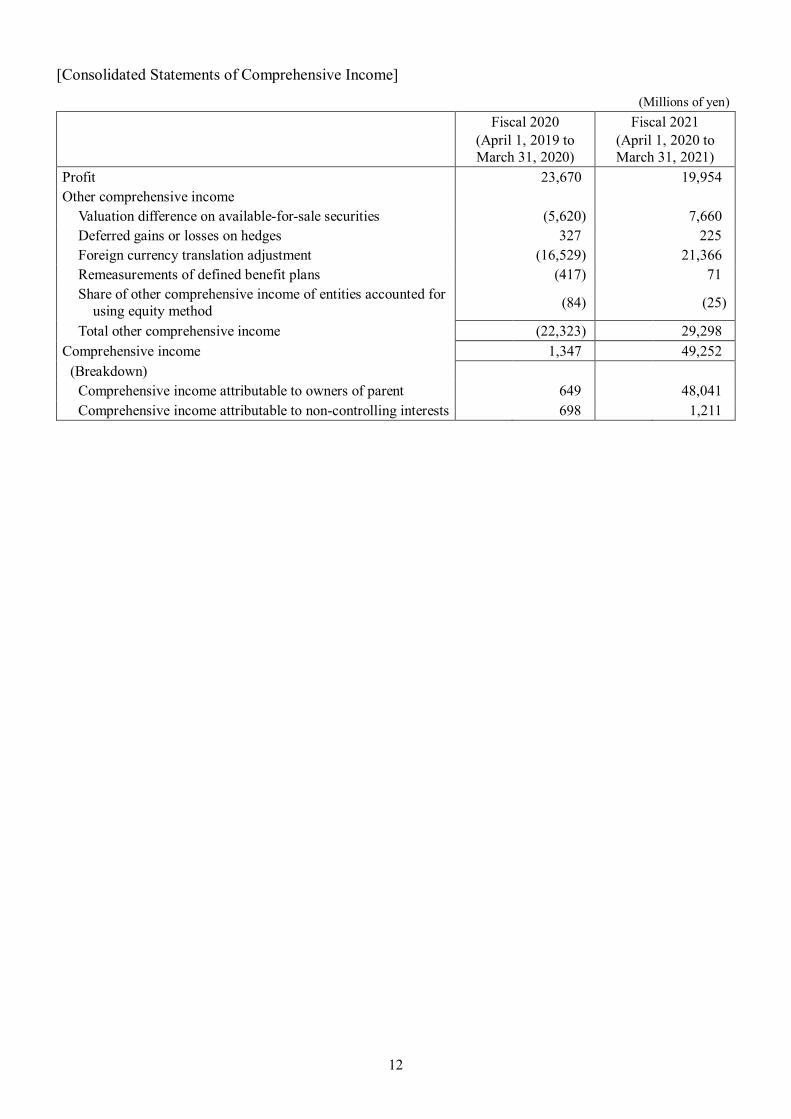
[Consolidated Statements of Comprehensive Income]
(Millions of yen)
Fiscal 2020
(April 1, 2019 to March 31, 2020)
Fiscal 2021 (April 1, 2020 to March 31, 2021)
Profit 23,670 19,954 Other comprehensive income
Valuation difference on available-for-sale securities (5,620) 7,660 Deferred gains or losses on hedges 327 225 Foreign currency translation adjustment (16,529) 21,366 Remeasurements of defined benefit plans (417) 71 Share of other comprehensive income of entities accounted for
using equity method (84) (25)
Total other comprehensive income (22,323) 29,298 Comprehensive income 1,347 49,252
(Breakdown) Comprehensive income attributable to owners of parent 649 48,041 Comprehensive income attributable to non-controlling interests 698 1,211
13
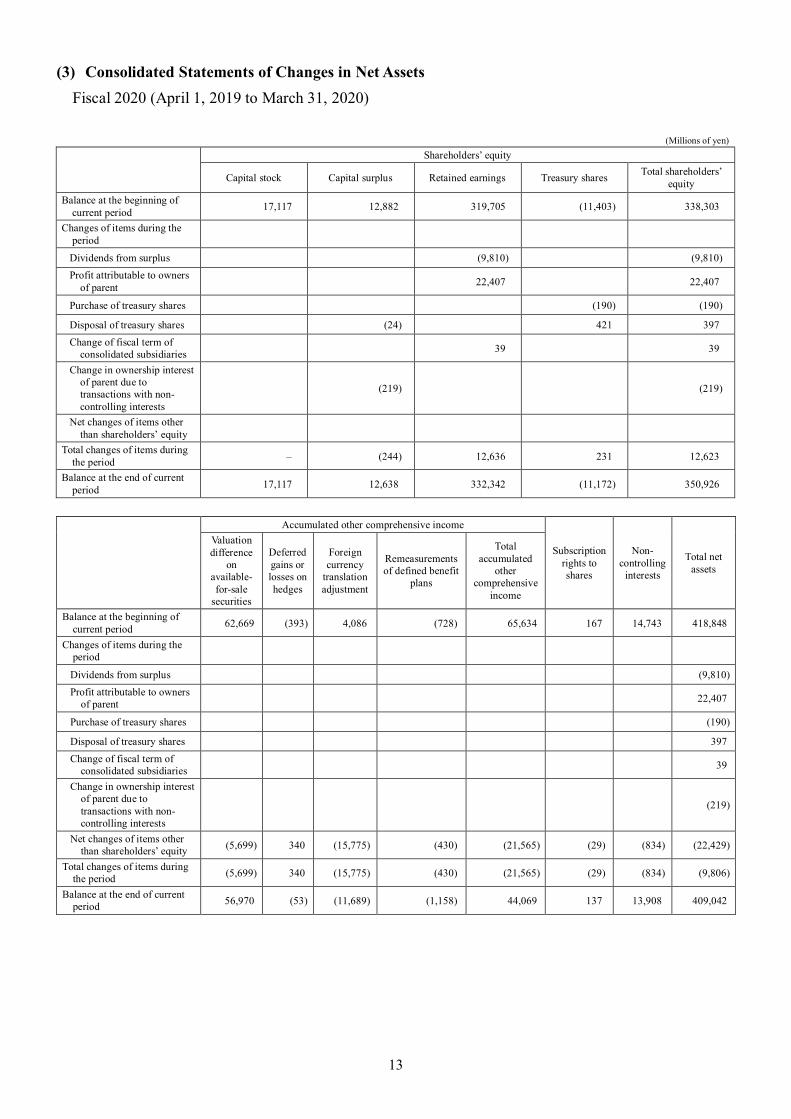
(3) Consolidated Statements of Changes in Net Assets Fiscal 2020 (April 1, 2019 to March 31, 2020)
(Millions of yen) Shareholders’ equity
Capital stock Capital surplus Retained earnings Treasury shares Total shareholders’ equity
Balance at the beginning of current period 17,117 12,882 319,705 (11,403) 338,303
Changes of items during the period
Dividends from surplus (9,810) (9,810) Profit attributable to owners
of parent 22,407 22,407
Purchase of treasury shares (190) (190)
Disposal of treasury shares (24) 421 397 Change of fiscal term of
consolidated subsidiaries 39 39
Change in ownership interest of parent due to transactions with non-controlling interests
(219) (219)
Net changes of items other than shareholders’ equity
Total changes of items during the period – (244) 12,636 231 12,623
Balance at the end of current period 17,117 12,638 332,342 (11,172) 350,926
Accumulated other comprehensive income
Subscription rights to shares
Non-controlling
interests
Total net assets
Valuation difference
on available-for-sale
securities
Deferred gains or losses on hedges
Foreign currency
translation adjustment
Remeasurements of defined benefit
plans
Total accumulated
other comprehensive
income
Balance at the beginning of current period 62,669 (393) 4,086 (728) 65,634 167 14,743 418,848
Changes of items during the period
Dividends from surplus (9,810) Profit attributable to owners
of parent 22,407
Purchase of treasury shares (190)
Disposal of treasury shares 397 Change of fiscal term of
consolidated subsidiaries 39
Change in ownership interest of parent due to transactions with non-controlling interests
(219)
Net changes of items other than shareholders’ equity (5,699) 340 (15,775) (430) (21,565) (29) (834) (22,429)
Total changes of items during the period (5,699) 340 (15,775) (430) (21,565) (29) (834) (9,806)
Balance at the end of current period 56,970 (53) (11,689) (1,158) 44,069 137 13,908 409,042
14
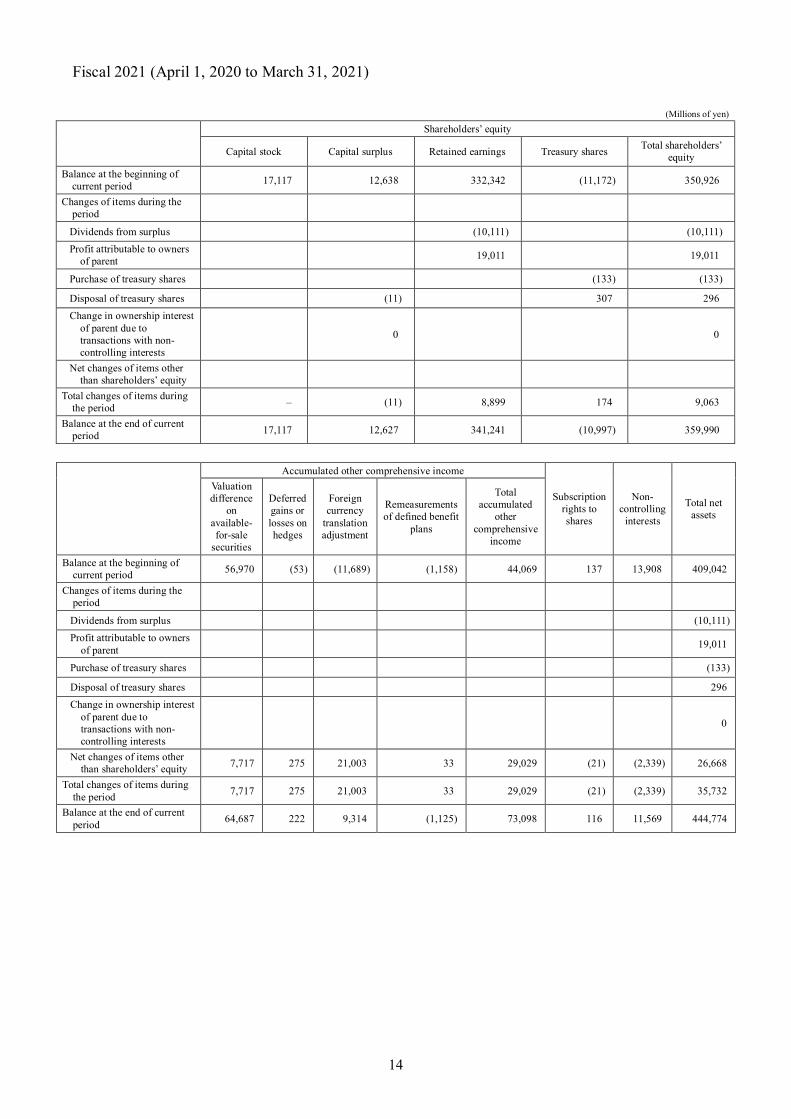
Fiscal 2021 (April 1, 2020 to March 31, 2021)
(Millions of yen)
Shareholders’ equity
Capital stock Capital surplus Retained earnings Treasury shares Total shareholders’ equity
Balance at the beginning of current period 17,117 12,638 332,342 (11,172) 350,926
Changes of items during the period
Dividends from surplus (10,111) (10,111) Profit attributable to owners
of parent 19,011 19,011
Purchase of treasury shares (133) (133)
Disposal of treasury shares (11) 307 296 Change in ownership interest
of parent due to transactions with non-controlling interests
0 0
Net changes of items other than shareholders’ equity
Total changes of items during the period – (11) 8,899 174 9,063
Balance at the end of current period 17,117 12,627 341,241 (10,997) 359,990
Accumulated other comprehensive income
Subscription rights to shares
Non-controlling
interests
Total net assets
Valuation difference
on available-for-sale
securities
Deferred gains or losses on hedges
Foreign currency
translation adjustment
Remeasurements of defined benefit
plans
Total accumulated
other comprehensive
income
Balance at the beginning of current period 56,970 (53) (11,689) (1,158) 44,069 137 13,908 409,042
Changes of items during the period
Dividends from surplus (10,111) Profit attributable to owners
of parent 19,011
Purchase of treasury shares (133)
Disposal of treasury shares 296 Change in ownership interest
of parent due to transactions with non-controlling interests
0
Net changes of items other than shareholders’ equity 7,717 275 21,003 33 29,029 (21) (2,339) 26,668
Total changes of items during the period 7,717 275 21,003 33 29,029 (21) (2,339) 35,732
Balance at the end of current period 64,687 222 9,314 (1,125) 73,098 116 11,569 444,774

15
(4) Consolidated Statements of Cash Flows
(Millions of yen)
Fiscal 2020
(April 1, 2019 to March 31, 2020)
Fiscal 2021 (April 1, 2020 to March 31, 2021)
Cash flows from operating activities Profit before income taxes 33,296 29,762 Depreciation and amortization 21,235 22,271 Impairment loss 5,224 977 Amortization of goodwill 5,672 5,436 Loss (gain) on step acquisitions (7,272) – Loss (gain) on sale of businesses (1,336) – Increase (decrease) in net defined benefit liability 1,162 63 Decrease (increase) in net defined benefit asset (31) 7 Interest and dividend income (3,363) (2,971) Interest expenses 3,163 2,782 Share of (profit) loss of entities accounted for using equity method (1,789) (1,794) Loss (gain) on sales of investment securities (210) (1,421) Decrease (increase) in notes and accounts receivable – trade 3,883 9,798 Decrease (increase) in inventories 6,339 2,091 Increase (decrease) in notes and accounts payable – trade (16,989) (6,672) Other, net (1,458) (439) Subtotal 47,528 59,891 Interest and dividends income received 4,449 3,735 Interest expenses paid (3,145) (2,784) Income taxes paid (10,412) (11,336) Net cash provided by (used in) operating activities 38,420 49,506
Cash flows from investing activities Payments into time deposits (1,064) (2,202) Proceeds from withdrawal of time deposits 1,965 – Purchase of securities (1,771) (881) Proceeds from sales of securities 2,117 1,343 Purchase of property, plant, and equipment and intangible assets (21,919) (17,359) Purchase of investment securities (554) (39) Proceeds from sales of investment securities 291 1,934 Proceeds from sale of businesses 1,426 – Purchase of shares of subsidiaries resulting in change in scope of consolidation (77,189) (275) Other, net (145) 376 Net cash provided by (used in) investing activities (96,844) (17,105)
Cash flows from financing activities Increase in short-term loans payable 35,719 305 Decrease in short-term loans payable (43,290) (14,422) Proceeds from long-term loans payable 10,000 400 Proceeds from issuance of bonds 19,888 – Proceeds from sales of treasury shares 250 122 Purchase of treasury shares (190) (133) Cash dividends paid (9,810) (10,111) Dividends paid to non-controlling interests (403) (3,550) Payments from changes in ownership interests in subsidiaries that do not result in
change in scope of consolidation (275) (0)
Repayments of lease obligations (3,549) (3,874) Other, net (0) – Net cash provided by (used in) financing activities 8,337 (31,264)
Effect of exchange rate changes on cash and cash equivalents (1,451) 1,466 Net increase (decrease) in cash and cash equivalents (51,537) 2,602 Cash and cash equivalents at beginning of period 107,374 56,550 Increase (decrease) in cash and cash equivalents resulting from change of fiscal year-
end of subsidiaries 713 –
Cash and cash equivalents at end of period 56,550 59,152
16
(5) Notes on Consolidated Financial Statements [Going Concern Considerations]
There are no applicable matters to be reported. [Changes in Disclosure] [Consolidated Statements of Cash Flows]
Due to growth in its monetary importance, “Dividends paid to non-controlling interests,” included within “Other, net” under “Net cash provided by (used in) financing activities” in the previous fiscal year (ended March 31, 2020), has been reported as a separate line item for the fiscal year ended March 31, 2021. Consolidated financial statements for the previous fiscal year have been restated to reflect this change in disclosure.
As a result, a loss of ¥404 million reported as “Other, net” under “Net cash provided by (used in) financing activities” in the Consolidated Statements of Cash Flows for the previous fiscal year (ended March 31, 2020) has been restated as a loss of ¥403 million reported as “Dividends paid to non-controlling interests,” and a loss of ¥0 million reported as “Other, net.” [Consolidated Statements of Income] 1. Impairment losses
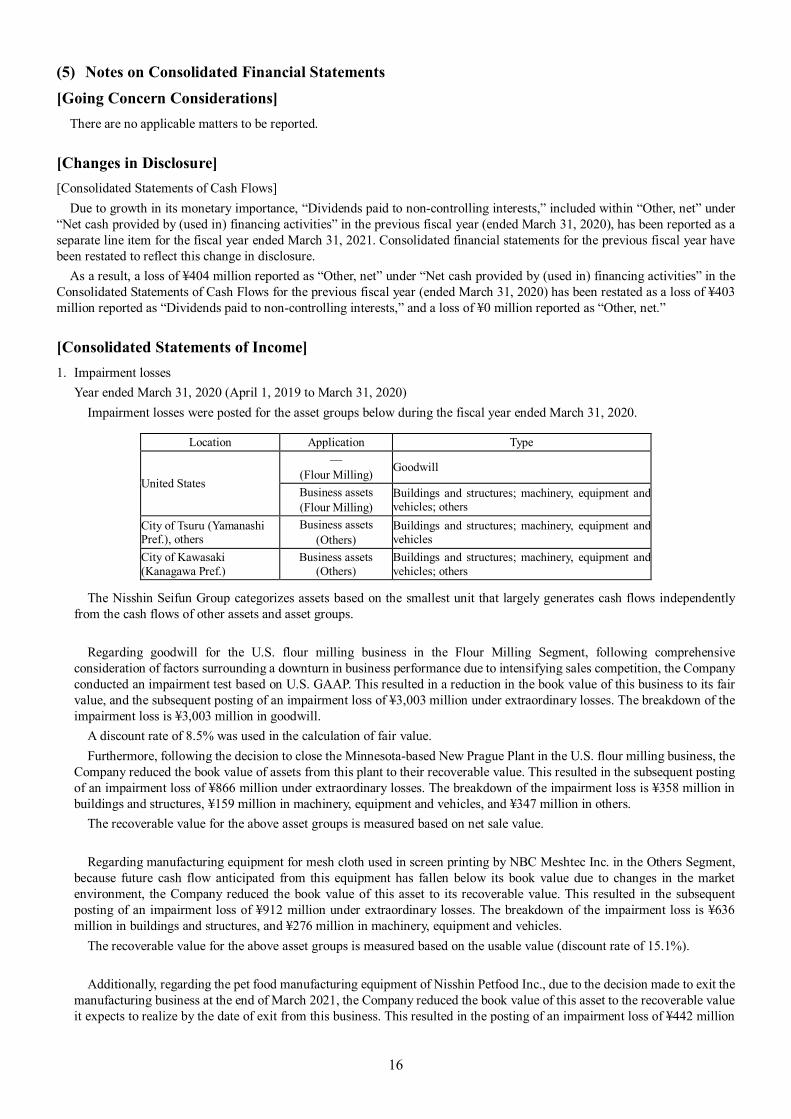
Year ended March 31, 2020 (April 1, 2019 to March 31, 2020) Impairment losses were posted for the asset groups below during the fiscal year ended March 31, 2020.
Location Application Type
United States
— (Flour Milling) Goodwill
Business assets (Flour Milling)
Buildings and structures; machinery, equipment and vehicles; others
City of Tsuru (Yamanashi Pref.), others
Business assets (Others)
Buildings and structures; machinery, equipment and vehicles
City of Kawasaki (Kanagawa Pref.)
Business assets (Others)
Buildings and structures; machinery, equipment and vehicles; others
The Nisshin Seifun Group categorizes assets based on the smallest unit that largely generates cash flows independently from the cash flows of other assets and asset groups.
Regarding goodwill for the U.S. flour milling business in the Flour Milling Segment, following comprehensive
consideration of factors surrounding a downturn in business performance due to intensifying sales competition, the Company conducted an impairment test based on U.S. GAAP. This resulted in a reduction in the book value of this business to its fair value, and the subsequent posting of an impairment loss of ¥3,003 million under extraordinary losses. The breakdown of the impairment loss is ¥3,003 million in goodwill.
A discount rate of 8.5% was used in the calculation of fair value. Furthermore, following the decision to close the Minnesota-based New Prague Plant in the U.S. flour milling business, the
Company reduced the book value of assets from this plant to their recoverable value. This resulted in the subsequent posting of an impairment loss of ¥866 million under extraordinary losses. The breakdown of the impairment loss is ¥358 million in buildings and structures, ¥159 million in machinery, equipment and vehicles, and ¥347 million in others.
The recoverable value for the above asset groups is measured based on net sale value.
Regarding manufacturing equipment for mesh cloth used in screen printing by NBC Meshtec Inc. in the Others Segment, because future cash flow anticipated from this equipment has fallen below its book value due to changes in the market environment, the Company reduced the book value of this asset to its recoverable value. This resulted in the subsequent posting of an impairment loss of ¥912 million under extraordinary losses. The breakdown of the impairment loss is ¥636 million in buildings and structures, and ¥276 million in machinery, equipment and vehicles.
The recoverable value for the above asset groups is measured based on the usable value (discount rate of 15.1%).
Additionally, regarding the pet food manufacturing equipment of Nisshin Petfood Inc., due to the decision made to exit the manufacturing business at the end of March 2021, the Company reduced the book value of this asset to the recoverable value it expects to realize by the date of exit from this business. This resulted in the posting of an impairment loss of ¥442 million
17
under extraordinary losses. The breakdown of the impairment loss is ¥99 million in buildings and structures, ¥323 million in machinery, equipment and vehicles, and ¥19 million in others.
The recoverable value for the above asset groups is measured based on the usable value (discount rate of 9.6%).
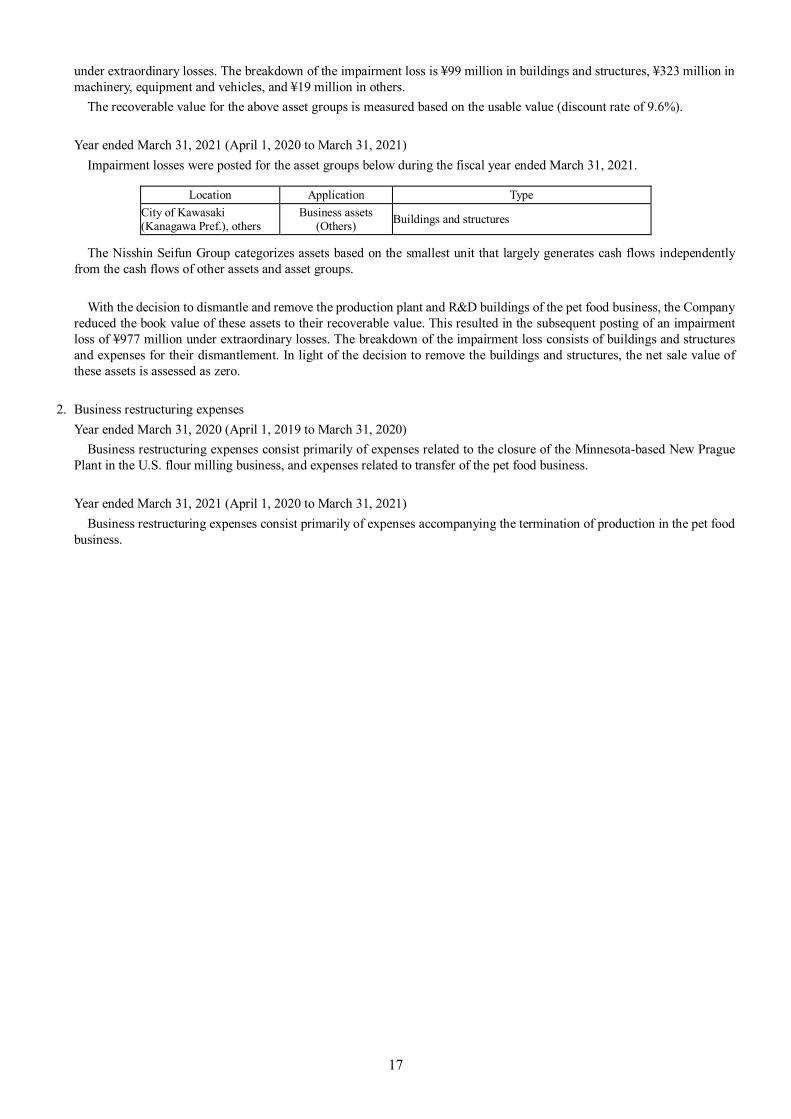
Year ended March 31, 2021 (April 1, 2020 to March 31, 2021) Impairment losses were posted for the asset groups below during the fiscal year ended March 31, 2021.
Location Application Type City of Kawasaki (Kanagawa Pref.), others
Business assets (Others) Buildings and structures
The Nisshin Seifun Group categorizes assets based on the smallest unit that largely generates cash flows independently from the cash flows of other assets and asset groups.
With the decision to dismantle and remove the production plant and R&D buildings of the pet food business, the Company
reduced the book value of these assets to their recoverable value. This resulted in the subsequent posting of an impairment loss of ¥977 million under extraordinary losses. The breakdown of the impairment loss consists of buildings and structures and expenses for their dismantlement. In light of the decision to remove the buildings and structures, the net sale value of these assets is assessed as zero.
2. Business restructuring expenses
Year ended March 31, 2020 (April 1, 2019 to March 31, 2020) Business restructuring expenses consist primarily of expenses related to the closure of the Minnesota-based New Prague
Plant in the U.S. flour milling business, and expenses related to transfer of the pet food business.
Year ended March 31, 2021 (April 1, 2020 to March 31, 2021) Business restructuring expenses consist primarily of expenses accompanying the termination of production in the pet food
business.

18
[Segment Information, etc.] [Segment information] 1. Outline of reportable segment
The Nisshin Seifun Group’s reportable segments and the other businesses are components of the Group, for which discrete financial information is available and the operating results are regularly reviewed by the Company’s Board of Directors to make decisions about resources to be allocated to and assess the performance of the segments.
The Company, as the holding company of the Group, plans and determines group strategies for, allocates resources to and assesses the performance of each of its businesses, which are classified by type of products and services in Flour Milling, Processed Food, Prepared Dishes and Other Prepared Foods and Others.
Accordingly, the Group designates the Flour Milling, Processed Food and Prepared Dishes and Other Prepared Foods segments as its reportable segments. Major products of the reportable segments are as follows.
Flour Milling: Wheat flour, bran and wheat flour-related products Processed Food: Prepared mix, wheat flour for household-use, pasta, pasta sauce, frozen food, cake and bread ingredients, biochemical products, life science business, healthcare foods Prepared Dishes and Other Prepared Foods: Boxed lunches, prepared dishes, prepared noodles and other prepared foods
2. Calculation methods of net sales, profit (loss), assets and other items for each reportable segment The accounting methods used for reportable segments are largely the same as those adopted for use in the preparation of
the consolidated financial statements. Segment profit figures are the same as operating profit figures. Intersegment sales and transfers are based on market prices.
3. Information about net sales, profit (loss), assets and other items for each reportable segment Year Ended March 31, 2020 (April 1, 2019 to March 31, 2020)
(Millions of yen)
Reportable segment
Others (Note 1) Total Adjustment
(Note 2)
Carried on consolidated
financial statements (Note 3)
Flour Milling
Processed Food
Prepared Dishes and
Other Prepared
Foods
Total
Net sales Sales to external
customers 306,745 217,959 129,967 654,673 57,507 712,180 – 712,180
Intersegment sales and transfers 16,507 1,465 4,991 22,963 2,406 25,369 (25,369) –
Total 323,252 219,424 134,959 677,637 59,913 737,550 (25,369) 712,180 Segment profit 9,326 12,895 1,736 23,958 4,698 28,657 194 28,852 Segment assets 294,565 159,399 60,065 514,031 73,642 587,674 78,540 666,215 Other items
Depreciation and amortization 11,780 5,005 3,142 19,928 1,546 21,475 (239) 21,235
Investment for affiliates accounted for by the equity method
3,370 159 – 3,530 16,649 20,179 – 20,179
Increase in property, plant and equipment and intangible assets
7,629 9,094 3,474 20,198 1,731 21,930 (87) 21,843
Notes: 1. Business segment of “Others” is excluded from reportable segment, which includes pet food, engineering, mesh cloths, handling and storage
businesses. 2. Segment profit adjustment refers to intersegment transaction eliminations.
The adjustment in segment assets of ¥78,540 million includes intersegment asset eliminations (-¥118,562 million) and the Group’s assets (¥197,103 million): mainly, the Company’s investment securities.
3. Segment profit has been adjusted for the operating profit appearing in the consolidated statements of income.
19
Year Ended March 31, 2021 (April 1, 2020 to March 31, 2021) (Millions of yen)
Reportable segment
Others (Note 1) Total Adjustment
(Note 2)
Carried on consolidated
financial statements (Note 3)
Flour Milling
Processed Food
Prepared Dishes and
Other Prepared
Foods
Total
Net sales Sales to external
customers 285,798 214,710 142,747 643,255 36,240 679,495 – 679,495
Intersegment sales and transfers 15,752 1,642 5,304 22,699 3,039 25,738 (25,738) –
Total 301,551 216,352 148,051 665,954 39,279 705,234 (25,738) 679,495 Segment profit 6,317 15,350 1,278 22,946 4,240 27,187 9 27,197 Segment assets 303,269 159,260 56,608 519,138 67,097 586,236 101,179 687,415 Other items
Depreciation and amortization 11,762 5,198 4,170 21,131 1,389 22,520 (249) 22,271
Investment for affiliates accounted for by the equity method
3,456 159 – 3,615 17,407 21,023 – 21,023
Increase in property, plant and equipment and intangible assets
8,510 5,064 2,008 15,583 1,056 16,639 (202) 16,437
Notes: 1. Business segment of “Others” is excluded from reportable segment, which includes pet food, engineering, mesh cloths, handling and storage
businesses. 2. Segment profit adjustment refers to intersegment transaction eliminations.
The adjustment in segment assets of ¥101,179 million includes intersegment asset eliminations (-¥113,550 million) and the Group’s assets (¥214,729 million): mainly, the Company’s investment securities.
3. Segment profit has been adjusted for the operating profit appearing in the consolidated statements of income.
20
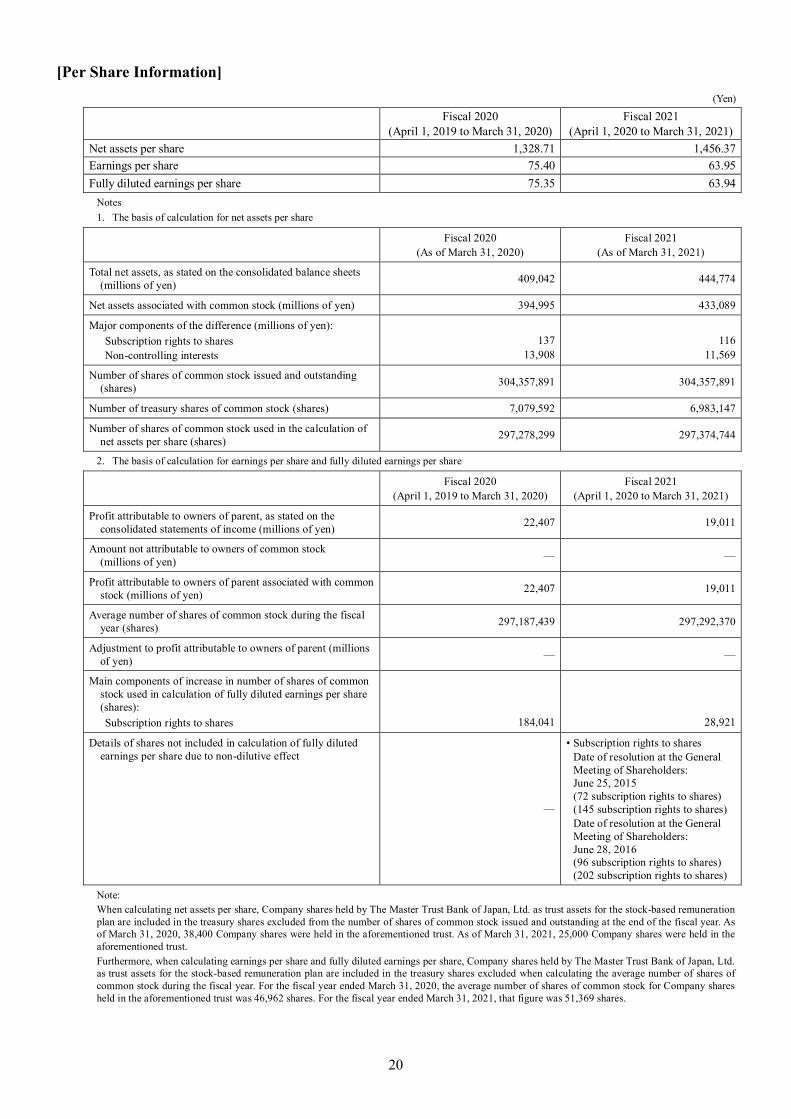
[Per Share Information] (Yen)
Fiscal 2020 (April 1, 2019 to March 31, 2020)
Fiscal 2021 (April 1, 2020 to March 31, 2021)
Net assets per share 1,328.71 1,456.37 Earnings per share 75.40 63.95 Fully diluted earnings per share 75.35 63.94
Notes 1. The basis of calculation for net assets per share
Fiscal 2020 (As of March 31, 2020)
Fiscal 2021 (As of March 31, 2021)
Total net assets, as stated on the consolidated balance sheets (millions of yen) 409,042 444,774
Net assets associated with common stock (millions of yen) 394,995 433,089
Major components of the difference (millions of yen): Subscription rights to shares Non-controlling interests
137
13,908
116
11,569
Number of shares of common stock issued and outstanding (shares) 304,357,891 304,357,891
Number of treasury shares of common stock (shares) 7,079,592 6,983,147
Number of shares of common stock used in the calculation of net assets per share (shares) 297,278,299 297,374,744
2. The basis of calculation for earnings per share and fully diluted earnings per share Fiscal 2020
(April 1, 2019 to March 31, 2020) Fiscal 2021
(April 1, 2020 to March 31, 2021)
Profit attributable to owners of parent, as stated on the consolidated statements of income (millions of yen) 22,407 19,011
Amount not attributable to owners of common stock (millions of yen) — —
Profit attributable to owners of parent associated with common stock (millions of yen) 22,407 19,011
Average number of shares of common stock during the fiscal year (shares) 297,187,439 297,292,370
Adjustment to profit attributable to owners of parent (millions of yen) — —
Main components of increase in number of shares of common stock used in calculation of fully diluted earnings per share (shares): Subscription rights to shares
184,041
28,921
Details of shares not included in calculation of fully diluted earnings per share due to non-dilutive effect
—
• Subscription rights to shares Date of resolution at the General
Meeting of Shareholders: June 25, 2015 (72 subscription rights to shares) (145 subscription rights to shares)
Date of resolution at the General Meeting of Shareholders: June 28, 2016 (96 subscription rights to shares) (202 subscription rights to shares)
Note: When calculating net assets per share, Company shares held by The Master Trust Bank of Japan, Ltd. as trust assets for the stock-based remuneration plan are included in the treasury shares excluded from the number of shares of common stock issued and outstanding at the end of the fiscal year. As of March 31, 2020, 38,400 Company shares were held in the aforementioned trust. As of March 31, 2021, 25,000 Company shares were held in the aforementioned trust. Furthermore, when calculating earnings per share and fully diluted earnings per share, Company shares held by The Master Trust Bank of Japan, Ltd. as trust assets for the stock-based remuneration plan are included in the treasury shares excluded when calculating the average number of shares of common stock during the fiscal year. For the fiscal year ended March 31, 2020, the average number of shares of common stock for Company shares held in the aforementioned trust was 46,962 shares. For the fiscal year ended March 31, 2021, that figure was 51,369 shares.
21
[Material Subsequent Events] There are no applicable matters to be reported.