disclosure of the impacts of adopting … · corporate size is consistently found to be...
TRANSCRIPT
THE IMPACT OF ADOPTING AIFRS IN AUSTRALIA: THE EXTENT AND
QUALITY OF DISCLOSURES, AND THEIR RELATIONSHIP TO
CORPORATE CHARACTERISTICS
Philip D. Palmerab
School of Commerce, Flinders University, Adelaide, Australia
Key Words: Voluntary Disclosure, Mandatory Disclosure, Agency Theory,
International Accounting Standards
SCHOOL OF COMMERCE RESEARCH PAPER SERIES: 06-5
ISSN: 1441-3906
aPhilip D. Palmer, School of Commerce, Flinders University, GPO Box 2100, Adelaide, South Australia, 5001, phone 08 8201 2013, fax 08 8201 2644, [email protected]. b The author would like to thank Peter Gerhardy, Matthew Tilling, Carol Tilt and Bryan Howieson for their helpful input and comments on this paper.
1
THE IMPACT OF ADOPTING AIFRS IN AUSTRALIA: THE EXTENT AND
QUALITY OF DISCLOSURES, AND THEIR RELATIONSHIP TO
CORPORATE CHARACTERISTICS
ABSTRACT
This paper investigates the extent and quality of disclosures by companies complying
with AASB 1047, Disclosing the Impacts of Adopting Australian Equivalents to
International Financial Reporting Standards, and whether they are related to selected
corporate characteristics. The key relationships examined are between extent of
disclosure and company size, profitability, leverage, industry membership and auditor
size. In addition exploratory hypotheses, suggesting a relationship between quality of
disclosure and company size, profitability, leverage and auditor size are investigated.
The study finds variation in the extent of disclosure by companies complying with
AASB 1047. Results of the univariate tests and multiple regression analysis provide
support for a positive relationship between the extent of disclosure and company size,
profitability, leverage and auditor size, with the latter variable being the most
significant. The tests do not support a relationship between differing levels of
disclosure and industry membership.
The univariate and multivariate tests provide limited (and qualified) support for a
relationship between the quality of disclosure and the size of a company’s auditor.
Univariate tests also provide limited support for a relationship between the quality of
disclosure and the size and profitability of a company; however, there is no evidence
of a relationship with the leverage of a company.
2
1. Introduction
On 3 July 2002 the then chairman of the Financial Reporting Council (FRC), Jeffrey
Lucy, announced that Australia would adopt international accounting standards from
1 January 2005 (FRC, 2002). Specifically, the FRC announced that from 1 January
2005 “the accounting standards applicable to reporting entities under the
[Corporations] Act will be the standards issued by the International Accounting
Standards Board” (FRC, 2002). The Australian Accounting Standards Board (AASB),
however, is responsible for making accounting standards that have the force of law
under the Corporations Act, and it is only with these standards that Australian
companies must comply. Therefore, the AASB decided to issue Australian
equivalents, based on International Financial Reporting Standards (IFRS).
This decision of the FRC has led to significant changes to the accounting standards
with which Australian companies must comply. The transition to Australian
Equivalents of International Financial Reporting Standards (AIFRS) is one of the
most significant events affecting financial reporting in Australia for some time and is
an important issue for companies, auditors and investors (ASIC, 2006).
As a means of keeping stakeholders informed of the likely impact of adoption of
AIFRS the AASB released AASB 1047, Disclosing the Impacts of Adopting
Australian Equivalents to International Financial Reporting Standards, requiring
companies to disclose in their financial reports details of how the transition to AIFRS
is being managed and what the likely impact of adoption will be. The standard applies
to annual and interim reporting periods ending on or after 30 June 2004, and applies
until first time adoption of AIFRS. AASB 1047 is therefore of major significance as it
requires companies to disclose in their annual reports their level of preparedness
leading up to the adoption of AIFRS, and what they consider the impacts of adoption
3
to be. The objective of the disclosures required under AASB 1047 is to ensure users
of financial reports have relevant and reliable information about the impact of
adoption, as well as information concerning how companies are preparing for
adoption.
Jubb (2005) and Ernst & Young (2005) survey corporate disclosures in relation to
AASB 1047 in order to highlight the major impacts on their financial statements
expected by companies as a result of adoption of AIFRS. Jubb’s (2005) study
examines Australian Stock Exchange (ASX) Section 4E Preliminary Final Reports
and annual reports filed with them, as well as ASX Section 4D Half-year Reports.
Disclosures required by AASB 1047 are examined, and the number of words devoted
to these disclosures counted. Disclosures relating to key differences in accounting
policies expected to ensue as a result of adopting AIFRS for each company are coded
into categories (e.g. Income Tax, Impairment, Share-based Payments, etc) and
descriptive statistics compiled. Jubb (2005) finds that the most frequently cited
expected accounting policy differences, in order of frequency, reported by the 808
companies making up the study sample are:
1. AASB 112 Income Taxes
2. AASB 136 Impairment of Assets
3. AASB 2 Share-based Payment
4. AASB 132 & 139 Financial Instruments: Presentation and Disclosure & Financial Instruments: Recognition and Measurement
5. AASB 3 Business Combinations
A similar analysis is conducted in the current study; however, the current study
focuses on the annual report rather than ASX filings, as the annual report represents
the major disclosure document to the external stakeholders of the reporting entity, and
is where AASB 1047, para. 4.1, prescribes that the impact of adopting AIFRS be
4
disclosed. Further, as outlined in Section 3, the current study uses sentences as the
unit of analysis, rather than words as used in Jubb’s (2005) study.
Ernst & Young (2005) examine disclosures made by the top 78 Australian listed
companies with a focus on the impact on profit and on equity at the AIFRS transition
date and at the end of the first AIFRS comparative year. Of the financial reports
included in Ernst & Young’s (2005) study, 21 were interim reports and 57 were
annual reports. Similar to the current and Jubb’s (2005) study, companies are
classified according to Global Industry Classification Standard (GICS)1 sector;
however, the number of companies in each category is not fully detailed. In
discussion of analysis of profit impact it is stated that there is only one company in the
Utilities and Health Care sectors meaning the results in these sectors are not
necessarily representative of the industry sector as a whole. Disclosures are
categorised by AASB standard and used as the basis to determine the impact (high,
medium, low) of each type of AIFRS adjustment, with the accounting policy
differences that companies expect to have a high impact on profit or equity being:
• Share-based payments
• Goodwill amortisation
• Income Taxes
• Defined benefit superannuation plans
The current study extends the analysis beyond that performed by Jubb (2005) and
Ernst & Young (2005) by not only developing a disclosure index that measures the
extent of disclosure but also the quality of those disclosures. Further, the current study
1 GICS is a joint Standards and Poor’s/Morgan Stanley Capital International product which aims to standardise industry classifications and definitions (ASX, 2005). Standard and Poor’s have reclassified all ASX listed companies according to GICS to bring Australia into line with the rest of the world (ASX, 2005). GICS consists of 10 Sectors aggregated from 24 Industry Groups, 64 Industries and 139 Sub-Industries (ASX, 2005). As industry membership is one of the independent variables tested in this study industry classification of sample companies is important.
5
makes use of univariate and multivariate statistical methods in investigating the extent
and quality of disclose and the relationship, if any, to corporate characteristics.
Given the significant impact adoption of AIFRS will have on Australian companies
and the interest shown by the professional accounting bodies and financial market
regulator, a study investigating the extent and quality of disclosures made by
Australian listed companies under AASB 1047 is timely. The study demonstrates the
effectiveness of a particular regulatory policy by showing the extent of compliance
with the requirements of the standard. AASB 1047 disclosures have the advantage of
being discretely and easily identified and isolated in the notes of the annual report and
thus the extent of disclosure can be directly measured. Additionally, the focus on the
quality of disclosure demonstrates the role of AASB 1047 in helping users of
financial statements to cope with the change. Also, while there has been extensive
research investigating the relationship between the level of various disclosures in
financial reports and corporate characteristics, very few studies (exceptions being,
Davies & Kelly, 1979; Hossain & Adams, 1995) have been undertaken in an
Australian setting. This study therefore seeks to complement and extend previous
studies by examining the extent and quality of disclosure by Australian listed
companies in complying with AASB 1047. Further, it investigates what corporate
characteristics, if any, appear to be related to the extent and quality of these
disclosures.
The remainder of the paper proceeds as follows. Section 2 provides the theoretical
background for the study and develops the hypotheses. Section 3 outlines the research
methods used to test the hypotheses. Section 4 reports the study’s results. Section 5
concludes the study by discussing the implications of the research findings, the
potential limitations of the study and considering future areas of research.
6
2. Theoretical background and hypotheses
2.1 Extent of Disclosure
2.1.1 Corporate Size and Disclosure
Corporate size is consistently found to be significantly and positively related to
disclosure levels; however, Watts and Zimmerman (1986) caution that size may proxy
for industry because companies within a particular industry may be of a similar size.
Additionally, as Ahmed and Courtis (1999) point out, there has been a wide variation
in the determined level of significance between size and the level of disclosure. Buzby
(1975, p. 18) identifies that “[w]hen we speak of an association between asset size and
disclosure, we are really referring to the special characteristics surrounding the size of
a firm and their logical link to the extent of disclosure”. Ahmed and Nicholls (1994)
suggest that many of these ‘special characteristics’ are put forward in the literature to
justify the relationship between the size of the reporting company and the level of
disclosure on a priori grounds. Reasons include:
Cost
The accumulation and presentation of detailed information is costly and smaller
companies may deem the exercise unmerited (Cerf, 1961; Singhvi & Desai, 1971;
Buzby, 1975; Firth, 1979), while larger companies are likely to have the resources in
place to undertake such an exercise (Ahmed & Nicholls, 1994; Hossain & Adams,
1995).
Economies of Scale
Larger companies are likely to have a higher level of internal reporting to keep senior
management informed and therefore are likely to have relevant information available
(Cerf, 1961; Buzby, 1975; Owusu-Ansah, 1998). Cerf (1961), however, notes that the
7
accumulation of such information is no guarantee that it will be presented in the
annual report.
Financing
Cerf (1961) and Singhvi and Desai (1971) argue that management of larger
companies may be more conscious of the needs of investors and appreciate the
potential benefits of fuller disclosure, including easier marketability of shares (Cerf,
1961) and greater ease in financing (Singhvi & Desai, 1971). Cooke (1993) suggests
that larger companies, requiring more funding than smaller companies, have a need to
raise capital at the lowest cost, and to do this companies will increase their voluntary
disclosures and compliance with mandated disclosures.
Economic Consequences
Wallace and Naser (1995) state that the impacts that large companies can have on the
economy can be considerable as these companies account for a significant proportion
of goods and services produced, consumption of raw materials and number of people
employed. As such, large companies are likely to come under the scrutiny of various
interested parties (Wallace & Naser, 1995).
Number of Shareholders
Cooke (1989) suggests that the number of shareholders is a measure of size and
argues that the greater the number of shareholders needing information, the greater
will be the diversity of information disclosed. On this basis, larger companies (with
more shareholders), are likely to come under more scrutiny from financial analysts
than smaller companies, leading to pressure for better disclosure (Cerf, 1961; Hossain
& Adams, 1995).
Buzby (1975, p. 18), summarising the preceding reasons to explain the relationship
between company size and a higher level of disclosure, indicates that some of them,
8

“taken alone, do not appear to be compelling enough to support such an expectation.
However, the reasons do cover a broad range of possibilities which, taken as a group,
might lead one to an expectation of a positive association between the two variables”.
Wallace et al. (1994, p. 44) recognise that while previous studies have provided
strong support for the relationship between size and greater disclosure levels, “the
theoretical basis for such a relationship is unclear”. There is not one single theoretical
framework that underpins the disclosure literature. Beattie (2005) suggests that
positive accounting theorists have sought to move on from explaining accounting
policy choices to explaining voluntary disclosure choices, and many of the theoretical
explanations for the relationship between the level of disclosure of financial
information and corporate characteristics are grounded in positive accounting theory.
The two main recurring theoretical explanations given in the literature are agency
theory and political costs.
On the basis of the above discussion the first hypothesis to be tested in the study is:
H1: The extent of disclosure by companies complying with AASB 1047 is greater
for larger companies than for smaller companies.
2.1.2 Industry and Disclosure
A number of studies investigate the relationship between a company’s industry
membership and the level of disclosure (e.g. Cerf, 1961; McNally et al., 1982; Cooke,
1992; Wallace et al., 1994; Raffournier, 1995; Inchausti, 1997; Owusu-Ansah, 1998).
Cook (1992) found that manufacturing companies in Japan disclosed more
information than non-manufacturing companies, while McNally et al. (1982) found
that there were no differences in the extent of disclosure by New Zealand companies
across eleven industry groups. Wallace et al. (1994) postulate that due to their unique
9

features companies from a particular industry group may adopt disclosure practices
additional to those mandatory for companies from all industries. Further, Inchausti
(1997) reasons that if a company doesn’t adopt the same disclosure strategies as
others in the same industry it could negatively impact on share price. This is because
the market may wonder why a particular company is not disclosing information
similar to others in the same industry and decide that it is because the company has
bad news which it is hiding. Inchausti (1997) also suggests the relationship between
the extent of disclosure and industry membership may be due to political costs theory,
as industry membership may affect the political vulnerability of a company. Based on
these arguments the following hypothesis is tested:
H2: The extent of disclosure by companies complying with AASB 1047 is
different for companies in different industries.
2.1.3 Profitability and Disclosure
The profitability of a company is also regularly included in disclosure studies and
hypothesised to be positively associated with a company’s disclosure level (Cerf,
1961; Wallace et al., 1994; Raffournier, 1995; Wallace & Naser, 1995; Inchausti,
1997; Owusu-Ansah, 1998). Watts and Zimmerman (1986) note that a company’s
earnings and size are highly correlated. Therefore, many of the explanations for the
relationship between profitability and disclosure levels are similar to those discussed
for size. Auxiliary to those explanations, Cerf (1961, p. 21) reasons that as
profitability is a measure of management performance, the manager of a profitable
company is more likely to disclose information to support “the continuance of their
positions and compensations”. Conversely, a company that is less profitable may
disclose less information in an attempt to cover up the reasons for declining profits
(Singhvi & Desai, 1971). However, Cerf (1961) postulates that a company that is less
10
profitable may in fact disclose more information to explain the reasons for the lower
profitability. In a similar vein Inchausti (1997) suggests that owners are interested in
keeping the market informed to avoid the undervaluation of their shares. Wallace and
Naser (1995) concur, arguing that a profitable company is more likely to signal its
good performance to the market by disclosing more information in its annual report.
The empirical studies, however, provide mixed results. Singhvi and Desai (1971) and
Wallace et al. (1994) found a positive significant relationship between profitability
and disclosure, while others (McNally et al., 1982; Raffournier, 1995; Owusu-Ansah,
1998) found no significant relationship. Conversely, Wallace and Naser (1995), in
their study of the relationship between corporate characteristics and disclosure levels
for Hong Kong listed companies, found a significant negative relationship between
profitability and disclosure levels; that is, companies with lower profit margins tended
to disclose more. Wallace and Naser (1995) contend that the companies viewed the
lower profit results as bad news, and therefore to offset this, disclosed more
information in their annual reports. On balance, based upon the theoretical discussion
above and the preponderance of empirical studies suggesting such a relationship, the
third hypothesis tested in the study is:
H3: The extent of disclosure by companies complying with AASB 1047 is greater
for companies with higher profitability levels than those with lower profitability
levels.
11

2.1.4 Leverage and Disclosure
Several studies investigate the relationship between leverage (book value of debt to
shareholder’s equity or book value of debt to total assets) and disclosure, with the
general view that companies with a high level of leverage disclose more information
(Inchausti, 1997). The general agency relationship can also be applied to the
relationship between managers and debt providers. Debt providers may be concerned
about possible wealth transfers to shareholders; that is, managers are more likely to
favour the interests of shareholders to the detriment of the providers of debt (Francis
& Wilson, 1988). Ahmed (1996) suggests that the agency costs of debt are higher for
companies with more debt in their capital structure and these costs may be reduced by
an increased level of disclosure. While increased disclosure may not necessarily be
part of a contractual agreement, Wallace et al. (1994) reason that a company with a
higher gearing level has a greater obligation to satisfy the needs of its long-term
creditors for information and may therefore provide more information in its annual
reports than a more lowly geared company. Courtis (1979) found a significant
relationship between leverage and the level of disclosure; however, the evidence has
generally not supported this theory (e.g. Chow & Wong-Boren, 1987; Wallace et al.,
1994; Hossain & Adams, 1995; Raffournier, 1995; Wallace & Naser, 1995; Inchausti,
1997). A possible explanation for these findings might be that debt holders are in a
position to demand additional information other than that contained in the annual
report and are therefore not as reliant on the disclosures made in the annual report. As
these previous studies have considered different countries and utilised differing
methods, there is value in considering leverage in this study. Therefore, the following
hypothesis is tested in this study:
12

H4: The extent of disclosure made to comply with AASB 1047 is higher for
companies with a greater proportion of debt in their capital structure than those
with a lower proportion of debt.
2.1.5 Auditor Size and Disclosure
A number of studies test the relationship between audit firm size and the level of
disclosure. Wallace et al. (1994, p. 47), postulate that bigger accounting firms are
“backed by the expertise of the international firms to which they are affiliated” and
that a “theory of association” exists, suggesting that the contents of annual reports
“are not only audited but also influenced by auditors”. Firth (1979) contends that
although primary responsibility for preparing the annual report rests with the
company, the company’s auditors provide some advice or exercise influence
regarding the level of disclosure to make. The larger and better known the auditor, the
greater influence they may be able to exercise (Firth, 1979). Additionally, auditing
firms may use the information their clients disclose as a means of signalling their own
quality (Inchausti, 1997). Thus, companies represented by the big international
auditors are likely to provide more detail in their annual reports than companies that
are not (Wallace et al., 1994).
Further, the existence of a positive relationship between auditor size and disclosure
has been explained on the basis of agency costs. Francis and Wilson (1988) argue that
company size may proxy for agency costs since, in general, as a company’s size
increases so do its agency costs.
The results of prior studies investigating this relationship are not consistent. Some
studies have found the relationship between the level of disclosure and the size of the
audit firm to be significant and positive (e.g. Singhvi & Desai, 1971; McNally et al.,
1982; Ahmed & Nicholls, 1994; Raffournier, 1995), while no relationship has been
13
found in others (e.g. Firth, 1979; Wallace et al., 1994). In contrast Wallace and Naser
(1995) found a significantly negative relationship between level of mandatory
disclosure and audit firm size; that is, the larger the audit firm size, the lower the level
of disclosure. On the basis of the discussion above, and given that the weight of
empirical evidence suggests the possible existence of a positive relationship between
auditor size and disclosure, the hypothesis tested in this study is:
H5: The extent of disclosure made to comply with AASB 1047 is greater for
companies that employ a larger (Big Four) audit firm than those that employ a
smaller audit firm.
2.2 Quality of Disclosure
In the disclosure literature many expressions have been used to describe the quality of
disclosure. Singhvi and Desai (1971) use the term “adequate”, Owusu-Ansah (1998)
uses the term “extent”, Wallace et al. (1994) use “comprehensiveness” and Naser et al.
(2002) use “depth”. In most cases, however, “quality” of disclosure was only used in
the sense of measuring the number of items disclosed. Wallace et al. (1994) is one of
the few studies that investigates both the quantity and quality of disclosure, not just
whether the item is disclosed or not. Wallace et al. (1994) base the measurement of
quality on the depth of information; that is, on consideration of whether the disclosure
improves a user’s understanding of the financial statements. It is recognised that it is
difficult to define or offer an absolute measure of quality in relation to financial
accounting information. There are many ways to define the quality of narrative
accounting disclosures which suggests it is a complex, multifaceted concept (Beattie
et al., 2004). The measurement of quality is important in many fields of research (e.g.,
quality of life, quality of food, quality of service provision) and “the complex,
14
context-sensitive and subjective nature of the concept is apparent in all cases” (Beattie
et al., 2004, p. 229).
In this study quality is narrowly defined, drawing on a decision-usefulness perspective
of accounting (AARF, 1990, SAC 2 par. 26). That is, the aspect of quality that is
being investigated and measured in this study is the perceived informativeness of the
information disclosed. Further detail regarding the operationalising of this measure of
a quality score is detailed in Section 3.3.1.
Given the limited investigation of quality in any real sense in the prior literature, this
part of the study is exploratory and therefore caution should be exercised in
interpreting the results. On a priori grounds it is intuitive to suggest that the
relationship between the quality of disclosure and corporate size, profitability,
leverage and auditor will be in the same direction, and for similar reasons to those
proposed in the literature concerning the extent of disclosure, as already discussed in
this section. However, there is no reason to believe a priori that one industry will
have disclosure of a higher quality than another. Thus, the following exploratory
hypotheses are also tested in this study:
H6: The quality of disclosure by companies complying with AASB 1047 is
greater for larger companies than for smaller companies.
H7: The quality of disclosure by companies complying with AASB 1047 is
greater for companies with higher profitability levels than for those with lower
profitability levels.
H8: The quality of disclosure made to comply with AASB 1047 is higher for
companies with a greater proportion of debt in their capital structure than those
with a lower proportion of debt.
15
H9: The quality of disclosure made to comply with AASB 1047 is greater for
companies that employ a larger (Big Four) audit firm than those that employ a
smaller audit firm.
3. Research Design
3.1 Sample Selection
This study is concerned with company characteristics that may affect the quantity and
quality of disclosures made by Australian companies to comply with AASB 1047.
Thus, the relevant population of the study is all companies listed on the Australian
Stock Exchange (ASX) as at 31 December 2004 with balance dates on or between 30
June 2004 and 31 December 2004. A file of the companies listed on the ASX is
available as a download. When accessed on 19 July 2005 there were 1772 companies
listed on the ASX. A sample of 253 companies was selected by applying a simple
random number generator to the full list.2 Of the 253 companies initially selected 43
were excluded as they had not reported for the full year; as profitability is an
independent variable utilised in the study it is necessary for consistency to include
only companies that reported for the full year. A further 14 of the selected companies
were excluded on the basis that they were trusts, 12 on the basis that no GICS Sector
Code was applicable, and 14 were excluded as they had been suspended or delisted.
Five companies with negative equity were excluded, and a further eight companies
had not yet been given a GICS classification. Five companies reported using
international accounting standards, and two did not report between the dates covered
by the requirements of AASB 1047. Thus, exclusion of these 103 companies reduced
the sample from 253 to the final 150 companies included in the study.
2 A minimum final sample size of 150 was desired, requiring a total of 253 companies to be selected (including those companies removed from the sample as outlined subsequently). The number of observations in each sector is detailed in Table 2.
16

3.2 Data Source
The disclosures made to comply with AASB 1047 will be in narrative form in the
notes accompanying companies’ financial reports. Thus, data were collected from the
annual reports of the companies in the sample and all of the reports were accessed
from the Connect 4 Database.
3.3 Measurement of the Variables
3.3.1 Dependent Variable
The dependent variable in this study is the extent and quality of disclosures made by
companies in complying with AASB 1047. As discussed previously, AASB 1047
specifies that disclosure must be made, but the extent and quality of the disclosure
varies widely among the companies in the sample. Thus, the study focuses on one
mandatory disclosure item and seeks to measure the extent and quality of that
disclosure. Unlike Jubb’s (2005) study which counts the number of words disclosed
by companies complying with AASB 1047, the analysis in the current study considers
the total extent of disclosures as well as the quality of disclosures; that is, inferences
are drawn from what companies have disclosed in their notes. Gray et al. (1995, p.
84), discussing the appropriateness of different units of analysis, note that
“[s]entences are preferred if one is seeking to infer meaning”. Thus, the unit of
analysis for this study is sentences with the total number of sentences giving the
extent of disclosure concerning the adoption of AIFRS by each company in the study.
Each sentence was given a ‘qualitative’ score, based upon a decision usefulness
framework referred to in Section 2.2. The qualitative score rewards the quality
(informativeness) of each sentence. Each sentence was treated separately; however,
the sentences were read in their context. Scores were awarded from ‘0’ to ‘5’ based on
a scale where the greater the specificity of the information, the more useful it is
17
deemed to be and therefore of greater quality.3 The rating scheme employed in this
study is outlined in Table 1.4
INSERT TABLE 1 ABOUT HERE
Having completed the rating of sentences, the qualitative score for each company is
then totalled. The qualitative score for each company is divided by the number of
sentences to give a ratio that measures the average quality score per sentence.
3.3.2 Independent Variables
3.3.2.1 Corporate Size
Prior studies have adopted different measures of corporate size; however, Ahmed and
Nicholls (1994, p. 65) state “there is no overriding theoretical reason to select one
variable rather than another”. The current study uses total assets, the most frequently
adopted measure of corporate size.5
3.3.2.2 Industry
The 150 companies included in the study are classified according to Sector, being the
broadest classification, to avoid the problem of sparse cells. A Chi-square test was
conducted to ensure the sample was representative of the population. The results
indicate there is no statistical difference between the sample and population with
respect to industry classification (Chi-square statistic = 5.5565, p = 0.783). Jubb
(2005) and Ernst & Young (2005), in surveying corporate disclosures in relation to
AASB 1047, also use the GICS two-digit industry sector as a basis for their analysis.
Table 2 details the Industry Sectors represented in the study and the number of
companies in the sample falling into each. As the industry variable is categorical the
3 A similar (four point) scale is used by Clarkson et al. (2003) when considering companies’ voluntary disclosures concerning the year 2000 systems issue. 4 The coding rules and the coding of a sample of 10 companies were reviewed by two independent accounting researchers. 5 Size has also been measured as net sales (e.g. Cooke, 1989) and market capitalisation (e.g. Chow & Wong-Boren, 1987).
18
use of dummy variables is employed in the regression analysis, with the Energy sector
used as the reference group.
INSERT TABLE 2 ABOUT HERE
3.3.2.3 Profitability
The relationship between the profitability of a company and disclosure has been tested
in a number of studies (e.g. Cerf, 1961; Wallace et al., 1994; Raffournier, 1995;
Wallace & Naser, 1995; Inchausti, 1997; Owusu-Ansah, 1998). The measures of
profitability used most often in these studies are Return on Equity (ROE) and Return
on Assets (ROA). Both these measures are utilised in the current study.
3.3.2.4 Leverage
Debt to Assets and Debt to Equity are two measures that have been used as the
independent variable in studies that investigate the relationship between leverage and
disclosure. Again, both these measures are utilised in this study.
3.3.2.4 Auditor
The relationship between the size of a company’s auditor and disclosure has been
tested in prior studies. Auditor is classified as being either a member of the “Big
Four” (Deloitte Touche Tohmatsu, Ernst & Young, PricewaterhouseCoopers, KPMG),
or “Other”. A dummy variable (0,1) is used in the regression analysis where the
dummy variable takes the value of 1 if the company is audited by one of the “Big
Four” firms.
3.4 Statistical Tests
Both univariate and multivariate methods are used to test the hypotheses developed
above. The distributional characteristics of the data, discussed in the next section,
suggest that nonparametric univariate tests are appropriate. Spearman rank correlation
coefficients are used to investigate the relationship between the non-categorical
19

explanatory variables, while Mann-Whitney U tests are used for the categorical
independent variables. Further, Kruskal-Wallis one-way analysis of variance is
conducted to test differences in the medians of the dependent variables for companies
audited by different accounting firms and companies in different industry sectors. The
multivariate test used in this study is standard multiple regression.
4. Results
4.1 AASB Accounting Standard Disclosures in Annual Reports
Table 3 reports the number of sentences devoted to each of the AASB Accounting
Standards that are mentioned by companies in their disclosures made to comply with
AASB 1047, broken down by their GICS two-digit industry sector codes. The table
reveals that the 150 companies making up the sample used in this study devoted 2,956
sentences to disclosures relating to specific accounting standards. Table 4 summarises
the accounting standards to which companies devote at least 200 sentences, which
together make up 74 per cent of the total number of sentences.
INSERT TABLE 3 ABOUT HERE
INSERT TABLE 4 ABOUT HERE
These results are similar to those reported by Ernst & Young (2005) and Jubb (2005),
who found the same five accounting issues were the most frequently cited, the only
difference being AASB 139 and AASB 2 were reversed in order of frequency.
Not surprisingly the standard for the Extractive Industries (AASB 6, Exploration for
and Evaluation of Mineral Resources) is among the main issues for the Energy and
Materials sectors as AASB 6 is likely to apply predominately to companies within
these sectors. Additionally, AASB 137, Provisions, Contingent Liabilities and
Contingent Assets, is also an important issue for the Energy and Material sectors as it
addresses the requirements for restoration and decommissioning costs.
20

For the Industrials, Consumer Discretionary and Consumer Staples sectors, the five
main standards remain the same as for the overall sample, but in differing orders of
frequency. Health Care, Financials, Information Technology, and Utilities likewise
deal with the same standards, with the exception of AASB 3, Business Combinations,
which is replaced in the ranking of importance by AASB 138, Intangible Assets for
these sectors. Not surprisingly, AASB 139, Financial Instruments: Recognition and
Measurement, ranks as the most significant for the Financials sector and AASB 136,
Impairment of Assets ranks first in importance for the Utility sector.
These results are similar to those of Jubb (2005, p. 6) and are “consistent with what
could be expected given the characteristics of specific industries”.
4.2 Descriptive Statistics
Table 5 contains the descriptive statistics for the dependent variables (Part A) and the
non-categorical independent variables (Part B) defined in the previous section.
INSERT TABLE 5 ABOUT HERE
The skewness and kurtosis coefficients of all the variables included in Table 5
indicate departures from normality, with the exception of Debt to Assets, which is
only slightly positively skewed.6 Additionally, the Kolmogorov-Smirnov one-sample
test statistics for all of the variables, apart from Debt to Assets, are all significant,
suggesting violation of the assumption of normality. The results of the univariate tests
will not be affected by non-normality of the variables as nonparametric tests are used.
However, in order to bring the variables closer to normality for the purpose of the
regression analysis transformation of the variables was undertaken. Tabachnick and
Fidell (2001) suggest that consideration should be given to transformation of variables
6 Foster (1986) suggests that a benchmark for suspecting positive and negative skewness is a skewness coefficient of greater than 0.50 or less than -0.50 respectively. Likewise, Foster (1986) suggests that a kurtosis coefficient of greater than 1.0 or less than -1.0 indicate a violation from normality.
21
in all situations unless there is some valid reason not to; for example, difficulty of
interpretation of the transformed variables. Many of the disclosure studies considered
in this study have applied logarithmic and square root transformations to the variables
of interest (e.g. Ahmed & Nicholls, 1994; Wallace et al., 1994; Hossain & Adams,
1995; Raffournier, 1995; Ahmed, 1996). Cohen and Cohen (1983) suggest that there
may be more than one transformation that will assist in correcting for failure of the
assumption of normality. In this study each variable was transformed using square
root (SR) and log transformations (LN) and negatively skewed variables were
reflected before calculation of their inverse (RI).7 The transformed variable with the
distribution that was closest to normal was selected for inclusion in the parametric
tests, with the exception of the dependent variable Quality. None of the
transformations reduced the skewness or kurtosis of the dependent variable Quality,
hence the raw data, which do not display a severe departure from normality, are used
for that variable. Table 6 contains the descriptive statistics for the transformed
variables, where the first two characters SR indicates the square root transformation,
LN the natural logarithmic transformation and RI the reflect and inverse
transformation.
INSERT TABLE 6 ABOUT HERE
As can be seen from Table 6 the departures from normality, reflected in the skewness
and kurtosis coefficients, is less for all of the transformed variables than for the
corresponding raw variables, except for SR_Debt to Assets, where the skewness
coefficient has decreased but the kurtosis coefficient has increased over that of the
7 A variable is reflected by finding the largest score in the distribution and adding one to it to form a constant that is larger than any score in the distribution. A new variable is then created by subtracting each score from the constant. Thus, a variable with negative skewness is converted to one with positive skewness before transformation (Tabachnick & Fidell, 2001). The reflection of a variable normally requires that the interpretation of it be reversed, or the variable re-reflected after transformation (Tabachnick & Fidell, 2001). However, calculating the inverse of the variables after reflecting itself acts as a reflection, so no reversal of interpretation is required.
22

raw variable. For most of the transformed variables, with the exceptions of SR_Extent
and LN_Debt to Equity, some departure from normality is still evident. However,
applying a 0.05 level of significance in the Kolmogorov-Smirnov tests, the only
variables for which the null hypothesis of normality is rejected is SR_Debt to Assets
and RI_Return on Assets, which have probability levels associated with them of 0.037
and 0.043 respectively.
4.3 Univariate Tests
Correlation analysis was utilised to test the relationship between the dependent
variables and the non-categorical independent variables. Table 7 shows the relevant
Spearman rank correlation coefficients.8
INSERT TABLE 7 ABOUT HERE
As can be seen from the first column of the table the correlation coefficients between
Extent and the independent variables are significant9 at the indicated levels10, are all
positive, and of the hypothesised sign. Using Cohen’s (1988) guidelines, the
correlation between Extent and Assets is medium, but small for the other non-
categorical variables. It therefore appears that some support for hypothesis 1 is
provided by this test, that larger companies disclose more information. The test
appears to provide limited support for hypotheses 3 and 4, that more profitable
companies and companies with more debt in their structure disclose more
information.
While the dependent variable Extent measures the amount of disclosure, the
dependent variable Quality is the total informativeness score awarded to each
company divided by the number of sentences. This gives a measure of quality per 8 Pearson product moment correlations were also determined using the transformed data with similar results to the non-parametric tests. 9 Cohen (1988) suggests that correlations of 0.10 to 0.29 are small, 0.30 to 0.49 are medium and 0.50 to 1.0 are large. 10 Probability values of 0.050 or better are regarded as significant for the purpose of this study.
23

sentence for each company. Table 7 also contains the Spearman rank correlation
coefficients for the dependent variable Quality and the independent variables included
in this study. As can be seen from the second column of the table there is only small
support (using Cohen’s (1988) guidelines) for hypothesis 6, that larger companies
have a greater quality score. The correlation coefficients do not support the other
hypotheses relating to the expected relationship between the dependent variable
Quality and the explanatory variables included in the table. While being of the
hypothesised sign, none of the other correlation coefficients are significant.
The relationship between the dependent variables and the categorical explanatory
variable Auditor was investigated using the non-parametric Mann-Whitney test. The
results of the Mann-Whitney tests are presented in Table 8. The results of the Mann-
Whitney U test indicate that there is a statistically significant difference in both Extent
and Quality of disclosure between companies audited by ‘Big 4’ auditors and those
audited by ‘others’; that is, the test provides evidence to support hypotheses 5 and 9,
that on average, companies audited by bigger auditors have higher Extent and Quality
scores.11
INSERT TABLE 8 ABOUT HERE
The relationship between the dependent variables and the categorical explanatory
variable Industry was investigated using the Kruskal-Wallis test, which is similar in
nature to the Mann-Whitney U test but allows comparison of scores on a continuous
variable for more than two groups. The results of the Kruskal-Wallis tests are
presented in Table 9. The results of the Kruskal-Wallis tests indicate that it is not
possible to reject the null hypothesis of no difference in the extent of information
disclosed across the different industry sectors; that is, the evidence does not support
11 Similar results were achieved using the transformed data and the Independent-samples t-test.
24
hypothesis 2, that the extent of disclosure will be different for companies in different
industries. 12 As outlined previously, no hypothesis was developed regarding the
quality of disclosure and industry, as there is no basis to believe that quality scores
will be different between industries.
INSERT TABLE 9 ABOUT HERE
4.4 Multivariate Tests
Multiple regression analysis was used for multivariate testing of the hypotheses. Each
of the dependent variables, SR_Extent of disclosure and Quality, was regressed
against the transformed independent variables LN_Assets, RI_Return on Assets and
SR_Debt to Assets. The dummy variable for Auditor and dummy variables for
Industry Sector were also included. The results of these regressions are reported in
Table 10.13
INSERT TABLE 10 ABOUT HERE
4.4.1 SR_Extent
The multiple regression model is highly significant (p ≤ 0.001)14. The coefficient of
determination (R2) indicates that 35.3% of the variation in the dependent variable is
explained by variation in the independent variables. The computed R2 statistic
indicates that the explanatory power of the model is moderate, but is similar to those
reported in the other disclosure studies, which range from 35.6% (Hossain & Adams,
1995) to 67.8% (Alsaeed, 2005). The coefficients for Auditor and SR_Debt to Assets
are statistically significant (p ≤ 0.001 and p ≤ 0.05), while the significance of the
12 The parametric alternative One-way between groups analysis of variance (ANOVA) was conducted, with the results being consistent with the Kruskal-Wallis tests. 13 Both models utilise the variable RI_Return on Assets as the measure of profitability and SR_Debt to Assets as the measure of leverage. The regressions on both of the dependent variables were re-estimated using the alternative measure for profitability of RI_Return on Equity and the alternative measure for leverage of LN_Debt to Equity. The results of these additional tests were not different in any significant way from the results reported in Table 8. 14 Both regression models reported were tested for heteroscedasticity and multicolliniarity. Neither was found to be a significant factor affecting the reliability of the results.
25
coefficient for LN_Assets is close to acceptance (p ≤ 0.059). Of the two statistically
significant variables, Auditor (beta = 0.403) is making the strongest unique
contribution to explaining the dependent variable, when the variance explained by all
other variables in the model is controlled for (compared to SR_Debt to Assets with a
beta of 0.191). Examination of the Partial correlation coefficients reveals R2 would
decrease by 12.39% if auditor was not included in the model (SR_Debt to Assets
1.87%). The results provide some evidence to support hypotheses 4 and 5, that
companies with more debt in their capital structures and those audited by bigger
auditors disclose more information.
4.4.2 Quality
Of the explanatory variables, only Auditor is significant, consistent with the
univariate results presented in Section 4.2 (beta = 0.195), providing some support for
hypothesis 9; that is, the quality of disclosure is greater for companies audited by a
Big Four audit firm than those that employ a smaller audit firm. In addition, the
values of R2 and the F statistic for the model indicate that it has low explanatory
power.
5. Conclusions
The application of Positive Accounting Theory suggests, amongst other things, that in
order to reduce agency and political costs the extent of disclosure by companies
complying with the requirements of AASB 1047 will be greater for larger companies,
more profitable companies and companies with more debt in their capital structure. In
addition, a range of researchers have suggested an important role for the auditor in
determining the extent of disclosure. On a priori grounds the study also suggested that
the quality of disclosure by companies complying with the requirements of AASB
26
1047 would be greater for larger companies, more profitable companies, companies
with more debt in their capital structure and companies audited by larger audit firms.
The results of this study indicate that consistent with prior studies, size, profitability
and leverage are all associated with higher levels of the extent of disclosure and size
and profitability with the quality of disclosure. However, in this study, the size of a
company’s auditor provides the largest contribution to the extent and quality of
disclosure made to comply with the requirements of AASB 1047. This suggests that
many companies may have relied extensively, if not solely, on example disclosures
provided by their auditors as a means of meeting the requirements of AASB 1047.
This is a view shared by the National Institute of Accountants (NIA), who state that
there is “evidence that accountants in companies or accounting firms misunderstand
the purpose of the disclosures relating to the impact of new standards and are seeking
fast-track solutions for a compliance issue that has been in existence for almost three
years”; that is, companies have reproduced sample disclosures provided by
accounting firms (NIA, 2005, p.1). It is generally accepted that accounting firms, and
particularly the Big 4 firms, develop so called ‘boilerplate’ disclosures for clients to
adopt in response to major new or amended disclosure requirements (Maiden, 2002).
If this is the case, the disclosures made by companies to comply with AASB 1047
may not provide an accurate reflection of the impact of adopting AIFRS upon them,
or their preparedness for adoption. Rather the disclosures may, at least in part, reflect
what the audit firm perceives as the areas where impacts are likely to be greatest and
the minimum required to garner ASIC’s acceptance. The danger of this practice is that
companies may not fully comprehend the requirements of AIFRS or have fully
investigated the impact upon the company, potentially leading to problems when
adoption occurs. Additionally, some disclosures that have simply been reproduced
27
may be irrelevant to the circumstances of the company (NIA, 2005). These factors
could result in the users of financial reports, including the shareholders, being misled
(NIA, 2005).
Alternatively, as discussed in Section 2.1.5, Wallace et al. (1994) and Firth (1979)
indicate that the contents of annual reports are influenced by auditors and the larger
and better known the auditor the greater influence they may be able to exercise.
Further, auditing firms may use the information their clients disclose as a means of
signalling their quality (Inchausti, 1997). Thus, larger audit firms may be seen to have
greater authority and be in a position to enforce the extent and quality of disclosure
than smaller audit firms. Boilerplate disclosures may then be a logical and economic
means of dealing with the significant uncertainty associated with estimating the
impact of first time adoption of AIFRS.
A further and related implication arising from the study, directed to the operations of
the standard setting bodies (in this case the AASB), is that the ultimate usefulness of
broad but imprecise standards, such as AASB 1047, needs to be examined. The results
of the study indicate that where the requirements of such a standard are broad and
open to interpretation, companies may be tempted to use ‘boilerplate’ disclosures or
be inclined to disclose the minimum amount to meet the requirements of the standard
and satisfy regulators. Thus, the information provided may be of doubtful value to
financial statement users; that is, it may not provide relevant and reliable information
which is of assistance in the decision making of users.
Further, it appears that smaller companies may require more guidance and assistance
with their preparations for the adoption of AIFRS. The evidence showing smaller
companies provide less, and perhaps lower quality disclosure, concerning their level
of preparedness may be an indication that they are ill prepared to meet the
28
approaching adoption date, from which associated negative consequences will flow.
Smaller companies have fewer resources at their disposal to meet the additional cost
of compliance imposed by the impending adoption of AIFRS, and will therefore find
it most difficult to cope with the demands of Australia’s new accounting regulations.
The results and implications of the present study are subject to some limitations. First,
the creation of a disclosure index requiring the awarding of a quality score to each
sentence, as detailed in Section 3.3.1, involves a level of subjectivity. However, as
outlined, actions were taken to overcome this problem.
Second, as Section 3.1 details, the number of companies in the sample does not allow
the companies to be classified into a more specific classification than the ten GICS
industry sectors. The results of the study indicate there is no difference in the extent of
disclosure across the industry sectors. It is possible that a different conclusion would
be reached if the sample were sufficiently large to allow classification of companies
into more specific categories. For example, the GICS has an ‘Industry Group’
classification with 24 categories, an ‘Industry’ classification with 65 categories and a
‘Sub-Industry’ classification with 146 categories. Such classification was not possible
due to the sample size utilitsed in the current study.
A further possible limitation relates to having only included listed companies in the
study sample. A more rigorous design would include unlisted companies and Not-For-
Profit organisations, as some entities within these groups are defined as a reporting
entity and thus compelled to comply with the requirements of AASB 1047.
A fourth possible limitation to the study is that companies may have disclosed
impacts of the adoption of AIRFS outside of the annual report. For example, the Chief
Financial Officers of both Santos (2005) and Telstra (2005) have made detailed
presentations on the transition to AIFRSs which are available from the respective
29

company’s websites. It is possible that more detailed and higher quality, disclosures
may be provided in such locations.
A number of potential areas for future research arise from this study. One direction
for future research, suggested by the discussion of the limitations of the research in
the previous section, would be to undertake further investigation of the research
question utilising a larger sample. This would allow industry to be classified into
more specific categories than the ten sectors used in the current study.
A further direction for future research involves extending the study to make it
longitudinal in nature. In particular, such an extension would involve examination of
the sample companies’ first full year annual report prepared under AIFRS. This would
enable a comparison of actual reported impacts of the adoption of AIFRS with the
anticipated impacts disclosed to comply with the requirements of AASB 1047. This
research would enable an assessment of the accuracy of the pre-AIFRS disclosures,
and would allow further consideration of the actual informativeness of the AASB
1047 disclosures.
An additional direction for future research would be to investigate more fully whether
so-called boilerplate disclosures were in fact adopted by companies to comply with
the requirements of AASB 1047. The ‘Big 4’ auditors all have sample disclosures
available to companies, either free of charge or at cost. Companies’ annual report
disclosures could be compared with the templates provided by auditors.
Further, consideration could be given to the disclosures made concerning the
transition to AIFRS via means other than the annual report. This would reveal
whether companies made more extensive and informative disclosures on the transition
to AIFRS as the transition date neared, which in many cases may have been some
months after the annual report analysed in this study was prepared. This extra time
30
may have enabled companies to arrive at a more comprehensive understanding of the
impact of adoption of AIFRS upon them.
A final direction for future research is to investigate the actual impact of the
requirements of specific standards on companies. This investigation would
particularly focus on those standards that have been identified in Section 4.1 as
potentially impacting most broadly across the sample and those that are identified as
having the largest potential impact on the reported profits and retained earnings of
companies. This research would provide more detailed insights into the results of the
current study.
31
REFERENCES
Ahmed, K., 1996, "Disclosure Policy Choice and Corporate Characteristics: A Study of Bangladesh", Asia Pacific Journal of Accounting, vol. 3, no. 1, pp. 183-203.
Ahmed, K., and Courtis, J.K., 1999, "Associations between Corporate Characteristics and Disclosure Levels in Annual Reports: A Meta-Analysis", The British Accounting Review, vol. 31, no. 1, pp. 35-61.
Ahmed, K., and Nicholls, D., 1994, "The Impact of Non-Financial Company Characteristics on Mandatory Disclosure Compliance in Developing Countries: The Case of Bangladesh", The International Journal of Accounting, vol. 29, no. 1, pp. 62.
Alsaeed, K., 2005, "The Association between Firm-Specific Characteristics and Disclosure: The Case of Saudi Arabia", Journal of American Academy of Business, Cambridge, vol. 7, no. 1, pp. 310.
Australian Accounting Research Foundation (AARF), 1990, Statement of Accounting Concept SAC 2 Objective of General Purpose Financial Reporting, AARF, Melbourne
Australian Accounting Standards Board (AASB), 2004, AASB 2, Share Based Payments, AASB, Melbourne.
Australian Accounting Standards Board (AASB), 2004, AASB 3, Business Combinations, AASB, Melbourne.
Australian Accounting Standards Board (AASB), 2004, AASB 6, Exploration for and Evaluation of Mineral Resources, AASB, Melbourne.
Australian Accounting Standards Board (AASB), 2004, AASB 101, Presentation of Financial Statements, AASB, Melbourne.
Australian Accounting Standards Board (AASB), 2004, AASB 108, Accounting Policies, Changes in Accounting Estimates and Errors, AASB, Melbourne.
Australian Accounting Standards Board (AASB), 2004, AASB 112, Income Taxes, AASB, Melbourne.
Australian Accounting Standards Board (AASB), 2004, AASB 116, Property, Plant and Equipment, AASB, Melbourne.
Australian Accounting Standards Board (AASB), 2004, AASB 117, Leases, AASB, Melbourne.
Australian Accounting Standards Board (AASB), 2004, AASB 118, Revenue, AASB, Melbourne.
32

Australian Accounting Standards Board (AASB), 2004, AASB 119, Employee Benefits, AASB, Melbourne.
Australian Accounting Standards Board (AASB), 2004, AASB 120, Accounting for Government Grants and Disclosure of Government Assistance, AASB, Melbourne.
Australian Accounting Standards Board (AASB), 2004, AASB 121, The Effects of Changes in Foreign Exchange Rates, AASB, Melbourne.
Australian Accounting Standards Board (AASB), 2004, AASB 127, Consolidated and Separate Financial Statements, AASB, Melbourne.
Australian Accounting Standards Board (AASB), 2004, AASB 128, Investments in Associates, AASB, Melbourne.
Australian Accounting Standards Board (AASB), 2004, AASB 131, Interests in Joint Ventures, AASB, Melbourne.
Australian Accounting Standards Board (AASB), 2004, AASB 132, Financial Instruments: Disclosure and Presentation, AASB, Melbourne.
Australian Accounting Standards Board (AASB), 2004, AASB 136, Impairment of Assets, AASB, Melbourne.
Australian Accounting Standards Board (AASB), 2004, AASB 137, Provisions, Contingent Liabilities and Contingent Assets, AASB, Melbourne.
Australian Accounting Standards Board (AASB), 2004, AASB 138, Intangible Assets, AASB, Melbourne.
Australian Accounting Standards Board (AASB), 2004, AASB 139, Financial Instruments: Recognition and Measurement, AASB, Melbourne.
Australian Accounting Standards Board (AASB), 2004, AASB 140, Investment Property, AASB, Melbourne.
Australian Accounting Standards Board (AASB), 2004, AASB 1047, Disclosing the Impacts of Adopting Australian Equivalents to International Financial Reporting Standards, AASB, Melbourne.
Australian Securities and Investments Commission (ASIC), 2006, Australian Companies on Track with Smooth AIFRS Transition [Online], available: http:www.asic.gov.au/asic/ASIC_PUB.NSF/print/06-012+Australian+companies+on +track+with+smooth+AIFRS+transition?opendocument [accessed 30 January 2006].
33
Australian Stock Exchange (ASX), 2005, What is GICS? [Online], available: http://www.asx.com.au/research/pdf/GICSStructure.pdf [accessed 23 August 2005]
Beattie, V., 2005, “Moving the Financial Accounting Research Front Forward: the UK Contribution”, The British Accounting Review, vol. 37, no. 1, pp. 85-114.
Beattie, V., McInnes, B., and Fearnley, S., 2004, "A Methodology for Analysing and Evaluating Narratives in Annual Reports: A Comprehensive Descriptive Profile and Metrics for Disclosure Quality Attributes", Accounting Forum, vol. 28, no. 3, pp. 205-236.
Buzby, S.L., 1975, "Company Size, Listed Versus Unlisted Stocks, and the Extent of Financial Disclosure", Journal of Accounting Research, vol. 13, no. 1, pp. 16-37.
Cerf, A.R., 1961, Corporate Reporting and Investment Decisions, Public Accounting Research Program, California.
Chow, C.W., and Wong-Boren, A., 1987, "Voluntary Financial Disclosure by Mexican Corporations", The Accounting Review, vol. 62, no. 3, pp. 533-541.
Clarkson, P.M., Ferguson, C. and Hall, J., 2003, ‘Auditor Conservatism and Voluntary Disclosure: Evidence from the Year 2000 Systems Issue’, Accounting and Finance, vol. 43, no.1, pp. 21-40.
Cohen, J., and Cohen, P., 1983, Applied Multiple Regression/Correlation Analysis for the Behavioural Sciences, 2 ed., Lawrence Erlbaum, Hillsdale.
Cohen, J.W., 1988, Statistical Power Analysis for the Behavioural Sciences, 2 ed., Lawrence Erlbaum Associates, Hillsdale, NJ.
Cooke, T.E., 1989, "Disclosure in the Corporate Annual Reports of Swedish Companies", Accounting and Business Research, vol. 19, no. 74, pp. 113.
Cooke, T.E., 1992, "The Impact of Size, Stock Market Listing and Industry Type on Disclosure in the Annual Reports of Japanese Listed Corporations", Accounting and Business Research, vol. 22, no. 87, pp. 229.
Cooke, T.E., 1993, "Disclosure in Japanese Corporate Annual Reports", Journal of Business Finance & Accounting, vol. 20, no. 4, pp. 521-535.
Courtis, J.K., (1979), Annual Report Disclosure in New Zealand: Analysis of Selected Corporate Attributes, Research Study 8, University of New England, Armidale, Australia.
Davies, R., and Kelly, G., 1979, "The Quality of Annual Report Disclosure in Australia and Its Relationship to Corporate Size", Management Forum, vol. 5, no. 4, pp. 259-273.
34

Ernst & Young, 2005, The Impacts of AIFRS on Australian Companies [Online],
available: http://www.ey.com/global/download.nsf/Australia/AABS_-_TCG_Report/$file/TCG_8-12-05.pdf [accessed 6 January 2006]
Financial Reporting Council (FRC), 2002, Bulletin 2002/4 Adoption of International Accounting Standards by 2005, 3 July [Online], available: http://www.frc.gov. au/bulletins/2002/04.asp [Accessed 22 Aug 2005].
Firth, M., 1979, "The Impact of Size, Stock Market Listing and Auditors on Voluntary Disclosure in Corporate Annual Reports", Accounting and Business Research, vol. 9, no. 36, pp. 273-280.
Foster, G., 1986, Financial Statement Analysis, 2 ed., Prentice-Hall, Englewood Cliffs, New Jersey.
Francis, J.R., and Wilson, E.R., 1988, "Auditor Changes: A Joint Test of Theories Relating to Agency Costs and Auditor Differentiation", The Accounting Review, vol. 63, no. 4, pp. 663-682.
Gray, R., Kouhy, R., and Lavers, S., 1995, "Methodological Themes: Constructing a Research Database of Social and Environmental Reporting by UK Companies", Accounting, Auditing & Accountability Journal, vol. 8, no. 2, pp. 78-101.
Hossain, M., and Adams, M., 1995, "Voluntary Financial Disclosure by Australian Listed Companies", Australian Accounting Review, vol. 5, no. 2, pp. 45-55.
Inchausti, B.G., 1997, "The Influence of Company Characterisitics and Accounting Regulation on Information Disclosed by Spanish Firms", The European Accounting Review, vol. 6, no. 1, pp. 45-68.
Jensen, M.C., and Meckling, W.H., 1976, "Theory of the Firm: Managerial Behaviour, Agency Costs and Ownership Structure", Journal of Financial Economics, vol.3 no.3, pp. 305-360.
Jubb, C., 2005, “Transition to IFRS: Listed Companies’ Expected Accounting Policy Impacts as Revealed by AASB 1047 Disclosures”, On behalf of the Institute of Chartered Accountants in Australia, [Online] available: http://www.icaa.org.au/upload/download/AEIFRStudy2.pdf. [accessed 14 August 2005].
Maiden, M., 2002, ‘Auditing the Auditors’, The Age, 20 April 2002 [Online] available: http://www.theage.com.au/articles/2002/04/19/1019020708257.html [accessed 01 November 2005].
McNally, G.M., Eng, L.H., and Hasseldine, C.R., 1982, "Corporate Financial Reporting in New Zealand: An Analysis of User Preferences, Corporate Characteristics and Disclosure Practices for Discretionary Information", Accounting and Business Research, vol. 13, no. 49, pp. 11-20.
35

Naser, K., Al-Khatib, K., and Karbhari, Y., 2002, "Empirical Evidence on the Depth of Corporate Information Disclosure in Developing Countries: The Case of Jordan", International Journal of Commerce and Management, vol. 12, no. 3 & 4, pp. 122-155.
National Institute of Accountants (NIA), 2005, Example Disclosures a ‘Health Hazard’ [Online] available: http://www.nia.com.au/publications/pdf/ A00014975.pdf [accessed 01 November 2005].
Owusu-Ansah, S., 1998, "The Impact of Corporate Attributes on the Extent of Mandatory Disclosure and Reporting by Listed Companies in Zimbabwe", The International Journal of Accounting, vol. 33, no. 5, pp. 605.
Raffournier, B., 1995, "The Determinants of Voluntary Financial Disclosure by Swiss Listed Companies", The European Accounting Review, vol. 4, no. 2, pp. 261-280.
Santos Limited, 2005, Transition to A-IFRS [Online], available: http://www.santos. com/FileGroup/library/IFRS_Investor%20Briefing_Presentation_2005.pdf [accessed 2 November 2005].
Singhvi, S.S., and Desai, H.B., 1971, "An Empirical Analysis of the Quality of Corporate Financial Disclosure", The Accounting Review, vol. 46, no. 1, pp. 129-138.
Tabachnick, B., and Fidell, L., 2001, Using Multivariate Statistics, 4 ed., Allyn and Bacon, Boston.
Telstra Corporation Limited, 2005, Transition to A-IFRS [Online], available: http:// www.telstra.com.au/abouttelstra/investor/docs/ifrs_final_presentation.pdf [accessed 2 November 2005].
Wallace, R.S.O., and Naser, K., 1995, "Firm-Specific Determinants of the Comprehensiveness of Mandatory Disclosure in the Corporate Annual Reports of Firms Listed on the Stock Exchange of Hong Kong", Journal of Accounting and Public Policy, vol. 14, no. 4, pp. 311-368.
Wallace, R.S.O., Naser, K., and Mora, A., 1994, "The Relationship between the Comprehensiveness of Corporate Annual Reports and Firm Characteristics in Spain", Accounting and Business Research, vol. 25, no. 97, pp. 41-53.
Watts, R.L., and Zimmerman, J.L., 1986, Positive Accounting Theory, Prentice Hall International, Englewood Cliffs, New Jersey.
36
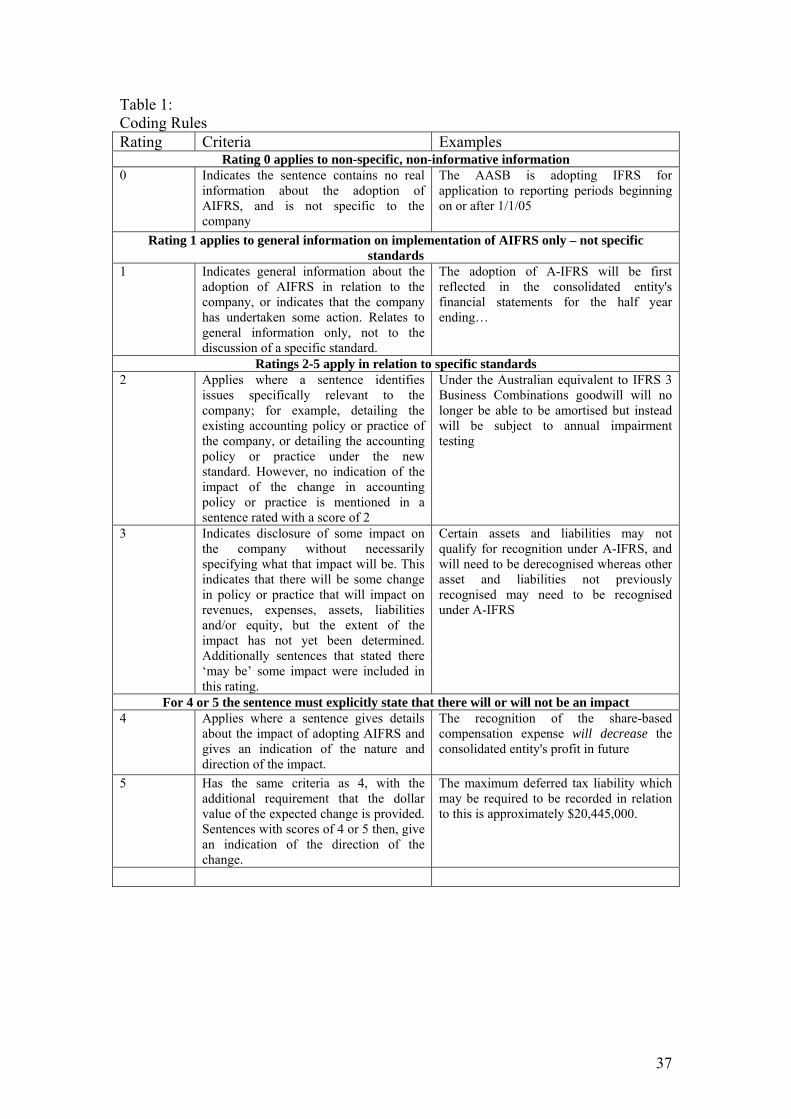
Table 1: Coding Rules Rating Criteria Examples
Rating 0 applies to non-specific, non-informative information 0 Indicates the sentence contains no real
information about the adoption of AIFRS, and is not specific to the company
The AASB is adopting IFRS for application to reporting periods beginning on or after 1/1/05
Rating 1 applies to general information on implementation of AIFRS only – not specific standards
1 Indicates general information about the adoption of AIFRS in relation to the company, or indicates that the company has undertaken some action. Relates to general information only, not to the discussion of a specific standard.
The adoption of A-IFRS will be first reflected in the consolidated entity's financial statements for the half year ending…
Ratings 2-5 apply in relation to specific standards 2 Applies where a sentence identifies
issues specifically relevant to the company; for example, detailing the existing accounting policy or practice of the company, or detailing the accounting policy or practice under the new standard. However, no indication of the impact of the change in accounting policy or practice is mentioned in a sentence rated with a score of 2
Under the Australian equivalent to IFRS 3 Business Combinations goodwill will no longer be able to be amortised but instead will be subject to annual impairment testing
3 Indicates disclosure of some impact on the company without necessarily specifying what that impact will be. This indicates that there will be some change in policy or practice that will impact on revenues, expenses, assets, liabilities and/or equity, but the extent of the impact has not yet been determined. Additionally sentences that stated there ‘may be’ some impact were included in this rating.
Certain assets and liabilities may not qualify for recognition under A-IFRS, and will need to be derecognised whereas other asset and liabilities not previously recognised may need to be recognised under A-IFRS
For 4 or 5 the sentence must explicitly state that there will or will not be an impact 4 Applies where a sentence gives details
about the impact of adopting AIFRS and gives an indication of the nature and direction of the impact.
The recognition of the share-based compensation expense will decrease the consolidated entity's profit in future
5 Has the same criteria as 4, with the additional requirement that the dollar value of the expected change is provided. Sentences with scores of 4 or 5 then, give an indication of the direction of the change.
The maximum deferred tax liability which may be required to be recorded in relation to this is approximately $20,445,000.
37
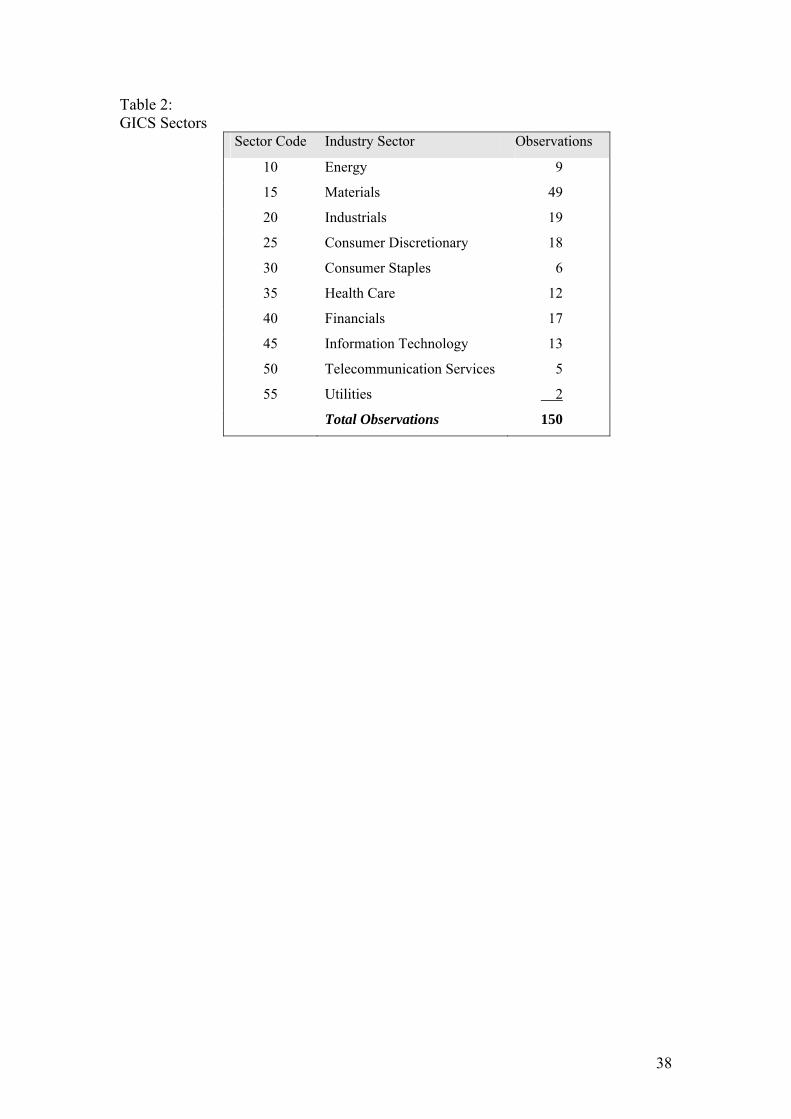
Table 2: GICS Sectors
Sector Code Industry Sector Observations
10 Energy 9
15 Materials 49
20 Industrials 19
25 Consumer Discretionary 18
30 Consumer Staples 6
35 Health Care 12
40 Financials 17
45 Information Technology 13
50 Telecommunication Services 5
55 Utilities 2
Total Observations 150
38

Table 3: Accounting Standards Referred to in AASB 1047 Disclosures in Annual Reports of Sample Companies (by no. of sentences) Accounting Standards Referred to in AASB 1047 Disclosures in Annual Reports of Sample Companies (by no. of sentences)
AASB E
nerg
y
Mat
eria
ls
Indu
stri
als
Con
sum
er
Dis
cret
iona
ry
Con
sum
er
Stap
les
Hea
lth C
are
Fina
ncia
ls
Info
rmat
ion
Tec
hnol
ogy
Tel
ecom
mun
ic-
atio
n Se
rvic
es
Util
ities
Tot
al
10
15
20
25
30
35
40
45
50
55
% % % % % % % % % % % 2 13 8 113 11 58 14 48 13 23 17 58 22 30 12 36 17 15 22 3 12 397 133 0 0 47 4 64 15 62 17 10 7 24 9 15 6 14 7 11 16 0 0 247 86 34 21 131 0 0 0 0 0 0 0 0 0 0 10 5 0 0 12 0 0 175 6101 0 0 0 0 0 0 0 0 0 0 0 0 1 0 0 0 0 0 0 1 0 0108 0 0 4 1 0 0 1 0 0 0 0 0 3 1 3 1 0 0 0 1 1 1 0 2112 26 16 181 17 88 21 59 16 22 16 39 14 59 24 43 21 14 21 4 15 535 18116 0 0 0 3 22 5 11 3 0 0 7 3 1 0 0 0 3 4 0 4 3 3 0 7117 0 0 3 0 0 0 0 0 0 0 5 2 0 0 0 0 0 0 0 8 0 0118 0 0 0 0 0 0 3 1 3 2 0 0 3 1 4 2 0 0 0 3 0 0 1119 3 2 21 2 10 2 12 3 3 2 13 5 0 0 0 0 0 0 0 0 62 2120 0 0 0 0 6 1 0 0 0 0 6 2 0 0 0 0 0 0 0 2 0 0 1121 4 2 3 1 16 4 12 3 5 4 0 0 0 0 0 0 0 0 0 0 2 1 0 5127 0 0 2 0 0 0 0 0 0 0 0 0 0 0 0 0 0 0 0 2 0 0128 0 0 4 0 1 0 10 3 0 0 0 0 0 0 0 0 0 0 0 5 1 0 1131 5 3 0 0 0 0 0 0 0 0 0 0 0 0 0 0 0 0 0 5 0 0132 1 1 1 0 3 1 0 0 0 0 0 0 0 0 2 1 0 0 0 7 0 0136 34 21 187 18 63 15 67 19 25 19 52 19 30 12 37 18 22 32 8 31 525 18137 13 8 9 7 2 0 0 0 3 2 0 0 0 0 2 1 0 0 0 9 3 6 0 8138 3 2 46 4 18 4 34 9 4 3 35 13 26 11 28 14 3 4 3 12 200 7139 26 16 195 18 74 17 42 12 37 27 30 11 70 28 28 14 0 0 8 31 510 17140 0 0 0 0 0 0 0 0 0 0 0 0 8 3 0 0 0 0 0 8 0 0
162 100 1057 100 425 100 361 100 135 100 269 100 246 100 207 100 68 100 26 100 2956 100
39
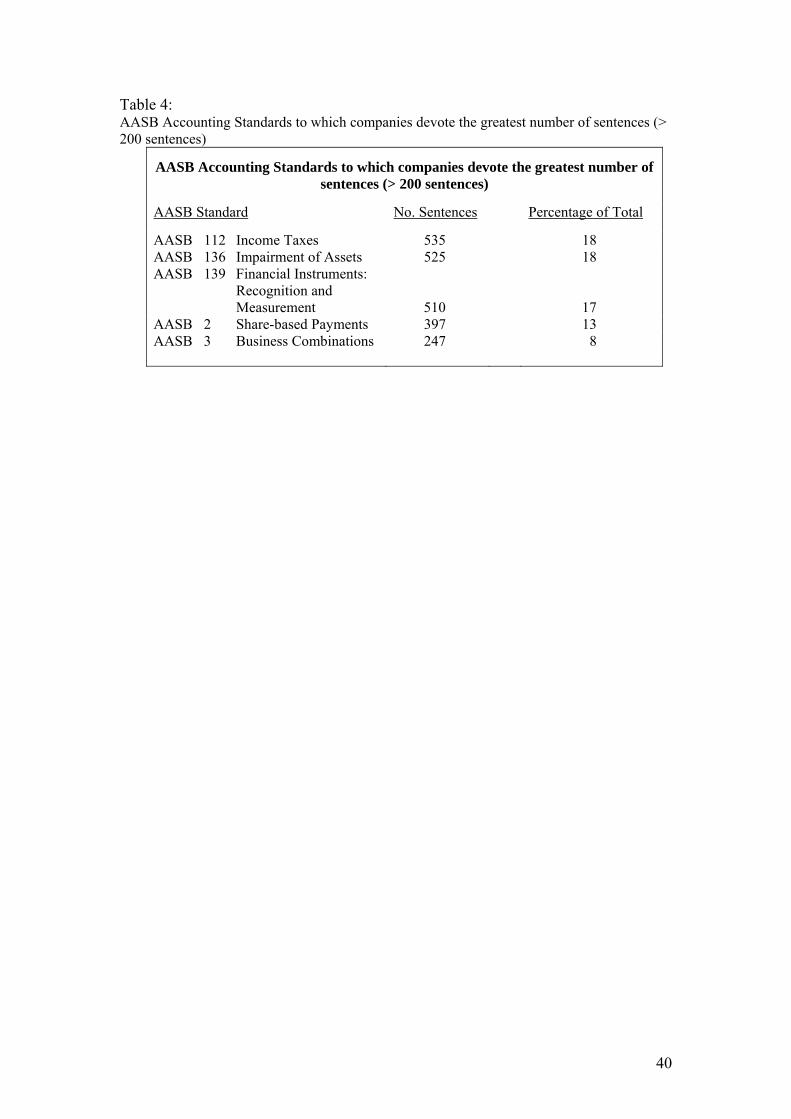
Table 4: AASB Accounting Standards to which companies devote the greatest number of sentences (> 200 sentences)
AASB Accounting Standards to which companies devote the greatest number of sentences (> 200 sentences)
AASB Standard No. Sentences Percentage of Total
AASB 112 Income Taxes 535 18 AASB 136 Impairment of Assets 525 18 AASB 139 Financial Instruments: Recognition and Measurement
510
17
AASB 2 Share-based Payments 397 13 AASB 3 Business Combinations 247 8
40

Table 5: Descriptive Statistics – Raw Data
Part A: Dependent Variables
Extent Quality
Valid Observations 150 150 Minimum 2 0.5 Maximum 102 2.5 Mean 30.52 1.4393 Std Deviation 18.081 .286 Skewness 1.423 -0.388 Kurtosis 2.727 1.516 K-S statistic 1.495 1.014 p value (2-tailed) 0.023 0.255
Part B: Non-Categorical Independent Variables
Assets Debt to Assets
Valid Observations 150 150 Minimum 299779 0.01 Maximum 10286400000 0.95 Mean 412801296 0.3153 Std Deviation 1268576884 0.25080 Skewness 4.784 0.631 Kurtosis 28.077 -0.487 K-S statistic 4.736 1.517 p value (2-tailed) 0.000 0.020
Debt to Equity Return on Assets
Valid Observations 150 150 Minimum 0.01 -2.39 Maximum 17.27 0.79 Mean 1.0470 -0.10 Std Deviation 2.295 0.3555 Skewness 4.721 -2.659 Kurtosis 25.285 13.051 K-S statistic 3.994 2.257 p value (2-tailed) 0.000 0.000
Return on Equity
Valid Observations 150 Minimum -3.69 Maximum 0.90 Mean -0.1297 Std Deviation 0.57158 Skewness -3.399 Kurtosis 17.629 K-S statistic 2.298 p value (2-tailed) 0.000
41
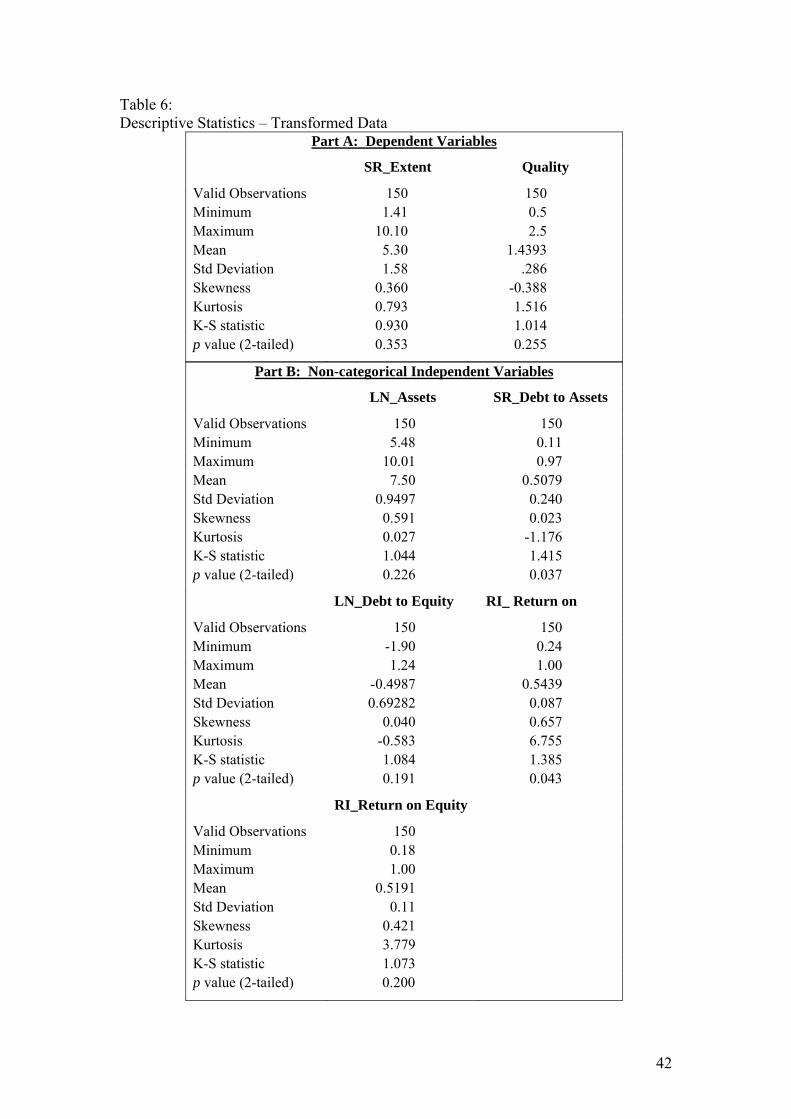
Table 6: Descriptive Statistics – Transformed Data
Part A: Dependent Variables
SR_Extent Quality
Valid Observations 150 150 Minimum 1.41 0.5 Maximum 10.10 2.5 Mean 5.30 1.4393 Std Deviation 1.58 .286 Skewness 0.360 -0.388 Kurtosis 0.793 1.516 K-S statistic 0.930 1.014 p value (2-tailed) 0.353 0.255
Part B: Non-categorical Independent Variables
LN_Assets SR_Debt to Assets
Valid Observations 150 150 Minimum 5.48 0.11 Maximum 10.01 0.97 Mean 7.50 0.5079 Std Deviation 0.9497 0.240 Skewness 0.591 0.023 Kurtosis 0.027 -1.176 K-S statistic 1.044 1.415 p value (2-tailed) 0.226 0.037
LN_Debt to Equity RI_ Return on
Valid Observations 150 150 Minimum -1.90 0.24 Maximum 1.24 1.00 Mean -0.4987 0.5439 Std Deviation 0.69282 0.087 Skewness 0.040 0.657 Kurtosis -0.583 6.755 K-S statistic 1.084 1.385 p value (2-tailed) 0.191 0.043
RI_Return on Equity
Valid Observations 150 Minimum 0.18 Maximum 1.00 Mean 0.5191 Std Deviation 0.11 Skewness 0.421 Kurtosis 3.779 K-S statistic 1.073 p value (2-tailed) 0.200
42

Table 7: Spearman Rank Correlation Coefficients
Spearman Rank Correlation Matrix
Dependent Variables = Extent and Quality
(Number of cases = 150)
Extent Quality
Assets 0.373 ** 0.143 *
Debt to Assets 0.239 ** 0.093
Debt to Equity 0.239 ** 0.093
Return on Assets 0.170 * 0.021
Return on Equity 0.201 ** 0.059
* Significant at the 0.050 level (1-tailed) ** Significant at the 0.010 level (1-tailed)
43
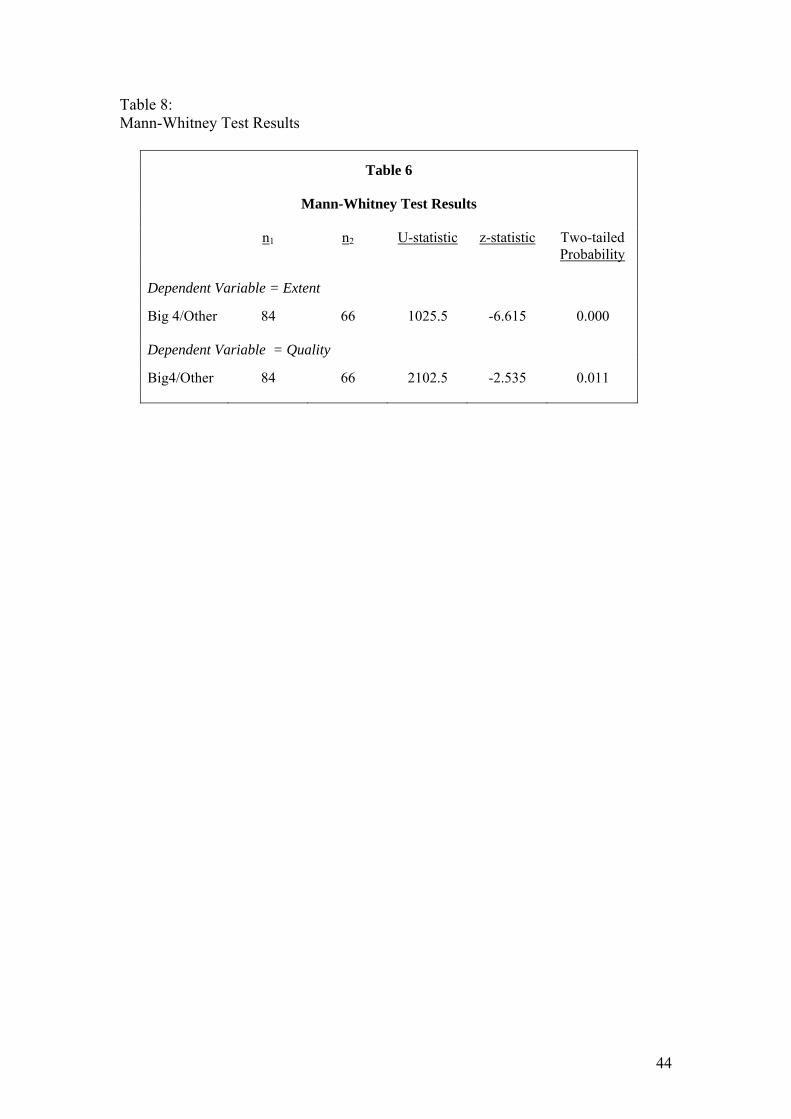
Table 8: Mann-Whitney Test Results
Table 6
Mann-Whitney Test Results
n1 n2 U-statistic z-statistic Two-tailed Probability
Dependent Variable = Extent
Big 4/Other 84 66 1025.5 -6.615 0.000 Dependent Variable = Quality
Big4/Other 84 66 2102.5 -2.535 0.011
44

Table 9: Kruskal-Wallis Test Results
Kruskal-Wallis Test Results Dependent Variable Industry Sector N Mean Rank
Extent Energy 9 71.56 Materials 49 82.09 Industrials 19 81.89 Consumer
Discretionary 18 79.33
Consumer Staples 6 74.92 Health Care 12 88.08 Financials 17 51.76 Information
Technology 13 73.77
Telecommunication Services
5 46.10
Utilities 2 49.25 Total 150 Kruskal-Wallis
Test Statistic Probability
10.884 0.284
45

Table 10: Multiple Regression Model Results
Multiple Regression Model Results
Explanatory Variable Coefficient t-statistic Significance Part A: Dependent Variable = SR_Extent Constant 1.004 0.317 LN_Assets 0.187 1.903 0.059 RI_Return on Assets 0.015 0.204 0.839 SR_Debt to Assets 0.191 2.072 0.040 Auditor 0.403 5.333 0.000 Materials 0.249 1.798 0.074 Industrials 0.022 0.196 0.845 Cons. Discretionary 0.012 0.111 0.912 Cons. Staples 0.014 0.163 0.870 Health Care 0.111 1.135 0.258 Financials -0.098 -0.930 0.354 Information Technology 0.088 0.875 0.383 Telecommunication Services -0.052 -0.641 0.523 Utilities -0.077 -1.033 0.303 R2 = 0.353; F = 7.243; p = 0.000; n = 150 Part B: Dependent Variable = Quality Constant 5.014 0.000 LN_Assets 0.048 0.404 0.687 RI_Return on Assets 0.020 0.224 0.823 SR_Debt to Assets -0.013 -0.118 0.906 Auditor 0.195 2.112 0.037 Materials -0.110 -0.649 0.517 Industrials -0.017 -0.121 0.904 Cons. Discretionary -0.012 -0.087 0.931 Cons. Staples -0.048 -0.460 0.646 Health Care 0.138 1.150 0.252 Financials -0.120 -0.926 0.356 Information Technology 0.054 0.435 0.664 Telecommunication Services -0.139 -1.395 0.165 Utilities 0.017 0.190 0.849 R2 = 0.035; F = 1.417; p = 0.159; n = 150
46