discourse-centric learning analytics - academic technology · rhetorical function and relationship...
TRANSCRIPT

Discourse-Centric Learning Analytics
Anna De Liddo1, Simon Buckingham Shum1, Ivana Quinto1,2, Michelle Bachler1, Lorella Cannavacciuolo2
1 Knowledge Media Institute, The Open University Walton Hall, Milton Keynes, MK7 6AA, United Kingdom
2 Dept. Business & Management Engineering, Universita’ degli Studi Napoli Federico II Piazzale Tecchio 80, 80125, Napoli, Italy
{A.DeLiddo, S.Buckingham.Shum, M.S.Bachler}@open.ac.uk
{Ivana.Quinto, Lorella.Cannavacciuolo}@unina.it
Abstract. Drawing on sociocultural discourse analysis and argumentation theory, we motivate a focus on learners’ discourse as a promising site for identifying patterns of activity which correspond to meaningful learning and knowledge construction. However, software platforms must gain access to qualitative information about the rhetorical dimensions to discourse contributions to enable such analytics. This is difficult to extract from naturally occurring text, but the emergence of more-structured annotation and deliberation platforms for learning makes such information available. Using the Cohere web application as a research vehicle, we present examples of analytics at the level of individual learners and groups, showing conceptual and social network patterns, which we propose as indicators of meaningful learning.
Keywords: Learning Analytics, Discourse Analytics, Discourse Analysis, Argumentation, Sensemaking, Social Network Analysis, Web Semantics
1 Introduction: Learning and Discourse
A key indicator of meaningful learning is the quality of contribution to discourse. As proposed by Mercer [1], a sociocultural perspective on learning “highlights the possibility that educational success and failure may be explained by the quality of educational dialogue, rather than simply in terms of the capability of individual students or the skill of their teachers.” The way in which learners engage in dialogue is an indicator of how they engage with other learner’s ideas, how they compare those ideas with their personal understanding, and finally how they account for their point of view, which is an explicit sign of the stance they hold in the conversation.
The analysis of accounts in text is the primary focus of discourse analysis. We look at discourse as a key indicator for learning and explore discourse analysis as a method to identify where and how learning happens. This approach to analyzing dialogue, in search of clues and indicators of learning, builds on the tradition of scholarly and scientific discourse. Gilbert and Muckay [2] pioneered this field by analyzing the way scientists construct their claims and defend their positions in a scientific dispute.

2
Information and data, together with experimental procedures, subsequent results and theoretical developments are not univocally observable, and can present a variety of significant interpretations which may be conflicting, while at the same time being equally valid. Within this ‘space’ of multiple interpretations, appropriate forms of rhetorical move in language are the means by which scientists make their claims to contribute to scientific debate and advance knowledge.
Discourse analysis focuses explicitly on language as social action, and in that, discourse and argumentation are the tools through which people can compare their thinking, explore ideas, shape agreement, and identify or solve disagreements. We use discourse to co-evolve and think together. “Many human activities involve not just the sharing of information and the coordination of social interaction, but also a joint, dynamic engagement with ideas amongst partners. When working together, we do not only interact, we ‘interthink’ [3]. Mercer focuses attention on the relationship of dialogue processes to outcomes: if discourse is the tool through which learners think collectively, then discourse outcomes and discourse analysis can provide indicators to better understand the learning processes. While Mercer and others originally focused on spoken dialogue as a tool for thinking collectively, their work has been shown subsequently to provide insight into textual discourse in online learning [4], providing a bridge to the world of online learning analytics for knowledge building.
Argumentation Theory is a second strand of work on which we build, given the importance of reflection and critical thinking in learning discourse. While argumentation and rhetorical theory date back to the Greek philosophers, we draw particular inspiration from the foundational work of Walton in articulating many of the argumentation schemes that we encounter in everyday discourse [5]. The formalization of such schemes by Walton, et al. for computational modeling [6] provides the technical bridge required for learning analytics.
The third strand of work informing our approach derives from Rittel’s formative work on Issue-Based Information Systems and his argumentative method for sensemaking deliberation in complex problem spaces [7]. Its subsequent translation by Conklin [8] into a hypertext data model supporting dialogue visualization provides the third key bridge for learning analytics.
We build on these three research strands and argue that if learning dialogues and their outcomes are representative indicators to better scaffold the learning process [1,3], then argumentation theory [5,6] and argumentation tools [7] can improve the ways in which those processes can be analyzed and understood.
2 The Move to Semantically Structured Online Discourse
Written discourse in online learning environments is expressed in diverse corpora such as learning journals, discussions, reviews, and essays, rendered via myriad tools such as threaded forums, blogs, wikis and social networking sites. Each tool constrains and shapes the ways in which users can articulate their thoughts and dialogue with one another. Those aspects makes online discourse and dialogue quite different from face-to-face dialogue and a specific clarification needs to be done of what type of online dialogue is being considered, how people can dialogue in those

3
environments and how discourse and discourse analysis may be interpreted in the specific ‘space’ of online communication which is being investigated.
The most established online dialogue environments render discourse chronologically, rather than logically, reflecting most strongly the sequence of contributions rather than their conceptual structure (for instance a Facebook dialogue, Figure 1).
Fig. 1. Extract of a real Facebook Dialogue.
Subject-line threading, tagging, or anchoring commentary to a document structure
do provide mechanisms, albeit weak, to navigate thematically. Such environments minimize the effort required by the user to add a contribution (they just click “comment” or “reply”), but the trade-off is that important phenomena that can signify more reflective learning conversations are hidden in the free-text content, making it harder for both participants, and the software platform, to understand questions such as: What are the key issues raised in the conversation? What are the emerging questions? How much support is there for this idea? Who disagrees, and what evidence do they use? What kind of argument is made to support this? One must simply read the entire online conversation, along with all the “noise” which cannot be filtered.
In order to address these limitations, we are now seeing the emergence of robust tools for more structured deliberation and argument mapping [9-11], prefigured by

4
extensive CSCL research [12-13]. These tools are now finding application in many forms of knowledge work which require clear thinking and debate, including learning, scenario planning, and policy formulation. As part of our broader conception of Hypermedia Discourse [14], we have developed a web application called Cohere [15], providing a medium for engaging in structured online discourse, or for summarising/analysing it, e.g. as a moderator, educator or researcher. Following the approach of structured deliberation/argument mapping, Cohere renders annotations on the web, or a discussion, as a network of rhetorical moves: users must reflect on, and make explicit, the nature of their contribution to a discussion. A simple example illustrates how a Cohere discussion is different from typical social network interaction, such as in Facebook (Figure1). In the example dialogue (Figure 1), Van has proposed a dinner for the 10th of October which Miriam cannot attend, while Anna and Aurelie can make it. From how the dialogue is represented, it is not evident at first that the central dinner-invitation post is the second one, nor what the positions of other participants are. The only way to make sense of the conversation is by reading it whole. While this is feasible with just three participants and 5 posts, this does not scale for complex debates with many participants.
Cohere aims to address this problem with two key extensions: • Adding icon types to the posts • Making semantic connections between posts (see Figure 2).
Figure 2: Shows how Cohere augment common online dialogue text: the icons at the side of
each post shows rhetorical role of the post and the semantic connections the rhetorical move between posts.

5
With Cohere, users can pick an icon to associate to their post, which explain the rhetorical role of that post in the wider conversation (e.g. Van is raising and idea/option to make a dinner on Friday, Miriam presents a con to the proposal: since she has guests that w-e, Anna present a pro in favor of Van proposal: there will be no Lab dinner in that w-e, etc) (Figure 2).
Moreover with Cohere users can explicitly connect their post to the post which is relevant to what they want to say. They can do so by making a connection between posts, which explain the rhetorical move they want to make in the conversation (i.e. Anna and Aurelie agree with Van’s idea while Miriam disagrees) (Figure 2).
Cohere augments the online conversation by making explicit information on the rhetorical function and relationship between posts. Moreover users can browse the online dialogue not as a linear text but as a semantic network of posts (Figure 3).
Fig.3. Cohere’s environment in which online dialogue is represented as semantic network of
posts.
By structuring and representing online discourse as semantic network of posts Cohere enables a whole new way to browse, make sense of, and analyze the online discourse. In this paper we discuss what it mean to use Cohere’s online dialogue environment to monitor online learning activities and develop useful learning analytics, by starting on the analysis of the online discourse which learners are involved in.
In particular in the next section we describe how discourse analytics can enable a deeper understanding of the online discourse, of the participants to the discourse and the social and learning dynamics.

6
3 Learning Analytics on Discourse Elements
In the previous sections we have described why discourse is a key indicator for learning (section 1), and we have described the specific type and technology for online discourse we will be focusing on: Cohere (section 2). In the following we present several examples of simple learning analytics based on discourse elements. These examples are intended to work as a proof of concept for the potential of discourse-centered learning analytics that is to say a focus on learners' discourse as promising site to identify patterns of meaningful learning.
Cohere introduces two main discourse elements in an online conversation: 1. The post type: which is represented with an icon and label, and expresses
the rhetorical role played by the post in the wider online conversation (Figure 2 and 3);
2. The semantic connection: that is represented by a link and label, and expresses the rhetorical move the author of the post wanted to make in the conversation, and toward a specific post or participant (Figure 2 and 3).
In the following we describe what kind of learning analytics can be done on those two discourse elements and give concrete examples of how Cohere can provide learning analytics per learner and per group, to identify:
• learners’ attention: what do learners focus on? What problems and questions they raised, what comments they made, what viewpoints they expressed etc.
• learners’ rhetorical attitude to discourse contributions: With what and who do a learner agrees/disagrees? What ideas he supports? What data he questioned?
• learning topics distribution: What are the hottest learning topics, by who they have been proposed and discussed?
• learners’ social interactions: How do learners act within a discussion group? What are the relationships between learners?
4 Analytics per Learner
Cohere provides two main types of learning analytics: analytics per learner and analytics per group. In the following we discuss the main analytics per learner which consist of two tables (Node Type table and Link type table); and two lists of connections (comparing thinking and information brokering connection list). We will use as example data the statistic for Rebecca, a semi-experienced Cohere user, which has been also involved in one of the use cases described in the following section (section 5).
4.1 Analytics on Post Types: Analyzing Rhetorical Roles
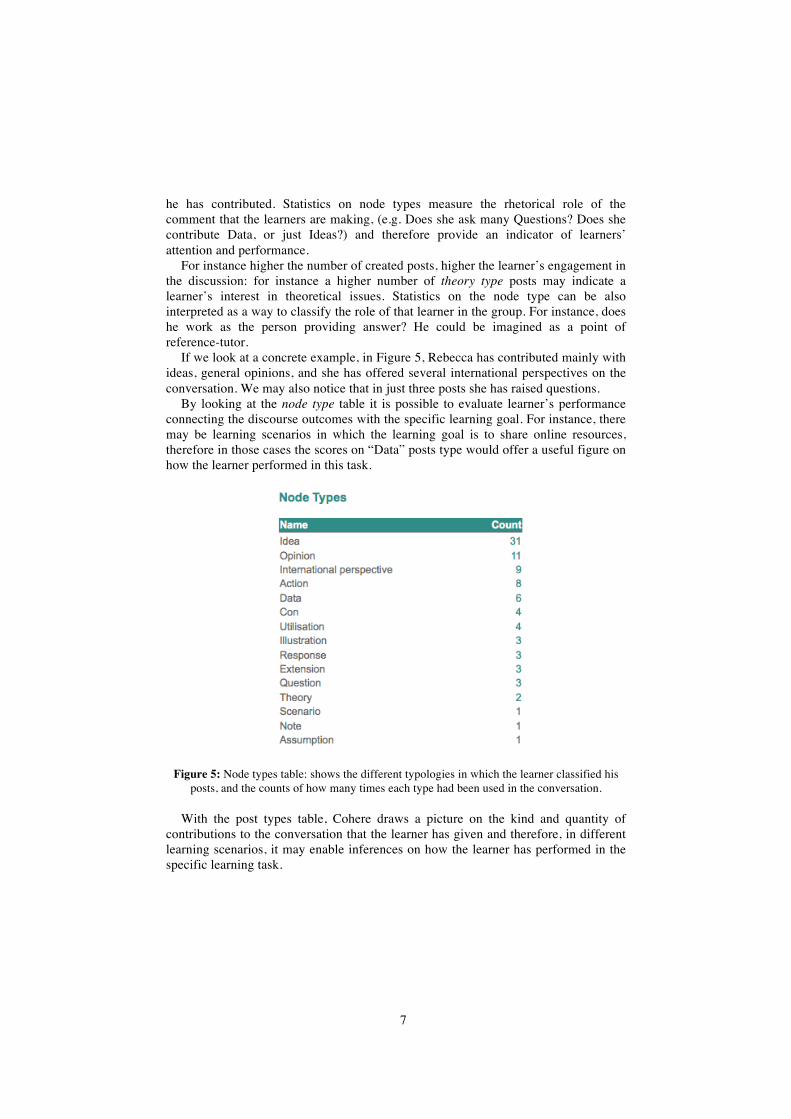
The table on post types (called node types) counts, shows the variety of types of posts that the learner has added to the conversation, and with how many posts of each type
7
he has contributed. Statistics on node types measure the rhetorical role of the comment that the learners are making, (e.g. Does she ask many Questions? Does she contribute Data, or just Ideas?) and therefore provide an indicator of learners’ attention and performance.
For instance higher the number of created posts, higher the learner’s engagement in the discussion: for instance a higher number of theory type posts may indicate a learner’s interest in theoretical issues. Statistics on the node type can be also interpreted as a way to classify the role of that learner in the group. For instance, does he work as the person providing answer? He could be imagined as a point of reference-tutor.
If we look at a concrete example, in Figure 5, Rebecca has contributed mainly with ideas, general opinions, and she has offered several international perspectives on the conversation. We may also notice that in just three posts she has raised questions.
By looking at the node type table it is possible to evaluate learner’s performance connecting the discourse outcomes with the specific learning goal. For instance, there may be learning scenarios in which the learning goal is to share online resources, therefore in those cases the scores on “Data” posts type would offer a useful figure on how the learner performed in this task.
Figure 5: Node types table: shows the different typologies in which the learner classified his
posts, and the counts of how many times each type had been used in the conversation.
With the post types table, Cohere draws a picture on the kind and quantity of contributions to the conversation that the learner has given and therefore, in different learning scenarios, it may enable inferences on how the learner has performed in the specific learning task.

8
4.2 Analytics on Link Types: Analyzing Rhetorical Moves
The table on link types (Figure 6) describes the rhetorical moves that the learner has made in the conversation. It gives the list of all link types, used by that learner, to express his ideas and connect them with other people’s ideas. The list will be ordered as descending on the number of time the semantic link has been used.
Three main elements can be observed by looking at this table: the language the learner uses to describe his thinking, his attitude toward the discussed topic, and how this language and attitude are similar or different from other learners in the same group.
In order to evaluate learners’ attitude Cohere classifies semantic links type into three categories: Positive, Neutral and Negative (Figure 6). Positive link types are represented with a green link and label, and express positive rhetorical moves such as i.e. supports, agrees with, improves on, is consistent with, predicts, proves, solves the problem etc.
These categories provide indicators of the attitude a learner had toward the learning task and within the conversation. In example, in the figure shown (Figure 6), we can see that the example learner has maintained a positive stance within the conversation.
Figure 6: Link types usage statistics. Arrows show three connections categories - Neutral,
Positive and Negative
In fact, in Figure 6 green links score quite high into the table and the most of the learner’s contributions to the conversation have been devoted to identify: consistencies, coherences, answers to questions raised by herself or other learners etc.
More precise statistics can be easily obtained from this table. For example, the percentage of positive contribution can be calculated as:

9
!
%P =
Nglgl=1
G
"
T*100 .
(1)
!
%P is equal to the summation of the number of times that the learner used a green link (
!
Ngl ), extended to all the green links (g=1,..G; where G is the number of different green links type), divided for the total number of links he has created (T), and multiplied by 100.
This percentage can be used as an indicator of the learner’s positive attitude toward the learning task, and toward other learners, within the online discourse. The same calculation can be repeated for neutral and negative link types. This would give the following analytics for our example learner (Table 1).
These statistics can be extended to all learners in a class or in a group of inquiry and therefore compare their attitude within the online conversation.
Table 1: Example of Link Type Analytics for a learner
%P: Percentage of positive rhetorical moves
%N: Percentage of Negative rhetorical moves
%Ntl: Percentage of Neutral rhetorical moves
47.1 9.5 43.4
The second observation, that can be made analyzing the link types table (Figure 7), concerns the learners’ language used to describe their rhetorical moves. Different learners may give different meaning, or nuances of meaning, to the same concept and this may mirror in using different terms to express the same concept, or the same term while referring to quite different meaning.
If we look at Rebecca’s list of rhetorical moves, we can notice that she classified as gray (neutral) rhetorical moves which refer to descriptive turns in the conversation, aiming to: i.e. identify similarities, illustrate, give examples and discover relationships. And the classification is quite coherent, in the sense that all the link types she has chosen convey the same descriptive meaning. In the same way, the green links seem to represent positive moves such as: improvement, support, problem solving etc. We may notice though that she classified as positive the relationship “causes”, which has a quite ambiguous interpretation. In fact other learners may have classified “causes” as neutral link type since causal moves may imply both positive and negative consequences and therefore the term does not bring per se a positive interpretation. Presented with link analytics of this sort, an educator might ask questions such as: Why did Rebecca classify this term as green? How did other users interpret this rhetorical move?
Comparison between different learners link types table, and different analytics on the data can support the understanding of those deeper reflections on learners’ use of language. For example, Figure 7 shows how four users who all participated in the

10
same investigation, used the five link types which were calculated to have highest usage within the group.
Figure 7: Comparing four users’ usage of link types.
Usage is a relative metric, which may be constrained to specific users group, or to specific users type (I.e experts, or non-expert). For instance, if we want to calculate the usage of a semantic link type by the most expert Cohere users, we can calculate the weighted summation of the number of time the link type has been used from the top 20 users, following the formula:
!
Ui = wiNuiu=1
20
" . (2)
where:
• i is the semantic link type, and varies from i=1,..n; where n is the number of all the different semantic connections type used by the top 20 Cohere users.
• u is the user and vary from 1,..20 for the top 20 Cohere users •
!
Nui with u=1,..20 is the number of times the user u has used the connection i;
• and the weights
!
wi are obtained by calculating the topological matrix of semantic-type/user and summing the row elements to obtain the number of users which used that same link type.
In other words, for each link type i, the weight
!
wi is proportional to the number of users that used that link type. The weight is a measure of popularity of each link type within the top 20 expert Cohere users, and the more popular is a link type the more it will score in the Usage calculation. By applying this formula we choose popularity as the main factor to determine if a semantic link type is used, in other words we make

11
sure that if just one user has used a semantic link type many times, but nobody else has, this link type will not score high in the link type usage.
4.3 Learners’ Attitude to Compare Thinking
An important aspect of learning is the capability of the learner to think critically and reflect on his personal point of view by comparing it with others. When a learner decides to connect his idea with another person’s idea this could serve as an indicator of reflective thinking, insofar as the learner is assumed to have read the target node, and reasoned about the relationship with his own idea, in order to select a link type.
Cohere counts and lists for each learner all the links in which she has connected his opinion to another person’s contribution to the online conversation (Figure 8). In the picture we can see that for each connection there are three user icons, which represent: the link’s author (at the center under the semantic connection label) and the authors of the two posts that are being connected. Compared thinking statistics counts the connections in which the link author (at the center) is also author of one of the two connected posts.
Figure 8: List of semantic connections in which learners have compared their thinking with other learners
4.4 Learners as Information Brokers
Another analytic afforded by semantic discourse of this sort concerns the degree to which users’ act as information brokers between others. Since connecting is an explicit, reflective act in Cohere, it is straightforward to count how many times learners create semantic connections between nodes authored by others (Figure 9).

12
Figure 9: List of semantic connections in which a learner acted as information brokers.
5 Discourse Network Analyses and Visualization: Analytics Per Online Discussion Group
Cohere calculates different kinds of statistics on online data generated and shared by group members. The group statistics summary shows two main factors:
• Discourse element statistics, such as the most popular link type and the most popular node type
• Discourse network statistics, such as i.e. the node type, the post and the learner with highest degree centrality.
Let us elaborate the properties of the discourse network. Its structure consists of two superimposed networks that are assumed to be strongly connected:
• Concept network – which relates the nodes that learners created. • Social network – which relates learners that participate to Cohere
discussions posting Ideas, Questions and Arguments etc; For data analysis we considered that, in the concept network, the posts are the
nodes, and the semantic relations among posts indicate the edges; whereas the social network maps the pattern of relationships among actors. In particular, we considered the users as nodes and we measured the edge between two users by counting the times that a user created a semantic connection that targeted a post authored by another user.
In the following tables, we show the different meaning that each Network Analysis metric has in the social and concept network adapted to our context.
Table 2. Ego-network measurements
Metric Social Network Concept Network
Outdegree
Measures most active users. It measure the activity of a user in terms of how many posts s/he has linked
Measures the attractiveness of a post in terms of how many posts it has been linked to
Indegree Measures Prestige and Expertise of the learner within
Measures the attractiveness of the post in terms of how many

13
the network incoming links it has. It identifies key targeted posts.
Degree Centrality (undirected graph)
A measure of the total number of links that a node has. A greater number of links implies an higher power within the network
Most interesting topics; hottest topics (by summing indegree and outdegree)
Eigenvector centrality
Measures a node importance by taking into account not only how many connections a vertex has (i.e., its Degree), but also the Degree of the vertices that it is connecting to. It considers first depth learners to which a given learner is connected to, when to calculate learner influence within the network
A measure of a node’s importance. It considers the kind of node to which a post is connected to. The Eigenvector Centrality metric takes into consideration not only how many connections a vertex has (i.e., its Degree), but also the Degree of the vertices that it is connecting to
Table 3. Network measurements
Metric Social Network Concept Network
Presence of network’s components
Assesses the degree to which a network is disconnected. A social network which is fully connected has only one component
Assesses the number of different subtopics discussed in a group
Link distribution Assesses the presence of hub users Assesses the presence of hub topics
In order to provide some concrete examples of how the above network metrics can
be used to analyze learners activities in online discussion groups we present two use cases.
In the first use case (OLnet team discussion) Cohere has been used by a group of researchers to annotate the document of a project proposal, and to reflect on which areas of the proposal they were making a contribution. With Cohere’s Firefox sidebar users can annotate the document and share their annotation in the group discussion environments. These annotations are initially presented as list of posts presented in reverse chronological order within the discussion group. After this initial phase of reading and annotating the document, participants were asked to have a group discussion on the main research questions addressed by the team, the main project achievements and how they related to the project goal. In order to do this, they had to create new posts in which they described more general reflections on research questions, goals and activities and then they had to start creating semantic connections between the document annotations and the posts (for more info on the Cohere’s user interface and how to build semantic connections and discourse networks through Cohere please refer to [16,17]).

14
This resulted into a discourse network in which document notes, open questions, ideas and other posts’ type are connected, and node’s icons and links express the rhetorical role and move played by each post into the online discourse.
In the second use case (COP15 discussion) four researchers have used Cohere to collaborative annotate web news, documents, blog posts etc about the United Nation Climate Change Conference COP15. Results of the web annotations have then been used to inform an online dialogue on the main issues tackled during COP15, as reported by the press or as micro and macro blogged by participants to the conference.
In order to have a specific focus for the discussion participants choose to discuss one of the public's top questions that have been suggested on a Open University Platform (see page: http://www.open.ac.uk/platform/join-in/your-votes/question-by-popular/Climate%20Change); that is:
• How do we know that climate change is real and we're not just experiencing a weather cycle?
Participants were asked to explore and annotate key Open Educational Resources (OER) and Social Media pages (such as Blogs, Wikis, Twitter streams, and web pages in general) with ideas to help answering the tackled question. Moreover they were asked to make connections between their ideas and other participants’ ideas. In this process the main driving question and the identified relevant OERs have been used as evidences to base claims/ideas. This resulted in a web of ideas and annotated resources on the issues at stake, meaningfully connected into a discourse network.
In the next paragraph we will describe how statistic on discourse network can provide insights on the contents of the group discussion and on the conceptual and social interaction between group members.
To analyze both the online group discussions and to compute some of above mentioned Network Analytics, we used UCINET tool [18]; instead we used NodeXL tool [19] for both concept network and social network visualization.
5.1 Concept Network Analysis and Visualization
5.1.1 Link distribution: Is the network topology hub and spoke or random? The first analysis that we conducted on the datasets of the two use cases looks at links distribution to assess the presence of hub users and hub topics. The existence of hubs indicates the presence of hot topics/posts or key/most-active users.
Network’s hubs are nodes with the highest degree centrality. From the analysis of link distribution, emerges that both OLnet and Cop15 discussion groups are characterized by a power law distribution. The power law tail indicates that the probability of funding posts with a large number of links is rather significant; this means that the network connectivity is dominated by few highly connected posts [20].
As illustrated in the two histograms below (Figure 10), in both the network it is possible to identify a hub with a highest degree followed by smaller ones. From the analysis emerges that the hub is a post labeled #COP15 and classified as “idea type”. The hub post has been connected to many other posts, which present annotations of various web resources. The learner who created the post was in fact using the hub to cluster those resources under the # tag “COP15”. This highlights a use of Cohere in

15
which the learner, more than dialoguing is rather mapping out his notes on web resources and then sharing them with the group within the online discourse.
Figure 10: Link distribution histograms for COP15 and OLnet Team discussion groups.
A different case is the OLnet discussion group, which highlights a use of Cohere as tool for collective inquiry. In fact the discussion presents two hubs, both with degree equal to 8:
• “What motivates registered users to learn in socio-collaborative ways on OpenLearn?” which was classifies by the author as “idea type” post; and
• “How can we build a robust evidence base to support and enhance the design, evaluation and use of OERs?” which has been classified as a “question type” post.
The first thing that we can notice is that the two hubs are both posts which present an open question to the group. This seems to suggest that within all posts’ types, questions have a higher discourse power, in that they trigger learners’ participation and interactions. Of course more systematic observations on wider and different online discussion groups are needed to appropriately test this hypothesis.
Other considerations can be also done by looking at the hub posts’ type. The learner who authored the first hub did not correctly classify the rhetorical role of his post within the wider conversation. The post clearly states a question but it has been classified as “idea”. This may be due to misunderstanding of the learning task or to less confidence in the use of the technology; in any case this observation would alert a tutor on the learner performance. This example, in the same line with the analysis done in section 4.1, highlight the value of using posts type to classify the rhetorical role of the posts within the online conversation.
5.1.2 Components analysis to compare the struceture of OLnet and Cop 15: Are the networks connected? The second analysis which has been conducted on the two datasets consists in assessing the presence of components. A component is a connected subset that composes a disconnected network. Within networks’ components there are no links/paths between the nodes belonged to different components. Therefore network components identify isolated subsets of people or topics within the discourse network.
If we look at the social network this analysis assesses the degree to which a network is disconnected: for instance: a social network which is fully connected has only one component. While if we look at the concept network the analysis assesses the number of different subtopics discussed in a group and at the same time.

16
From the analysis emerges that both networks present several components and this implies that the networks are weakly connected.
In details, COP15 group presents 9 components but the bulk of nodes belong to two components. OLnet group presents 10 components but the bulk of nodes belong to one component.
The presence of components in each group can be interpreted as the emergence of different sub-discussions independent among them. Analyzing the size of each component, (number of node in each component) emerges that not all the sub-discussions are developed by learners in the same way. Bigger components can be interpreted as hot sub-topics which attracts a greater interest than others.
We can also notice that the number of posts in the group discussion may have an influence on how hub topics distribute. For instance if we compare the two groups we can notice that in more developed discussion groups, such as COP15 group, two components absorb the bulk of nodes (161 out of 178). While in a group with less posts, as OLnet group, the bigger component absorb less than 45% of the total nodes. This could indicate that at the beginning of the discussion, learners try to explore a wider deliberation space talking about different aspects of the same topic; then gradually, they start to focus on few sub-topics and to deepen them. This hypothesis would need to be proof/disproved by more in depth analysis, but consideration on the line of these give an example of how analyzing network metrics can inform the understanding of group dynamics.
Finally specific network visualizations can be drawn to focus on the main network analysis metrics. The next figure (Figure 11) shows results of the concept network visualization for the OLnet Team discussion group, done with NodeXL [19].
Figure 11: Concept Network Visualization of OLnet team discussion)
In particular in figure: • Edge shape depends on link type (Positive=solid line; Neutral=dotted line,
Negative=dashed lines) • Edge width depends on the frequency of the relationship

17
• Vertex size depends on the degree centrality
5.2 Social Network Analysis and Visualization
One approach to studying collaborative environment, as well as collaborative network, has been the application of Social Network Analysis.
The phrase “social network” refers to the set of actors and the ties among them. The network analyst would seek to model these relationships to depict the structure of a group. One could then study the impact of this structure on behaviour of the group and/or the influence of this structure on individuals within the group [21]. Focusing on depicting the structure of the network, the paper applies the main structural measures of SNA to Cohere’ discourse network in order to analyze the typology of network which emerges from the online discussions.
In the following we present the Social Network Analysis (SNA) for the OLnet discussion group. The SNA measurements that we consider in our analysis are: out degree and in degree centrality. We adapted the meaning of these two measures to our case, indeed:
• Out degree measures the users’ activity level; • In degree is a sort of indirect measure of quality and relevance of a user’s
posts. In the table (Table 5), we show the results that emerge from the analysis of OLnet
group social network. The node more active is Learner 1. Her outdegree is equal to 11. It means that she
creates 11 links among different posts. While, Learner 6 is the learner with the higher indegree value. Her indegree is equal to 11. It means that L6’s posts are considered more interesting and/or relevant by the group.
Table 5. Outdegree and Indegree values for the Olnet Team discussion (11 participants)
Learners Outdegree Learners Indegree L1 11 L6 11 L2 7 L3 7 L3 6 L1 5 L4 4 L4 4 L5 4 L2 4 L6 3 L8 4 L7 3 L5 2 L8 2 L7 2 L9 2 L11 2
L10 1 L10 1 L11 0 L9 1
By using the network metrics detailed in Table 2 the SN of the OLnet Team
discussion group can be represented as follows (Figure 12, NodeXL tool’s visualization [19]).

18
Figure 12: Social network representation of the OLnet Team discussion group.
In particular in figure: • Link width indicates the frequency of relationship (reply). • Edge shape indicates the link type (positive: solid line, neutral: dotted line,
negative: dashed line). The final shape depends on the prevalence of one of two link type.
• Vertex size depends on the in-degree centrality of each users (bigger node have higher out-degree centrality).
• Vertex colour depends on the out-degree centrality (more black sphere have a higher in-degree value instead grey node have lower indegree value
6 Conclusions
Drawing on Mercer’s socio-cultural discourse analysis and argumentation theory, we have motivated a focus on learners’ discourse as a promising site for identifying patterns of activity which correspond to meaningful learning and knowledge construction. However, in order for online discourse to deliver on the promise of learning analytics, software platforms must gain access to qualitative information about the pragmatic dimensions of conversational contributions, that is, the rhetorical dimensions to a contribution.
We identified the emergence in recent years of more-structured deliberation platforms on the Web, descended from hypertext research systems in the 1980s. Users of such tools make explicit certain classes of information which is very difficult to extract from naturally occurring text, although we are now investigating computational linguistics tools for detecting rhetorical gestures [22] In particular, we are interested in the rhetorical role that a user’s contribution is making to a document or conversation (e.g. identifying a problem, responding to a query, challenging or supporting a viewpoint, contributing new data), and the nature of the connection to other contributions using semantic relationships.
19
Using the Cohere system as an experimental vehicle, we have presented examples of learning analytics at the level of individual learners and groups to better understand:
• learners’ attention: by analyzing the specific type and quantity of contributions to the conversation that a learner gives it is possible to measure several aspects of the learner performance (section 4);
• learners’ rhetorical moves within the online discussion: By analyzing the semantic connections between posts we can enhance our understanding on the different ways in which learners participate to the conversation. Moreover we can make consideration on what attitude they have toward the discussed topic and the role they play within the group (section 4);
• learning topics distribution: by applying concept network analysis we can identify what are the hottest learning topics and by who they have been proposed and discussed. Moreover we can see how topic and subtopic distribute within the online conversation (section 5);
• learners’ social interactions: by applying SNA we can map how learners act within a discussion group, what are the relationships between learners, where and how much they interacted with each other, and who is the key learner and why (section 5).
These examples don’t aim to present in depth analysis of the collected use case
data, they are rather meant to give a proof of concept of the potential impact of discourse-centric learning analytics in the study of CSCL. Based on those examples we argue that discourse-centric learning analytics such as these enable more in-depth reflections on learners’ activities than would be possible to achieve with quantitative analysis of lower level actions (such as mining of logs on how many resources are downloaded, how many times they have logged into a system, how many comments they have made, how long they have spent on a task, etc).
This is partially due to the nature of the analyzed data. Discourse-centric learning analytics are based on data that makes explicit the learner’s cognitive context (e.g. what kind of rhetorical move the learner wanted to make with a comment, what meaning he gave to a connection, what contrasting viewpoints he detected etc). By analyzing more richly expressed and structured data, discourse-centered analytics can augment the level of accuracy and the cognitive depth of the inferences that can be made on where and how learning happens.
Acknowledgments We gratefully acknowledge the support of the William & Flora Hewlett Foundation, through their funding of the Open Learning Network Project (www.OLnet.org).

20
References
1. Mercer, N.: Sociocultural discourse analysis: analysing classroom talk as a social mode of thinking. Journal of Applied Linguistics, 1(2), 137-168. (2004)
2. Gilbert, G.N., Mulkay, M.: Opening pandora's box: A sociological analysis of scientists' discourse. Cambridge: Cambridge University Press (1984)
3. Mercer, N.: Words and Minds. London: Routledge (2000) 4. Ferguson, R.: The Construction of Shared Knowledge through Asynchronous Dialogue.
PhD thesis, The Open University. Chapter 2. pp.44-51 (2009,) http://oro.open.ac.uk 5. Walton, D.: Argumentation Schemes for Presumptive Reasoning. Lawrence Erlbaum
Associates: NJ (1996) 6. Walton, D., Reed, C., Macagno, F.: Argumentation Schemes. Cambridge: CUP (2010) 7. Kuntz, W., Rittel, H.: Issues as Elements of Information Systems, Working Paper No. 131,
Institute of Urban and Regional Development, U. California at Berkeley. 8. Conklin, J., Begeman, M. L.: gIBIS: A Hypertext Tool for Exploratory Policy Discussion.
ACM Transactions on Office Information Systems, 6 (4), 303-331 (1988) 9. Klein, M., Iandoli, L.: “Supporting Collaborative Deliberation Using a Large-Scale
Argumentation System: The MIT Collaboratorium”, Directions and Implications of Advanced Computing. Conference on Online Deliberation. U.C. Berkeley (2008)
10. Kirschner, P., Buckingham Shum, S., Carr, C. Eds. Visualizing Argumentation. Springer-Verlag: London (2003)
11. ODET 2010: Online Deliberation: Emerging Technologies Workshop, Fourth Int. Conf. on Online Deliberation (Leeds, 30 June–2 July, 2010), http://olnet.org/odet2010
12. Andriessen, J. Baker, M., Suthers, D.: Arguing to Learn: Confronting Cognitions in Computer-Supported Collaborative Learning Environments. Kluwer (2006)
13. Scardamalia, M., Bereiter, C.: Computer support for knowledge-building communities. Journal of the Learning Sciences 3(3), 265-83. (1994)
14. Buckingham Shum, S.: “Sensemaking on the Pragmatic Web: A Hypermedia Discourse Perspective”. Proc. PragWeb'06: 1st International Conference on the Pragmatic Web, ACM Digital Library: http://dl.acm.org (2006)
15. Buckingham Shum, S.,: Cohere: Towards Web 2.0 Argumentation. In 2nd Int. Conference on Computational Models of Argument, Toulouse. IOS Press: Amsterdam (2008)
16. De Liddo, A., Buckingham Shum, S.: Cohere: A prototype for contested collective intelligence. In: ACM Computer Supported Cooperative Work: Workshop on Collective Intelligence in Organizations, Feb 6-10, 2010, GA. http://oro.open.ac.uk/19554 (2010)
17. De Liddo, A.: From Open Content to Open Thinking. In: World Conference on Educational Multimedia, Hypermedia and Telecommunications (Ed-Media 2010), 29 Jun, Toronto, Canada. Available at: http://oro.open.ac.uk/22283/. (2010)
18. Borgatti, S. Everett, M., Freeman, L.: UCINET 6.0 for Windows, MA: Analytic Technologies. http://www.analytictechn.com (2002)
19. Smith, M., Shneiderman, B., Milic-Frayling, N., Rodrigues, E.M., Barash, V., Dunne, C., Capone, T., Perer, A., Gleave, E.: Analyzing (Social Media) Networks with NodeXL. In C&T '09: Proceedings of the Fourth International Conference on Communities and Technologies. Springer. (2009)
20. Barabasi, A.L., Albert, R., Jeong, H.: “Scale-free characteristics of random networks: the topology of the world-wide web”. Physica A: Statistical Mechanism and its Applications, 281(1-4), 69-77 (2000).
21. Wasserman, S. Faust, K.: Social Network Ananlysis, Cambridge: CUP (1994) 22. Sándor, A.: Modeling metadiscourse conveying the author's rhetorical strategy in
biomedical research abstracts, Revue Française de Linguistique Appliquée 200(2):97—109 (2007)