discover cube 6.4 tutorial - amazon web...
TRANSCRIPT


Copyright © 2007–2016 Citilabs, Inc. All rights reserved.
Citilabs is a registered trademark of Citilabs, Inc. All other brand names and product names used in this book are trademarks, registered trademarks, or trade names of their respective holders.
The information contained in this document is the exclusive property of Citilabs. This work is protected under United States copyright law and the copyright laws of the given countries of origin and applicable international laws, treaties, and/or conventions. No part of this work may be reproduced or transmitted in any form or by any means, electronic or mechanical, including photocopying or recording, or by any information storage or retrieval system, except as expressly permitted in writing by Citilabs.
Citilabs has carefully reviewed the accuracy of this document, but shall not be held responsible for any omissions or errors that may appear. Information in this document is subject to change without notice
Book version 60-040-0 January 11, 2016

Discover Cube 6.4 Tutorial
Contents
About This Document . . . . . . . . . . . . . . . . . . . . . . . . . . . . . . . . . . . . . . . . . . . . . vii
Chapter 1 Introduction to Cube . . . . . . . . . . . . . . . . . . . . . . . . . . . . . . . . . . . . . . . . . . . . . . . 1
The Cube software suite . . . . . . . . . . . . . . . . . . . . . . . . . . . . . . . . . . . . . . . . . . . . . . . 2Architecture . . . . . . . . . . . . . . . . . . . . . . . . . . . . . . . . . . . . . . . . . . . . . . . . . . . . . . . . . . . 3
Cube Base. . . . . . . . . . . . . . . . . . . . . . . . . . . . . . . . . . . . . . . . . . . . . . . . . . . . . . . . . 4Cube Voyager . . . . . . . . . . . . . . . . . . . . . . . . . . . . . . . . . . . . . . . . . . . . . . . . . . . . . 5Cube Cargo . . . . . . . . . . . . . . . . . . . . . . . . . . . . . . . . . . . . . . . . . . . . . . . . . . . . . . . 5Cube Dynasim . . . . . . . . . . . . . . . . . . . . . . . . . . . . . . . . . . . . . . . . . . . . . . . . . . . . 6Cube Analyst & Analyst Drive . . . . . . . . . . . . . . . . . . . . . . . . . . . . . . . . . . . . . . 6Cube Land . . . . . . . . . . . . . . . . . . . . . . . . . . . . . . . . . . . . . . . . . . . . . . . . . . . . . . . . 7Cube Cloud . . . . . . . . . . . . . . . . . . . . . . . . . . . . . . . . . . . . . . . . . . . . . . . . . . . . . . . 7
Working environment . . . . . . . . . . . . . . . . . . . . . . . . . . . . . . . . . . . . . . . . . . . . . . . . . 9Key Features . . . . . . . . . . . . . . . . . . . . . . . . . . . . . . . . . . . . . . . . . . . . . . . . . . . . . . 9Window Management. . . . . . . . . . . . . . . . . . . . . . . . . . . . . . . . . . . . . . . . . . . . 10
Tabbed Window Interface . . . . . . . . . . . . . . . . . . . . . . . . . . . . . . . . . . . . 10Legacy Interface . . . . . . . . . . . . . . . . . . . . . . . . . . . . . . . . . . . . . . . . . . . . . 11
Developer and Applier Mode . . . . . . . . . . . . . . . . . . . . . . . . . . . . . . . . . . . . . 11Developer mode . . . . . . . . . . . . . . . . . . . . . . . . . . . . . . . . . . . . . . . . . . . . . . . . . 12Applier mode . . . . . . . . . . . . . . . . . . . . . . . . . . . . . . . . . . . . . . . . . . . . . . . . . . . . 12
Integration with ArcGIS . . . . . . . . . . . . . . . . . . . . . . . . . . . . . . . . . . . . . . . . . . . . . . . 14Integration of the Cube modules . . . . . . . . . . . . . . . . . . . . . . . . . . . . . . . . . . . . . . 15
Chapter 2 Getting Started . . . . . . . . . . . . . . . . . . . . . . . . . . . . . . . . . . . . . . . . . . . . . . . . . . . . . 17
Chapter 3 Exploring Cube Base and Cube Voyager . . . . . . . . . . . . . . . . . . . . . . . . . 19
Maps. . . . . . . . . . . . . . . . . . . . . . . . . . . . . . . . . . . . . . . . . . . . . . . . . . . . . . . . . . . . . . . . . 20Models . . . . . . . . . . . . . . . . . . . . . . . . . . . . . . . . . . . . . . . . . . . . . . . . . . . . . . . . . . . . . . . 28
Getting started. . . . . . . . . . . . . . . . . . . . . . . . . . . . . . . . . . . . . . . . . . . . . . . . . . . 28
Discover Cube 6.4 Tutorial iii

Contents
Understanding the model . . . . . . . . . . . . . . . . . . . . . . . . . . . . . . . . . . . . . . . . 31Running an existing scenario . . . . . . . . . . . . . . . . . . . . . . . . . . . . . . . . . . . . . 33
Highway networks. . . . . . . . . . . . . . . . . . . . . . . . . . . . . . . . . . . . . . . . . . . . . . . . . . . . 39Improving network quality . . . . . . . . . . . . . . . . . . . . . . . . . . . . . . . . . . . . . . . 39Changing the road network . . . . . . . . . . . . . . . . . . . . . . . . . . . . . . . . . . . . . . 43
Public transit . . . . . . . . . . . . . . . . . . . . . . . . . . . . . . . . . . . . . . . . . . . . . . . . . . . . . . . . . 53Demographic data. . . . . . . . . . . . . . . . . . . . . . . . . . . . . . . . . . . . . . . . . . . . . . . . . . . . 59
Creating maps from demographic data . . . . . . . . . . . . . . . . . . . . . . . . . . . 59Running demographic-based scenarios . . . . . . . . . . . . . . . . . . . . . . . . . . . 64
Chapter 4 Exploring Reports . . . . . . . . . . . . . . . . . . . . . . . . . . . . . . . . . . . . . . . . . . . . . . . . . 69
Working with existing reports . . . . . . . . . . . . . . . . . . . . . . . . . . . . . . . . . . . . . . . . . 70Examining reports. . . . . . . . . . . . . . . . . . . . . . . . . . . . . . . . . . . . . . . . . . . . . . . . 71Generating reports for new scenarios . . . . . . . . . . . . . . . . . . . . . . . . . . . . . 73Working with multiple scenarios . . . . . . . . . . . . . . . . . . . . . . . . . . . . . . . . . . 77Single-scenario reports . . . . . . . . . . . . . . . . . . . . . . . . . . . . . . . . . . . . . . . . . . . 78Multiple-scenario reports . . . . . . . . . . . . . . . . . . . . . . . . . . . . . . . . . . . . . . . . . 80
Editing existing reports . . . . . . . . . . . . . . . . . . . . . . . . . . . . . . . . . . . . . . . . . . . . . . . 82General properties . . . . . . . . . . . . . . . . . . . . . . . . . . . . . . . . . . . . . . . . . . . . . . . 82Layout . . . . . . . . . . . . . . . . . . . . . . . . . . . . . . . . . . . . . . . . . . . . . . . . . . . . . . . . . . . 86Fonts . . . . . . . . . . . . . . . . . . . . . . . . . . . . . . . . . . . . . . . . . . . . . . . . . . . . . . . . . . . . 87Data labels . . . . . . . . . . . . . . . . . . . . . . . . . . . . . . . . . . . . . . . . . . . . . . . . . . . . . . . 89Charts . . . . . . . . . . . . . . . . . . . . . . . . . . . . . . . . . . . . . . . . . . . . . . . . . . . . . . . . . . . 91Multiple scenario comparisons . . . . . . . . . . . . . . . . . . . . . . . . . . . . . . . . . . . 93
Generating new reports . . . . . . . . . . . . . . . . . . . . . . . . . . . . . . . . . . . . . . . . . . . . . . 99Creating reports from existing reports . . . . . . . . . . . . . . . . . . . . . . . . . . . . 99Creating reports from scratch . . . . . . . . . . . . . . . . . . . . . . . . . . . . . . . . . . . . 101
Chapter 5 Exploring Cube Cargo. . . . . . . . . . . . . . . . . . . . . . . . . . . . . . . . . . . . . . . . . . . . 109
Cubetown Cargo model . . . . . . . . . . . . . . . . . . . . . . . . . . . . . . . . . . . . . . . . . . . . . 110Forecasting demand for proposed rail service . . . . . . . . . . . . . . . . . . . . . . . . 115
Developing a scenario for proposed rail service . . . . . . . . . . . . . . . . . . 115Evaluating results . . . . . . . . . . . . . . . . . . . . . . . . . . . . . . . . . . . . . . . . . . . . . . . 117
Forecasting impact of rail pricing. . . . . . . . . . . . . . . . . . . . . . . . . . . . . . . . . . . . . 120
Chapter 6 Learning More . . . . . . . . . . . . . . . . . . . . . . . . . . . . . . . . . . . . . . . . . . . . . . . . . . . . 123
User support . . . . . . . . . . . . . . . . . . . . . . . . . . . . . . . . . . . . . . . . . . . . . . . . . . . . . . . . 124User forum . . . . . . . . . . . . . . . . . . . . . . . . . . . . . . . . . . . . . . . . . . . . . . . . . . . . . . . . . . 125Training . . . . . . . . . . . . . . . . . . . . . . . . . . . . . . . . . . . . . . . . . . . . . . . . . . . . . . . . . . . . . 126Consulting and assistance . . . . . . . . . . . . . . . . . . . . . . . . . . . . . . . . . . . . . . . . . . . 127
iv Discover Cube 6.4 Tutorial

Contents
Chapter 7 Acquiring Cube 6.4 . . . . . . . . . . . . . . . . . . . . . . . . . . . . . . . . . . . . . . . . . . . . . . . 129
Licensing options. . . . . . . . . . . . . . . . . . . . . . . . . . . . . . . . . . . . . . . . . . . . . . . . . . . . 130Contacts . . . . . . . . . . . . . . . . . . . . . . . . . . . . . . . . . . . . . . . . . . . . . . . . . . . . . . . . . . . . 131
Index . . . . . . . . . . . . . . . . . . . . . . . . . . . . . . . . . . . . . . . . . . . . . . . . . . . . . . . . . . . . . . . 133
Discover Cube 6.4 Tutorial v

Contents
vi Discover Cube 6.4 Tutorial

Discover Cube 6.4 Tutorial
About This Document
Welcome to Cube 6.4!
The Discover Cube 6.4 Tutorial will introduce you to the features and capabilities of Cube. This document includes information and exercises that can help you understand how Cube works, what Cube can do, and how you might start using Cube for analyzing your transportation systems.
This document contains the following chapters:
• Chapter 1, “Introduction to Cube” — Introduces you to Cube and to the features and architecture of the Cube software suite.
• Chapter 2, “Getting Started” — Lists components to install in order to do the exercises.
• Chapter 3, “Exploring Cube Base and Cube Voyager” — Guides you through exercises that demonstrate how you can use Cube Base and Cube Voyager when developing data, running scenarios, and examining and analyzing outputs.
• Chapter 4, “Exploring Reports” — Guides you through a series of exercises that demonstrate how you can use Cube 6.4 to simplify the analysis and presentation of results from travel forecasting models.
• Chapter 5, “Exploring Cube Cargo” — Guides you through a series of exercises that demonstrate how you can use Cube to analyze freight traffic.
Discover Cube 6.4 Tutorial vii

• Chapter 6, “Learning More” — Discusses the additional resources available for learning more about Cube.
• Chapter 7, “Acquiring Cube 6.4”— Provides more information on how you can acquire a customized Cube software suite.
viii Discover Cube 6.4 Tutorial

Discover Cube 6.4 Tutorial
1 Introduction to Cube
This chapter introduces you to Cube 6.4 and to the features and architecture of the Cube software suite. Topics include:
• The Cube software suite
• Architecture
• Working environment
• Integration with ArcGIS
• Integration of the Cube modules
Discover Cube 6.4 Tutorial 1

Introduction to CubeThe Cube software suite1
The Cube software suiteThe Cube software suite is a comprehensive set of modules that support transportation planning. With Cube, you can generate decision-making information quickly using powerful modeling and GIS techniques, statistics and comparisons, high-quality graphical output, and a variety of reporting methods.
To help you complete transportation planning and engineering tasks, Cube offers:
• Two unique working modes: Developer mode — Allows you to design and develop
transportation models Applier mode — Allows you to quickly and easily apply
models for building, testing, and evaluating scenarios
• A set of modules and extensions that work within the integrated Cube software environment, using common data sources. The modules support: Passenger forecasting (Cube Voyager) Freight forecasting (Cube Cargo) Traffic microsimulation (Cube Dynasim) Trip matrix optimization (Cube Analyst)
The extensions support: Dynamic traffic assignment (Cube Avenue) Running models across multiple processors (Cube Cluster)
• An intuitive model and application workspace that allows you to easily manipulate data
• Direct access to and from ArcGIS, the industry standard for geographic data
• Tools for developing and sharing high quality 2D and 3D animations
2 Discover Cube 6.4 Tutorial

Introduction to CubeArchitecture 1
Architecture Cube is a modular system. You can supplement the core module, Cube Base, with other modules that support specific planning techniques. Several modules offer extensions, which enhance a module’s feature set. You only need to acquire the modules and extensions required for your tasks.
This section discusses each of the Cube modules:
• Cube Base
• Cube Voyager
• Cube Cargo
• Cube Dynasim
Discover Cube 6.4 Tutorial 3

Introduction to CubeArchitecture1
• Cube Analyst & Analyst Drive
• Cube Land
• Cube Cloud
Cube BaseCube Base is the core module of the Cube software suite. Cube Base provides the user interface that supports all Cube modules. Cube Base offers tools for:
• Developing, editing, manipulating, mapping, and graphing data using geographic information system (GIS) techniques
• Designing and applying the modeling and microsimulation process
• Creating, managing, comparing, and analyzing scenarios
• Creating high-quality reports and charts from single or multiple scenarios
Integrated with ESRI’s ArcGIS, Cube Base offers advanced GIS functions.
You can use Cube Base to update and apply models developed in Cube Voyager and in Citilabs’ other travel forecasting systems: TP+, TRIPS, and Tranplan.
An optional extension is available for Cube Base:
• Cube Cluster — Adds functions that enable model processes to run across multiple computer processors, either within one or on multiple personal computers or servers
4 Discover Cube 6.4 Tutorial

Introduction to CubeArchitecture 1
Cube VoyagerCube Voyager combines Citilabs’ latest technologies to forecast personal travel. Cube Voyager uses a modular, script-based structure. This structure allows you to incorporate any modeling methodology in your forecast, such as standard four-step models, discrete-choice models, and activity-based models.
With Cube Voyager’s open and user-friendly framework, you can model a wide variety of planning policies and improvements at the urban, regional, or long-distance levels. You can create a comprehensive library of planning functions under the general Cube framework, and use that library to model various policies and improvements. With a well-defined library, you can easily manage data and code complex methodologies with a simple step-by-step approach.
Advanced methodologies allow you to model junction-based capacity restraints for highway analysis, and discrete-choice path building for multiroute transit assignment. With Cube Voyager’s highly flexible network and matrix calculators, you can calculate travel demand and to compare scenarios in detail.
An optional extension is available for Cube Voyager:
• Cube Avenue — Adds advanced dynamic traffic assignment, or “mesoscopic assignment,” to Cube Voyager
Cube Cargo Cube Cargo forecasts freight movement. Cube Cargo uses a commodity-based approach for analyzing freight demand. You can use Cube Cargo to test a wide variety of policies and infrastructure improvements, such as alternative pricing strategies or freight-specific facilities.
Cube Cargo works seamlessly with other Cube modules, including Cube Voyager and Cube Analyst. Cube Cargo also works with TP+ and TRIPS. With Cube Cargo, you can add freight forecasting to your existing passenger data and models.
Discover Cube 6.4 Tutorial 5

Introduction to CubeArchitecture1
With Cube Cargo, you can forecast:
• Tons of goods by commodity type and by transport mode, which you can use to analyze flow of goods
• Number of trucks by truck type, which you can use to analyze truck vehicle flows
Cube Dynasim Cube Dynasim simulates multimodal traffic at a microscopic level. Cube Dynasim helps planners and engineers analyze the interactions between alternative infrastructure designs, operating characteristics, and travel demand forecasts. With Cube Dynasim, you can simulate systems of any size, and easily share data with other Cube modules.
Cube Dynasim captures the dynamics of time-dependent traffic phenomena using sophisticated driver-behavior models. Cube Dynasim also performs detailed operational analysis of complex traffic on roads while realistically representing the flow of automobiles, trucks, buses, rail, and pedestrians.
Cube Dynasim provides stunning 2D and 3D animations and graphics for clear evaluation.
Cube Analyst & Analyst DriveCube Analyst estimates and updates statistically optimized trip matrices for base-year automobile, truck, and public transit trips. An accurate origin-destination matrix of existing travel is one of the most valuable pieces of data for transportation planning. With Cube Analyst, you can manipulate extensive data sets and develop or update origin-destination matrices.
Cube Analyst uses mathematical techniques to find trip matrices consistent with observed transport demand and traffic counts. With Cube Analyst, you can work more efficiently and generate more accurate results than with manual methods.
6 Discover Cube 6.4 Tutorial

Introduction to CubeArchitecture 1
Cube Analyst Drive builds on the estimation tools provided to the Cube software suite by the Analyst module. It is a completely new program with advanced capabilities not previously available to the Cube platform. Some key differences exist between some of the files that are used by the two programs; for example, Analyst Drive uses a new ICP file format for the Highway program which has been developed to dramatically reduce the file size for large problems. Analyst Drive also introduces dynamic matrix estimation with Cube Avenue, simulatenous estimation of multiple user classes, 64-bit support, and increased performance through multithreading.
Cube Land Cube Land simulates the real estate market to predict detailed information about household and employment by zone or parcel. Cube Land takes into account information about demand, real estate supply, transport accessibility, other zonal or parcel attributes, regulations, and economic incentives. You can easily integrate Cube Land into existing transportation planning models and can apply Cube Land for either long- or short-term horizons to model the interaction between land use and transportation.
Cube CloudCube Cloud provides traffic analysts, engineers and planners the ability to run and share their transportation analysis and forecasting models within a cloud computing environment. Models are designed within Desktop Cube and published to the cloud. Users are invited to access the models, create and run tests, undertake analysis of the data using maps and charts and manage the associated information.
The client remains the owner of their data and models, but may easily and safely invite others to use their tools to test scenarios and to get model results. It is the perfect environment for sharing tools within work teams and with stakeholders.
Discover Cube 6.4 Tutorial 7

Introduction to CubeArchitecture1
Models run much faster in Cube Cloud since the calculations are spread, using Citilabs' Cube Cluster technology, across a large number of cores located within the cloud. The computing and storage environment of Cube Cloud is provided by Amazon Elastic Compute Cloud. The cloud offers essentially unlimited resources enabling the running of many analyses simultaneously.
If your model or analysis uses specialized programs, these can be uploaded to Cube Cloud and used along with Cube modules to support your complete process.
8 Discover Cube 6.4 Tutorial

Introduction to CubeWorking environment 1
Working environmentThis section describes:
• Key Features
• Window Management
• Developer and Applier Mode
Key FeaturesCube Base supports all Cube modules. The user interface includes:
• Scenario Manager — For managing alternatives and associated input and output data and reports
• Mapping window — For developing and editing transportation networks, and producing high-quality charts and maps
• Application Manager — For building and documenting the model process through a flow chart interface
• Table window — For viewing and editing numeric data in tabular format
• Ribbon — Cube 6.4 uses a convenient Ribbon command interface. The commands displayed in the ribbon change depending on the type of file currently open, and the task at hand. The ribbon features: Tabs — a ribbon tab displays a toolbar of related
commands. Different tabs will appear depending on the file context.
Groups — Ribbon commands within a tab are Grouped when they have closely-related functions.
Caption Button — Caption buttons are located on the lower-right corner of many groups. Clicking the caption button brings up a settings window related to the group’s function.
Discover Cube 6.4 Tutorial 9

Introduction to CubeWorking environment1
• Data Manager — For organizing and opening data sources, including maps, tables, geodatabases, and more
Window ManagementCube Manages open windows by two means: the Tabbed Window Interface, and the Legacy Interface.
Tabbed Window Interface
Cube introduces a convenient new tabbed window interface to organize your workspace. As shown below, you may click the down arrow icon to view a list of all open windows. Click the left and right
Mapping window
Scenario Manager
Table window
Data Manager
Application Manager
Ribbon
10 Discover Cube 6.4 Tutorial

Introduction to CubeWorking environment 1
arrows to scroll through all available window tabs (when many are open). Click the X on any tab, or the X near the pointers, to close the current window.
Legacy Interface
Alternately, Windows can be managed similarly to previous versions of Cube. Go to File > Options > General tab, and unselect “Display Windows as Tabs.” In this “Legacy” mode, selecting an individual window makes that window the active window.
Once in Legacy mode, you can open multiple windows of different file types simultaneously using the View ribbon tab. There you will find commands to cascade windows, tile them, minimize all, and more.
Developer and Applier ModeThrough Cube Base, you can operate Cube in two modes:
• Developer mode
• Applier mode
Discover Cube 6.4 Tutorial 11

Introduction to CubeWorking environment1
Developer modeIn developer mode, you can use Application Manager to design a model structure and manipulate the associated data. Application Manager offers a flow-chart interface for designing and documenting model processes. Model developers can also create user interfaces for those who apply or run the model.
Applier modeIn applier mode, you can view the process flow chart, edit selected inputs, and run the model. Model appliers do not edit the process flow chart. Model appliers evaluate alternatives by creating scenarios in Scenario Manager and defining the associated inputs
Application Manager
12 Discover Cube 6.4 Tutorial

Introduction to CubeWorking environment 1
in the scenario window. Model developers can customize the scenario window offering model appliers the choices needed for developing and testing scenarios.
Scenario Manager
Scenario window
Discover Cube 6.4 Tutorial 13

Introduction to CubeIntegration with ArcGIS1
Integration with ArcGISThe primary mapping window is the GIS window. The GIS window uses the ESRI ArcGIS engine to display a map depicting the geographic information stored in geodatabases, shapefiles, CAD format files, and raster images, as well as other map elements that you specify or create.
The GIS window represents geographic information as a collection of layers along with defined elements in a map. You can save map documents, share them with other analysts who can use the data within ArcGIS, and easily bring the data back to Cube for further modeling and simulation.
14 Discover Cube 6.4 Tutorial

Introduction to CubeIntegration of the Cube modules 1
Integration of the Cube modulesYou access the Cube modules—Cube Voyager, Cube Cargo, Cube Dynasim, and Cube Analyst—from the Ribbon menu of Cube Base’s Application Manager window. Other legacy products from Citilabs, such as TRIPS, TP+, and Tranplan, are accessed in the same way.
From Application Manager, you can use the Cube modules and other integrated products as functions when developing a modeling and simulation process. You can also integrate other “User Programs,” such as specialized routines in C++, C, Fortran, or any other programming language, in the same way. Finally, you can integrate third-party software products, such as Microsoft Excel and Crystal Reports, within the Cube working environment.
Discover Cube 6.4 Tutorial 15

Introduction to CubeIntegration of the Cube modules1
16 Discover Cube 6.4 Tutorial

Discover Cube 6.4 Tutorial
2 Getting Started
The Discover Cube 6.4 Tutorial is installed with the Cube software. The Cubetown data that the exercises use may be downloaded from the Citilabs Learning Center, below. (The Tutorial may also be downloaded separately from the Leanirng Center.)
http://www.citilabs.com/support/learning-center
Install the software and data before proceeding to the exercises.
Cube may be installed from a download, or a DVD. Follow the installer’s directions to install the software. In order to complete the tutorials, you should install:
• Cube Base
• Cube Voyager
• Cube Cargo
• Cube Land
You will also need to install Cubetown, available from the Learning Center (above). During its installation, you can alter the directory where the wizard installs the Cubetown data files.
NOTE: The file paths given in the tutorial exercises assume you install Cubetown data in the C:\Cubetown directory.
Discover Cube 6.4 Tutorial 17

Getting Started2
18 Discover Cube 6.4 Tutorial

Cube 6.4Discover Cube 6.4 Tutorial
3 Exploring Cube Base and Cube Voyager
You can use Cube to develop data, run scenarios, and examine and analyze outputs. This chapter contains a series of exercises that help you explore tasks you might complete with Cube Base and Cube Voyager. Topics include:
• Maps
• Models
• Highway networks
• Public transit
• Demographic data
Discover Cube 6.4 Tutorial 19

Exploring Cube Base and Cube VoyagerMaps3
MapsCube Base displays geographic information in a map. You can use Cube Base to work with maps and analyze data. This section contains an exercise that demonstrates how you might use Cube Base to display a network, add new layers from ArcGIS Online or a geodatabase, adjust the map display, and save a map document.
To create an ArcGIS map document
1. Open the Discover Cube catalog.
a. Start Cube.
You can:
• Double-click the Cube icon on your desktop.
• Click the Start button, point to All Programs, point to Citilabs, and choose Cube.
20 Discover Cube 6.4 Tutorial

Exploring Cube Base and Cube VoyagerMaps 3
Cube displays the Welcome to Cube dialog box.
a. Select Discover Cube Catalog.
Cube opens the Discover Cube catalog in Scenario Manager. The catalog shows the scenarios, data, and applications or models used with the Cubetown demonstration models.
1. Open the input highway network.
a. Under the Data pane in Scenario Manager, click to expand Inputs and Voyager.
b. Double-click HW Network.
Discover Cube 6.4 Tutorial 21

Exploring Cube Base and Cube VoyagerMaps3
Because the input highway network is a custom feature data set stored in an ESRI personal geodatabase file, Cube opens the input highway network in a new GIS map window. The window shows the map and a table of contents, which lists the layers in the map.
2. Add a geodatabase feature class to the map.
a. From the Home ribbon tab, click Add Data and choose Geodatabase Data.
b. A file browser will open. Navigate to C:\Cubetown\Inputs\cubetown.mdb.
Map
Table of contents
22 Discover Cube 6.4 Tutorial

Exploring Cube Base and Cube VoyagerMaps 3
c. In the right-hand pane, double-click Demographics to add a transportation analysis zone (TAZ) layer to the map.
3. Add an ArcGIS Online layer to the map (requires Internet access).
ArcGIS Online is a free service provided by ESRI including background imagery that can be loaded using an internet connection. To find out more, visit www.esri.com/arcgisonline.
a. From the Home ribbon tab, click Add Data and choose Layer File.
b. In the Add Layer from File dialog box, navigate to the C:\Cubetown\GIS directory, select World_Imagery.lyr, and click Open.
Discover Cube 6.4 Tutorial 23

Exploring Cube Base and Cube VoyagerMaps3
Cube adds the World Imagery layer to the map. Cube loads the imagery shown in the layer from ESRI’s ArcGIS Online service using your Internet connection.
4. Use the table of contents to adjust the map display.
a. Drag the Demographics layer to the top of the list.
24 Discover Cube 6.4 Tutorial

Exploring Cube Base and Cube VoyagerMaps 3
Cube redraws the map, displaying the TAZ boundaries on top of the imagery.
b. Drag the NoBuild network group layer to the top of the list.
NOTE: Do not move the NoBuild_Node or NoBuild_Link layers outside the NoBuild group.
Discover Cube 6.4 Tutorial 25

Exploring Cube Base and Cube VoyagerMaps3
Cube redraws the map with the network shown on top of the TAZ boundaries and background imagery.
5. Use the toolbar buttons to adjust the map display, as desired.
You might: Turn off one or more layers
• Clear a layer’s check box in the table of contents, to hide the layer from the displayed map.
Zoom to a particular area
• Click the Fixed Zoom In button one or more times to zoom in by a fixed amount.
• Click the Zoom In button and draw a box around the desired area of focus on the map.
26 Discover Cube 6.4 Tutorial

Exploring Cube Base and Cube VoyagerMaps 3
Switch back and forth between two views using the Go Back to Previous Extent and the Go to Next Extent buttons.
View the entire set of active layers by clicking the Full Extent button.
6. Save your work as a map document so that you can retrieve it later.
a. From the File menu, choose Save As.
b. In the Save As dialog box, navigate to the directory where you save maps and enter the name of the file.
c. Click Save.
7. From the File menu, choose Close to close the map.
Discover Cube 6.4 Tutorial 27

Exploring Cube Base and Cube VoyagerModels3
Models Transportation planning models require a structure that allows you to study the effects of varying inputs. In Cube, that structure consists of:
• Applications — Applications describe the model Cube uses to process data. You use Application Manager to develop models. You save the models as applications.
• Scenarios — Scenarios link a specific set of inputs to an application. You develop scenarios to apply applications. A scenario links a specific set of inputs to an application.
• Catalogs — Catalogs store related applications and data. You create catalogs as the container for your work. Catalogs provide convenient access to the applications and scenarios you need to complete a study.
This section guides you through exercises that demonstrate how you work with applications, scenarios, and catalogs to run a transportation planning model. Topics include:
• Getting started
• Understanding the model
• Running an existing scenario
Getting startedCube stores the applications and scenarios you use for a study in a catalog. The exercise in this section guides you through opening the catalog that contains the exercise’s data, the Discover Cube catalog, and examining the catalog’s Cube Voyager model.
28 Discover Cube 6.4 Tutorial

Exploring Cube Base and Cube VoyagerModels 3
To open the Discover Cube catalog and model
1. Open the Discover Cube catalog.
If Cube is already open:
a. From the File menu, choose Open.
b. In the Open File dialog box, navigate to the C:\Cubetown directory, select Discover Cube.cat, and click Open.
If Cube is not open:
a. Open Cube, such as by double-clicking the desktop icon or by clicking the Start button and navigating to the Cube application.
b. In the Welcome to Cube window, select Discover Cube Catalog.
Cube opens the Discover Cube catalog in Scenario Manager. A catalog stores a set of models, data, and scenarios.
Discover Cube 6.4 Tutorial 29

Exploring Cube Base and Cube VoyagerModels3
Scenario Manager has four panes: Scenarios — Lists defined scenarios. Use this section to
develop or edit scenarios and to apply the model. Data — Shows input and output data for each scenario. Use
this section for easy access to these files. Applications — Lists the available model processes. Use this
section to select the model you wish to use. Keys — Lists the Catalog Keys available for this particular
catlaog. From this pane, you may also modify, add or remove keys.
To forecast personal travel in this exercise, we will use the Cube Voyager Demonstration Model.
2. Under App, double-click Cube Voyager Demonstration Model.
Scenarios
Data
Applications
Keys
30 Discover Cube 6.4 Tutorial

Exploring Cube Base and Cube VoyagerModels 3
A new window, called Application Manager, opens showing a flow-chart view of the model process.
We are examining the model in “applier mode.” In this mode, Cube presents the model for easy use by those that create and run scenarios. In this mode, you cannot change the model, but you can apply (run) the model.
Understanding the modelThe Cube Voyager Demonstration Model is a “four-step” model consisting of:
• Trip generation
• Trip distribution
• Mode split (mode choice)
Discover Cube 6.4 Tutorial 31

Exploring Cube Base and Cube VoyagerModels3
• Mode assignment
The model has other steps for developing networks and analyzing the results.
Cube is an open and flexible tool. Cube enables model developers to build models using almost any model structure, including emerging methods in activity models and tour-based approaches. The four-step model used in the demonstration system is the most commonly used structure by analysts around the world.
The flow chart represents model steps with dark blue boxes. To the left of each step are light blue boxes, which show inputs to the step. To the right of each step are green boxes, which show the outputs from the step. Links show where outputs from one step become inputs to another step.
The model has a loop around the Distribution, Mode-Choice, and Assignment steps. This is called a “feedback loop”—the model takes the travel times from the assignment model (the congested travel times) and inputs those travel times to the distribution step, redistributing the trips using the congested times. The model also inputs the congested travel times to the mode-choice step. The model iterates between these steps until it meets equilibrium criteria.
Input Step Output
Link — output from Trip Distribution step becomes input to Mode Choice step
32 Discover Cube 6.4 Tutorial

Exploring Cube Base and Cube VoyagerModels 3
You can click an output or an input to see how they relate to each other in the loop.
Running an existing scenarioThe Cube Voyager Demonstration Model studies a town called Cubetown. We will use the model to study impacts associated with a new road. The model contains a predefined scenario, the Base scenario. Base scenario models existing conditions in Cubetown.
In the exercise in this section, you will run a scenario to compute the traffic generated based on the current inputs and examine various outputs.
Discover Cube 6.4 Tutorial 33

Exploring Cube Base and Cube VoyagerModels3
To run the Base scenario
1. In Scenario Manager under Scenarios, double-click Base.
Cube opens the scenario window for the Base scenario. You use this window to run and manage the scenario.
Working in Cube’s developer mode, model developers configure the colors, logo, explanatory text, and input fields most appropriate for the model.
34 Discover Cube 6.4 Tutorial

Exploring Cube Base and Cube VoyagerModels 3
2. From the scenario window, click Run.
The Task Monitor window opens and shows the progress of the model run.
When the run is complete, the Task Run Result dialog box opens.
3. Click OK.
The dialog box and the Task Monitor window closes.
Next, we will examine the results.
4. Under Data in Scenario Manager, click to expand Outputs, Voyager, and Highway Assignment.
Discover Cube 6.4 Tutorial 35

Exploring Cube Base and Cube VoyagerModels3
5. Open the highway output network by double-clicking HW Loads.
The GIS window opens, showing the loaded highway network and estimated flows for the tested scenario.
6. Add volume bandwidths to visualize traffic loads on the map.
a. Select the CombinedOutputs layer in the table of contents.
b. From the GIS Analysis ribbon tab, choose Multi-Bandwidth.
The Highway Layer Link Band Width Settings dialog box opens.
36 Discover Cube 6.4 Tutorial

Exploring Cube Base and Cube VoyagerModels 3
c. Verify that the settings show the volume.
NOTE: You can right-click in the Selection Criteria edit box to select FUNC_CLASS from a list of available variables.
d. Click OK.
Property ValueSet 3: Volume BandwidthAttributes V_1Value / pixel 500Selection Criteria FUNC_CLASS=1-9
Discover Cube 6.4 Tutorial 37

Exploring Cube Base and Cube VoyagerModels3
The GIS window updates to show the bandwidth display.
7. Close the map, scenario window, and Application Manager.
Save the map, if desired.
38 Discover Cube 6.4 Tutorial

Exploring Cube Base and Cube VoyagerHighway networks 3
Highway networksCube Base includes network-editing tools. This section contains exercises that demonstrate how you can use these tools when working with a highway network:
• Improving network quality
• Changing the road network
Improving network qualityCube Base includes tools that help you improve the quality of your network. For example, your network might simplify links with a straight line between two points. With Cube Base, you can snap the links to an underlying shape data and add vertices to better represent actual road shape and distances.
This section contains an exercise that shows how you can use vertex editing to properly apply true shape to a freeway interchange in the Cubetown model.
To use vertex editing to apply true shape to a freeway
1. If necessary, open the Discover Cube catalog.
Refer to “To open the Discover Cube catalog and model” on page 29.
2. Open the highway network for the Build Road scenario.
a. Under Scenarios in Scenario Manager, expand Base, and select Build Road.
b. Under Data, expand Inputs and Voyager, and double-click HW Network to open the network feature data set for the Build Road scenario.
Cube opens a GIS window showing a map of the scenario’s highway network input. Currently, the network uses a straight link to represent a cloverleaf interchange.
3. Add highway centerline data to the map.
Discover Cube 6.4 Tutorial 39

Exploring Cube Base and Cube VoyagerHighway networks3
a. From the Home ribbon tab, click Add Data and choose Geodatabase Data.
A file browser window opens.
b. Navigate to C:\Cubetown\GIS and select MapElements.mdb.
c. Under Datasets, select RoadCenterline. Click Open to add a new layer to the map containing the feature.
4. Focus the display on the freeway interchange.
a. Click the Select Features tool.
b. Click and drag a small box in the interchange near the center of the network, selecting the freeway ramps.
Feature Explorer opens, showing the selected features.
c. Click the Zoom To Selected Features button to focus on that area.
Selected interchange
40 Discover Cube 6.4 Tutorial
Exploring Cube Base and Cube VoyagerHighway networks 3
5. Set the window to editing mode for the proper layer.
a. On the Editing toolbar, click the Editor button, and choose Start Editing.
The Editing toolbar becomes active.
b. Click the Editor button and select two operating modes: Vertex Snap and Edit Vertex.
c. In the Layers drop-down list, select Build_Link, the layer where we will edit the vertices.
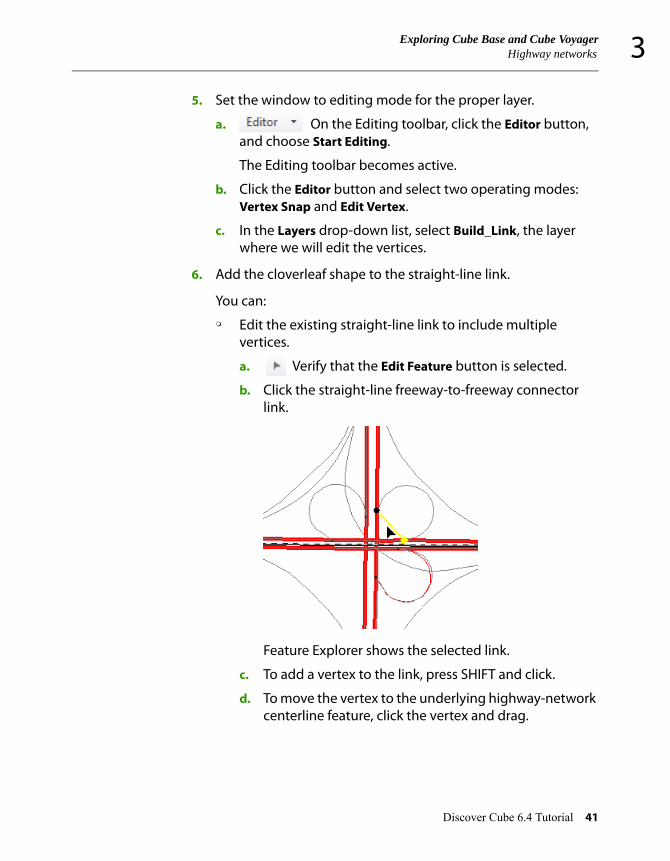
6. Add the cloverleaf shape to the straight-line link.
You can: Edit the existing straight-line link to include multiple
vertices.
a. Verify that the Edit Feature button is selected.
b. Click the straight-line freeway-to-freeway connector link.
Feature Explorer shows the selected link.
c. To add a vertex to the link, press SHIFT and click.
d. To move the vertex to the underlying highway-network centerline feature, click the vertex and drag.
Discover Cube 6.4 Tutorial 41

Exploring Cube Base and Cube VoyagerHighway networks3
The new vertex will snap to the vertices of the underlying feature.
e. Repeat steps c and d until the curvature of the freeway ramp is correct.
Copy the shape from the road centerline feature to the link.
a. If you already added the shape with vertexes, click the Undo button until the link is no longer shaped like a cloverleaf.
b. Verify that the Edit Feature button is selected.
c. Click the straight-line freeway-to-freeway connector link.
Feature Explorer shows the selected link.
d. In Feature Explorer, click the Copy Shape From Another Feature button.
e. Click the line feature with the shape that you want to copy—in this case, the cloverleaf centerline.
Cube Base copies the shape to the link.
42 Discover Cube 6.4 Tutorial

Exploring Cube Base and Cube VoyagerHighway networks 3
7. Save edits and exit editing mode.
a. Click the Editor button and choose Save Edits.
Cube uses nondestructive editing. You can review your changes before saving them. This reduces the likelihood of data corruption.
b. Click the Editor button and choose Stop Editing.
8. Close the GIS window.
If the desired, you can save the current map document.
Changing the road networkThis section contains an exercise that demonstrates how you might modify network data to include a new road link, and use that network in a different scenario, the Build Road scenario, to examine the changes that occur after adding a new road to the network.
To modify a road network
1. Open the scenario’s highway network.
a. Under Scenarios in Scenario Manager, expand Base, and double-click Build Road to open the scenario window for the Build Road scenario.
b. Click the Edit button for the highway network input.
Cube opens a GIS window showing a map of the scenario’s highway network input.
Currently, the network is missing one segment on the new road.
2. Focus the map near the new road segment.
Discover Cube 6.4 Tutorial 43

Exploring Cube Base and Cube VoyagerHighway networks3
a. Click Zoom In and select the area at the top-center of the map, where there is a missing section of road.
b. Click the Select Features tool and draw a box around the missing link.
44 Discover Cube 6.4 Tutorial

Exploring Cube Base and Cube VoyagerHighway networks 3
Cube selects the nodes within the box, and opens Feature Explorer to show information about those nodes and associated links.
c. Close Feature Explorer.
3. Display the node information on the map.
a. Click the Zoom to Selected Features button.
Cube updates the view in the map window to focus on the selected area.
b. On the Home ribbon tab, Post GIS Node group, Click the Post button.
Discover Cube 6.4 Tutorial 45

Exploring Cube Base and Cube VoyagerHighway networks3
Cube opens the Posting Selection dialog box.
c. In Set, select 3:Post all nodes, and verify the options to display node numbers on the network.
Field DescriptionFirst attributes drop-down list
Select N to post node numbers.
Offset Select the check box to place the label next to the node rather than directly on the node.
Symbol/Font Style If desired, select a font from the ESRI style list.
Use Built In Font If desired, select this check box to render fonts using the ESRI default font.
Use Built In Font Size If desired, select this check box to scale text using the ESRI default font size.
Simple Posting If desired, select this check box to use a single color and reduce the time required to post labels.
Color If desired, click the Color box to open the Color dialog box, where you can select a color for the node number.
Selection Criteria Clear to label all nodes on the map.
46 Discover Cube 6.4 Tutorial

Exploring Cube Base and Cube VoyagerHighway networks 3
d. Click OK.
Cube displays the node numbers.
4. Select an existing link as a template for the new link.
a. On the Editing toolbar, click the Editor button , and choose Start Editing.
The Editing toolbar becomes active.
b. Verify that the Edit Feature button is selected.
c. On the Layers drop-down list, choose Build_Link as the type of feature to select.
d. Click link 1218-771.
Feature Explorer opens showing the properties of that link.
e. Click the Set Current Feature Attributes as Template button.
Cube copies the attributes of the selected link into memory. Any new links that you create will copy this link’s attributes, simplifying required data entry.
5. Add a new link.
a. Click the Editor button and enable Endpoint Snap to snap new links to existing nodes when possible.
b. Click the Create Feature button.
c. On the Layers list, verify that Build_Link is selected as the type of feature to create.
d. Click node 1351.
The cursor mode changes to a drawing mode.
Discover Cube 6.4 Tutorial 47

Exploring Cube Base and Cube VoyagerHighway networks3
e. Move the cursor to node 1218 and double-click node 1218.
Cube draws the new link and opens Feature Explorer for the new link.
For the selected feature, Feature Explorer lists field values. When multiple features are selected, Feature Explorer lists the range of values contained in a field—that is, the minimum and maximum values of the field among all the selected features. Press CTRL and click to select a feature or cancel a selection.
48 Discover Cube 6.4 Tutorial

Exploring Cube Base and Cube VoyagerHighway networks 3
While working in edit mode, you can edit values in Feature Explorer. When you select multiple features, Feature Explorer adds a New Value column to enter values. Cube applies any value entered to all currently selected features.
6. Save the data for the new link.
a. On the Editing toolbar, click the Editor button, and choose Stop Editing.
b. Click Yes when prompted to save your edits.
Cube uses nondestructive editing. You can review your changes before saving them. This reduces the likelihood of data corruption.
NOTE: You can automate many common network processing tasks using the Cube Voyager Network program. For more information, see Chapter 8, “Network Program,” in the Cube Voyager Reference Guide.
7. Close the GIS window.
At the prompt to save the map document, click No.
8. Run the Build Road scenario.
a. From the scenario window, click Run.
If you need to open the scenario window, simply double-click Build Road under Scenarios in Scenario Manager.
The Task Monitor opens, displaying the run status.
When the run is complete, the Task Run Result dialog box opens.
b. Click OK.
The dialog box and the Task Monitor window closes.
9. Open the output network.
a. Under Data in Scenario Manager, click to expand Outputs, Voyager, and Highway Assignment.
b. Double-click HW Loads to open the loaded highway output network.
Discover Cube 6.4 Tutorial 49
Exploring Cube Base and Cube VoyagerHighway networks3
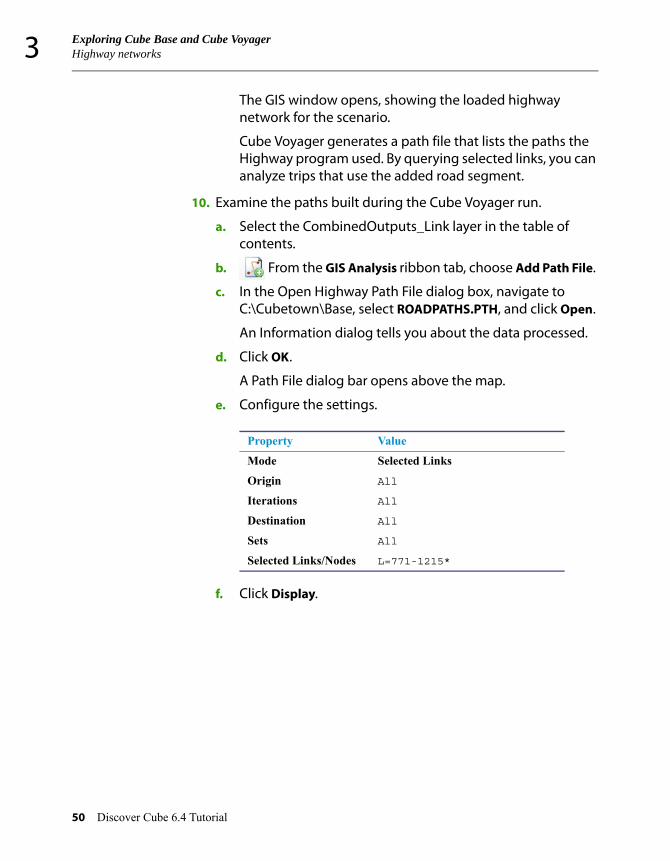
The GIS window opens, showing the loaded highway network for the scenario.
Cube Voyager generates a path file that lists the paths the Highway program used. By querying selected links, you can analyze trips that use the added road segment.
10. Examine the paths built during the Cube Voyager run.
a. Select the CombinedOutputs_Link layer in the table of contents.
b. From the GIS Analysis ribbon tab, choose Add Path File.
c. In the Open Highway Path File dialog box, navigate to C:\Cubetown\Base, select ROADPATHS.PTH, and click Open.
An Information dialog tells you about the data processed.
d. Click OK.
A Path File dialog bar opens above the map.
e. Configure the settings.
f. Click Display.
Property ValueMode Selected Links Origin All Iterations All Destination All Sets All Selected Links/Nodes L=771-1215*
50 Discover Cube 6.4 Tutorial

Exploring Cube Base and Cube VoyagerHighway networks 3
The map updates to show how traffic on the new link distributes across the network.
NOTE: You can also create customized traffic assignment procedures and analyses, such as select link and subarea extraction, using the Cube Voyager Highway program. See Chapter 6, “Highway Program,” in the Cube Voyager Reference Guide.
11. Save and close the map.
a. Click File > Save.
b. In the Save As dialog box, navigate to the directory where you save maps, enter the name of the file, and click Save.
NOTE: Cube saves the graphic representation of the path with this map, but does not save the link to the data with the map. If you update the path data in the future, the map will not update.
Discover Cube 6.4 Tutorial 51

Exploring Cube Base and Cube VoyagerHighway networks3
c. From the File menu, choose Close to close the map.
52 Discover Cube 6.4 Tutorial

Exploring Cube Base and Cube VoyagerPublic transit 3
Public transitCube Base enables you to import, view, edit, and create data for public transit networks. You can model public transit with Cube Voyager’s Public Transport program. This section contains an exercise that demonstrates how you might modify data for a public transit line, run a model, and view results.
To work with public transit data
1. Open the Increase Transit scenario’s transit line network.
a. Under Scenarios in Scenario Manager, expand Base, and double-click Increase Transit to open the scenario window for the Increase Transit scenario.
b. Click the Edit button for the public transit lines input.
Discover Cube 6.4 Tutorial 53

Exploring Cube Base and Cube VoyagerPublic transit3
Cube opens a GIS window showing a map with the scenario’s highway network and public transport network inputs.
2. Edit the headway for the Red line.
a. Click the Editor button and choose Start Editing.
b. Verify that the Edit Feature button is selected.
c. In the Layers list, select Headway_PTLine.
d. Click the Red line on the map.
54 Discover Cube 6.4 Tutorial

Exploring Cube Base and Cube VoyagerPublic transit 3
Cube highlights the line and opens Feature Explorer for that line.
e. Change the value of HEADWAY_1 to 3 to reduce the line’s headway, thereby increasing the frequency of service.
f. Click the Save Current Item button to save the change.
3. Save the edits to the database and close the GIS window.
a. Click the Editor button and choose Stop Editing.
b. On the Confirm dialog box, click Yes to save your edits.
c. From the File menu, choose Close to close the GIS window.
You do not need to save the current map document.
4. Run the Increase Transit scenario.
Discover Cube 6.4 Tutorial 55

Exploring Cube Base and Cube VoyagerPublic transit3
a. If necessary, double-click Increase Transit under Scenarios in Scenario Manager to open the scenario window.
b. From the scenario window, click Run.
The Task Monitor opens, displaying the run status.
When the run is complete, the Task Run Result dialog box opens.
c. Click OK.
The dialog box and the Task Monitor window closes.
5. Examine the transit load results using the bandwidth display.
a. Under Data in Scenario Manager, click to expand Outputs, Voyager, and PT Assignment.
b. Double-click Transit Loads to open the public transit output.
The GIS window opens, showing the assigned network and estimated loads for the tested scenario.
c. Add volume bandwidths to visualize transit loads on the map.
i. In the table of contents, select TRNLOADS_PTLink.
ii. From the GIS Analysis ribbon tab, choose Multi-Bandwidth.
The Transit Layer Link Band Width Settings dialog box opens.
iii. In the Attributes list, select VOL_1.
iv. Click OK.
The GIS Window updates to show the bandwidth display, representing loads on transit lines.
56 Discover Cube 6.4 Tutorial

Exploring Cube Base and Cube VoyagerPublic transit 3
NOTE: You can use the Cube Voyager Public Transport program to define customized transit choice behavior models with multiple user classes. For more information, see Chapter 12, “Public Transport Program,” in the Cube Voyager Reference Guide.
6. Save and close the map.
a. Choose File > Save.
b. In the Save As dialog box, navigate to the directory where you save maps, enter the name of the file, and click Save.
NOTE: Cube saves the graphic representation of the load bandwidths with this map, but does not save the link to the data with the map. If you update the load data in the future, the map will not update bandwidths.
Discover Cube 6.4 Tutorial 57

Exploring Cube Base and Cube VoyagerPublic transit3
c. From the File menu, choose Close to close the map.
58 Discover Cube 6.4 Tutorial

Exploring Cube Base and Cube VoyagerDemographic data 3
Demographic dataCube Base includes tools that helps you work with demographic data. For example, you can create thematic maps that help you visualize geometric relationships of demographic data.
Topics in this section include:
• Creating maps from demographic data
• Running demographic-based scenarios
Creating maps from demographic dataThis section contains an exercise that demonstrates how you might create a thematic map, which helps you visualize the number of households in different zones of a city, and how you might update that data with Cube Base.
To create and update maps based on demographic data
1. Open the Land Use scenario’s demographic data.
a. Under Scenarios in Scenario Manager, expand Base, and double-click Land Use to open the scenario window for the Land Use scenario.
b. Click the Edit button for the demographic data input.
Discover Cube 6.4 Tutorial 59

Exploring Cube Base and Cube VoyagerDemographic data3
Cube opens a GIS window showing a map with the scenario’s demographic zones.
2. Add network data to the map.
a. From the Home ribbon tab, click Add Data and choose Geodatabase Data.
A File Browser opens.
b. Navigate to the C:\Cubetown\Inputs directory and select Cubetown.mdb.
c. Under Datasets, select NoBuild.
d. Click Open to close File Browser and open the data.
3. Create a thematic map.
a. In the table of contents, select the NewLU polygon layer.
b. From the GIS Analysis ribbon tab, click Thematic Map.
60 Discover Cube 6.4 Tutorial

Exploring Cube Base and Cube VoyagerDemographic data 3
c. The Thematic Map Setup dialog box opens.
d. Set the properties to configure the desired map.
e. Click Color On to generate the thematic map.
Property ValueExpression Right-click and choose HOUSEHOLDS Color Double-click the box to open the Color
dialog box, where you can choose a color.Select a lightest color and a darkest color as desired.
Groups 3 Round increments to nearest
100
Discover Cube 6.4 Tutorial 61

Exploring Cube Base and Cube VoyagerDemographic data3
The GIS window updates to show the thematic map.
4. Add zone numbers to map.
a. From the Home ribbon tab, on the Post GIS Node group, choose Post.
The Posting Selection dialog box opens.
b. Verify the settings will show zone labels.
c. Click OK.
5. Increase the number of households in zone 5.
a. Click the Editor button, and choose Start Editing.
Property ValueSet 1:Zone numbers Drop down list TAZ
62 Discover Cube 6.4 Tutorial

Exploring Cube Base and Cube VoyagerDemographic data 3
b. Verify that the Edit Feature button is selected.
c. In the Layers drop-down list, choose NewLU.
d. Click in zone 5.
Feature Explorer opens, showing attributes of that zone.
e. Set the value of HOUSEHOLDS to 2531.
f. Click the Save Current Item button to save the change.
g. Close Feature Explorer.
6. Save the edits to the database.
a. Click the Editor button and choose Stop Editing.
b. On the Confirm dialog box, click Yes to save your edits.
7. Update the thematic map.
a. From the GIS Analysis ribbon tab, click Thematic Map.
b. Click Color On to update the thematic map.
Discover Cube 6.4 Tutorial 63

Exploring Cube Base and Cube VoyagerDemographic data3
The map updated the color assigned to zone 5
8. Save and close the map.
a. Click File > Save button.
b. In the Save As dialog box, navigate to the directory where you save maps, enter the name of the file, and click Save.
NOTE: Cube saves the thematic map, but does not save the thematic map settings. You must redefine the thematic map to update in the future.
c. From the File menu, choose Close to close the map.
Running demographic-based scenariosDemographic-based studies often involve studying matrix results. This section contains an exercise that illustrates how you might analyze results from such a run, by examining the destinations of trips generated from zone 5, where we increased the number of households.
To run and analyze a demographic-based scenario
1. Run the Land Use scenario.
a. Select the Land Use scenario, if its scenario manager window is not visible.
b. From the scenario window, click Run.
The Task Monitor opens, displaying the run status.
When the run is complete, the Task Run Result dialog box opens.
c. Click OK.
The dialog box and the Task Monitor window closes.
2. Open the matrix results.
a. Under Data in Scenario Manager, click to expand Outputs, Voyager, and Trip Distribution.
64 Discover Cube 6.4 Tutorial

Exploring Cube Base and Cube VoyagerDemographic data 3
b. Double-click Person Trips to open the trip distribution matrix data.
A Matrix window opens, showing the person trip data.
3. Open the loaded highway network.
a. Under Data in Scenario Manager, expand Outputs, Voyager, and Highway Assignment.
b. Double-click HW Loads to open the assigned highway loads output.
The GIS window opens, showing the loaded highway network.
4. Link the matrix results to the loaded highway network.
a. Select the CombinedOutputs data set in the table of contents.
b. From the GIS Analysis ribbon tab, choose Link to Matrix.
The Set Linkage to Matrices dialog box opens.
c. Under Available Linkage, select the open matrix file, C:\Cubetown\Base\LandUse\PERSONTRIPS.MAT, and click Add.
Discover Cube 6.4 Tutorial 65

Exploring Cube Base and Cube VoyagerDemographic data3
Cube moves the matrix under Current Linkage.
d. Click Close to close the dialog box.
5. Post the desire lines that represent the demand from zone 5.
a. From the GIS Analysis ribbon tab, choose Desire Lines.
The Desire Lines dialog bar opens at the top of the GIS window.
b. Enter the properties to show desire lines representing demand from zone 5 to other zones.
Property ValueMatrix Table Right-click and choose M1.T7.TOTA. Scale 500 Loc Fld N Orig Exp 5 Dest Exp 1-25 Direction option 1-way (O-D)
66 Discover Cube 6.4 Tutorial

Exploring Cube Base and Cube VoyagerDemographic data 3
c. Click Display to add a layer representing these settings to the map.
d. In the table of contents, clear the CombinedOutputs_Node layer check box to simplify the map.
NOTE: You can use the Cube Voyager Matrix program to automate processing of zone-based data and other tables. For more information, see:
• Chapter 9, “Matrix Program,” in the Cube Voyager Reference Guide
• Chapter 10, “Distribution Program,” in the Cube Voyager Reference Guide
• Chapter 11, “Generation Program,” in the Cube Voyager Reference Guide
• Chapter 5, “Fratar,” in the Cube Voyager Reference Guide
Discover Cube 6.4 Tutorial 67

Exploring Cube Base and Cube VoyagerDemographic data3
6. From the File menu, choose Close to close the map.
NOTE: Desire lines are temporary feature classes. If you attempt to save the map, Cube Base will ask if you want to make the layer permanent. Click Yes to save the layer in the map. You must enter a name for the layer. Click No to remove the layer from the saved map.
68 Discover Cube 6.4 Tutorial

Cube 6.4Cube 6.4Discover Cube 6.4 Tutorial
4 Exploring Reports
This chapter contains a series of exercises that demonstrate how you can use reporting tools in Cube Base to simplify the analysis and presentation of results from travel forecasting models. These exercises use results from the Base scenario in the Discover Cube catalog. These exercises assume that you are familiar with Cube Base and the interface’s primary elements, Application Manager and Scenario Manager. For an introduction to Cube Base, see Chapter 3, “Exploring Cube Base and Cube Voyager.”
The exercises in this chapter demonstrate:
• Working with existing reports
• Editing existing reports
• Generating new reports
Discover Cube 6.4 Tutorial 69
Exploring ReportsWorking with existing reports4
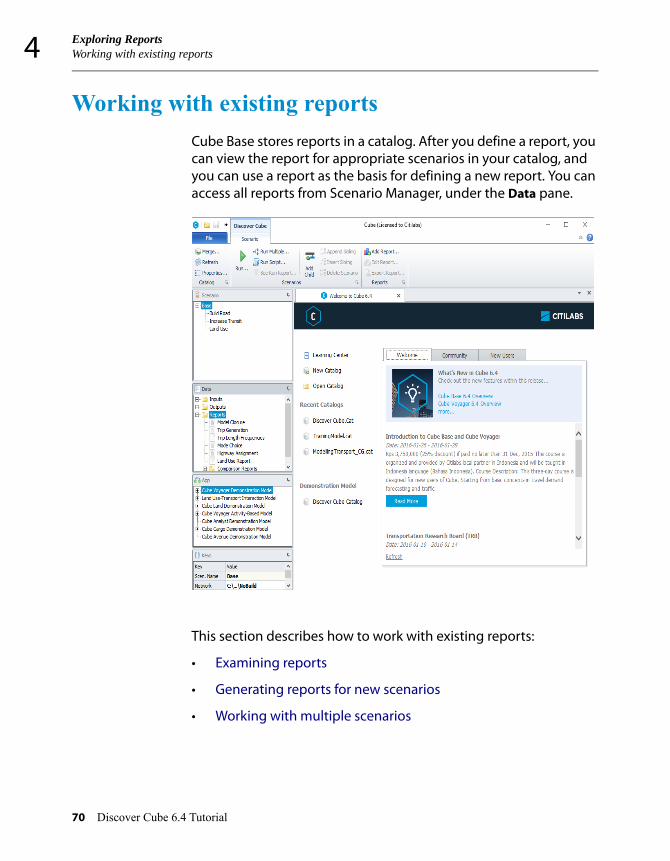
Working with existing reportsCube Base stores reports in a catalog. After you define a report, you can view the report for appropriate scenarios in your catalog, and you can use a report as the basis for defining a new report. You can access all reports from Scenario Manager, under the Data pane.
This section describes how to work with existing reports:
• Examining reports
• Generating reports for new scenarios
• Working with multiple scenarios
70 Discover Cube 6.4 Tutorial

Exploring ReportsWorking with existing reports 4
Examining reportsWhenever you run a scenario, Cube collects the data necessary to present a report. This exercise demonstrates how to examine a report.
To examine an existing report
1. Open the Discover Cube catalog in Cube.
a. Start Cube.
You can:
• Double-click the Cube icon on your desktop.
• Click the Start button, point to All Programs, point to Citilabs, and choose Cube.
Cube displays the Welcome to Cube dialog box.
b. Select Discover Cube Catalog and click OK.
Cube opens the Discover Cube catalog in Scenario Manager.
2. Run the Base scenario.
NOTE: If you already ran the Base scenario, such as during the exercises in Chapter 3, “Exploring Cube Base and Cube Voyager” you can skip this step.
a. Under App in Scenario Manager, select Cube Voyager Demonstration Model.
b. Under Scenarios in Scenario Manager, double-click Base.
Cube opens the scenario window for the Base scenario.
c. Click Run.
The Task Monitor window opens and shows the progress of the model run. When the run is complete, the Task Run Result dialog box opens.
d. Click OK to close the dialog box and the Task Monitor window.
Discover Cube 6.4 Tutorial 71

Exploring ReportsWorking with existing reports4
3. Open the Trip Length Frequencies report for the Base scenario.
a. Under Scenarios in Scenario Manager, select Base.
b. Under Data in Scenario Manager, click to expand Reports.
c. Double-click Trip Length Frequencies.
Cube opens the Trip Length Frequencies report.
4. Navigate between the three pages in the report.
You can:
72 Discover Cube 6.4 Tutorial

Exploring ReportsWorking with existing reports 4
Navigate using the Home ribbon tab. Click the Next Page, Last Page, Previous Page, or First Page buttons, as appropriate.
Or, navigate using the keyboard.
1. Close the report by clicking the close button .
Generating reports for new scenariosCube Base automatically generates predefined reports in your catalog for any new scenarios that you create.
To build a scenario and generate a report
1. Create a new child scenario.
a. Under App in Scenario Manager, select Cube Voyager Demonstration Model.
b. Click Base and select Add Child on the Scenarios ribbon tab. Or, right-click Base and select Add Child.
c. In the name space, enter:
Scenario 1
Key stroke ActionHOME Scroll to the top of the current page.CTRL-HOME Move to the first page.END Scroll to the bottom of the current page.CTRL-END Move to the last page.PAGE UP Scroll the current page up.PAGE DOWN Scroll the current page down.Arrow keys Scroll a bit in the direction of the arrow.
Discover Cube 6.4 Tutorial 73

Exploring ReportsWorking with existing reports4
The Scenario Properties dialog box opens for the new scenario.
d. In Code, enter S1.
You can append the scenario code to scenario-specific file names to help with file identification.
e. If desired, enter text describing the scenario in Description.
f. Click OK.
g. If necessary, double-click Scenario 1 to open the window for the scenario.
2. Define the input files and parameters for the scenario.
Set Growth Factor for EE Trips to 1.5.
3. Click Save to save the scenario.
4. Run the scenario.
a. On the scenario window, click Run.
74 Discover Cube 6.4 Tutorial

Exploring ReportsWorking with existing reports 4
Cube runs the application for Scenario 1. A Task Monitor window opens showing the progress of the run. When Cube completes the run, the Task Run Result dialog box opens.
b. Click OK to close the dialog box and the Task Monitor window.
5. Examine the Trip Length Frequencies report.
a. Under Data in Scenario Manager, click to expand Reports.
b. Double-click Trip Length Frequencies.
Discover Cube 6.4 Tutorial 75

Exploring ReportsWorking with existing reports4
Cube opens the Trip Length Frequencies report.
Note that Cube generated the report for the new scenario automatically. You did not need to export any information or issue any additional commands.
6. Close the report by clicking .
7. From the File menu, click Save and choose Catalog to save the new scenario in the catalog.
76 Discover Cube 6.4 Tutorial

Exploring ReportsWorking with existing reports 4
Working with multiple scenariosAnalysts usually apply a model many times to test different scenarios, sometimes hundreds of scenarios. Cube Base facilitates analysis of a report across multiple scenarios. This section contains exercises that demonstrate how you can compare multiple scenarios using two types of reports:
• Single-scenario reports
• Multiple-scenario reports
Before completing these exercises, however, you must generate data for multiple scenarios.
To build additional scenarios
1. Build and run a child of Scenario 1, named Alternative A.
a. Click Scenario 1 and select Add Child on the Catalog ribbon tab. Or, right-click Scenario 1 and select Add Child.
b. In the name space, enter Alternative A.
c. In Code on the Scenario Properties dialog box, enter S1A1.
d. Click OK to close the Scenario Properties dialog box.
e. If needed, double-click Alternative A to open the window for the scenario.
f. On the scenario window, click Next to set the Value of Time to 10.
g. Click Save.
h. Click Run to run the scenario.
i. Click OK to close the Task Run Result dialog box and the Task Monitor window.
2. Build and run a child of the Base scenario, named Scenario 2.
a. Click Base and select Add Child on the Scenarios ribbon tab. Or, right-click Base and select Add Child.
b. In the name space, enter Scenario 2.
Discover Cube 6.4 Tutorial 77

Exploring ReportsWorking with existing reports4
c. In Code on the Scenario Properties dialog box, enter S2.
d. Click OK to close the Scenario Properties dialog box.
e. Double-click Scenario 2 to open the window for the scenario
f. On the scenario window, set the Growth Factor for EE Trips to 2.
g. Click Save.
h. Click Run to run the scenario.
i. Click OK to close the Task Run Result dialog box and the Task Monitor window.
3. On the File menu, click Save and choose Catalog to save the scenarios in the catalog.
Single-scenario reportsSingle-scenario reports present results from a single scenario. You can easily analyze multiple scenarios by comparing single-scenario reports.
To open copies of a report for a subset of scenarios
1. If necessary, under Data in Scenario Manager, click to expand Reports.
78 Discover Cube 6.4 Tutorial

Exploring ReportsWorking with existing reports 4
2. Specify the desired subset of scenarios, Scenario 1 and Alternative A.
a. Under Data in Scenario Manager, right-click Trip Length Frequencies, and choose Select Scenarios.
b. Cube opens the Select Scenarios dialog box, which lists the scenarios defined in the catalog.
c. If necessary, click Clear All, to clear any scenarios listed in the Selected box.
d. If necessary, click to expand the list of scenarios in the Scenarios box.
e. Select Scenario 1 and click Add With Children.
Cube adds both Scenario 1 and Alternative A to the list in the Selected box.
f. Click OK to set the selection and close the window.
3. Open the selected reports.
Under Data in Scenario Manager, right-click Trip Length Frequencies, point to View Report, and choose Selected Scenarios.
Discover Cube 6.4 Tutorial 79

Exploring ReportsWorking with existing reports4
For both selected scenarios (Scenario 1 and Alternative A), Cube display the Trip Length Frequencies report in separate windows. To view the reports, select the scenario then double-click Trip Length Frequencies.
You can use the tabbed window interface to select the report window for a particular scenario. Or, if Cube is in “legacy” window mode, you may arrange the report windows by tiling or cascading them. For more on window management in Cube, see “Window Management” on page 10.
4. Close each report window by clicking .
Multiple-scenario reportsMultiple-scenario reports present results from multiple scenarios in a single report. You can open these reports for a single scenario, for all scenarios, or for a selected set of scenarios.
To open a multiple-scenario report for a subset of scenarios
1. Specify the subset of scenarios, Scenario 1 and Scenario 2.
a. Under Data in Scenario Manager, expand Reports and Comparison Reports.
b. Right-click Compare Transit, and choose Select Scenarios.
Cube opens the Select Scenarios dialog box, which lists the scenarios defined in the catalog.
c. Click Clear All to clear the list in the Selected box.
d. If necessary, click to expand the list of scenarios in the Scenarios box.
e. Select Scenario 1 and click Add.
Cube adds Scenario 1 to the list in the Selected box.
f. Select Scenario 2 and click Add.
Cube adds Scenario 2 to the list in the Selected box.
g. Click OK to set the selection and close the window.
80 Discover Cube 6.4 Tutorial

Exploring ReportsWorking with existing reports 4
2. Open the report for the selected scenarios.
Under Data in Scenario Manager, right-click Compare Transit, choose View Report, and select Selected Scenarios.
Cube opens the Compare Transit report, which displays results from both selected scenarios in a single window.
3. Close the report window by clicking .
Discover Cube 6.4 Tutorial 81

Exploring ReportsEditing existing reports4
Editing existing reportsYou can easily edit the template for existing reports. This section contains a series of exercises that demonstrate how you can edit key features in reports:
• General properties
• Layout
• Fonts
• Data labels
• Charts
• Multiple scenario comparisons
General propertiesAll reports have general properties that describe the report and affect its display. This exercise demonstrates how you edit a report, changing one of its general properties.
To edit existing reports
1. Open the Mode Choice report for the Base scenario.
a. Under Scenarios in Scenario Manager, select Base.
b. Under Data in Scenario Manager, click to expand Reports.
c. Double-click Mode Choice.
82 Discover Cube 6.4 Tutorial

Exploring ReportsEditing existing reports 4
Cube opens the Mode Choice report for the Base scenario.
2. Browse through all three pages of the report.
Notice that the banner repeats on every page.
3. Edit the report to show the banner just on the first page.
a. With the report open, select Edit Report on the Home ribbon tab.
Cube opens the Report Definition dialog box.
Discover Cube 6.4 Tutorial 83

Exploring ReportsEditing existing reports4
b. Select the General tab.
This tab contains several properties that define the report.
Property DescriptionReport File Name
Name and location of file storing the report.
Database Name Name of database file that provides the source data for the report.Acceptable file formats are:• Database files (.dbf)• Cube Voyager network file (.net)• Cube Voyager matrix file (.mat)To generate different names by scenario, Cube incorporates a key name in the database name, such as {SCENARIO_DIR}.
84 Discover Cube 6.4 Tutorial

Exploring ReportsEditing existing reports 4
c. Unselect the Repeat Banner on Each Page check box.
4. Click OK.
Cube closes the dialog box and updates the report to reflect the new settings, displaying the banner on just the first page.
Scenarios Indicates whether the report can include results from multiple scenarios for side-by-side comparisons. There are two options:• Apply a Single Scenario to the Report —
Select to show results from a single scenario in each report window.
• Include Multiple Scenarios in the Report — Select to show results from multiple scenarios in a single report window for comparison.
Scenario Name in Tables/Charts
Indicates whether to display the scenario name using the long format, such as “Scenario1.AlternativeA,” or the short format, such as “Alternative A.” There are two options:• Show Short Scenario Name • Show Long Scenario Name
Order Scenarios By
For reports that show multiple scenarios, indicates the order that the report presents scenarios. There are two options:• Scenario Name • Scenario Tree Order
Banner Name of file containing graphic that report displays at the top of the first page or at the top of each page.Select Repeat Banner on Each Page to display banner at the top of each page.
Heading Title text that appears at the top of the first page or at the top of each page.Select Repeat Report Heading on Each Page to display title at the top of each page.
Property Description
Discover Cube 6.4 Tutorial 85

Exploring ReportsEditing existing reports4
LayoutYou can configure a report’s page size and orientation, and the information that appears in the header and footer. This exercise demonstrates how you can edit the information in a header and footer.
To edit a report’s header and footer layout
1. Open the Mode Choice report for the Base scenario.
2. With the report open, select Edit Report on the Home ribbon tab.
Cube opens the Report Definition dialog box.
3. Select the Layout tab.
86 Discover Cube 6.4 Tutorial

Exploring ReportsEditing existing reports 4
This tab contains two sections with properties that define the report’s page size and header and footer information.
4. Configure the date to appear on the left side of the header and the page number to appear on the right side of the footer. Under Header, in Left, select Date. Under Footer, in Right, select Page Number.
5. Configure the format for the date and page number. In Page Number Format, select n/N. In Date Format, select Long (dd MMMM yyyy).
6. Click OK.
Cube closes the dialog box and updates the report to reflect the new settings, displaying the header and footer on all three pages.
FontsYou can configure which fonts a report uses for different elements. This exercise demonstrates how to edit fonts displayed in the header and footer.
Section DescriptionPaper Size and Orientation
Specify the report’s orientation and paper size.The default setting configures reports to use the paper size and orientation of your computer’s current printer. However, configuring a setting allows you to control the presentation regardless of the selected printer.
Header and Footer Specify what appears in the report’s headers and footers.The default setting shows the report’s title in the center of the header. You can configure the page number, date, or title to appear at the left, center, or right side of the header or footer.
Discover Cube 6.4 Tutorial 87

Exploring ReportsEditing existing reports4
To edit fonts displayed in the header and footer
1. Open the Mode Choice report for the Base scenario.
2. With the report open, select Edit Report on the Home ribbon tab.
Cube opens the Report Definition dialog box.
3. Select the Fonts tab.
From this tab, you can set the font for different categories of text in the report. You can set the font by category or globally for all categories. You can also reset all categories to the value in the default category or to the values currently used for new reports.
4. Set the font size in the header and footer to 9 points.
a. Under Category, select Page Header, and click Select Font.
Cube opens the Font dialog box.
b. In the Size list, select 9 and click OK.
c. Repeat the steps above for the Page Footer category.
88 Discover Cube 6.4 Tutorial

Exploring ReportsEditing existing reports 4
d. Click OK to accept the settings and close the Report Definition dialog box.
Cube updates the report to reflect the new settings, displaying the smaller font in the header and footer on all three pages.
Data labelsLabels describe data elements in a report. You configure aliases for database fields. These aliases are the labels you see in the report. This exercise demonstrates how to edit the data labels in a report.
To edit a report’s data labels
1. Open the Mode Choice report for the Base scenario.
2. With the report open, select Edit Report on the Home ribbon tab.
Cube opens the Report Definition dialog box.
3. Select the Fields tab.
Discover Cube 6.4 Tutorial 89

Exploring ReportsEditing existing reports4
From this tab, you can set the aliases that the report displays for database fields. For example, aliases are often visible in the column headers of a table. Aliases might be shorter or more descriptive than the actual field names.
4. Change the “Car Pool” label to “Carpool.”
a. In Available Fields, select V2 (Car Pool) and click Alias.
Cube updates the dialog box to allow alias entry.
b. In Report Alias Name, enter Carpool.
c. Click OK.
Cube returns to the view version of the Available Fields list.
d. Repeat the steps above for the other fields currently labeled “Car Pool”: V7, V12, V17, and V22.
NOTE: When you specify the report alias name, Cube will warn you that the alias is already in use. Click Yes to use it anyway.
5. Click OK to accept the settings and close the Report Definition dialog box.
90 Discover Cube 6.4 Tutorial

Exploring ReportsEditing existing reports 4
Cube updates the report to reflect the new settings, displaying the correct label for carpools on all three pages.
ChartsCharts provide a graphical view of results, allowing analysts to quickly compare the scale of values. Charts are often more attractive than a table of numbers. You can use Cube Base to produce pie charts, bar charts, or scatter diagrams. This exercise demonstrates how you might edit the format of an existing chart.
To edit an existing chart
1. Open the Mode Choice report for the Base scenario.
2. With the report open, select Edit Report on the Home ribbon tab.
The Report Definition dialog box opens.
3. Select the Tables/Charts tab.
From this tab, you can add new tables or charts to a report, or you can edit, delete, or reorder existing tables and charts.
Discover Cube 6.4 Tutorial 91

Exploring ReportsEditing existing reports4
4. Under Report Contents, double-click Work Mode Choice.
Cube opens the Report Chart dialog box, where you can edit the Work Mode Choice chart.
This dialog box contains several tabs where you configure the information presented and the display format: Chart — Use the Chart tab to configure the name
identifying the chart, the title of the chart on the report, the type of chart, and how the report presents the chart for multiple scenarios.
Fields — Use the Fields tab to configure which database fields the chart presents and what statistics the report computes for each field. If desired, you can group data by field attributes and you can filter data.
Layout — Use the Layout tab to configure the chart’s dimensions and position, as well as the format and dimensions of various elements.
Fonts — Use the Fonts tab to configure the fonts used in the chart’s title, legend, and labels.
92 Discover Cube 6.4 Tutorial

Exploring ReportsEditing existing reports 4
Colors — Use the Colors tab to configure the colors presented for different slices in pie charts or different columns in bar charts.
5. Configure the chart as a 3D chart without a legend.
a. Select the Layout tab.
b. Select the Show in 3D check box.
c. Select the Show Legend check box.
6. Click OK to close the Report Chart dialog box.
7. Click OK to close the Report Definition dialog box.
Cube updates the report to reflect the new settings, displaying a 3D version of the Work Mode Shares chart, without a legend. Click Next Page the see the corresponding report.
Multiple scenario comparisonsYou can configure a report to present results from multiple scenarios. This exercise demonstrates how to edit an existing report to ensure that the report presents results from multiple scenarios in a helpful way.
To edit an existing report to present results from multiple scenarios
1. Open the Mode Choice report for the Base scenario.
2. Verify that the configuration supports multiple reports.
a. With the report open, select Edit Report on the Home ribbon tab.
The Report Definition dialog box opens.
b. If necessary, select the General tab.
Discover Cube 6.4 Tutorial 93

Exploring ReportsEditing existing reports4
c. Verify that two options are selected:
• Include Multiple Scenarios in the Report
• Scenario Tree Order
d. Click OK.
3. Close the opened Mode Choice report.
4. Select the scenarios to open for the Mode Choice report: Base and Scenario 1.
a. Under Data in Scenario Manager, right-click Mode Choice, and choose Select Scenarios.
NOTE: Mode Choice is under the Reports folder.
Cube opens the Select Scenarios dialog box, which lists the scenarios defined in the catalog.
b. Click Clear All to clear the list in the Selected box.
c. If necessary, click to expand the list of scenarios in the Scenarios box.
d. Select Base and click Add.
Cube adds Base to the list in the Selected box.
94 Discover Cube 6.4 Tutorial

Exploring ReportsEditing existing reports 4
e. Select Scenario 1 and click Add.
Cube adds Scenario 1 to the list in the Selected box.
f. Click OK to set the selection and close the window.
5. Open the report for the selected scenarios.
Under Data in Scenario Manager, right-click Mode Choice, point to View Report, and choose Selected Scenarios.
Cube opens the Mode Choice report, which displays results from both selected scenarios in a single window.
Discover Cube 6.4 Tutorial 95

Exploring ReportsEditing existing reports4
The report contains more pages, reflecting the additional information presented. However, each chart has the same title; you cannot differentiate between scenarios.
6. Configure the report to include the scenario name in the chart title.
a. With the Mode Choice report open, select Edit Report on the Home ribbon tab.
The Report Definition dialog box opens.
b. Select the Tables/Chart tab.
c. In the Reports Contents item list, double-click Work Mode Choice.
The Report Chart dialog box opens.
d. Select the Chart tab.
e. Click the browse button next to Chart Title.
Cube opens the Build Text with Catalog Keys dialog box, which enables you to construct a chart title using keys defined in the catalog.
f. Clear the Show Catalog Keys check box to limit the displayed keys to system keys.
96 Discover Cube 6.4 Tutorial

Exploring ReportsEditing existing reports 4
g. Double-click Scenario_ShortName to add the key to the chart title’s text.
h. Insert spaces and a hyphen in the text:
Work Mode Shares - {Scenario_ShortName}
i. Click OK to accept the text.
j. Click OK to close the Report Chart dialog box.
k. Repeat the above steps for the other charts included in the report contents:
• Shop Mode Choice
• School Mode Shares
• Other Mode Shares
• Non Home Base Shares
l. Click OK to close the Report Definition dialog box.
Discover Cube 6.4 Tutorial 97

Exploring ReportsEditing existing reports4
Cube updates the report to reflect the new settings, displaying the scenario name in the chart title.
7. Save your changes.
On the File menu, choose Save > Catalog.
98 Discover Cube 6.4 Tutorial

Exploring ReportsGenerating new reports 4
Generating new reports Reports can include accepts several types of input:
• Database files (.dbf files)
• Cube Voyager network files (.net files)
• Cube Voyager matrix files (.mat files)
This section contains exercises that show how to generate new reports by:
• Creating reports from existing reports
• Creating reports from scratch
Creating reports from existing reportsCopying existing reports allows you to easily create a new report from the same database file as an existing report.
To create a new report by copying an existing report
1. Open the Person Trips report for the Base scenario.
a. Under Scenarios in Scenario Manager, select Base.
b. Under Data in Scenario Manager, click to expand Reports.
c. Double-click Trip Generation.
The Trip Generation report for the Base scenario opens.
2. Save the report as Trip Generation New.
a. On the File menu, choose Save As.
b. In the File name box, enter trip generation new.rep.
c. Click Save.
3. Verify that the catalog is opened in developer mode.
a. Choose the Scenario tab, and click the caption button on the Catalog group.
Discover Cube 6.4 Tutorial 99

Exploring ReportsGenerating new reports4
The Catalog Properties dialog box opens.
b. Select the Model User tab.
c. Under Model User, select Model Developer.
d. Click OK to close the Catalog Properties dialog box.
4. Add the new report to the catalog.
a. Under Data in Scenario Manager, right-click Reports and choose Add Existing Report.
b. Next to Data Name, click Browse.
c. In the Open dialog box, select trip generation new.rep and click Open.
d. In Description, enter the name of the report that will appear in Scenario Manager: Trip Generation New.
e. Click OK.
100 Discover Cube 6.4 Tutorial

Exploring ReportsGenerating new reports 4
Cube adds the report under Reports in Scenario Manager.
5. Edit the report to present the desired information.
See “Editing existing reports” on page 82 for information on how you can edit existing reports.
Creating reports from scratchYou can create new reports directly from output files shown in Scenario Manager.
To create a new report
1. In the Data pane, right-click Reports and select Create Report.
The Report Definition dialog box opens.
2. On the General tab, enter general properties that describe the report. In Report File Name, enter the file where Cube stores the
report definition.
i. Click the browse button .
b. Navigate to the C:\Cubetown\Model\Reports directory.
c. In the File name box, type: HighwaySummary.rep.
d. Click Save. In Report Name, enter the name that identifies the report:
Loaded Network - Summary
In Database Name, click Select.
Discover Cube 6.4 Tutorial 101

Exploring ReportsGenerating new reports4
a. Click Browse Windows Folders and navigate to C:\Cubetown\Base. Choose Results.mdb. Click Yes on replacing the directory name with {SCENARIO_DIR}.
b. Under Table Name, choose CombinedOutputs_Link.
c. Click OK.
d. The Report Definition dialog should now look like:
3. Choose the Fields tab.
Enter labels for the database fields that the report will show.
To enter a label:
a. Under Available Fields, select a database field and click Alias.
b. In Report Alias Name, enter the desired label.
Database field LabelV_1 Total Flows
VC_1 Volume/Capacity
CSPD_1 Congested Speed
102 Discover Cube 6.4 Tutorial

Exploring ReportsGenerating new reports 4
c. Click OK.
4. On the Tables/Charts tab, specify the report’s content.
a. Click Add Chart.
The Report Chart dialog box opens.
b. On the Chart tab, enter properties that define the chart.
• In Chart Name, enter Average Congested Speed.
• In Chart Title, enter Average Congested Speed - {Scenario_ShortName}.
NOTE: Select the browse button to select the field name from a list of available keys.
• In Chart Type, choose Bar.
c. On the Fields tab, specify which values to display in the chart.
i. Under Report Fields, select CSPD_1(Congested Speed) and click the arrow button to move the field under Values to Compare.
ii. Under Function, select Average as the computation for congested speed values.
Discover Cube 6.4 Tutorial 103

Exploring ReportsGenerating new reports4
iii. Select the Group values within the Chart by a Data Attribute check box.
iv. Cube adds the Group Values By box to the dialog box.
v. Under Report Fields, select FUNC_CLASS and click the arrow button to move the field under Group Values By.
The chart will group data with different values in the FUNC_CLASS field.
d. Select the Layout tab.
Increase Chart Width to 180mm.
e. Click OK to close the Report Chart dialog box.
You have defined sufficient data to view a draft version of the new report.
5. Click OK to close the Report Definition dialog box.
Cube adds the new report to the Reports folder under Data in Scenario Manager.
104 Discover Cube 6.4 Tutorial

Exploring ReportsGenerating new reports 4
6. Under Data in Scenario Manager, click to expand Reports.
7. Double-click Loaded Network - Summary to view the report.
The report opens.
Discover Cube 6.4 Tutorial 105

Exploring ReportsGenerating new reports4
8. If desired, edit the report to make it more attractive and robust.
Using the exercises in “Editing existing reports” on page 82 as a guide, you might: Add a banner Show results from multiple scenarios in a single report
9. Set the catalog to applier mode.
a. Choose the Catalog tab, and click the caption button on the Catalog group.
106 Discover Cube 6.4 Tutorial

Exploring ReportsGenerating new reports 4
The Catalog Properties dialog box opens.
b. Select the Model User tab.
c. Under Model User, select Model Developer.
d. Click OK to close the Catalog Properties dialog box.
10. Save the catalog and exit Cube.
a. On the File menu, choose Save > Catalog.
b. On the File menu, choose Exit Cube.
c. At the prompt, click Yes to close all windows and exit.
Discover Cube 6.4 Tutorial 107

Exploring ReportsGenerating new reports4
108 Discover Cube 6.4 Tutorial

Discover Cube 6.4 Tutorial
5 Exploring Cube Cargo
This chapter contains a series of exercises that demonstrate how you can use Cube Cargo to forecast commodity and truck flows. These exercises use the model in the Discover Cube catalog, found with the Cubetown data that you installed. These exercises assume that you are familiar with Cube Base and the interface’s primary elements, Application Manager and Scenario Manager. For an introduction to Cube Base, see Chapter 3, “Exploring Cube Base and Cube Voyager.”
The exercises in this chapter demonstrate:
• Cubetown Cargo model
• Forecasting demand for proposed rail service
• Forecasting impact of rail pricing
Discover Cube 6.4 Tutorial 109

Exploring Cube CargoCubetown Cargo model5
Cubetown Cargo modelThe exercises in this chapter use the Cube Cargo Demonstration Model, a cargo model for Cubetown. In this section, we will become familiar with the model, and run the Base scenario to estimate the commodity levels by mode and the truck matrices for the base conditions.
To become familiar with the Cubetown cargo model
1. Open the Discover Cube catalog in Cube.
a. Start Cube.
You can:
• Double-click the Cube icon on your desktop.
• Click the Start button, point to All Programs, point to Citilabs, and choose Cube.
Cube displays the Welcome to Cube window.
b. Select Discover Cube Catalog.
Cube opens the Discover Cube catalog.
2. Under App in Scenario Manager, double-click Cube Cargo Demonstration Model to open the Cubetown cargo model.
110 Discover Cube 6.4 Tutorial

Exploring Cube CargoCubetown Cargo model 5
Application Manager opens the Cube Cargo Demonstration Model.
The yellow boxes represent steps in the model, the blue boxes show inputs to each step, and the green boxes show the outputs. Lines represents the links between outputs from one step and inputs to the next step.
This model has three steps: Compute network costs and times by mode Estimate zone-to-zone commodity and truck matrices Compute peak-hour trucks
3. Open the Base scenario.
Under Scenarios in Scenario Manager, double-click Base.
Discover Cube 6.4 Tutorial 111

Exploring Cube CargoCubetown Cargo model5
Cube opens the scenario window for the Base scenario.
4. Click Edit next to the field for entering the Roadway network.
112 Discover Cube 6.4 Tutorial

Exploring Cube CargoCubetown Cargo model 5
Cube opens the GIS window, which shows a map of the highway network and the rail services connecting major points.
You can use Cube Cargo models to study both long-distance and local freight movement. Creating a large-scale study area allows us to properly study the amount of goods passing through, originating from, or terminating in Cubetown by various modes.
In addition to rail and highway services, the study area has river services.
5. From the Home ribbon tab, click Add Data and choose Geodatabase Data.
Geodatabase Browser opens. Browse to C:\Cubetown\Inputs and select Cubetown.mdb.
6. Select CARGORIVER in the right-hand pane, and click Open, to add the river transit layer to the map.
Discover Cube 6.4 Tutorial 113

Exploring Cube CargoCubetown Cargo model5
7. Cube shows the entire study area, including the river services.
The mode choice for freight is likely to impact the truck flow passing through the study area of Cubetown.
8. Close the GIS window.
9. At the prompt to save the map document, click No.
10. On the scenario window, click Run to run the Base scenario.
The Task Monitor window opens, showing the progress of the run. When complete, a Task Run Result dialog box opens.
11. Click OK.
114 Discover Cube 6.4 Tutorial

Exploring Cube CargoForecasting demand for proposed rail service 5
Forecasting demand for proposed rail serviceCubetown presently serves as the region’s rail hub. Shippers send freight from all areas for transfer at Cubetown. The rail service operators want to consider the market for new, direct north-south rail freight service. We will use the Cube Cargo model to help them estimate the demand for this proposed service.
There are two parts to this exercise:
• Developing a scenario for proposed rail service
• Evaluating results
Developing a scenario for proposed rail serviceTo estimate the demand for the proposed rail service, we need a new scenario with a modified rail input, which represents the proposed service.
To develop a scenario for proposed rail service
1. Under Scenario in Scenario Manager, right-click Base and choose Add Child.
2. In the name space, enter:
New Rail
A Scenario Properties dialog box opens. If desired, enter text describing the scenario in the Description box.
3. Click OK.
4. If necessary, double-click New Rail to open its window. By default, the new scenario uses all the values from its parent scenario, the Base scenario. We will change the input for the rail network.
5. Click Browse next to the field for entering rail lines.
A file browser dialog opens to specify the rail lines input.
Discover Cube 6.4 Tutorial 115

Exploring Cube CargoForecasting demand for proposed rail service5
6. In the C:\Cubetown\Inputs directory, select cubetown.mdb. Its contents will display in the right hand pane.
7. Select CargoFutureRail and click Ok.
Cube updates the input in the scenario window.
This rail file introduces a new rail service from the southern portion of the study area to the northern portion, without stopping in Cubetown.
8. Click Save to save the scenario’s configuration.
9. Click Run to run the scenario.
The Task Monitor window opens, showing the progress of the run. When complete, the Task Run Result dialog box opens.
10. Click OK.
116 Discover Cube 6.4 Tutorial

Exploring Cube CargoForecasting demand for proposed rail service 5
Evaluating resultsCube Cargo computes a variety of statistics and results, including detailed matrices of commodity and truck flows. To evaluate the New Rail scenario, we want to measure the reduction in truck flows and the increase in rail tons.
The model produces two output files useful for our analysis:
• Truck Change — A matrix showing the reduction in annual truck flows
• Commodity Change — A matrix showing the change in tons of commodities transported by mode per year
To evaluate results
1. Under Data in Scenario Manager, expand Outputs and expand Cargo.
2. Double-click Truck Change.
Cube opens the truck change matrix, which shows the change in truck flows between zones.
Discover Cube 6.4 Tutorial 117

Exploring Cube CargoForecasting demand for proposed rail service5
3. In Scenario Manager, double-click Commodity Change.
Cube opens the commodity change matrix, which shows the change in commodities carried between zones by mode.
4. Click the 2 railchange tab to see the results for rail mode.
Total increase in annual truck flows
118 Discover Cube 6.4 Tutorial

Exploring Cube CargoForecasting demand for proposed rail service 5
5. Close the results windows when done.
Total decrease in annual tons shipped by rail
Discover Cube 6.4 Tutorial 119

Exploring Cube CargoForecasting impact of rail pricing5
Forecasting impact of rail pricingThe Cube Cargo model evaluates changes in costs in addition to changes in level of service. In this exercise, we will evaluate how increasing rail costs by 10% impacts truck traffic.
To forecast the impact of increased rail costs
1. Under Scenario in Scenario Manager, right-click Base and choose Add Child.
2. In the name space, enter:
Rail Increase
A Scenario Properties dialog box opens. If desired, enter text describing the scenario in the Description box.
3. Click OK.
4. If necessary, double-click Rail Increase to open its scenario window. By default, the new scenario uses all the values from its parent scenario, the Base scenario. We will change the rail costs.
5. Under Please select the percentage change in rail transport costs, select 10.
6. Click Save to save the configuration for the Rail Increase scenario.
7. Click Run to run the scenario.
The Task Monitor wRail indow opens, showing the progress of the run. When complete, the Task Run Result dialog box opens.
8. Click OK.
120 Discover Cube 6.4 Tutorial

Exploring Cube CargoForecasting impact of rail pricing 5
9. Under Data in Scenario Manager, expand Outputs and expand Cargo.
10. Double-click Truck Change.
Cube opens the truck change matrix.
Discover Cube 6.4 Tutorial 121

Exploring Cube CargoForecasting impact of rail pricing5
11. Double-click Commodity Change.
Cube opens the commodity change matrix. The 1 truckchange tab shows the results for truck mode.
1. Click the 2 railchange tab to see the results for rail mode.
The results show that increasing rail costs by 10 percent decreases rail shipments by more than 181,000, tons and increases truck shipments by nearly 300,000 tons.
2. When done, exit Cube.
a. From the File menu, choose Exit Cube.
b. Click Yes to close all windows.
c. Click Yes when prompted to save the catalog.
122 Discover Cube 6.4 Tutorial

Discover Cube 6.4 Tutorial
6 Learning More
Citilabs is committed to helping you get the most out of Cube. This chapter discusses resources available to learn more about Cube:
• User support
• User forum
• Training
• Consulting and assistance
Discover Cube 6.4 Tutorial 123

Learning MoreUser support6
User supportCitilabs provides free user support for all new product or upgrade purchases. You can purchase additional user support on an annual basis through a software maintenance contract. A current maintenance contract provides you with user support and free software updates.
To access Citilabs user support, please visit
http://www.citilabs.com/support
124 Discover Cube 6.4 Tutorial

Learning MoreUser forum 6
User forumCitilabs has an online user group. Through the user group, you can exchange information and ideas with others who use Citilabs software, drawing on the large wealth of knowledge available from the Citilabs user community. We encourage you to join at:
http://community.citilabs.com/
Discover Cube 6.4 Tutorial 125

Learning MoreTraining6
TrainingCitilabs holds training sessions throughout the year in major cities around the world. You may also access additional tutorials and webinars at the Cube Learning Center:
http://www.citilabs.com/support/learning-center
For a listing of currently scheduled courses and locations, visit
http://www.citilabs.com/events
If you have specific training needs not met by our regular course offerings, please contact us. We would be happy to work with you to develop training appropriate for your specific needs.
126 Discover Cube 6.4 Tutorial

Learning MoreConsulting and assistance 6
Consulting and assistanceCitilabs is a full-service multimodal transportation software and planning firm. We offer a range of consulting services, such as the development of specialized planning software applications and utilities, and the research and implementation of advanced planning methods.
To find out more about the range of consulting services offered by Citilabs, please visit:
http://www.citilabs.com/solutions
Discover Cube 6.4 Tutorial 127

Learning MoreConsulting and assistance6
128 Discover Cube 6.4 Tutorial

Discover Cube 6.4 Tutorial
7 Acquiring Cube 6.4
This chapter discusses available licensing options for Cube 6.4 and provides a list of representatives you can contact for more information about Cube 6.4 or to initiate a purchase:
• Licensing options
• Contacts
Discover Cube 6.4 Tutorial 129

Acquiring Cube 6.4Licensing options7
Licensing optionsCitilabs offers default floating licenses. In this case, the license is activated on a central computer, which manages multiple seat licenses on your network. A floating license can be activated on one workstation and other workstations on the network can use the license from the activated workstation. The number of workstations that can use the license simultaneously, depends on the number of seats available.
Citilabs also offers node-locked licenses. The activation keys with node-locked license is locked to a workstation and cannot be shared across the network. A node locked license key can hold multiple activations, which means that the key can be activated on multiple workstations. This is different from floating license where the licenses are shared from a single activation.
Citilabs also offers server license to be used with terminal servers. This license allows multiple users to log into the same terminal server and work simultaneously. Additionally, this license can be used to share the license with a Virtual Machine.
Discounts are available for multiple seats. Citilabs also offers special licenses for educational use.
For more information on licensing, please contact [email protected].
130 Discover Cube 6.4 Tutorial

Acquiring Cube 6.4Contacts 7
ContactsCitilabs sells Cube 6.4 directly in most parts of the world. In some countries, Citilabs uses distributors.
To obtain a quote, or for further information about Cube 6.4, contact the appropriate representative for your part of the world. You may view a current list of Citilabs sales representatives at:
http://www.citilabs.com/contact
Discover Cube 6.4 Tutorial 131

Acquiring Cube 6.4Contacts7
132 Discover Cube 6.4 Tutorial

Version 6.4January 11, 2016Discover Cube 6.4 Tutorial
Index
AApplication Manager
accessing modules with 15Cube Cargo model 111Cube Voyager demonstration model 31description 9opening 31
applicationsdescription 28list of 30opening 30viewing process 31
applier modeApplication Manager in 31description 12
ArcGIS integration 14ArcGIS Online layer 23
Bbandwidths
highway volume 36transit loads 56
banner, repeating 83Base scenario
opening 34, 111output 21, 35running 34, 114
Build Road scenarioadding link to 47adding link vertices to 41opening 39, 43output 49running 49
CC++ 15catalogs
description 28opening 29
centerline data 39chart properties 92charts
configuring 3D 93editing 91including scenario name in title 96specifying for new report 103–104
Citilabs 127Compare Transit report 81consulting 127costs, evaluating 120Crystal Reports 15Cube
acquiring 131ArcGIS integration 14feature summary 2installing 17integrating other products 15starting 29
Cube Analystdescription 6
Cube Avenue 5Cube Base
interface description 9module integration 15operating modes 11summary 4
Cube Cargodemonstration model 111description 5
Discover Cube 6.4 Tutorial 133

IndexD
estimating demand for service 115evaluating costs 120exercises 109–122results 117study area size 113
Cube Clouddescription 7
Cube Dynasimdescription 6
Cube Land 7Cube Voyager
demonstration model 31description 5
Cubetownadding road segment 43changing demographic data 59existing conditions 33increasing transit frequencies 53using data 109
Cubetown cargo model 110
Ddata labels
description 89specifying for new report 102
data manager 10data pane 30database fields, configuring aliases 89.dbf files 99demographic data
editing 62viewing on map 59working with 59
desire lines 66developer mode
changes made in 34description 12
displaynode numbers 47zone numbers 62
Eediting mode
changing feature values 49entering 41exiting 43saving 43
endpoint snap 47
FFeature Explorer
closing 45link data 48opening 45values 48zone attributes 63
field values 48fonts
editing in header and footer 88Fortran 15freeway interchange 40full extent, map 27
GGIS window
adding ArcGIS Online layer 23adding feature class 22adjusting map with table of contents 24adjusting map with toolbar 26bandwidth display in 38demographic zones in 60displaying path files in 50opening 22posting desire lines 66public transport inputs 54saving edits 49thematic map, displaying 62using feature as template 47viewing nodes in 45
Hheader and footer
editing fonts 88editing layout 86
IIncrease Transit scenario
opening 53output 56results 56running 55
input file formats 99inputs
highway network 21model display 32specifying for scenario 34
Kkeys 30
134 Discover Cube 6.4 Tutorial

IndexL
LLand Use scenario
opening 59output 64running 64
layerhiding from display 26network data, adding to map 60selecting for editing 41
layers, river transit 113links
adding new 47saving 49using as template 47vertex, adding to 41
Mmaintenance contract 124map
adjusting display with table of contents 24, 26ArcGIS Online layer, adding 23demographic data on 60desire line layer, adding 67feature class, adding 22highway bandwidths, adding to 36network data, adding 60path file display on 50saving 27showing node numbers on 45traffic on new link 51viewing full extent 27zones, adding 62
mapping window 9.mat files 99matrix
linking to network 65results, opening 64
Microsoft Excel 15Mode Choice report 82models
accessing 30Cube Cargo demonstration 111Cube Voyager demonstration, description 31flow-chart view 31
modulesaccessing 15list of 3
multiple-scenario reportsconfiguration property 85configuring 93
description 80
Nnavigating in reports 72.net files 99network
adding data to map 60improving quality 39linking to matrix 65transit, viewing 53
New Rail scenariocreating 115outputs 117results 117running 116
nodescentering display on 43displaying numbers on map 45selecting on map 45
Ooutputs
Base scenario 35Build Road scenario 49Cube Cargo model 117Increase Transit scenario 56Land Use scenario, matrix 64Land Use scenario, network 65model display 32New Rail scenario 117Rail Increase scenario 121
Ppath files 50Person Trips report 99
RRail Increase scenario
creating 120outputs 121–122running 120
rail servicecreating scenario 115evaluating results 117
regions, modeling in Cube Cargo 113report properties
content 91field aliases 89font 88general 84
Discover Cube 6.4 Tutorial 135

IndexS
header and footer 87page size 87specifying for new report 101
reportsadding to catalog 100banner, editing 83charts 91–93creating from existing 99creating from scratch 101data labels 89editing 82–98examining 71exercises 69–107general properties 84including scenario name 96input files 99layout 86navigating 72new scenarios and 73opening for subset of scenarios 78opening multiple-scenario report 80presenting multiple scenarios 93
ribbon 9, 15caption button 9groups 9tabs 9
runningBase scenario 34Build Road scenario 49Cubetown cargo model, base scenario 114Increase Transit scenario 55Land Use scenario 64New Rail scenario 116Rail Increase scenario 120
SScenario Manager
accessing reports 70creating new scenarios 73, 77description 9sections in 30specifying report scenarios 79
scenario windowdescription 13opening 34running scenarios from 35
scenarios
See also individual scenario namesbuilding 73, 77codes for 74comparing results 77description 28list of 30specifying subset for viewing 79
single-scenario reportsconfiguration property 85description 78
Ttable of contents 22table window 9tables, editing 91template, using feature as 47thematic map
creating 60displaying in GIS window 62updating display of 63
TP+ 15training 126Tranplan 15transit
loads displayed as bandwidth 56modifying headway 54viewing network 53
Trip Length Frequencies reportopening 72opening, subset of scenarios 80
TRIPS 15
Uuser group 125user support 124
Vvertex
adding 41editing 39moving 41
Wwindows
legacy interface 11tabbed 10
136 Discover Cube 6.4 Tutorial


612 S. Copeland StreetTallahassee, FL 32304 USA
Phone: 1.888.770.CUBE
Fax: 1888.771.CUBE
www.citilabs.com