discovery of an integrative network of micrornas … › ajoulab104 › ...discovery of an...
TRANSCRIPT

Discovery of an integrative network of microRNAsand transcriptomics changes for acute kidney injuryChan Gyu Lee1, Jin Geol Kim1, Hyun Joo Kim1, Hyuk-Kwon Kwon2, Il Je Cho3, Dal Woong Choi4,Woo Hyung Lee1, Won Dong Kim1, Se Jin Hwang5, Sangdun Choi2 and Sang Geon Kim1
1Research Institute of Pharmaceutical Sciences, College of Pharmacy, Seoul National University, Seoul, Korea; 2Department of MolecularScience and Technology, Ajou University, Suwon, Korea; 3College of Oriental Medicine, Daegu Haany University, Daegu, Korea;4Department of Public Health Science, Graduate School, College of Health Sciences, Korea University, Seoul, Korea and 5College ofMedicine, Hanyang University, Seoul, Korea
The contribution of miRNA to the pathogenesis of acute
kidney injury (AKI) is not well understood. Here we evaluated
an integrative network of miRNAs and mRNA data to
discover a possible master regulator of AKI. Microarray
analyses of the kidneys of mice treated with cisplatin were
used to extract putative miRNAs that cause renal injury. Of
them, miR-122 was mostly downregulated by cisplatin,
whereas miR-34a was upregulated. A network integrating
dysregulated miRNAs and altered mRNA expression along
with target prediction enabled us to identify Foxo3 as a core
protein to activate p53. The miR-122 inhibited Foxo3
translation as assessed using an miR mimic, an inhibitor, and
a Foxo3 30-UTR reporter. In a mouse model, Foxo3 levels
paralleled the degree of tubular injury. The role of decreased
miR-122 in inducing Foxo3 during AKI was strengthened by
the ability of the miR-122 mimic or inhibitor to replicate
results. Increase in miR-34a also promoted the acetylation of
Foxo3 by repressing Sirt1. Consistently, cisplatin facilitated
the binding of Foxo3 and p53 for activation, which depended
not only on decreased miR-122 but also on increased
miR-34a. Other nephrotoxicants had similar effects. Among
targets of p53, Phlda3 was robustly induced by cisplatin,
causing tubular injury. Consistently, treatment with miR
mimics and/or inhibitors, or with Foxo3 and Phlda3 siRNAs,
modulated apoptosis. Thus, our results uncovered an miR
integrative network regulating toxicant-induced AKI and
identified Foxo3 as a bridge molecule to the p53 pathway.
Kidney International (2014) 86, 943–953; doi:10.1038/ki.2014.117;
published online 23 April 2014
KEYWORDS: acute kidney injury; cell death; microarray analysis; miRNA
expression; pathophysiology of renal disease; progression
Acute kidney injury (AKI), which is most commonly causedby nephrotoxicants, markedly increases morbidity andmortality in hospitalized patients.1,2 A variety of chemicalssuch as drugs and environmental materials can induce AKI.3
Drugs have an ongoing etiological role in the occurrence ofnephropathy for their direct damaging action on tubularcells. It is recognized as the most common cause of kidney-related problems because nontoxic concentration of the drugduring treatment could reach toxic levels in the kidney. Inparticular, renal tubular cells are vulnerable to the toxiceffects of drugs because of their role in concentrating andreabsorbing the glomerular filtrate. Despite the ongoingstudies, prevalence of drug-induced AKI remains significantlyhigh. As chemical-induced nephropathy accompanies thedisruption of certain signal transduction pathways,understanding of the signaling and working moleculeswould be of value in finding a way to prevent toxicity and/or treat kidney injury.
The microRNA (miRNA) negatively regulates geneexpression by base-pairing with the 30-untranslated region(UTR) of target messenger RNA.4 Abnormal levels of miRNAcould be one of the mechanisms explaining dysregulatedprotein expression during kidney disease progression.5 Althoughprofiles of miRNA expression have been examined in renaldiseases, such as polycystic disease, diabetic nephropathy,renal cancer, and fibrosis,6–9 few studies have specificallydescribed the identification of miRNAs and their roles inAKI. Moreover, little information was available on the networkintegrating miRNA dysregulation and altered mRNA expres-sion that occur in nephropathy. Considering the fact that thecorrelation between transcriptome and proteome expressionis not always linear because of posttranscriptional regulationof mRNA translation and protein modifications,10 an inte-grative network of both miRNA and mRNA databases mayprovide key information in identifying the factors involved indrug-induced toxicity, shedding light on new strategies forthe management of AKI.
Drugs such as cisplatin, aminoglycosides, and amphoter-icin B induce tubular injury. In particular, cisplatin is awidely prescribed agent; its main dose-limiting side effect is
http://www.kidney-international.org b a s i c r e s e a r c h
& 2014 International Society of Nephrology
Correspondence: Sang Geon Kim, Research Institute of Pharmaceutical
Sciences, College of Pharmacy, Seoul National University, Gwanakno 599,
Seoul 151-742, Korea. E-mail: [email protected]
Received 13 August 2013; revised 9 February 2014; accepted 6 March
2014; published online 23 April 2014
Kidney International (2014) 86, 943–953 943

AKI itself, and it is a direct inducer of proximal and distaltubular epithelial cell damage. Nephrotoxicity of cisplatin is acomposite result of many presentations implicated in drug-induced nephrotoxicity, such as drug transport, activation ofmultiple pathways, and initiation of inflammatory re-sponse,11 which makes cisplatin a suitable model for AKI.
This study investigated an integrative regulatory networkof altered miRNA and transcript levels governing AKIinduced by cisplatin treatment. In particular, we wereinterested in identifying the specific miRNAs that directlycontrol a bridge molecule leading to cell death during AKI.Of the miRNAs differentially expressed in the miRNA micro-arrays, we found the most significant reciprocal changes inthe levels of miR-122 and -34a during renal injury. Moreover,we identified their coordinated translational and posttransla-tional roles in activating Foxo3 as a molecule bridging top53-dependent apoptosis. To assess the degree of nephrop-athy, a cascade of cell death pathway, and the underlyingbasis, both animal and cell models were utilized along with abioinformatic approach using the outcomes of miRNA andmRNA microarrays. In addition, our findings uncovered thefunctional role of Phlda3, an effector molecule substantiallyinduced downstream of p53, in tubular cell death.
RESULTSmiRNAs dysregulated in AKI caused by cisplatin
To identify the miRNAs dysregulated in AKI induced bycisplatin, renal miRNA microarray analyses were carried outin mice at day 3 after a single intraperitoneal (i.p.) injectionof cisplatin (15 mg/kg). Seven miRNAs showed significantchanges in expression on cisplatin treatment when a cutoff ofPo0.05 was used; the expression of five was decreased,whereas that of two was increased (Figure 1a). Of them, miR-122 levels showed the greatest downregulation comparedwith vehicle-treated control, whereas expression of miR-34awas distinctly increased. Quantitative reverse transcription-PCR assays confirmed the changes (Figure 1b). In the time-course study, miR-122 levels decreased on day 1 aftercisplatin treatment and remained low until day 3. At day 5,they were slightly increased from the trough (Figure 1c, left).However, miR-34a levels increased significantly at day 3 andwere further increased at day 5 after treatment (Figure 1c,right). In a subsequent study, we narrowed our focus ondysregulation of miR-122 and -34a because the changes werethe greatest.
An integrated regulatory network of dysregulated miRNAsand mRNAs
To facilitate the prediction of targets possibly interacting withmiR-122 and -34a, we performed cDNA microarray analysesusing the kidneys of mice treated with a single dose ofcisplatin (15 mg/kg, at day 3), and the microarray profileswere compared (Figure 2a). Among those represented on themicroarray, 36 genes were differentially expressed by cisplatintreatment when Po0.01 and a twofold change cutoff wereused. Bioinformatic analyses using TargetScan algorithms
allowed us to select the targets putatively regulated by miR-122 and -34a. In this approach, we focused on five candidategenes that have potential to be regulated by decreased miR-122 in association with cell death (Supplementary Table S1online). Twelve genes were chosen as possible targets affectedby increased miR-34a (Supplementary Table S2 online).Integrated analyses of miRNA and mRNA expression data
miR
-122
miR
-30e
miR
-193
miR
-26a
let-7
gm
iR-3
4a
*
*
Array
qRT–PCR
* * *
*
***
**
**
Log2
(C
ispl
atin
vs.
veh
icle
rat
io)
2
1
0
–1
–2
–3
–4
–5
miR-122 miR-34a
**
***
**
*
1.4
1.2
1.0
0.8
0.6
0.4
0.2
0
Vehic
le
Rel
ativ
e m
iRN
A le
vel
Rel
ativ
e m
iRN
A le
vel
0
1
2
3
4
5
1 3 5
Vehic
le
Cisplatin Cisplatin
1 3 5 (day)(day)
miR
-10b
*
Downregulated miRNAs Upregulated miRNAs
miRNAmiRNA
0.03260.04280.03630.03630.0293
–3.39miR-122miR-10b*miR-30emiR-193miR-26a
–1.16–0.44–0.26–0.31
Log2 ratioLog2 ratio P-valueP-value
0.02130.0420
1.110.27
miR-34alet-7g
Log2 (Cisplatin/vehicle) ratio of differentially expressed miRNAsthat reached statistical significance by T-test (P < 0.05)
Figure 1 | The expression profiles of microRNAs (miRNAs) in thekidney after cisplatin treatment. (a) A list of differentially expressedmiRNAs in the microarray analysis, including log2 ratio and P values.Microarrays were performed with miRNA samples extracted from thekidney at day 3 after a single administration of vehicle or cisplatin(15 mg/kg) to C57BL/6 mice. (b) Quantitative reverse transcriptionPCR (qRT-PCR) validation of differentially expressed miRNAs. Resultsare shown as mean of log2(cisplatin/vehicle) and are presented side-by-side with the respective array results. (c) The effects of cisplatintreatment on the levels of miR-122 and -34a. For b and c, valuesrepresent the mean±s.e.m. (significantly different as comparedwith vehicle treatment according to array or qRT-PCR analysis,respectively, *Po0.05, **Po0.01; N¼ 3 per group in miRNA array andN¼ 4 per group in qRT-PCR).
b a s i c r e s e a r c h CG Lee et al.: miRNAs leading to AKI
944 Kidney International (2014) 86, 943–953
Heat map for genes in gene set: p53 signaling
Cisplatin
Terms
Cell cycle
Vehicle
MDM2CDKN1A
BBC3BAX
GTSE1PMAIP1
EI24APAF1
SFNTNFRSF10B
CASP9TNF
Phlda3 FAIM2 C16ORF5
ARHGEF3
PSENEN
APH1A PEA15
RNF34
NCSTN
DEDD
PEG10
ROCK1
miR-34a
PDCD4 MDM4SIRT1
TP73TP53
MGMT
PLK2CYCS
CCNG1
SULF2 PHLDA3
PLK3
EPHX1
DPYD
miR-34a
SIRT1FOXO3
TP53
miR-122
MDM2
CDKN1A
BBC3
SNCA
PASSF5
ZMAT3 FHITPACRG
FOXO3
FOXO1
BCL2
CD74
miR-122CASP2
ITSN1
SLC12A3
PER2
SGK1
PKM2
EPO
MEF2D
EPOR
ALAS2
ADAMTSL4
ABR
SGPP1
ZDHHC16
Cis
plat
in #
3
Cis
plat
in #
2
Cis
plat
in #
1
Veh
icle
#3
Veh
icle
#2
Veh
icle
#1
Cox6b2Aldh1a1Cdkn1aEphx1Ccng1Trp53inp1Ces5PIk2MgmtPIk3Mdm2Ltc4sSgk1Stc1Sulf2Bbc3Cxcl10Zmat3Per2Exoc4Polr3eSlc12a3SncaEsm1DpydRtkn2Cd74Slc8a1PacrgGmdsFhitAlas2Immp2lMup2Hbb-b1
–4.0 4.0
Core network
–4.0
a
c
b
4.00.0
Z-score
p53 signaling pathway
Drug metabolism
Cell cycleMetabolism of xenobiotics by
cytochrome P450
P-value Z-score
4.91
3.76
2.85
2.820.0024
0.0022
8.53e–05
4.50e–07p53 signaling pathway
Drug metabolism
Metabolism of xenobiotics by CYP450
Enriched pathway
6543210
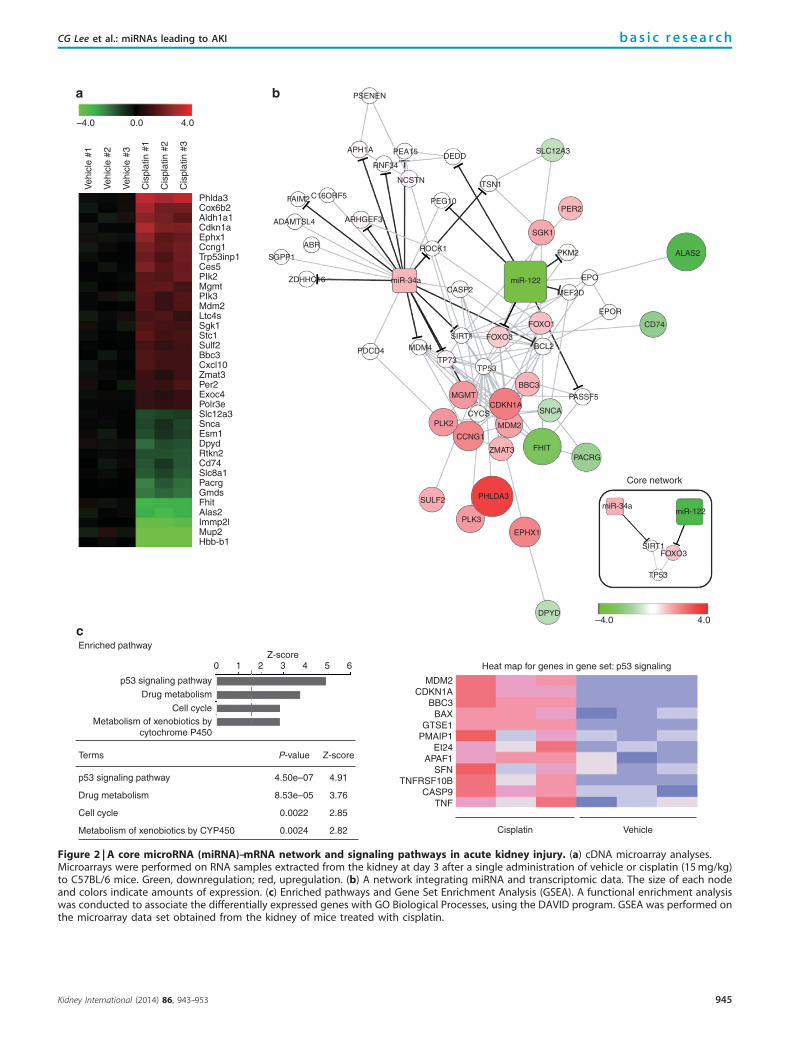
Figure 2 | A core microRNA (miRNA)–mRNA network and signaling pathways in acute kidney injury. (a) cDNA microarray analyses.Microarrays were performed on RNA samples extracted from the kidney at day 3 after a single administration of vehicle or cisplatin (15 mg/kg)to C57BL/6 mice. Green, downregulation; red, upregulation. (b) A network integrating miRNA and transcriptomic data. The size of each nodeand colors indicate amounts of expression. (c) Enriched pathways and Gene Set Enrichment Analysis (GSEA). A functional enrichment analysiswas conducted to associate the differentially expressed genes with GO Biological Processes, using the DAVID program. GSEA was performed onthe microarray data set obtained from the kidney of mice treated with cisplatin.
Kidney International (2014) 86, 943–953 945
CG Lee et al.: miRNAs leading to AKI b a s i c r e s e a r c h
along with the outcome of target-prediction programanalysis suggested that Foxo3 is likely a key factor governedby the key miRNA regulatory network (Figure 2b). Acore network was shown from the integrated network toemphasize molecules interacting with Foxo3 (Figure 2binset). In addition, the integrative analyses of our databaseand target prediction pointed out the genes whose expressionis necessary for p53-mediated apoptosis (Figure 2b). Con-sistently, the p53 signaling pathway was most significantlyenriched in a functional enrichment analysis (Figure 2c, left).In Gene Set Enrichment Analysis, cisplatin treatmentupregulated a subset of genes targeted by p53 (P¼ 0.1;Figure 2c, right).
Foxo3 as a direct target of miR-122
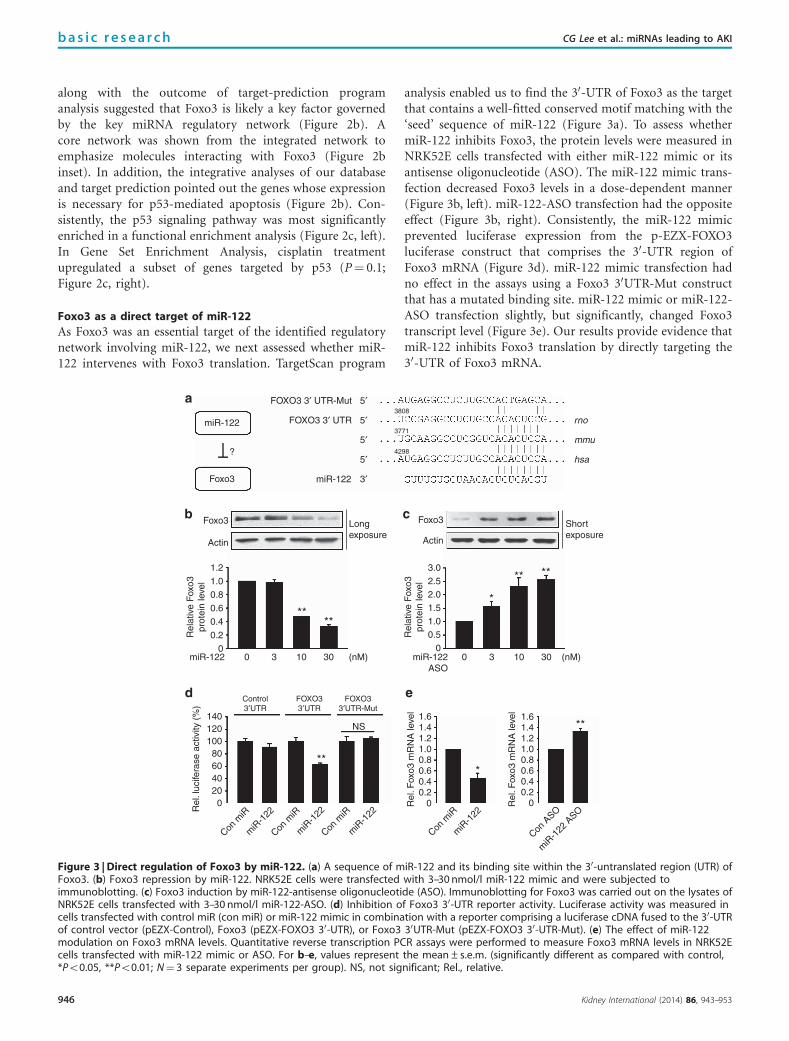
As Foxo3 was an essential target of the identified regulatorynetwork involving miR-122, we next assessed whether miR-122 intervenes with Foxo3 translation. TargetScan program
analysis enabled us to find the 30-UTR of Foxo3 as the targetthat contains a well-fitted conserved motif matching with the‘seed’ sequence of miR-122 (Figure 3a). To assess whethermiR-122 inhibits Foxo3, the protein levels were measured inNRK52E cells transfected with either miR-122 mimic or itsantisense oligonucleotide (ASO). The miR-122 mimic trans-fection decreased Foxo3 levels in a dose-dependent manner(Figure 3b, left). miR-122-ASO transfection had the oppositeeffect (Figure 3b, right). Consistently, the miR-122 mimicprevented luciferase expression from the p-EZX-FOXO3luciferase construct that comprises the 30-UTR region ofFoxo3 mRNA (Figure 3d). miR-122 mimic transfection hadno effect in the assays using a Foxo3 30UTR-Mut constructthat has a mutated binding site. miR-122 mimic or miR-122-ASO transfection slightly, but significantly, changed Foxo3transcript level (Figure 3e). Our results provide evidence thatmiR-122 inhibits Foxo3 translation by directly targeting the30-UTR of Foxo3 mRNA.
miR-122
Foxo3
Foxo3 Foxo3
Actin
1.2
1.0
0.8
0.6
0.4
0.2
0
*
**
Rel
. Fox
o3 m
RN
A le
vel
Rel
. luc
ifera
se a
ctiv
ity (
%)
Rel
. Fox
o3 m
RN
A le
vel
1.21.41.6
1.00.80.60.40.2
0
miR
-122
miR
-122
miR
-122
miR
-122
miR
-122
ASO
Con A
SO
Con m
iR
Con m
iR
Con m
iR
Con m
iR
1.21.41.6
1.00.80.60.40.2
0
(nM) (nM)
****
** **
*
miR-122
Rel
ativ
e F
oxo3
prot
ein
leve
l
Rel
ativ
e F
oxo3
prot
ein
leve
l
0 3 30100
0.51.01.52.02.53.0
miR-122ASO
0 3 3010
Actin
Longexposure
Shortexposure
?
FOXO3 3′ UTR-Mut
rno
mmu
hsa
FOXO3 3′ UTR 5′
5′3808
3771
42985′
5′
3′miR-122
NS
**
FOXO33′UTR
Control3′UTR
FOXO33′UTR-Mut
140120100806040200
Figure 3 | Direct regulation of Foxo3 by miR-122. (a) A sequence of miR-122 and its binding site within the 30-untranslated region (UTR) ofFoxo3. (b) Foxo3 repression by miR-122. NRK52E cells were transfected with 3–30 nmol/l miR-122 mimic and were subjected toimmunoblotting. (c) Foxo3 induction by miR-122-antisense oligonucleotide (ASO). Immunoblotting for Foxo3 was carried out on the lysates ofNRK52E cells transfected with 3–30 nmol/l miR-122-ASO. (d) Inhibition of Foxo3 30-UTR reporter activity. Luciferase activity was measured incells transfected with control miR (con miR) or miR-122 mimic in combination with a reporter comprising a luciferase cDNA fused to the 30-UTRof control vector (pEZX-Control), Foxo3 (pEZX-FOXO3 30-UTR), or Foxo3 30UTR-Mut (pEZX-FOXO3 30-UTR-Mut). (e) The effect of miR-122modulation on Foxo3 mRNA levels. Quantitative reverse transcription PCR assays were performed to measure Foxo3 mRNA levels in NRK52Ecells transfected with miR-122 mimic or ASO. For b–e, values represent the mean±s.e.m. (significantly different as compared with control,*Po0.05, **Po0.01; N¼ 3 separate experiments per group). NS, not significant; Rel., relative.
946 Kidney International (2014) 86, 943–953
b a s i c r e s e a r c h CG Lee et al.: miRNAs leading to AKI

Foxo3 induction in injured kidney
Although Foxo3 is known as a regulator of apoptosis,12
the role of Foxo3 in AKI has been scarcely studied. To assessthe link between Foxo3 and renal injury, we determined theassociation of increased levels of Foxo3 with the degree of
renal cell death. Kidney function was measured using knownblood parameters; blood urea nitrogen and serum creatininelevels were both gradually elevated at day 3 and/or at day 5after cisplatin treatment (Figure 4a, left). The levels of kidneyinjury molecule-1 (Kim-1), a well-known biomarker of
**
**
**
*
**** **
Cre
atin
ine
(mg/
dl)
Rel
. Kim
-1 m
RN
A le
vel
BU
N (
mg/
dl)
100
80
60
40
20
0
80
60
40
20
0
Fox
o3-p
ositi
ve c
ells
Rel
. miR
-122
leve
l
Tubules (nuclei) Tubules (cytoplasm) Glomeruli
NS
NSNS
**
**
****
**
**
800
600
400
200
0
3.02.52.01.51.00.5
0
0
20
40
60
80
Fox
o3-p
ositi
ve c
ells
Fox
o3-p
ositi
ve c
ells
020406080
100120140
Rel
. neu
trop
hil e
last
ase
mR
NA
leve
l
4
0
1
2
3
1.0
0.8
0.6
0.4
0.2
0
Vehic
le
Cisplatin
1 3
Vehic
le5 (day)
Vehic
le
Vehic
le
Vehic
le
Cisplatin
Cisplatin
Cisplatin
Cisplatin
Con miR miR-122
NRK52E
NRK52E
miR-122ASOCon ASO
–– + +
–– + +
1 3 5 (day)
Vehic
le
Cisplatin
1 3 5 (day)
Vehic
le
Cisplatin
1 3 5 (day)
Vehic
le
Vehic
le
Cisplatin
Cisplatin
1 3 5 (day)Rel
. Fox
o3 le
vel
**** *
1 3 5 (day)
Cisplatin
1 3 5 (day)
Vehic
le
Cisplatin
1 3 5 (day)
Vehic
le
Cisplatin
1 3 5 (day)
Control Cisplatin 1d
*
** *
*
*
**
**
**
Cisplatin 3d Cisplatin 5d
Vehicle Cisplatin 1 day Cisplatin 3 day Cisplatin 5 day
Kidney
H&
E s
tain
ing
Fox
o3
Foxo3NRK52E
Actin
Foxo3
Foxo3
Actin
Actin
CisplatinFoxo3
Actin
24 48 72 (h)
24 48 72 (h)
** ****
1.21.00.80.60.40.2
0
500 μm
100 μm
100 μm
Figure 4 | Foxo3 induction by cisplatin. (a) The time-course effect of cisplatin treatment on blood urea nitrogen (BUN), serum creatininecontents, Kim-1 mRNA, and neutrophil elastase mRNA in the kidney. (b) Hematoxylin and eosin (H&E) staining and immunohistochemicalanalysis for Foxo3. Asterisks indicated desquamation of the tubular epithelium. Arrowheads indicate flattened tubular epithelium, whereasarrows indicate nuclear swelling and vacuolization of the tubular epithelium in necrotizing tubular epithelia. Bar¼ 500mm in the upper columnand 100 mm in the middle and lower columns. (c) Quantification of Foxo3-positive cells in tubules (nuclear and cytoplasmic) or glomeruli.(d) The effect of cisplatin treatment on Foxo3. Foxo3 levels in the kidney were measured by immunoblotting at the indicated times after anintraperitoneal injection of cisplatin in C57BL/6 mice. For a, c and d, values represent the mean±s.e.m. (significantly different as compared withvehicle-treated control (Con), *Po0.05, **Po0.01; N¼ 4 per group). (e) The effect of cisplatin on Foxo3 in NRK52E cells. Immunoblotting wasperformed on the lysates of NRK52E cells treated with 30 mmol/l cisplatin for the indicated times. (f) Decrease in miR-122 in NRK52E cells treatedwith cisplatin. Data represent the mean±s.e.m. of three replicates (treatment mean significantly different from the mean of vehicle-treatedCon, **Po0.01). (g) The effect of miR-122 modulation on Foxo3. NRK52E cells were transfected with 10 nmol/l miR-122 mimic or antisenseoligonucleotide (ASO), followed by treatment with 30 mmol/l cisplatin for 48 h. NS, not significant; Rel. relative.
Kidney International (2014) 86, 943–953 947
CG Lee et al.: miRNAs leading to AKI b a s i c r e s e a r c h

AKI,13 were also increased, which matched the progressiverenal damage elicited by cisplatin (Figure 4a, middle).Cisplatin treatment promoted infiltration of inflammatorycells (neutrophil and macrophage) in the kidney, as indicatedby increases of neutrophil elastase and F4/80, respectively(Figure 4a, right; and Supplementary Figure S1A online).Consistently, tumor necrosis factor-a and intercellular adhesionmolecule mRNA levels were increased (Supplementary FigureS1B and C online). Levels of CD3e and CD19 (indicators ofT cell and B cell) were marginally changed (SupplementaryFigure S1A online).
Histopathological and immunohistochemical assays sup-ported the concept that increased levels of Foxo3 contributedto tubular cell injury (Figure 4b). Quantification of immuno-histochemical data confirmed Foxo3 increase in both nucleiand cytoplasm (Figure 4c). Foxo3 levels were elevated at day1 or day 3 after cisplatin treatment, and slightly returned tocontrol levels at day 5 (Figure 4d). In addition, cisplatintreatment decreased NRK52E cell viability (data not shown),which was accompanied not only by Foxo3 induction butalso by decrease in miR-122 (Figure 4e and f). To linkbetween miR-122 repression and Foxo3 induction in thetubular cell injury, the effect of miR-122 mimic or ASOtransfection on Foxo3 expression was examined in NRK52Ecells treated with cisplatin. miR-122 mimic transfectionabrogated the ability of cisplatin to induce Foxo3, whereasthat with miR-122-ASO fortified it (Figure 4g). These dataindicate that Foxo3 induced by decrease in miR-122 maycontribute to cisplatin-induced kidney toxicity.
Foxo3 activation by miR-34a
On the basis of the established network, we next assessed theeffect of miR-34a on the expression of key molecule(s)interacting with Foxo3. As miR-34a inhibits the expressionof Sirt1 responsible for deacetylation of Foxo3,12,14 wemonitored acetyl modification of Foxo3 in response tocisplatin treatment. Acetylated Foxo3 levels were increasedby cisplatin in parallel with progressive renal damage(Figure 5a). A time-dependent increase in miR-34a level bycisplatin was also verified in NRK52E cells (Figure 5b). Asexpected, cisplatin treatment increased the levels of acetylatedand total forms of Foxo3 (Figure 5c, left). miR-34a mimictransfection in combination with cisplatin treatment furtherenhanced the acetylated or total form of Foxo3 levels. miR-34a-ASO transfection resulted in the opposite effect(Figure 5c, right). These results showed that miR-34aupregulated by cisplatin may contribute to the activation ofFoxo3 presumably via Sirt1 repression.
Foxo3 as a bridge molecule to activate the p53 signalingpathway
Foxo3 has been shown to directly bind p53 and activate p53-dependent apoptosis.15,16 Having identified Foxo3 as a bridgeprotein between dysregulated miRNAs and p53 signalingpathway in tubular cell injury, we confirmed the functionalrole of Foxo3 induced by cisplatin in the activation of p53.
Treatment of NRK52E cells with cisplatin facilitated theassociation of Foxo3 and p53 as a function of time, being inparallel with the accumulation of p53 and Bax (Figure 6a).Abrogation of the basal and cisplatin-inducible expression ofp53 by the knockdown of Foxo3 verified the key role of Foxo3in maintaining upregulated levels of p53 (Figure 6b).Consistently, miR-122 mimic transfection diminished p53and Bax levels in NRK52E cells treated with cisplatin, whereasthat with miR-122-ASO exerted the opposite effect (Figure 6c).In addition, miR-34a mimic transfection promoted both thebasal and the inducible expression of p53 and Bax (Figure 6d).miR-34a-ASO transfection antagonized the ability of cisplatinto increase p53 and Bax levels. All of these results stronglysupport the conclusion that the increased expression andactivation of Foxo3 elicited by toxicant-induced miRNAdysregulation has a role in triggering the p53 signalingpathway.
Phlda3 as an effector molecule activated by p53 in AKI
As a continuing effort to find the molecule responsible fortubular cell death downstream from p53, we sought toexamine the levels of downstream effector molecules in thecore network (Figure 7a). In quantitative reverse transcrip-tion-PCR assays, cisplatin treatment substantially upregu-lated the expression of Phlda3 mRNA and other p53 targettranscripts (Figure 7b). Of them, Phlda3 showed the highestmRNA fold change and the lowest P-value in the kidney
Rel
ativ
e m
iR-3
4a le
vel
**
*
10
8
6
4
2
0012345
Rel
ativ
eA
c-F
oxo3
leve
l
Vehic
le
Vehic
le
Vehic
le
1 3 5
1 3 5
24 48 72 (h)(day)
(day)
Kidney
****
Ac-Foxo3Actin
CisplatinCisplatin
Cisplatin Cisplatin
NR
K52E
Cisplatin
Foxo3
Sirt1
Actin
Ac-Foxo3
Foxo3
Sirt1
Actin
Ac-Foxo3
Con miR Con ASO– + – + – + – +
miR-34amiR-34a
ASO
NR
K52E
Figure 5 | Role of miR-34a in the acetylation of Foxo3 by cisplatin.(a) Acetylated Foxo3 levels in the kidney. Immunoblotting foracetyl–lysine was performed on Foxo3 immunoprecipitates preparedat the indicated times. Values represent the mean±s.e.m.(significantly different as compared with vehicle-treated control(Con), **Po0.01; N¼ 4 per group). (b) Induction of miR-34a bycisplatin in NRK52E cells. Data represent the mean±s.e.m. of threereplicates (treatment mean significantly different from the mean ofvehicle-treated Con, *Po0.05, **Po0.01). (c) The effect of miR-34amodulations on Foxo3. The cells were similarly treated as described inFigure 4g.
948 Kidney International (2014) 86, 943–953
b a s i c r e s e a r c h CG Lee et al.: miRNAs leading to AKI

injured by cisplatin. As the structure of Phlda3 is similar tothe PH-domain,17 Phlda3 may interfere with binding ofactivating Akt to the plasma membrane.18,19 In a time-coursestudy, p53 or Phlda3 levels in the kidney were also elevated bycisplatin treatment, which caused gradual decreases in p-Aktlevels (Figure 7c). To associate Phlda3 and tubular injury bycisplatin, we measured Phlda3- and terminal deoxynucleoti-dyl transferase dUTP nick end labeling (TUNEL)-positive cellnumbers using serial kidney sections. Cisplatin treatmentmarkedly increased TUNEL-positive cell numbers (Figure 7d).In the samples, TUNEL-positive cells were detected to agreater extent in Phlda3-positive cells than in Phlda3-negative ones, supporting the notion that Phlda3 inducedby cisplatin may contribute to tubular cell death.
In a NRK52E cell model, cisplatin treatment increased theexpression of Phlda3, which matched decreases in p-Akt at 48and 72 h after an adaptive increase at 24 h (Figure 7e). In thecells treated with cisplatin (48 h), the ability of Phlda3 toantagonize Akt phosphorylation was verified by the increasein p-Akt level after knockdown of Phlda3 (Figure 7f). Asexpected, miR-122 transfection resulted in the opposite effect(Figure 7g). Our results demonstrate that Phlda3 substan-tially induced by cisplatin downstream from p53 mayfacilitate tubular cell death by diminishing Akt activity.
Changes in cell viability by modulations of the targetsidentified
Finally, we monitored whether modulations of miR-122 and/or -34a levels affect the degree of cisplatin-induced cell deathin vitro. miR-122-ASO transfection further decreased theviability of NRK52E cells as compared with cisplatin treatmentalone, whereas that with miR-122 mimic increased it(Figure 8a). When the cells were transfected with eithermiR-34a mimic or miR-34a-ASO, cell viability was signifi-cantly changed (Figure 8b). Combined treatment with miR-122-ASO and miR-34a mimic further decreased the viabilityof cells in response to cisplatin (Figure 8c). Also, silencing ofFoxo3 completely prevented cisplatin-induced cytotoxicity,whereas that of Phlda3 partially did so (Figure 8d and e). Inthe rescue assay, the protective effect of miR-122 against cisplatinwas diminished by transfection with a Foxo3 constructlacking the 30UTR (Figure 8f). These results support theconclusion that Foxo3 induced and activated by miR-122 and-34a dysregulation contributes to acute tubular injury byfortifying the p53 signaling pathway (Figure 8g).
DISCUSSION
Many ‘-omics’ studies have been conducted to elucidate themolecular pathology. Nonetheless, the underlying basis andthe cascade pathway leading to renal injury are only partiallyknown from the databases. Moreover, miRNA expressionprofiles accounting for AKI had not been identified. OurmiRNA microarray data shown in the present studydemonstrate for the first time that miR-122 levels were mostmarkedly decreased in the kidney injured by cisplatintreatment throughout the time points examined (1–5 days).Our finding also showed a distinct increase in the level ofmiR-34a, raising the hypothesis that AKI induced by toxicantmight be controlled by miR-122 and -34a dysregulation.
An important finding of the present study is the discoveryof a core miRNA–mRNA network that associates Foxo3 withthe process of toxicant-induced injury. Our integratedapproach may serve as a major step forward as comparedwith the commonly used transcriptome-based approachbecause the identified miRNA and mRNA network was ofvalue in defining Foxo3 as the key molecule that isposttranscriptionally and posttranslationally activated andtriggers the pathway leading to AKI. In association with thediscovery of Foxo3 as a bridge molecule, the present workenabled us to extract the enriched pathways associated withkidney injury, which included the p53 signaling pathway, cellcycle, and CYP450 metabolism of xenobiotics. Becausecisplatin has an effect on cell-cycle progression for cancertherapy, the expression of cell-cycle–associated genes wassignificantly changed. CYP450 and metabolism pathwayswere also affected probably because cisplatin is metabolizedin the liver and kidney.
In the present study, we revealed the new function of miR-122 as a direct suppressor of Foxo3 mRNA translation, asshown by its ability to inhibit Foxo3 expression and decreaseFoxo3 30-UTR reporter activity. The role of miR-122 in
IP:p53
Cisplatin si Con si Foxo3
(h)24 48 72– +– +–
+– +– +– +–
+– +–+– +–
IB: Foxo3
p53
Bax
Actin
Cisplatin
Cisplatin Cisplatin
Foxo3
p53
Bax
Actin
Con miR miR-122 Con ASOmiR-122
ASO
p53
Bax
Actin
Cisplatin
p53
Bax
Actin
Cisplatin
p53
Bax
Actin
p53
Bax
Actin
Con miR miR-34a Con ASOmiR-34a
ASO
Figure 6 | The effects of miR-122 or -34a modulations on Foxo3and p53 activation by cisplatin. (a) Binding of Foxo3 and p53 foractivation. Immunoblotting (IB) for Foxo3 was performed on p53immunoprecipitates (IPs) from NRK52E cells treated with 30 mmol/lcisplatin for the indicated times. (b) Inhibition of p53 by smallinterfering RNA (siRNA) knockdown of Foxo3. NRK52E cells weretransfected with a siRNA directed against Foxo3 followed bytreatment with 30 mmol/l cisplatin for 48 h. (c) The effect of miR-122mimic or antisense oligonucleotide (ASO) on p53. (d) The effect ofmiR-34a mimic or ASO on p53.
Kidney International (2014) 86, 943–953 949
CG Lee et al.: miRNAs leading to AKI b a s i c r e s e a r c h

regulating Foxo3 was fortified by the result obtained usingmiR-122-ASO. Our findings represent the first evidence thatdecrease in miR-122 causes the induction of Foxo3 duringAKI. The causal effect of Foxo3 on tubular cell death wasstrengthened by the finding that cisplatin treatment increasedFoxo3 in a cell model, which was reversed by the miR-122mimic and enhanced by miR-122-ASO. Consistently, ourresults confirmed an increase in Foxo3 levels in vivo: Foxo3induction was also detectible in the immunohistochemical
analysis, implying that Foxo3 may serve as a marker oftubular cell injury. Increase in Foxo3 was observed in tubules,but not in glomeruli (Figure 4c), although injuries werefound in both (Supplementary Figure S2 online), suggestingthe notion that Foxo3 controlled by the proposed integrativenetwork is induced in a cell-type–specific manner.
It has been extensively studied that miR-122 is highlyabundant in the liver and is implicated in liver diseases.20,21
Nevertheless, the functional role of miR-122 in kidney disease
p-Akt
mIR-34amIR-122
p53
Vehic
le
SIRT1FOXO3
TP53
CDKN1A
Actin
Akt
p-Akt
Phlda3
Phl
da3
TU
NE
L
MGMT
CCNG1
PHLDA3
1 3 5 (day)
0.2
0.4
0.6
0.8
1.0
1.2p-Akt
Phlda3
*
** **
**
**
Vehic
le
Rel
. Phl
da3
leve
l Rel. P
-Akt level
6
5
4
3
2
1
0
Vehic
le
Phlda3
+
Phlda3
–
Cisplat
inTU
NE
L+ c
ells
(co
unts
)
0
20
40
60
80
Rel
. mR
NA
leve
l
151050
Array
qRT–PCR
Mgm
t
Ccng1
Cdkn1
a
Phlda3
20406080
0
20
40
60
80
100
**
Rel
. TU
NE
L+ c
ells
(%
)
0(Day)
Kidney
Cisplatin
Vehicle
100 μm
100 μm
Cisplatin
1 3 5
Cisplatin
**
Cisplatin
Cisplatin
– 24 48 72 (h)
NR
K52E
NR
K52E
NR
K52E
Con miR
CisplatinCisplatin
Phlda3
p-Akt
Phlda3
p-Akt
Akt
Akt
Akt
Actin
Actin
Actin
miR-122si Phlda3si Con
– +– +– –+ +
Figure 7 | A core integrative network and interacting molecules. (a) A core network of microRNA (miRNA) and mRNA leading to theinduction of Phlda3. (b) Upregulation of p53 target genes in the kidney of mice treated with cisplatin as described in Figure 1a.(c) Immunoblotting for p53, Phlda3, and p-Akt in the kidney homogenates. Data represent the mean±s.e.m. (treatment mean significantlydifferent from the mean of vehicle-treated control, *Po0.05, **Po0.01; N¼ 4 per group). (d) Immunohistochemical analysis for Phlda3 andterminal deoxynucleotidyl transferase dUTP nick end labeling (TUNEL) staining in the kidney of mice treated with cisplatin as described inFigure 1a. (e) Immunoblotting for Phlda3 and p-Akt in NRK52E cells treated with cisplatin (30 mmol/l). (f) The effect of Phlda3 knockdown onp-Akt. NRK52E cells were transfected with small interfering (si) RNA directed against Phlda3, followed by treatment with 30 mmol/l cisplatinfor 48 h. (g) The effect of miR-122 mimic treatment on Phlda3 and p-Akt. Con, control; qRT-PCR, quantitative reverse transcription-PCR; Rel.,relative.
950 Kidney International (2014) 86, 943–953
b a s i c r e s e a r c h CG Lee et al.: miRNAs leading to AKI

has been scarcely explored. In recent studies, miR-122 hasbeen shown to be upregulated in renal cancer,22,23 which mayaccount for the progression of RCC growth and proliferation.
Despite the effect of increased levels of miR-122 on renalcancer biology, the role of miR-122 in the physiology ofnormal kidney cells was unknown. Another important
P<0.05 P<0.05Renal toxicant
(cisplatin)
miR-122 miR-34a
SIRT1
Foxo3 Foxo3
p53
Phlda3
Acute kidney injury
Ac
(inactive) (active)
** **
CisplatinmiR-122miR-122
ASOCon miRCon ASO
– + – + – + – +
Rel
ativ
e ce
ll vi
abili
ty (
%)
120
100
80
60
40
20
0
P<0.05
P<0.05
P<0.05 NS
**
Foxo3 constructlacking 3′UTR
Mock
**
P<0.05 P<0.01
**** *
P<0.05
** **
Cisplatin
miR-34amiR-34aASO
Con miRCon ASO
– + – + – + – +
Rel
ativ
e ce
ll vi
abili
ty (
%) 120
100
80
60
40
20
0
Cisplatin – –+ + – –+ + – –+ +
miR-34a+
miR-122ASO
si Con si Consi Foxo3 si Phlda3Con miR
Rel
ativ
e ce
ll vi
abili
ty (
%)
120
100
80
60
40
20
0
120
100
Cisplatin
miR-122
– –++ + +
– – – –+ +
80
Rel
ativ
e ce
ll vi
abili
ty (
%)
60
40
20
0
Cisplatin
Rel
ativ
e ce
ll vi
abili
ty (
%)
120
100
80
60
40
20
0Cisplatin
Rel
ativ
e ce
ll vi
abili
ty (
%)
120
100
80
60
40
20
0
Figure 8 | Cell viability after modulations of miR-122 and -34a, or Foxo3 and Phlda3. (a) The effect of miR-122 on cisplatin-inducedcell death. NRK52E cells were transfected with miR-122 mimic or antisense oligonucleotide (ASO), followed by treatment with 30 mmol/lcisplatin for 48 h. (b) The effect of miR-34a on cisplatin-induced cell death. (c) The effect of combined treatment with miR-122-ASO andmiR-34a mimic. (d) Decrease in cisplatin-induced cell death by Foxo3 knockdown. NRK52E cells were transfected with a small interferingRNA directed against Foxo3, followed by treatment with 30 mmol/l cisplatin for 72 h. (e) Improvement in cell survival by Phlda3 knockdown.(f) The effect of transfection with a Foxo3 construct lacking the 30-untranslated region (UTR) on the cytoprotective effect of miR-122.(g) A proposed pathway by which nephrotoxicant elicits AKI. For a–f, data represent the mean±s.e.m. of four replicates (treatment meansignificantly different from that of vehicle-treated control (Con), *Po0.05, **Po0.01).
Kidney International (2014) 86, 943–953 951
CG Lee et al.: miRNAs leading to AKI b a s i c r e s e a r c h

finding of the present study is that decrease in miR-122contributed to tubular cell injury on cisplatin treatment. Asthe basal miR-122 levels might be greater in tubules than inglomeruli (Po0.1; Supplementary Figure S3 online), miR-122 dysregulation may be more predominant in tubules.Overall, miR-122 may function as a mediator that controlstubular cell viability despite its lesser basal expression in thekidney than in the liver, suggestive of its potential as atherapeutic means to prevent and/or treat toxic nephropathy.
In several toxic challenges, miR-34a has been shown to beinduced.24,25 In addition, miR-34a is a target gene of p53activation during DNA damage, implying that increase inmiR-34a may reflect the ensuing apoptosis.25 miR-34arepresses Sirt1, a deacetylase that activates Foxo3.12,26,27
In our findings, miR-34a was also distinctly elevated in thekidney after cisplatin treatment. As increase in miR-34aactivates Foxo3 by suppressing Sirt1, it is highly likely thatposttranslational modification of Foxo3 due to an increase inmiR-34a favors a shift in tubular cell viability toward cell-cycle arrest or apoptosis.
An active form of Foxo3 induces p53-dependent apoptosisby cytoplasmic accumulation and stabilization of p53.28 Tworegions within Foxo3 (FH and CR3 domains) interact withthe DNA-binding domain of p53.29 It is well recognized thatp53 becomes activated in response to a myriad of stress.30
In kidney tubules, the accumulation of p53 leads to cell-cyclearrest and apoptosis.31,32 In our results, Foxo3 induced bycisplatin promoted its interaction with p53, enhancing p53stability. Consistently, Foxo3 induction by cisplatin precedesp53 stabilization and activation. Our data showingFoxo3–p53 binding or p53 accumulation as a consequenceof miR-122 and -34a dysregulation strengthens the regulatoryfunction of the identified miRNA–mRNA core network in theprocess of AKI.
Drug-induced acute renal failure is encountered in agrowing number of patients because of a more aggressivediagnostic or therapeutic approach in an aging and multi-medicated patient population that is increasingly vulner-able.33,34 Although chemical-induced AKI is encountered inmany people because of medications or exposure to environ-mental toxicants,3 limited information had been available onthe mechanism of toxic nephropathy and the responsiblemolecules.35 In the present study, the results of the cDNAmicroarray and the enriched pathways obtained from themicroarray data included not only the activation of p53 butalso the large induction of Phlda3, enabling us to find Phlda3as one of the effector molecules causing tubular cell death.This contention was further supported by the observationthat Phlda3 contributes to tubular cell death in cell-basedassays, as also strengthened by the in vivo results ofimmunohistochemical analysis and TUNEL staining.
In an effort to generalize the pathological relevance of theproposed network in renal injury, we additionally employedother toxicants and monitored miRNAs and target geneexpression levels. Treatment with either doxorubicin orgentamicin dysregulated miR-122 and -34a in the kidney of
mice as did cisplatin treatment, which matched not only withthe severities of renal injury but also with the increases inFoxo3 and p53 (Supplementary Figure S4A–C online). Ourdata strengthen the contention that renal toxicants inducetubular injuries probably through the pathways of theintegrative miRNA–mRNA network.
Collectively, the results shown here demonstrate thatdysregulation of miR-122 and -34a has a critical role in acuterenal tubular injury caused by toxicants, identifying Foxo3 asa key molecule bridging to augment the p53 signalingpathway. This idea was fortified by the abilities of exogenousmiR-122 and -34a mimics or inhibitors to alter p53 and Baxlevels in cell-based assays. Moreover, our findings stronglysupport the conclusion that dysregulation of miR-122 and-34a leads to Phlda3-mediated tubular injury, implying thatmodulations of the identified miRNAs, bridging molecules,and/or effector molecules could be the mechanism withwhich to prevent or treat AKI elicited by nephrotoxicants.
MATERIALS AND METHODSAdditional details regarding the materials and methods are providedin Supplementary Information online.
Animal treatmentAnimal experiments were conducted under the guidelines andethical approvals of the Institutional Animal Use and Care Committeeat Seoul National University. Male C57BL/6 mice (9 weeks old) werepurchased from Samtako Company (Osan, Korea) and housedunder filtered, pathogen-free air, with food and water availablead libitum. After the mice were injected with a single dose ofcisplatin (15 mg/kg, i.p.), doxorubicin (20 mg/kg, i.p.), and gentamicin(250 mg/kg, i.p.), the cortices of kidney tissues were taken forbiochemical assays.
miRNA and cDNA microarray analysesThe mirVana miRNA isolation kit (Ambion, Austin, TX) was usedfor total RNA isolation according to the manufacturer’s protocol.miRNA microarray analysis was performed using the Agilent mousemiRNA microarray (Agilent, Santa Clara, CA), which was based onSanger miRbase release 15.0 (http://www.mirbase.org).
For cDNA microarray analyses, the integrity of total RNAextracted from mouse kidney was assessed using Bioanalyzer 2100(Agilent). The RNA integrity number was 10 for all samples. A measureof 500 ng of high-quality total RNA was amplified with a TotalPrepamplification kit (Ambion), and 750 ng of amplified cRNA washybridized to the Illumina MouseWG-6 expression beadchip(Illumina, San Diego, CA) for 16 h. The hybridized array wasscanned with a BeadArray Reader (Illumina). The probe intensitieswere normalized at log2 scale using quantile normalization inbeadarray 1.6 (http://www.bioconductor.org), an R/Bioconductorpackage. The microarray data were deposited in the GEO databasebefore submission (accession number: GSE35257).
Real-time PCR assaysTotal RNA for quantitative reverse transcription-PCR was extractedusing Tri-Reagent (Molecular Research Center, Cincinnati, OH).Quantitative reverse transcription-PCR was carried out according tothe manufacturer’s instructions using a Light CyclerDNA masterSYBR green-I kit (Light-Cycler 2.0, Roche, Mannheim, Germany) as
952 Kidney International (2014) 86, 943–953
b a s i c r e s e a r c h CG Lee et al.: miRNAs leading to AKI

described previously.36 The details and primer information are inSupplementary Information online.
Bioinformatic analysesDifferentially expressed genes by cisplatin treatment were statisticallyselected as the genes with t-test P-values less than 0.01 with a foldchange 42. Statistically enriched signaling pathways of clustereddifferentially expressed genes were ranked and categorized accordingto the Kyoto Encyclopedia of Genes and Genomes pathway usingDAVID software.37 Targetscan 6.2 database (http://www.targetscan.org) was used to predict mRNAs possibly regulated by the differen-tially expressed miRNAs. Gene interaction network between theclustered differentially expressed genes was achieved by STRING 9.0(http://string-db.org) and visualized by Cytoscape software.38,39
DISCLOSUREAll the authors declared no competing interests.
ACKNOWLEDGMENTSThis work was financially supported by the Korea Ministry of Foodand Drug Safety in 2010–2012 (10182KFDA992).
SUPPLEMENTARY MATERIALFigure S1. The effects of cisplatin treatment on kidney inflammation.Figure S2. TUNEL staining in tubules and glomeruli.Figure S3. qRT-PCR assays for miR-122 and -34a in tubules andglomeruli.Figure S4. The effects of other nephrotoxicants on miR-122, miR-34a,Foxo3, and p53 levels.Table S1. The candidate target genes of miR-122 that are associatedwith apoptosis regulation.Table S2. The candidate target genes of miR-34a that are associatedwith apoptosis regulation.Supplementary material is linked to the online version of the paper athttp://www.nature.com/ki
REFERENCES1. Himmelfarb J, Ikizler TA. Acute kidney injury: changing lexicography,
definitions, and epidemiology. Kidney Int 2007; 71: 971–976.2. Uchino S, Kellum JA, Bellomo R et al. Acute renal failure in critically ill
patients: a multinational, multicenter study. JAMA 2005; 294: 813–818.3. Vilay AM, Wong CS, Schrader RM et al. Indicators for serious kidney
complications associated with toxic exposures: an analysis of the NationalPoison Data System. Clin Toxicol (Phila) 2013; 51: 96–105.
4. Bagga S, Bracht J, Hunter S et al. Regulation by let-7 and lin-4 miRNAsresults in target mRNA degradation. Cell 2005; 122: 553–563.
5. Ho J, Kreidberg JA. The long and short of microRNAs in the kidney. J AmSoc Nephrol 2012; 23: 400–404.
6. Chandrasekaran K, Karolina DS, Sepramaniam S et al. Role of microRNAsinkidney homeostasis and disease. Kidney Int 2012; 81: 617–627.
7. Pandey P, Brors B, Srivastava PK et al. Microarray-based approachidentifies microRNAs and their target functional patterns in polycystickidney disease. BMC Genomics 2008; 9: 624.
8. Krupa A, Jenkins R, Luo DD et al. Loss of MicroRNA-192 promotesfibrogenesis in diabetic nephropathy. J Am Soc Nephrol 2010; 21:438–447.
9. Kato M, Arce L, Wang M et al. A microRNA circuit mediates transforminggrowth factor-beta1 autoregulation in renal glomerular mesangial cells.Kidney Int 2011; 80: 358–368.
10. Laloo B, Simon D, Veillat V et al. Analysis of post-transcriptionalregulations by a functional, integrated, and quantitative method. Mol CellProteomics 2009; 8: 1777–1788.
11. Pabla N, Dong Z. Cisplatin nephrotoxicity: mechanisms andrenoprotective strategies. Kidney Int 2008; 73: 994–1007.
12. Giannakou ME, Partridge L. The interaction between FOXO and SIRT1:tipping the balance towards survival. Trends Cell Biol 2004; 14: 408–412.
13. Vaidya VS, Ferguson MA, Bonventre JV. Biomarkers of acute kidney injury.Annu Rev Pharmacol Toxicol 2008; 48: 463–493.
14. Yamakuchi M, Ferlito M, Lowenstein CJ. miR-34a repression of SIRT1regulates apoptosis. Proc Natl Acad Sci USA 2008; 105: 13421–13426.
15. Chung YM, Park SH, Tsai WB et al. FOXO3 signalling links ATM to the p53apoptotic pathway following DNA damage. Nat Commun 2012; 3: 1000.
16. You H, Mak TW. Crosstalk between p53 and FOXO transcription factors.Cell Cycle 2005; 4: 37–38.
17. Saxena A, Morozov P, Frank D et al. Phosphoinositide binding by thepleckstrin homology domains of Ipl and Tih1. J Biol Chem 2002; 277:49935–49944.
18. Datta K, Franke TF, Chan TO et al. AH/PH domain-mediated interactionbetween Akt molecules and its potential role in Akt regulation. Mol CellBiol 1995; 15: 2304–2310.
19. Kawase T, Ohki R, Shibata T et al. PH domain-only protein PHLDA3 is ap53-regulated repressor of Akt. Cell 2009; 136: 535–550.
20. Lagos-Quintana M, Rauhut R, Yalcin A et al. Identification of tissue-specific microRNAs from mouse. Curr Biol 2002; 12: 735–739.
21. Girard M, Jacquemin E, Munnich A et al. miR-122, a paradigm for the roleof microRNAs in the liver. J Hepatol 2008; 48: 648–656.
22. Zhou L, Chen J, Li Z et al. Integrated profiling of microRNAs and mRNAs:microRNAs located on Xq27.3 associate with clear cell renal cellcarcinoma. PLoS One 2010; 5: e15224.
23. Osanto S, Qin Y, Buermans HP et al. Genome-wide microRNA expressionanalysis of clear cell renal cell carcinoma by next generation deepsequencing. PLoS One 2012; 7: e38298.
24. Ghawanmeh T, Thunberg U, Castro J et al. miR-34a expression, cell cyclearrest and cell death of malignant mesothelioma cells upon treatmentwith radiation, docetaxel or combination treatment. Oncology 2011; 81:330–335.
25. Chang TC, Wentzel EA, Kent OA et al. Transactivation of miR-34a by p53broadly influences gene expression and promotes apoptosis. Mol Cell2007; 26: 745–752.
26. Brunet A, Sweeney LB, Sturgill JF et al. Stress-dependent regulation ofFOXO transcription factors by the SIRT1 deacetylase. Science 2004; 303:2011–2015.
27. Motta MC, Divecha N, Lemieux M et al. Mammalian SIRT1 repressesforkhead transcription factors. Cell 2004; 116: 551–563.
28. You H, Yamamoto K, Mak TW. Regulation of transactivation-independentproapoptotic activity of p53 by FOXO3a. Proc Natl Acad Sci USA 2006;103: 9051–9056.
29. Wang F, Marshall CB, Yamamoto K et al. Biochemical and structuralcharacterization of an intramolecular interaction in FOXO3a and itsbinding with p53. J Mol Biol 2008; 384: 590–603.
30. Boulon S, Westman BJ, Hutten S et al. The nucleolus under stress. Mol Cell2010; 40: 216–227.
31. Dagher PC. Apoptosis in ischemic renal injury: roles of GTP depletion andp53. Kidney Int 2004; 66: 506–509.
32. Molitoris BA, Dagher PC, Sandoval RM et al. siRNA targeted to p53attenuates ischemic and cisplatin-induced acute kidney injury. J Am SocNephrol 2009; 20: 1754–1764.
33. Chronopoulos A, Cruz DN, Ronco C. Hospital-acquired acute kidney injuryin the elderly. Nat Rev Nephrol 2010; 6: 141–149.
34. Evenepoel P. Toxic nephropathy due to drugs and poisons. In: Jorres A,Ronco C, Kellum JA (eds). Management of Acute Kidney Problems. SpringerPublications: New York, 2010, pp 317–328.
35. Faubel S, Chawla LS, Chertow GM et al. Ongoing clinical trials in AKI. ClinJAm Soc Nephrol 2012; 7: 861–873.
36. Lee CG, Kim YW, Kim EH et al. Farnesoid X receptor protects hepatocytesfrom injury by repressing miR-199a-3p, which increases levels of LKB1.Gastroenterology 2012; 142: 1206–1217.
37. Huang da W, Sherman BT, Lempicki RA. Systematic and integrativeanalysis of large gene lists using DAVID bioinformatics resources. NatProtoc 2009; 4: 44–57.
38. Szklarczyk D, Franceschini A, Kuhn M et al. The STRING database in 2011:functional interaction networks of proteins, globally integrated andscored. Nucleic Acids Res 2011; 39: D561–D568.
39. Smoot ME, Ono K, Ruscheinski J et al. Cytoscape 2.8: new features fordata integration and network visualization. Bioinformatics 2011; 27:431–432.
Kidney International (2014) 86, 943–953 953
CG Lee et al.: miRNAs leading to AKI b a s i c r e s e a r c h