discovery of quasi-molecular ions in electrospray spectra by automated searching for simultaneous...
TRANSCRIPT
Technical Notes
Discovery of Quasi-Molecular Ions in ElectrospraySpectra by Automated Searching for SimultaneousAdduct Mass Differences
Ekkehard Go1rlach* and Ramsay Richmond†
Core Technology Area Analytics Unit, Novartis Pharma AG, CH-4002 Basel, Switzerland
Our high-throughput flow injection analysis mass spec-trometry (FIA-MS) system using electrospray ionizationsteers the majority of ion current into quasi molecular ionand adduct m/z positions. One advantage of this dawnedon us, i.e., that adducted electrospray spectra are ame-nable to automated quasi molecular ion discovery bysearching for the simultaneous occurrence of adduct massdifferences. Therefore, an adduct scanning algorithm wasdeveloped, given a graphical user interface, and thenincorporated into a Visual Basic application originallydeveloped for reporting of high-throughput FIA-MS re-sults.
In any interpretation of a mass spectrum, the first step isusually the manual assignment of molecular weight. Sincemethane positive chemical ionization (CI) was first reported in1966, it has been extensively used in molecular weight determi-nation of molecules under 800 a.m.u.1-3 The principal reason forits popularity was that the quasi molecular ion [M + H]+ generallyhad greater stability than the molecular ion [M]+ in electronimpact ionization. Prominent adduct ions exist, i.e., [M + C2H5]+
and [M + C3H5]+ and to a lesser extent the [M + CH5]+
species.3-4 Occasionally observed ions include the [2M + H]+,[2M + CH5]+, [2M + C2H5]+, and [M + C3H5]+ species.5 As statedin ref 6, “initially, these adduct ions appear to confuse thespectrum, but actually they have diagnostic value in the determi-nation of M” as their simultaneous occurrence allows them to beused as powerful pointers for the assignment of molecular weight.By analogy with methane positive ion CI, adducts in thermospray7
and electrospray ionization (ESI)8 are also frequently seen. Theelectrospray adduct ion intensities relative to the quasi molecularion are more variable compared with the relative intensities inmethane positive ion CI, but a compensatory feature for structureelucidation is that the adducts in ESI are more diverse. Unfortu-nately, this diversity is potentially confusing as it can obscure thequasi molecular ion. This is especially so in our high-throughputFIA-MS, as the chemists see their spectra directly on theirworkbench PC screens, containing no written quasi molecular ionannotation by mass spectrometrists. However the high degree ofadduction seen in soft ESI, i.e., with no intentional in-sourcecollision-induced dissociation, offers the possibility of automatedquasi molecular ion discovery, by scanning a spectrum for thesimultaneous occurrence of adduct mass differences. The workpresented here has some similarities to the halogen isotope clusterenhancement programs reported in, refs 9-11, although ouremphasis is on mass difference, and the relative ion intensityconditions are much looser.
The RackViewer system developed to deliver the FIA-MSresults quickly and directly to our sample-submitting chemistshas been reported.12 RackViewer has four main views, specificallyOverview, Spectrum, 3-D map, and Chromatogram.13-14 A movableadduct stencil developed to overlay any spectrum within theSpectrum view and serve as a quasi molecular ion discovery“scanner” has been briefly discussed.13 Here we focus on twomajor enhancements to this quasi molecular ion discovery tool.First, the reporting within the Spectrum view of the cumulativeadduct ion current (∑ %RA) found in the movable adduct stencil.Second, the application of this movable adduct stencil linked with∑ %RA evaluation, to automated quasi molecular ion discoverywithin the bird’s eye 3-D map,13 either for individual combinatorialsyntheses or for contiguous liquid chromatography (LC) fractionsin a 96-well rack.14 In this, putative quasi molecular ions are picked
* Corresponding author.† Corresponding author on analytics.
(1) Munson, M. S. B.; Field, F. H. J. Am. Chem. Soc. 1966, 88, 2621-2630.(2) Munson, M. S. B.; Field, F. H. J. Am. Chem. Soc. 1966, 88, 4337-4345.(3) Wilson, M. S.; Dzidic, I.; McCloskey, J. A. Biochim. Biophys. Acta 1971,
240, 623-626.(4) Fales, H. M.; Milne, G. W. A.; Vestal, M. L. J. Am. Chem. Soc. 1969, 91,
3682-3685.(5) Maryanoff, C. A.; Caldwell, G. W.; Chang, S. Y. Org. Mass Spectrom. 1988,
23, 129-134.(6) Leclercq, P. A.; Desiderio, D. M. Org. Mass Spectrom. 1973, 7, 515-533.(7) Volmer, D.; Preiss, A.; Levsen, K.; Wunsch, G. J. Chromatogr., A 1993,
647, 235-259.
(8) Karlsson, K.-E. J. Chromatogr., A 1998, 794, 359-366.(9) Canada, D. C.; Regnier, F. E. J. Chromatogr. Sci. 1976, 14, 149-154.
(10) Anderegg, R. J. Anal. Chem. 1981, 53, 2169-2171.(11) LaBrosse, J. L.; Anderegg, R. J. J. Chromatogr. 1984, 314, 93-102.(12) Hegy, G.; Gorlach, E.; Richmond, R.; Bitsch, F. Rapid Commun. Mass
Spectrom. 1996, 10, 1894-1900.(13) Gorlach, E.; Richmond, R.; Lewis, I. Anal. Chem. 1998, 70, 3227-3234.(14) Richmond, R.; Gorlach, E.; Seifert, J.-M. J. Chromatogr., A 1999, 835, 29-
39.
Anal. Chem. 1999, 71, 5557-5562
10.1021/ac9904011 CCC: $18.00 © 1999 American Chemical Society Analytical Chemistry, Vol. 71, No. 24, December 15, 1999 5557Published on Web 10/27/1999

out and color-highlighted from large slabs of MS data. A semi-preparative LC fraction set of a multiple parallel combinatorialchemistry synthetic end product was used, first, to illustrate thepracticability of these ideas and, second, to show the integrationof these various discovery tools in a unified visual interface.
1. EXPERIMENTAL1.1. LC Fraction Set. The combinatorial synthetic end
product had an expected stoichiometric formula C31H42N4O6, witha monoisotopic molecular weight ) 566.3. From 110 mg of crudeproduct, a 2-mg aliquot was separated by LC for subsequent FIA-MS analysis.14
The LC solvent delivery system and solvent gradient has beendescribed.14 In total, 84 fractions each consisting of 0.6 mL,representing 0.33-min intervals, were collected into Micronic 45× 8.8 mm tubes. The tubes were evaporated to dryness and placedin a 96-well Micronics rack in positions B1-H12 and sent for FIA-MS.
1.2. Sample Delivery and Preparation. The receivedevaporated residue in each 96-well tube was redissolved in 0.2mL CH3CN/H2O 70:30 v/v. In parallel to the rack’s physicaldelivery to the MS laboratory, a Microsoft Excel CSV format filedescribing the sample positions and expected stoichiometricformulae was electronically deposited on a file server by thesample-submitting synthetic chemist. The MS operator then callsthe Excel file, and UNIX script files automatically build the massspectrometer analysis page method list.12-14
Each 10-µL sample injection is followed by two loop washes(10 µL CH3CN/H2O 70:30 v/v) to waste. The FIA-MS measure-ment duty cycle for each LC fraction is 90 seconds. Samples areusually measured in a left-to-right sequence, B1 to B12, C1 to C12,... H1 to H12.
Each LC fraction rack has a yohimbine standard curve installedin row A by the MS operator, for the sake of maintaining inter-rack comparability. This was made from yohimbine hydrochloride(Sigma part no. Y-3125), dissolved in 1.0 mL CH3CN/H2O 70:30v/v.14 For LC fraction racks, the synthetic chemists often supplyno expected stoichiometric formula in the accompanying MicrosoftExcel CSV files. In this case, the MS operator modifies the CSVfile so that the purity estimation defaults to reporting yohimbinepurities for the entire rack, not just for the yohimbine standardcurve inserted by the MS operator in row A. If the syntheticchemists supply a formula, then yohimbine purities are reportedonly for the standard curve in row A.
1.3. Mass Spectrometry. A Finnigan MAT SSQ-7000 singlequadrupole mass spectrometer (San Jose, CA) was used, con-trolled by a DEC AXP 3000/300 workstation under the OSF/1V3.2D operating system running the Finnigan Interactive Chemi-cal Information System (ICIS) V8.2.1 application software. TwoEthernet interfaces connected the workstation to the SSQ-7000and the Novartis local area network (LAN), respectively. Adedicated file service accessible by the synthetic chemists wasset up on the Novartis LAN, to exchange files with the DEC AXP3000/300 via TCP/IP (Samba).
The Finnigan ICIS package controls a Hewlett Packard 1090series II liquid chromatograph through a HP-IB interface and theautosampler via the RS-232C interface. An eight 96-well rackautosampler was used, i.e., the model HTS PAL from CTCAnalytics, CH-4222 Zwingen, Switzerland.
The MS operating conditions in ESI positive mode were:heated capillary temperature, 220 °C; conversion dynode at 15kV; electron multiplier at 0.9 kV, a collision induced dissociationoffset of 0.0 V and a spray voltage of 4.5 kV. The scan range was160-1560 m/z per 2 s in centroid acquisition mode. The FIAsolvent was CH3CN/H2O 70:30 v/v as in ref 14. The FIA flow ratewas 50 µL/min. Normally, 2 µL of sample was injected, onto a10-µL loop. The connection between the autosampler LC valveand the exit end of the electrospray spray nozzle was as in ref 14.The head pressure for the ESI source nitrogen sheath gas was60 p.s.i. The particular Finnigan API interface version no. was asin ref 14. A 0.001 mg/mL solution of yohimbine hydrochloride,reserpine, and cyclosporin A in CH3CN/H2O 70:30 v/v, infusedat 50 µL/min was used to coarse-tune in profile acquisition. Forsubsequent fine tuning to accentuate the adduction characteristicsof the electrospray tuning, the yohimbine [M + H + CH3CN]+/[M + H]+ (or [M + Cl]-/[M - H]-) profile signal ratio wasmaximized.
The RackViewer application for networked reporting of FIA-MS results has been reported.12-14 The discovery algorithm wasimplemented in C++ (Microsoft Visual C++, version 4.2) andloaded into RackViewer as a dynamic link library.
2. RESULTS2.1. Criteria Used for Quasi Molecular Ion Discovery. To
include ion current in the quasi molecular ion discovery programand report it as ∑ %RA within the Spectrum and 3-D map views,all the following criteria (Figure 1) are sequentially met:
(1a) The quasi molecular ion, e.g., [M + H]+ or [M - H]-,must have ion intensity above 1 %RA. (1b) An A + 1 ion must bepresent,15 at quasi molecular + (1 ( 0.2) m/z. (1c) This A + 1ion must fulfill an intensity isotope criterium (eq 1). (1d) If thereis an ion at the quasi molecular - (1 ( 0.2) m/z, it can not havegreater intensity than the quasi molecular ion. (2a) For an ion tobe regarded as a quasi molecular one, there must be at least oneadduct with the correct ∆m/z, e.g., [M + Na]+ must have 22 (0.2 m/z units greater than the [M + H]+. (2b) An A + 1 ion mustbe present, at adduct + (1 ( 0.2) m/z. (2c) This A + 1 ion mustfulfil an intensity isotope criteria (eq 1). (2d) If there is an ion atthe adduct - (1 ( 0.2) m/z, it can not have greater intensity thanthe adduct ion.
Figure 1. Schematic of ion current inclusion criteria in the discoveryalgorithm for the quasi molecular ion and the adduct ion.
5558 Analytical Chemistry, Vol. 71, No. 24, December 15, 1999
Criterion 1d excludes the A + 1 and A + 2 part of the quasimolecular cluster being reported as quasi molecular ions. Criterion2d excludes other confusions, e.g., the ∆m/z between A + 1 ofthe [M + K]+ and the monisotopic of [M + Na]+ being interpretedas that between the monoisotopic of [M + H]+ and the monoiso-topic of [M + NH4]+, or the ∆m/z between A + 1 of the [M +K]+ cluster and the monoisotopic of [M + NH4]+ being interpretedas that between the monoisotopic of [M + H]+ and the monoiso-topic of [M + Na]+.
As for criteria 1c and 2c, the A + 1 intensity is contributedpredominately by carbon, nitrogen, silicon, and sulfur and to alesser extent hydrogen and oxygen.15 Silicon and sulfur can beexcluded as their stoichiometry in synthetic end products makesthem generally unimportant in A + 1 ion contributions. Novartis’synthetic chemistry was examined for the highest relative A + 1content. An averaging of the relative ratios of C H N O in 420stoichiometric formulae from five diverse combinatorial chemis-tries gave five ratio sets, Table 3. The highest nitrogen/carbonratio was typified by the formula C18H29N4O2. Therefore, the A +1 relative ion intensity at mw ) 333, will be (18 × 1.1%) + (29 ×0.015%) + (4 × 0.37%) + (2 × 0.04%) ) 21.8%. This allows thefollowing equation to be derived:
1. %RA[A + 1]/%RA[quasi molecular] ) (deviation factor) (0.218) (ion’sm/z value)/333
However, under the soft ESI conditions used, there will besome deviation of the cluster shape from the theoretical, andtherefore, a factor of 1.5 was included in the above equation. Thisequation was used in criteria 1c and 2c to exclude all quasimolecular or adduct ions that had greater than the expected A +1 ion current.
2.2. Quasi Molecular Ion Discovery in Individual Spectra.This is implemented in two subviews within the Spectrum view,Figure 2. The largest subview occupies the left-hand side anddepicts the spectrum of the chosen well. The second subviewoccupies the bottom right-hand side. It appears only when an on/off switch called “show adducts” is activated, Figures 2 and 3. It
comprises a small discovery “scanner” box with the ∑ %RA asthe y-axis, oval outlined in Figure 2. Under the x-axis, two buttonsexist with arrows pointing right and left, respectively. The rightand left arrows direct the quasi molecular ion discovery programto move up and down the spectrum, respectively, and scan forpossible quasi molecular ions. Each time the respective arrow ismouse-clicked the discovery program skips to the next quasimolecular ion hit. As each ion hit is found, a histogram bar isdisplayed within the box with its height proportional to the ∑ %RAof the ions found in all the adduct positions. The last 20consecutive hits are recorded within this box in blue. The currenthit is displayed in red. The molecular weight and the ∑ %RA ofthe current hit are visible above the scanner box.
In addition, when the show adducts switch is activated, anadduct stencil comprising dotted vertical lines appears on the largespectrum picture. When first switched on, the stencil [M + H]+
(or [M - H]- if in negative-ion mode) is positioned by defaultover the position of the expected quasi molecular ion. As soon asthe quasi molecular ion discovery program starts scanning downor up mass upon user request in the discovery scanner box, theadduct stencil skips down or up the spectrum, respectively.
2.3. Quasi Molecular Ion Discovery in 3-D Ion CurrentData Sets. The 3-D map of RackViewer13 presents a bird’s eyeview of the entire ion current belonging to a 96-well rack using Xaxis, e.g., LC fraction no. or combinatorial synthesis well, Y axis(m/z), and color. Three colorization criteria are available, select-able with the list box color on the bottom right of the 3-D map
(15) McLafferty, F. W.; Turecek, F. Interpretation of Mass Spectra, Fourth ed;University Science Books: California, 1993; pp. 23-25.
Table 1. List of Cationic Adducts Displayed by theAdduct Stencil in the Spectrum View
m/z position cation identity
(M + 2)/2a [M + 2H]2+ a
M + 1 [M + H]+
M + 7 [M + Li]+
M + 18 [M + NH4]+
M + 20 [2M + H + K]2+
M + 23 [M + Na]+
M + 39 [M + K]+
M + 42 [M + H + CH3CN]+
M + 48 [M + Li + CH3CN]+
M + 64 [M + Na + CH3CN]+
M + 80 [M + K + CH3CN]+
M + 83 [M + H + CH3CN + CH3CN]+
(2M) + 1 [2M + H]+
(2M) + 18 [2M + NH4]+
(2M) + 23 [2M + Na]+
(2M) + 39 [2M + K]+
a The adduct in italics is not incorporated in the quasi molecularion discovery algorithm either in the Spectrum or 3-D map views.
Table 2. List of Anionic Adducts Displayed by theAdduct Stencil in the Spectrum View
m/z position anion identity
(M - 2)/2a [M - 2H]2- a
M - 1 [M - H]-
M + 21 [M + Na - 2H]-
M + 35 [M + Cl]-
M + 37 [M + K - 2H]-
M + 79 [M + Br]-
M + 45 [M + HCO2]-
M + 59 [M + CH3CO2]-
M + 113 [M + CF3CO2]-
(2M) - 1 [2M - H]-
(2M) + 21 [2M + Na - 2H]-
(2M) + 37 [2M + K - 2H]-
a The adduct in italics is not incorporated in the quasi molecularion discovery algorithm either in the Spectrum or 3-D map views.
Table 3. Average Stoichiometry of Hydrogen, Nitrogen,and Oxygen Relative to Carbon, in Five DiverseNovartis Combinatorial Chemistries
chemistryhydrogen/carbon
rationitrogen/carbon
ratiooxygen/carbon
ratio
rack 165a 1.61 0.22 0.11rack 275 1.23 0.12 0.27rack 508 1.11 0.12 0.09rack 700 0.96 0.12 0.09rack 998 1.29 0.15 0.13
a The A + 1 ratio of the N-substituted peptoid chemistry used toillustrate the 3-D map is comfortably accommodated by the use of theratios from rack 165 in the ion current inclusion criteria 1c and 2c,Figure 1.
Analytical Chemistry, Vol. 71, No. 24, December 15, 1999 5559
display, Figures 3 and 4. The criteria are by “Mass”, i.e., forbiddenloss or adduct zoning, secondly by “Intensity”, i.e., simple %RA,and thirdly by “Discovery” (I and II), i.e., ∑ %RA. Upon enteringthe 3-D map, the default is by Mass rendering.13 This colorizationis orientated towards an expected quasi molecular ion in eachwell’s spectrum13 and will not be discussed further in the presentcontext.
The colorizations that are of use for quasi molecular iondiscovery are by Discovery (I and II) and to a lesser extent byIntensity. In both schemes each ion is colorized in a rainbowgradation according to its %RA, Figure 4, with red and blue
meaning high and low intensity, respectively. An illustrativevertical minimum/maximum color bar legend adjacent to 3-D map,appears upon colorization. In Discovery I mode, Figure 5, eachputative quasi molecular ion displayed after colorization has topossess at least one adduct in Table 1 or 2 in the positive-ion ornegative-ion mode, respectively, and this must fulfil the A + 1relative intensity requirement already discussed. In Discovery IImode, Figure 6, each putative quasi molecular ion displayed aftercolorization has to possess at least two adducts in either Table 1or 2, and this must fulfil the A + 1 relative intensity requirement.The Discovery I and II ∑ %RA current in the 3-D map is identicalto that reported in the Discovery I and II scanner box in theSpectrum view.
In both Discovery I and II, the colorization is then normalizedversus the putative quasi molecular ion with the highest amountof attributable ion current, Figures 4 and 5. The attributable ioncurrent is specifically ∑ %RA and has no isotope cluster breadth,i.e., for unknown monoisotopic cluster shapes, unlike the by Masscolorization in the 3-D map for expected monoisotopic clustershapes. Using the discovery algorithm, all putative quasi molecularions will be automatically displayed within this 3-D map of thetotal ion current.
If too much obscuring ion current exists in any of the three3-D map colorizations, then one can increase the threshold toeliminate it, which enhances the more important ion current, e.g.,%RA ) 10% in the Intensity depiction or ∑ %RA ) 10% in theDiscovery depiction. One can select a particular threshold withthe list box “Threshold” on the bottom left of the 3-D map, Figures
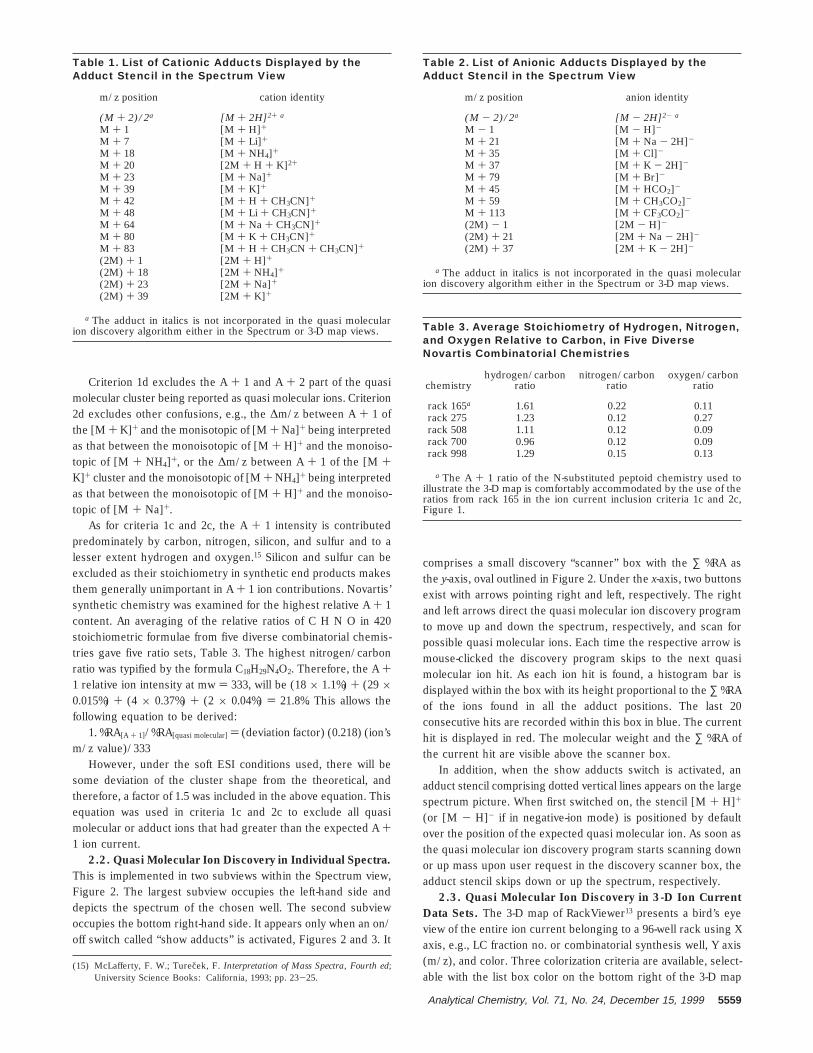
Figure 2. Positive-ion ESI spectrum of the expected synthetic product with monoisotopic molecular weight ) 566.3, in well E10, showing theprominent quasi molecular [M + H]+. As the spectrum has been zoomed in on the quasi molecular ion region, the gas dimers [2M + H]+, [2M+ NH4]+, [2M + Na]+, and [2M + K]+ are off-scale. The quasi molecular ion discovery I algorithm found three molecular weight hits in thisspectrum, i.e., 566.3 with ∑ %RA ) 258.6, 583.4 with ∑ %RA ) 29.9, and 1132.7 with ∑ %RA ) 110.8. The hit with mw ) 583.4, actually the[M + NH4]+ ion, is a false positive. The hit with mw ) 1132.7 is the [2M + H]+ ion. The discovery II algorithm found only the hits with mw )566.3 and 1132.7.
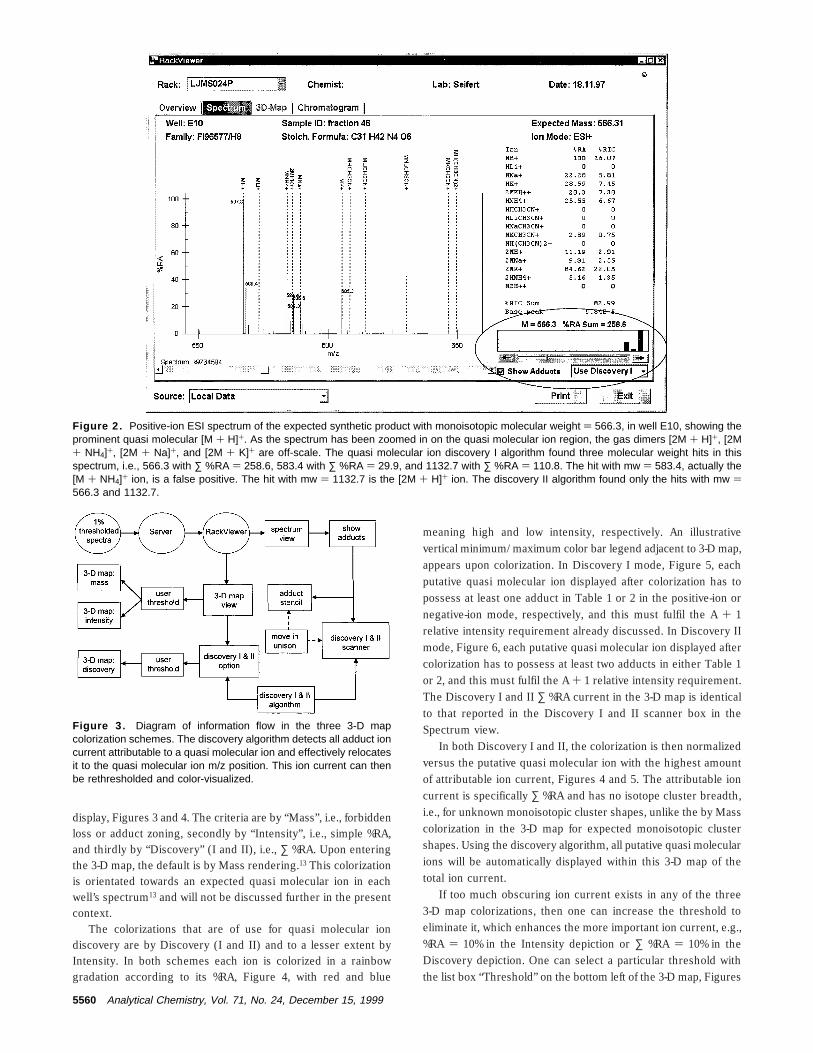
Figure 3. Diagram of information flow in the three 3-D mapcolorization schemes. The discovery algorithm detects all adduct ioncurrent attributable to a quasi molecular ion and effectively relocatesit to the quasi molecular ion m/z position. This ion current can thenbe rethresholded and color-visualized.
5560 Analytical Chemistry, Vol. 71, No. 24, December 15, 1999
3 and 4. On first switching to the 3-D map, the threshold isdefaulted to “dynamic” which rations displayable graphic points,well-by-well, rather than allowing noisy samples with many m/zvalues to grab a disproportionate share.
3. CONCLUSIONSThe high-throughput and quick turnaround FIA-MS, designed
to analyze the output from the Novartis corporate multiple parallelcombinatorial chemistry program, generates yearly tens of thou-
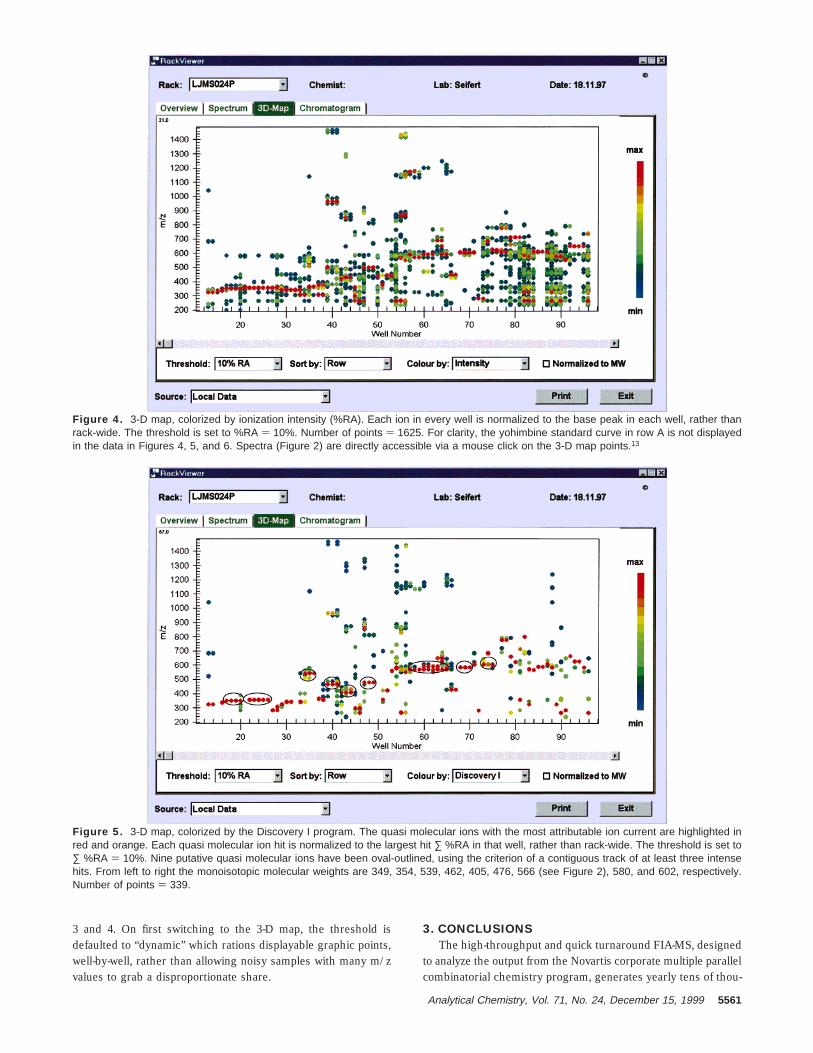
Figure 4. 3-D map, colorized by ionization intensity (%RA). Each ion in every well is normalized to the base peak in each well, rather thanrack-wide. The threshold is set to %RA ) 10%. Number of points ) 1625. For clarity, the yohimbine standard curve in row A is not displayedin the data in Figures 4, 5, and 6. Spectra (Figure 2) are directly accessible via a mouse click on the 3-D map points.13
Figure 5. 3-D map, colorized by the Discovery I program. The quasi molecular ions with the most attributable ion current are highlighted inred and orange. Each quasi molecular ion hit is normalized to the largest hit ∑ %RA in that well, rather than rack-wide. The threshold is set to∑ %RA ) 10%. Nine putative quasi molecular ions have been oval-outlined, using the criterion of a contiguous track of at least three intensehits. From left to right the monoisotopic molecular weights are 349, 354, 539, 462, 405, 476, 566 (see Figure 2), 580, and 602, respectively.Number of points ) 339.
Analytical Chemistry, Vol. 71, No. 24, December 15, 1999 5561
sands of adduct-rich electrospray spectra. The choice of electro-spray ionization was of critical significance and produces spectrathat are well conditioned for automated estimates of spectralpurities with reference to expected stoichiometric formulae. Thissoft ionization approach complicates any manual interpretation bythe synthetic chemists, who are generally unfamiliar with thediversity of electrospray adduction patterns. However, this richadduction proves to be optimal for automated molecular weightdiscovery as it allows searching for simultaneous adduct massdifferences and then using these as pointers to putative quasimolecular ions. This is essentially a simple idea that has beenlatent since adducted quasi molecular ions, e.g., in methanepositive on CI, first appeared in the mid 1960s. Its implementationrequired the availability of two 1990s technologies: a languagefor rapid development of visual interfaces, e.g., Visual Basic, anda robust and soft ionization technique that is compatible with liquidintroduction, e.g., electrospray. The last deciding factor was thedemand for highlighting tools to analyze industrial-scale FIA-MS
data, whether from combinatorial syntheses, LC fractions, ornatural products. The coincidence of these three factors enabledthe development of a quasi molecular ion discovery software, bothin a spectrum scanner view and in a 3-D map of the MS ioncurrent. These quasi molecular ion discovery tools are built intothe reporting system for our high-throughput FIA-MS, allowingtheir use by the Novartis synthetic chemists at their work benches.
ACKNOWLEDGMENT
Thanks go to Dr. Jan-Marcus Seifert, Department of Immunol-ogy, Novartis Research Institute GmbH, A-1235 Vienna, forproviding the semi-preparative LC fractions for illustrating thequasi molecular ion discovery tools.
Received April 19, 1999. Accepted August 31, 1999.
AC9904011
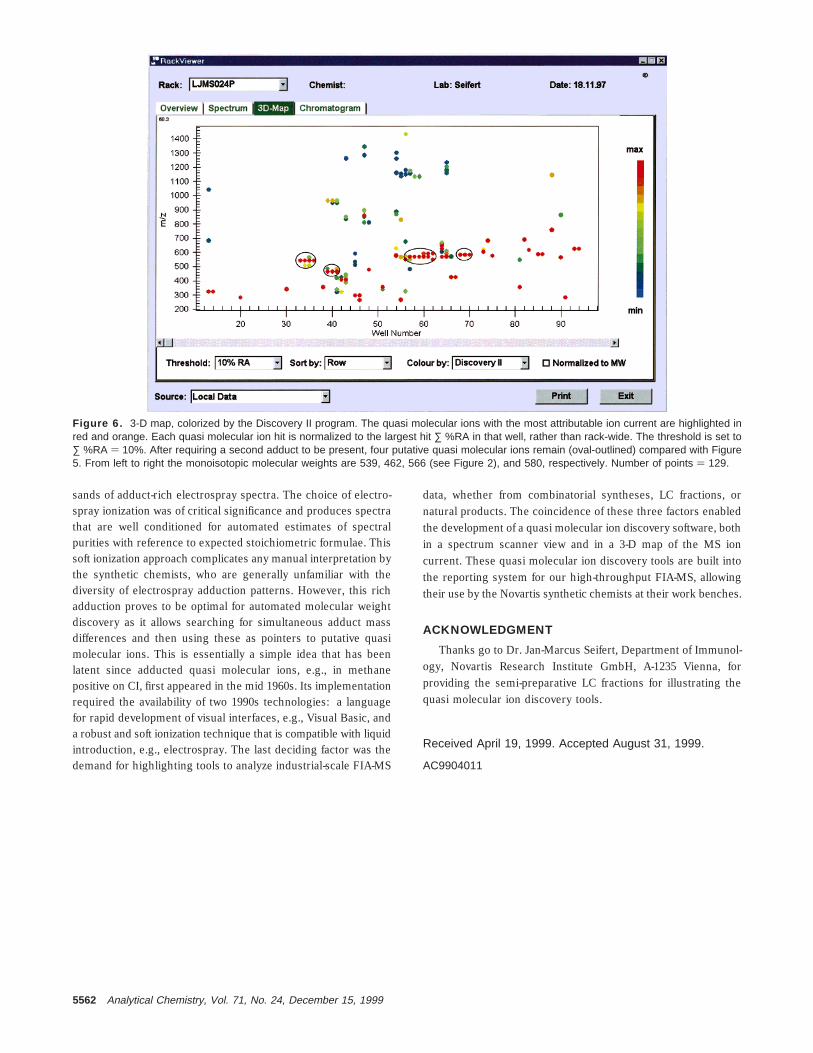
Figure 6. 3-D map, colorized by the Discovery II program. The quasi molecular ions with the most attributable ion current are highlighted inred and orange. Each quasi molecular ion hit is normalized to the largest hit ∑ %RA in that well, rather than rack-wide. The threshold is set to∑ %RA ) 10%. After requiring a second adduct to be present, four putative quasi molecular ions remain (oval-outlined) compared with Figure5. From left to right the monoisotopic molecular weights are 539, 462, 566 (see Figure 2), and 580, respectively. Number of points ) 129.
5562 Analytical Chemistry, Vol. 71, No. 24, December 15, 1999