discrete mathematics data, graph theoryfaculty.bemidjistate.edu/grichgels/projects/2016 projects...
TRANSCRIPT
Discrete Mathematics
Data, Graph Theory
2nd Grade
Kelli Jensen, Central Elementary, [email protected] Leighann Mensen, Central Elementary, [email protected]
Meghan Klein, Blackduck Elementary, [email protected]
Executive Summary This unit is designed to build problem solving skills.Through games and activities students will practice different strategies to guide them to solving higher level thinking problems. In unit one students will specifically practice creating patterns, what’s my rule input and output, Venn Diagrams, tally charts, pictographs, surveys, and plurality voting. In unit two students will use geoboards, learn about circuits, and combinations.These units align with the Minnesota K12 Academic Standards under Number and Operation and Geometry and Measurement in second grade.
Unit 1: 2.2.1.1 Identify, create and describe simple number patterns involving repeated addition or subtraction, skip counting and arrays of objects such as counters or tiles. Use patterns to solve problems in various contexts. 2.3.1.1 Describe, compare, and classify two and threedimensional figures according to number and shape of faces, and the number of sides, edges and vertices (corners). 2.3.1.2 Identify and name basic two and threedimensional shapes, such as squares, circles, triangles, rectangles, trapezoids, hexagons, cubes, rectangular prisms, cones, cylinders and spheres.
2.1.2.5 Solve realworld and mathematical addition and subtraction problems involving whole numbers with up to 2 digits. 2.1.2.6 Use addition and subtraction to create and obtain information from tables, bar graphs and tally charts.
Unit 2: 2.1.2.5 Solve realworld and mathematical addition and subtraction problems involving whole numbers with up to 2 digits.
2.2.1.1 Identify, create and describe simple number patterns involving repeated addition or subtraction, skip counting and arrays of objects such as counters or tiles. Use patterns to solve problems in various contexts. 2.3.1.1 Describe, compare, and classify two and threedimensional figures according to number and shape of faces, and the number of sides, edges and vertices (corners).
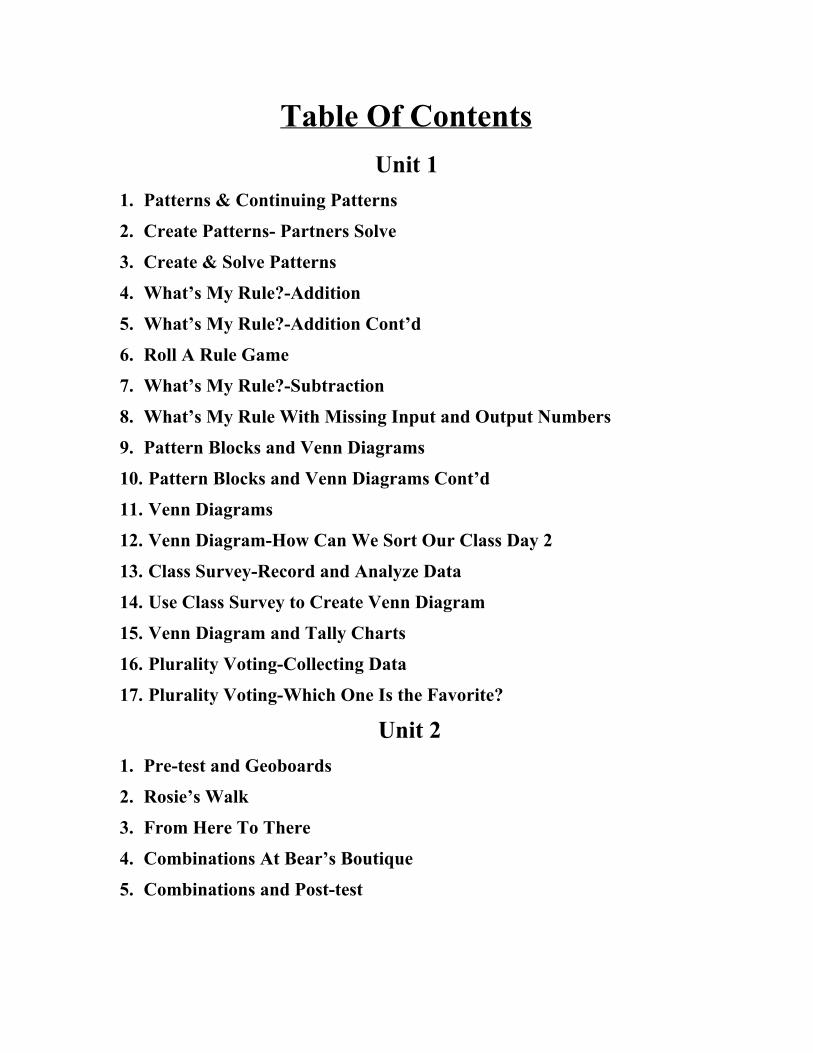
Table Of Contents Unit 1
1. Patterns & Continuing Patterns
2. Create Patterns Partners Solve
3. Create & Solve Patterns
4. What’s My Rule?Addition
5. What’s My Rule?Addition Cont’d
6. Roll A Rule Game
7. What’s My Rule?Subtraction
8. What’s My Rule With Missing Input and Output Numbers
9. Pattern Blocks and Venn Diagrams
10. Pattern Blocks and Venn Diagrams Cont’d
11. Venn Diagrams
12. Venn DiagramHow Can We Sort Our Class Day 2
13. Class SurveyRecord and Analyze Data
14. Use Class Survey to Create Venn Diagram
15. Venn Diagram and Tally Charts
16. Plurality VotingCollecting Data
17. Plurality VotingWhich One Is the Favorite?
Unit 2 1. Pretest and Geoboards
2. Rosie’s Walk
3. From Here To There
4. Combinations At Bear’s Boutique
5. Combinations and Posttest
Day One: Patterns & Continuing Patterns Standard: Recognize, create, describe, and use patterns and rules to solve real world and
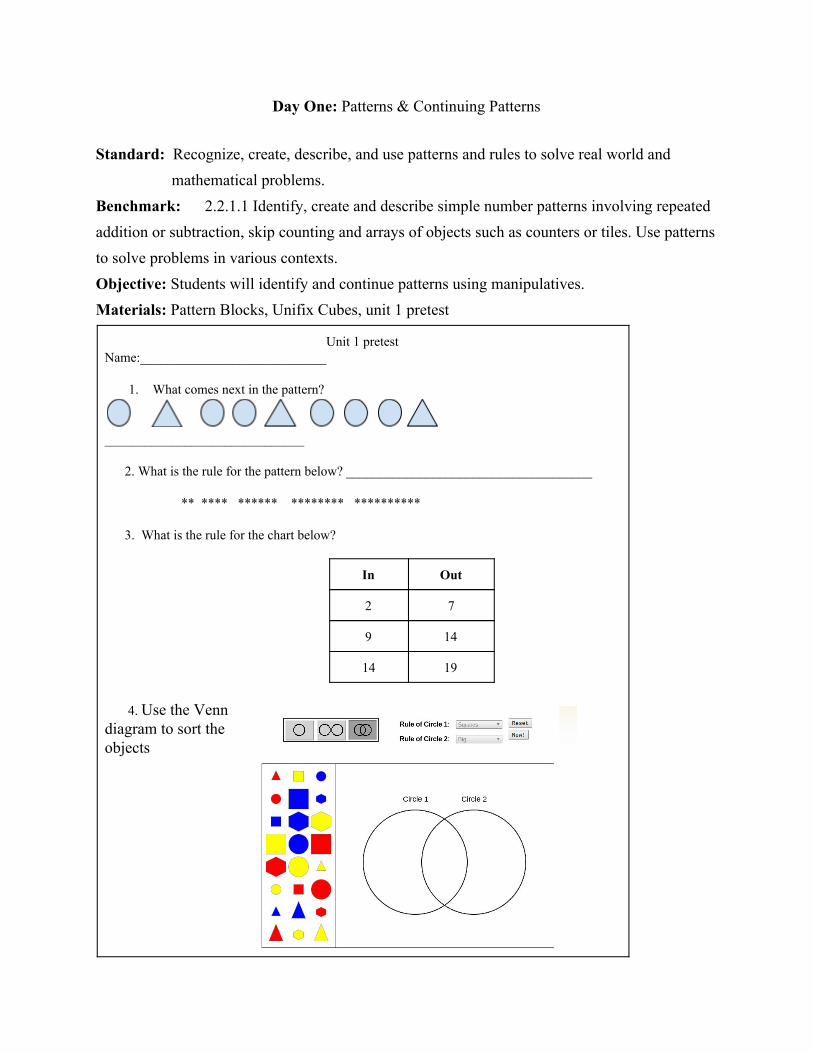
mathematical problems. Benchmark: 2.2.1.1 Identify, create and describe simple number patterns involving repeated addition or subtraction, skip counting and arrays of objects such as counters or tiles. Use patterns to solve problems in various contexts. Objective: Students will identify and continue patterns using manipulatives. Materials: Pattern Blocks, Unifix Cubes, unit 1 pretest
Unit 1 pretest Name:____________________________
1. What comes next in the pattern?
______________________________ 2. What is the rule for the pattern below? _____________________________________ ** **** ****** ******** ********** 3. What is the rule for the chart below?
In Out
2 7
9 14
14 19
4. Use the Venn diagram to sort the objects
Procedure:
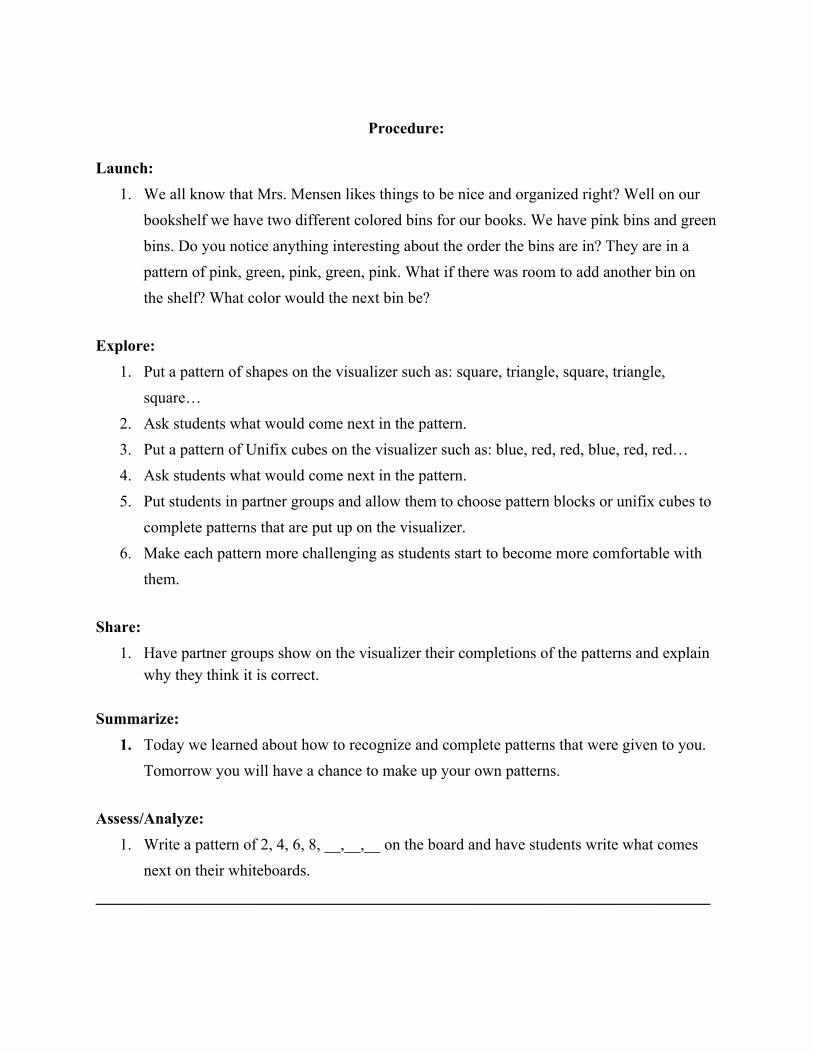
Launch: 1. We all know that Mrs. Mensen likes things to be nice and organized right? Well on our
bookshelf we have two different colored bins for our books. We have pink bins and green bins. Do you notice anything interesting about the order the bins are in? They are in a pattern of pink, green, pink, green, pink. What if there was room to add another bin on the shelf? What color would the next bin be?
Explore:
1. Put a pattern of shapes on the visualizer such as: square, triangle, square, triangle, square…
2. Ask students what would come next in the pattern. 3. Put a pattern of Unifix cubes on the visualizer such as: blue, red, red, blue, red, red… 4. Ask students what would come next in the pattern. 5. Put students in partner groups and allow them to choose pattern blocks or unifix cubes to
complete patterns that are put up on the visualizer. 6. Make each pattern more challenging as students start to become more comfortable with
them. Share:
1. Have partner groups show on the visualizer their completions of the patterns and explain why they think it is correct.
Summarize:
1. Today we learned about how to recognize and complete patterns that were given to you. Tomorrow you will have a chance to make up your own patterns.
Assess/Analyze:
1. Write a pattern of 2, 4, 6, 8, __,__,__ on the board and have students write what comes next on their whiteboards.
_____________________________________________________________________________
Day Two: Create Patterns
Standard: Recognize, create, describe, and use patterns and rules to solve real world and mathematical problems.
Benchmark:
2.2.1.1 Identify, create and describe simple number patterns involving repeated addition or subtraction, skip counting and arrays of objects such as counters or tiles. Use patterns to solve problems in various contexts.
Objective: Students will create patterns using pattern blocks and unifix cubes. Materials: Pattern Blocks, Unifix Cubes
Procedure:
Launch: 1. Yesterday we were talking about how I like to keep things nice and organized and the
bookshelves have bins that are in patterns. We also looked at some patterns and figured out how to complete them. Today you will get to create your own patterns and then have a partner complete the pattern.
Explore:
1. Have students partner up and choose either pattern blocks or unifix cubes to work with. 2. Students will start a pattern and have their partner complete it, explaining what the
pattern was and how they knew what shoud come next. 3. Then partners switch and other partner comes up with the pattern. 4. Have students keep creating and completing patterns for a set amount of time.
Share:
1. Ask students to share some of their more challenging patterns on the visualizer and see if the teacher can complete the pattern.
Summarize:
1. Today we got to create our own patterns using different rules that others could figure out to complete the pattern. Tomorrow we will work with some rules in a different way to find some more patterns.
Assess/Analyze:
1. Give students a pattern of a mixture of pattern blocks and unifix cubes such as: square, red cube, triangle, hexagon, blue cube, square, red cube, triangle...Have students write or draw on an exit ticket what would come next in the pattern.
______________________________________________________________________________
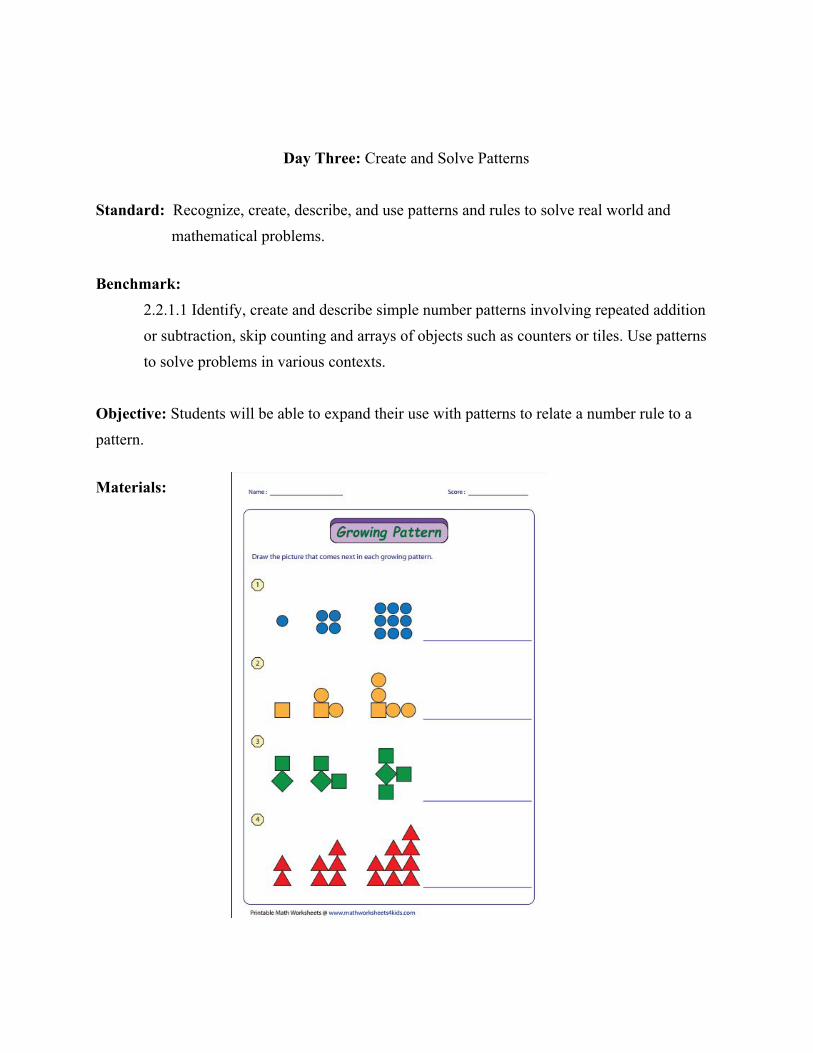
Day Three: Create and Solve Patterns
Standard: Recognize, create, describe, and use patterns and rules to solve real world and mathematical problems.
Benchmark:
2.2.1.1 Identify, create and describe simple number patterns involving repeated addition or subtraction, skip counting and arrays of objects such as counters or tiles. Use patterns to solve problems in various contexts.
Objective: Students will be able to expand their use with patterns to relate a number rule to a pattern. Materials:
Procedure:
Launch: 1. Refer back to Mrs. Mensen liking to keep things organized and patterns in the classroom.
Explore:
1. Students will connect numbers to patterns made with objects. 2. Students will then look at the number patterns to predict what the rule is and what will
come next in the pattern.
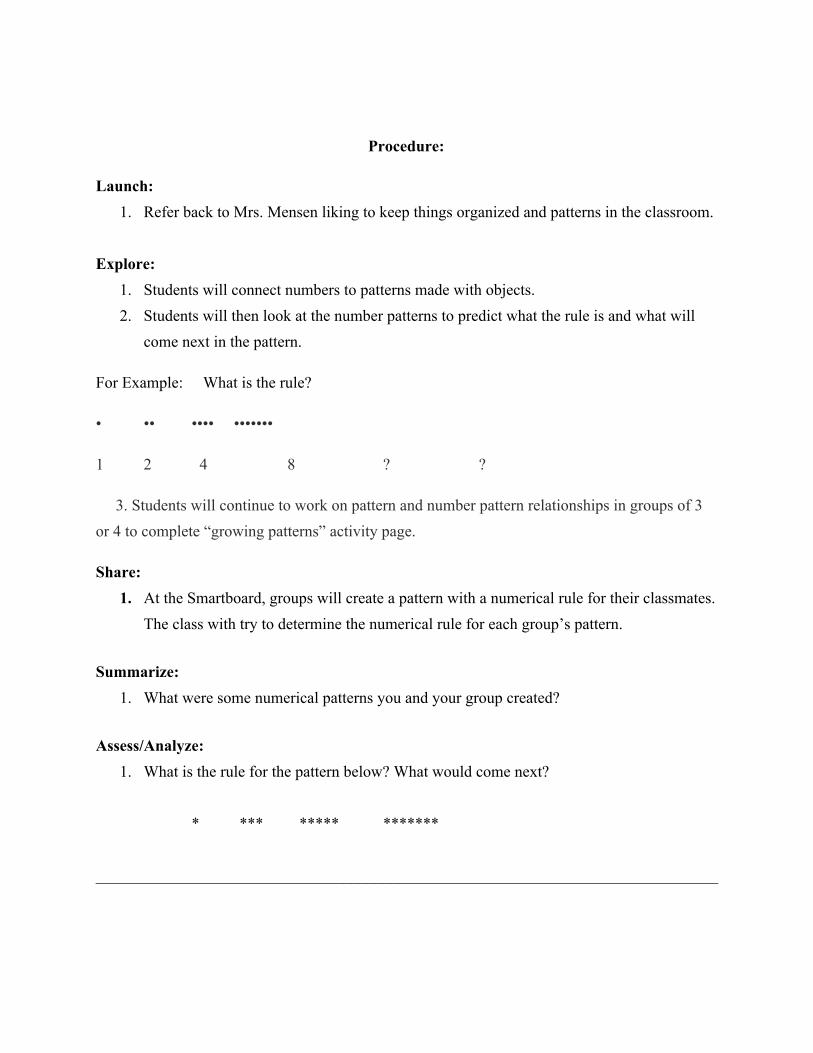
For Example: What is the rule?
• •• •••• •••••••
1 2 4 8 ? ?
3. Students will continue to work on pattern and number pattern relationships in groups of 3 or 4 to complete “growing patterns” activity page.
Share: 1. At the Smartboard, groups will create a pattern with a numerical rule for their classmates.
The class with try to determine the numerical rule for each group’s pattern. Summarize:
1. What were some numerical patterns you and your group created? Assess/Analyze:
1. What is the rule for the pattern below? What would come next? * *** ***** *******
______________________________________________________________________________
Day Four: What’s My Rule? Addition Standard: Recognize, create, describe, and use patterns and rules to solve real world and mathematical problems. Benchmark:
2.2.1.1 Identify, create and describe simple number patterns involving repeated addition or subtraction, skip counting and arrays of objects such as counters or tiles. Use patterns to solve problems in various contexts.
Objective: Materials: Magic Pot Workmat

Procedure:
Launch: 1. Begin today’s lesson by reading Two of Everything by Lily Toy Hong. Tell students in
this story there is a magic pot. If you put something in the pot you might magically get more of that object. As you read see if your students can discover a pattern.
Explore:
1. Discuss with students that there are many patterns when using math. Sometimes we might know the patterns, while other times we need to figure out the pattern.
2. Introduce input and output tables using the Magic Pot Workmat. Tell students that these tables are just like the magic pot. If we put a number in the pot, a new number will come out. Sometimes the number might be bigger or smaller depending on the rule. The
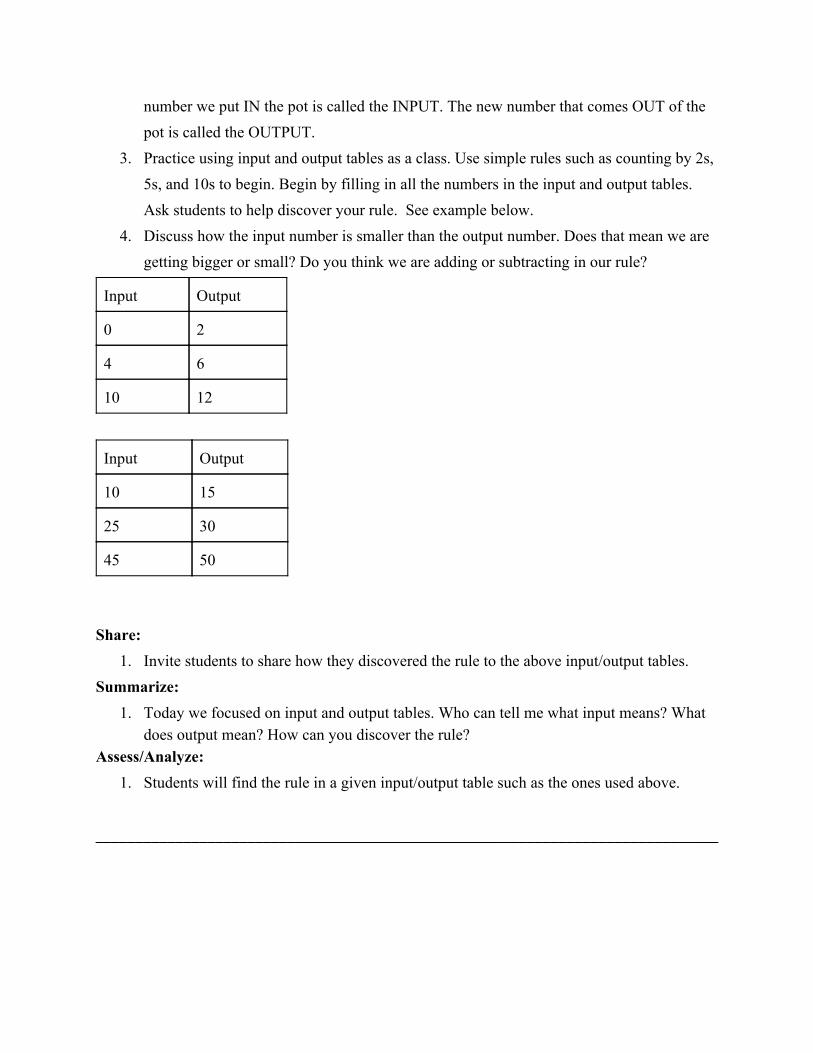
number we put IN the pot is called the INPUT. The new number that comes OUT of the pot is called the OUTPUT.
3. Practice using input and output tables as a class. Use simple rules such as counting by 2s, 5s, and 10s to begin. Begin by filling in all the numbers in the input and output tables. Ask students to help discover your rule. See example below.
4. Discuss how the input number is smaller than the output number. Does that mean we are getting bigger or small? Do you think we are adding or subtracting in our rule?
Input Output
0 2
4 6
10 12
Input Output
10 15
25 30
45 50
Share:
1. Invite students to share how they discovered the rule to the above input/output tables. Summarize:
1. Today we focused on input and output tables. Who can tell me what input means? What does output mean? How can you discover the rule?
Assess/Analyze: 1. Students will find the rule in a given input/output table such as the ones used above.
______________________________________________________________________________
Day Five: What’s My Rule? Addition Continued Standard: Recognize, create, describe, and use patterns and rules to solve real world and mathematical problems. Benchmark: 2.2.1.1 Identify, create and describe simple number patterns involving repeated addition or subtraction, skip counting and arrays of objects such as counters or tiles. Use patterns to solve problems in various contexts. Objective:
1. Students will be able to identify number patterns in an input and output table. Materials: whiteboards
Procedure:
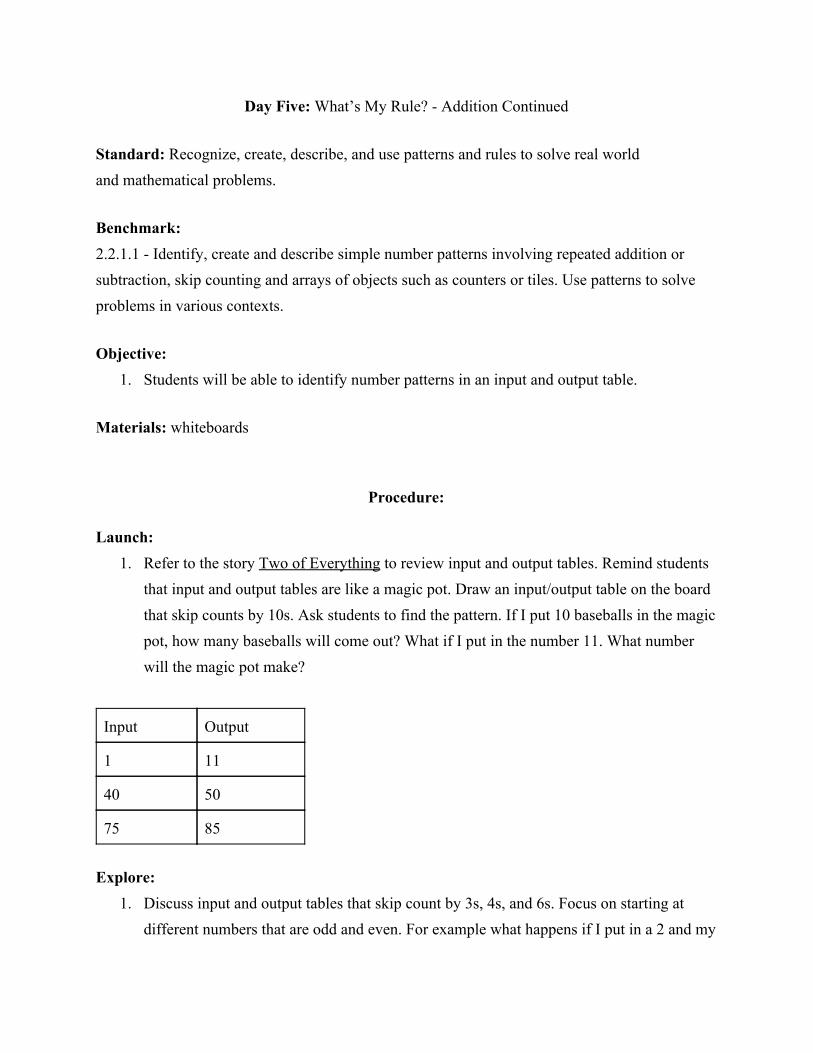
Launch: 1. Refer to the story Two of Everything to review input and output tables. Remind students
that input and output tables are like a magic pot. Draw an input/output table on the board that skip counts by 10s. Ask students to find the pattern. If I put 10 baseballs in the magic pot, how many baseballs will come out? What if I put in the number 11. What number will the magic pot make?
Input Output
1 11
40 50
75 85
Explore:
1. Discuss input and output tables that skip count by 3s, 4s, and 6s. Focus on starting at different numbers that are odd and even. For example what happens if I put in a 2 and my
rule is to add 3. Do you think my rule is adding or subtracting? What number will the magic pot make?
2. Make various input/output tables that start at even and odd numbers on the whiteboard. Have students work in pairs to discover the missing rule by identifying the pattern. Make input and output tables simple or complex depending on the level or your students.
Share:
1. Invite students to volunteer and share the rules they discovered when solving various input and output tables.
Summarize:
1. Today we practiced identifying rules in input and output tables. We learned that if our rule is add 2 we discovered that the input number might not always be a number we say when skip counting by 2s.
Assess/Analyze: 1. Students will create an input and output table. Student will determine which numbers to
put in the magic pot, apply the rule, and find the output numbers. ______________________________________________________________________________

Day Six: Roll A Rule Game Standard: Recognize, create, describe, and use patterns and rules to solve real world and mathematical problems. Benchmark: 2.2.1.1 Identify, create and describe simple number patterns involving repeated addition or subtraction, skip counting and arrays of objects such as counters or tiles. Use patterns to solve problems in various contexts. Objective:
1. Students will be able to identify number patterns in an input and output table. Materials: Roll A Rule recording sheet and dice

Procedure:
Launch: 1. Refer back to the Magic Pot Story.
Explore:
1. Introduce Roll A Rule Game. Students will work independently for this activity. Students will start by rolling a dice. The first number they roll will be their rule. Students should write this number in box labeled rule. Then students will roll the dice again to determine the starting number. Students will practice applying the rule to continue the pattern.
Share:
1. Students will discuss and share some of the patterns they made on the whiteboard. Were there some patterns that were harder than others? How many of you are feeling confident when finding the missing rule with addition? Do you think you could play this game with a 9 sided dice?
Summarize: 1. Discuss how we can use dice to create different rules and patterns. What do you think
would happen if we changed our rule from adding to subtracting? We will discuss more about subtracting with input and output rules tomorrow.
Assess/Analyze: 1. Students will continue the pattern of a partner's input and output table.
______________________________________________________________________________
Day Seven: What’s My Rule? Subtraction Standard: Recognize, create, describe, and use patterns and rules to solve real world and mathematical problems. Benchmark: 2.2.1.1 Identify, create and describe simple number patterns involving repeated addition or subtraction, skip counting and arrays of objects such as counters or tiles. Use patterns to solve problems in various contexts. Objective: Students will be able to identify number patterns in an input and output table. Materials: dice and whiteboards
Procedure:
Launch: 1. Remind students about the Roll A Rule game they played yesterday. Invite two students
to the front of the classroom. The first student will roll the dice to determine the rule. The second student will roll the dice to find the starting number. Students will continue the pattern on their whiteboard.
Explore: 1. Discuss how we have been focusing on number patterns that get bigger. Do you think
there is number patterns that get smaller? What happens if I put 8 shoes in the magic pot and it only gives me 4 back. Can you determine the pattern?
2. Put an example of an input and output table that uses subtraction. Ask students to share their observations. Discuss how the input numbers are big and the output numbers get smaller.
3. Write multiple input and output tables on the whiteboard that have rules with subtraction. Have students work in pairs to solve input and output tables.
Share: 1. Invite students to share the missing rules they discovered for the input and output tables
Summarize:
1. Today we focused our learning on number patterns that get smaller. How can I determine if my rule is using subtraction?
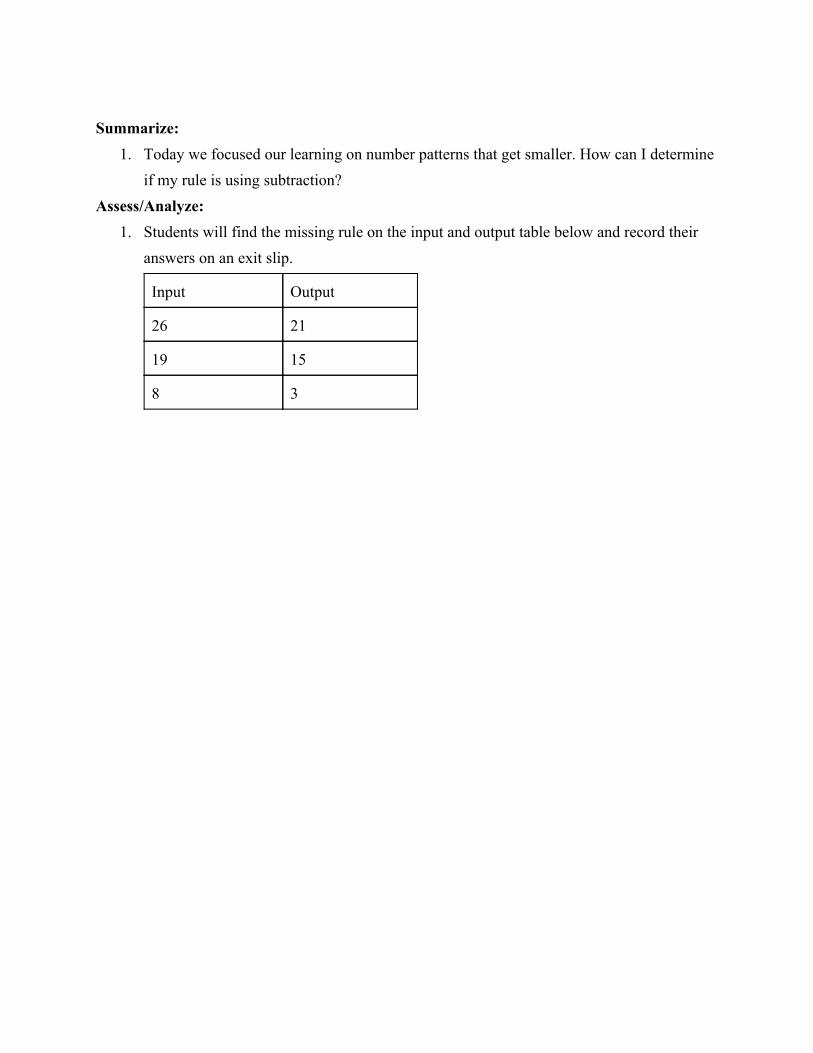
Assess/Analyze: 1. Students will find the missing rule on the input and output table below and record their
answers on an exit slip.
Input Output
26 21
19 15
8 3
Day Eight: What’s My Rule with Missing Input and Output Numbers
Standard: Recognize, create, describe, and use patterns and rules to solve real world and mathematical problems. Benchmark: 2.2.1.1 Identify, create and describe simple number patterns involving repeated addition or subtraction, skip counting and arrays of objects such as counters or tiles. Use patterns to solve problems in various contexts. Objective:
1. Students will be able to identify number patterns in an input and output table. Materials:
Procedure:
Launch: 1. This weekend I was putting a puzzle together with my grandma. The puzzle had 300
pieces so it was hard to keep track of them all. As we were putting the puzzle together we were just about done and we noticed that we were missing a few pieces. Have you ever lost something that you needed to complete a project? Sometimes this happens when we are doing math. Today we are going to look at input and output tables with missing input and output numbers.
Explore: 1. Write an input and output table on the board with missing numbers. 2. Discuss how to find a missing output. If the input numbers are given how could you find
the output? In the table below there is only one output number. We must find the rule before we can continue on the pattern.
3. Think 6+___=15. Once you determine the rule then you can continue the pattern to fill in the output numbers.
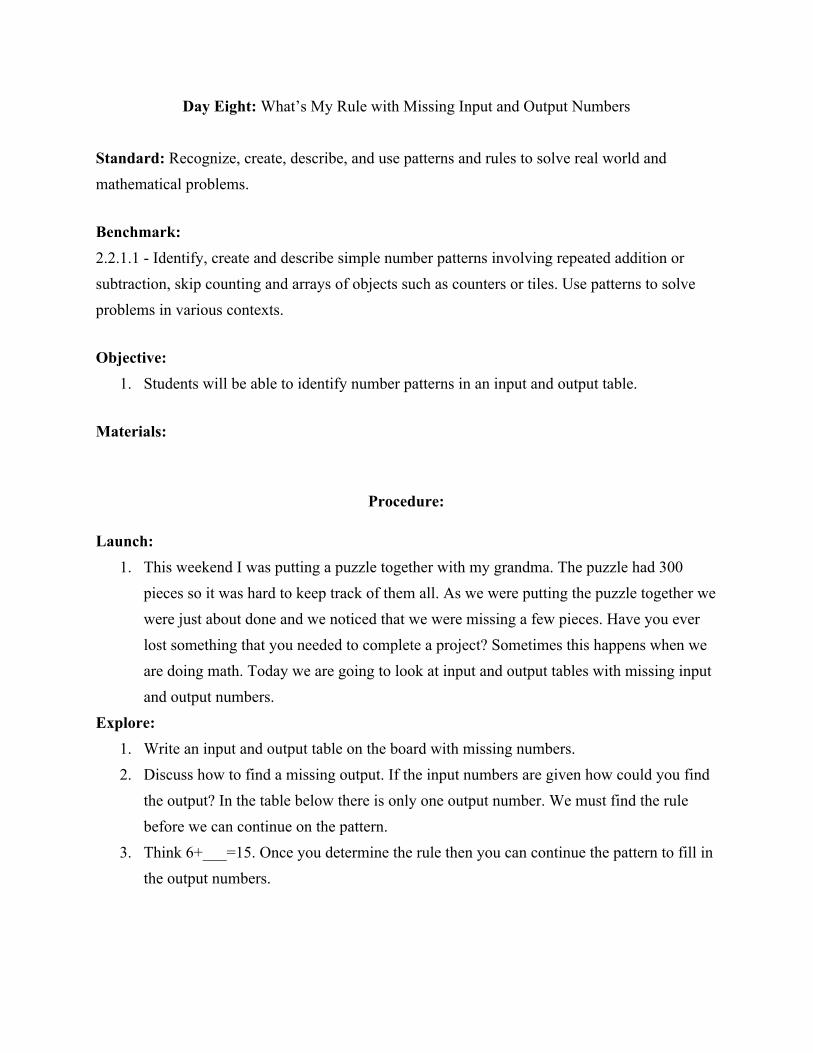
Input Output
6 15
11
34
4. Discuss how to find a missing input. When the output numbers are given and you are
missing the input numbers, you must do the opposite of the rule. In the table below I can find my rule by thinking 5 + ___=9. I know that 5+4=9 so my rule is +4 since my number gets bigger. If I put a 5 in the magic pot the next number that comes out would be a 9. However since I am missing my input numbers I can’t add 4 to 26 because that would give me 30. 30 + 4 does not equal 26. Therefore I must do the opposite of my rule to get my input. So 26 4 = 22.
Input Output
5 9
26
43
5. Write examples on the board for students to practice solving with partners. Share:
1. Students will share strategies how they found the missing input and output numbers. Summarize:
1. Today we discussed how sometimes input and output tables are missing numbers. How do I find the missing input numbers? How do I find the missing output numbers?
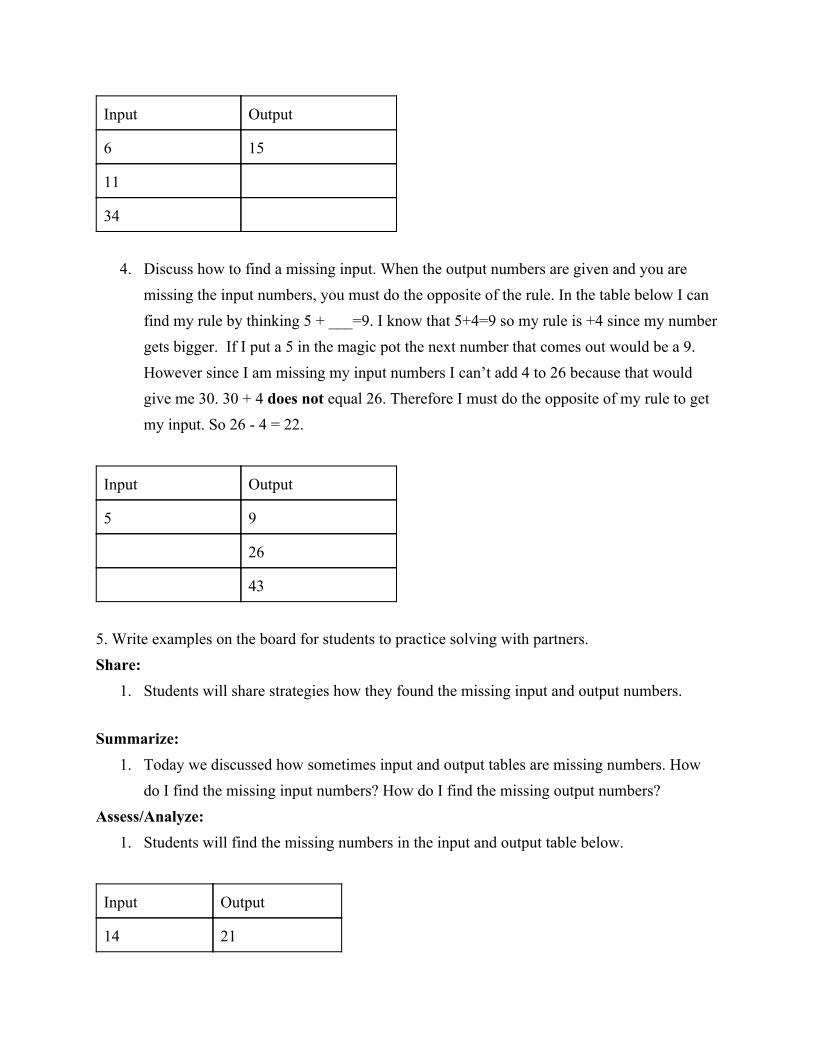
Assess/Analyze: 1. Students will find the missing numbers in the input and output table below.
Input Output
14 21

34
45
______________________________________________________________________________
Day Nine: Pattern blocks & Venn diagrams
Standard: Identify, describe, and compare basic shapes according to their geometric attributes. Benchmark:
2.3.1.2 Identify and name basic two and threedimensional shapes, such as squares, circles, triangles, rectangles, trapezoids, hexagons, cubes, rectangular prisms, cones, cylinders and spheres.
Objective: Students will sort pattern blocks according to their geometric attributes.
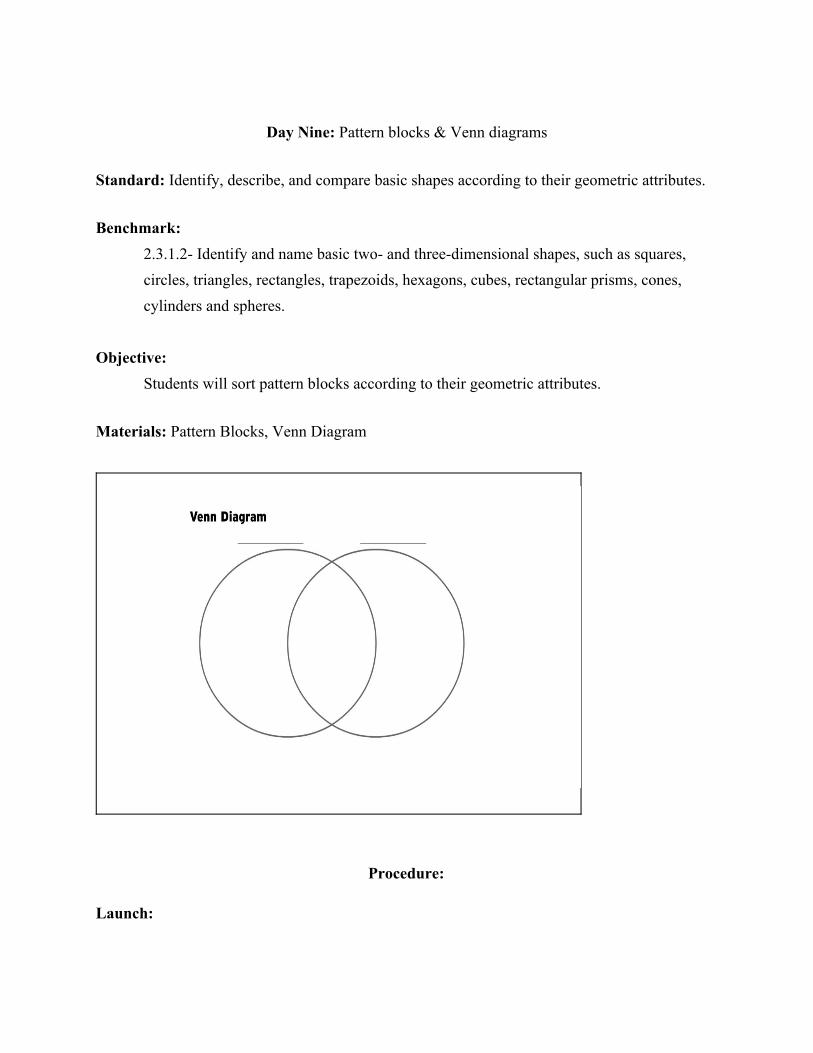
Materials: Pattern Blocks, Venn Diagram
Procedure:
Launch:
1. Tell students pizza story: “In our house, my husband is the only person who likes to eat hot dog pizza (a cheese pizza with cutup hot dogs on it) so I bake two at a time: one for him and a pepperoni pizza for the children and me.” (On the Smartboard show two separate circles to represent the two pizzas.)
2. “One evening, I was taking both pizzas out of the oven and I accidentally dropped his pizza on the edge of our pizza.” (Move a portion of the hotdog pizza circle over a section of the pepperoni pizza circle)
3. Ask Students: “If this circle represents the pepperoni pizza, and this circle represents the hot dog pizza, what kind of pizza do I have in the middle?”
Explore:
1. Show a blank Venn Diagram on the visualizer and ask if students know what it is. Explain how a Venn Diagram is used to sort things and that one circle will be for triangles and one will be for blue shapes. Also discuss how the middle where the circles come together is for items that could belong in either circle. Discuss how outside the two circles is for items that don’t fit in either circle.
2. Give students pattern blocks and have them try, in groups, to figure out where all of the shapes would go.
3. Discuss where the shapes belong and show on the visualizer. 4. Give another example and have students work in their groups to figure out what shapes
go where. Share:
1. Ask student groups to share how they decided where to put the shapes in their Venn Diagrams with the rest of the class.
Summarize:
1. Today we worked with sorting pattern blocks into groups that I gave you. Tomorrow you will get to choose how you want to sort the blocks in your groups.
Assess/Analyze:
1. Give students an example of how to sort the pattern blocks such as: circles and yellow. Have them draw a Venn Diagram and put the blocks where they belong on their own.
______________________________________________________________________________
Day Ten: Pattern blocks & Venn diagram Standard: Identify, describe, and compare basic shapes according to their geometric attributes. Benchmark:
2.3.1.1 Describe, compare, and classify two and threedimensional figures according to number and shape of faces, and the number of sides, edges and vertices (corners).
Objective: Students will create Venn Diagrams sorting pattern blocks according to their geometric attributes.
Materials:Pattern Blocks
Procedure:
Launch: 1. Refer back yesterday’s launch and the hot dog pizza. Today we are going to look at more
ways to compare and contrast different items. Explore:
1. Give student groups pattern blocks and have them decide how they are going to sort them into their Venn Diagram.
2. Explain that they can sort the shapes any way they would like to. They have to make sure that all of the shapes are included in the Venn Diagram.
3. Have groups discuss among themselves why the shapes go where they have them on their diagram.
Share:
1. Ask groups to show on the visualizer how they sorted their shapes and how they knew where to put each shape.
Summarize:
1. Venn Diagrams are very helpful for sorting things. How did we sort our shapes today? How did we know which section of the Venn Diagram to put them? Tomorrow we will use Venn Diagrams to sort other things.
Assess/Analyze: 1. Have students draw a Venn Diagram on their whiteboards and show where shapes would
go if you were sorting all of the shapes that are yellow or blue. ______________________________________________________________________________
Day Eleven: Venn diagrams
Standard: Demonstrate mastery of addition and subtraction basic facts; add and subtract one and twodigit numbers in realworld and mathematical problems. Benchmark: 2.1.2.5 Solve realworld and mathematical addition and subtraction problems involving whole numbers with up to 2 digits. Objective: Students will use Venn diagrams to sort the class. They will use the Venn diagrams to solve 1 and 2 digit equations. Materials: Tape, Smartboard
Procedure:
Launch: 1. Refer back to the hot dog pizza launch. What would we do with things that are on neither
pizza like mushrooms or sausage? Where would those objects go on our Venn diagram? Explore:
1. With tape make two large circles on the floor to create a Venn Diagram. 2. Review the parts of a Venn diagram and what each part means. 3. Students will stand to the side of the Venn Diagram. As the teacher labels regions for the
circles on the Smartboard students will move to the appropriate circle, middle, or outside. 4. Sample attributes to sort by:
Brown hair vs. blonde hair Glasses vs. no glasses Boys vs. girls Plays a sport vs. doesn’t play a sport Siblings vs. no siblings Favorite activity playing outside vs. watching TV
5. For each sorting on the Venn diagram students will write equations to answer questions such as:
How many people have neither brown or blonde hair?
How many people like playing outside AND watching TV How many people have brown or blonde hair
Share:
1. Ask students to share some of the attributes that we had people in the middle for things that people fit into both circles. What were some attributes that we had people outside the circles for things that some people didn’t fit into either category?
Summarize:
1. What did you learn about your classmates using Venn diagrams? Why might it be useful to use a Venn diagram rather than listing all your information out.
Assess/Analyze:
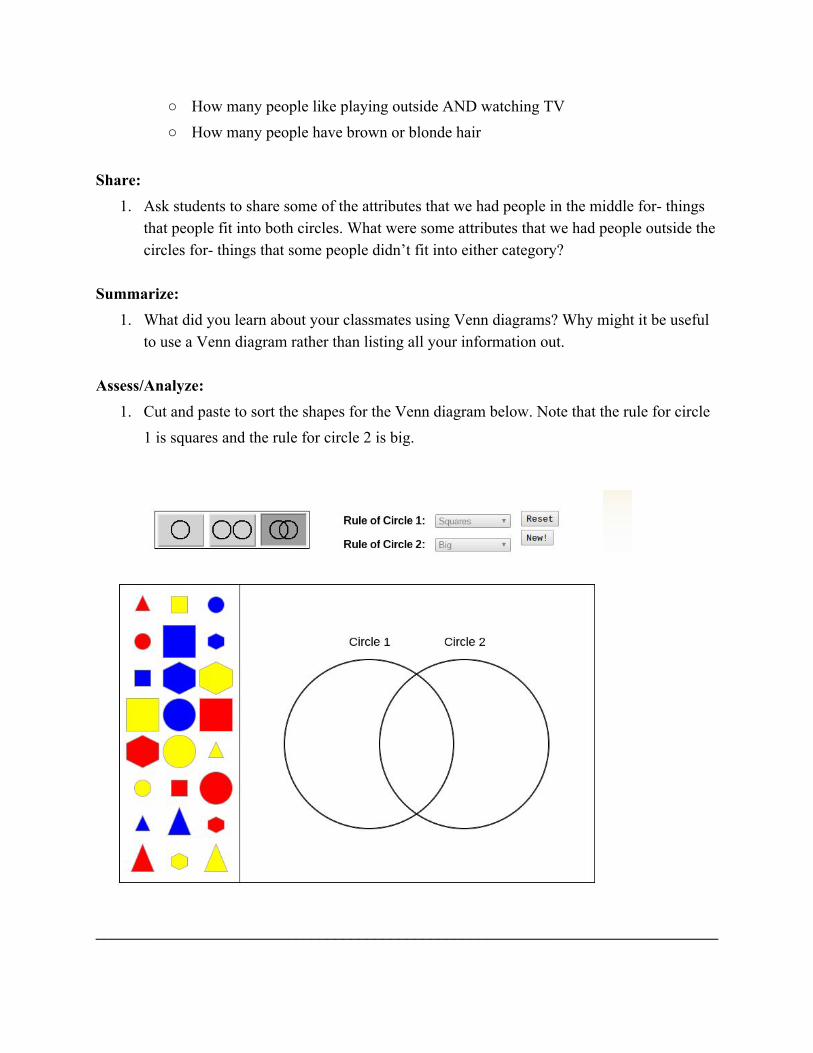
1. Cut and paste to sort the shapes for the Venn diagram below. Note that the rule for circle 1 is squares and the rule for circle 2 is big.
______________________________________________________________________________
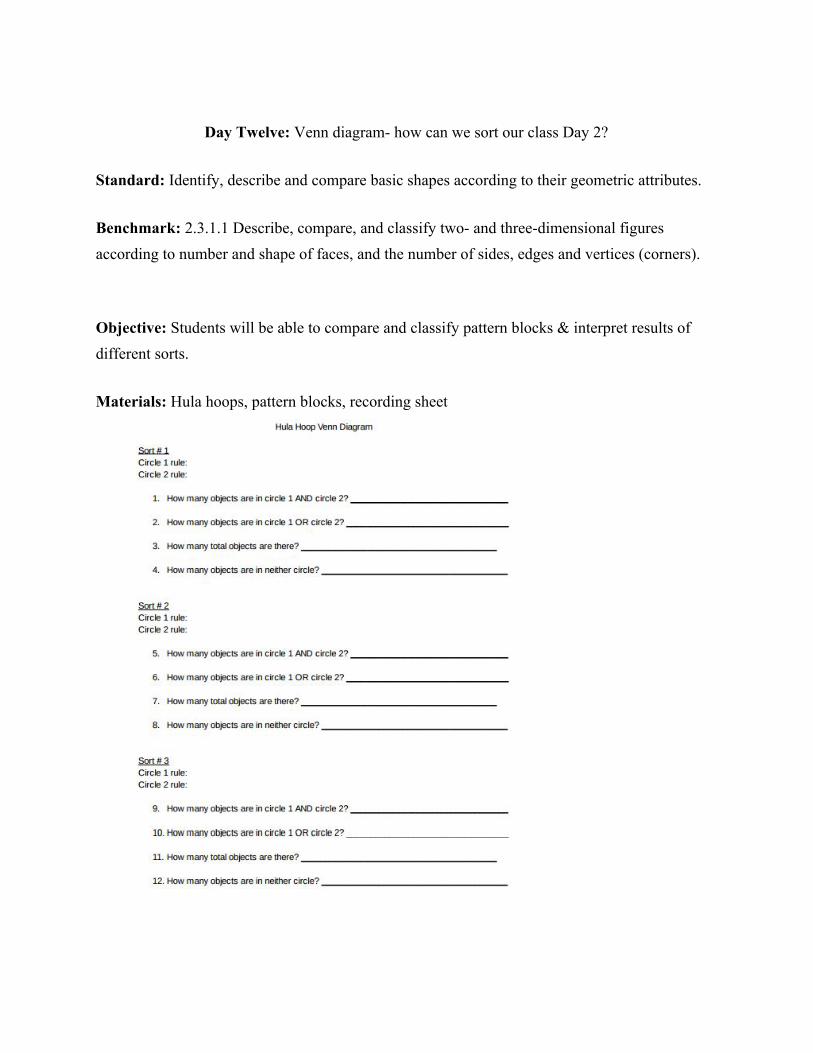
Day Twelve: Venn diagram how can we sort our class Day 2?
Standard: Identify, describe and compare basic shapes according to their geometric attributes. Benchmark: 2.3.1.1 Describe, compare, and classify two and threedimensional figures according to number and shape of faces, and the number of sides, edges and vertices (corners).
Objective: Students will be able to compare and classify pattern blocks & interpret results of different sorts. Materials: Hula hoops, pattern blocks, recording sheet

Procedure:
Launch: 1. How many of you like to play with the hula hoops in gym and at recess? When I was in
elementary I LOVED to hula hoop. Me and my friends would have contests with hula hoops. Who could hula hoop the longest without touching it and who could go the longest with the most hula hoops. One day when we were having a contest one girl had 15 hula hoops around her. She had hula hoops spinning from the top of her shoulders all the way down to her knees. Everyone tried by nobody was able to beat her record. Do you think you could?
2. Today you are going to get into groups of 4. Each group will get 2 hula hoops. 3. Use your hula hoops to make a Venn diagram.
Explore:
1. With your group sort your patterns blocks in your hula hoops by multiple different attributes. For each compare and contrast fill out your recording sheet.
Share:
1. On the whiteboard write 1 way you compared your pattern blocks and your answers for that Venn diagram on your recording sheet.
Summarize:
1. What was one way you compared your objects that gave you objects in the middle? What was one way that gave you objects on the outside of your circles? What does this tell us about our pattern blocks?
______________________________________________________________________________
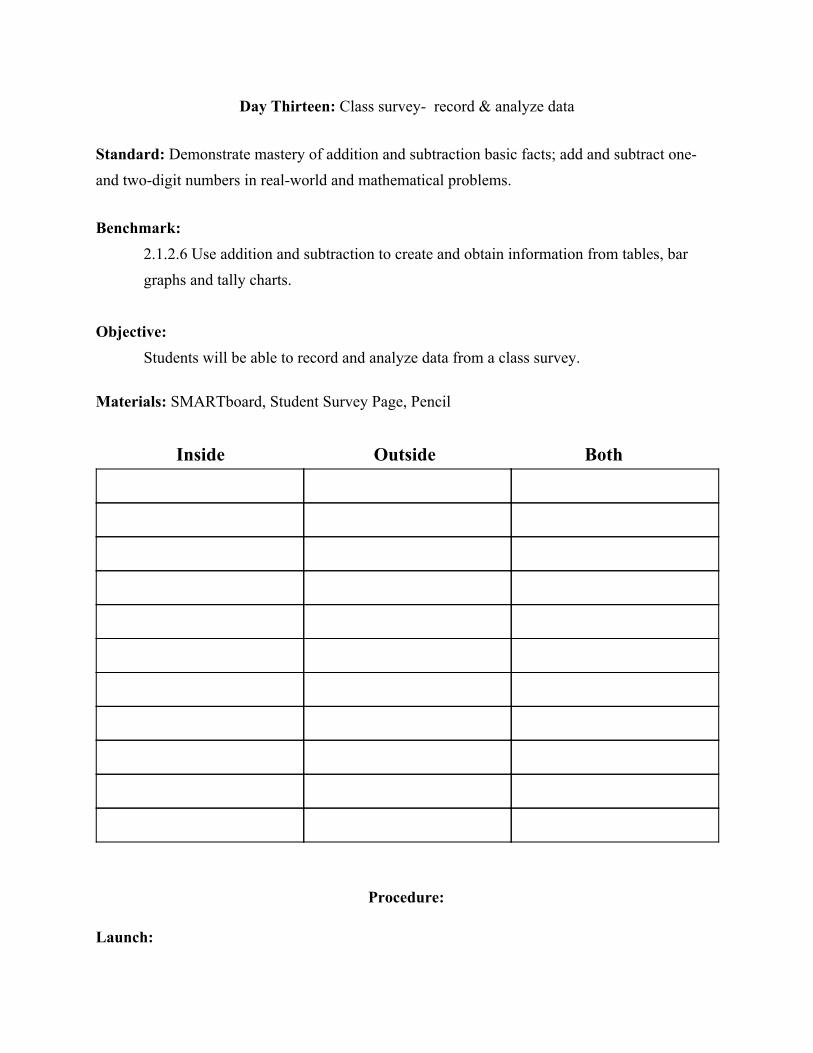
Day Thirteen: Class survey record & analyze data Standard: Demonstrate mastery of addition and subtraction basic facts; add and subtract one and twodigit numbers in realworld and mathematical problems. Benchmark:
2.1.2.6 Use addition and subtraction to create and obtain information from tables, bar graphs and tally charts.
Objective: Students will be able to record and analyze data from a class survey.
Materials: SMARTboard, Student Survey Page, Pencil
Inside Outside Both
Procedure:
Launch:
1. Over the weekend I watched a really great movie called “Zootopia”. I love watching good movies when I have spare time on the weekend. Now I am sure all of you have things that you like to do on the weekend, too. Some of you like to do activities inside and others like to play outside. We are going to find out how many people like to play inside, how many like to play outside, and how many like to do both by taking a class survey today.
Explore:
1. Show survey on the board and explain that students will be asking other students if they like to play inside, outside or both. They must each ask every other student in the class and also mark their choice.
2. On the survey sheet there are three columns for outside, inside, and both. Students will have each other put their initials in a box in the column of their choice.
3. After students have surveyed everyone else in the class, have them get into groups and decide if more students like to play inside, outside, or both.
4. Ask groups how many students like playing outside? How many more students like playing inside than outside? How many students do not like playing inside?
Share:
1. Ask a group to share their answers to the questions above and how they decided on those answers.
Summarize:
1. What did we learn about surveys today? How can we figure out which activity won? Assess/Analyze:
1. Ask students to write on an exit ticket how many students do not like to play outside. ______________________________________________________________________________
Day Fourteen: Use class survey to create venn diagram
Standard:Demonstrate mastery of addition and subtraction basic facts; add and subtract one and twodigit numbers in realworld and mathematical problems. Benchmark:
2.1.2.6 Use addition and subtraction to create and obtain information from tables, bar graphs and tally charts.
Objective: Students will create a Venn Diagram and a Pictograph using data from a class survey.
Materials: Paper, Pencil
Procedure:
Launch: 1. Yesterday we took a class survey of whether we like to play inside, outside, or both.
Today we will use that data to create a Venn Diagram and a Pictograph. Explore:
1. Show a blank Venn Diagram with two circles intersecting on the board. Explain that this is a Venn Diagram and we will use it to represent our data from yesterday.
2. Have students take out their surveys and ask what they think each of the circles should be labeled and what the intersection should be labeled. Label each section on the board.
3. Ask how many students chose outside and write that number in the correct area on the Diagram. Ask how many students chose inside and write that number in the correct area on the diagram. Ask where the number of students that chose both would go. Write that number in the correct area.
4. Explain that this is one way to represent our data and now we will make a pictograph. 5. Put a blank pictograph on the board and show where the labels would go for inside,
outside and both. 6. Explain that pictographs use a picture to represent a certain number of things on the
pictograph. First, we need to decide on a picture (that is fairly simple to draw) and how
many things it will represent. For example, we could use triangles and each triangle represents 2 students.
7. If each triangle represents 2 students, how many triangles do we need to draw for inside? How many for outside? How many for both?
Share:
1. Have groups discuss how they got the answers to the above questions. Ask a group to share their explanation of what to do when there is an odd number of students that voted for a choice.
Summarize:
1. Today we learned about two more ways to represent data. What were they? Which way to represent data has been the most helpful to you so far?
Assess/Analyze:
1. Have students write on their whiteboards how they would represent 25 votes on the pictograph.
______________________________________________________________________________
Day Fifteen: Venn Diagram & Tally Charts Standard:Demonstrate mastery of addition and subtraction basic facts; add and subtract one and twodigit numbers in realworld and mathematical problems. Benchmark:
2.1.2.6 Use addition and subtraction to create and obtain information from tables, bar graphs and tally charts.
Objective:
Students will create a Venn Diagram and Tally Chart using data collected in class. Materials: SMARTboard,Sticky Notes, Marker
Procedure:
Launch: 1. We have a Venn Diagram on the board that looks a little bit different than the one we
made yesterday. What is different about this Venn Diagram? It is labeled differently because this time we are going to see who has brown hair, who wears glasses, and who has brown hair and wears glasses.
Explore:
1. Draw a Venn Diagram on the board and label one side “brown hair” and the other side “wears glasses”.
2. Have students come up to the board and write their name on a sticky note. Then they will stick it on the Venn Diagram where they belong.
3. Once all student names are on the board, ask students to get into groups. 4. Have the groups discuss what they can learn from the Venn Diagram. Ask each group to
come up with a question for another group to answer such as: How many students have brown hair? How many students do not wear glasses? Where do students names go if they don’t have brown hair or wear glasses?
Share:
1. Ask one group at a time to ask the question they came up with. Let them choose a group to answer their question.
2. Give the group that is answering the question time to talk it over and tell the other groups that they should also be working on finding the answer.
3. Make sure every group has a chance to ask and answer one question. Summarize:
1. We have learned a few different ways to collect and represent data in the last couple of days. We have also learned how to analyze the data and find information from it.
Assess/Analyze:
1. Have students draw their own Venn Diagram with each side labeled with two ways to sort something. They can choose whatever they would like as a topic for sorting, but there has to be a way to have at least one in the intersection.
______________________________________________________________________________
Day Sixteen: Plurality VotingCollecting Data Standard: Demonstrate mastery of addition and subtraction basic facts; add and subtract one and twodigit numbers in realworld and mathematical problems. Benchmark:
2.1.2.6 Use addition and subtraction to create and obtain information from tables, bar graphs and tally charts.
Objective:
Students will be able to use addition and subtraction to create information from tally charts.
Materials: Paper and Pencils
Procedure:
Launch: 1. My family loves to watch movies together. We always like to have a snack while we
watch our movie. There is always a big debate about what we should have for a snack. I like to eat oreos, both of my sisters like popcorn, and my brother likes gummy bears. Which snack do you think we eat most often and why? My sisters always win because they get the most votes and we end up eating popcorn. Today you will have the opportunity to vote for the snack that you would choose to eat while watching a movie.
Explore:
1. Draw a tally chart on the board and explain that this is a way to collect data to show which snack is most popular in the class between 3 choices: oreos, popcorn, and gummy bears.
2. Have each student come up to the board and put a tally mark under their choice for a snack.
3. After all of the students have added their tallies to the chart, have students in groups discuss how many students voted for oreos? How many voted for popcorn and gummy bears? How do you figure that out?
4. What would happen if we eliminated the choice of gummy bears? Would this change the numbers of votes for the other choices?
5. How many students voted total? How many did not vote for popcorn? Share:
1. Have a group share how they figured out how many students voted for popcorn and gummy bears. Have another group share how they figured out how many students did not vote for popcorn.
Summarize:
1. What did we use today to collect our data for the top snack choice of our class? Tables are great ways to collect data and tomorrow we will learn about a way to represent that data so that we can see which snack won.
Assess/Analyze:
1. Pass out a tally chart that students need to analyze and tell how many more votes there were for one choice over another.
____________________________________________________________________________
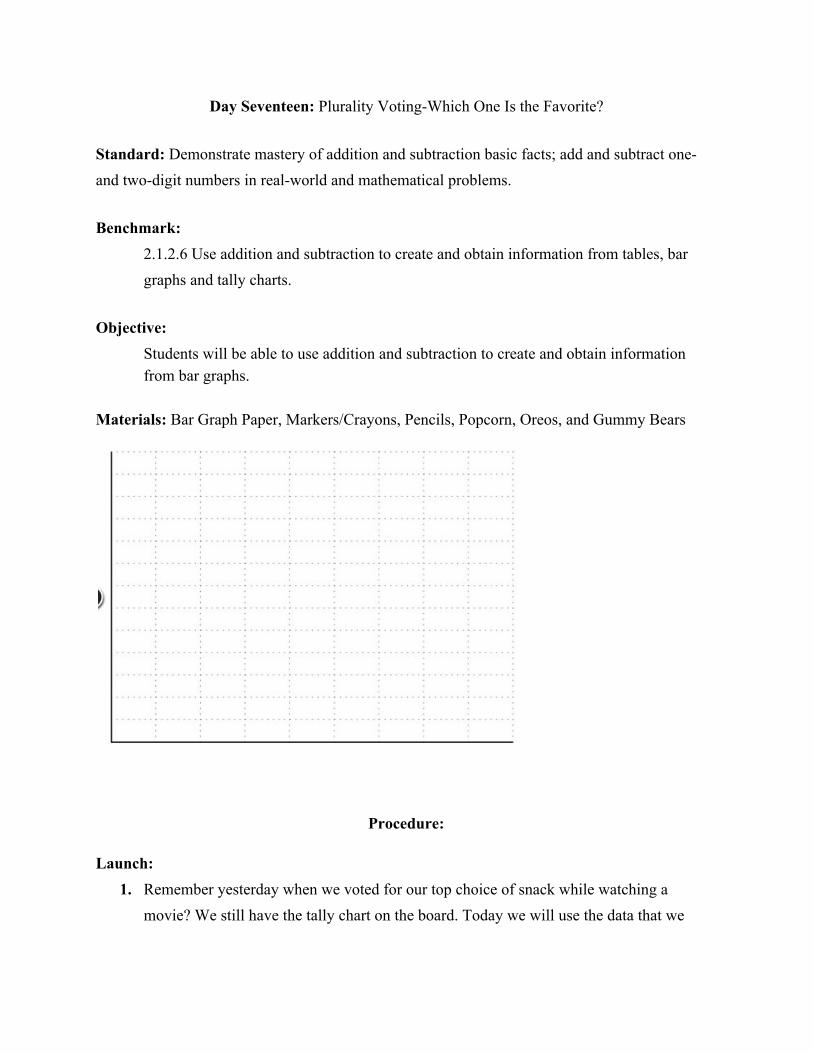
Day Seventeen: Plurality VotingWhich One Is the Favorite? Standard: Demonstrate mastery of addition and subtraction basic facts; add and subtract one and twodigit numbers in realworld and mathematical problems. Benchmark:
2.1.2.6 Use addition and subtraction to create and obtain information from tables, bar graphs and tally charts.
Objective:
Students will be able to use addition and subtraction to create and obtain information from bar graphs.
Materials: Bar Graph Paper, Markers/Crayons, Pencils, Popcorn, Oreos, and Gummy Bears
Procedure:
Launch: 1. Remember yesterday when we voted for our top choice of snack while watching a
movie? We still have the tally chart on the board. Today we will use the data that we
collected yesterday on our tally chart to create a bar graph. Does anyone know what a bar graph is? Show examples of bar graphs on the board.
Explore:
1. Hand out the bar graph template and model how to label each side with the scale and the names of the snack options.
2. Have students label their bar graphs the same way. 3. Ask students to look at the tally chart from yesterday and tell how many students voted
for Oreos. Show students how to create and color in the bar up to the number of votes for oreos. Have students do the same on their bar graph.
4. Continue with the other bars for popcorn and gummy bears. 5. When students have finished their bar graphs, have them get into groups and discuss
which snack won and how they know they are correct. 6. Ask students how the graph would change if popcorn was no longer a choice. Have them
discuss this. 7. Now ask students how many students voted for oreos? How many voted for popcorn and
gummy bears? How many did not vote for popcorn? Share:
1. Ask a group to share how they decided which snack won. 2. Ask another group to share their findings on whether their answers from yesterday were
the same and if they were easier to figure out using the bar graph. Summarize:
1. You all did a great job working with bar graphs today. Can anyone tell me one new thing that you learned today? What snack choice did you vote for? Give them that snack. Explain that everyone will get the snack that they voted for as a treat if they can answer a question about the bar graph!
Assess/Analyze:
1. Ask students a question about the bar graph in order for them to get their snack that they voted for.
______________________________________________________________________________
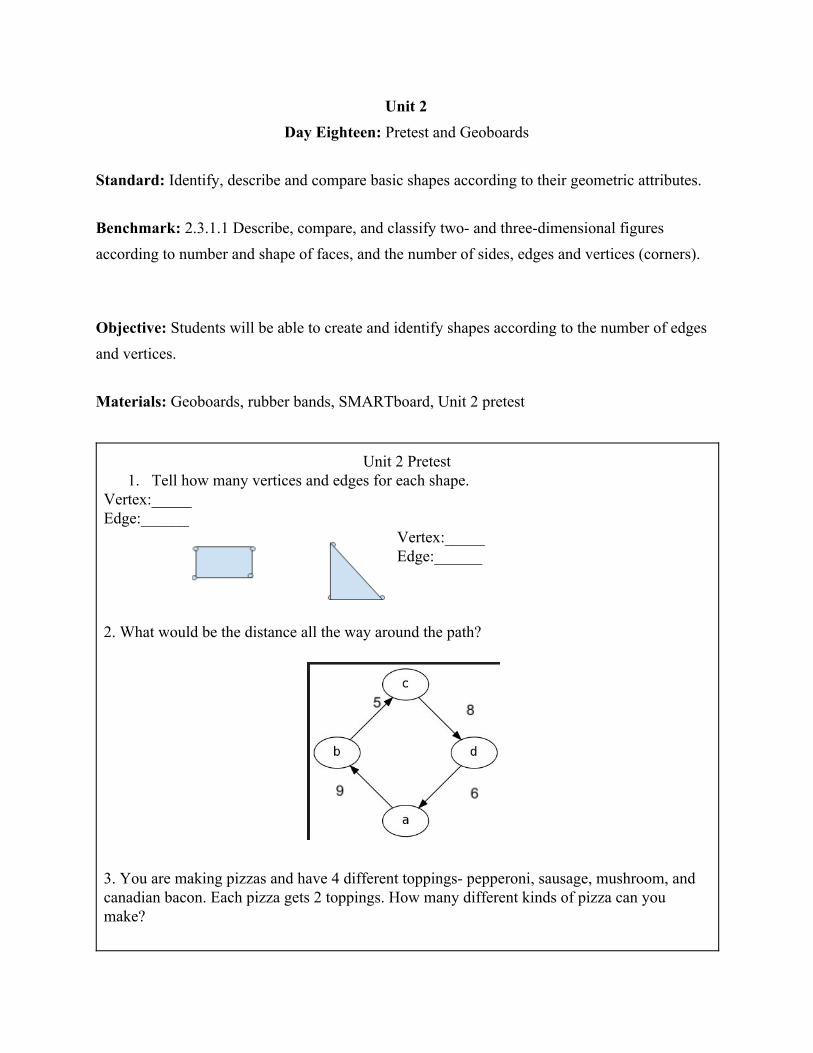
Unit 2 Day Eighteen: Pretest and Geoboards
Standard: Identify, describe and compare basic shapes according to their geometric attributes. Benchmark: 2.3.1.1 Describe, compare, and classify two and threedimensional figures according to number and shape of faces, and the number of sides, edges and vertices (corners).
Objective: Students will be able to create and identify shapes according to the number of edges and vertices. Materials: Geoboards, rubber bands, SMARTboard, Unit 2 pretest
Unit 2 Pretest 1. Tell how many vertices and edges for each shape.
Vertex:_____ Edge:______
Vertex:_____ Edge:______
2. What would be the distance all the way around the path? 3. You are making pizzas and have 4 different toppings pepperoni, sausage, mushroom, and canadian bacon. Each pizza gets 2 toppings. How many different kinds of pizza can you make?
_______________________________
Procedure:
Launch: 1. Pass out geoboards and give students time to explore them and gain curiosity and interest
in them. Explore:
1. In unit 1 when we worked with pattern blocks, one of the ways we sorted our pattern blocks was by vertices and edges.
2. Review that edges are the sides of a shape and vertices are the spots where two or more edges come together.
3. Give each student a geoboard and rubber bands. 4. One the whiteboard write: Vertices Edges 5. Give students time to explore making different shapes.
Share: 1. Once they have created a shape students will count the number of vertices and edges and
write it on the whiteboard. Summarize:
1. What observations can you make from our chart on the whiteboard? What do you see? Do you see any patterns? What different types of shapes did we make?
Assess/Analyze:
1. On your geoboard create a shape with 4 vertices and 4 edges.
Day Nineteen: Rosie’s Walk Standard: Demonstrate mastery of addition and subtraction basic facts; add and subtract one and twodigit numbers in realworld and mathematical problems. Benchmark: 2.1.2.5 Solve realworld and mathematical addition and subtraction problems involving whole numbers with up to 2 digits. Objective: Students will add multiple one and two digit numbers to determine the total distance Rosie walked. Materials: Rosie’s Walk by Pat Hutchins, paper places 1 with each animal on it, tape
Procedure:
Launch: 1. Read students the story Rosie’s Walk. Has anyone ever been in Rosie’s situation? 2. Rosie had to walk a LONG way trying to find help.
Explore:
1. Students will be grouped into groups of 3. On the floor each group will have a path to follow (under materials). Each edge of the path is a different length.
2. If Rosie visits each animal (each vertex) what is the longest path she could take? What is the shortest path?
3. If Rosie walks each edge what is the total distance she will walk? 4. With your groups walk the path on the floor and work together to determine the total
distance Rosie had to walk to visit each animal.

Share:
1. On the whiteboard share the path Rosie could take for the shortest route to visit each animal? What path could she take for the longest route. What was the total distance Rosie traveled?
Assess/Analyze:
1. What path could Rosie take to start at A, visit each animal, and end at A. ______________________________________________________________________________
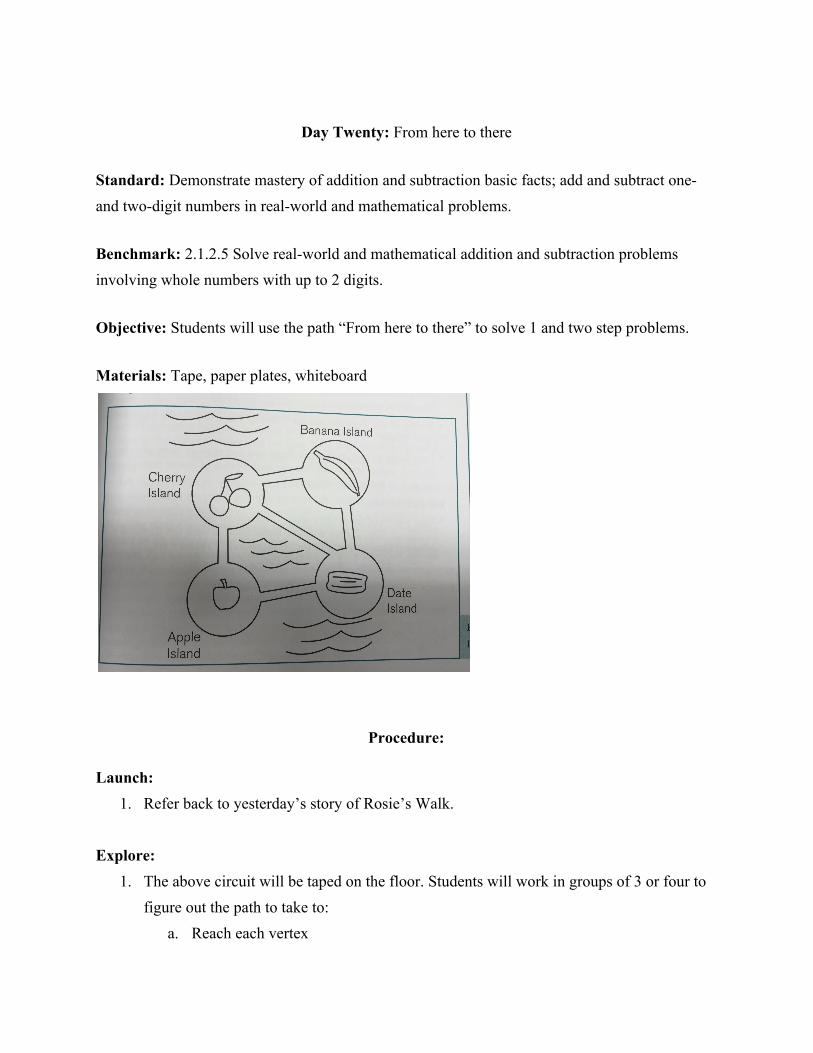
Day Twenty: From here to there
Standard: Demonstrate mastery of addition and subtraction basic facts; add and subtract one and twodigit numbers in realworld and mathematical problems. Benchmark: 2.1.2.5 Solve realworld and mathematical addition and subtraction problems involving whole numbers with up to 2 digits. Objective: Students will use the path “From here to there” to solve 1 and two step problems. Materials: Tape, paper plates, whiteboard
Procedure:
Launch: 1. Refer back to yesterday’s story of Rosie’s Walk.
Explore:
1. The above circuit will be taped on the floor. Students will work in groups of 3 or four to figure out the path to take to:
a. Reach each vertex
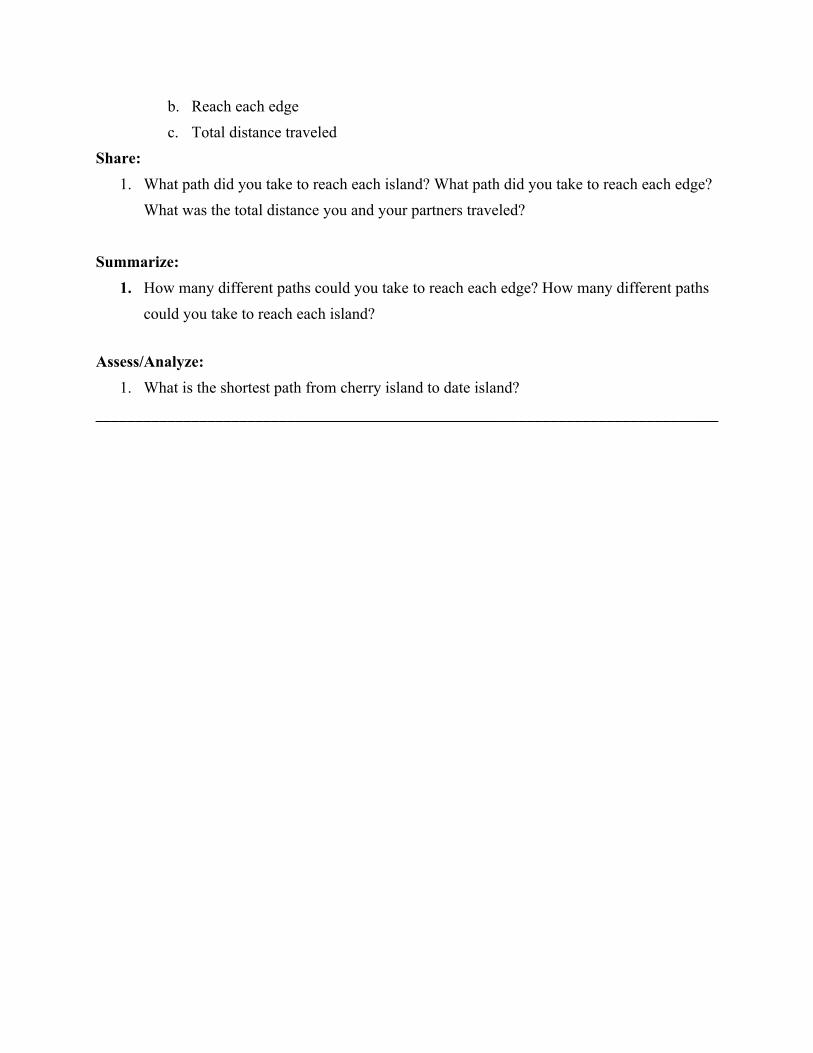
b. Reach each edge c. Total distance traveled
Share: 1. What path did you take to reach each island? What path did you take to reach each edge?
What was the total distance you and your partners traveled? Summarize:
1. How many different paths could you take to reach each edge? How many different paths could you take to reach each island?
Assess/Analyze:
1. What is the shortest path from cherry island to date island? ______________________________________________________________________________
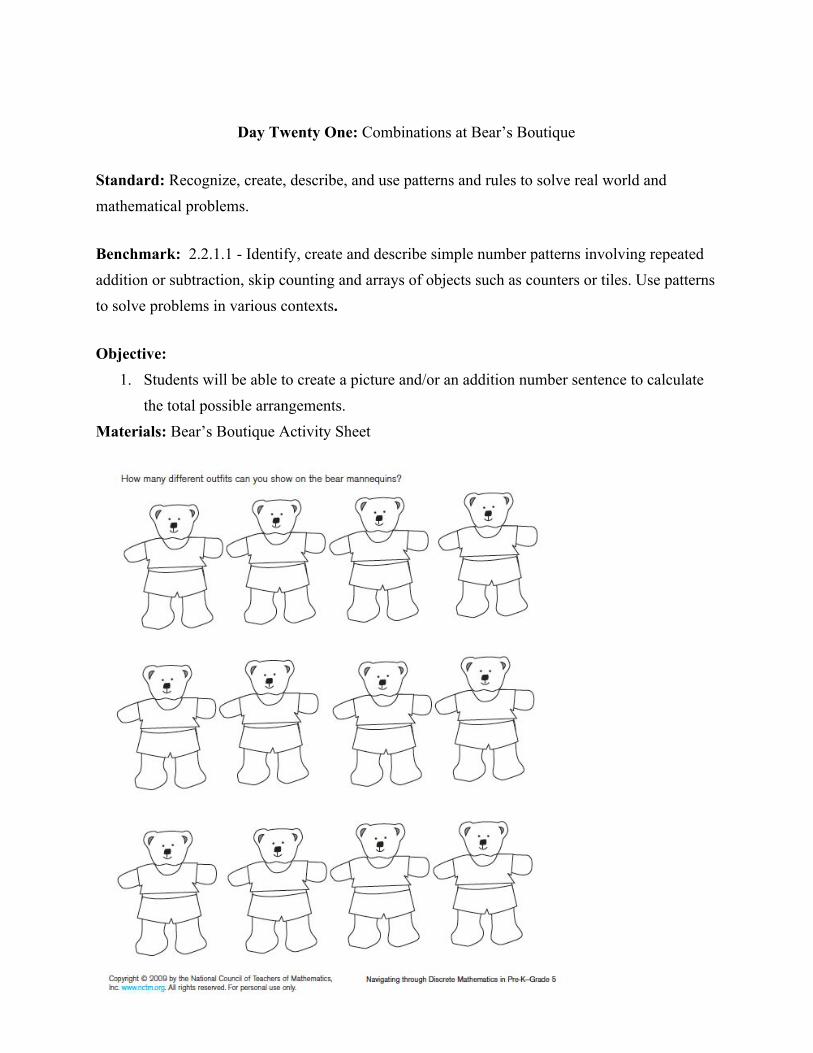
Day Twenty One: Combinations at Bear’s Boutique
Standard: Recognize, create, describe, and use patterns and rules to solve real world and mathematical problems. Benchmark: 2.2.1.1 Identify, create and describe simple number patterns involving repeated addition or subtraction, skip counting and arrays of objects such as counters or tiles. Use patterns to solve problems in various contexts. Objective:
1. Students will be able to create a picture and/or an addition number sentence to calculate the total possible arrangements.
Materials: Bear’s Boutique Activity Sheet
Procedure:
Launch: 1. When I was in second grade I loved to dress up my stuffed animals. My favorite animal
to dress up was my bear. Her name was Betty. When my mom bought Betty she came with a few different outfits. She had three different colored shirts. She has a red, yellow, and pink shirt. She also had two different pairs of shorts. One pair of shorts are dotted and the other pair has stripes. Today were are going to figure out how many different outfits she has.
Explore:
1. Introduce combinations. Combinations in math is an arrangement of objects in which the order does not matter. Ask students if they can help you combine different shirts and shorts to make different outfits for Betty the bear to wear when she goes on vacation. Students will begin by coloring three shirts and two shorts the assigned colors.
2. Students will work in groups to discover different outfit combinations to wear. 3. After students begin working in groups, encourage each group to use strategies. If they
are having trouble getting started guide them to use the strategy of “opposites.” For example if you dress Betty the bear in a pink shirt and striped shorts, what would be the opposite of that outfit? Pink shirt and dotted shorts.
Share: 1. Ask students to share the different outfit combinations their group came up with on the
document camera. 2. How many outfits did your group make in all?
Summarize: 1. Discuss how many outfits each group made. Did some groups find more combinations
than others? Can we represent these combinations of outfits with addition? (2+2+2=6) Assess/Analyze:
1. On an exit slip students will write down two different outfit combinations they created for this activity.
______________________________________________________________________________
Day Twenty Two: Combinations & post test Standard: Recognize, create, describe, and use patterns and rules to solve real world and mathematical problems. Benchmark: 2.2.1.1 Identify, create and describe simple number patterns involving repeated addition or subtraction, skip counting and arrays of objects such as counters or tiles. Use patterns to solve problems in various contexts. Objective:
1. Students will be able to create a picture and an addition number sentence to calculate the total possible arrangements.
Materials: Bear’s Boutique Activity Sheet (see lesson 21)
Procedure:
Launch: 1. Refer back to outfits we created for Betty the Bear. Tell the students that you went to the
store and found two more shirts. One was purple and the other was green. Now Betty the bear has a total five shirts and two pairs of shorts.
Explore:
1. Remind students that this is a combination problem where they will arrange the shirts and shorts into different outfits.
2. Students will color two more shirts (purple and green) to add to their collection from yesterday.
3. Students will work in their groups to discover all the possible outfits. 4. Students will compare their outfits with another group. Students will discuss any patterns
they discovered when arranging outfits for Betty. Share:
1. Student will share the arrangements they created. Discuss any patterns they discovered. How can we represent these combinations of outfits with addition? (2+2+2+2+2=10)
Summarize: 1. Discuss reasons why finding the combination of different objects might be useful in the
real world. Do you think there are other ways we could represent this combination? How would you represent this problem by making a list?
Assess/Analyze: 2. Turn and Talk: How would this problem change if we bought another shirt? How many
possible outfits would you be able to make then? ______________________________________________________________________________
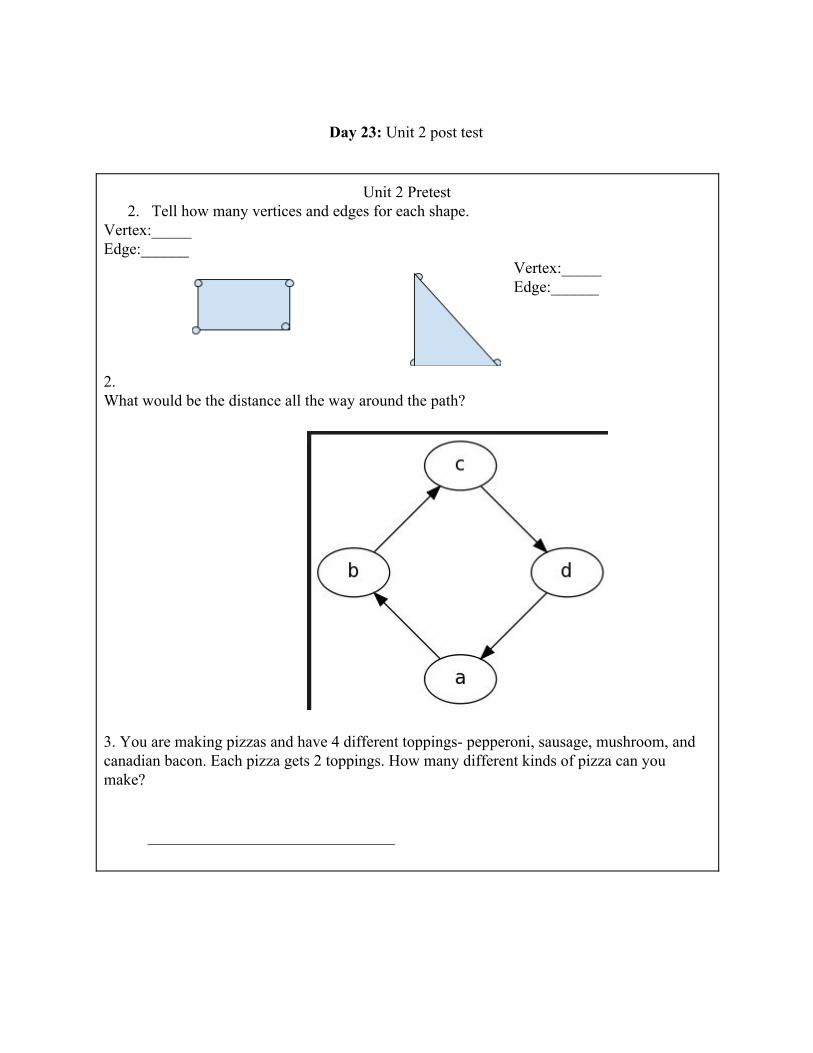
Day 23: Unit 2 post test
Unit 2 Pretest 2. Tell how many vertices and edges for each shape.
Vertex:_____ Edge:______
Vertex:_____ Edge:______
2. What would be the distance all the way around the path? 3. You are making pizzas and have 4 different toppings pepperoni, sausage, mushroom, and canadian bacon. Each pizza gets 2 toppings. How many different kinds of pizza can you make? _______________________________