discrete probability distributions. discrete vs. continuous discrete ▫a random variable (rv) that...
TRANSCRIPT

Discrete Probability Distributions

Discrete vs. Continuous
•Discrete▫A random variable (RV) that can take only
certain values along an interval: Cars passing by a point Results of coin toss Students taking a class
•Continuous▫An RV that can take on any value at any
point along an interval: Temperature, time, distance, money etc.

Frequency Distribution
•Number of times an observation occurs in a given population.

What is a variable?
•A symbol (A, B, x, y, etc.) that can take on any of a specific set of values▫X=number of heads▫Y= temperature
•Random variable▫The outcome of a statistical experiment

Random variable notation
•Capital letter represents the RV▫X=total number of heads in 4 tosses▫P(X) represents the probability of X
•Lower-case letter represents one of the values of the RV▫P(X=x) is the probability the RV will
assume a specific value▫P(X=2) is the probability that we will have
exactly 2 heads in the 4 tosses

Probability Distribution
•Relative frequency distribution that should, theoretically, occur for observations from a given population.
Outcome #heads Probability
HH 2 .25
HT 1 .25
TH 1 .25
TT 0 .25
X P(X)
0 0.25
1 0.50
2 0.25
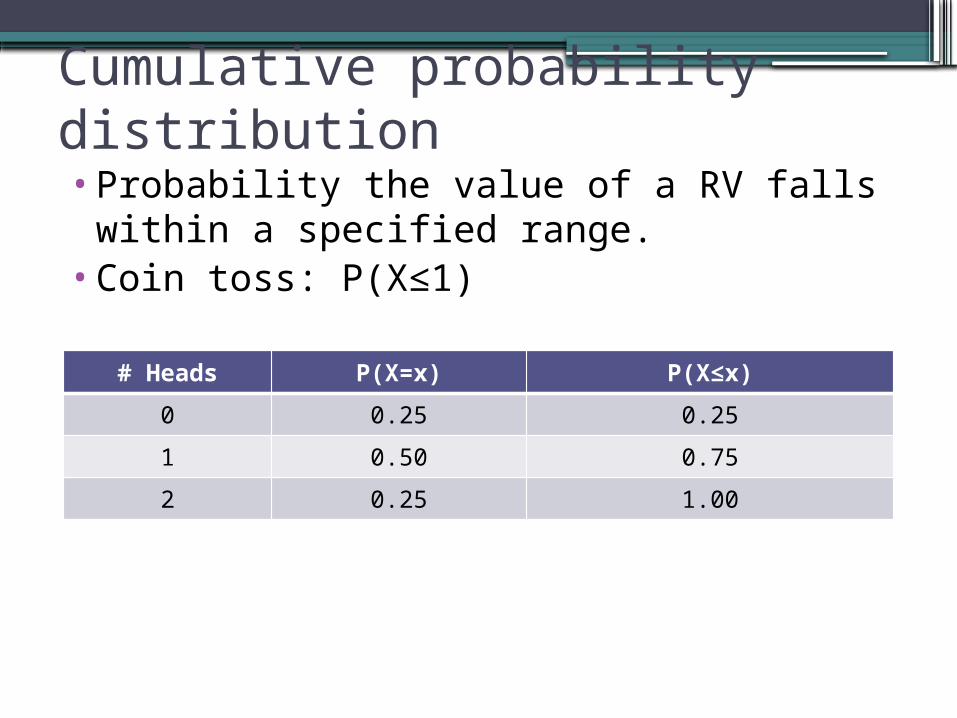
Cumulative probability distribution•Probability the value of a RV falls within a
specified range.•Coin toss: P(X≤1)
# Heads P(X=x) P(X≤x)
0 0.25 0.25
1 0.50 0.75
2 0.25 1.00

Characteristics of a Discrete Probability Distribution
•For any value of x
•The values of x are exhaustive, i.e. the distribution contains all the possible values
•The values of x are mutually exclusive; i.e., only one value can occur for an experiment
•The sum of the probabilities equals 1

Mean and standard deviation
•Mean of discrete distribution is called expected value
•Variance
•Standard Deviation

Practice
•Determine the Mean (µ) or Expected Value (E(x)) for the following data.
X 0 1 2
P(x) 0.6 0.3 0.1

Practice
•A music shop is holding a promotion in which the customer rolls a die and deducts a dollar from the price of a CD equal to the number that he rolls.
•If the owner pays $5.00 for each disk and prices them at $9.00, what will his expected profit be on each CD during this promotion?

Binomial Distributions
•There are 2 or more identical trials•In each trial, there can be only 2
outcomes (success or failure)•Trials are statistically independent
▫Outcome of one trial does not influence outcome of the next
•Probability of success remains the same from one trial to the next

Binomial Experiment?
•An article in a 1988 issue of The New England Journal of Medicine talked about a TB outbreak. ▫One person caught the disease in 1995▫232 workers sampled from a very large
population were given a TB test▫The number of workers testing positive is
the variable of interest•If we test all 232 workers for the disease,
is this a binomial experiment?

Binomial Experiment?
•Bill has to sell 3 cars to meet his monthly quota. He has 5 customers, but 3 of them are interested in the same car and will leave if that car is sold.
•He has a 30% chance of a sale with each customer.
•Is this a binomial experiment?

Binomial Distributions
•Probability of exactly x successes in n trials:
•Where:▫π = probability of success for any trial▫n = number of trials▫x = number of successes▫(1-x) = number of failures

Binomial Distributions
•Expected value
•Variance

Binomial Distributions in Excel• =binom.dist(number_s,trials,probability_s,cumul
ative)• Where:
▫ Number_s = number of successes▫ Trials▫ Probability_s = probability of success▫ Cumulative:
False, if we want the probability of x True, if we want the probability of all the variables up
to and including x
• Example, in the previous problem▫ P(X=5)▫ =binom.dist(5,5,.1,false)

Binomial Experiment
•We’re going to select 5 households at random in a city where the unemployment rate is 10% to see if the head of the household is unemployed. What is the probability that all 5 are employed?
•Is this a binomial experiment? ▫Why or why not?

Acceptance to college
•The probability that a student is accepted to a prestigious college is 0.3. If 5 students apply, what is the probability that at most 2 are accepted?
These examples came from the StatTrek website: http://stattrek.com/Lesson1/Statistics-Intro.aspx?Tutorial=StatThese examples came from the StatTrek website: http://stattrek.com/Lesson1/Statistics-Intro.aspx?Tutorial=StatThese examples came from the StatTrek website: http://stattrek.com/Lesson1/Statistics-Intro.aspx?Tutorial=Stat

Probability Distribution
0 1 2 3 4 50
0.05
0.1
0.15
0.2
0.25
0.3
0.35
0.4
# Accepted
Pro
babi
lity

Cumulative Probability Distribution
0 1 2 3 4 50
0.1
0.2
0.3
0.4
0.5
0.6
0.7
0.8
0.9
1
# Accepted
Pro
babi
lity

Coin flipping - again
•What is the probability of getting 45 or fewer heads in 100 tosses of a fair coin?

Probability Distribution
0 3 6 9 12 15 18 21 24 27 30 33 36 39 42 45 48 51 54 57 60 63 66 69 72 75 78 81 84 87 90 93 96 99
-0.00999999999999998
1.90819582357449E-17
0.01
0.02
0.03
0.04
0.05
0.06
0.07
0.08
0.09

Cumulative Probability Distribution
0 3 6 9 12 15 18 21 24 27 30 33 36 39 42 45 48 51 54 57 60 63 66 69 72 75 78 81 84 87 90 93 96 990
0.1
0.2
0.3
0.4
0.5
0.6
0.7
0.8
0.9
1

The World Series
•What is the probability that the World Series will last 4 games?
•5 games? •6 games? •7 games?
▫Assume the teams are evenly matched.

Poisson Distribution
•Applies for events occurring over time, space, or distance
•Examples:▫Number of cars driving past a point▫Number of defects per foot in
manufactured pipe▫Number of knots in a section of wood panel▫Number of accidents per day at a job site

Poisson Distribution
e is the base of the natural logarithm system and is equal to 2.71828
Any number raised to a negative exponent is the same as 1 divided by that number raised to its exponent. Example: 2-2 is the same as 1/22

Poisson Distribution
•There were 438 children born in a small town last year.
•What is the probability that, on any given day, no children were born?

Poisson Distribution in Excel
•=poisson.dist(x,mean,cumulative)•Where:
▫X=the number we’re looking for▫Mean = lambda▫Cumulative
True = probability of all values up to and including x
False = probability of x•=poisson.dist(0,1.2,false)

Probability Distribution
0 1 2 3 4 5 6 7 8 9 100
0.05
0.1
0.15
0.2
0.25
0.3
0.35
0.4

Cumulative Poisson Distribution•Suppose the average number of lions seen
on a 1-day safari is 5. What is the probability that tourists will see fewer than four lions on the next 1-day safari?

0 1 2 3 4 5 6 7 8 9 10 11 12 13 14 150
0.1
0.2
0.3
0.4
0.5
0.6
0.7
0.8
0.9
1
Cumulative Poisson Distribution

Hypergeometric Distribution
•Sampling without replacement•Compare to binomial
▫There are 2 or more identical trials▫In each trial, there can be only 2 outcomes
(success or failure)▫Trials are statistically independent▫Probability of success remains the same
from one trial to the next▫The random variable is the number of
successes in n trials
Trials are not statistically independentProbability of success changes from one trial to the next

Hypergeometric Distribution
Where: N=size of the populationn=size of the samples=number of successes in the
populationx=number of successes in the
sample

Hypergeometric in Excel
•=hypgeom.dist(sample_s, number_sample, population_s, number_population, cumulative)
•Where:sample_s=number of successes in the
samplenumber_sample=size of the samplepopulation_s=number of successes in the populationnumber_population=size of the
populationcumulative=same as before
• =hypgeom.dist(2, 4, 6, 20, false)

Hypergeometric Distribution
•20 businesses filed tax returns•6 of the returns were filled out incorrectly•The IRS has randomly selected 4 of the 20
returns to audit•What is the probability that exactly 2 of
the 4 selected for audit will be filled out incorrectly?

Hypergeometric Distribution
0 1 2 3 40
0.05
0.1
0.15
0.2
0.25
0.3
0.35
0.4
0.45
0.5

Cumulative Hypergeometric
•Suppose we select 5 cards from an ordinary deck of playing cards. What is the probability of obtaining 2 or fewer hearts?

Cumulative Hypergeometric
0 1 2 3 4 50
0.2
0.4
0.6
0.8
1
1.2
Summary
•Random variables▫Discrete v. continuous
•Probability distributions▫Cumulative distributions
•Expected values•Binomial•Poisson•Hypergeometric