discrimination through “versioning” with advertising in
TRANSCRIPT

NÚMERO 600
ANTONIO JIMÉNEZ-MARTÍNEZ AND OSCAR GONZÁLEZ-GUERRA
Discrimination through “Versioning” with Advertising
in Random Networks
www.cide.edu SEPTIEMBRE 2016
Importante
Los Documentos de Trabajo del CIDE son una herramienta para fomentar la discusión entre las comunidades
académicas. A partir de la difusión, en este formato, de los avances de investigación se busca que los autores
puedan recibir comentarios y retroalimentación de sus pares nacionales e internacionales en un estado aún
temprano de la investigación.
De acuerdo con esta práctica internacional congruente con el trabajo académico contemporáneo, muchos de
estos documentos buscan convertirse posteriormente en una publicación formal, como libro, capítulo de
libro o artículo en revista especializada.

D.R. © 2016, Centro de Investigación y Docencia Económicas A.C. Carretera México Toluca 3655, Col. Lomas de Santa Fe, 01210, Álvaro Obregón, México DF, México. www.cide.edu
www.LibreriaCide.com
Oficina de Coordinación Editorial [email protected] Tel. 5727 9800
Abstract
This paper proposes a framework of second-degree discrimination with two different versions
of a service that are served in random networks with positive externalities. In the model,
consumers must choose between purchasing a premium version of the service or a free version
that comes with advertising about a certain good (unrelated to the service). The ads attached
to the free version influence the free version adopters’ opinions and, given the induced effects
on the good sales, they affect the optimal pricing of the premium version. We relate the optimal
pricing strategy to the underlying hazard rate and degree distribution of the random network.
Under increasing hazard rates, hazard rate dominance always implies higher prices for the
service. In some applications of the model, decreasing hazard rates are often associated to
extreme situations where only the free version of the service is provided. The model provides
foundations for empirical analysis since key features of social networks can be related to their
underlying hazard rate functions and degree distributions.
Keywords: Social networks, second-degree discrimination, advertising, degree
distributions, hazard rate
JEL Classification: D83, D85, L1, M3
Resumen
Este artículo propone un marco de discriminación de segundo grado con dos versiones diferentes
de un servicio que se proveen a través de redes aleatorias con externalidades positivas. En el
modelo, los consumidores eligen entre comprar una versión premium del servicio o una versión
gratuita que incluye publicidad sobre un cierto bien (no relacionado con el servicio). La publicidad
adjunta a la versión gratuita influencia las opiniones de quienes adoptan esa versión y, a causa
de los efectos en la venta del bien, afecta la estrategia óptima de precios. Relacionamos la
polática óptima de precios con la hazard rate y con la distribución de grado de la red aleatoria.
Con hazard rates crecientes, dominancia en hazard rate siempre implica mayores precios del
servicio. En algunas aplicaciones del modelo, hazard rates decrecientes se asocian con
frecuencia a situaciones extremas donde sólo la versión gratuita es provista. El modelo
proporciona fundamentos teóricos para el estudio empírico dado que importantes propiedades
de las redes sociales están relacionadas con sus hazard rates y distribuciones de grado
Palabras clave: Redes sociales, discriminación de segundo grado, publicidad,
distribuciones de grado, tasa de riesgo
Clasificación JEL: D83, D85, L1, M3


Discrimination through “Versioning” with Avertisingin Random Networks∗
Oscar González-GuerraCIDE, Division of Economics
and
Antonio Jiménez-Martínez†
CIDE, Division of Economics
August 2016
Abstract
This paper proposes a framework of second-degree discrimination with two different versions of
a service that are served in random networks with positive externalities. In the model, consumers
must choose between purchasing a premium version of the service or a free version that comes with
advertising about a certain good (unrelated to the service). The ads attached to the free version
influence the free version adopters’ opinions and, given the induced effects on the good sales, they
affect the optimal pricing of the premium version. We relate the optimal pricing strategy to the
underlying hazard rate and degree distribution of the random network. Under increasing hazard rates,
hazard rate dominance always implies higher prices for the service. In some applications of the model,
decreasing hazard rates are often associated to extreme situations where only the free version of the
service is provided. The model provides foundations for empirical analysis since key features of social
networks can be related to their underlying hazard rate functions and degree distributions.
Keywords: Social networks, second-degree discrimination, advertising, degree distributions,hazard rateJEL Classification: D83, D85, L1, M3
∗We thank Benjamin Golub, Navin Kartik, Christopher Sánchez-Vázquez, and Jorge Zatarain-Lizárraga forvery useful feedback. Jiménez-Martínez acknowledges financial support from CONACYT grant 41826. Anyremaining errors are our own.
†Corresponding Author
1

1 Introduction
We develop a model for exploring second-degree discrimination through advertising that iswidely applicable to the provision of services over random social networks in the presence ofpositive externalities. The foundation of our model is the observation that most providers ofonline services through social networks are able to offer two different versions of their services:a premium version where consumers purchase it at a price, and a free version where consumerspay no price but, in exchange, must receive advertisements of some other products (which areusually unrelated to the service). For those consumers who choose the free version, the attachedads have two effects. First, they incur a cost from their exposition to ads, which establishes therelevant trade-off in order to choose one version or the other. Secondly, advertising influencesthe consumers’ opinions about the advertised good, which affects the revenue from the salesof such a good. As a consequence, the revenue to the service provider from the free versionof the service and, hence, the optimal pricing of the premium version are also affected. Sinceconsumers’s opinions are influenced, the effects of this type of discrimination are more complexthan those of the classical second-degree price discrimination.Over the last decade, the expansion of the Internet, mobile devices, and other communica-
tion technologies has triggered a dramatic increase of online services that are provided throughsocial netwoks.1 The social networks targeted by these service providers tend to feature posi-tive externalities: the usage of the service is more or less beneficial to a consumer dependingon whether or not his neighbors (e.g., friends or co-workers) are using it as well. Given thesenetwork externalities, the service provider would benefit from implementing some type of pricediscrimination. One plausible strategy is to offer individualized prices as a function of the con-sumer’s position in the social network. On this important issue of perfect price discrimination,the theoretical literature on networks has recently yielded a number of key insights which re-late the firm’s pricing strategy to the consumers’ centrality (Candogan et al. (2012) and Bloch& Quérou (2013)). Perfect price discrimination, however, can become difficult to implementin many real-world large social networks.2
Alternatively, since the platform technologies used for providing online services has madeit possible for other firms (from a variety of industries, in principle, unrelated to the serviceprovider) to use it as a channel to advertise their own products, the service provider may optfor implementing a second-degree discrimination strategy with advertising.3 An additional
1Providing services through social networks is the business model of companies such as Google (general com-munication and information), Facebook and Twitter (social interaction), Whatsapp, Skype, and Line (com-munication) AirBnB (accommodation search), Waze (traffic and route forecasting), The Weather Channel(weather forecasting), Yelp and Foursquare (review and rating), YouTube, Vimeo, and Spotify (entertainingand information), Strava (exercise and health tracking), Box (second-hand selling), or Tinder (dating).
2First, it requires the firm to have full information about the entire social network, which may be unfeasible incomplex (and, sometimes, rapid evolving) networks. Secondly, setting a particular price to each consumerdepending on his position in the network may result too costly (or simply unpractical) for the firm even ifit is able to identify completely the neighbors of each consumer.
3The most widely established pattern in practice is one where a service provider offers its product through
2
feature of these business models is that the premium version usually allows the consumers toenjoy the network externality to a larger extent than the free version. This type of second-degree discrimination, which is becoming extensively used in many real-world social networks,is commonly referred to in the business literature as “versioning.” While the incentives forperfect price discrimination in social networks are now fairly well understood by economists,the process by which second-degree discrimination through “versioning” (with advertising)takes place has received little formal study. Understanding the simple economics of this typeof second-degree discrimination is the goal of this paper.To overcome the difficulties of dealing with complex networks, the service providers can
rely on the empirical regularities that exhibit social networks.4 Considering random networksallows for a tractable framework to investigate optimal discrimination over complex socialnetworks. Therefore, based on random networks, we provide some general results about theoptimal pricing of the premium version of the service (and, thus, the optimal discriminationstrategy) as a function of fundamentals such as production and advertising costs, and ofsome key indicators of the degree distribution of the random network. Our model is able tocapture some empirical regularities of second-degree discrimination through “versioning” insocial networks.Given that our main goal is the relationship between the service provider and the consumers,
this paper abstracts from the plausible relations that may exist between the service providerand a different company whose product is being advertised through the online service provision.Using a reduced form, we model both firms as being perfectly integrated and acting as a singlemonopolist that offers both products.5 The analysis assumes that the cost to the consumersfrom their exposition to ads is arbitrarily small, which directly implies that each consumerpurchases either the premium or the free version of the service. This makes the analysis of thesecond-degree discrimination problem tractable.6
Our notion of advertising builds upon the informative advertising approach followed byLewis & Sappington (1994) and Johnson & Myatt (2006). We consider that advertising informsconsumers about the good’s characteristics and let them improve their knowledge about theirtrue underlying preferences for the good.Our results show that the role of the random network in the monopolist’s optimal discrim-
some social network and another firm makes use of the service diffusion platform to advertise its ownproduct. Then, the firm that provides the service receives a compensation from the firm that advertises itsproduct, which is usually based on the amount of ads served or on the profits from the advertising activity.
4See, e.g., Jackson (2008) where empirical regularities of social networks such as small worlds, clustering, orassortativity are discussed at length.
5Our main insights would follow qualitatively if we considered instead a model with two different firms, wherethe service provider receives a compensation proportional to the profits generated from the advertisingactivity.
6Under the premise that the architecture of the underlying social network is not affected when some consumerspurchase no version of the service, considering the case where consumers may decide not to purchase anyversion of the service would only imply differences in the composition of the demand for the service. Yet,there would be no qualitative changes in the optimal discrimination strategy followed by the monopolist.
3

ination policy can be pinpointed by the (cummulative) degree distribution that generates thenetwork and by its corresponding hazard rate. On the one hand, the shape of the degreedistribution directly determines the demands of the premium and free versions of the servicein our model. Other things equal, the aforementioned differences in externalities imply thatconsumers with relatively large neighbourhoods prefer the premium version rather than thefree one. Then, the demand of the premium version, for each given price of the service, ispositively related with the probability that the network generates relatively large neighbour-hoods. On the other hand, the shape of the hazard rate of the degree distribution, amongother implications, is useful to determine whether or not increasing the service price raises theprofits from the service sales (to premium version adopters).Including advertising into the monopolist’s discrimination strategy leads to a more subtle
analysis than that involving mere second-degree price discrimination. For instance, when thecost of advertising is relatively low, the firm is able to induce a high valuation for the goodto the consumers, which naturally raises the revenue from the good sales. Thus, through thischannel, it becomes profitable for the firm to raise the price of the service in order to increasethe number of its free version adopters as these are the only consumers who are receivingthe ads. If this effect is sufficiently high, then raising the service price can be profitableeven for those random networks where this lowers the profits from the premium version sales.Taking into account the effects on total profits, both from the good and the service sales,Proposition 3 shows that, when the advertising cost lowers, the firm wishes to raise the priceof the service if and only if the current proportion of free version adopters exceeds a certainbound, which depends only on fundamentals (production and advertising costs). In short, forthe existing price for the service, the random network must have already allowed for relativelyhigh proportions of free version adopters.On the key issue of the role of the social network in the monopolist’s optimal pricing strat-
egy, the crucial criterion relies on a ranking between distributions which is stronger than theclassical first order stochastic dominance. We show in Proposition 4 that, other things equal,hazard rate dominance implies higher optimal prices for the service when the compared socialnetworks feature increasing hazard rates. For the case of decreasing hazard rate functions,the relation between the optimal prices is more ambiguous. Hazard rate functions are usuallybest interpreted from a dynamic perspective. High values of the hazard rate function indicatethat, at the current price of the service, it is less likely that a randomly chosen consumer formsnew links. Then, suppose that we compare two random networks, both with increasing hazardrates, and with degree distributions FA and FB such that FA Hazard Rate Dominates FB. Bydefinition, this means that, for each fixed price of the service, there is a lower value for thehazard rate function under FA than under FB. Then, for each given price, the probability thata consumer increases the number of his current links is higher under FA than under FB sothat premium version adopters are, in average, willing to accept higher prices for the servicein the network generated by FA.
4

Decreasing hazard rates are often associated in our model to situations where the monopolistprefers to serve the service only through its free version. Intuitively, decreasing hazard ratesindicate that, as the price of the service increases, it becomes more likely for consumers toform new links in the future. Then, when the price of the service rises, this makes premiumversion adopters somehow more reluctant to switch to the free version because they expecta future increase in the number of their links and, thus, higher benefits from their relativeexternality gains.7 As a consequence, the firm could find it beneficial to raise even furtherthe price of the service and this might lead to situations where profits are always increasingin the service price. In these cases, the firm ends up seting an optimal price so high that allconsumers opt for the free version and only the the premium version is provided. Corollary 1provides conditions under which profits always increase with the price of the service.Interestingly, the empirical literature on social networks suggests that decreasing hazard
rates are often present in relatively large, but sparsely connected, social networks. In particu-lar, most large and sparse social networks seem to adjust to the pattern of scale-free networkswhich are determined by a power law degree distribution. The power law and other associ-ated distributions, such as the Pareto distribution, feature decreasing hazard rates.8 On theother hand, recent empirical evidence on general graphs suggests that more densely connectedgraphs tend to diverge from the scale-free/power law pattern. In these cases, most graphsseem to adjust to the exponential degree distribution pattern,9 which features constant hazardrate functions.Of course, it remains quite debatable what forces are behind the actual strategies of real-
world providers of services through social networks. There are many examples where providersthat have access to relatively large and sparse social networks, such as Twitter, Waze, Yelp,Google, or YouTube are increasingly opting for providing only a free version (with advertising)of their services. On the other hand, there is evidence as well that firms which serve torelatively smaller, but denser, social networks, such as The Weather Channel, Spotify, and
7Of course, the price raise does lead to a transfer of service adopters from the premium to the free version.But this transfer is relatively smaller than the one induced under increasing hazard rates because, in thiscase, premium version adopters expect to have lower neighborhood sizes in the future.
8In their seminal study of the World Wide Network, Barabási & Albert (1999) concluded that the degreedistribution of nodes on the Internet adjusts to a power law distribution. More recently, Clauset et al.(2009) found empirical evidence that both the nodes on the Internet (at the level of autonomous systems)and the number of links in websites adjust to a power law distribution. Also, Stephen & Toubia (2009) arguethat the emerging social commerce network through the Internet follows a typical power law distribution.In perhaps the largest structural analysis conducted up to date, Ugander et al. (2011) conclude that theFacebook social network features decreasing hazard rates as well, though it does not fit the pattern of apower law distribution. Also, decreasing hazard rates are always generated by two ubiquitous models ofthe theoretical literature on random networks: the preferencial attachment model proposed by Barabási &Albert (1999) and the network-based search model suggested by Jackson & Rogers (2007).
9See, e.g., Rosas-Calals et al. (2007) or Ghoshal & Barabási (2011). At a theoretical level, increasing hazardrates arise in the classical models of Poisson random networks proposed by Erdös & Renyi (1959) and SmallWorlds networks suggested by Watts & Strogatz (1998). Following a dynamic approach, Shin (2016) hasrecently provided a very interesting micro-founded model where increasing (or constant) hazard rates ariseif an only if nodes are less likely (or equally likely) to engage in new links as their degrees increase.
5

most exercise tracking services and travel guides,10 maintain both the premium and free versionof their services. Our results provide empirical predictions of how the optimal pricing with“versioning” of service providers depends on the shape of the degree distribution and on itsassociated hazard rate function.
1.1 Related Literature
To the best of our knowledge, this is the first paper that explores second-degree discriminationin social networks by means of two versions of a product, one of which offers advertising.Nonetheless, our work is related to several fields of research in economics. The motivation ofthis article is influenced by the large literature, originated by Farrell & Saloner (1985) and Katz& Shapiro (1985), that explore the effects of network externalities on economic decisions. Thestudy of the incentives to provide consumers with private information goes back to the seminalcontribution of Lewis & Sappington (1991) and Lewis & Sappington (1994), and the work ofPrat & Ottaviani (2001). Our notion of informative advertising builds upon the insights onadvertising of Johnson & Myatt (2006). In particular, our model exploits their result that, in awide variety of circumstances, the monopolist’s profits are convex in the amount of informationthat is transmitted through advertising.11 The idea that advertising may generate costs to theconsumers from their exposition to ads goes back to the seminal paper of Becker & Murphy(1993). Including this type of costs allows us to model the critical trade-off for the consumersin order to choose one version or the other. The analysis of price discrimination where amonopolist offers a menu of different qualities of some product originated with the works ofMussa & Rosen (1978) and Maskin & Riley (1984).Our analysis relies on the large literature on random networks. The study of random
networks initiated with the influential work of Erdös & Renyi (1959), which served the basisfor a plethora of models wherein economic agents only known that the actual social networkis randomly drawn from a set of possible networks. Our dynamic interpretation of randomnetworks builds on the canonical configuration model which was proposed by Bender & Canfield(1978) and used thereafter by a number of important papers in the social networks area (e.g.,Bollobás (2001), Newman et al. (2001), Jackson & Yariv (2007), Galeotti & Goyal (2009), andFainmesser & Galeotti (2016)).Our paper complements a recent and prolific literature that deals with how firms can use
the diffusion of information through social networks to increase their profits. The literatureon optimal advertising in the presence of adoption externalities initiated with the insights ofButters (1977) and Grossman & Shapiro (1994). Optimal targeting and advertising strategiesthrough word of mouth communication with local interactions have been investigated by a
10In contrast with most typical social networks, these are networks where each node is directly linked withalmost all other nodes.
11As in their paper, we obtain that, through its advertising activity, the firm optimally wishes either to revealno information whatsoever or to be completely informative.
6

number of papers since the seminal contributions of Ellison & Fudenberg (1995) and Bala& Goyal (1998). For instance, Galeotti & Goyal (2009) relate optimal marketing strategies,both under word of mouth communication and adoption externalities, to the characteristicsof the random network. Under the assumption that consumers only inform their neighbors ifthey themselves purchase the product, Campbell (2013) proposes a dynamic model of optimalpricing and advertising in random networks where information diffusion is endogenously gen-erated. More recently, Fainmesser & Galeotti (2016) build on the influential insights aboutoptimal perfect discrimination of Candogan et al. (2012) and Bloch & Quérou (2013) to explorepricing strategies when consumers are heterogenous with respect to their influence abilities,and to obtain key implications on welfare. Our paper departs from those contributions in tworespects. First, the novel form of second-degree discrimination with advertising that our paperproposes is not present in those works. Secondly, our model does not consider that the in-formation about the advertised good flows through the network depending on how consumersare linked. While we assume that this information is transmitted publicly to all free versionadopters, the role of the network is to provide the consumers with the incentives for theirpurchasing decisions depending on the relative sizes of the externalities.Finally, perhaps the paper closest to ours in its scope is Gramstad (2016) wherein the mo-
nopolist allows consumers to choose from a menu of differentiated products in the presence oflocal externalities. These externalities are such that a consumer benefits from the consump-tion of a connection (either direct or indirect) only if they purchase the same product. WhileGramstad (2016) explores the role of the network structure in optimal pricing in a contextwhere consumers may choose between different versions of a product, as we do, there are im-portant differences in both approaches. The main difference is that the influence of advertisingand, therefore, of a mechanism through which the firm may raise its profits from an advertisedproduct, are absent in his analysis. In addition, we consider that the size of the networkexternality depends only on the version chosen by the consumer himself and not on the ver-sions chosen by his neighbors. As a consequence, in line with the classical second-degree pricediscrimination, his analysis focuses more on segmented markets along the network whereas wemaintain a common market, with different versions of the product, throughout the network.The rest of the paper is organized as follows. Section 2 proposes our new taxonomy of second-
order degree discrimination through “versioning” and lays out the model. While Section 3 offerssome preliminary insights, Section 4 describes the paper’s main results. Section 5 providessome examples of our model, Section 6 discusses equilibrium existence and its unicity, andSection 7 concludes. The proofs of Propositions 1–4 are relegated to the Appendix.
2 The Model
A monopolist sells two (different and totally unrelated) products to a unit mass of consumers,indexed by i ∈ [0, 1], that are embedded in a (large and complex) social network. The monop-
7

olist produces z ≥ 0 units of a good, at a marginal cost cz, and any discrete quantities of twoversions of a service, at no cost, that is provided through the social network.We can broadly interpret the links of the network as connections over some social me-
dia platform, informative communications, online trading connections, friendship or workingrelations.12 The social network allows consumers to interact locally with respect to their con-sumptions (only) of the service. In particular, the consumption of the service exhibits a local(positive) network effect: a consumer’s utility from (any version of) the service increases ashis neighbors increase their consumptions. These externalities capture the idea that the totalutility from making use of the service is positively related to the number of neighbors whoare using it as well. In practice, these externalities take the form of informational gains (e.g.,weather forecast, traffic monitoring, news services, or review and rating services), collaborativegains (e.g., online gaming or collaborative projects), and commercial or personal benefits frombeing able to interact or make transactions with a higher number of people (e.g. second handselling, exercise tracking, or dating services).One version of the service is offered with advertising about the good (free version or ads
version) while the other is offered without advertising (premium version or no-ads version).By offering two different versions of the service, the firm is able to implement a second-degreediscrimination policy where the consumers decide which version they adopt.Each consumer has a unit demand for the good and a unit demand for the service. A
consumer i is willing to pay up to ωi for a single unit of the good and up to θi for a singleunit of the service. If his expected valuation either of the good or the service exceeds notthe corresponding price, then he purchases none of the respective product. The consumers’valuations for the good ωi are independently drawn from a uniform distribution13 U [0, 1]
and their valuations for the service θi are independently drawn according to some (common)distribution from a support Θ ⊂ R++, with θ = inf Θ. The two products are totally unrelatedand, therefore, the valuations ωi and θi are assumed to be independent from each other.
2.1 Advertising the Good
The literature on advertising has focused on three approaches which are typically labelled aspersuasive, complementary, and informative (e.g., Bagwell (2007)). Advertising is persuasivewhen it raises the consumers’ propensity to pay for the good being advertised and it is com-plementary when its consumption is complementary to that of the good. On the other hand,advertising is informative when it affects the consumers’ knowledge, or perceptions, of the
12In principle, we regard the social network as a graph more general than the one generated only by those linksfacilitated by the service provider. The social network could include the links provided by the monopolist,links provided by other firms of different industries, and both formal and informal existing links such asthose of working relations, family, or friendship.
13Assuming that the valuations of the good are uniformly distributed simplifies the analysis and the expositionof the results. The main results, though, follow qualitatively under more general specifications of how thesevaluations are distributed.
8

good features. While the general effects of the three types of advertising are rather similar,in the sense that all of them affect the consumers’ tastes for the good, they are conceptuallydifferent and might lead to slightly different implications. In particular, persuasive and com-plementary advertising always raise individual demands14 whereas informative ads need notdo so since consumers might learn that their tastes are indeed not well suited to the goodcharacteristics.15
In this paper, we consider informative advertising and, therefore, the role of advertising isto influence the consumers’ knowledge of their own tastes for the good. The monopolist’sadvertising strategy has two dimensions: an advertising level and an informative degree of ad-vertising. Choosing the advertising level is costly to the firm and it determines the valuationfor the good induced to the consumers when communication through ads is fully informa-tive. The informative degree of advertising is costless and it determines the quality of theinformation transmission through ads.16 Since this paper’s goal is to explore second-degreediscrimination with advertising, the analysis focuses on equilibria where the informative degreeis indeed fully informative. Therefore, for the class of equilibria that we explore, while freeversion adopters become completed persuaded that the product quality corresponds to thatwhich was (costly) selected by the firm, those consumers who instead purchase the premiumversion retain their own priors about the quality of the good.More specifically, the valuation of the good is uncertain to the consumers (as well as to
the monopolist) and, prior to his purchasing decision, each consumer i observes not the truevalue of ωi but some public signal or advertising level ωl ∈ (0, 1), which is selected by thefirm at a marginal cost cω. Here, ωl can be interpreted as the public observation of someposted information about the good quality, such as the one obtained from a commercial, amarketing sample, or from some other selling activity. More formally, ωl is the valuation of thegood that the firm induces to any consumer when it transmits credibly, without any noise, theinformation conveyed by its ads. In addition to the advertising level, the monopolist choosesan informative degree a ∈ [0, 1] for its advertising activity. The mechanism through whichconsumers update their initial beliefs is very simple. The advertising level and the informativedegree are related to the consumers’ valuations of the good according to the rule: ωl = ω,with probability a, and ωl is an independent draw from U [0, 1], with probability 1− a. Then,
14In some of the pioneering models of the complementary advertising view, such as Stigler & Becker (1977)and Becker & Murphy (1993), the final effects on demand are ambiguous. The reason behind this, however,lies not in the consumers preferences for the good but in the fact that these models usually incorporatesome costs to the consumers from their exposition to the ads. We incorporate this type of costs as well inthe current paper to propose the second-degree discrimination scheme.
15In principle nothing prevents that, after receiving the ads, the consumers’ final valuations of the good mayfall short of their initial expectations.
16While the advertising level summarizes the quality of the product that the firm wishes to transmit to theaudience, the informative degree determines the quality of the channels through which such an image ofthe product is transmitted. For example, the firm can decide, on the one hand, about hiring one or anotherpublic figure to serve as commercial ambassador of its good and, on the other hand, it must choose thedesign of its advertisements, which affects the way in which the intended message is communicated.
9

each consumer i obtains the posterior expectation of his valuation for the good by applyingBayes rule:
E[ωi |ωl] = aωl + (1− a)(1/2). (1)
Higher values of a indicate more informative advertising. If a = 1, the consumers believethat the advertised level ωl is their actual valuation for the good. If a = 0, the consumersobtain no information whatsoever from the advertising activity and retain their priors. Thisformulation builds on the settings proposed by Lewis & Sappington (1994) and Johnson &Myatt (2006) to analyze informative advertising. In their approaches, though, the advertisinglevel ωl is exogenously taken whereas this paper assumes that the firm is able to choose it ata cost. In short, a describes the informative quality of the firm’s advertising activity and ωlrepresents the valuation of the good that the firm induces on the consumers when advertisingis completely informative.Finally, we assume that exposition to advertising generates a relatively small cost to the
consumers. As mentioned in footnote 14, such type of costs from exposition to advertisinghave been commonly considered by the literature on advertising. We use ψ(a) to describe thecost to any consumer from his exposing to an advertising activity with informative degree a.We assume that ψ(0) = 0 and that ψ(a) increases in a ∈ [0, 1]. This captures the idea thatmore informative advertising is associated to higher quantities of ads received by the consumerand, therefore, to higher costs from exposition. In this paper, we will assume arbitrarily smallcosts to the consumers from their exposition to ads to ensure that all consumers adopt oneversion of the service or the other.
2.2 The Strategies of the Firm and the Consumers
The monopolist and the consumers are engaged in a two-stage game. In the first stage, themonopolist chooses a price p ≥ 0 for the premium of the service, a price P ≥ 0 for the good,an advertising level ωl ∈ (0, 1), and an informative degree a ∈ [0, 1] for the advertising of thegood, which it gives away through the free version of the service. In the second stage, theconsumers observe the choices (p, P, ωl, a) made by the monopolist and then make simultaneousconsumption decisions about the service and the good
(z0, za, x, y
). Here, z0 indicates the
probability that a premium version adopter purchases the good and za, for a ∈ (0, 1], standsfor the probability that a free version adopter (who receives ads according to some positiveinformative degree a) purchases the good. Also, each consumer i chooses a vector (xi, yi) ∈W =
{[0, 1]2 : 0 ≤ xi + yi ≤ 1
}, where xi and yi indicate, respectively, the probabilities that i
adopts the free and the premium version of the service. Therefore, x = λ({i ∈ [0, 1] : xi = 1})and y = λ({i ∈ [0, 1] : yi = 1}) indicate the sizes (with respect to Lebesgue measure) of thesets of consumers who, respectively, adopt the free and the premium version of the service.To focus on situations where each consumer always wishes to adopt some version of the
service, Assumption 1 will restrict our set of equilibria to situations where all consumers
10

at least want to adopt the free version of the service. Given this, we will then explore theconditions under which some consumers prefer the premium version to the free version.
2.3 The Social Network
The underlying social network is exogenously given and undirected. To capture the uncer-tainty that the monopolist and the consumers have about the architecture of the (large andcomplex) social network, we assume that it is stochastically generated. The monopolist andthe consumers are uncertain about the complete configuration of the social network but theycommonly known the stochastic process that generates it. All consumers have a (common) setof possible neighbors B = ∆([0, 1]) in the network so that a neighborhood Bi ∈ B for consumeri is simply a Borel set in the overall set of consumers [0, 1]. Accordingly, all consumers havea set n ∈ N = [n, n] ⊆ R+ of possible neighborhood sizes, or degrees in the social network.In principle, the set N could be unbounded as well and, in particular, n is allowed to tendto infinity in applications. The degree distribution of the social network is given by a twicecontinuously differentiable distribution F (n), with a strictly positive density f(n) over thesupport [n, n]. Thus, the degree of a fraction F (n) =
∫ nn f(m)dm of consumers exceeds not n.
We make use of the canonical configuration model to formalize how the random graph isgenerated.17 The idea here is that each consumer i with degree ni gets randomly linked toa set of size ni of other consumers according to a weighted uniform distribution where theweights are determined by the corresponding degrees nj of the consumers in the remainingsample. Therefore, if i gets linked with j, then the density according to which consumer j hasanother n neighbors is
h(n) =f(n)n∫ n
n mf(m)dm.
Let x(n) = λ({i ∈ [0, 1] : xi = 1 |ni = n}) and y(n) = λ({i ∈ [0, 1] : yi = 1 |ni = n}) denotethe fraction of consumers that, respectively, adopt the free and the premium version of theservice, conditioned on their degrees being equal to n. The expected consumption of consumeri’s neighbors can then be obtained as∫
j∈BiE[xj + yj |nj = n]h(n)dn = ni
∫ n
n[x(n) + y(n)]h(n)dn = niK,
where
K =
∫ nn n[x(n) + y(n)]f(n)dn∫ n
n nf(n)dn∈ [0, 1] (2)
17The configuration model was originally developed by Bender & Canfield (1978) and, since then, has beenextensively used in a number models with random graphs, such as Bollobás (2001), Newman et al. (2001),Jackson & Yariv (2007), Fainmesser & Galeotti (2016), and Shin (2016), among many others. A nicediscussion of the configuration model, and of its relation with other random graph models, is provided byJackson (2008).
11

is the expected consumption of any neighbor in the social network under the degree distributiondescribed by F and f .
Finally, we will make use of the degree independence assumption, in order to guarantee thatthe only relevant information about the network for each consumer is his degree.18
Using the previous observations, we then specify the expected utility to consumer i, giventhe monopolist’s choices (P, p, ωl, a), as
Ui(x, y, za
)= xi
[θi − ψ(a) + γxniK
]+ yi
[θi − p+ γyniK
]+ za
[E[ωi |ωl]− P
], (3)
where the parameters γx, γy > 0 describe the presence of local (positive) network externalities.A consumer’s utility raises by an amount γx, when he adopts the free version of the service, orby an amount γy, when he adopts the premium version, for each unit of the service consumedby his neighbors, regardless of the version that the neighbors adopt. We assume that γy > γx,which can be viewed formally as a single crossing condition for the two types of service adopterswhere the network externality to the premium version adopters exceeds that of the free versionadopters. This assumption captures the idea that the premium version allows consumers toenjoy the externalities of the service to a greater extent than in the case of the free version. Thisseems to be the case in most real-world services that are provided through social networks withboth a free and a premium version. The existence of equilibria in our model where networkexternalities matter is only guaranteed if the degree of the externality varies across the twoversions of the service. In the sequel, we will use β = γy − γx > 0 to denote the discrepancybetween the network externalities or the externality premium.
2.4 The Hazard Rate Function Associated with the Random Network
We now describe an indicator that can be used to measure interesting features of the randomsocial network. The hazard rate function of the random social network with distribution degreeF is the function on [n, n] defined as
r(n) =f(n)
1− F (n).
Intuitively, the function r(n) gives us the probability that a randomly selected consumer hasapproximately n links,19 conditioned on his actual neighborhood size being no less than n.The hazard rate function becomes a very interesting indicator of the degree distribution ifwe interpret the social network as a collection of neighborhood sizes that evolve dynamicallyaccording to some stochastic law. To grasp better the intuition here, suppose that the firm’s
18The degree independence assumption states that the nodes of the network regard their shared links asindependently chosen from the random network. This is a quite common assumption in the literature onrandom networks and has been used, among others, by Jackson & Yariv (2007), Galeotti et al. (2010),Fainmesser & Galeotti (2016), and Shin (2016).
19For our continuous distribution case, a number of links in the interval (n − ε, n + ε), for ε > 0 sufficientlysmall.
12
records indicate that, up to a certain period t, there are no neighborhoods in the social networkof size less than some minimum level n. Then, r(n) can be interpreted as the odds that, ina subsequent period t + 1, consumers have a number of links approximately equal to sucha former lower bound n. Therefore, using this dynamic interpretation, an increasing hazardrate indicates that if the average neighborhood size increases over time, then it becomes verylikely to have a reversal in this growing tendency because at each t+1 consumers tend to havea number of neighbors around the minimum size that was already achieved in the previousperiod t. Decreasing hazard rates imply higher probabilities that in the future consumers haveneighborhood sizes that diverge from the current minimum size making it more likely that thenetwork maintains its minimum neighborhood size as it grows.Those intuitive implications have recently received quite appealing formal microeconomic
foundations by Shin (2016). Under the assumptions on the random network generating processused in our model, Shin (2016) (Proposition 2) shows that increasing hazard rates follow ifand only if a node is less likely to form additional new links as his degree increases. On theother hand, with decreasing hazard rates, the degree of a randomly chosen node in the networkbecomes arbitrarily large as the average neighborhood size increases (Shin (2016), Proposition3).Both the degree distribution and the hazard rate function are very useful to establish rela-
tions between different random social networks.
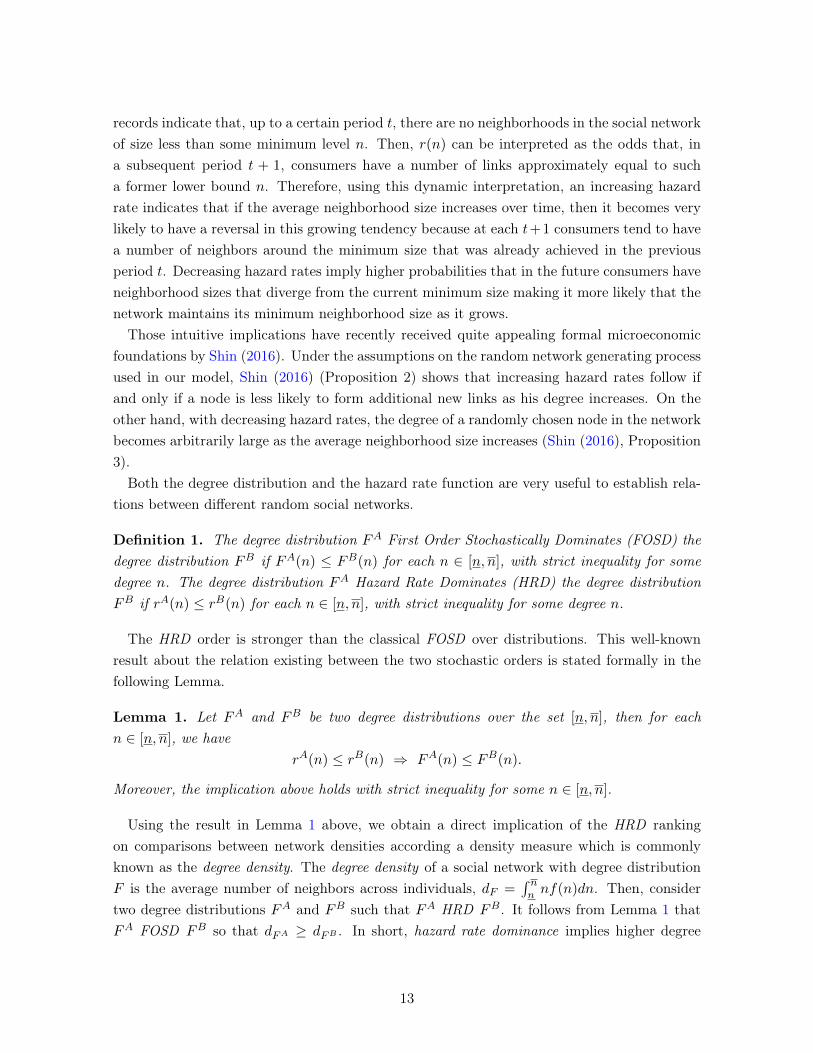
Definition 1. The degree distribution FA First Order Stochastically Dominates (FOSD) thedegree distribution FB if FA(n) ≤ FB(n) for each n ∈ [n, n], with strict inequality for somedegree n. The degree distribution FA Hazard Rate Dominates (HRD) the degree distributionFB if rA(n) ≤ rB(n) for each n ∈ [n, n], with strict inequality for some degree n.
The HRD order is stronger than the classical FOSD over distributions. This well-knownresult about the relation existing between the two stochastic orders is stated formally in thefollowing Lemma.
Lemma 1. Let FA and FB be two degree distributions over the set [n, n], then for eachn ∈ [n, n], we have
rA(n) ≤ rB(n) ⇒ FA(n) ≤ FB(n).
Moreover, the implication above holds with strict inequality for some n ∈ [n, n].
Using the result in Lemma 1 above, we obtain a direct implication of the HRD rankingon comparisons between network densities according a density measure which is commonlyknown as the degree density. The degree density of a social network with degree distributionF is the average number of neighbors across individuals, dF =
∫ nn nf(n)dn. Then, consider
two degree distributions FA and FB such that FA HRD FB. It follows from Lemma 1 thatFA FOSD FB so that dFA ≥ dFB . In short, hazard rate dominance implies higher degree
13

density of the random network.We will consider the consumers’ cost from exposition to ads ψ > 0 as a fixed primitive of the
model. In some parts of the paper we will make use of the transformation Fβ(p) = F(p−ψβ
)for p ∈ [βn+ ψ, βn+ ψ], for each size of the externality premium β > 0. Accordingly, we willalso use the transformations fβ(p) =
(1β
)f(p−ψβ
)and
rβ(p) =
(1
β
)r
(p− ψβ
)=
fβ(p)
1− Fβ(p).
These transformations allow us to relate changes in the price of the service with the degreedistribution. If rβ(p) increases with p, this conveys the intuitive message of a large jointprobability of having relatively high prices for the service and, at the same time, that consumersform fewer new links. A decreasing rβ(p) indicates that, as the price rises, consumers becomemore likely to form new links. As a consequence, the amount of premium version adoptersthat switch to the free version following a price raise is relatively smaller when hazard rates aredecreasing, compared to the case of increasing hazard rates. Under decreasing hazard rates,premium version adopters expect to have more neighbors in the future and benefit to a largerextent from the premium externality. In contrast, with increasing hazard rates, premiumversion adopters believe that their numbers of neighbours and, therefore, their benefits fromthe premium externality, will decrease.
3 Preliminaries: Optimal Decisions
We restrict attention to pure-strategy perfect-Bayes Nash equilibria of the game described.Furthermore, our analysis focuses on equilibria where consumers always adopt some versionof the service so that x∗ + y∗ = 1 in equilibrium. To do this, we assume that the cost fromexposing to ads satisfy the following condition with respect to the valuation of the service, thenetwork externality from the free version, and the support of the degree distribution.
Assumption 1. The cost of exposition to ads ψ satisfies ψ ≤ θ + γxnε for some arbitraryε > 0.
Assumption 1 above requires that the cost from exposing to ads be not excessively high sothat, starting from some arbitrary aggregate consumption of the service x(n) + y(n) ≥ ε > 0
for each neighborhood size n ∈ [n, n] (i.e., an aggregate consumption uniformly bounded frombelow across degrees by some, possibly negligible, ε > 0), the net valuation of the premiumversion of the service of each consumer is strictly positive. Notice from the expression in(2) that Assumption 1 implies that K∗ = 1. This is very intuitive: if all consumers adoptsome version of the service for each of their possible degrees (i.e., x∗(n) + y∗(n) = 1 for eachn ∈ [n, n]), then expected service consumption of a consumer i’s neighbor is precisely the sizeof his neighborhood, regardless of the degree distribution of the network.
14

The remaining of this section describes some optimal choices by the firm and the consumersin equilibrium.
3.1 The Firm’s Optimal Decisions
We first analyze the optimal choices of the firm on advertising. Regarding the informativedegree of advertising, the monopolist wishes to choose some a∗ ∈ [0, 1] so as to maximize itsprofits from the sales of the good. The information that the consumers obtain about their ownvaluation of the good depends on whether they adopt or not the free version of the service andon the optimal choice of the firm regarding advertising. This, in turn, influences the optimalprice P that the firm sets for the good.
For any information level a ∈ [0, 1], let z∗a denote the fraction of consumers who decide topurchase the good in equilibrium and let P ∗a denote the price of the good that the firm wouldoptimally set conditioned on a. Although we are conditioning the optimal price of the good onthe informative degree a, this paper does not consider price discrimination through the priceP of the good and, therefore, the firm is not allowed to set a price P ∗a as a function of a. Asa consequence, the firm will ultimately choose its optimal price P ∗ by averaging according tothe proportions of consumers who receive different information levels a. The price of the goodmust satisfy E[ω |ωl] ≥ P so that the monopolist optimally chooses P ∗ = E[ω |ωl]. Then, forany information level a ∈ (0, 1] and price P ∗a , the fraction of consumers who decide to purchasethe good is
z∗a = P(E[ω |ωl] ≥ P ∗a
)= P
(aωl + (1− a)(1/2) ≥ P ∗a
)=aω + (1− a)(1/2)− P ∗a
a,
since, ex-ante, ωl is uniformly distributed on the interval [0, 1]. Then, by substituting theoptimal price P ∗a = aωl + (1− a)(1/2) in the expression above, we obtain z∗a = ω−ωl
ω−ω for eacha ∈ (0, 1]. On the other hand, for the extreme situation a = 0, it follows from the assumptionthat ω is uniformly distributed on the interval [0, 1] that z∗0 = 1/2 with P ∗0 = 1/2.Since our goal in this paper is to study second-degree discrimination where some consumers
may avoid paying a price for the service by receiving ads instead, we assume that the monop-olist is restricted to choosing a positive informative degree a > 0. Otherwise, no consumerwould receive any information whatsoever from ads and there would be no second-degree dis-crimination by construction. Then, for a ∈ (0, 1], the monopolist’s profits from the sales ofthe good to the adopters of the free version of the service are given by
π(a, ωl) =[aωl + (1− a)(1/2)− cz
](1− ωl)− cωωl. (4)
These profits are concave in ωl and the first order condition with respect to ωl yields theoptimal advertising level
ω∗l =a− (1− a)(1/2) + cz − cω
2a.
15
In addition, the function π(a, ωl) above is linear, and hence convex, in a. Therefore, byconsidering a = 1 in the expression above, we observe that if the inequality
ω∗l =1 + cz − cω
2>
1
2(5)
is satisfied, then profits are maximized at a∗ = 1 for the case where the informative degree a isallowed to vary within the interval (0, 1]. The implication that, with informative advertising,the monopolist optimally wishes to choose either completely uninformative or fully informativeadvertising is now a well-known result in the advertising literature.20 Thus, under the conditionstated in (5), the only case where the monopolist discriminates across consumers throughadvertising is when it chooses a∗ = 1. Otherwise, no consumer receives any ads whatsoever,regardless of their choices with respect to the service version. Let us refer to equilibria wherethe monopolist optimally chooses a∗ = 1 as discriminatory equilibria. Given our researchquestions, we will restrict attention only to discriminatory equilibria. We will also impose afurther condition on costs to ensure that the firm always makes nonnegative profits from itssales of the product. Given the particular distribution for the valuations of the good that weconsider, it can be directly verified from the previous arguments that while condition (i) ofthe following assumption ensures that ω∗l ∈ (0, 1) and, at the same time, that the condition in(5) holds, condition (ii) is sufficient to guarantee that P ∗a ≥ cz for each a ∈ [0, 1].
Assumption 2. The marginal costs of producing the good and of choosing the advertisinglevel, cz and cω, satisfy:(i) 0 < cz − cω < 1 and(ii) cz ≤ 1/2.
We emphasize that our focus on discriminatory equilibria necessarily implies that the optimaladvertising level set by the firm must be higher than the consumers’ prior, i.e., ω∗l ∈ (1/2, 1)
in any discriminatory equilibrium. Finally (perhaps with some abuse of notation), throughoutthe remaining of the paper, let us simply denote by ψ = ψ(1) the cost from exposition toadvertising which is associated to the fully informative advertising degree.
4 Main Results
In order to analyze the optimal price that the firm sets for the good, let us use y∗(p) to indicatethe equilibrium size of the set of premium version adopters as a function of the price p chosen
20In fact, the function π(a, ωl) in (4) above falls into the class of profit functions analyzed by Lewis & Sap-pington (1994) and Johnson & Myatt (2006) for informative advertising. In particular, Lewis & Sappington(1994) (Propositions 1 and 2) and Johnson & Myatt (2006) (Proposition 4) show that, even for more gen-eral production costs, the type of profit functions that we are analyzing in this paper turn out to be themaximum of convex functions so that they are themselves convex with respect to a ∈ [0, 1]. Therefore,the monopolist optimally chooses either a∗ = 0 or a∗ = 1. This is a well-known result in the advertisingliterature with the interpretation that the monopolist wishes to target either a “niche” or a “mass” market.
16

by the monopolist for the (premium version of) the service. Given the optimal choices bythe consumers on service adoption, and the optimal choice (in the discriminatory equilibrium)a∗ = 1 by the firm, the optimal price for the good must satisfy
P ∗ = y∗(p)P ∗0 + [1− y∗(p)]P ∗1= y∗(p)(1/2) + [1− y∗(p)]ω∗l= ω∗l − (ω∗l − 1/2)y∗(p).
Recall that we are considering that the firm does not discriminate between the service adoptersby charging them different prices for the good. This is consistent with the fact that thegood and the service are totally unrelated products and, therefore, with the more generalinterpretation of our model where the good be provided instead by a different firm. For thediscriminatory equilibrium, the fraction of consumers who buy the good is given by
z∗ = y∗(p)z∗0 +[1− y∗(p)
]z∗1
= y∗(p)(1/2) +[1− y∗(p)
](1− ω∗l )
= (1− ω∗l ) + (ω∗l − 1/2) y∗(p).
Therefore, the monopolist’s profits as a function of the price that it sets for the service aregiven by Π(p) = Π1(p) + Π2(p), where
Π1(p) = (P ∗ − cz)z∗ − cωω∗l= [(ω∗l − cz)− (ω∗l − 1/2)y∗(p)] · [(1− ω∗l ) + (ω∗l − 1/2) y∗(p)]− cωω∗l
(6)
are the firm’s profits from its sales of the good to both types of service adopters and Π2(p) =
py∗(p) are the firm’s profits from its sales of the service to the service adopters. In particular,notice that the total profits of the firm can be expressed as a quadratic expression with respectto the proportion of premium version adopters. In particular,
Π(p) =(ω∗l − cz)(1− ω∗l )− cωω∗l+[p+ (2ω∗l − 1− cz)(ω∗l − 1/2)
]y∗(p)− (ω∗l − 1/2)2
[y∗(p)
]2.
Finally, by using the expression obtained earlier for the optimal advertising level in a discrim-inatory equilibria, we obtain the following expression for the firm’s profits.
Π(p) =(1− cz)2 + c2
ω − 2cω(1 + cz)
4+
[p− cω(cz − cω)
2
]y∗(p)− (cz − cω)2
4
[y∗(p)
]2. (7)
The following Proposition characterizes (interior) equilibria where both version of the serviceare adopted.
Proposition 1. Suppose that Assumptions 1 and 2 hold. Then, in any discriminatory equi-librium with adopters of the premium version of the service, i.e., where y∗(p∗) > 0 and
17

p∗ > ψ > 0, it follows that: (i) the firm chooses its advertising level as a function of itsproduction and advertising costs,
ω∗l =1 + cz − cω
2, (8)
(ii) the firm chooses the price of (the premium version of) the service as a function of thepremium externality, the cost to the consumers from the exposition to ads, the production andadvertising costs, and the degree distribution of the social network,
rβ(p∗)
[p∗ − cz(cz − cω)
2+
(cz − cω)2
2Fβ(p∗)
]= 1, (9)
provided that the second order condition
r′β(p∗)[rβ(p∗)
]2 +
[1 +
(cz − cω)2
2fβ(p∗)
]≥ 0,
holds, (iii) the consumers choose which version of the service as a function of its price and thedegree distribution,
y∗(p∗) = 1− Fβ(p∗), (10)
and (iv) the firm chooses the price of the good according to
P ∗ =1 + (cz − cω)Fβ(p∗)
2. (11)
Condition (ii) of Proposition 1 above gives us the key requirement that characterizes anyinterior optimal price for the service p∗ > ψ. Yet, note that the support of the degree distri-bution may impose additional constraints on such a price. In particular, since n ∈ [n, n], theoptimal price must also satisfy the condition
βn+ ψ ≤ p∗ ≤ βn+ ψ. (12)
Thus, these constraints allow for the possibility of obtaining corner solutions, which are relatedto the support of the degree distribution. Intuitively, when the corner solution p∗ = βn+ψ isobtained, the firm would like to provide the service to neighboorhoods whose size be smallerthan the actual minimum size. In this case, by using the expression in (10) for the equilibriumproportion of the premium version adopters, we observe that the firm would like to achievey∗(p∗) = 1 or, in other words, to provide only the premium version of the service. Theanalogous intuitive interpretation follows for the case where the corner solution p∗ = βn + ψ
is obtained. In this case, the firm would like to provide the service to neighborhoods whosesize be larger than the maximum size actually available in the social network and it wouldlike to achieve y∗(p∗) = 0, so that only the free version with ads would be served. In addition,if we allow n to tend to infinity, then the situation where the firm optimally wishes to serveonly the free version arises if the firm’s profits are always increasing in p. Of course, studyingwhether or not any of these types of solutions follow in particular applications either when
18

the condition in (12) is not satisfied or when p∗ → +∞ requires us to study the entire shapeof the the corresponding profit function Π(p) in the interval [βn+ ψ, βn+ ψ].A raise in the price p that the monopolist sets for the service generates the following effects
on its total profits:
1. Higher price p changes the profits from the service sales Π2(p) = py∗(p). The directionof this change depends on the shape of the degree distribution of the social network. Inparticular, an infinitesimal increase in p raises locally the profits from the service salesif and only if rβ(p) < 1/p.
2. Higher price p always raises the optimal price P ∗ =1+(cz−cω)Fβ(p∗)
2 that the monopolistsets for the good.
3. Higher price p lowers the fraction y∗(p) of consumers who adopt the premium version ofthe service and, therefore, it lowers the fraction
z∗ =
(1− cz + cω
2
)+
(cz − cω
2
)y∗(p)
of consumers who purchase the good.
The result of the combination of the effects enumerated above is not obvious in general.The following straightforward corollary gives us the conditions that characterize the sign ofthe derivative dΠ(p)/dp.
Corollary 1. Suppose that Assumptions 1 and 2 hold. Then, for each price p of the servicesuch that y∗(p) > 0 and p > ψ > 0, it follows that dΠ(p)/dp > 0 if and only if the condition
rβ(p)
[p− cz(cz − cω)
2+
(cz − cω)2
2Fβ(p)
]< 1
is satisfied.
Notice that the existence of a solution p∗ where the monopolist wishes to serve only the freeversion of the service always follows when the condition stated in Corollary 1 is satisfied for eachp ∈ (βn+ψ, βn+ψ). This solution can either take the form of a corner solution p∗ = βn+ψ, ifwe consider a finite maximum neighborhood size, or of an indeterminate explosive price, if weallow n → +∞. We observe that, other things equal, decreasing hazard rates make it easierfor condition in Corollary 1 to be met, compared to the case of increasing hazard rates. Thistype of solutions describes a situation where the monopolist is mainly interested in makingprofits only through advertising. Recently, many firms (such as Twitter, YouTube, Facebook,or Google, just to mention a few of the most prominent ones) had adhered to this secondscenario. Such firms regard potential expansions of the social network as beneficial for theirbusinesses because they allow them to increase considerably its audience for advertisements.
19

Interestingly, many empirical studies suggest that decreasing hazard rates are present in mostreal-world complex and relatively sparse social networks (see, e.g., Barabási & Albert (1999),Clauset et al. (2009), Stephen & Toubia (2009) or Ugander et al. (2011)). Finally, given that weare considering a fairly general class of degree distributions, we are not able to obtain sufficientconditions under which the monopolist always wishes to serve only the free version. For degreedistributions with monotone decreasing hazard rates, we discuss in Section 6 necessary andsufficient conditions under which this type of equilibria is obtained.The following proposition establishes that an increase of the premium externality size β
always leads to an increase of the optimal price p∗. This is very intuitive since premiumversion adopters always benefit from higher premium externalities so that they are willing topay higher prices when the premium externality raises.
Proposition 2. Suppose that Assumptions 1 and 2 hold. Then, in any discriminatory equi-librium with adopters of the premium version of the service, i.e., where y∗(p∗) > 0 andp∗ > ψ > 0, it follows ∂p∗/∂β ≥ 0.
We turn now to explore the implications on the optimal service price p∗ of a decrease in theadvertising cost cω. As can be directly observed from (8), lower advertising costs lead to higheroptimal levels of advertising in our model. While this is very intuitive, it is less clear whetherinducing higher valuations of the good to the consumers who purchase the free version willultimately lead to higher prices for the premium version or not. Other things equal, raisingthe price of the service may lower profits due to a reduction in the service sales to the premiumversion adopters. As indicated earlier, this will be the case when rβ(p∗) > 1/p∗. However,raising the price of the service also increases the proportion of the free version adopters, whichraises the profits from the good sales. In particular, notice from the expression in (6) that
∂Π1
∂y∗= (ω∗l − 1/2)
[(cz − cω)[1− y∗]− cz
]< 0 ∀ y∗ ∈ [0, 1].
In words, lower proportions of premium version adopters (and, hence, higher proportions offree version adopters) always raise the profits from the good sales. Nevertheless, this raise inprofits is not always increasing with the optimal adverting level. From the expression in (6),it can be verified that
∂2Π1
∂y∗∂ω∗l= (2ω∗l − 1)
[1− cz − 2y∗
]< 0 ⇔ y∗ >
1− cz2
,
so that we need that the current proportion of premium version adopters be sufficiently high inorder to obtain a positive second order effect on the profits from the good sales. The followingproposition gives us the condition on the current proportion of service adopters under whichthe positive effect on the good sales dominates the effect on the service sales.
Proposition 3. Suppose that Assumptions 1 and 2 hold. Then, in any discriminatory equi-librium with adopters of the premium version of the service, i.e., where y∗(p∗) > 0 and
20

p∗ > ψ > 0, an increase of the optimal advertising level leads (locally) to an increase ofthe optimal service price if and only if the condition
Fβ(p∗) ≥ cz2(cz − cω)
is satisfied at equilibrium.
In intuitive terms, we observe that, when advertising becomes less costly, raising the priceof the service will be profitable for the firm if the social network has already allowed for alarge enough proportion of free version adopters at the current price.We now explore the central issue of how the random network structure influences the price
p∗ that the monopolist sets for the service. The HRD ranking between distributions plays acrucial role in our model to determine the relations that may exist between the prices that themonopolist sets for the service for two different random networks.
Proposition 4. Suppose that Assumptions 1 and 2 are satisfied. Consider two degree distri-butions FA and FB over [n, n] such that FA HRD FB. Suppose that the cost from expositionto advertising ψ and the premium externality β remain fixed across the two random networks.Let p∗A and p∗B be equilibrium prices for the service under the degree distributions FA and FB,respectively, such that p∗A, p
∗B ∈ (βn + ψ, βn + ψ). Consider the cutoff price of the service p̂
specified by rBβ (p̂) = rAβ (p∗A). Then,
(i) if both hazard rate functions rAβ and rBβ are (weakly) decreasing in [βn+ ψ, βn+ ψ], theequilibrium prices p∗A and p∗B can satisfy either (a) p∗A < p̂ ≤ p∗B, if the cutoff price p̂ exists inthe interval (p∗A, βn+ ψ), or (b) p∗A ≥ p∗B, regardless of the cutoff price p̂.
(ii) if both hazard rate functions rAβ and rBβ are (weakly) increasing in [βn+ψ, βn+ψ], theequilibrium prices p∗A and p∗B must always satisfy p∗A ≥ p∗B.
While the HRD criterion remains ambiguous as to the relation between equilibrium priceswhen hazard rates are decreasing, it does provide a clear-cut condition when hazard rates areincreasing. For social networks which feature increasing hazard rates, hazard rate dominanceimplies, other things equal, higher equilibrium prices for the service.If a degree distribution FA HRD another FB, it follows that rAβ (p−ψβ ) ≤ rBβ (p−ψβ ) for each
p ∈ [βn+ ψ, βn+ ψ]. The intuitive implication of this inequality is that, for each fixed pricep of the service, the probability that a randomly chosen consumer enjoys in the future moreneighbours than its current degree is higher under FA than under FB. Therefore, other thingsequal, premium version adopters are more willing to accept an increase in the service priceunder FA than under FB. Furthermore, when both hazard rates rAβ and rBβ are increasing, araise in the price p makes it more likely for consumers, both under FA and FB, to have fewerlinks in the future so that moving along the graphs of rAβ and rBβ does not make consumers
21
rβA
rβB
p
p
rβ
pA*
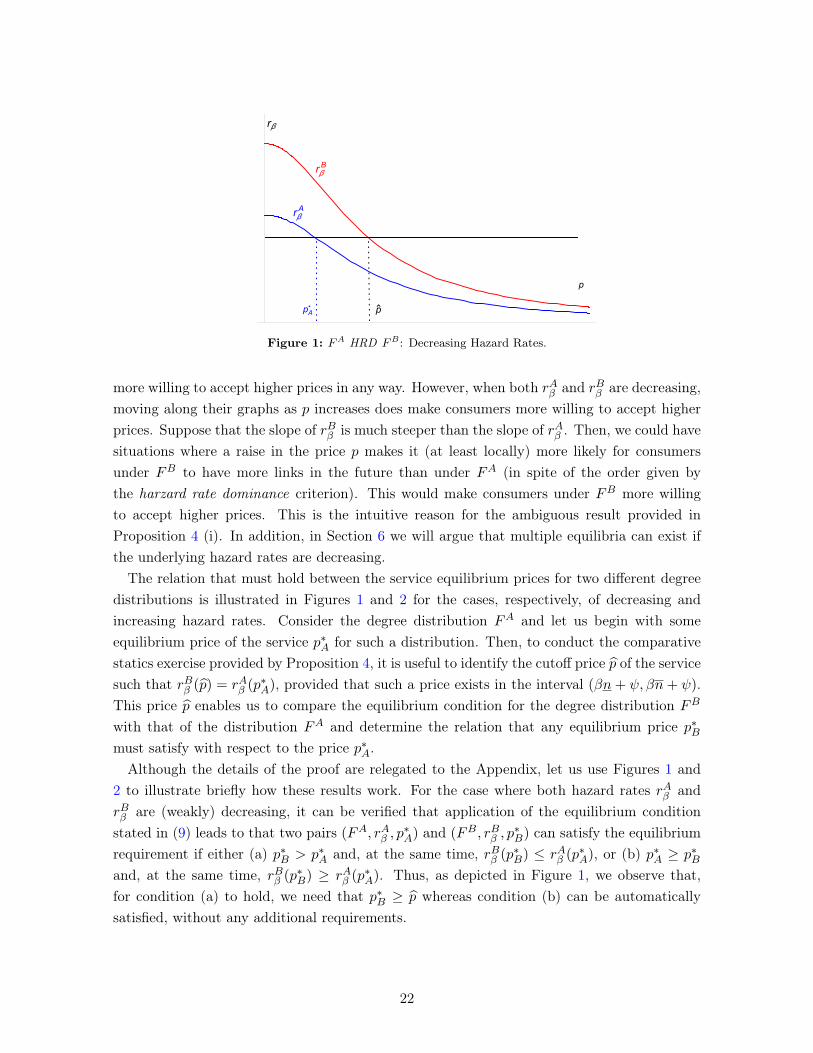
Figure 1: FA HRD FB : Decreasing Hazard Rates.
more willing to accept higher prices in any way. However, when both rAβ and rBβ are decreasing,moving along their graphs as p increases does make consumers more willing to accept higherprices. Suppose that the slope of rBβ is much steeper than the slope of rAβ . Then, we could havesituations where a raise in the price p makes it (at least locally) more likely for consumersunder FB to have more links in the future than under FA (in spite of the order given bythe harzard rate dominance criterion). This would make consumers under FB more willingto accept higher prices. This is the intuitive reason for the ambiguous result provided inProposition 4 (i). In addition, in Section 6 we will argue that multiple equilibria can exist ifthe underlying hazard rates are decreasing.The relation that must hold between the service equilibrium prices for two different degree
distributions is illustrated in Figures 1 and 2 for the cases, respectively, of decreasing andincreasing hazard rates. Consider the degree distribution FA and let us begin with someequilibrium price of the service p∗A for such a distribution. Then, to conduct the comparativestatics exercise provided by Proposition 4, it is useful to identify the cutoff price p̂ of the servicesuch that rBβ (p̂) = rAβ (p∗A), provided that such a price exists in the interval (βn+ ψ, βn+ ψ).This price p̂ enables us to compare the equilibrium condition for the degree distribution FB
with that of the distribution FA and determine the relation that any equilibrium price p∗Bmust satisfy with respect to the price p∗A.
Although the details of the proof are relegated to the Appendix, let us use Figures 1 and2 to illustrate briefly how these results work. For the case where both hazard rates rAβ andrBβ are (weakly) decreasing, it can be verified that application of the equilibrium conditionstated in (9) leads to that two pairs (FA, rAβ , p
∗A) and (FB, rBβ , p
∗B) can satisfy the equilibrium
requirement if either (a) p∗B > p∗A and, at the same time, rBβ (p∗B) ≤ rAβ (p∗A), or (b) p∗A ≥ p∗Band, at the same time, rBβ (p∗B) ≥ rAβ (p∗A). Thus, as depicted in Figure 1, we observe that,for condition (a) to hold, we need that p∗B ≥ p̂ whereas condition (b) can be automaticallysatisfied, without any additional requirements.
22

p
rβArβ
B
rβ
pA*
p
Figure 2: FA HRD FB : Increasing Hazard Rates.
On the other hand, for the case where both hazard rates rAβ and rBβ are (weakly) increasing,it can be verified that application of the equilibrium condition stated in (9) leads to thattwo pairs (FA, rAβ , p
∗A) and (FB, rBβ , p
∗B) can satisfy the equilibrium requirement if either (a)
p∗A ≥ p∗B and, at the same time, rBβ (p∗B) ≥ rAβ (p∗A), or (b) p∗A ≥ p∗B and, at the same time,rBβ (p∗B) < rAβ (p∗A). From Figure 2, we observe that (a) can hold only if p̂ ≤ p∗B ≤ p∗A whereas(b) can hold if p∗B < p̂ ≤ p∗A.Finally, recall that if a degree distribution FA HRD another FB, then the random network
associated with FA has higher degree density than the network associated with FB. Thus,from the result in Proposition 4 (ii) above, we observe that, under HRD for the case ofincreasing hazard rates, higher price service is obtained alongside with higher degree density.
5 A Few Examples
As an antidote to the abstractness of our model, we now present some examples that makeuse of common degree distributions in the social networks literature. Our goal with theseexamples is to illustrate the monopolist’s optimal discrimination strategy, as well as to obtainintuitions about how our main results work.
Example 1 (Constant Hazard Rate: The Exponential Distribution). Suppose thatcω = 1/10 and cz = 5/10 so that Assumption 2 is satisfied. Consider the exponential distribu-tion given by
Fβ(p) = 1− eρ(
1+ψ−pβn
)for each p ≥ βn+ ψ,
where ρ > 0. The corresponding density and hazard rate function are
fβ(p) =
(ρ
βn
)eρ(
1+ψ−pβn
), rβ(p) =
ρ
βn.
The exponential degree distribution is often used to capture the formation of links according to
23

p* ≃ 0.593
π
1 2 3 4
-0.4
-0.2
0.2
0.4
Figure 3: Firm’s profits for the exponential degree distribution.
uniform randomness in growing random networks21 Since r′β(p) = 0, the second order conditionfor the equilibrium price of the service is trivially satisfied. Then, from the expression in (9),we obtain that the price that the firm sets for the service must satisfy the equality
100p∗ − 8eρ(
1+ψ−p∗βn
)=
2ρ+ 100βn
ρ. (13)
We further pick ρ = 1, n = 0.5, β = 1, and ψ = 0.05 so that Assumption 1 is satisfied. Then,using the equilibrium condition in (13), we obtain a unique equilibrium price p∗ ≈ 0.593 withoptimal profits Π(p∗) ≈ 0.482. In particular, the function Π(p) takes the form depicted inFigure 3.Finally, we would like to study the equilibrium prices obtained from two different exponential
degree distributions FAβ and FBβ , parameterized, respectively, by ρA and ρB such that ρA < ρB,so that FAβ HRD FBβ . From the results of Proposition 4, we should obtain p∗A ≥ p∗B. To verifythis result using this example, let us use B to denote the exponential distribution introducedabove so that ρB = 1 and p∗B ≈ 0.593. Now, consider another exponential distribution withρA = 1/2. For this second exponential distribution, we obtain that p∗A ≈ 1.068 with Π(p∗A) ≈0.6. The firm’s profit functions for these two exponential degree distributions are depicted inFigure 4.
Example 2 (Increasing Hazard Rate: The Erlang Distribution). As in the previousexample, suppose that cω = 1/10 and cz = 5/10. Consider the Erlang distribution given by
Fβ(p) = 1−(p− ψ + β
β
)e−(p−ψβ
)for each p ≥ ψ,
21See, e.g., Jackson (2008), Chapter 5, for an insightful description of the use of the exponential degreedistribution in growing random networks.
24
pA*
pB* 1 2 3 4
-0.4
-0.2
0.2
0.4
0.6
Figure 4: Firm’s profits for two different exponential degree distributions.
where ρ > 0. The corresponding density and hazard rate function are
fβ(p) =
(p− ψβ2
)e−(p−ψβ
), rβ(p) =
p− ψβ(p− ψ + β)
.
Since r′β(p) = 1β(p−ψ+β)2
> 0, the second order condition for the equilibrium price of the serviceis satisfied. Then, from the expression in (9), we obtain that the price that the firm sets forthe service must satisfy the equality
100p∗ − 8
(p∗ − ψ + β
β
)e−(p∗−ψβ
)=
100β(p∗ − ψ + β)
p∗ − ψ+ 2.
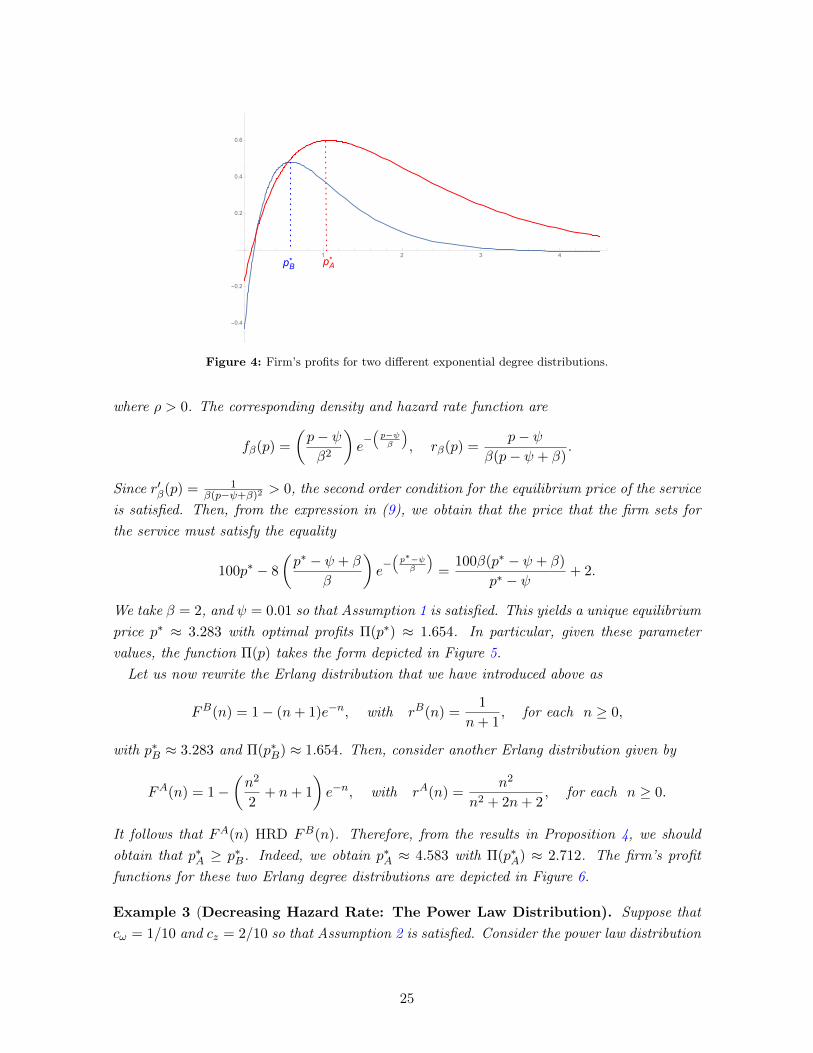
We take β = 2, and ψ = 0.01 so that Assumption 1 is satisfied. This yields a unique equilibriumprice p∗ ≈ 3.283 with optimal profits Π(p∗) ≈ 1.654. In particular, given these parametervalues, the function Π(p) takes the form depicted in Figure 5.Let us now rewrite the Erlang distribution that we have introduced above as
FB(n) = 1− (n+ 1)e−n, with rB(n) =1
n+ 1, for each n ≥ 0,
with p∗B ≈ 3.283 and Π(p∗B) ≈ 1.654. Then, consider another Erlang distribution given by
FA(n) = 1−(n2
2+ n+ 1
)e−n, with rA(n) =
n2
n2 + 2n+ 2, for each n ≥ 0.
It follows that FA(n) HRD FB(n). Therefore, from the results in Proposition 4, we shouldobtain that p∗A ≥ p∗B. Indeed, we obtain p∗A ≈ 4.583 with Π(p∗A) ≈ 2.712. The firm’s profitfunctions for these two Erlang degree distributions are depicted in Figure 6.
Example 3 (Decreasing Hazard Rate: The Power Law Distribution). Suppose thatcω = 1/10 and cz = 2/10 so that Assumption 2 is satisfied. Consider the power law distribution
25

p* ≃ 3.283
π
2 4 6 8 10
-1.0
-0.5
0.5
1.0
1.5
2.0
Figure 5: Firm’s profits for the Erlang degree distribution.
pA*pB
*2 4 6 8 10
-1
1
2
3
Figure 6: Firm’s profits for two different Erlang degree distributions.
26

pA* ≃ 0.0122
π
0.008 0.010 0.012 0.014
-0.10
-0.05
0.05
0.10
Figure 7: Firm’s profits for the power law degree distribution.
given by
Fβ(p) = 1−(
βn
p− ψ
)α−1
for each p ≥ βn+ ψ, where α > 1.
The corresponding density and hazard rate function are
fβ(p) =(α− 1)(βn)α−1
(p− ψ)α, rβ(p) =
α− 1
(p− ψ).
Although r′β(p) = −(α− 1)/(p− ψ)2 < 0 in this random social network, it can be checked thatthe second order condition for the equilibrium price of the service is satisfied, at least for somereasonable values of α. In particular, one obtains
r′β(p∗)[rβ(p∗)
]2 =α− 2
α− 1
so that, for α > 2, we can guarantee that the required second order condition always hold.Then, from the expression in (9), we obtain the following expression for the optimal price thatthe firm sets for the service
200p∗ −(
βn
p∗ − ψ
)α−1
− 200
(p∗ − ψα− 1
)= 1.
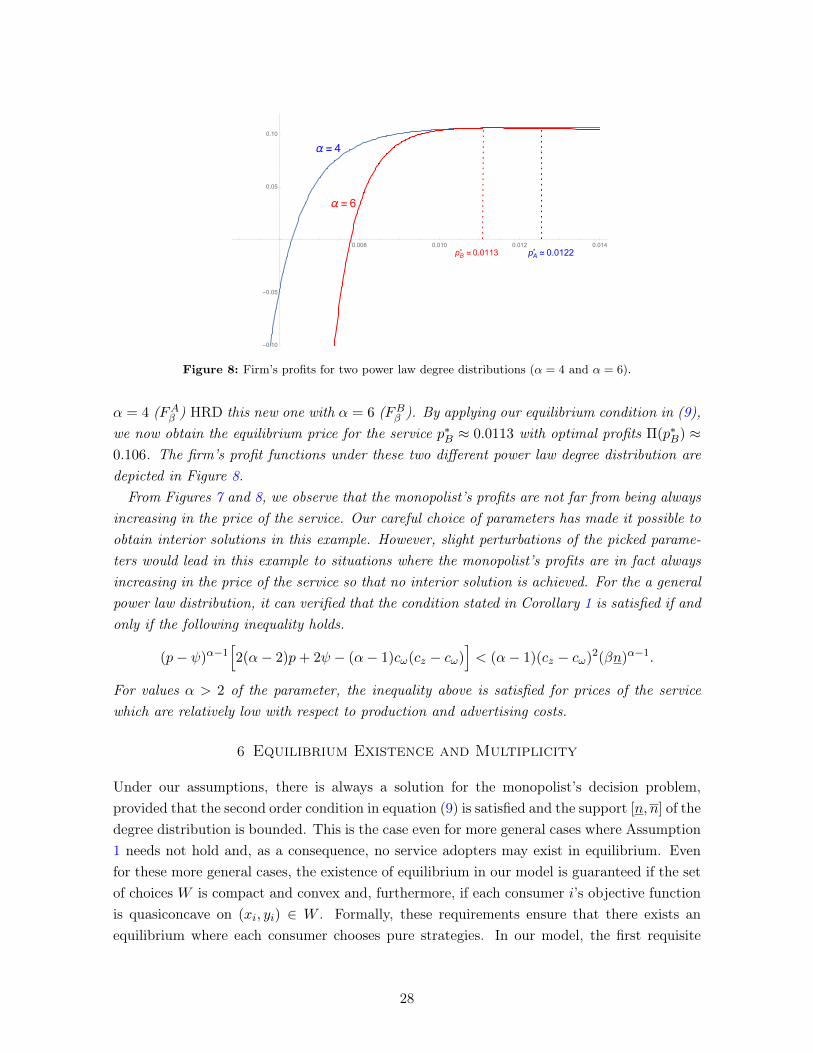
Consider n = 0.01, β = 1, and ψ = 0.001 so that Assumption 1 is satisfied. Furthermore,take α = 4 and denote by FAβ this particular power law distribution. Then, we obtain a uniqueequilibrium price p∗A ≈ 0.0122 with optimal profits Π(p∗A) ≈ 0.106. In particular, given theseparameter values, the function Π(p) takes the form depicted in Figure 7.Finally, consider another power law distribution where α = 6 and let us use FBβ to denote
this second distribution. It can be directly verified that the previous power law distribution with
27
α = 6
α = 4
pA* ≃ 0.0122pB
* ≃ 0.01130.008 0.010 0.012 0.014
-0.10
-0.05
0.05
0.10
Figure 8: Firm’s profits for two power law degree distributions (α = 4 and α = 6).
α = 4 (FAβ ) HRD this new one with α = 6 (FBβ ). By applying our equilibrium condition in (9),we now obtain the equilibrium price for the service p∗B ≈ 0.0113 with optimal profits Π(p∗B) ≈0.106. The firm’s profit functions under these two different power law degree distribution aredepicted in Figure 8.From Figures 7 and 8, we observe that the monopolist’s profits are not far from being always
increasing in the price of the service. Our careful choice of parameters has made it possible toobtain interior solutions in this example. However, slight perturbations of the picked parame-ters would lead in this example to situations where the monopolist’s profits are in fact alwaysincreasing in the price of the service so that no interior solution is achieved. For the a generalpower law distribution, it can verified that the condition stated in Corollary 1 is satisfied if andonly if the following inequality holds.
(p− ψ)α−1[2(α− 2)p+ 2ψ − (α− 1)cω(cz − cω)
]< (α− 1)(cz − cω)2(βn)α−1.
For values α > 2 of the parameter, the inequality above is satisfied for prices of the servicewhich are relatively low with respect to production and advertising costs.
6 Equilibrium Existence and Multiplicity
Under our assumptions, there is always a solution for the monopolist’s decision problem,provided that the second order condition in equation (9) is satisfied and the support [n, n] of thedegree distribution is bounded. This is the case even for more general cases where Assumption1 needs not hold and, as a consequence, no service adopters may exist in equilibrium. Evenfor these more general cases, the existence of equilibrium in our model is guaranteed if the setof choices W is compact and convex and, furthermore, if each consumer i’s objective functionis quasiconcave on (xi, yi) ∈ W . Formally, these requirements ensure that there exists anequilibrium where each consumer chooses pure strategies. In our model, the first requisite
28

above is trivially satisfied by the construction ofW . As to the second requirement, notice thateach Ui is linear on (xi, yi), which implies the desired quasiconvavity.
Unfortunately, we cannot always guarantee uniqueness of equilibrium in our model (evenfor interior equilibria). The main source of equilibrium multiplicity comes from the fact thatthe hazard rate of the degree distribution be either non-monotone or decreasing. For (weakly)increasing hazard rates, though, interior equilibrium, if it exists, is unique. Consider thefunction Ψ(p) specified as
Ψ(p) = rβ(p)
[p− cz(cz − cω)
2+
(cz − cω)2
2Fβ(p)
](14)
so that Ψ(p∗) = 1 is the equilibrium condition specified in (9) for the service price. Since Fand f are continuous functions, Ψ(p) is continuous in p ∈ [βn+ψ, βn+ψ] as well. In addition,let us specify the bounds on the hazard rate rβ = rβ(βn+ ψ) and rβ = rβ(βn+ ψ), providedthat they are well-defined.22 We observe that the term in brackets in the specification of thefunction Ψ(p) in (14) is always increasing in p. Then, given our earlier observations, directapplication of the intermediate value Theorem leads to the following result.
Proposition 5. Suppose that assumptions 1 and 2 hold and that either rβ(βn + ψ) < ∞or limn→+∞ rβ(βn + ψ) < ∞ (for the case of unbounded support of the degree distribution).Suppose that the hazard rate function associated to the random network is monotone (eitherincreasing or decreasing), then there exists a unique equilibrium price p∗ ∈ (βn + ψ, βn + ψ)
if and only if the following condition holds
rβ
[βn+ ψ − cz(cz − cω)
2
]< 1 < rβ
[βn+ ψ − cω(cz − cω)
2
]. (15)
Notice first that if the hazard rate rβ is increasing in p, this ensures that the functionΨ(p) specified in (14) is monotone in p and that any interior equilibrium price p∗ is unique.23
Secondly, if rβ is increasing in p, then the condition (15) stated in Proposition 5 is alwayssatisfied for a fairly broad class of random networks. From Assumption 2 it follows that[
βn+ ψ − cz(cz − cω)
2
]<
[βn+ ψ − cω(cz − cω)
2
].
Also, recall that, by Assumption 1, ψ is arbitrarily small. Therefore, if rβ is increasing in p,for condition (15) to hold, we only need to consider a support [n, n] such that n be relatively
22 Unlike a density function, the tail of a hazard rate function needs not converge to zero; it can increase,decrease, converge to some constant, etc. For the case of unbounded support of the degree distribution, letrβ = limn→+∞ rβ(βn+ ψ), provided that such a limit exists.
23Using a model different to the one proposed here but where a monopolist also chooses a price for a goodthat is distributed through a network with positive degree externalities, Shin (2016) obtains uniqueness ofthe optimal price when the underlying hazard rate is increasing. While increasing hazard rates directlyensure the required single-crossing property in his model, we also need an additional form of single-crossingproperty which, in our model, takes the form of the assumed strictly positive premium externality.
29

small and n be relatively large. Most applications fall into this class of degree distributions.Thirdly, if rβ is decreasing in p, then the result obtained in Corollary 1, under which the firm’stotal profits are always increasing in p is obtained if and only if
min
{rβ
[βn+ ψ − cz(cz − cω)
2
], rβ
[βn+ ψ − cω(cz − cω)
2
]}< 1.
Since, rβ > rβ when rβ is decreasing in p, the condition stated above can be obtained for afairly reasonable class of degree distributions. As indicated earlier, decreasing hazard ratesare often associated with profits that always increase in the service price.In addition, notice that monotonicity of the function Ψ(p) specified in (14) needs not follow
either when rβ(p) is non-monotone or when it is decreasing in p. This constitutes the onlysource of multiplicity if we restrict attention to equilibria where each consumer chooses purestrategies.Finally, it follows from a perturbation argument over the two parameters (ψ, β) ∈ R2
++,that the set of equilibria is generically a finite one. This perturbation argument allows us toeliminate equilibria both where the consumers choose mixed strategies (i.e., the non-genericcases where ni = (p∗ − ψ)/βK∗ for some i ∈ [0, 1]) and where the condition in the firstrequirement of equation (9) might lead to a continuum set of solutions p∗.
7 Concluding Remarks
While advertising is an ubiquitous aspect in economic life, important to understand the func-tioning of many markets, the pricing behavior of firms that operate in social networks hasbecome a central area of interest for economists. The growth of online and assorted tech-nologies has made it possible for firms to implement advertising and discrimination strategiesthat were not available earlier. These new possibilities have motivated an array of importantquestions about how advertising and prices interact with the architecture, and the dynamicevolution, of social networks. In this article, we have suggested and investigated a new tax-onomy of second-degree discrimination in social networks which is implemented through twoversions of a product, one of them being offered with advertising.We have obtained clear-cut predictions of how fundamentals such as the difference in sizes of
the network externalities, or the advertising costs, affect the optimal discrimination strategy.The comparative statics of optimal pricing with respect to hazard rate dominance are verydifferent depending on whether hazard rates are increasing or decreasing. When hazard ratesare increasing, hazard rate dominance always leads to higher prices and, therefore, to smallerproportions of premium version adopters. When hazard rates are decreasing, the hazard ratedominance criterion does not provide clear implications and, furthermore, there might existmultiple equilibrium prices.On the other hand, important implications about the firm’s behavior follow from decreasing
hazard rates. In some cases, decreasing hazard rates lead to that the firm’s total profits are
30

always increasing in the service price which, in turn, imply that the firm wishes to serve onlythe free version with ads. A number of prominent real-world service providers seem to adjustto this pattern and our model provides a foundation for the popular claims that many serviceproviders regard potential expansions of the networks as valuable because of the inducedincrease in their audiences for advertising. Beyond that, this model says when firms benefitfrom increasing their audiences for ads, depending on the shapes of the underlying hazard ratefunctions.There are different directions in which our model could be extended. First, we have con-
sidered the case of monopoly and it would be very interesting to explore the consequences ofhaving several service providers competing in a common social network. In this respect, ourresults nonetheless continue to be compelling if, for most practical situations, we believe thatthere is indeed sufficient service differentiation and/or that different service providers do notactually serve a significant number of common links (i.e., there is a certain degree of networkdifferentiation across service providers). Secondly, our framework assumes that the only factorthat determines the size of the network externalities is the degree of the nodes. Thus, we havenot incorporated important features present in real-world social networks (such as clusteringor assortativity) which, in practice, could influence the consumption externalities. For exam-ple, the externality could be larger when common neighbors are shared or when the links areformed between consumers with some similar characteristics. Finally, our analysis has ignoredthe fact that the links could be used to transmit information about the characteristics of theadvertised good. This information transmission would interact (either in a complementary orsubstitutive way) with the information distributed through formal advertising. This allowsfor interesting interactions between the formal advertising by the firm and the world of mouthadvertising through the social network. In particular, for review and rating services, includingthis possibility into the analysis seems very important.While our framework is broadly applicable, it seems to capture empirical observations about
how real-world business models operate in their provision of online services through socialnetworks. The implications of our model could be useful for conducting empirical researchand of interest for practitioners in the area.
31

Appendix
Proof of Proposition 1. Note that there are only two necessary conditions that remainto be obtained. One of them is with respect to the optimal price that the firm sets forthe service, p∗, and the other one is with respect to the size of the set of premium versionservice adopters, y∗(p). From the specification of the monopolist’s profits in 7, provided thatmonopolist chooses p > ψ > 0 and that there are premium version service version adopters atthe price p (y∗(p) > 0), we obtain:
dΠ(p)/dp
y∗(p)= 1 +
[p− cω(cz − cω)
2
]dy∗(p)/dpy∗(p)
− (cz − cω)2
2dy∗(p)/dp. (16)
On the other hand, from the consumers’ preference specification in 3, we obtain, under As-sumptions 1 and 2,
y∗(p) = P(θ − ψ + γxn ≤ θ − p+ γyn
)= P
(n ≥ p− ψ
β
)= 1− Fβ(p),
which gives us the specification of the optimal size of the set of premium version adopters undera price of the service p stated in Proposition 1 (iii). In turn, this specification of the optimal sizeof consumers y∗(p) implies dy∗(p)/dp
y∗(p) = −rβ(p) and dy∗(p)/dp = rβ(p)[Fβ(p) − 1
]. Therefore,
the expression in (16) above, together with the first order condition of the monopolist’s problemwhen it sets the optimal price for the service p∗ > ψ > 0, leads to that dΠ(p∗)/dp = 0 if andonly if
1− rβ(p∗)[p∗ − cz(cz − cω)
2+
(cz − cω)2
2Fβ(p∗)
]= 0
holds in equilibrium, an equality that can be directly rewritten as the equilibrium conditionstated in Proposition 1 (ii).As for the second order condition in 1 (ii), notice that, for y∗(p∗) > 0, we have d2Π(p∗)
dp2≤ 0
if and only if
r′β(p∗)[p∗ − cz(cz − cω)
2+
(cz − cω)2
2Fβ(p∗)
]+ rβ(p∗)
[p∗ +
(cz − cω)2
2fβ(p∗)
]≥ 0.
Then, using the equilibrium condition for the price p∗, we obtain that, for y∗(p∗) > 0, therequired second order condition can be written as
r′β(p∗)
rβ(p∗)+ rβ(p∗)
[p∗ +
(cz − cω)2
2fβ(p∗)
]≥ 0,
or, equivalently,r′β(p∗)[rβ(p∗)
]2 +[p∗ +
(cz − cω)2
2fβ(p∗)
]≥ 0,
as stated.
32

Proof of Proposition 2. Define the function
Γ(p∗(β), β
)= rβ(p∗)
[p∗ − cz(cz − cω)
2+
(cz − cω)2
2Fβ(p∗)
],
so that Γ(p∗(β), β
)= 1 is the equilibrium condition for the optimal price that the monopolist
sets for the service, as stated in Proposition 1 (ii). Application of the implicit function Theoremallows us to obtain
∂p∗
∂β= − ∂Γ/∂β
∂Γ/∂p∗
for ∂Γ/∂p∗ 6= 0. It can then be verified that
∂Γ
∂β=−
(1
β
){[rβ(p∗) + (p∗ − ψ)r′β(p∗)
][p∗ − cz(cz − cω)
2+
(cz − cω)2
2Fβ(p∗)
]+
(cz − cω)2
2(p∗ − ψ)rβ(p∗)fβ(p∗)
}.
On the other hand, it can be verified that
∂Γ
∂p∗=r′β(p∗)
[p∗ − cz(cz − cω)
2+
(cz − cω)2
2Fβ(p∗)
]+ rβ(p∗)
[1 +
(cz − cω)2
2fβ(p∗)
].
Furthermore, using the equilibrium condition for the price of the service stated in Proposition1 (ii), the expressions above can be rewritten, respectively, as
∂Γ
∂β= −
(1
β
)[1 + (p∗ − ψ)
r′β(p∗)
rβ(p∗)+
(cz − cω)2
2(p∗ − ψ)rβ(p∗)fβ(p∗)
].
and∂Γ
∂p∗=r′β(p∗)
rβ(p∗)+ rβ(p∗)
[1 +
(cz − cω)2
2fβ(p∗)
].
Thus, if we set
A(p∗) =(cz − cω)2
2rβ(p∗)fβ(p∗) > 0,
then the local change of the equilibrium price of the service p∗ as the size of the premiumexternalities β varies is given by
∂p∗
∂β=
(1
β
) 1 + (p∗ − ψ)[r′β(p∗)
rβ(p∗) +A(p∗)]
rβ(p∗) +[r′β(p∗)
rβ(p∗) +A(p∗)] . (17)
Note first that we obtain[r′β(p∗)
rβ(p∗) +A(p∗)]≥ 0 if and only if the condition
r′β(p∗) +(cz − cω)2
2
[rβ(p∗)
]2fβ(p∗) ≥ 0
is satisfied. But this inequality is in fact directly satisfied from the equilibrium second ordercondition obtained in Proposition 1 (ii). Therefore, it follows that ∂p∗
∂β ≥ 0.
33

Proof of Proposition 3. In order to analyze the effects on the equilibrium price of the ser-vice p∗ of a local change in the advertising cost cω, we define the function
Γ(p∗(cz), cz
)= rβ(p∗)
[p∗ − cz(cz − cω)
2+
(cz − cω)2
2Fβ(p∗)
],
so that Γ(p∗(cz), cz
)= 1 is the equilibrium condition for the optimal price that the mo-
nopolist sets for the service, as stated in Proposition 1 (ii) Also, we use the expressionA(p∗) = (cz−cω)2
2 rβ(p∗)fβ(p∗) > 0 which was specified in the proof of Proposition 2. Then, itcan be verified that
∂Γ
∂cω= rβ(p∗)
[cz/2− (cz − cω)Fβ(p∗)
].
Hence, by using the implicit function Theorem, we obtain
∂p∗
∂cω=rβ(p∗)
[(cz − cω)Fβ(p∗)− cz/2
]rβ(p∗) +
[r′β(p∗)
rβ(p∗) +A(p∗)] . (18)
From the second order condition that must hold in equilibrium, which was obtained in Propo-sition 1 (ii), the denominator of the expression (18) above is positive. Therefore, sincerβ(p∗) ≥ 0, it follows that ∂p∗
∂cω≥ 0 if and only if
Fβ(p∗) ≥ cz2(cz − cω)
,
as stated.
Proof of Proposition 4. Consider two degree distributions FA and FB such that rA(n) ≤rB(n) for all n ∈ [n, n], with strict inequality for some n. As stated in Lemma 1, this in turnimplies that FA(n) ≤ FB(n) for all n ∈ [n, n], with strict inequality for some n. Let theparameters ψ and β remain constant across the two random networks. Suppose that p∗A andp∗B are equilibrium prices for the service under the degree distributions, respectively, FA andFB. Also, suppose that p∗A, p
∗B ∈ (βn+ ψ, βn+ ψ). Application of the equilibrium condition
stated in Proposition 1 (ii) to both triplets (rAβ , FAβ , p
∗A) and (rBβ , F
Bβ , p
∗B) leads to
rAβ (p∗A)
rBβ (p∗B)=
2p∗B + (cz − cω)2FBβ (p∗B)− cz(cz − cω)
2p∗A + (cz − cω)2FAβ (p∗A)− cz(cz − cω). (19)
Consider first the case where (i) both hazard rate functions rAβ and rBβ are (weakly) decreas-ing in [βn+ ψ, βn+ ψ]. We obtain:
(ia) Let p∗A < p∗B. Since the functions FAβ , FBβ are nondecreasing and, in addition, FAβ (p) ≤FBβ (p) for all p ∈ [βn + ψ, βn + ψ] (with strict inequality for some p), then it must be thecase that FBβ (p∗B) > FAβ (p∗A). Therefore, the right-hand side of equation (19) must exceed one.This is compatible with p∗A and p∗B being equilibrium prices only if rAβ (p∗A) > rBβ (p∗B). Since
34

we are considering that rAβ and rBβ are decreasing, this inequality can only be obtained if thereexists a cutoff price p̂ ∈ (βn+ ψ, βn+ ψ) such that rBβ (p̂) = rAβ (p∗A) and p∗A < p̂. If this pricep̂ exists, then p∗A and p∗B are equilibrium prices such that p∗A < p̂ ≤ p∗B.
(ib) Let p∗A ≥ p∗B. Since we are considering that the functions rAβ , rBβ are (weakly) decreasing
and, in addition, rAβ (p) ≤ rBβ (p) for all p ∈ [βn + ψ, βn + ψ] (with strict inequality for somep), then it must be the case that rBβ (p∗B) ≥ rAβ (p∗A). Therefore, the left-hand side of equation(19) is less than one. Using the right-hand side of equation (19), it can be verified that theseequilibrium prices p∗A and p∗B must satisfy the following condition
FBβ (p∗B)− FAβ (p∗A) ≤2(p∗A − p∗B)
(cz − cω)2.
The condition above does not contradicts any of the previous requirements for these pricerelation to hold.Consider now the case where (ii) both hazard rate functions rAβ and rBβ are (weakly) in-
creasing in [βn+ ψ, βn+ ψ]. We obtain:
(iia) Let p∗A < p∗B. Since the functions FAβ , FBβ are nondecreasing and, in addition, FAβ (p) ≤
FBβ (p) for all p ∈ [βn + ψ, βn + ψ] (with strict inequality for some p), then it must be thecase that FBβ (p∗B) > FAβ (p∗A). In addition, since the functions rAβ , r
Bβ are (weakly) increasing
and, furthermore, rAβ (p) ≤ rBβ (p) for all p ∈ [βn+ ψ, βn+ ψ] (with strict inequality for somep), then it must be the case that rBβ (p∗B) > rAβ (p∗A). Therefore, the left-hand side of equation(19) is less than one. Using the right-hand side of equation (19), it can be verified that this iscompatible with p∗A and p∗B being equilibrium prices only if
FBβ (p∗B)− FAβ (p∗A) <2(p∗A − p∗B)
(cz − cω)2< 0.
But this leads to a contradiction since, as indicated above, it must be the case that FBβ (p∗B) >
FAβ (p∗A).
(iib) Let p∗A ≥ p∗B. Suppose that there exists a price p̂ ∈ (βn + ψ, βn + ψ) such thatrBβ (p̂) = rAβ (p∗A) and p̂ ≤ p∗A. Then, for p̂ ≤ p∗B ≤ p∗A, we have rBβ (p∗B) ≥ rAβ (p∗A) so that theleft-hand side of equation (19) is no larger than one. Using the right-hand side of equation(19), it can be verified that these equilibrium prices p∗A and p∗B must in addition satisfy thefollowing condition
FBβ (p∗B)− FAβ (p∗A) ≤2(p∗A − p∗B)
(cz − cω)2.
Notice that equilibrium prices p∗A and p∗B, with p∗A ≥ p∗B, that satisfy the inequality above can
also be obtained even if the price p̂ does not exist in the interval (βn + ψ, βn + ψ). In thiscase, we always obtain the required condition rBβ (p∗B) ≥ rAβ (p∗A).
35

Finally, consider the case where cutoff price p̂ exists but p∗B ≤ p̂. This leads to thatrBβ (p∗B) ≤ rAβ (p∗A) so that the left-hand side of equation (19) is no less than one. Using theright-hand side of equation (19), it can then be verified that these equilibrium prices p∗A and p∗B,with p∗A ≥ p∗B, are still compatible with equilibrium when the following condition is satisfied.
FBβ (p∗B)− FAβ (p∗A) ≥2(p∗A − p∗B)
(cz − cω)2> 0.
Note that this condition can only be obtained if there exists a price p̃ ∈ (βn + ψ, βn + ψ)
such that FBβ (p̃) = FAβ (p∗A) and p̃ ≤ p∗A. Also, this condition does not contradicts any of theprevious requirements for these price relation to hold. If such a cutoff price p̃ exists, then itmust be the case that p̃ ≤ p∗B ≤ p∗A for these prices to be compatible with equilibrium.
36

References
Bagwell, K. (2007), ‘The economic analysis of advertising’, Handbook of Industrial Organiza-tion, Edited by M. Armstrong and R. H. Porter 3, 1701–844.
Bala, V. & Goyal, S. (1998), ‘Learning from neighbors’, Review of Economic Studies 65, 595–621.
Barabási, A.-L. & Albert, R. (1999), ‘Emergence of scaling in random networks’, Science286, 509–512.
Becker, G. S. & Murphy, K. M. (1993), ‘A simple theory of advertising as a good or bad’,Quartely Journal of Economics 108(4), 941–964.
Bender, E. A. & Canfield, E. R. (1978), ‘The asymptotic number of labelled graphs with givendegree sequences’, Journal of Combinatorial Theory 24, 296–307.
Bloch, F. & Quérou, N. (2013), ‘Pricing in social networks’, Games and Economic Behavior80, 243–261.
Bollobás, B. (2001), Random Graphs, second edn, Cambridge University Press.
Butters, G. (1977), ‘Equilibrium distribution of prices and advertising’, Review of EconomicStudies 44, 465–492.
Campbell, A. (2013), ‘World-of-mouth communication and percolation in social networks’,American Economic Review 103(6), 2466–2498.
Candogan, O., Bimpikis, K. & Ozdaglar, A. (2012), ‘Optimal pricing in networks with exter-nalities’, Operations Research 60(4), 883–095.
Clauset, A., Rohilla-Shalizi, C. & Newman, M. E. J. (2009), ‘Power law distributions inempirical data’, Siam Review 51(4), 661–703.
Ellison, G. & Fudenberg, D. (1995), ‘Word-of-mouth communication and social learning’,Quartely Journal of Economics pp. 93–125.
Erdös, P. & Renyi, A. (1959), ‘On random graphs i’, Publicationes Mathematicae 6, 290–297.
Fainmesser, I. P. & Galeotti, A. (2016), ‘Pricing network effects’, Review of Economic Studies83, 165–198.
Farrell, J. & Saloner, G. (1985), ‘Standardization, compatibility, and innovation’, The RANDJournal of Economics 16, 70–83.
Galeotti, A. & Goyal, S. (2009), ‘Influencing the influencers: A theory of strategic diffusion’,RAND Journal of Economics 40(3), 509–532.
37

Galeotti, A., Goyal, S., Jackson, M. O., Vega-Redondo, F. & Yariv, L. (2010), ‘Networkgames’, Review of Economic Studies 77(218-244).
Ghoshal, G. & Barabási, A.-L. (2011), ‘Ranking stability and super-stable nodes in complexnetworks’, Nature Communications 2(394).
Gramstad, A. R. (2016), Nonlinear pricing with local network effects. Unpublished Manuscript.
Grossman, G. & Shapiro, C. (1994), ‘Informative advertising with differentiated products’,Review of Economic Studies 51, 63–82.
Jackson, M. O. (2008), Social and Economic Networks, Princeton University Press.
Jackson, M. O. & Rogers, B. W. (2007), ‘Meeting strangers and friends of friends: How randomare social networks?’, American Economic Review 97(3), 890–915.
Jackson, M. O. & Yariv, L. (2007), ‘Diffusion of behaviour and equilibrium properties innetwork games’, American Economic Review 97(2), 92–98.
Johnson, J. P. & Myatt, D. P. (2006), ‘On the simple economics of advertising, marketing,and product design’, American Economic Review 93(6), 756–784.
Katz, M. L. & Shapiro, C. (1985), ‘Network externalities, competition, and compatibility’,American Economic Review 75, 424–440.
Lewis, T. R. & Sappington, D. E. M. (1991), ‘All-or-nothing information control’, EconomicsLetters 37(2), 111–113.
Lewis, T. R. & Sappington, D. E. M. (1994), ‘Supplying information to facilitate price dis-crimination’, International Economic Review 35(2), 309–327.
Maskin, E. & Riley, J. (1984), ‘Monopoly with incomplete information’, The RAND Journalof Economics 15(2), 171–196.
Mussa, M. & Rosen, S. (1978), ‘Monopoly and product quality’, Journal of Economic Theory18, 301–317.
Newman, M. E. J., Strogatz, S. H. & Watts, D. J. (2001), ‘Random graphs with arbitrarydegree distributions and their applications’, Physical Review E 64: 026118.
Prat, A. & Ottaviani, M. (2001), ‘The value of public information in monopoly’, Econometrica69(6), 1673–1683.
Rosas-Calals, M., Valverde, S. & Solé, R. V. (2007), ‘Topological vulnerability of the euro-pean power grid under error and attacks’, International Journal of Bifurcation and Chaos17(7), 2465–2475.
38

Shin, E. (2016), Social network formation and strategic interaction in large networks. Unpub-lished Manuscript.
Stephen, A. T. & Toubia, A. (2009), ‘Explaining the power law degree distribution in a socialcommerce network’, Social Networks 31, 262–270.
Stigler, G. J. & Becker, G. S. (1977), ‘De gustibus non est disputandum’, American EconomicReview 67(2), 76–90.
Ugander, J., Karrer, B., Backstrom, L. & Marlow, C. (2011), ‘The anatomy of the facebooksocial graph’, arXiv.
Watts, D. J. & Strogatz, S. H. (1998), ‘Collective dynamics of ’small world’ networks’, Nature393, 440–442.
39
