discussion - gdace · load-carrying capacity of the beam under the action of arch thrust can be...
TRANSCRIPT

486 ACI Structural Journal/July-August 2010
DISCUSSION
The paper presents the experimental results of a series of12 reinforced concrete (RC) beams restrained longitudinallyagainst axial deformation. Some theoretical considerationsare also proposed on the basis of a theory developed by Parkand Gamble.13 The innovative design of the experiments andtesting results presented by the authors allowed the discussers toinvestigate the compressive arch action and tensile catenaryaction in reinforced concrete beams. The discussers wouldlike to offer the following comments and suggestions:
1. As seen in Fig. 2 to 4, there should be a great rigidassembly to block horizontal displacement of the specimensunder compressive arch thrust. Also, the horizontal forceshould be measured. It is noted that from Fig. 5 to 9 thatseveral axial force curves take on slippage in the position ofzero axial force. This slippage may have resulted from anexperimental device other than the behavior of the beams. Inaddition, the linear variable differential transformer (LVDT)installed in the actuator can only be used to measure thecylinder displacement of the actuator rather than thedisplacement of the beam. From Fig. 4 it can be seen that thesteel frame on which the actuator was fixed may also deformupward under loading. The displacement of the actuator’scylinder is not equal to the displacement of the specimen. Itis necessary to calibrate the flexibility of the frame, thensubtract the displacement of the frame from the total actu-ator’s displacement to obtain the displacement of the spec-imen. In addition, the sudden drop of the load-carryingcapacity in Specimens A3 and A6, as shown in Fig. 5 and 8, isperhaps due to the sudden release of elastic strain energystored in the frame in the conversion process of arch actionto catenary action. If the stiffness of the test device was largeenough, more smooth curves13 could be obtained.
2. In Fig. 5 to 8 and Fig. 12, the load-deflection curves aremarked with a yielding point, which means that the yieldingof tension steel reinforcement occurred at the supports;however, how to measure the strain of the steel was notdescribed in the paper. It is not clear how to get the yieldingpoint in the testing. From the curves in these figures, such asSpecimens A1, A4, B3, B4, and others, it cannot be consideredthat the behavior of the specimens at the yielding point havenot been beyond the “linear load-deflection response,”assuming the yielding bending moment amplifies the factorof Specimen B3 at the midspan and support as 1.15 and 1.65,respectively (Fig. 12). The estimated yield load according toEq. (3) is at least 10% less than that listed in Table 3. Intesting the applied load, the axial force and bending momentat the supports could be measured. Then, the bendingmoment at the midspan could be calculated based on Eq. (3).The yielding of steel reinforcement, however, can only bedetermined from the measured strain of the steel. Themeasured strain of the steel was not listed in the paper,possibly due to limits on length. The authors could plot the
measured strain of the steel of Specimen B3 in the Closureof this discussion, which would be helpful in better under-standing the paper.
3. In the literature to date, there are very few measurementresults of arch thrust in the testing of RC beams and slabs. Itis very interesting that the maximum arch thrust and themaximum load-carrying capacity of the beams occurred at adifferent deformation state, as described in the paper. Thecurves shown in Fig. 12 and Eq. (3) seem to give a reasonableexplanation of the relationship between the increase in thecross section bending resistance capacity and the change inload-carrying capacity of the beam. In the compressive archaction stage, the effect of axial force on the bending resistancecapacity of the sections and the flexural equilibrium state ofthe beam changed with deflection. For the slabs with a smallsection height, the stage from the beginning of the archaction to the snap-through is very short. It can be looselyconsidered that the sectional bending resistance capacity andthe load-carrying capacity of the slab reach the maximum atthe same time, but the section height of a beam is usuallymuch greater than that of a slab. Before the cross sectionbending resistance capacity reaches its maximum, the beamreaches the maximum load-carrying capacity. This is themain difference in compressive arch action between beamsand slabs. It is also the main finding of the paper. Unfortu-nately, the paper gives the measured relative bendingmoment of only one specimen. The variation of arch thrust islimited to qualitative discussions. Using Eq. (3) in the paper,Park and Gamble13 developed an arch thrust equation of aslab strip, as shown in Eq. (1) of the paper. Park’s equation,however, implies an assumption that the “maximum load-carrying capacity and the maximum arch thrust occurred atthe same time.” Park’s model is not applicable to the beamspresented in the paper. As shown in Fig. 12, the axial force,bending moments at the midspan, and support can beexpressed as the functions of deflection δ. The correctmethod is to solve the deflection δ from the following equation
By substituting δ into Eq. (3) in the paper, the maximumload-carrying capacity of the beam under the action of archthrust can be obtained.
4. The paper states that the tension of steel reinforcementat the midspan in all of the specimens was finally fractured.For example, there were three steel bars of 14 mm (0.552 in.)diameter in the bottom of Specimen B3. The total tensionforce was 247 kN (55.53 kip). Due to the elongation of thesteel reinforcement rate of 27%, top reinforcement shouldalso be in tension. Therefore, the axial force in the beam may
d M M′+( )dδ
-------------------------- dNdδ-------δ N+=
Disc. 106-S55/From the September-October 2009 ACI Structural Journal, p. 600
Progressive Collapse Resistance to Axially-Restrained Frame Beams. Paper by Youpo Su, Ying Tian, andXiaosheng Song
Discussion by Weijian Yi, Qingfeng He, and Xiao YangCollege of Civil Engineering, Hunan University, Changsha, Hunan, China
ACI Structural Journal/July-August 2010 487
not be less than 247 kN (55.53 kip). In Fig. 5, however, theaxial force in Specimen A3 is only approximately 100 kN(22.48 kip). The axial tension forces in other specimens arealso smaller than the total tension force of the bottom steelbars. In the second paragraph on p. 604, it says that “Thefinal failure of all specimens was announced by the fractureof bottom reinforcement at the interface of beam and centercolumn stub.” According to the explanation for Fig. 12 in thepaper, the bending moment in the midspan existed until thebottom steel reinforcement fractured. This is possiblebecause the bottom and top steel bars are in different tensionstress states, which results in a bending-tension state. If thereis a considerable bending moment at the midspan of a beamin the final stage, the load-carrying capacity of the beam isobviously underestimated by the model presented in Fig. 14because there is not only catenary action but also bendingmoment in the load path. As described in the paper, “It isnoted that, prior to failure, the specimen could still resist asignificant amount of bending moment at the criticalsections. Therefore, a double curvature deformed shape wasmaintained in the beams until failure when the bottom rein-forcement at the midspan fractured under catenary action”(first paragraph, p. 606). This description may be used toexplain why the measured axial force is less than the totaltension force in the bottom steel reinforcement of the beam.If this explanation was acceptable, the ultimate load-carryingcapacity would be calculated using Eq. (3) in the paper bysimply substituting the measured axial tensile force andbending moments in the equation. In this way, however, thecomparison shown in Fig. 14 may be meaningless. Inaddition, “tensile arch action” in Table 3 should be “tensilecatenary action.”
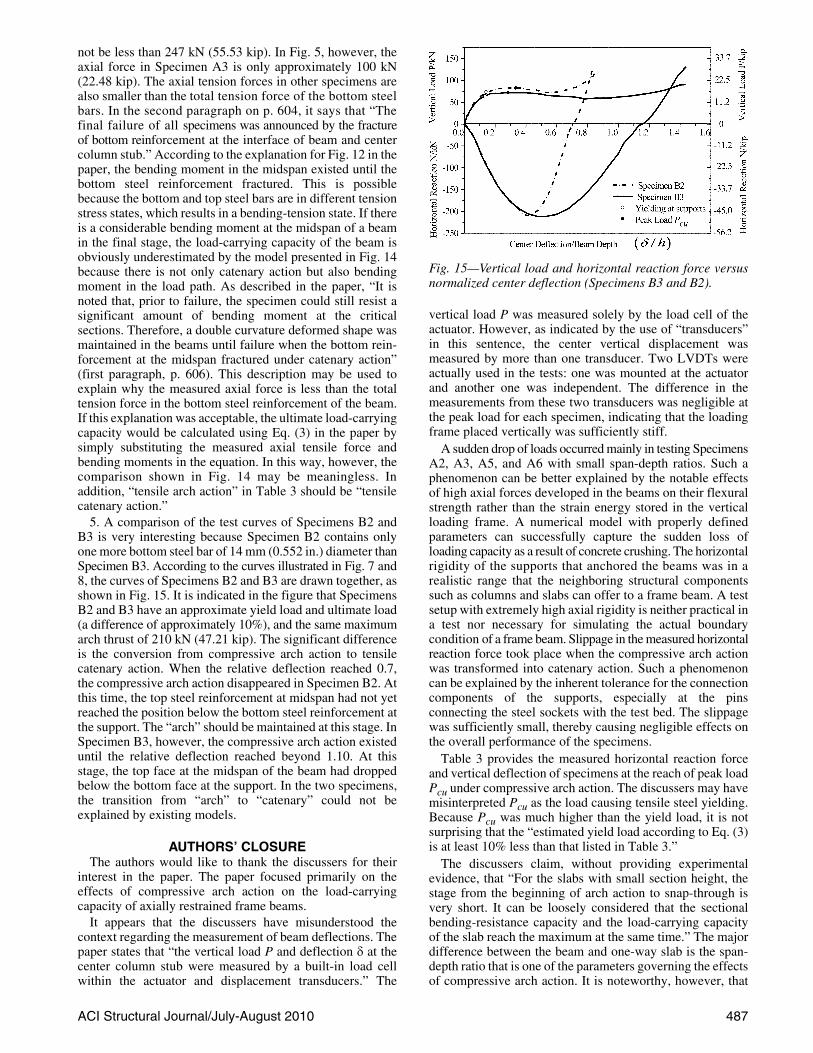
5. A comparison of the test curves of Specimens B2 andB3 is very interesting because Specimen B2 contains onlyone more bottom steel bar of 14 mm (0.552 in.) diameter thanSpecimen B3. According to the curves illustrated in Fig. 7 and8, the curves of Specimens B2 and B3 are drawn together, asshown in Fig. 15. It is indicated in the figure that SpecimensB2 and B3 have an approximate yield load and ultimate load(a difference of approximately 10%), and the same maximumarch thrust of 210 kN (47.21 kip). The significant differenceis the conversion from compressive arch action to tensilecatenary action. When the relative deflection reached 0.7,the compressive arch action disappeared in Specimen B2. Atthis time, the top steel reinforcement at midspan had not yetreached the position below the bottom steel reinforcement atthe support. The “arch” should be maintained at this stage. InSpecimen B3, however, the compressive arch action existeduntil the relative deflection reached beyond 1.10. At thisstage, the top face at the midspan of the beam had droppedbelow the bottom face at the support. In the two specimens,the transition from “arch” to “catenary” could not beexplained by existing models.
AUTHORS’ CLOSUREThe authors would like to thank the discussers for their
interest in the paper. The paper focused primarily on theeffects of compressive arch action on the load-carryingcapacity of axially restrained frame beams.
It appears that the discussers have misunderstood thecontext regarding the measurement of beam deflections. Thepaper states that “the vertical load P and deflection δ at thecenter column stub were measured by a built-in load cellwithin the actuator and displacement transducers.” The
vertical load P was measured solely by the load cell of theactuator. However, as indicated by the use of “transducers”in this sentence, the center vertical displacement wasmeasured by more than one transducer. Two LVDTs wereactually used in the tests: one was mounted at the actuatorand another one was independent. The difference in themeasurements from these two transducers was negligible atthe peak load for each specimen, indicating that the loadingframe placed vertically was sufficiently stiff.
A sudden drop of loads occurred mainly in testing SpecimensA2, A3, A5, and A6 with small span-depth ratios. Such aphenomenon can be better explained by the notable effectsof high axial forces developed in the beams on their flexuralstrength rather than the strain energy stored in the verticalloading frame. A numerical model with properly definedparameters can successfully capture the sudden loss ofloading capacity as a result of concrete crushing. The horizontalrigidity of the supports that anchored the beams was in arealistic range that the neighboring structural componentssuch as columns and slabs can offer to a frame beam. A testsetup with extremely high axial rigidity is neither practical ina test nor necessary for simulating the actual boundarycondition of a frame beam. Slippage in the measured horizontalreaction force took place when the compressive arch actionwas transformed into catenary action. Such a phenomenoncan be explained by the inherent tolerance for the connectioncomponents of the supports, especially at the pinsconnecting the steel sockets with the test bed. The slippagewas sufficiently small, thereby causing negligible effects onthe overall performance of the specimens.
Table 3 provides the measured horizontal reaction forceand vertical deflection of specimens at the reach of peak loadPcu under compressive arch action. The discussers may havemisinterpreted Pcu as the load causing tensile steel yielding.Because Pcu was much higher than the yield load, it is notsurprising that the “estimated yield load according to Eq. (3)is at least 10% less than that listed in Table 3.”
The discussers claim, without providing experimentalevidence, that “For the slabs with small section height, thestage from the beginning of arch action to snap-through isvery short. It can be loosely considered that the sectionalbending-resistance capacity and the load-carrying capacityof the slab reach the maximum at the same time.” The majordifference between the beam and one-way slab is the span-depth ratio that is one of the parameters governing the effectsof compressive arch action. It is noteworthy, however, that
Fig. 15—Vertical load and horizontal reaction force versusnormalized center deflection (Specimens B3 and B2).

488 ACI Structural Journal/July-August 2010
the same mechanism of compressive arch action can still beassumed for both beams and one-way slabs. Additionally,due to the secondary effects resulting from large slab defor-mation far beyond initial steel yielding, the slab loadingcapacity can be reached earlier than its flexural capacity.Such a performance has also been observed in the beam tests(such as Specimen B3). The authors extended the modeldeveloped for one-way slabs by Park and Gamble13 toaxially restrained beams. It is noted that, different from whatthe discussers have interpreted, Eq. (1) defines P as thevertical load applied on the beam rather than as the “archthrust.” In addition, scrutinizing the context of Chapter 12 ofReference 13 indicates that no assumption was adopted orimplied by the authors of this reference about a simultaneousreach of the maximum vertical load-carrying capacity andthe maximum axial force developed in the beams undercompressive membrane action.
The discussers briefly described an approach to calculatethe beam loading capacity Pcu. This approach is simply adifferent mathematical method to solve the same problem:searching the maximum load at varying values. The equationprovided by the discussers can be derived from Eq. (3) bytaking the first-order directive of P with respect to δ as zero.Despite the seemingly simple format of this equation, nodetailed formulations are provided by the discussers todefine M, M′, and N as a function of δ. It is possible that aclosed-form solution of δ cannot be obtained and a numerical
approach has to be used to determine the value of δ at Pcu.Additionally, if the same ways of defining M, M′, and N (asthose recommended by Park and Gamble13) are used, it isbelieved that the approach recommended by the discusserswould lead to results identical to the analytical predictionsgiven in the paper.
It is noted that N is defined in the paper as the measuredhorizontal reaction force. Hence, Fig. 5 to 8 show the horizontalreaction force rather than the axial force actually developedin the beams. At large deformation of beams subjected tocatenary action, the axial force will be much higher than thehorizontal reaction force. Therefore, it is inappropriate todirectly correlate the forces shown in these figures to thecatenary action forces. Figure 14 shows a simple model forpredicting the loading capacity as well as the comparisonbetween the calculated and measured results. As described inthe paper and admitted by the discussers, the internal forcemay be far more complicated than that assumed in the simplemodel. By presenting Fig. 14, the authors used a modest wayto show their disagreement with this simple model, which hasbeen adopted in Reference 10, and alert readers that this modelmay result in unreliable predictions.
The authors agree that the test results for Specimens B2and B3 are interesting, especially the earlier transition froma compressive arch action to a catenary action in Specimen B2.The authors are currently carrying out an analytical studythat may facilitate a reasonable explanation of the different
Disc. 106-S56/From the September-October 2009 ACI Structural Journal, p. 608
Carbon Fiber-Reinforced Polymer for Continuity in Existing Reinforced Concrete Buildings Vulnerable toCollapse. Paper by Sarah Orton, James O. Jirsa, and Oguzhan Bayrak
Discussion by Rafael Alves de SouzaACI member, PhD, Universidade Estadual de Maringá, Maringá, Brazil
The authors have made a significant contribution regardingthe strengthening of structures to prevent progressive collapse.Also, the authors have presented an interesting strategy basedon the use of carbon fiber-reinforced polymers (CFRPs).Despite the quality of their research and their valuable findings,the discusser requests clarification on some topics.
INTRODUCTION AND RESEARCH SIGNIFICANCEThe authors have proposed the use of FRP as a strengthening
alternative for beams that might lose some of their supports(interior columns). It is undoubtedly a situation that mayoccur in daily practice and engineers need to come up withquick and rational strategies of strengthening. The engineeringsolutions are desired to be simple, fast, and economical toavoid progressive collapse and allow the users to escape orrecover their belongings before the effects become significant.
The use of CFRP for critical situations such as thatpresented by the authors, however, does not seem to be apractical alternative, as this solution may demand specializedworkers (adequate intervention) and structural engineers(design of the CFRP sheets). From a practical point ofview—despite the exceptional qualities of CFRP sheets—ashoring approach using steel or wood shores will work betterfor a provisory situation where the loss of some columns isevident. Also, this kind of approach is cheaper, faster, and doesnot require a complex background. Could the authors explain
the main advantages of using CFRP instead of shoring elementsin critical situations where progressive collapse is evident?
EXPERIMENTAL PROCEDUREThe authors have determined a strengthening scheme
using FRP that would allow a beam with discontinuityreinforcement to survive loss of a column. For that, theyhave investigated seven half-scale specimens based ontypical information obtained from constructions built in the1970s. Unfortunately, the concrete compressive strengthused for the specimens do not represent the majority of thebuildings constructed in that time. Also, the values presentedin Table 3 are very different and may prompt distortionsregarding the interpretation of the results.
The discusser does not agree with the procedure of takingjust one specimen for each proposed situation (NR-2, PM-1,PM-2, NM-1, NM-2, FR-1, CR-1). At least two specimensshould have been tested for each situation to effectivelydiscuss the results based on a minimum statistical background.Also, there is a great variation for the compressive concretestrength used in all specimens. As one can see in Table 3,Specimens NM-2, FR-1, and CR-1 have concrete compressivestrengths that are significantly higher than the other situations.Additionally, some specimens are significantly more reinforcedthan others and, taking into account the great variationregarding the concrete compressive strength and reinforcements(steel and FRP), some results were expected.

ACI Structural Journal/July-August 2010 489
EXPERIMENTAL RESULTS AND DISCUSSIONTo the discusser’s understanding, the authors have
mentioned two basic situations of failure for their specimens:flexure strength and catenary (or cable) action. However, itis not clear throughout the paper which situation is moreeffective for representing the level of strength of a structurebased on the GSA guidelines.1 Also, it is not clear whencatenary (or cable) action may develop. How can the rotationof 0.13 radians be defined to obtain catenary (or cable) action?
In the situation denominated “flexural strengthening,”the authors used 4.5 times the amount of CFRP used inSpecimen NM-2. Why not use the same strengthening usedin Specimens PM-1/PM-2 and NM-1/NM-2 to account forthe effect of providing FRP for positive and negativemoments? Increasing CFRP in Specimen FR-1 makes acomparison with Specimens PM-1, PM-2, NM-1 and NM-2difficult. Also, in Table 3, there is no description regardingthe concrete compressive strength of Specimen NM-1.
CONCLUSIONSThe authors have presented a very interesting paper
concerning the progressive collapse of reinforced concretestructures. The loss of a supporting column may leave abeam unable to resist gravity loads and may lead to thecollapse of either side of the lost column. In that way, engineersneed to come up with techniques that allow building occupantsto recover their belongings or escape before the effects of alocal failure become significant. The authors have presenteda technique based on the use of CFRP sheets, which can beconsidered a very effective intervention because it canprovide a great level of ductility for damaged sections.
In critical situations, however, this alternative of interventionmay be considered more complicated and expensive thanother provisory and simple situations, such as a shoringapproach (steel or wood). Also, when strengthening a beamfor flexure using CFRP, one must be aware of the effectiveshear strength. If the shear strength needs to be enhancedonce the flexural strength was increased by using CFRPsheets, this solution may become even more expensive andcomplicated, demanding special attention.
The authors are correct when they state that a staticallyapplied load corresponding to 2(DL + 0.25LL), based on GSAguidelines,1 may or may not correspond to actual progressivecollapse prevention. In fact, new information concerningcatenary (or cable) action is needed to better understand themaximum strength of reinforced concrete structures.
Finally, the discussed paper presents the importance ofproviding continuity for positive and negative reinforcements.It is an issue that requires special attention in the designcodes. Practical experience has been shown through theyears that an adequately detailed structure may withstandincredible loads, even if some errors were committed duringthe design process. There is no doubt that the proposedintervention using FRP sheets is effective; however, it willonly be possible in practice if an adequate continuity of rein-forcement was defined in the damaged structure.
AUTHORS’ CLOSUREThe authors thank the discusser for his interest in the paper. It
appears the discusser misinterpreted the intent of the strength-ening procedure. The objective was to prevent a progressivecollapse if a catastrophic event occurred. The technique wasnever intended to be used on a structure that was heavilydamaged and needed to be shored to prevent collapse.
The application of CFRP in these situations does requirespecialized workers and structural engineers, but there is nota lack of these qualified people. The use of CFRP tostrengthen structures has been long implemented and thereare several firms that provide both the engineering assistanceto design the CFRP and the workers to correctly apply it. CFRPis both flexible and lightweight so that after the surface prepara-tion, the application of the fabric can occur in less than a fewhours with only a few skilled workers. For the beams in thisstudy, the CFRP application only took approximately 1 hour.
For this study, the intent was to see whether CFRP couldbe applied in such a way to provide continuity (which it can)and whether that continuity can aid in the resistance ofprogressive collapse (which it can). Although it would havebeen desirable to repeat the tests of some CFRP designs, thatwas simply not within the time or budget constraints of theprojects. The evaluation of more variables was deemed moreimportant than replicating rather expensive test specimens.Specimens NM-1 and NM-2 did replicate results of thenegative moment strengthening. The two specimens werethe same, with the only difference being in the amount ofCFRP applied. After the successful test of Specimen NM-1,it was decided that a reduced amount of CFRP could producethe same results, so Specimen NM-2 was tested.
The design concrete strength for the specimens was 27.6 MPa(4000 psi). The concrete, provided by a local concretesupplier, was unusually low for the first batch of beams, andhigh for the second two. The concrete compressive strengthof Specimen NM-1 was 33.8 MPa (4900 psi) (the same as forSpecimens PM-1 and PM-2). Although the concrete strengthmay not have been as intended, it did not significantly affectthe behavior of the specimens. For a specimen under catenaryaction, the most important variables are the location andstrength of the reinforcing steel, and height and depth of thebeam. As for the steel in the specimens, all specimens havethe same reinforcing steel and the same steel design, exceptSpecimen CR-1, which was designed using current ACI 318requirements for integrity reinforcement.
All specimens (except for Specimen FR-1) exhibited someform of flexural failure (ex-beam hinging at the support inSpecimens NM-1 and NM-2), then went into catenary action.Catenary action consistently developed at a deflection equalto, or just greater than, the depth of the beam. To reach thisdeflection without a complete flexural failure (bar fracture),the beams needed to have sufficient rotational ductility. Forthese specimens, the rotational ductility needed to beapproximately 0.13 radians.
For Specimen FR-1, the intent was to increase the flexuralstrength of the beam to allow it to carry the moments inducedby a loss column. This was not the same intent as the otherspecimens, so a different design approach was used. Thedesign of the CFRP was based on basic flexural principlesand used the least amount of CFRP needed to reach therequired strength. As seen in Fig. 12 of Reference 19, thestrains measured in the CFRP were approaching the fracturestrain and most of the CFRP had debonded, indicating thatthe CFRP was almost fully used.
The discusser is correct that shear strength must be considered.Improving the continuity in a beam does not help if the shearstrength is lacking. Strengthening for shear was outside ofthe scope of the research project.
REFERENCES19. Orton, S. L.; Jirsa, J. O.; and Bayrak, O., “Design Considerations of
Carbon Fiber Anchors,” Journal for Composites for Construction, ASCE,V. 12, No. 6, Nov/Dec 2008, pp. 608-616.

490 ACI Structural Journal/July-August 2010
Disc. 106-S61/From the September-October 2009 ACI Structural Journal, p. 656
New Formula to Calculate Minimum Flexure Reinforcement for Thick High-Strength Concrete Plates. Paperby E. Rizk and H. Marzouk
Discussion by Abdulkadir CevikAssistant Professor, Department of Civil Engineering, University of Gaziantep, Gaziantep, Turkey
The authors have proposed a new equation to calculateminimum flexure reinforcement for thick plates and two-way slabs. The validity of the new proposed equation is verifiedby a comparison between the proposed equation withBattista’s experimental results and with different codeformulas for calculating minimum reinforcement for flexuralmembers. At first sight, everything seems to be correct;however, after closer inspection, the database (Battista’sexperimental results) used for verification cannot be used forthis purpose. First of all, the range of the dependent variable(steel ratio) is too close where steel ratios are 0.22, 0.23, and0.24, respectively. On the other hand, the ranges of independentvariables are quite high as compared to the dependent variable,which means that most of the dependent variables do nothave any significant effect on the dependent variable. As thedependent variable is grouped and the interaction diagramsare plotted, this problem can be observed easily, as shown inFig. 10 to 12. As can be seen, variations of related independentvariables have no effect on the dependent variable (steel ratio).
As a result of the aforementioned arguments, Battista’sexperimental results cannot be used to verify any code formu-lations or equations regarding the calculation of minimumflexure reinforcement for thick plates and two-way slabs.
AUTHORS’ CLOSUREThe authors would like to thank the discusser for his
interest in the paper, and for providing the authors theopportunity to illustrate a few details. The developed modelis based on the theoretical assumptions based on the theoryof plates in Eq. (12) to (17) and the shear sandwich modelsimplification, not any test data as explained in the paper.The test data of Battista is not related to the paper.
The discusser is arguing that Battista’s experimental workcannot be used to verify any code formulations or equationsregarding the calculation of minimum flexure reinforcementfor thick plates and two-way slabs, because most of theindependent variables (concrete compressive strength fc′ , steelyield strength fy, and slab depth d) do not have any significanteffect on the dependant variable (reinforcement ratio ρ).
The discusser’s argument is not correct because he ignoredthe size-scale effect factor as an independent factor on theamount of reinforcement ratio. It is possible to consider thestructural member size effect on the minimum reinforcementratio through the brittleness number concept NP, as definedby Bosco et al.15 The brittleness number is derived fromlinear elastic fracture mechanics (LEFM) concepts, as
(39)
where ρ is the steel reinforcement ratio, KIC is the concretefracture toughness, fy is the yield strength of the steel, and his the thickness of the structural member.
NP ρfyh0.5
KIC
------------=The critical value of the stress-intensity factor KIC can be
evaluated as follows
(40)KIC GfEc=
Fig. 10—Interaction plot of steel ratio = 0.23 for fc versusfy, fc versus depth, and depth versus fy.
Fig. 11—Interaction plot of steel ratio = 0.22 for fc versus fy.
Fig. 12—Interaction plot of steel ratio = 0.24 for fc versusfy.

ACI Structural Journal/July-August 2010 491
where Gf is the fracture energy and Ec is the concretemodulus of elasticity determined by standard methods. Thebrittleness of the structural member increases by increasingthe member size or decreasing the steel reinforcement ratio.Bosco et al.15 found that a particular value of number NPdoes exist, for which the moment at which the reinforcementyields equals the moment at first cracking. Such a conditiondefines the minimum amount of reinforcement ratio. Currentdesign codes suggest a constant minimum reinforcement
ratio independent of member size. This is not true as theminimum reinforcement ratio is inversely proportional to themember depth.
As a result of the aforementioned arguments, Battista’sexperimental results can be used to verify any code formulationsor equations regarding the calculation of minimum flexurereinforcement for thick plates and two-way slabs. The signifi-cance of the independent variables on the reinforcement ratiois clear and can be observed easily, as shown in Fig. 13 to 16.
Fig. 13—Brittleness number (NP): steel yield strength forsteel reinforcement ratio = 0.23%. (Note: 1 MPa = 145 psi.)
Fig. 14—Brittleness number (NP): slab depth for steelreinforcement ratio = 0.23%. (Note: 1 MPa = 145 psi.)
Fig. 15—Brittleness number (NP): steel yield strength forsteel reinforcement ratio = 0.24%. (Note: 1 MPa = 145 psi.)
Fig. 16—Brittleness number (NP): steel yield strength forsteel reinforcement ratio = 0.22%. (Note: 1 MPa = 145 psi.)
Disc. 106-S63/From the September-October 2009 ACI Structural Journal, p. 678
Evaluation of Load Transfer and Strut Strength of Deep Beams with Short Longitudinal Bar Anchorages.Paper by Sergio F. Breña and Nathan C. Roy
Discussion by Dipak Kumar Sahoo, Bhupinder Singh, and Pradeep BhargavaPhD, Reader, School of Engineering, Cochin University of Science and Technology, Kochi, Kerala, India; PhD, ACI member, Assistant Professor, Department of Civil Engineering, Indian Institute of Technology Roorkee, Roorkee, India; PhD, Professor, Department of Civil Engineering, Indian Institute of Technology Roorkee
The authors are to be complimented for the interestingstudy. Based on a/d ratio, the authors have sought to identifytwo mechanisms of load transfer in deep beams: tied-archmechanism and truss mechanism. It is well established,however, that besides the ratio, the truss mechanism is alsodependent on the amount of web reinforcement in the deepbeam, whereas the tied-arch mechanism is relatively inde-pendent of the amount of web reinforcement. The presence
of web reinforcement, however, does serve to confine theinclined strut in the tied arch. Further, ACI 318-08 specifiesthat diagonal struts in beams inclined in the range of 25 to65 degrees with the adjoining tie are well-conditioned forstrut-and-tie modeling. Therefore, for all cases wherein theinclination of the strut is typically more than 25 degrees (that is,a/d < 2.14), it will be reasonable to use the tied-arch mechanismas the overarching method for the analysis of deep beams.

492 ACI Structural Journal/July-August 2010
The authors have rightly observed that although vertical webreinforcement is explicitly included in truss models, it is notdone so in tied-arch models. Moreover, the effect of horizontalweb reinforcement is usually not included in either of themodels. The discussers feel that discounting the role ofhorizontal web reinforcement runs contrary to a unifiedapproach to strut-and-tie modeling. On the basis of theirinvestigations of statically determinate truss models withvertical and with horizontal truss mechanisms, Matamorosand Wong (2003) have concluded that though both themechanisms yield conservative results, they require almostdouble the amount of web reinforcement compared to anindeterminate truss model consisting of a combination of thevertical and horizontal truss models. The discussers are ofthe opinion that for a/d less than about 2.14 (strut inclination>25 degrees), it will be simple and convenient to adopt thetied-arch mechanism with web reinforcement—both verticaland horizontal—being accounted for in determining thestrength of the single bottle-shaped diagonal strut joining theload point and the support.
The term F in Eq. (12) and (18) should be corrected to FS-truss.The discussers suggest that the issue of apportioning the totalshear between the tied-arch and the truss mechanism canprobably be better resolved by using the combined indeter-minate strut-and-tie model of Fig. 7(a) rather than thedeterminate model approach implied in Eq. (10) through(21). Furthermore, the authors’ attempt to determine thefraction of the shear transferred through truss action on thebasis of strain measurements using Instruments L2 and L3may not be reliable because the strain profile across the strutaxis is nonuniform due to the bottling effect.
It is interesting to note that the strut efficiency factor βs ofthe diagonal struts of the nine beams that failed by strutfailure when plotted against the corresponding strut inclinationangle α is seen to be increasing with increasing α followingthe linear trend shown in Fig. 12. On the other hand,irrespective of the angle of inclination of the diagonal strutwith the adjoining horizontal tie, ACI 318-08 Appendix Arecommends a constant strut efficiency factor of 0.75 for allof these reinforced bottle-shaped struts. For strut inclinationssmaller than approximately 30 degrees, Fig. 12 shows thatthe ACI recommended strut efficiency factor may be uncon-servative when compared to the experimental results of theauthors. Interestingly, for all of these beams, including thosewith short anchorage lengths, the authors’ experimentallyobserved strut efficiency factors do have a sufficient marginof safety when compared with the predicted strut efficiencyfactors obtained from a recent model by Sahoo (2009), shownas follows.
(22)
In Eq. (22), (valid for up to 81 MPa [11,748.05 psi]), α isthe angle of inclination of the diagonal strut with the tie indegrees, and rc is the concentration ratio of the load resistedby the diagonal strut obtained as the ratio of ws-top and halfthe strut length. The effective transverse reinforcement ratio ρTis computed from the corrected version of the transformationused in ACI Eq. (A-4), shown as follows (Sahoo et al. 2009)
βs 0.60 0.05
rc
----------+ 55ρT+⎝ ⎠⎛ ⎞ α
90------=
(23)
where Asi is the cross-sectional area of each layer of webreinforcement in the i-th orientation; bs is the strut or beamthickness (out-of-plane); si is the spacing of web reinforce-ment in the i-th orientation; and αi is the angle between thestrut and the bars in the i-th orientation.
What is notable in Fig. 12 is that that the trend of theauthors’ experimentally obtained strut efficiency factors issimilar to the trend of the predicted strut efficiency factorsbased on the Sahoo (2009) model.
REFERENCESMatamoros, A. B., and Wong, K. H., 2003, “Design of Simply Supported
Deep Beams Using Strut-and-Tie Models,” ACI Structural Journal, V. 100,No. 6, Nov.-Dec., pp. 704-712.
Sahoo, D. K., 2009, “An Investigation of the Strength of Bottle-ShapedStruts,” PhD thesis, Indian Institute of Technology Roorkee, Roorkee,India, 324 pp.
Sahoo, D. K.; Singh, B.; and Bhargava, P., 2009, “An Appraisal of theACI Strut Efficiency Factors,” Magazine of Concrete Research, V. 61, No. 6,Aug., pp. 445-456.
AUTHORS’ CLOSUREThe authors appreciate the discussers’ interest in their
paper. We would first like to thank the discussers forpointing out notation errors in Eq. (12) and (18) in the paper.This allows us to correct these equations and fix other errorsfound in the manuscript. Figure 11(b) should be modified tobe consistent with the notation given in Fig. 11(a) includedin this discussion.
FC(L) = FC(R) – FS-trusscosγ (12)
Vtruss = FS-trusssinγ (18)
Finally, the values reported in the last column of Table 3are ratios of calculated-to-test values of stresses in the strutfor a tied-arch model. Therefore, the header for the lastcolumn in Table 3 should be modified to read fS-TA/fS-TA(test).
ρTAsi
bssi
--------sin2αi∑=
Fig. 12—Variation of strut efficiency factor with strut angle.

ACI Structural Journal/July-August 2010 493
The authors would now like to provide closing commentsin response to points made by the discussers. The discusserscorrectly point out that the load-transfer mechanism in deepbeams is not only influenced by a/d, but also by the amountof transverse web reinforcement. To isolate the influence ofa/d in the load-transfer mechanism, the authors designed thedeep beams in our tests with the same amount and spacing oftransverse reinforcement. The main objective of the researchwas to identify the effect of short bar anchorage at thesupport on the load-transfer mechanism. Certainly a morecomplete study would include variations in the amount andspacing of transverse reinforcement while holding a/dconstant—this was, however, outside the scope of our tests.
The discussers point out that by using the minimumpermissible angle between a strut and a tie in accordancewith ACI 318-08, one could determine a maximum a/d of2.14, where load could be transferred directly into thesupport using a tied-arch model. Although one couldcertainly design a beam that falls in this a/d range using onlya tied-arch model and in compliance with ACI 318-08, loadscan also be transferred indirectly into the support throughtruss action for a/d less than 2.0, as has been previouslydemonstrated (refer to Eq. (4) from FIP [1999] in the paper).Furthermore, the authors contend that in the case of deepbeams with anchorage details that do not ensure yielding ofthe bottom tie at the face of the extended nodal zone abovethe support (a requirement needed to satisfy equilibrium in atied-arch model), the fraction of load transferred throughtruss action might be higher than for a beam with appropriateanchorage in this region, provided that enough transversereinforcement exists to support this load transferred by trussaction. The fact that specimens having longitudinal baranchorages shorter than required to develop yielding of thebottom tie were able to support loads comparable with thosewith full development demonstrates that a fraction of thetotal load was being transferred through a truss mechanism.
The discussers point out that it would be better to use anindeterminate strut-and-tie model involving tied-arch andtruss mechanisms to determine the fraction of shear transferredby each model. The authors would like to remind thediscussers that, to solve an indeterminate strut-and-tie model,one must either assume the fraction of load transferred by eachindividual mechanism or determine this load fraction inproportion to the individual submodel stiffnesses. The bestway to verify our experimental results was to separate theproblem into two statically determinate models where theload being transferred could be verified by independentmeasurements taken during the tests. These results wereintended to provide information on the fraction of load beingtransferred by each potential load-transfer mechanism toprovide guidance for the future use of indeterminate modelsfor this type of structure. The load carried by each mechanismwas estimated through independent experimental measurementstaken along the direction of struts in the assumed tied-archand truss models for each group of beams. The authorswould like to emphasize that we were using potentiometersthat measured the overall axial shortening of the relevantstruts (the potentiometer ends were attached to points locatedat the ends of struts). This allowed us to experimentallydetermine the average axial force-displacement relationshipof each strut and avoid basing our results on local strainreadings. The total load (sum of forces carried by eachindividual mechanism) would of course have to add to 100%of the applied shear. If the total load carried did not add to
100% of the applied shear, that would mean that the adoptedprocedure to determine the individual load-transfer fractionswas flawed or that experimental measurements were notreliable. As mentioned in the paper and included in Table 3,the largest difference between the load needed to be transferredby tied-arch action to ensure that 100% of the applied shearwas carried and the load determined through potentiometermeasurements was approximately 12%. We believe that thissmall difference gives reasonable confidence about the proce-dure employed to estimate the fraction of load transferred bytied-arch and truss mechanisms.
The variation of strut efficiency factor βs that thediscussers present in Fig. 12 is consistent with results plottedin Fig. 9. The main difference is that βs is plotted in Fig. 9 asa function of a/d instead of direct strut angle α, but these twoquantities are directly related. The authors are also quitesatisfied that the experimentally determined βs values followthe same trend as the discussers’ model. We thank thediscussers for making us aware of their model and lookforward to studying the reference they provided in detail.
Fig. 11—(revised from original paper)—Truss model for loadtransfer: (a) geometry of model; and (b) top node details.
494 ACI Structural Journal/July-August 2010
The authors should be complimented for their interestingtest series and informative report. The saw cuts of differenttest specimens (Fig. 5) especially allow for very informativeinsights into the failure process of the footings and someshortages of the code provisions.
The footings without shear reinforcement did not fail indirect punching: the failure was caused by the failure of theanchorage of the flexural reinforcement along the perimeterof the specimens. This can be observed at the horizontalcracking along/above the flexural reinforcement at the edgesof the specimens and at the many failing outer corners ofpractically each and every footing without shear reinforce-ment. These local failures could partly be caused by theloading pattern with the sliding bearings near edgesmodeling a uniform surface load, which is practical for testreasons but not realistic. These circumstances could lead toa decision not to consider these specimens in the discussion.Nevertheless, as the detailing of the reinforcement corre-sponds to the practice, it is mandatory to tackle the results asthey help to elucidate the shortages of the code provisions.
EXPERIMENTAL PROGRAMMaterial properties
It is not clear at which age the test specimens were loaded.Was it around the 28th day?
Test setupEven if Fig. 4(b) does not yield detailed information about
the real loading pattern, the discusser has the impression thatthe specimens of Series II were relatively overloaded alongtheir perimeter; the outer sliding bearings were too near tothe edges of the specimens.
The locations of the flexural steel strain gauges as shownin Fig. 4(b) are not optimal. At choosing these locations, thestaggering of the tension line due to the shear force (refer tothe inclined cracks in Fig. 5), too, should have been takeninto consideration.
EXPERIMENTAL RESULTSCracking and failure characteristics
All test specimens without shear reinforcement failed dueto the failure of the anchorage of the flexural reinforcement.The authors declare correctly that “the failure occurredalong/due to the wide shear crack and the inclination of thecracks in these specimens is determined by the ratio a/d.”The saw cuts of the uniformly loaded footings with shearreinforcement reveal an extremely important and forward-looking fact: as the inner work required to open the outershear crack crossing the shear reinforcement was higher thanthe inner work causing the much steeper inner shear crack,even though the shear reinforcement was activated, itdetermined the position of the failure surface but not the sizeof the ultimate failure load. The authors correctly specifythat “in contrast to the footings without shear reinforcement,the influence of a/d on the inclination of the shear cracks
seems to be negligible.” The distance s0, the spacing betweenthe column face and the first row of shear reinforcement isdecisive.
Steel strainsAs revealed before, the position of the strain gauges was
not optimal. The flexural steel strains measured at failure ofthe footings with shear reinforcement reached yielding as theshear reinforcement let the inner crack develop in the neigh-borhood of the strain gauges.
DISCUSSION OF EXPERIMENTAL RESULTSEffect of a/d
The slenderness ratio a/d is an indirect indicator of thepossible inclination of the failure shear surface only. At thispoint, a direct factor (the inclination) should be introduced inthe codes.
Effect of concrete compressive strengthThe authors’ conclusion is correct: the behavior of the
footings can not be described by a strut-and-tie model. Thefailure load in shear is not controlled at all by the bearingcapacity of the compressive strut. The “source” of the ultimateload in shear is the shear load-bearing capacity of theconcrete compressive zone. Before the failure occurs, theshear crack, as part of the failure surface, is so wide that noaggregate interlock or similar sidelines could be drawn on toexplain the behavior. The influence of the increasingconcrete strength is neither linear nor follows any squareroot relationship. Further fundamental research is neededregarding this.
Effect of shear reinforcementAs explained previously, at least in case of Specimens
DF16 to DF18, the shear reinforcement was not activated aspart of the shear load-bearing mechanism; hence, anyconclusion—for example, based on Fig. 10—would bemisleading.
Effect of soil-structure interactionIt is a pity that the saw cut of the test specimen with shear
reinforcement, Specimen DF 9, supported on sand, was notpresented in the paper.
COMPARISON OF PREDICTIONS AND EXPERIMENTAL RESULTS
Comparison with ACI 318-08Figure 12(b) seems to confirm that ACI 318-08 does not
consider the influence of a/d. Nevertheless, the real influenceof the effective depth, as shown in Fig. 12(a), should not beevaluated without considering the impact of a/d, that is, theinclination of the failure surface. The specimens supportedon sand with different effective depths had different a/d too.The position of the critical perimeter b0, accompanied withthe assumption of the uniform soil pressure distribution,
Disc. 106-S66/From the September-October 2009 ACI Structural Journal, p. 706
Punching Strength of Reinforced Concrete Footings. Paper by Josef Hegger, Marcus Ricker, and Alaa G. Sherif
Discussion by Andor WindischACI member, PhD, Karlsfeld, Germany

ACI Structural Journal/July-August 2010 495
approximates the real behavior on the safe side (namely,conservative) two times; refer to the crack pattern in Fig. 5(iv)(Fig. 5(h) shows Specimens DF7, not DF17). The crackpattern of Specimen DF9 should have been shown, too, torealize the impact of the shear reinforcement on the failurebehavior of sand-supported footings.
Comparison with Eurocode 2The authors are correct in that:
• The failure crack patterns of the footings without shearreinforcement seem to prove the position of the basiscontrol perimeter at 2.0d distance from the columnface; and
• It is odd that VRu,max according to Eq. (17) controls thedesign. Being only a function of the concrete compres-sive strength, it seems to refer to a web-crushing limitalthough, in case of the tested footings, no crushingcould occur.
The authors criticize that VRu,max does not reflect a/dcorrectly. The discusser agrees and suggests that in the caseof footings, a control like VRu,max has no meaning at all.Instead of VRd,max, the authors propose a new equation, Eq.(19), which is a follow-up of Eq. (15). It would be informa-tive to learn how the multiplier 16 has been found.Whereas vRd,c (Eq. (15)) yields a lower limit, VRd,max (Eq.(19)) sets an upper limit of the load-bearing capacity.Comparing Eq. (19) to Eq. (15), the margin between themseems to originate from the geometry, that is, . Whydoes the geometry not influence the punching shear-stressresistance vRd,c either? The authors are kindly asked to clarify.It would be desirable, too, that the odd “best fit” form of(100ρ · fck)
1/3 in Eq. (15) will be substituted with a physicallysound term in the New Model Code of fib under preparation.
Even if—according to Fig. 15(d)—Eq. (19) seems to yielda “safe” upper limit, the rate of approximation depends on a/dand is, in the case of footings supported on sand, very conser-vative. For the time being, the limited number of the testspecimens with shear reinforcement, that is, with differentratios d/u0 and different spacings between the column faceand the first row of shear reinforcement, s0, do not allow forfinal acceptance of the proposed VRd,max (Eq. (19)).
The authors are kindly encouraged to continue theirinteresting research work.
AUTHORS’ CLOSUREThe authors are grateful for the comments and the interest
in the paper. In the present closure, the authors would like to
d/u0
( )
d/u0
( )
address some of the points raised in the discussion to providesome clarification. Because of space limitations, the mostimportant points, such as the type of failure, will bediscussed in more detail.
EXPERIMENTAL PROGRAMFailure characteristics
The discusser assumes that the failure of the footingswithout shear reinforcement was caused by bond failure.This is not correct. In Fig. 16, the crack patterns of three foot-ings without shear reinforcement are presented. All footingswere loaded via 16 bearings, simulating a uniform load case.The crack patterns are typical for a punching shear failure. Atfirst, radial cracks around the column appeared, then the firsttangential cracks developed at the column face and, later on,at higher load stages, more and more tangential cracksappeared. The ultimate punching capacity of the slab wasachieved when the inclined failure crack reached the flexuralreinforcement. Because the failure was relatively brittle andthe tests were load controlled, it was not always possible tostop the test right in time. After the failure took place, theload was removed and, afterward, the specimens werereloaded to determine the bearing capacity after punchingfailure. During this second loading phase, the flexural rein-forcement was heavily deformed in the region of the failurecrack, which led to the spalling concrete at some edges.
In contrast to Fig. 2, in the footings without shear rein-forcement, the flexural reinforcement was twice bent-up(Fig. 17). Thus, for the given geometry, a typical bondfailure is nearly impossible. The footings with shear rein-forcement were identical to the specimens without shearreinforcement in terms of flexural reinforcement andconcrete strength. Although the anchorage of the flexuralreinforcement was weaker (90-degree hooks), the specimenswith shear reinforcement reached a higher failure load. Thisshould clearly indicate that at least the footings without shearreinforcement and 180 (2 times 90) degree hooks did not failprematurely by bond failure. Hallgren et al.5 reported theresults of 14 punching shear tests on reinforced column foot-ings. In these tests, among other parameters, the influence ofthe end anchorage of reinforcement was investigated system-atically. Hallgren et al.5 concluded that the anchorage of theflexural reinforcement has only a small influence on thepunching strength of footings; however, curved anchorageimproved the ductility. It is worth mentioning that theSwedish saw cuts and crack patterns are very similar to those
Fig. 16—Crack patterns of Footings DF11 to DF13 after failure.
496 ACI Structural Journal/July-August 2010
in the present tests and also showed spalling concrete at theedges of the specimens.
For the footings with shear reinforcement, the discussercorrectly mentions that the shear reinforcement determinedthe position of the failure surface but not the value of theultimate failure load. The discusser also correctly presumed
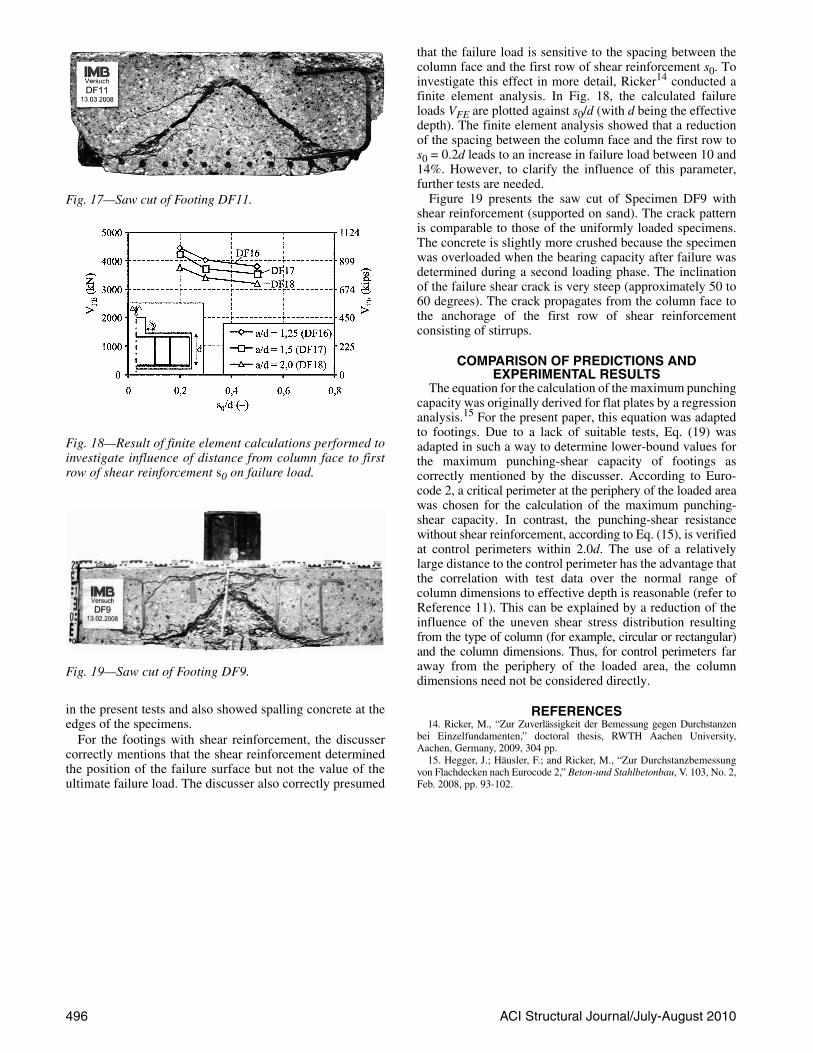
Fig. 17—Saw cut of Footing DF11.
Fig. 18—Result of finite element calculations performed toinvestigate influence of distance from column face to firstrow of shear reinforcement s0 on failure load.
Fig. 19—Saw cut of Footing DF9.
that the failure load is sensitive to the spacing between thecolumn face and the first row of shear reinforcement s0. Toinvestigate this effect in more detail, Ricker14 conducted afinite element analysis. In Fig. 18, the calculated failureloads VFE are plotted against s0/d (with d being the effectivedepth). The finite element analysis showed that a reductionof the spacing between the column face and the first row tos0 = 0.2d leads to an increase in failure load between 10 and14%. However, to clarify the influence of this parameter,further tests are needed.
Figure 19 presents the saw cut of Specimen DF9 withshear reinforcement (supported on sand). The crack patternis comparable to those of the uniformly loaded specimens.The concrete is slightly more crushed because the specimenwas overloaded when the bearing capacity after failure wasdetermined during a second loading phase. The inclinationof the failure shear crack is very steep (approximately 50 to60 degrees). The crack propagates from the column face tothe anchorage of the first row of shear reinforcementconsisting of stirrups.
COMPARISON OF PREDICTIONS AND EXPERIMENTAL RESULTS
The equation for the calculation of the maximum punchingcapacity was originally derived for flat plates by a regressionanalysis.15 For the present paper, this equation was adaptedto footings. Due to a lack of suitable tests, Eq. (19) wasadapted in such a way to determine lower-bound values forthe maximum punching-shear capacity of footings ascorrectly mentioned by the discusser. According to Euro-code 2, a critical perimeter at the periphery of the loaded areawas chosen for the calculation of the maximum punching-shear capacity. In contrast, the punching-shear resistancewithout shear reinforcement, according to Eq. (15), is verifiedat control perimeters within 2.0d. The use of a relativelylarge distance to the control perimeter has the advantage thatthe correlation with test data over the normal range ofcolumn dimensions to effective depth is reasonable (refer toReference 11). This can be explained by a reduction of theinfluence of the uneven shear stress distribution resultingfrom the type of column (for example, circular or rectangular)and the column dimensions. Thus, for control perimeters faraway from the periphery of the loaded area, the columndimensions need not be considered directly.
REFERENCES14. Ricker, M., “Zur Zuverlässigkeit der Bemessung gegen Durchstanzen
bei Einzelfundamenten,” doctoral thesis, RWTH Aachen University,Aachen, Germany, 2009, 304 pp.
15. Hegger, J.; Häusler, F.; and Ricker, M., “Zur Durchstanzbemessungvon Flachdecken nach Eurocode 2,” Beton-und Stahlbetonbau, V. 103, No. 2,Feb. 2008, pp. 93-102.