discussion paper 45 - university college cork · pdf filethere are many factors that are...
TRANSCRIPT

Department of Food Business and Development
Discussion Paper Series
Conjoint analysis as a market-oriented new product design tool: the case of
functional meal replacement beverages
By
Joe Bogue, Alex Hofler and Douglas Sorenson
Agribusiness Discussion Paper No. 45
April 2005
Department of Food Business and Development
University College, Cork
Ireland
Ollscoil na hÉireann, Corcaigh - National University of Ireland, Cork

2
TABLE OF CONTENTS
PAGE
Abstract 4
SECTION I: INTRODUCTION 1.1 Functional Beverages: Meal Replacements 5
1.1.1 Key Drivers of Meal Replacements for On-the-Go Consumption 6
1.1.2 NPD Activity in the Meal Replacement Category 6
1.2 Market-oriented NPD 7
1.2.1 Market-oriented NPD Process 8
1.3 Product Design: Foods On-the-Go 9
1.4 Conjoint Analysis 10
SECTION II: RESEARCH OBJECTIVES AND METHODOLOGY 2.1 Research Objectives 11
2.2 Methodology 11
2.3 Interviews 11
2.4 Conjoint Experimental Design 12
2.4.1 Conjoint Questionnaire 13
2.4.2 Data Analysis 13
2.4.3 Validity of the Conjoint Model 14
SECTION III: RESULTS AND ANALYSIS 3.1 Results of the Interviews 14
3.1.1 Consumer Profiles 14
3.1.2 Breakfast Eating Habits 14
3.1.3 Eating On-the-Go 16
3.1.4 Meal Replacement Beverages 18
3.2 Results of the Conjoint Questionnaires 20
3.2.1 Eating Habits and Travel Patterns 21
3.2.2 Results of Conjoint Analysis 22
3.2.3 Cluster Analysis 24
3.2.4 Cluster Preferences and Socio-demographic Profiles 25
3.2.5 Simulations 27

3
SECTION IV: RESEARCH CONCLUSIONS AND RECOMMENDATIONS 4.1 Meal Replacement: Meeting the Challenges of Consumer Demands 30
4.2 Qualitative Consumer Research 30
4.3 Segmentation and Product Design 31
4.4 Premium Pricing Strategies for a Functional Product 32
4.5 Positioning Strategies and Communication 33
4.6 The Importance of Market Research in NPD 33
4.7 Research Recommendations 34
4.8 Suggestions for Further Research 34
References 35
Appendix A 39
Appendix B 46
Appendix C 61
Appendix D 62

4
Conjoint analysis as a market-oriented new product design tool: the case of
functional meal replacement beverages1
1 This research was funded by the Department of Agriculture and Food under the National Development Plan, 2000-2006, Food Institutional Research Measure (FIRM).
Abstract Meal replacement beverages represent a significant opportunity for Irish food firms
to provide consumers with healthy, convenient beverages that are suitable for
‘consuming on-the-go’. The objectives of this research were: to identify the key
intrinsic and extrinsic product design attributes for meal replacement beverages; and
to identify successful segmentation and positioning strategies. Conjoint analysis was
used to help identify design attributes for meal replacement beverages. This initially
involved conducting eight interviews followed by a 300 respondent consumer survey.
The interviews identified positioning the meal replacement beverage as a healthy
natural drink, as the product is targeted at the breakfast meal occasion. The key
product design attributes of a meal replacement beverage identified from the conjoint
analysis were: price, functional health benefits, the flavour and the base product. The
conjoint-based study revealed five consumer segments based on their preferences for
meal replacement beverage concepts. The group level simulation analysis helped
identify new meal replacement beverage concepts that could be targeted more
effectively at each market segment. This research generated information on consumer
utility for a number of product design attributes that can be used by technical
personnel to design meal replacement beverages that gain consumer acceptance.

5
SECTION I: INTRODUCTION
1.1 Functional Beverages: Meal Replacements
According to Hollingsworth (2000) the functional beverage market is the fastest
growing market segment in the beverage industry and has out performed all other
functional food segments. Zenith International (2000) reported that sales of
functional beverages in Western Europe, US and Japanese markets experienced an
increase of 77 per cent in volume from 1995 to 1999, to 8.2 billion litres. The growth
of the functional beverages market was further outlined by Starling (2002).
Functional beverages were defined by Zenith International (2000: 1) as:
“Drinks providing a health benefit beyond their basic nutrition content, by
virtue of their physiologically active components”.
Meal replacements represent over 30 per cent of the functional beverage category in
the US (Prepared Foods, 1999). Delahanty (2002) defined a meal replacement as a
portion controlled, pre-packaged product, which replaced an entire meal or snack.
He also noted that meal replacements for specific market segments were designed to
be low in fat and calories, with a calorie content of 200 to 300 calories, and a
macronutrient content of roughly 3 grams of fat, 10 grams of protein, up to 25 grams
of carbohydrates and various vitamins and minerals. The Nutrition Business Journal
Report (2002) reported that the meal replacement category in the USA, which
included both bars and drinks, was valued at $US 2.3 billion annually.
According to Prince (2002) the concept of a meal worldwide is changing
significantly due to healthy eating habits, weight concerns and time constraints. Sloan
(1999) reported that meal replacements offer consumers a healthy and convenient
product. Furthermore, meal replacements represent an opportunity for manufacturers
to develop products that offer a mainstream retail product opportunity, with
convenient packaging, and a broad demographic appeal (Prince, 2002).

6
1.1.1 Key Drivers of Meal Replacements for On-the-Go Consumption
There are many factors that are driving the development of meal replacement
products for the on-the-go market. One of the major factors reported by Watson
(2003) concerned the liberalising of social rule, where consumers no longer felt
embarrassed to eat in public places or in front of work colleagues at their desks.
Gofton (1995) referred to a ‘time famine’ as people worked longer and travel further
to work, and consequently had less time in the morning for a formal breakfast. It was
also reported by Watson (2003) that consumers were increasingly health and diet
conscious.
The convenience food market has experienced strong growth of seven to ten per cent
year on year in Ireland since 2000 (Horgan, 2004). According to Groves (2002) this
growth was attributed to: consumer demand for food without preparation;
consumers’ time constraints; and the adoption of individualistic lifestyles resulting in
a demand for easy-to-serve portion controlled convenience foods. As time pressures
increase, consumers look for non-intrusive foods that may be consumed on-the-go,
during work, travel and leisure (Datamonitor, 2001). In addition, Groves (2002)
reported that the increase in the number and variety of places where food was
available, together with more impulsive and impatient consumers, was driving the
move towards more informal dining and a decline in traditional fixed meal times.
Innovations in packaging have also driven the growth of the meal replacement
market. There is a growth in the market for single-serve products using PET2
bottles, as an alternative to cans, as they are lighter, more portable, easier and more
hygienic to drink from, and they are resealable (Leatherhead Food International,
2003).
1.1.2 NPD Activity in the Meal Replacement Category
New Product Development (NPD) activity in the meal replacement category has
focused on the development of meal replacement products for the on-the-go market
and the repositioning of traditional meal replacements for broader consumer appeal.
2 Polyethylene Terephthalate (PET) is a plastic resin used to make bottles for soft drinks.

7
Prince (2002) referred to a new generation of meal replacements that are leveraging
functional beverages into mainstream markets. These enriched beverages contain
roughly 220 calories, contain less that five grams of fat, contain less then twenty-five
grams of sugar, are enriched with ten to twenty grams of protein and fortified with
vitamins and minerals. One such product is the Snapple-A-Day meal replacement
beverage launched by the Cadbury Schweppes group, which is a fruit flavoured soy-
based drink. This beverage offers both convenience and health in a single package
(New Nutrition Business, 2003).
Manufacturers have been particularly active developing meal replacements designed
to replace the breakfast meal occasion. Mellentin (2003) reported that 20 to 30 per
cent of consumers in the US skip breakfast causing manufacturers to address the
problem of decreasing sales of breakfast cereals. Beverages such as Sanitarium’s Up
and Go and cereal bars such as Kellogg’s Nutri-Grain bar are currently on the
market. In addition, innovation in the yoghurt and cereal bars category has resulted
in products gaining a broader consumer appeal (Roberts, 2003).
The repositioning of meal replacement products is a strategy being used by a number
of firms to gain broader consumer appeal. This strategy was used for both Ensure and
Boost, which were brands initially designated for use in hospitals, primarily for tube
feeding and elderly care. Hollingsworth (2003) reported that recently both these
products have been repositioned by altering their packaging and their formulation to
market the brands to the broader consumer market. Similarly, the Slim-Fast brand,
which includes bars and beverages targeting the weight loss market, has also adopted
a repositioning strategy to broaden its appeal to the healthy lifestyle consumer
segment (Hollingsworth, 2003).
1.2 Market-oriented NPD
Consumers’ needs and wants evolve as a result of changing attitudes, demographics
and lifestyles. Consequently, manufacturers need to continually develop new
products to satisfy the changing needs of the consumer (Food Agency Co-operation
Council, 2003). Buisson (1995) noted that the factors which influenced increased
levels of new product activities were: changing consumer needs; the need for product
8
differentiation; advances in technologies; increased competitive pressure; and a
shortening of product life cycles. However, Urban and Hauser (1993) emphasised
changes in demographics and lifestyles as key driving forces in the development of
new products.
Traill and Grunert (1997) reported that 90 per cent of new products in the food
industry fail in their first year. However, Cooper (1993) found that having a market-
orientation was a critical success factor for successful NPD and Narver and Slater
(1990) reported that it was an important determinant of profitability for firms. A lack
of market-orientation can result in: inadequate market analysis; a failure to
understand consumer needs and wants; and insufficient attention to the marketplace.
Grunert et al. (1996) reported that a major factor influencing the move of the food
industry from being product-oriented towards being market-oriented was the
increased importance of added-value in the NPD process.
1.2.1 Market-oriented NPD Process
Cooper (1993) reported that there are three essential elements to developing a
successful new product: having a strong commitment and orientation to the
marketplace; having a logical and stepwise flow of activities in the NPD process; and
that there is interaction between people from different functional groups within a
firm. According to Calatone and Cooper (1979), successful NPD is dependent upon a
product being unique and superior; understanding consumer wants, needs and
preferences; effective communication between the product development team
personnel; top management support and effective product marketing. Hoban (1998)
had similar views on the success factors of NPD. He found that the NPD success
factors included: the involvement of senior management; the use of internal multi-
functional teams; conducting market research to understand consumer trends and
needs; and the use of information from retail and external sources.
Cooper’s (1993) Stage-Gate New Product Process is a market-oriented NPD process.
This process is multi-functional and activities occur parallel to each other. The gates
between each stage act as quality control checkpoints. The key stages in this model
include: a preliminary investigation stage; a detailed investigation; product

9
development; the testing and validation stages; and the full production and market
launch.
1.3 Product Design: Foods On-the-Go
Product design features can have a strong influence on whether a product is
ultimately successful on the market or not. It was reported by Childs (1997) that for
food products the attributes of taste, convenience, and value for money remained the
primary factors that influenced product success. In terms of functional foods the
benefits from the added ingredients also influence product success. Moskowitz et al.
(2002) identified that the consumer’s needs for eating on-the-go included small
portion size and controllable packaging with the introduction of single-serve packs
and individual portion formats were important packaging features that aided the
development of the on-the-go sector (Eurofood, 2001). Other developments in
packaging materials science that have aided the development of the on-the-go sector
are the shift away from glass and cans to PET bottles which offer a more convenient,
resealable option for consumers with active lifestyles (Leatherhead Food
International, 2003).
Price is a significant element of most marketing strategies. According to Heasman
and Mellentin (2001) the key issue concerning the pricing strategy adopted for
functional foods relates to identifying the premium which consumers are willing to
pay for such foods. Sloan (2003) reported that consumers were willing to pay a
higher price for convenient functional products.
Impulse outlets such as convenience stores and petrol forecourts, where products are
now normally available chilled for immediate consumption, have been successful
points of sale for drinks designed for on-the-go consumption (Leatherhead Food
International, 2003). Business Wire (2002) noted that vending machines were a
strategic element of a distribution strategy for products designed for consumption on-
the-go. Berry (1999) outlined their suitability for on-the-go products due to their 24
hour availability in strategic locations. Business Wire (2002) reported that vending
machines sell products directly to the consumer, allowing consumers to avoid store
queues.
10
Promotion and brand awareness play an important role in the on-the-go market due to
the competitive nature of this impulse driven market. Promotional activities used in
the confectionery and savoury snack markets include the licensing of characters, tie-
ins with special events, and endorsements by sports people and celebrities
(Leatherhead Food RA, 2002).
1.4 Conjoint Analysis
Conjoint analysis is a quantitative methodology described by Steenkamp (1987) as a
consumer-oriented methodology which seeks to quantify and predict consumers’
overall judgement of a product on the basis of the underlying product attributes.
Green and Srinivasan (1978) stated that conjoint analysis provided information for
the researcher about the structure of consumer preferences, which were obtained
from their overall judgement of a set of alternative combination levels of different
attributes. Furthermore, Green and Krieger (1991) pointed out the potential
usefulness of conjoint analysis for the development of new multi-attribute products
with optimal utility levels, for the estimation of market shares in alternative
competitive scenarios, and to enhance market segmentation and promotional
strategies. According to Steenkamp (1987) there are two basic assumptions
underpinning conjoint analysis. The first assumption is that a product can be
described as a combination of levels of a set of attributes, and secondly, that these
levels determine consumers’ overall judgement of a product.
The full-profile approach is referred to by Gil and Sánchez (1997) as being the most
common method of data collection used in conjoint analysis. This approach to
conjoint analysis involves asking consumers to score each alternative product
concept based on their preferences (Green and Srinivasan, 1978). There are a number
of advantages to using the full-profile approach. Green and Srinivasan (1978)
reported that it utilised a more complete set of attributes than other forms of conjoint
analysis. Aaker et al. (1998) reported that the description of the concepts was a more
realistic way of representing a product concept when the full profile approach was
used. Another advantage of the full profile approach is that it is flexible in that either
rank orders or ratings may be applied (Green and Srinivasan, 1978). However, a
major limitation of the full profile approach is the limit to the number of attributes

11
that may be used. Green and Srinivasan (1978) recommended that five or six
attributes should be used in the full-profile approach.
SECTION II: RESEARCH OBJECTIVES AND METHODOLOGY
2.1 Research Objectives
The objectives of this research were: i) to identify the key intrinsic and extrinsic
attributes, in terms of product design, that influence consumer acceptance of meal
replacement beverages; and ii) to identify the key components of successful market-
oriented strategies that gain consumer acceptance, including segmentation and
positioning strategies.
2.2 Methodology
Conjoint analysis was used to identify the key design attributes of the meal
replacement beverage and to identify consumer segments and positioning strategies.
This initially involved conducting interviews to identify product attributes and their
associated levels. The information generated from the interviews was used in the next
step of the research to construct hypothetical meal replacement products that were
rated by consumers using the conjoint questionnaire.
2.3 Interviews
Interviews were used to gain an insight into peoples’ eating habits and to establish
the important product characteristics for meal replacement products. Punch (1998)
stated that interviews were useful in generating an insight into consumers’
experiences, opinions, attitudes and feelings. Kumar (1999) outlined that interviews
were flexible and provided researchers with rich qualitative information.
Patton (1990) described an interview guide as a list of questions that are explored
during an interview and which enable the interviewer to probe and explore issues
that explain and enlighten that particular subject. The first section of this interview
guide contained questions that were relevant to the meal replacement product. These
questions were concerned with consumers’ eating habits with a particular focus on
breakfast, consumer behaviour relating to eating on-the-go, and issues to do with the

12
marketing strategy for a meal replacement beverage. The second section of the
interview guide contained questions relating to a meal complement beverage
followed by questions concerning consumer socio-demographic details. The
interview guide was pilot tested to eliminate mistakes, to ensure that the questions
could be fully understood and to test the time required to conduct the interview (See
Appendix A).
According to Patton (1990) a qualitative inquiry typically examines a relatively small
sample. Convenience sampling was the methodology selected for the interviews.
Participants were recruited by advertising on campus at University College Cork.
The sample consisted of a broad range of age groups. Age categories from 18 to 64
years were represented. The interviews were held in a conference room at University
College Cork. Eight interviews were conducted in March 2004. Each interview was
tape-recorded and lasted between forty-five minutes to one hour. The interviews were
transcribed from the tape-recordings and then coded. Codes were developed and
assigned to responses to the interview guide. All interview transcripts were evaluated
and significant quotes and comments were highlighted. This information was used to
guide the selection of attributes and levels used in the conjoint survey to construct
hypothetical meal replacement products (Gil and Sánchez, 1997).
2.4 Conjoint Experimental Design
The conjoint model was designed using SPSS Conjoint (SPSS, 2001). From the
interviews, the attributes and levels selected for the conjoint design were: the type of
drink, flavour, functional health benefit, price, packaging format and portion size.
The hypothetical products were generated using the Generate Orthogonal Design
dialog in SPSS (SPSS, 2001). A fractional-factorial design was used to select a
sample of product profiles to determine the relative importance of a product’s multi-
dimensional attributes. This enabled data to be gathered on a large number of product
profiles while consumers only rated a limited number of product profiles. The
conjoint preference model incorporated six attributes and their associated levels,
which were used by the orthogonal design function in SPSS conjoint to generate 22
hypothetical products. The design consisted of 18 products and 4 holdouts. Holdouts

13
are product profiles which are ranked or rated by consumers but not used in the
estimation of utility values.
2.4.1 Conjoint Questionnaire
A questionnaire was designed which presented 22 hypothetical product profiles to
consumers who rated their preferred products. Additional questions were included in
the questionnaire concerning consumer eating habits, lifestyles and socio-
demographic information. Respondents were presented with 22 product profiles and
were then asked to rate each of the product profiles, according to their purchase
intentions on a scale from 1 (least preferred) to 9 (most preferred) (see Appendix B).
A significant methodological critique of the full-profile conjoint analysis method
concerns the increased possibility of respondent fatigue, which can result in
reliability and validity problems, as the number of attributes and associated attribute
levels increase. A number of steps were therefore taken in order to reduce the
possibility of respondent fatigue. Firstly, in-depth one-to-one interviews were
initially conducted with consumers to identify the most relevant product attributes
that influence consumers’ purchase decisions. Secondly, the resulting conjoint survey
was then pilot tested to determine: the validity of the models, consumer
understanding of the procedure, and the time required to complete the questionnaire.
A high Kendall’s tau value for the four-holdout cards was obtained which indicated
good agreement between the card ratings and model predictions, which further
validated the questionnaire (SPSS, 2001). Questionnaires were distributed using a
mixture of the ‘drop-off and collect’ method to houses, and the ‘intrusive’ method by
distributing them in leisure centres and shopping centres. The sample was selected
using stratified random sampling of the Irish population from the 2002 census (CSO,
2002). The survey was conducted in Dublin and Cork in May 2004. Three hundred
questionnaires were collected and six of these were deemed unusable, resulting in a
total sample of 294 respondents.
2.4.2 Data Analysis
The first step in the conjoint analysis was to calculate the utility values, which
indicated how each factor level related to consumer preferences. For rating-based

14
conjoint surveys a positive utility value indicates that the attribute’s level is
positively related to preferences and a negative utility value indicates that consumers
have a low preference for the factor level. Importance values are also calculated
which indicate the importance of each attribute to preference ordering. ‘K-means’
cluster analysis was used to help identify market segments based on their preferences
and socio-demographic characteristics. Finally, simulation tests were conducted to
predict consumers’ preferences for hypothetical products, which were not actually
rated by consumers.
2.4.3 Validity of the Conjoint Model
The validity of the conjoint model assessed how well the model fitted the ratings for
an individual. The validity of the model was assessed by association measures and
holdout cards (SPSS, 2001). The model had a good fit as both the association
measures, Pearson’s R (0.998) and Kendall’s tau (0.974) measures were close to one,
which indicated that there was a good agreement between the average card rating and
the card utilities predicted by the model. The Kendall’s tau value for the four-holdout
cards was also very high (1.0) which indicated that there was a good agreement
between the card ratings and model predictions, which further validated the model.
SECTION III: RESULTS AND ANALYSIS
3.1 Results of the Interviews
This section presents the qualitative findings on consumers’ breakfast eating habits,
eating on-the-go and the product characteristics of a meal replacement beverage.
3.1.1 Consumer Profiles
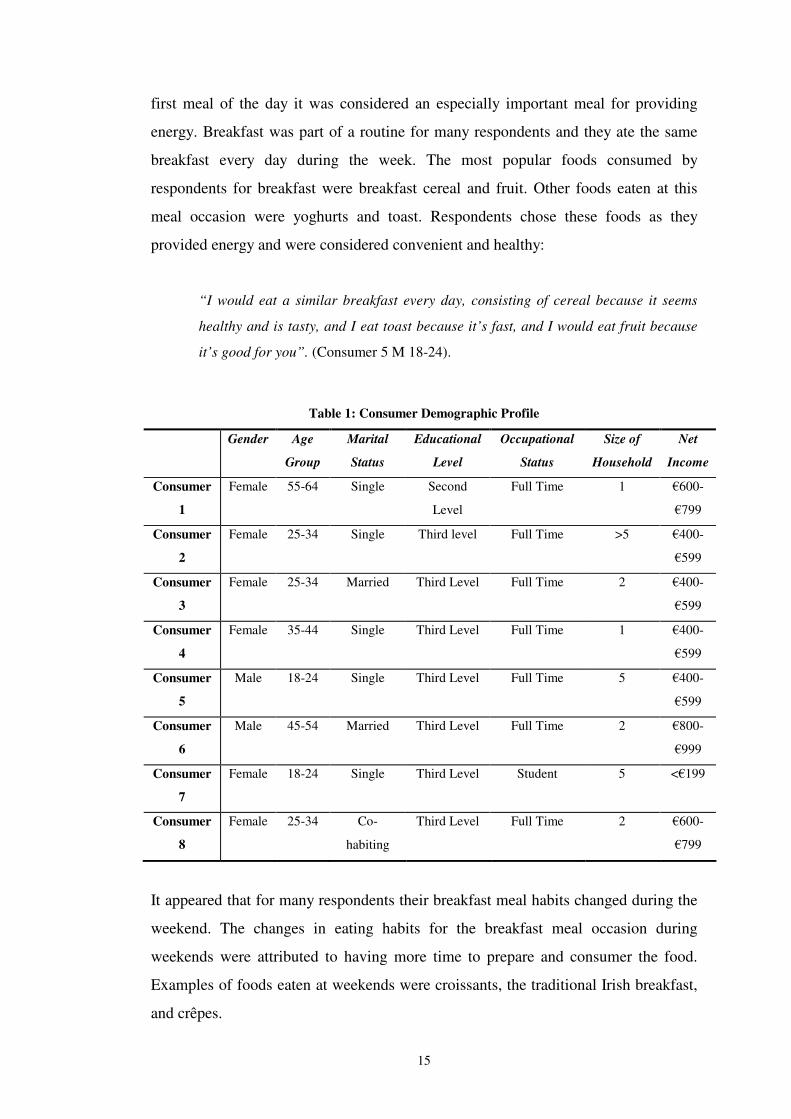
The consumer profiles for the interviews are shown in Table 1. Eight in-depth
interviews were conducted with six females and two males. The majority of
respondents were single, had completed third level education, and were in full-time
employment.
3.1.2 Breakfast Eating Habits
Breakfast was considered an important meal by the majority of respondents. As the
15
first meal of the day it was considered an especially important meal for providing
energy. Breakfast was part of a routine for many respondents and they ate the same
breakfast every day during the week. The most popular foods consumed by
respondents for breakfast were breakfast cereal and fruit. Other foods eaten at this
meal occasion were yoghurts and toast. Respondents chose these foods as they
provided energy and were considered convenient and healthy:
“I would eat a similar breakfast every day, consisting of cereal because it seems
healthy and is tasty, and I eat toast because it’s fast, and I would eat fruit because
it’s good for you”. (Consumer 5 M 18-24).
Table 1: Consumer Demographic Profile
Gender Age
Group
Marital
Status
Educational
Level
Occupational
Status
Size of
Household
Net
Income
Consumer
1
Female 55-64 Single Second
Level
Full Time 1 �600-
�799
Consumer
2
Female 25-34 Single Third level Full Time >5 �400-
�599
Consumer
3
Female 25-34 Married Third Level Full Time 2 �400-
�599
Consumer
4
Female 35-44 Single Third Level Full Time 1 �400-
�599
Consumer
5
Male 18-24 Single Third Level Full Time 5 �400-
�599
Consumer
6
Male 45-54 Married Third Level Full Time 2 �800-
�999
Consumer
7
Female 18-24 Single Third Level Student 5 <�199
Consumer
8
Female 25-34 Co-
habiting
Third Level Full Time 2 �600-
�799
It appeared that for many respondents their breakfast meal habits changed during the
weekend. The changes in eating habits for the breakfast meal occasion during
weekends were attributed to having more time to prepare and consumer the food.
Examples of foods eaten at weekends were croissants, the traditional Irish breakfast,
and crêpes.

16
Respondents generally ate breakfast at home. However, a young female consumer
frequently ate her breakfast while at work. This consumer stated that due to a lack of
time in the mornings she would skip breakfast at home, but would eat something at
work later in the morning:
“I don’t eat breakfast as I would not have the time in the mornings. The first time I
would eat would be at 11 o’clock”. (Consumer 2 F 25-34).
Consumers were aware of the consequences of skipping breakfast. The effects
mentioned were a lack of energy, poor performance and concentration. It was also
mentioned by consumers that as a result of skipping breakfast there was an increase
in snacking throughout the day:
“My performance at work would be hindered if I skipped breakfast as I would be
just waiting for lunch and watching the clock. It would also effect your energy as
you wouldn’t have eaten in maybe 14 hours”. (Consumer 5 M 18-24).
“If I skipped breakfast I would get hungry quicker, so I would need to eat again
quicker”. (Consumer 7 F 18-24).
3.1.3 Eating On-the-Go
A majority of respondents snacked between their meals throughout the day. The
reasons for this included hunger, provision of energy to replace missed meals, and
out of routine:
“If I know that I am not going to get a meal later on, my dinner for example, I know
that I need to get some food into my body and anything will do”. (Consumer 4 F 35-
44).
“I would snack in the morning and afternoon, as I probably need a bit of energy to
keep me awake and help my concentration during lectures”. (Consumer 7 F 18-24).
Respondents mentioned numerous occasions throughout the day when they snacked.
These snacking occasions occurred mid-morning, mid-afternoon, and in the evening
while watching television. The types of snacks consumed included the following:

17
fruit, biscuits, crisps, chocolate and cereal bars. These snack foods were chosen for
their convenience, satiating qualities and taste. A young female respondent noted:
“You can eat a bar of chocolate while walking along a street as it’s convenient,
small, it’s quick and it makes you feel better afterwards”. (Consumer 8 F 25-34).
Drinks, which were considered suitable for snacking included tea, coffee, water, fruit
juice and energy drinks. Healthy alternatives to indulgent snack foods included: fruit,
nuts, yoghurts, and cereal bars.
“I would consider yoghurts a healthy snack as they have different types of bacteria
in them. They are natural, they are good for your bones as there is a lot of calcium
in them, and they are tasty as well”. (Consumer 5 M 18-24).
Fruit was considered a good example of a food product that could be consumed on-
the-go. Bananas were chosen for eating on-the-go because they were easy to eat and
are covenient, while satsumas, rather than oranges, were chosen to eat on-the-go
because they were small and easy to peel:
“I would normally eat bananas when I’m on-the-go as you can just grab it and eat it
from the hand. Bananas are easy, good for you, and they are filling”. (Consumer 8
F 25-34).
Respondents also mentioned cereal and energy bars as foods chosen for eating on-
the-go as they were considered filling and tasty. Savoury products such as popcorn
and crisps were eaten because they were seen as convenient.
A number of problems associated with eating on-the-go were reported by
respondents. One problem experienced by respondents whilst eating on-the-go was a
lack of cleanliness associted with consuming certain foods. Other problems reported
were the lack of provision of utensils for products such as salads and yoghurts, the
disposal of packaging, and the package size:
“Oranges are very messy and I generally wouldn’t choose an orange when eating

18
on-the-go as I would have to find a bin and wash my hands. The little mandarin
oranges are much handier. I find smaller foods are much easier to cope with than
bigger foods when eating on-the-go”. (Consumer 2 F 25-34).
Suggestions for ways in which products could be modified for ease of eating on-the-
go included: making portion sizes smaller; providing utensils such as spoons, forks
and straws; more portable and user-friendly packaging; and drinkable products such
as yoghurts for ease of eating on-the-go. A young female consumer noted the lack of
provision of cutlery for healthy products such as salads:
“A huge criticism I would have is that a lot of Irish supermarkets sell salads, but if
you were to snack on something like that in the car, you rarely get cutlery with it.
So I would see it as a deterrent to people eating good food on-the-go. It is easier to
eat a burger, chips or crisps”. (Consumer 3 F 25-34).
3.1.4 Meal Replacement Beverages
Interviewees had mixed views on the meal replacement beverage concept. An elderly
female respondent had a negative attitude towards the meal replacement beverage:
“A meal replacement beverage wouldn’t appeal to me at all. I like my cereal and I
like to sit down and relax over it for 10 to 15 minutes. I like to enjoy my meal and
prepare it my self”. (Consumer 1 F 55-64).
However, there were also respondents who had positive attitudes towards the meal
replacement beverage. A middle-aged female consumer perceived meal replacements
as ideal for her busy lifestyle:
“I would purchase one, because everyone is more aware of nutritional value these
days and you need more energy to keep going, because people have busy schedules
and are normally travelling somewhere”. (Consumer 4 F 35-44).
Respondents did not think that the meal replacement beverage was a full substitute
for a solid breakfast and therefore would not consume the beverage every day during
the week:

19
“No I wouldn’t consume one every day during the week. I don’t think it could fully
replace solid food”. (Consumer 5 M 18-24).
The most significant attributes for consumers for the meal replacement beverages
were: health benefits, packaging, price and taste. The health benefits of the meal
replacement beverage were important for respondents, and, in particular, the vitamin
and mineral content. Respondents deemed breakfast an important meal in terms of
aquiring their intake of vitamins and minerals and they said that the breakfast drink
should contain similar vitamins and minerals to the meal it was designed to
substitute. The addition of healthy ingredients was seen as an extra benefit, and an
opportunity to gain some extra vitamins and minerals or an additional health benefit
from the product:
“The drink should be healthy. You don’t want to be buying something that
has been processed and modified and isn’t a healthy alternative. It should be
equal to what you would have eaten”. (Consumer 8 F 25-34).
The packaging of the meal replacement drink was also important to respondents. For
an on-the-go product, the most important packaging attributes were that it was
portable and resealable:
“If it’s a complete meal on-the-go beverage it would have to be portable.
You want it to be handy so you can carry it along as you walk”. (Consumer 5
M 18-24).
The packaging formats favoured by consumers for the meal replacement beverage
were the pouch, the plastic bottle and the carton. The glass bottle was deemed
unsuitable for an on-the-go beverage due to its weight, poor resealability and the
possibility of it breaking:
“I think the pouch would probably be the best because it is squeezable, it’s easy to
fold away when it’s finished unlike the plastic or glass bottles”. (Consumer 5 M 18-

20
24).
“I would eliminate the glass bottle and the can as I just don’t like drinking out of a
can and the glass would be too heavy”. (Consumer 3 F 24-34).
The general view from respondents was that breakfast was not an expensive meal,
and should cost in the region of �2. If the product was too expensive it would affect
the purchase intention for some consumers. Alternatively, some respondents justified
paying �5 for a complete meal:
“I would pay around �2. If it was too cheap people probably wouldn’t buy it or
trust it, but if it’s too expensive people probably wouldn’t buy it either”. (Consumer
7 F 18-24)
Flavour was also one of the important attributes for respondents regarding the meal
replacement beverage and the most popular flavours were strawberry and orange.
Some examples of other flavours mentioned by respondents were pineapple, banana,
and apple. Respondents continually referred to breakfast as being a healthy meal
throughout the interviews. Therefore, it was not surprising that the positioning
statement most favoured by respondents for the meal replacement product was: ‘a
healthy way to start the day’. Respondents also favoured the ‘healthy and natural’
statement. A young male’s view on the product positioning statement is presented
below:
“I would prefer the option: “a healthy way to start the day”. Generally my breakfast
would be healthy so I would like to replace that with a healthy option”. (Con 5 M
18-24)
3.2 Results of the Conjoint Questionnaires
The attributes and their associated levels to be used in the conjoint questionnaire for
the meal replacement beverage were selected by combining attributes generated from
the interviews for the meal replacement beverage and product design features
identified by process engineers engaged in the project. These attributes and their
levels are shown in Table 2. The profile of the respondents is in Table 3.

21
Table 2: Attributes and levels to be used in the conjoint study
Attribute Level Type of Drink Rice Milk Oat Bran and Carrot Fruit Soup Fruit Flavour Strawberry Orange Banana Health Benefit Boosts the Immune System Aids the Digestive System None Size 250ml 330ml 500ml Packaging Format Plastic Bottle Pouch Carton Price �1.50 �2.50 �4.00
3.2.1 Eating Habits and Travel Patterns
A high proportion (49 per cent) of consumers skipped breakfast at least occasionally
during the week. For 59 per cent of those consumers who skipped breakfast this was
due to time constraints. However, hunger was the main reason why 47 per cent of
respondents chose to eat breakfast. There was a high frequency of snacking
throughout the day by the consumers surveyed, with hunger being the main reason
why 43 per cent of the respondents snacked. Cars were the main mode of transport
used by 61 per cent of the respondents to travel to work with journey times ranging
from 15 minutes to 1 hour.

22
Table 3: Consumer demographic profile (n = 294)
Factor n % Gender Male 115 39.1 Female 179 60.9 Age Group 18-24 78 26.5 25-34 111 37.8 35-44 61 20.7 45-54 29 9.9 55-65 15 5.1 Marital Status Single 163 55.4 Married 104 35.4 Co-habiting 21 7.1 Separated/Divorced 4 1.4 Widowed 2 0.7 Educational Level Primary 2 0.7 Secondary 76 25.8 Third level 216 73.5 Occupational Status Full-Time 189 64.3 Part-Time 35 11.9 Student 45 15.3 Retired 4 1.4 Unemployed 1 0.3 Other 20 6.8 Household Income Less than �199 28 9.5 �200-399 42 14.3 �400-599 48 16.3 �600-799 18 6.1 �800-999 23 7.8 �1000 and above 48 16.3 Declined to answer 87 29.6
3.2.2 Results of Conjoint Analysis
The first stage of the conjoint analysis was to identify consumers’ overall preferences
for meal replacement beverages. Figure 1 summarises the averaged results for the
overall conjoint analysis. The column on the extreme left indicates the importance for
each factor as it relates to the ratings and the utility column contains the utility
estimates for levels of the factors. The utilities indicate how each factor level relates
to preferences. Results from Figure 1 indicated that price was the most important
attribute overall (importance = 22.59) to the respondents surveyed. Both the health
benefit and flavour were also important attributes and had similar importance values

23
of 19.83 and 19.41 respectively. Size and packaging format were the least important
of the factors to respondents, with importance values of 11.23 and 9.74 respectively.
Averaged Importance Utility Factor ���������� FLAVOUR Flavour �19.41 � .4101 �-- Orange � ��������� -.6075 --� Banana � .1975 �- Strawberry � ��������� CARRIER Base Product �17.21 � .2207 �- Rice � �������� -.3309 -� Oat Bran and Carrot � .1102 � Fruit Soup � ���������� FUNCTION Health Benefit �19.83 � .4911 �-- Boosts ImmuneSystem � ��������� .4299 �-- Aids DigestiveSyste � -.9210 ----� None � ����������� PRICE Price �22.59 � .8432 �--- �1.50 � ���������� .1589 �- �2.50 � -1.0021 ----� �4.00 � ������ SIZE Size 11.23� � -.0899 � 250ml � ����� -.0571 � 330ml � .1470 �- 500ml � ����� PACKAGIN Packaging Format 9.74 � � .0523 � Plastic Bottle � ���� .0104 � Pouch � -.0627 � Carton � 4.7118 CONSTANT
Figure 1: Conjoint analysis subfile summary
When analysing the utilities for each attribute, a clearer image of consumers’
preferences can be seen. As expected, the lower price of �1.50 was most preferred by
consumers. Respondents were responsive to price, as there was a preference for both
prices of �1.50 and �2.50, but respondents did not score the price of �4.00 highly
(See Appendix C, Figure 1). Of the 294 respondents, 78 respondents indicated that
they preferred a higher price of either �2.50 or �4.00 to that of the lower price of
�1.50. This could be explained by the fact that for these subjects there may have been
interaction between price and perceptions of quality.

24
In terms of health benefits respondents had a strong preference for the presence of a
health benefit and had a slightly higher overall preference for the health benefit
‘boosting the immune system’ over ‘aiding the digestive system’’ (See Appendix C,
Figure 2). The flavour most preferred by respondents was the orange flavour
followed by the strawberry flavour. Respondents did not score the banana flavour
highly (See Appendix C, Figure 3). The carrier that respondents most preferred was
rice milk, followed by fruit soup. Overall, there was a much lower preference for the
carrier of oat bran and carrot than for the other two (See Appendix C, Figure 4).
Respondents indicated that product size and packaging format were the least
important attributes of the meal replacement beverage. Respondents most preferred
the 500ml size and they had least preference for the 250ml and 330ml pack sizes
(See Appendix C, Figure 5). There was a preference for two packaging formats: the
plastic bottle and the pouch, with the plastic bottle being the most preferred.
Respondents had a lower preference for carton packaging (See Appendix C, Figure
6).
3.2.3 Cluster Analysis
The K-means cluster analysis revealed five clusters within the sample of 294 subjects
(See Figure 2).
Number of Cases in each Cluster
41.000114.00042.00065.00032.000
294.000.000
12345
Cluster
ValidMissing
Figure 2: Cluster group size
All five groups exhibited the expected relationship between price and utility, with a
preference for the lower price of �1.50. Other similarities across all consumer groups
included a preference for a functional meal replacement beverage and a low
preference for the banana flavour (See Figure 3).

25
Final Cluster Centers
1.32 .08 .21 .57 .35-2.35 -.27 -.62 -.31 -.141.03 .19 .42 -.26 -.21
.19 .05 .92 -.08 .55-.25 -.16 -2.34 -.10 1.12.06 .10 1.42 .18 -1.68.40 .20 .10 1.16 .79.11 .18 .34 1.23 .23
-.51 -.38 -.43 -2.39 -1.02.68 .71 .69 1.18 1.05.14 .13 -.03 .37 .12
-.82 -.84 -.66 -1.55 -1.16-.03 -.14 -.22 -.02 .03.05 .00 -.21 -.28 .25
-.02 .13 .44 .30 -.28.16 .02 .29 .07 -.31
-.19 .04 -.28 .06 .44.03 -.06 -.01 -.13 -.13
OrangeBananaStrawberryRiceOat Bran and CarrotFruit SoupBoosts Immune SystemAids Digestive SystemNone�1.50�2.50�4.00250ml330ml500mlPlastic BottlePouchCarton
1 2 3 4 5Cluster
Figure 3: Mean attribute utility values for each cluster
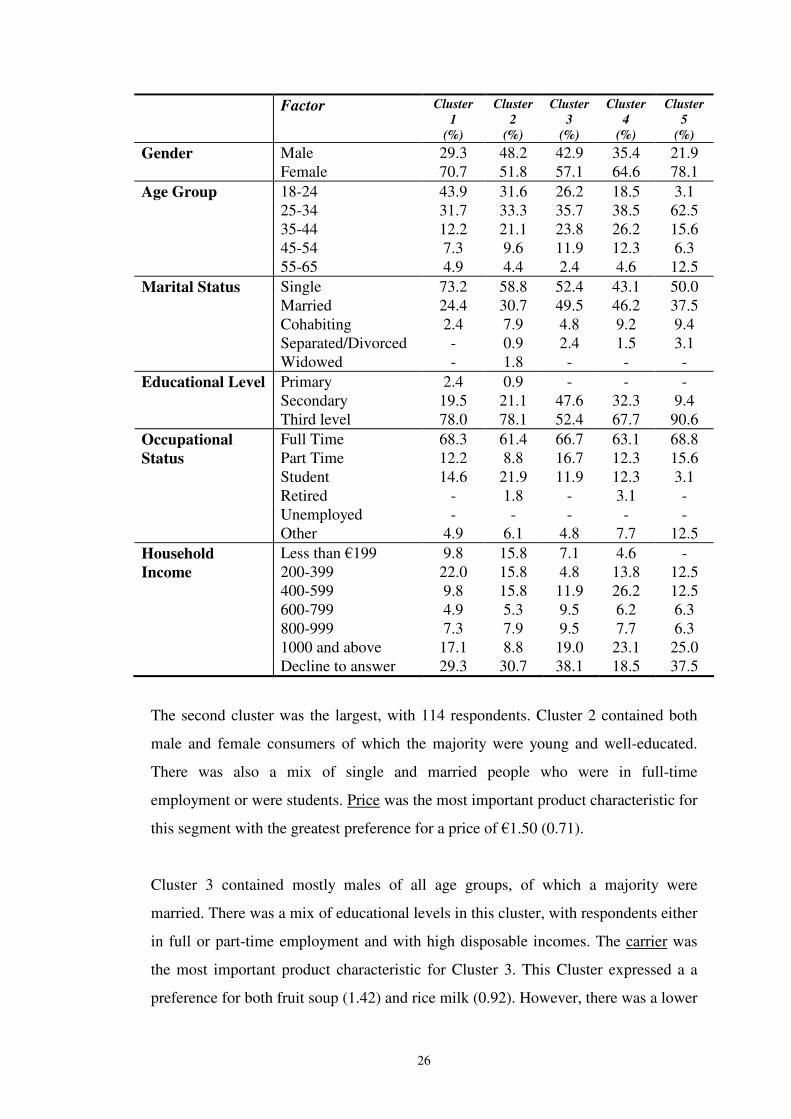
3.2.4 Cluster Preferences and Socio-demographic Profiles
There are differences in preferences between different demographic groups (See
Appendix D). Table 4 shows the demographic profile for each cluster. Each cluster is
broken down in terms of gender, age group, marital status, educational level,
occupational status and household net income.
Cluster 1 contained 41 consumers who were mainly young single females with
relatively low disposable incomes. Flavour was the most important product
characteristic for this segment of consumers. There was a preference for both orange
(utility=1.32) and strawberry (0.98) flavours. The banana flavour had a lower
preference (-2.35).
Table 4: Demographic profile for clusters
26
Factor Cluster 1
(%)
Cluster 2
(%)
Cluster 3
(%)
Cluster 4
(%)
Cluster 5
(%) Gender Male 29.3 48.2 42.9 35.4 21.9 Female 70.7 51.8 57.1 64.6 78.1 Age Group 18-24 43.9 31.6 26.2 18.5 3.1 25-34 31.7 33.3 35.7 38.5 62.5 35-44 12.2 21.1 23.8 26.2 15.6 45-54 7.3 9.6 11.9 12.3 6.3 55-65 4.9 4.4 2.4 4.6 12.5 Marital Status Single 73.2 58.8 52.4 43.1 50.0 Married 24.4 30.7 49.5 46.2 37.5 Cohabiting 2.4 7.9 4.8 9.2 9.4 Separated/Divorced - 0.9 2.4 1.5 3.1 Widowed - 1.8 - - - Educational Level Primary 2.4 0.9 - - - Secondary 19.5 21.1 47.6 32.3 9.4 Third level 78.0 78.1 52.4 67.7 90.6
Full Time 68.3 61.4 66.7 63.1 68.8 Occupational Status Part Time 12.2 8.8 16.7 12.3 15.6 Student 14.6 21.9 11.9 12.3 3.1 Retired - 1.8 - 3.1 - Unemployed - - - - - Other 4.9 6.1 4.8 7.7 12.5
Less than �199 9.8 15.8 7.1 4.6 - 200-399 22.0 15.8 4.8 13.8 12.5 400-599 9.8 15.8 11.9 26.2 12.5
Household Income
600-799 4.9 5.3 9.5 6.2 6.3 800-999 7.3 7.9 9.5 7.7 6.3 1000 and above 17.1 8.8 19.0 23.1 25.0 Decline to answer 29.3 30.7 38.1 18.5 37.5
The second cluster was the largest, with 114 respondents. Cluster 2 contained both
male and female consumers of which the majority were young and well-educated.
There was also a mix of single and married people who were in full-time
employment or were students. Price was the most important product characteristic for
this segment with the greatest preference for a price of �1.50 (0.71).
Cluster 3 contained mostly males of all age groups, of which a majority were
married. There was a mix of educational levels in this cluster, with respondents either
in full or part-time employment and with high disposable incomes. The carrier was
the most important product characteristic for Cluster 3. This Cluster expressed a a
preference for both fruit soup (1.42) and rice milk (0.92). However, there was a lower

27
preference for the use of oat bran and carrots (-2.34) for this group. Price was the
second most important attribute with a preference (0.69) for the lowest price of
�1.50.
Cluster 4 consumers were middle-aged female consumers who were married, had
mixed educational levels, and had medium range disposable incomes. For those in
Cluster 4, the functional health benefit was the most important attribute. There were
similar preferences for having either of the health benefits, ‘boosting the immune
system’ (1.16) or ‘aiding the digestive system’ (1.23). Price was also important to
cluster 4, with a preference for the lower price of �1.50 (1.18).
Cluster 5 consumers were mostly young females, both single and married, who were
well educated and had high disposable incomes. For this cluster of consumers the
carrier was the most important factor. However, unlike Cluster 3, there was a
preference for oat bran and carrot (1.12) and a lower preference for the use of fruit
soup carrier (-1.68). Both price and health benefit were important to this conumer
segment. The lower price of �1.50 was preferred (1.05) and there was also a
preference for a health benefit ‘boosting to the immune system’ (0.79).
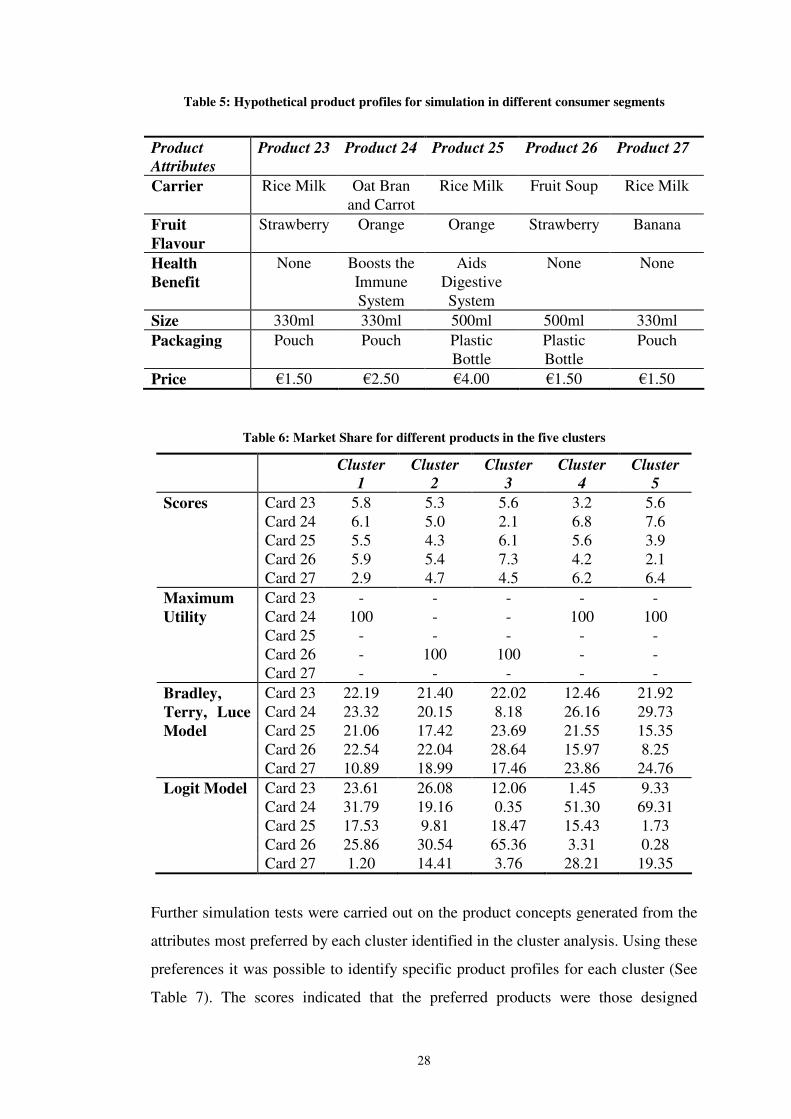
3.2.5 Simulations
Five alternative meal replacement beverage concepts were developed from
information generated from the qualitative aspect of this research and from technical
personnel, process engineers and sensory scientists, working on the project. The
market shares for these hypothetical product profiles were tested for the five
segments identified in this study (See Table 5).
Clusters 1, 4 and 5 most preferred Product 24 (oat bran and carrot, orange flavour,
boosts the immune system, 330ml, pouch, �2.50) and Product 26 (fruit soup,
strawberry flavour, no health benefit, 500ml, plastic bottle, �1.50) was most preferred
by Clusters 2 and 3 (See Table 6). The probability choice models, the maximum
utility, the Bradley, Terry, Luce and Logit models values corresponded with the
results found for the preference score for each cluster (See Table 6).
28
Table 5: Hypothetical product profiles for simulation in different consumer segments
Product Attributes
Product 23 Product 24 Product 25 Product 26 Product 27
Carrier Rice Milk Oat Bran and Carrot
Rice Milk Fruit Soup Rice Milk
Fruit Flavour
Strawberry Orange Orange Strawberry Banana
Health Benefit
None Boosts the Immune System
Aids Digestive System
None None
Size 330ml 330ml 500ml 500ml 330ml Packaging Pouch Pouch Plastic
Bottle Plastic Bottle
Pouch
Price �1.50 �2.50 �4.00 �1.50 �1.50
Table 6: Market Share for different products in the five clusters
Cluster 1
Cluster 2
Cluster 3
Cluster 4
Cluster 5
Scores Card 23 5.8 5.3 5.6 3.2 5.6 Card 24 6.1 5.0 2.1 6.8 7.6 Card 25 5.5 4.3 6.1 5.6 3.9 Card 26 5.9 5.4 7.3 4.2 2.1 Card 27 2.9 4.7 4.5 6.2 6.4
Card 23 - - - - - Maximum Utility Card 24 100 - - 100 100 Card 25 - - - - - Card 26 - 100 100 - - Card 27 - - - - -
Card 23 22.19 21.40 22.02 12.46 21.92 Card 24 23.32 20.15 8.18 26.16 29.73
Bradley, Terry, Luce Model Card 25 21.06 17.42 23.69 21.55 15.35 Card 26 22.54 22.04 28.64 15.97 8.25 Card 27 10.89 18.99 17.46 23.86 24.76 Logit Model Card 23 23.61 26.08 12.06 1.45 9.33 Card 24 31.79 19.16 0.35 51.30 69.31 Card 25 17.53 9.81 18.47 15.43 1.73 Card 26 25.86 30.54 65.36 3.31 0.28 Card 27 1.20 14.41 3.76 28.21 19.35
Further simulation tests were carried out on the product concepts generated from the
attributes most preferred by each cluster identified in the cluster analysis. Using these
preferences it was possible to identify specific product profiles for each cluster (See
Table 7). The scores indicated that the preferred products were those designed
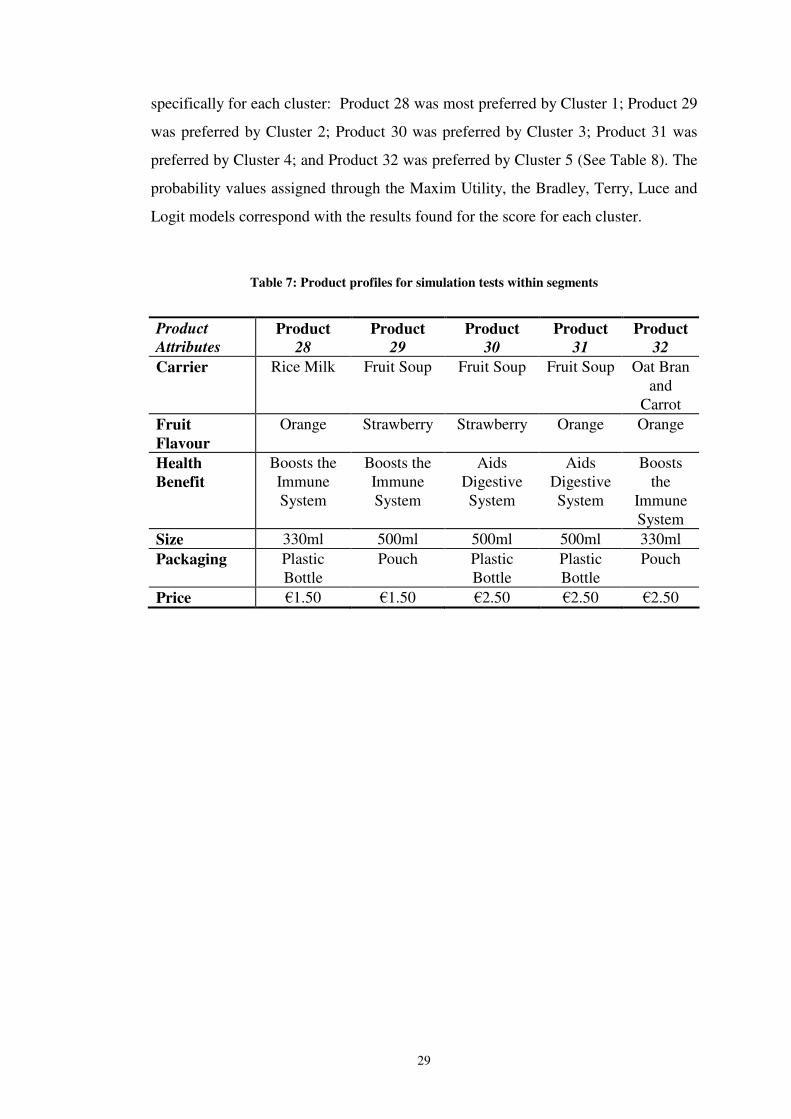
29
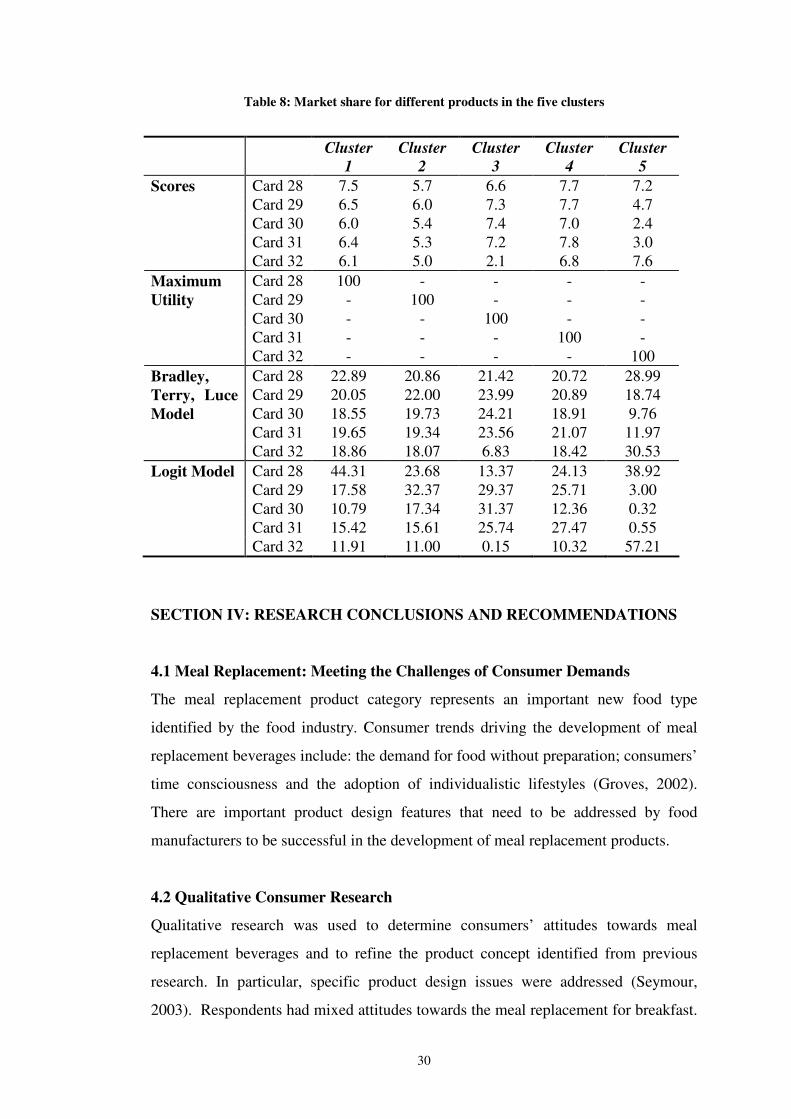
specifically for each cluster: Product 28 was most preferred by Cluster 1; Product 29
was preferred by Cluster 2; Product 30 was preferred by Cluster 3; Product 31 was
preferred by Cluster 4; and Product 32 was preferred by Cluster 5 (See Table 8). The
probability values assigned through the Maxim Utility, the Bradley, Terry, Luce and
Logit models correspond with the results found for the score for each cluster.
Table 7: Product profiles for simulation tests within segments
Product Attributes
Product 28
Product 29
Product 30
Product 31
Product 32
Carrier Rice Milk Fruit Soup Fruit Soup Fruit Soup Oat Bran and
Carrot Fruit Flavour
Orange Strawberry Strawberry Orange Orange
Health Benefit
Boosts the Immune System
Boosts the Immune System
Aids Digestive System
Aids Digestive System
Boosts the
Immune System
Size 330ml 500ml 500ml 500ml 330ml Packaging Plastic
Bottle Pouch Plastic
Bottle Plastic Bottle
Pouch
Price �1.50 �1.50 �2.50 �2.50 �2.50
30
Table 8: Market share for different products in the five clusters
Cluster
1 Cluster
2 Cluster
3 Cluster
4 Cluster
5 Scores Card 28 7.5 5.7 6.6 7.7 7.2 Card 29 6.5 6.0 7.3 7.7 4.7 Card 30 6.0 5.4 7.4 7.0 2.4 Card 31 6.4 5.3 7.2 7.8 3.0 Card 32 6.1 5.0 2.1 6.8 7.6
Card 28 100 - - - - Maximum Utility Card 29 - 100 - - - Card 30 - - 100 - - Card 31 - - - 100 - Card 32 - - - - 100
Card 28 22.89 20.86 21.42 20.72 28.99 Card 29 20.05 22.00 23.99 20.89 18.74 Card 30 18.55 19.73 24.21 18.91 9.76
Bradley, Terry, Luce Model
Card 31 19.65 19.34 23.56 21.07 11.97 Card 32 18.86 18.07 6.83 18.42 30.53 Logit Model Card 28 44.31 23.68 13.37 24.13 38.92 Card 29 17.58 32.37 29.37 25.71 3.00 Card 30 10.79 17.34 31.37 12.36 0.32 Card 31 15.42 15.61 25.74 27.47 0.55 Card 32 11.91 11.00 0.15 10.32 57.21
SECTION IV: RESEARCH CONCLUSIONS AND RECOMMENDATIONS
4.1 Meal Replacement: Meeting the Challenges of Consumer Demands
The meal replacement product category represents an important new food type
identified by the food industry. Consumer trends driving the development of meal
replacement beverages include: the demand for food without preparation; consumers’
time consciousness and the adoption of individualistic lifestyles (Groves, 2002).
There are important product design features that need to be addressed by food
manufacturers to be successful in the development of meal replacement products.
4.2 Qualitative Consumer Research
Qualitative research was used to determine consumers’ attitudes towards meal
replacement beverages and to refine the product concept identified from previous
research. In particular, specific product design issues were addressed (Seymour,
2003). Respondents had mixed attitudes towards the meal replacement for breakfast.

31
A majority of respondents had positive views of meal replacement beverages,
deeming them an ideal way to consume ‘breakfast on-the-go’ for time conscious
consumers. However, meal replacement beverages were thought to be suitable for
occasional rather than consistent replacement of solid foods for breakfast.
One important association with breakfast identified from the interviews was the
consumption of fruit, dairy and cereal-based products. These food constituents should
be considered key ingredients on which the meal replacement product should be
based. The interviews also showed that consumers expected the products consumed
at breakfast time to be healthy as breakfast was considered important in terms of
vitamin and mineral intake. Consumers also expected foods consumed at breakfast
time to be low in fat and calories, high in fibre, natural and to be satiating. Other key
design features necessary for products developed for the ‘on-the-go’ market are
portability, convenience and provision of utensils if required.
4.3 Segmentation and Product Design
The conjoint analysis methodology was very useful for identifying key product
design attributes and consumer segments (Bogue et al., 2002). It helped to identify
consumer segments that expressed a preference for a functional meal replacement
beverage and represented viable market opportunities. The key consumer drivers for
the meal replacement beverage were price, functional health benefit, flavour and the
base product. These key drivers represent opportunities for the optimal refinement of
innovative meal replacment beverages.
Conjoint analysis allowed the identification of the key factors that influenced
consumers’ purchase decisions for a meal replacement beverage. For example, this
research revealed that consumers most preferred orange and strawberry flavour
profiles and least preferred the banana flavoured meal replacement beverage. The
inclusion of a functional health benefit would also aid in the success of the meal
replacement product, with certain segments having a preference for the health benefit
‘boosting the immune system’ and other segments having a preference for the health
benefit ‘aiding the digestive system’. Therefore, it is possible to design alternative
products for each of the consumer segments in a market-oriented fashion.

32
Cluster 2 represented the most attractive business opportunity, contained the greatest
number of consumers, and had a broad socio-demographic representation. This
cluster had a preference for a strawberry flavoured fruit soup-based beverage with the
health benefit “boosts the immune system”. There was a preference for a volume of
500ml, in a pouch packaging and having a price of �1.50. Cluster 4 may be the most
viable cluster to develop a product for as it was driven by functionality.
There was a further segment of health conscious consumers who had a preference for
a meal replacement beverage based on rice milk or oat bran and carrot. This cluster,
Cluster 5, contained young well-educated consumers with high disposable incomes.
A product developed specifically for these consumers would have an oat bran and
carrot base, with and orange flavour, contain the health benefit “boosts the immune
system”, have a volume of 330ml, be packaged in a pouch and be priced at �2.50.
4.4 Premium Pricing Strategies for a Functional Product
Numerous researchers, such as Gil and Sánchez (1997) and Poulsen (1999), have
identified the conjoint technique as a powerful tool, which allowed companies to test
alternative pricing strategies and to analyse consumers price sensitivity for a product.
According to Heasman and Mellentin (2001) the key issue concerning the pricing
strategy for functional foods relates to identifying the premium which consumers are
willing to pay.
This research found that a majority of consumers were unwilling to pay a high price
(�4) for a meal replacement beverage. While the price of �1.50 was preferred, they
were willing to pay a price of �2.50. The consumers who indicated that they preferred
a higher price in the conjoint questionnaire were prepared to pay the higher price of
�4.00 as they equated price with quality. According to Childs (1997) the ability to
achieve a premium for nutritional functionality depends on the perception of the
product as a quality product. Therefore, manufacturers need to focus on setting the
optimum price for new meal replacement products targeted at specific segments.
4.5 Positioning Strategies and Communication

33
Breakfast was perceived as a healthy and natural meal and, therefore, a meal
replacement product designed to replace breakfast should be positioned as a healthy
and natural product. The preference for the positioning statement of ‘a healthy way to
start the day’ for the meal replacement product reflected this consumer association of
‘health’ with breakfast.
The communication of the meal replacement’s nutritional profile and health benefits
was important to consumers. These health aspects could be communicated to
consumers by way of in-store education of consumers and the use of health and
nutritional informational leaflets. The promotional tool of in-store product sampling
could be used to allow consumers to experience sensory aspects of the meal
replacements. Consumers also need to be informed of the product’s satiating
properties to differentiate it from similar products on the market. Therefore, the
positioning of meal replacement products should be on a healthy and natural
platform.
4.6 The Importance of Market Research in NPD
This study highlighted the role of market research throughout the NPD process.
Qualitative research was essential for guiding and refining the meal replacement
concept at the early stages of the NPD process. The involvement of the consumer was
vital in selecting the key attributes for the meal replacement beverage, which were
then used in the quantitative part of the study.
Conjoint analysis helps food product developers understand product design attributes
that meet specific consumer value; analyse consumer price sensitivities, and estimate
market shares in alternative competitive scenarios. Conjoint analysis also generated
information for market segmentation through identifying the intrinsic and extrinsic
attributes that were of most importance to specific consumer groups.
The use of qualitative and quantitative research throughout the NPD process can give
guidance to all members of the NPD team for the development of the meal
replacement beverage.

34
4.7 Research Recommendations
Much research has been conducted to identify strategies to improve the success rate
of developing new products. Consumer-oriented NPD, which involves integrating the
consumer throughout the whole NPD process, has been identified as an important
strategy to increase the consumer acceptance of new products. It is recommended that
new product developers incorporate qualitative research into the early stages of the
development process so as to identify and refine new product concepts. The
qualitative and quantitative research identified consumer expectations and
requirements associated with the breakfast meal occasion. These requirements can be
addressed by marketers seeking opportunities in the meal replacement part of the
food market. Design features which should be incorporated by manufacturers for the
meal replacement beverage are that it should be based on either fruit, cereal or dairy
products, avoid strong flavours, and have a functional health benefit. An important
element, which manufacturers need to decide on, is the pricing strategy for functional
beverages. A final element of the marketing strategy is the positioning of the meal
replacement as a healthy and natural drink.
4.8 Suggestions for Further Research
This research demonstrated the usefulness of the conjoint analysis methodology in
identifying the intrinsic and extrinsic drivers of consumer food choice for meal
replacement beverages and the market segments to which such a product appeals.
Further quantitative studies using conjoint and cluster analysis to identify consumer
preferences for a range of meal complement beverages could be useful. The
apparently irrational preferences for higher priced products that were revealed in the
conjoint analysis could also be investigated. Further qualitative research with
selected market segments that seek to optimise the meal replacement and meal
complement product concepts, would contribute to product design information. This
would provide market-oriented information for technical personnel.
35
REFERENCES Aaker, D.A., Kumar, V. and Day, G.S. (1998). Marketing Research, New York:
John Wiley and Sons Inc.
Berry, D. (1999). Buy me! Dairy Foods, May.
Bogue, J., Sorenson, D. and Delahunty, C. (2002). Determination of Consumers’
Sensory Preferences for Full-fat and Reduced-fat Dairy Products, Agribusiness
Discussion Paper No. 37, Department of Food Economics, University College Cork,
Cork.
Buisson, D. (1995). Developing New Products for the Consumer. In: Food Choice
and the Consumer, (Marshall, D.W., Ed.), London: Blackie Academic and
Professional.
Business Wire. (2002). Quench Bottled Water Adding Major New Distribution
Channel With High Visibility Vending Machines to Build Brand Awareness and
Sales, Business Wire, December 3.
Calatone, R.J. and Cooper, R.G. (1979). A Discriminate Model for Identifying
Scenarios of Industrial New Product Development Failure, Journal of Academy of
Marketing Science, 7, 163-183.
Childs, N.M. (1997). Functional Foods and the Food Industry: Consumer, Economic
and Product Development Issues, Journal of Nutraceuticals, Functional and Medical
Foods, 1, 2, 25-43.
Cooper, R.G. (1993). Winning at New Products: Accelerating the Process from Idea
to Launch, United States of America: Addison-Wesley Publishing Company.
CSO. (2002). Central Statistics Office Ireland, Census of Population 2002,
www.cso.ie
Datamonitor. (2001). ‘On-The-Go’ Snack Market, In: Food On-The-Go Increasing
as Habits Change, Eurofood, May 10.
Delahanty, L. (2002). Do Meal Replacements Work? American Dietetics
Association, April.
Eurofood. (2001). Food On-The-Go Increasing as Habits Change, Eurofood, May
10.
Food Agency Co-operation Council. (2003). Market Led New Product
Development in the Food and Drink Industry. Dublin: Department of Agriculture
and Food.
36
Gil, J.M. and Sánchez, M. (1997). Consumer Preferences for Wine Attributes: a
Conjoint Approach, British Food Journal, 99, 1, 3-9.
Green, P.E. and Krieger, A.M. (1991). Segmenting Markets with Conjoint
Analysis, Journal of Marketing, 55, 4, 20-31.
Green, P.E. and Srinivasan, V. (1978). Conjoint Analysis in Consumer Research:
Issues and Outlook, Journal of Consumer Research, 5, September, 103-122.
Gofton, L. (1995). Convenience and the moral status of consumer practices. In:
Food choice and the consumer, (Marshall, D.W., Ed.), London: Blackie Academic
and Professional.
Groves, A.M, (2002). Food Consumption 2002. UK: Institute of Grocery
Distribution. Watford: IGD Business Publication.
Grunert, K.G., Baadsgaard, A., Larsen, H.H. and Madsen, T.K. (1996). Market
Orientation in Food and Agriculture, USA: Kluwer Academic Publishers. Heasman, M. and Mellentin, J. (2001). The Functional Foods Revolution. Healthy
People, Healthy Profits? Surrey: Leatherhead International.
Hoban, T.J. (1998). Improving the Success of New Product Development, Food
Technology, 52, 1, 46-49.
Hollingsworth, P. (2000). Functional Beverage Juggernaut Faces Tighter
Regulations, Food Technology, 54, 11, 50-53.
Hollingsworth, P. (2003). Food and the Ageing Consumer, Food Technology, 57, 7,
28-30.
Horgan, M. (2004). Demand for Food-on-move Keeps Producers on their Toes, Irish
Examiner, June 18.
Kumar, R. (1999). Research Methodology: a Step-by-Step Guide for Beginners,
London: Sage Publications.
Leatherhead Food International. (2003). Drinks On The Go - International Trends
and Developments, Leatherhead Food International. Surrey: January.
Leatherhead Food RA. (2002). Food On The Go - A Global Analysis, Leatherhead
Food RA. Surrey: July.
Mellentin, J. (2003). Functional Foods Turns out to be a Beverage Business, New
Nutrition Business, 8, 4.

37
Moskowitz, H.R., Flores, L., Beckley, J., Mascuch, T.C., Cleveland, C.E. and
Ewald, J.D. (2002). Crossing the Knowledge and Corporate Boundaries to
Systematize Invention and Innovation, ESOMAR Congress, Barcelona, September.
Narver, J.C. and Slater, S.F. (1990). The effect of a Market-Orientation on
Business Profitability, Journal of Marketing, 54, 4, 20-34.
New Nutrition Business. (2003). Cadbury aims to take Meal Replacements
Mainstream, New Nutrition Business. 8, 4, 13.
Nutrition Business Journal. (2002). In: Meals without Replacements - The
Replacements, Beverage World, November.
Patton, M.Q. (1990). Qualitative Evaluation and Research Methods, London: Sage
Publications.
Poulsen, J.B. (1999). Danish Consumers’ Attitudes Towards Functional Foods,
MAPP Working Paper, No. 62, February, Denmark: Aarhus School of Business.
Prepared Foods. (1999). New Smoothie Brands Touts Health, June,
http//www.preparedfoods.com .
Prince, G.W. (2002). Meals without Replacements - The Replacements, Beverage
World, November, 47-48.
Punch, K.F. (1998). Introduction to Social Research: Quantitative and Qualitative
Approaches, London: Sage Publications.
Roberts, W.A. (2003). Bar None, Prepared Foods, April.
http//.www.preparedfoods.com.
Seymour, C. (2003). Consumer-oriented Development of New Functional Drinks:
Meal Replacements and Meal Complements, Unpublished MSc Food Business
Thesis, Department of Food Business and Development, University College Cork.
Sloan, A.E. (1999). The New Market: Foods for the not so Healthy, Food
Technology, 53, 2, 54-60.
Sloan, A. E. (2003). What, When, and Where Americans Eat: 2003, Food
Technology. 57, 8, 48-68.
SPSS. (2001). SPSS Training for Conjoint Analsysis. Dublin: SPSS Ireland.
Starling, S. (2002). Functional Beverages Pour It On, Functional Foods and
Nutraceuticals, July/August.
Steenkamp, J-B.E.M. (1987). Conjoint Measurement in Ham Quality Evaluation,
Journal of Agricultural Economics, 38, 3, 473-480.

38
Traill, B. and Grunert, K. (1997). Product and Process Innovation in the Food
Industry, London: Blackie Academic and Professional.
Urban, G.L. and Hauser, J.R. (1993). Design and Marketing of New Products,
New York: Ridge Press/Random House.
Watson, K. (2003). No bar to Breakfast, Food Manufacture, Supplement,
September, 25-26.
Zenith International. (2000). International Market for Functional Soft Drinks, In
association with The Centre for Food and Health Studies, Bath: Zenith International
Ltd.