discussion paper brian emmett and geoffrey emmett · discussion paper brian emmett and geoffrey...
TRANSCRIPT

June 2015
Charities in Canada as an Economic Sector Discussion Paper
brian emmett and geoffrey emmett

Charities in Canada as an Economic Sector: Discussion PaperBrian Emmett and Geoffrey Emmett
Published byImagine Canada65 St. Clair Avenue East, Toronto, Ontario, Canada M4T 2Y3T 416 597 2293 | F 416 597 2294
Copyright ©2015 Imagine Canada
Copy editors: Marnie Grona, David Lasby, Cornelia Schrecker Design and production: Shanti Hadioetomo French translation: Cornelia Schrecker
All rights reserved. The content of this publication may be reproduced, in whole or in part, by charitable and nonprofit organizations for non-commercial use and where Imagine Canada is acknowledged as the original publisher including year of publication, publication title, and original document source (electronic publication link or website link). Otherwise, no part of this report may be reproduced without prior written agreement from Imagine Canada.

- 3 -
table of contents
Summary 4
1. Introduction 6
2. The Role and Scope of the Charitable Sector in Canadian economy 9
2.1. Charitable Sector Contribution to GDP and Employment is Large and has been Growing 9
2.2. The Charitable Sector Shares Many of the Characteristics of the Broader Service Sector of the Economy 11
2.3. The Charitable Sector has Much in Common with the Small Business Sector 13
2.4. Productivity and Innovation in the Charitable Sector 16
2.5. The Charitable Sector as a Place to Work 18
3. Revenue for Charitable Organizations 21
3.1. Sources of Funds for Broad and Core Charitable Sectors 21
3.2. Donations 24
3.3. Government Funding 26
3.4. Membership Fees and Sales of Goods and Services 29
4. Policy Implications 30
About the Authors 32

- 4 -
summary
1. The charitable sector has expanded rapidly in the last
two decades and is now a major sector in Canada,
supporting a large number of jobs and creating
significant economic growth.
2. This growth is not supply driven — created by an increase
in the number of charities — but is driven by demand. As
population grows, ages and becomes more diverse and as
economies become richer, the demand for the services
that the sector provides — health, social services, recreation,
culture and so on-tend to increase. The growth of the
charitable sector is thus driven by demand and value the
sector produces.
3. The sector has expanded rapidly in most advanced indus-
trial economies and is increasingly an integral part of the
global service and knowledge-based economy.
4. Because the growth in the charitable sector in Canada is
mirrored by similar developments in other advanced econ-
omies it provides Canada with an important and expanding
set of connections to growing economies worldwide.
5. The sector is in many ways similar to the small business
sector of the economy and makes a similar contribution to
jobs and growth. It also faces similar problems — for exam-
ple with financing, as well as with investment in innovation
and productivity improvements.

- 5 -
6. The jobs the sector creates are good ones, requiring skills
and education levels somewhat higher than the Canadian
work force in general. People enjoy high levels of job satis-
faction. The sector is also a good first employer for graduates
and new Canadians.
7. The rapid expansion of the sector and the jobs it has brought
with it have been financed by a combination of income
earned by the charitable sector from the sale of member-
ships and services, from government funding and from
donations from individuals.
8. Donations from individuals have shown a tendency to
weaken and government contributions are in decline as
a result of fiscal pressure.
9. Canada’s charities are at a financial crossroads. With tradi-
tional revenue sources declining, charities are increasingly
looking at ways to finance their nonprofit activities through
business income — both in areas directly related to their
charitable missions, and in areas that are not.
- 6 -
introduction1Charitable organizations are not like other firms in
the economy:
The charity sector will never be like other sectors. In-deed its special role means we don’t want it to be. It is driven by a sense of mission and passion — few are involved to maximize profits, improve share prices or earn as much as they can. 1
Nevertheless, it is useful from an economic point of view to
regard charities as being in many ways analogous to firms.
Each charity uses inputs — labour (volunteers and paid staff),
capital, material and energy — to produce outputs in pursuit of
its goals and objectives. Operations are paid from a number of
sources, including memberships, government grants and con-
tributions, and donations from corporations and individuals.
The sector as a whole consists of a large number of generally
quite small entities, which provide valuable but often diffi-
cult-to-measure services, from poverty alleviation to culture
and recreation.
The comparison with private sector firms is useful but not ex-
act — charities pose special problems from an economic point
of view. Charities are mission-oriented, often staffed largely or
in part by committed volunteers, and do not make a profit by
definition. In the absence of profit and share value (the market
economy’s effective way of comparing apples and oranges), it
is difficult for economists to develop a way of measuring the
performance of one charity compared to another, or of chari-
ties compared to other valuable economic activities. In addi-
tion, the services provided by charities tend to be difficult to
1 How do we Drive Productivity
and Innovation in the Charity
Sector, Dan Corry, Lecture
hosted by the Royal Society
for the encouragement of
the Arts, Manufactures and
Commerce, 8 May, 2014.

- 7 -
measure in dollar terms — poverty reduction, improvements in
literacy, reductions in recidivism, the provision of arts, culture
and recreation and myriad other services are highly valued,
but often intangible in nature. This makes the output of chari-
ties difficult to measure and to compare to other market-based
activities, such as providing haircuts or producing autos, for
example. Key indicators of economic performance, such as
productivity and innovation, can also be elusive.2
But the charitable sector in Canada is simply too large and
significant NOT to be looked at through the same lens as other
economic actors. Indeed, the sector is itself seeking to improve
its ability to speak the language of economics and position
itself appropriately as a source of jobs, innovation and growth
in the modern Canadian economy. 3 Taking an economic per-
spective opens up a wide range of questions of fact and analy-
sis — what is the structure of the sector? Is it labour or capital
intensive? Is it a source of (good) jobs and growth? How does it
fit into broader developments in the global knowledge econo-
my? Where does its revenue come from and what does this say
about the outlook for the sector?
The purpose of this paper is to take a balanced look at the
Canadian charitable sector from an economic point of view,
taking the same approach that an analyst looking at any sector
would take — be it semi-conductors or natural resources. It will
attempt to present a general picture of Canadian charities as an
economic sector using existing data and analyses.
The second section of the paper focuses on structure:
• the role and scope of the charitable sector in the economy
as compared to other types of economic activity;
• the charitable sector as a service sector;
• the charitable sector as a small business sector;
2 Government shares many
of these elements and
poses some of the same
challenges to economists.
3 The appointment of a Chief
Economist by Imagine
Canada is a good example
of this.

- 8 -
• the charitable sector as a source of innovation and
productivity growth in the economy; and,
• the charitable sector as an employer of staff and volunteers.
The third section turns to sources of revenue and the financial
sustainability of the sector. Section four then lays out some
preliminary and broad policy implications. Subsequent papers
are planned to look at two specific areas: the policy landscape
facing charities going forward and the growing interest in
social impact investing.

- 9 -
the role and scope of the charitable sector in canadian economy
2There has been rapid growth in organized voluntary activity
in both developed and developing economies over the past few
decades. Because of this “associational growth,” the sector’s
share of employment and income is growing, both here in
Canada and elsewhere in the world.4 This growth has naturally
caught the attention of economists and policy makers seeking
to understand the role of the sector in both an economic and
social context.
A Johns Hopkins University study of eight different countries
shows worldwide growth of the nonprofit sector outpacing the
growth of GDP in each of eight developed economies, with the
exception of the Czech Republic. In Canada, the nonprofit sector
is growing at 6.4% annually compared to 5.6% for GDP.
2.1 Charitable Sector Contribution to GDP and Employment is Large and has been Growing
FIGURE 1
Average annual growth, Nonprofit vs. aggregate GDP
Source State of Global
Civil Society and Volunteering,
Johns Hopkins University, 2013
4 The Rise of the Nonprofit
sector, Lester Salamon,
Foreign Affairs, July 1994.
-6%
-4%
-2%
0%
2%
4%
6%
8%
10%
12%
8-Country Average
Canada Japan United States Czech Republic
Belgium Thailand Norway Australia
Nonpro�t GDP
- 10 -
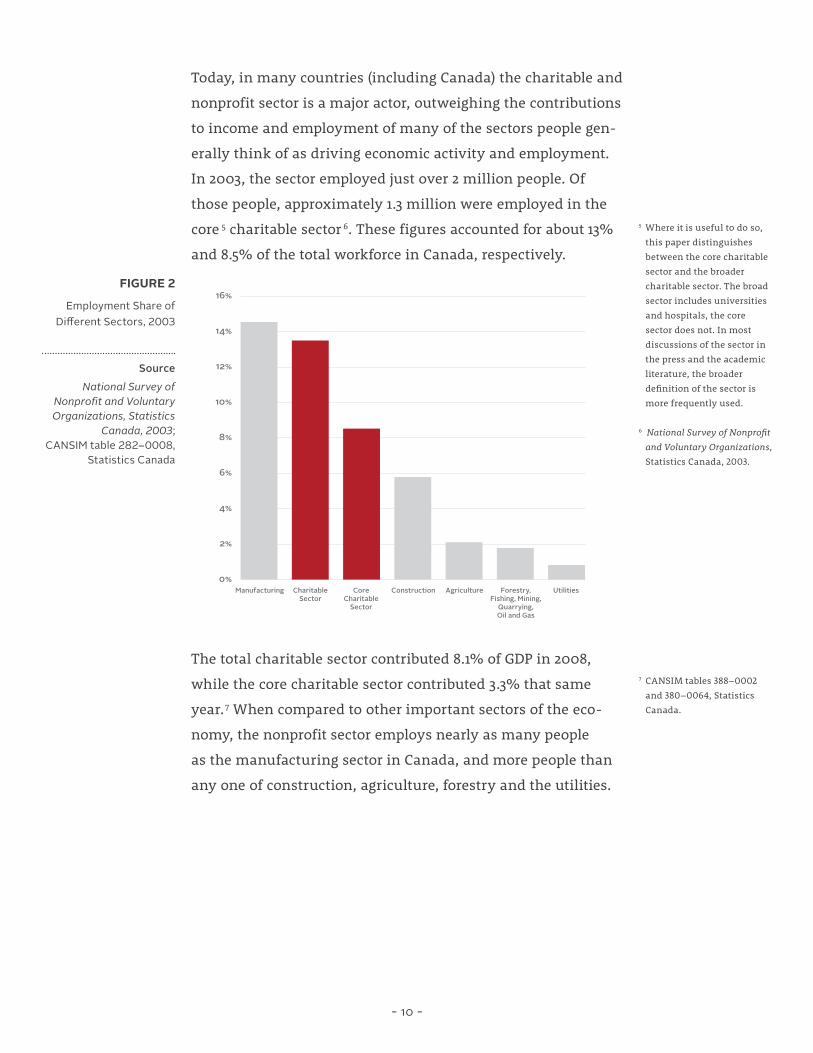
Today, in many countries (including Canada) the charitable and
nonprofit sector is a major actor, outweighing the contributions
to income and employment of many of the sectors people gen-
erally think of as driving economic activity and employment.
In 2003, the sector employed just over 2 million people. Of
those people, approximately 1.3 million were employed in the
core 5 charitable sector 6. These figures accounted for about 13%
and 8.5% of the total workforce in Canada, respectively.
The total charitable sector contributed 8.1% of GDP in 2008,
while the core charitable sector contributed 3.3% that same
year.7 When compared to other important sectors of the eco-
nomy, the nonprofit sector employs nearly as many people
as the manufacturing sector in Canada, and more people than
any one of construction, agriculture, forestry and the utilities.
FIGURE 2
Employment Share of Different Sectors, 2003
SourceNational Survey of
Nonprofit and Voluntary Organizations, Statistics
Canada, 2003; CANSIM table 282–0008,
Statistics Canada
5 Where it is useful to do so,
this paper distinguishes
between the core charitable
sector and the broader
charitable sector. The broad
sector includes universities
and hospitals, the core
sector does not. In most
discussions of the sector in
the press and the academic
literature, the broader
definition of the sector is
more frequently used.
6 National Survey of Nonprofit
and Voluntary Organizations,
Statistics Canada, 2003.
7 CANSIM tables 388–0002
and 380–0064, Statistics
Canada.
0%
2%
4%
6%
8%
10%
12%
14%
16%
Manufacturing Charitable Sector
Core Charitable
Sector
Construction Agriculture Forestry, Fishing, Mining,
Quarrying, Oil and Gas
Utilities

- 11 -
While charities operate in a number of fields, some of
which are goods producing, the charitable sector is largely
a service sector.8
FIGURE 3
GDP contribution of different sectors
(including volunteer contributions), 2008
SourceSatellite Account of Non-
profit Institutions and Volunteering, Statistics
Canada, 2008; CANSIM table 379–0031,
Statistics Canada; State of Global
Civil Society and Volunteering,
Johns Hopkins University, 2013
2.2 The Charitable Sector Shares Many of the Characteristics of the Broader Service Sector of the Economy
FIGURE 4
Contribution of Core Nonprofit Sector by
Area of Service, 2008
SourceCANSIM table 388–0002,
Statistics Canada
8 The service sector broadly
encompasses those
industries that do not
produce tangible output:
transportation and
storage; communications;
wholesale and retail trade;
finance, insurance and
real estate (FIRE); and
community, business and
personal services (CBPS).
Lagging Productivity
Growth in the Service
Sector: Mismeasurement,
Mismanagement or
Misinformation? Dinah
Maclean, Research
Department Bank
of Canada.
Manufacturing Energy Sector
Charitable Sector
Oil and Gas Core Charitable
Sector
Agriculture, Forestry,
Fishing and Hunting
Utilities0%
2%
4%
6%
8%
10%
12%
14%
0%
5%
10%
15%
20%
25%
Culture and
Recreation
Other Educatio
n
and Research
Other Health
Social Services
Development
and Housing
Fundraising, Grantmaking
and Voluntarism Religion
Business/Professional
Associations and Unions Other

- 12 -
The service sector is the fastest growing component of ad-
vanced industrial economies. The growth of the charitable
sector reflects the growth in the service sector in general. In
Canada, for example, the share of goods-producing activity in
the economy has fallen from 35% in 1997, to 30% in 2013 — the
continuation of a trend to a more service-dominated economy
which has been observed since about 1960.
Data on employment published by Statistics Canada reveals
that about 78% of working Canadians are currently employed
in the service sector (with about 10% of working Canadians
employed in the charitable sector). Because most charities fo-
cus on service delivery, they tend to be quite labour intensive.9
Many service industries deliver personalized services.…on average about one third of operating expenses in the service industry goes toward paying salaries and wages. The share is even higher in industries reliant on highly trained employees: wages account for 54% in the accounting and book keeping industries and 47% in engineering services.10
Service industries tend also to employ more women than men.
In 2014, 55% of employees in service industries were women.
FIGURE 5
GDP Contribution of Goods-producing
and Service Sectors, 1997–2013
SourceStatistics Canada,
CANSIM table 379-0030
9 The degree of labour
intensity is typically
measured in proportion
to the amount of capital
required to produce the
goods/services; the higher
the proportion of labour
costs required, the more
labour intensive the
business. http://www.
investopedia.com/terms/l/
laborintensive.asp.
10 Canada Yearbook 2006,
Statistics Canada,
2006. http://www41.
statcan.gc.ca/2006/0163/
ceb0163_000-eng.htm. This
places the amount charities,
with their highly educated
work forces, spend on
wages and salaries in an
appropriate context.
0%
10%
20%
30%
40%
50%
60%
70%
80%
20132012201120102009200820072006200520042003200220012000199919981997
Goods-producing
Service

- 13 -
The health care and social assistance industries employ an
especially large number, with 1.8 million women occupying
82% of jobs in the field.11
The labour intensity of the sector has led to concerns about
productivity, growth and the rise of the knowledge economy,
which will be explored in a subsequent section.
Charities are small businesses, albeit with some special
charac teristics. Both the charitable sector and the small busi-
ness sector consist of a large number of small entities. Data
from the NSNVO 12 shows that in 2003 there were 161,227 chari-
ties and nonprofits in Canada. The majority (54%) employed
no paid staff. Only 2% had paid staff of 100 or more.
It’s a similar story in the small business sector, which is dom-
inated by a large number of small firms,13 the vast majority of
which (98%) employ fewer than 100 paid staff. Less than 2%
employ 100 people or more.
2.3 The Charitable Sector has Much in Common with the Small Business Sector
FIGURE 6
Charities by number of employees, 2003
SourceNational Survey
of Nonprofit and Voluntary Organizations, Statistics Canada, 2003
12 National Survey of Nonprofit
and Voluntary Organizations,
Statistics Canada, 2003.
11 Statistics Canada, CANSIM
table 282–0008.
13 Key Small Business Statistics,
Industry Canada, August
2013. http://www.ic.gc.ca/
eic/site/061.nsf/eng/02804.
html.
100+25 to 99
54 %26 %
8 %
6 %
4 % 2 %
None
1 to 4
5 to 9
10 to 24

- 14 -
Both sectors are characterized by significant risks to success
and continuity. Barriers to entry are relatively low and barriers
to success are relatively high. Therefore there is a significant
rate of entry and exit in both the charitable and small business
sectors for a variety of reasons, including bankruptcy, illness,
retirement, or the fulfilment of mission.
FIGURE 7
Businesses in Canada by size, 2012
SourceKey Small Business
Statistics, Industry Canada
FIGURE 8
Net business entrants, 2000–2008
SourceFirm dynamics: Firm
Entry and Exit, Statistics Canada, 2000–2008
Small (1–99)
Medium (100–499) Large (500+)
98.22%
1.64% 0.14%
0
5,000
10,000
15,000
20,000
25,000
30,000
200820072006200520042003200220012000
Goods-producing
Service

- 15 -
For the small business sector, the service sector has added
firms more quickly than the goods-producing sector. And,
in some years, the rate of attrition in the small business
sector has been starkly high — as for example in the
recession year 2009.
Charities in Canada also experience low barriers to entry and
high barriers to success. The net result is that each year, the
number of charities in Canada increases. In 2009, for example,
approximately 2,100 new charities were registered by Revenue
Canada14 while 1,500 charities were revoked. Over the past 10
years, a net increase of roughly 360 charities per year has been
typical, leading to a fairly rapid expansion of the number of
charities in Canada.
This is a natural and, in many ways, desirable part of the
dynamics of the economy as older organizations die or fail and
existing ownership is replaced by new. This level of turnover is
comparable to, and in some cases less dramatic than, the rate
of entry and exit in the world of small business.
FIGURE 9
Business entrants and exits, 2009
SourceEntrepreneurship
Indicators Database, Statistics Canada
14 Registered Charities
Newsletter 31, Canada
Revenue Agency, http://
www.cra-arc.gc.ca/E/
pub/tg/charitiesnews-31/
charitiesnews31-e.html.
0
10,000
20,000
30,000
40,000
50,000
60,000
Entry Exits
CharitiesGoods-producingService

- 16 -
“Productivity isn’t everything, but in the long run it is almost everything. A country’s ability to improve its standard of living over time depends almost entirely on its ability to raise its output per worker.”
Job creation and economic growth remain core objectives for
governments and “the fastest way to boost productivity and
economic growth is to innovate.” 15 It is inevitable, then, that
productivity issues will generate a significant amount of policy
and research attention. With the absolute size of the charitable
sector and its rapid growth, questions about productivity and
innovation are in many ways difficult to answer.
The charitable sector is essentially a service sector and
Over the past three decades, the rapid growth of the economy’s service sector and the increasing interest in the sector on the part of both scholars and policy makers have helped give currency to three perceptions about service industries. The perceptions are that (1) the service sector is composed entirely of industries that have very low rates of productivity growth; (2) service industries are highly labor intensive and low in capital intensity; and (3) shifts in employment to the service producing sector have been a major reason for the slowdown in productivity growth over the past 10 to 15 years.16
Funding for innovation is difficult. Both the small business
sector and the charitable sector are dominated by small firms
— and the availability of resources to spend on research and
development (R&D) is tied to the size of businesses. Large
2.4 Productivity and Innovation in the Charitable Sector
— Paul Krugman, The Age of Diminished Expectations (1994)
15 Industrial Research and
Development: Intentions,
Statistics Canada, 2012,
and calculations by
Industry Canada.
16 The service-producing
sector: some common
perceptions reviewed, Ronald
E. Kutscher and Jerome
A. Mark, Monthly Labor
Review, April 1983.

- 17 -
businesses account for fewer than 0.2% all employer business-
es, but accounted for over 50% of all R&D expenditures in 2009
(Figure 10). Small businesses make up 98% of all employer
businesses, on the other hand, but accounted for only 31% of
total R&D expenditures.17
In addition, charities may exhibit other characteristics that
make innovation difficult.
Changes in the market and new opportunities — often the result of new technologies — drive economic pro-gress. Social organizations are slower to adapt since their revenues are less sensitive to changes in demand, need, and performance, and their market is often seen to be their funders rather than the constituencies or causes they serve. Funding models are based on avoid-ing risk rather than experimenting with new approaches that might increase effectiveness. Fresh ideas emerge through the creation of new organizations, but they enter a crowded marketplace and are often unable to demonstrate convincingly their superior efficacy. For established organizations, technological innovation is frequently viewed more as a problem than as a source of creativity.18
FIGURE 10
Percentage of total expenditures on R&D
by firm size, 2009
SourceIndustrial Research and
Development: Intentions, Statistics Canada, 2012
and calculations by Industry Canada
17 Ibid.
18 On Not Letting a Crisis Go
to Waste, Tim Brodhead,
The Philanthropist,
Vol. 23 No. 1, 2010.
Small (1–99)
Medium (100–499)
Large (500+)
31%
18%
51%

- 18 -
As charities position themselves as an important economic sector,
as a source of jobs and growth to be encouraged and supported
by government, questions of innovation and productivity will
become more and more pressing.
In many ways, charities are seen as good places to work, where
well motivated and well educated people with a sense of mis-
sion, of wanting make a difference, can find meaningful and
fulfilling employment. Beyond this, though, there are a host
of more bottom-line, practical questions about the desirability
of working in the sector. How do wages and benefits in the
charitable sector compare to other employers? Does a period
of employment in the charitable sector increase an employee’s
marketable skill set, producing a resume that is attractive in
the broader economy? Is HR capacity in the sector adequate to
attract and maintain the necessary work force?
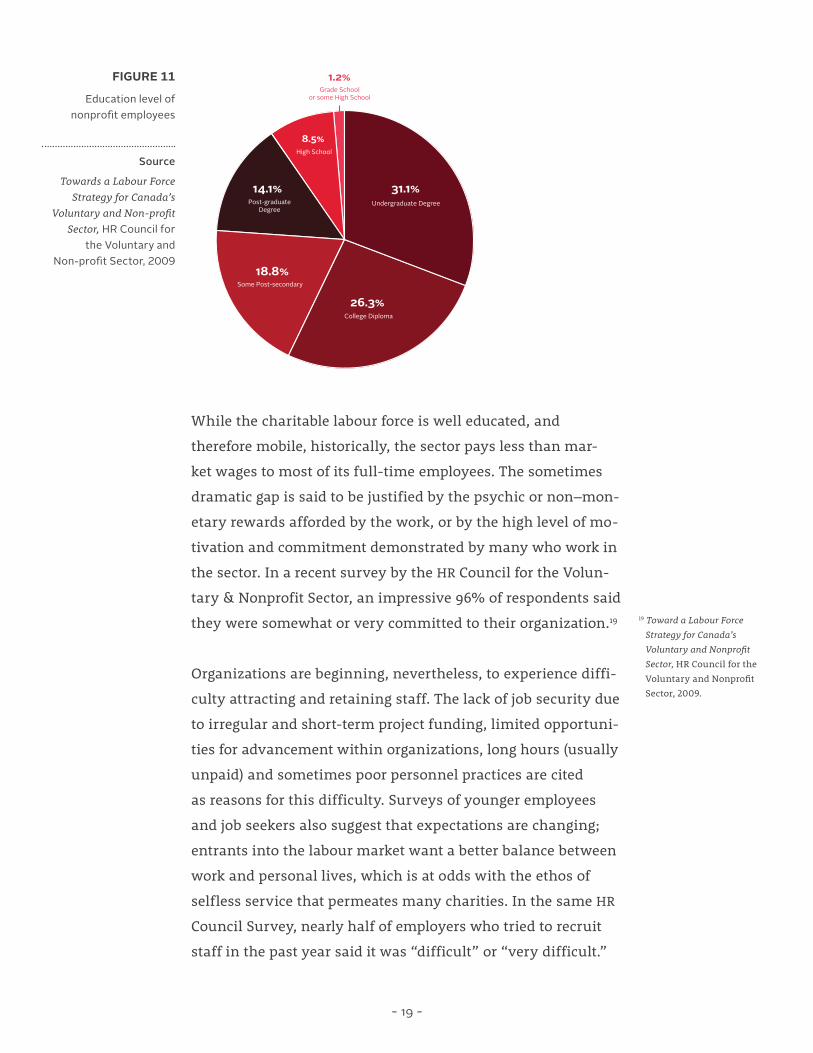
The work force in the charitable sector is well educated relative
to the general levels of education in the work force, with more
than 90% of employees having some post-secondary education
and some 71% having a college diploma, undergraduate or
graduate degree.
2.5 The Charitable Sector as a Place to Work
- 19 -
FIGURE 11
Education level of nonprofit employees
Source
Towards a Labour Force Strategy for Canada’s
Voluntary and Non-profit Sector, HR Council for
the Voluntary and Non-profit Sector, 2009
While the charitable labour force is well educated, and
therefore mobile, historically, the sector pays less than mar-
ket wages to most of its full-time employees. The sometimes
dramatic gap is said to be justified by the psychic or non–mon-
etary rewards afforded by the work, or by the high level of mo-
tivation and commitment demonstrated by many who work in
the sector. In a recent survey by the HR Council for the Volun-
tary & Nonprofit Sector, an impressive 96% of respon dents said
they were somewhat or very committed to their organization.19
Organizations are beginning, nevertheless, to experience diffi-
culty attracting and retaining staff. The lack of job security due
to irregular and short-term project funding, limited opportuni-
ties for advancement within organizations, long hours (usually
unpaid) and sometimes poor personnel practices are cited
as reasons for this difficulty. Surveys of younger employees
and job seekers also suggest that expectations are changing;
entrants into the labour market want a better balance between
work and personal lives, which is at odds with the ethos of
selfless service that permeates many charities. In the same HR
Council Survey, nearly half of employers who tried to recruit
staff in the past year said it was “difficult” or “very difficult.”
19 Toward a Labour Force
Strategy for Canada’s
Voluntary and Nonprofit
Sector, HR Council for the
Voluntary and Nonprofit
Sector, 2009.
Some Post-secondary
College Diploma
Undergraduate DegreePost-graduate Degree
Grade School or some High School
High School
31.1%
26.3%
18.8%
14.1%
8.5%
1.2%

- 20 -
Attention to HR management can be under-resourced in both
the small business and the charitable sector.
Research conducted recently by Framework Founda-tion reveals that of 197 courses offered by Canadian post-secondary institutions on voluntary sector manage-ment, only 22% (according to the course descriptions) address such human resource issues as engaging, training, and managing staff and volunteers. On the other hand, one-third deal with fundraising and financial management. More attention needs to be directed to how the community sector engages and trains a new generation of volun teers who have different and more demanding expectations, but also much to contribute.20
FIGURE 12
Professional development
opportunities for nonprofit staff
Source
Towards a Labour Force Strategy for Canada’s
Voluntary and Non-profit Sector, HR Council for
the Voluntary and Nonprofit Sector, 2009
20 Brodhead, op.cit.
0%
10%
20%
30%
40%
50%
60%
In-house Training
Paid Time O� for
Professional Development
Payment of Some/All Fees
In-house Career
Counselling
In-house Mentoring/
Job Shadowing
Unpaid Time
O� for Self-Study
Other None
- 21 -
revenue for charitable organizations3Like any economic entity for profit or nonprofit, the charita-
ble sector needs revenue to finance its operations and future
sustainability and to invest to increase productivity. Unlike
most for-profit firms, though, charities face a disconnect
between sources of revenues and customers or clients. In the
private sector, it is customers who judge whether products or
services are adequate and their decisions determine whether a
firm succeeds or fails. There is little or no conflict between the
aphorism that the customer is always right and the old adage
that the person with the gold sets the rules. In the charitable
sector, it is funders who provide the revenue, while clients
are somewhat passive beneficiaries of funding decisions by
govern ments and donors.
Charities and nonprofits are funded by a variety of sources.
Charities sell memberships and some goods and services,
receive money from governments to deliver government pro-
grams and priorities, and receive donations from individual
households and businesses.
For the broadly defined charitable sector, government transfers
are the most important source of revenue — reflecting the role
of universities and hospitals in achieving government objec-
tives in health care and education.
3.1 Sources of Funds for Broad and Core Charitable Sectors

- 22 -
The breakdown of the various sources shows a high degree
of stability over time, with some indication that the role of
govern ment is declining slightly, which is also true of invest-
ment income (reflecting the recession after 2008), and that
there is some softness in donations from individuals. The core
charitable sector is much more member- and donor-driven,
while government transfers play a still significant but less
prominent role.
FIGURE 13
Sources of revenue for broad charitable
sector, 2008
SourceStatistics Canada,
CANSIM table 388–0001
FIGURE 14
Sources of revenue for the broad charitable
sector, 1997–2008
SourceStatistics Canada,
CANSIM table 388–0001
32%
7.8%
7.1%2.1%
51%
Sales of Goods & Services
Membership Fees
Current Transfers from Households & Businesses
Current Transfers from Governments
Investment Income
0
10%
20%
30%
40%
50%
60%
200820072006200520042003200220012000199919981997
Sales of goods
Investment income
Membership fees
Current transfer from governments
Current transfer from household & businesses
- 23 -
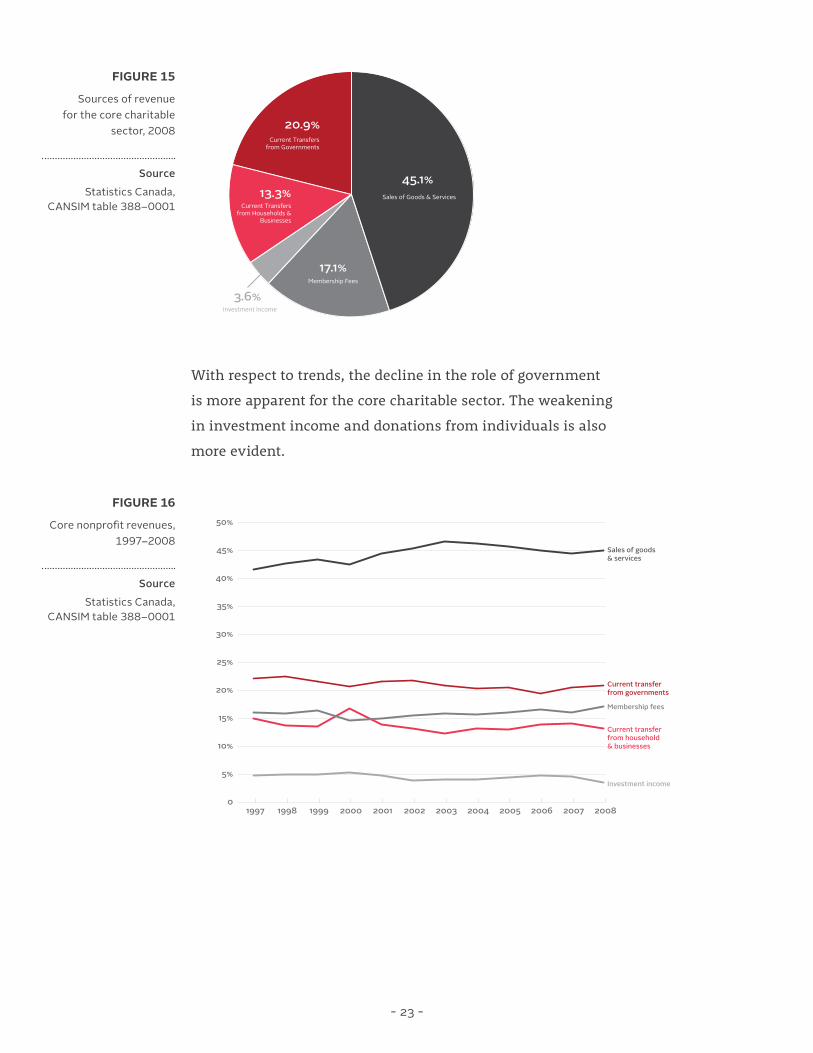
With respect to trends, the decline in the role of government
is more apparent for the core charitable sector. The weakening
in investment income and donations from individuals is also
more evident.
FIGURE 15
Sources of revenue for the core charitable
sector, 2008
SourceStatistics Canada,
CANSIM table 388–0001
FIGURE 16
Core nonprofit revenues, 1997–2008
Source Statistics Canada,
CANSIM table 388–0001
13.3%
20.9%
17.1%
3.6%
45.1%Sales of Goods & Services
Membership Fees
Current Transfers from Households &
Businesses
Current Transfers from Governments
Investment Income
200820072006200520042003200220012000199919981997
Sales of goods & services
Investment income
Membership fees
Current transfer from governments
Current transfer from household & businesses
0
5%
10%
15%
20%
25%
30%
35%
40%
45%
50%

- 24 -
Donations account for 13% of all income for core charities and
nonprofits, but donations have a value to charities that is out of
proportion to their relative size.21
Donations may only contribute some 11% of charities’ revenue, but their value lies in their being (mostly) unre-stricted, unlike most of the money provided by govern-ments, foundations, and corporate donors. This source therefore underwrites much of the operational costs of organizations in the sector. 22
Charities receive donations from both corporations and house-
holds, with the majority being donations from households.
This section will focus on donations from households. Dona-
tions by Canadians to charities have generally tracked GDP,
with donations as a percentage of GDP steady at roughly just
under 0.5% of GDP. However, since 2007, the level of donations
has fallen noticeably to 0.439% of GDP. This amounts to a
substantial proportion of what Canadians give each year.
It is tempting to attribute this decrease to recession and eco-
nomic uncertainty beginning in roughly 2007/08. However,
the “great recession” has been relatively mild in Canada with
3.2 Donations
FIGURE 17
Donations as a percentage of GDP,
1997–2012 (minus tax shelters)
SourceCANSIM tables 111–002
and 380–0064, Statistics Canada; Charities
Directorate, Canada Revenue Agency
22 Broadhead, op. cit.
21 CANSIM 388–0001,
Statistics Canada, 2008.
0.40%
0.42%
0.44%
0.46%
0.48%
0.50%
0.52%
0.54%
0.56%
0.58%
0.60%
2012201120102009200820072006200520042003200220012000199919981997
Percentage of GDP
- 25 -
GDP increasing slowly but steadily over this period. This
means changes in the underlying behaviour of donors must
be examined.
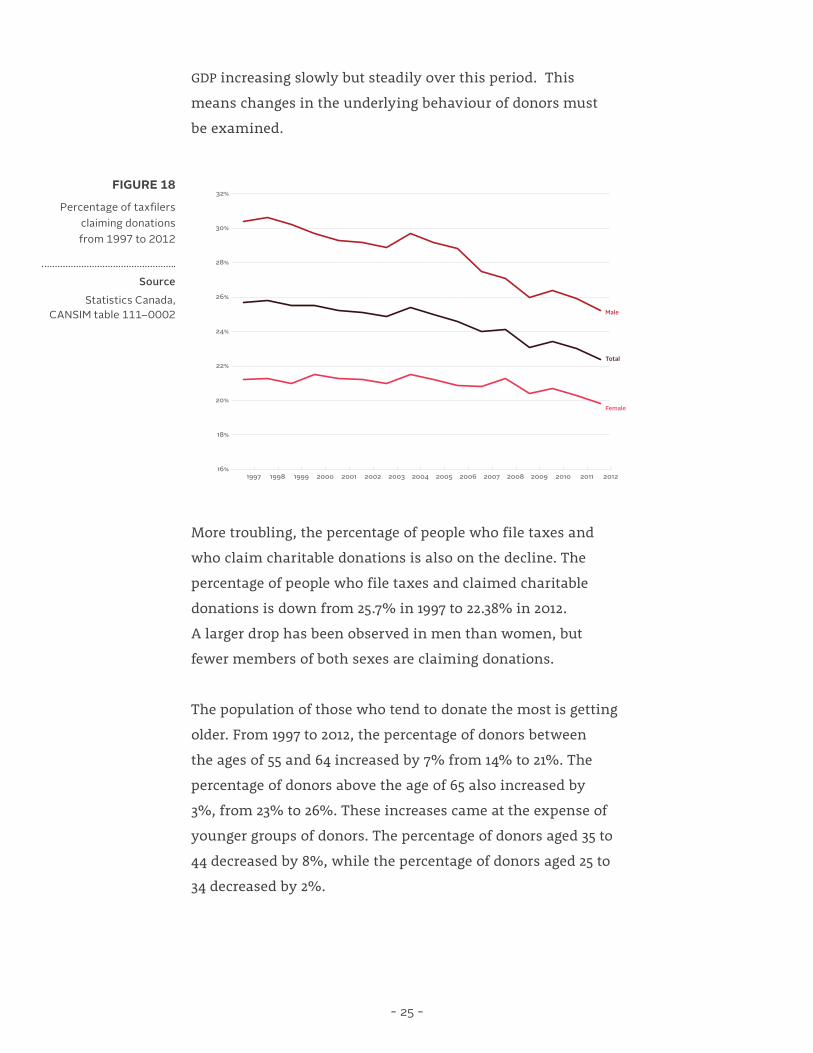
More troubling, the percentage of people who file taxes and
who claim charitable donations is also on the decline. The
percentage of people who file taxes and claimed charitable
donations is down from 25.7% in 1997 to 22.38% in 2012.
A larger drop has been observed in men than women, but
fewer members of both sexes are claiming donations.
The population of those who tend to donate the most is getting
older. From 1997 to 2012, the percentage of donors between
the ages of 55 and 64 increased by 7% from 14% to 21%. The
percentage of donors above the age of 65 also increased by
3%, from 23% to 26%. These increases came at the expense of
younger groups of donors. The percentage of donors aged 35 to
44 decreased by 8%, while the percentage of donors aged 25 to
34 decreased by 2%.
FIGURE 18
Percentage of taxfilers claiming donations from 1997 to 2012
SourceStatistics Canada,
CANSIM table 111–0002
16%
18%
20%
22%
24%
26%
28%
30%
32%
2012201120102009200820072006200520042003200220012000199919981997
Male
Total
Female

- 26 -
These trends suggest that charities are failing to attract young-
er donors who are entering the workforce for the first time.
There are a number of possible explanations for this phe-
nomenon. Religious institutions play a very large role in the
charitable sector and place a significant emphasis on charity,
but Canadians are becoming increasingly less religious. Young
professionals may also feel that charities are not doing a good
job and are failing to innovate. If charities fail to innovate,
people might perceive them as old fashioned and ineffective,
which would make them less likely to donate. It is also possible
that people feel that the tax treatment they would receive for
donating is not a sufficient incentive.
Despite the potential issues with donations, charities still
receive the majority of their funds from the government.
Government funding represents a substantial portion of the in-
come for charities in the form of grants and reimbursement for
delivering services. Of the total funding for the core chari table
sector for example, 15% comes from provincial and territorial
governments, 5.5% comes from the federal government, and
0.8% comes from municipal governments.23
FIGURE 19
Percentage of donors by age group
from 1997 to 2012
SourceStatistics Canada,
CANSIM table 111–0002
3.3 Government Funding
23 CANSIM table 388-0001,
Statistics Canada, 2008.
0%
5%
10%
15%
20%
25%
30%
2012201120102009200820072006200520042003200220012000199919981997
0 to 24
25 to 34
35 to 44
45 to 5455 to 64
65+

- 27 -
The role of the federal government is statistically small relative
to the provinces, reflecting the predominant role of provincial
government in health education and social services. But the
role of the federal government cannot be underestimated — it
is the level of government which determines the tax treatment
of the donations under the Income Tax Act for example. It is
also the level of government responsible for overall economic
policy affecting the growth of GDP and employment and there-
fore of the capacity of people to donate. It is also the funder of
huge transfer programs such as unemployment insurance, old
age security and pensions. The generosity, or lack of it, of these
broad social programs goes a long way to determining the role
charities need to play in meeting the needs of society.
The federal government is becoming relatively smaller in
economic terms. This is in part related to the goal of the
present government to reduce the role of government in the
lives of Canadians. It is also part of a longer-term trend as
governments world-wide have encountered fiscal pressures.
In fact the size of the federal government has been declining
steadily since 1997 as successive governments have struggled
with fiscal challenges and deficit control. Overall, government
spending as a percentage of GDP declined over 3% from 1997 to
2009, with an uptick in 2010 to reflect a short-term increase in
expenditure in response to recession.
FIGURE 20
Government expenditure as a percentage of GDP
from 1997 to 2009
Source
Statistics Canada, CANSIM tables 385-0001
and 380-0064
0%
5%
10%
15%
20%
25%
2009200820072006200520042003200220012000199919981997
Local Governments
Federal Government
Provincial & TerritorialGovernment

- 28 -
One response to reduced federal expenditure can be a move by
provincial and municipal governments to take up the resulting
fiscal room and expand their own expenditures. This in gene-
ral has not occurred in recent years. Provincial and municipal
spending has remained relatively stable as a percentage of GDP
as provinces and municipalities have had to cope with their
own fiscal pressures.
An additional concern is the make-up of expenditures: as the
federal government has become smaller, has spending on
social programs become relatively smaller? The answer appears
to be no — the federal government has chosen to keep things
like transfers to individuals relatively stable as a percentage of
federal expenditure. However, since overall federal spending
is declining in relation to GDP, so is overall federal spending on
social programs.
The picture this paints is one of a Canada which is taking on
a different character, one in which government will do less and
charities will need to do more. This trend isn’t likely to reverse
itself soon — the current conservative government is expected
to lower taxes in the near future, meaning that government
FIGURE 21
Federal social services spending as
a percentage of GDP and as a percentage of total
federal spending
SourceStatistics Canada,
CANSIM tables 380–0064 and 385-0001
GDP
Federal Expenditures
0
5%
10%
15%
20%
25%
30%
35%
40%
45%
2009200820072006200520042003200220012000199919981997

- 29 -
spending will likely continue to shrink, making it relatively
difficult for future parliaments to increase spending and the
role of government.
While facts speak to the robustness of Canada’s non-profit sector and its integral role in Canadian society, more organizations are facing increasing sustainability challenges in the face of uncertain revenues and esca-lating service demands driven by demographic changes and exacerbated by the recent recession. 24
The charitable sector has enjoyed rapid growth over the past
couple of decades or so outpacing the rate of growth of the
economy and of the service sector as a whole. But growth and
the jobs it generates can only be sustained if there are reve-
nue streams to support it. Charities rely on the three pillars
of government funding, philanthropy, and earned income. Of
these, both philanthropy in the form of donations from indi-
viduals and government funding are under threat because of
fundamental changes in demographics, culture and the ongo-
ing fiscal pressures encountered by governments world–wide.
While earned income activities have done well, increasing as a
percentage of charitable revenues over the last few years, it is
questionable whether they can be expected to fill a gap which
is emerging and which will grow as governments cut back
on social spending. This is especially true in Canada where
charities’ efforts to increase earned income are constrained by
legislative and regulatory barriers.
3.4 Membership Fees and Sales of Goods and Services
24 Strengthening the Third Pillar
of the Canadian Union: An
Intergovernmental Agenda
for Canada’s Charities
and Nonprofits, Elizabeth
Mulholland, Matthew
Mendelsohn, Negin
Shamshir, Mowat Centre
for Policy Innovation, 2011.

- 30 -
policy implications4While this paper has been largely descriptive, some of the pol-
icy implications of a review of the sector’s structure and con-
tribution to the Canadian economy are clear. Canada’s charities
and nonprofits are a large and growing part of the Canadian
economy. They generate jobs and growth and provide valuable
services that are more and more in demand. In this respect,
Canada’s economy is changing and keeping pace with develop-
ments in other advanced industrial economies. The growth of
the sector in Canada means that the country is well positioned
to be successful in the global economy of he 21st century.
First, this means that effective overall management of the
economy (the fiscal framework, monetary policy, industrial
policy) should increasingly be sensitive to the needs of the
charitable and nonprofit sector as well as sectors more tradi-
tionally thought of as “economic”. Of course, this means that
charities and nonprofits need to be aware of their economic
role and nature and interact with governments on economic
policy as well as, for example, social and environmental
policy issues.
Second, to support jobs and growth and value, the full suite of
support programs available to small private business should be
extended to the charitable sector and would produce significant
benefits to the economy in terms of jobs and growth, increased
productivity, and the ability to innovate.
Third, if charities are to be able to sustain contributions to
jobs and growth they will need to work with government to
explore options to increase funding in two key areas: contri-

- 31 -
butions from individuals (through improved tax treatment of
donations) and options to expand earned income from their
own efforts and use it for charitable purposes. The latter means
addressing regulatory and income tax barriers to expanding
earned income and exploring social finance and investment
more broadly.
Fourth, as an important and rapidly growing sector of the
economy the sector requires and warrants better data collec-
tion and analysis by government, similar to data collection,
analysis and support for the small business sector.

- 32 -
about the authors
brian emmettChief Economist for Canada’s Charitable and Nonprofit Sector
In 2013, Brian Emmett joined Imagine Canada in the unique role of the Chief Economist for Canada’s Charitable and Nonprofit Sector. As Chief Economist, Brian is tasked with measuring the impact of the sector and bringing economic issues facing charities and nonprofits to the forefront of public policy decision makers. imaginecanada.ca/chief-economist
The position of the Chief Economist for Canada’s Charitable and Nonprofit Sector is made possible through funding received by The Muttart Foundation, Ontario Trillium Foundation — an agency of the Government of Ontario, Vancouver Foundation, an anonymous donor, and the PricewaterhouseCoopers Canada Foundation.
geoffrey emmettResearch Assistant
Geoffrey Emmett is an honours graduate of south Carleton High School in Ottawa where he captained the basketball and rugby terms and was named male athlete of the year. He is currently enrolled in management engineering at the University of Waterloo. Other assignments have included work in logistics for Magna International.