discussion summary cytoscape introduction thomas skøt jensen center for biological sequence...
Post on 22-Dec-2015
216 views
TRANSCRIPT
Discussion summary
Cytoscape introduction
Thomas Skøt JensenCenter for Biological Sequence AnalysisThe Technical University of Denmark


Sub-cellular localization coverage

Co-localization of interacting proteins

Tendency to interact with your cousin

Over-representation of highly abundant proteins
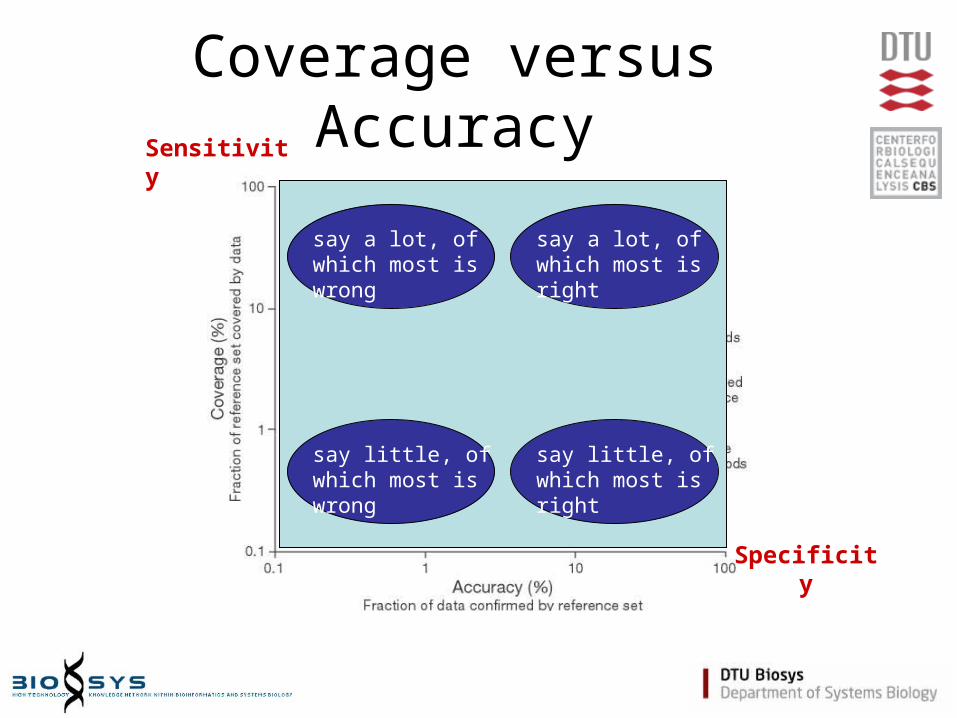
Coverage versus Accuracy
say a lot, of which most is wrong
say a lot, of which most is right
say little, of which most is wrong
say little, of which most is right
Specificity
Sensitivity
Visualizing protein/gene relationships
A short introduction to Cytoscape

Outline
• Visualization
• Why Cytoscape?
• Getting started
• Attributes for nodes and edges
• Examples

Visualization
• Systems Biology - looking at a system– a collection of units (gene/proteins) in a context
• Massive amounts of protein/gene relationships– a lot of undiscovered biology is hiding in that data– impossible to get an overview if investigated by
hand
• Integrate many types of relationships– the data is available in the CBS data warehouse
Why Cytoscape?
• Cytoscape (www.cytoscape.org)– can visualize relationships– is easy to use– has an advanced color coding scheme– allows for custom made plug-ins– has a strong community– is free for academia
Getting started
• Two types of input formats– GML: a graphical markup language– SIF: a simple input format
• Nodes (genes/proteins) and relationships are specified in one file
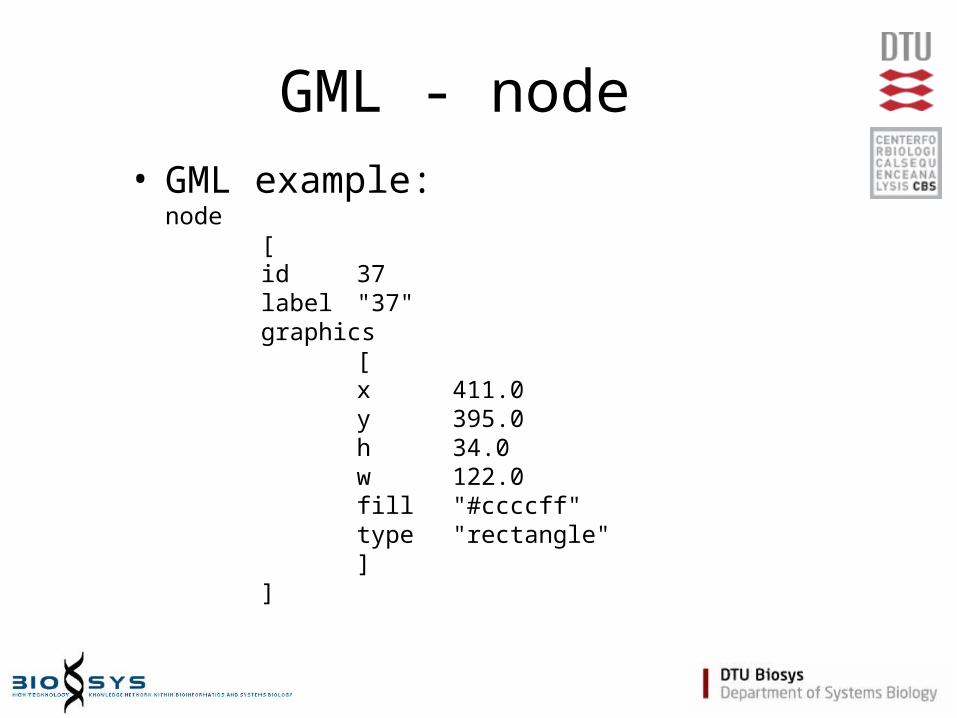
GML - node• GML example:
node[id 37label "37"graphics
[x 411.0y 395.0h 34.0w 122.0fill "#ccccff"type "rectangle"]
]

GML - edge
• GML example:edge
[source 210target 92label "PPo"graphics
[width 1.0type "line"fill "#000000"]
]
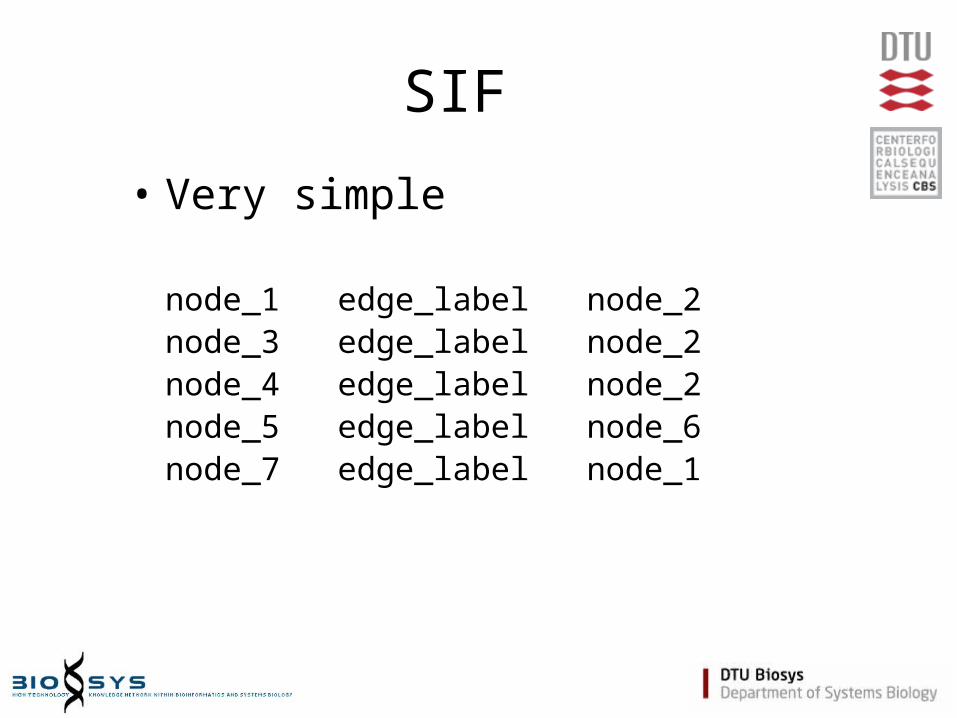
SIF
• Very simple
node_1 edge_label node_2node_3 edge_label node_2node_4 edge_label node_2node_5 edge_label node_6node_7 edge_label node_1
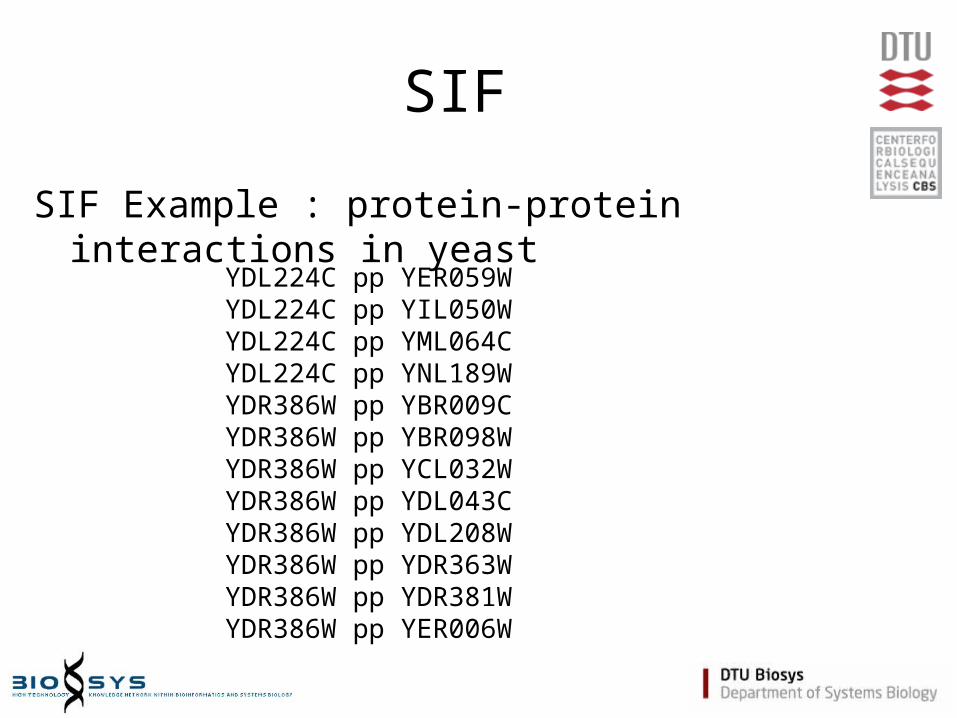
SIF
YDL224C pp YER059WYDL224C pp YIL050WYDL224C pp YML064CYDL224C pp YNL189WYDR386W pp YBR009CYDR386W pp YBR098WYDR386W pp YCL032WYDR386W pp YDL043CYDR386W pp YDL208WYDR386W pp YDR363WYDR386W pp YDR381WYDR386W pp YER006W
SIF Example : protein-protein interactions in yeast
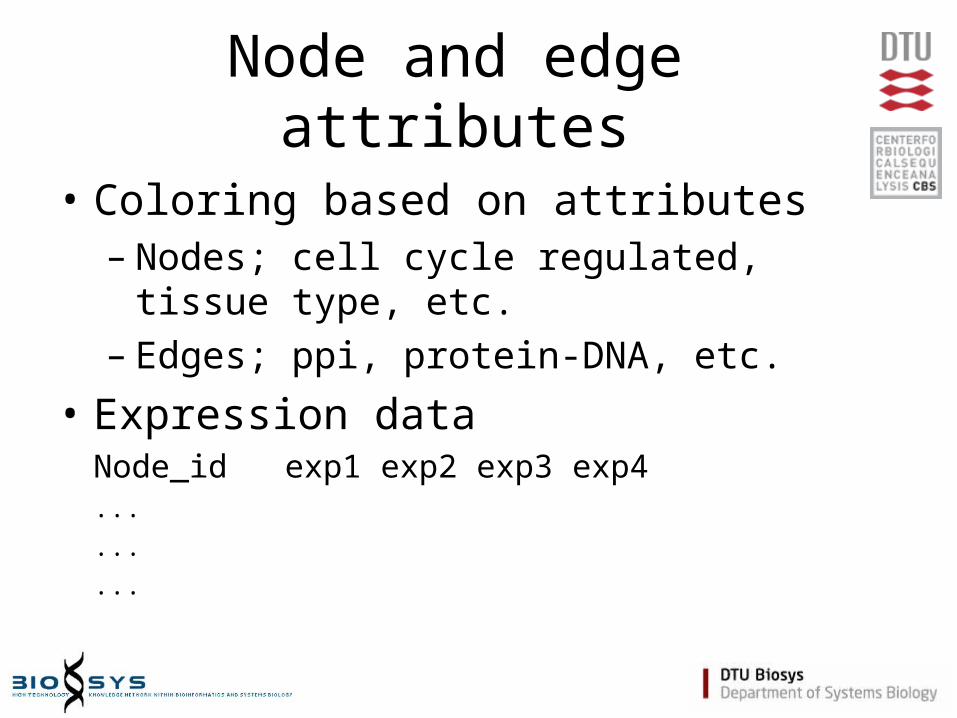
Node and edge attributes
• Coloring based on attributes– Nodes; cell cycle regulated, tissue type,
etc.– Edges; ppi, protein-DNA, etc.
• Expression dataNode_id exp1 exp2 exp3 exp4.........
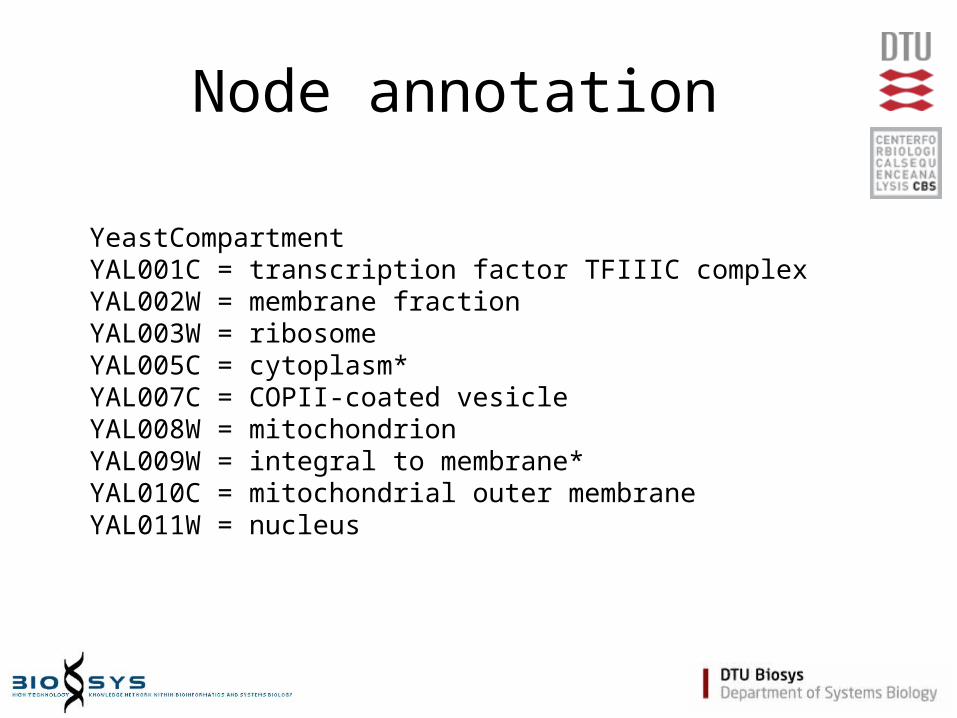
Node annotation
YeastCompartmentYAL001C = transcription factor TFIIIC complexYAL002W = membrane fractionYAL003W = ribosomeYAL005C = cytoplasm*YAL007C = COPII-coated vesicleYAL008W = mitochondrionYAL009W = integral to membrane*YAL010C = mitochondrial outer membraneYAL011W = nucleus
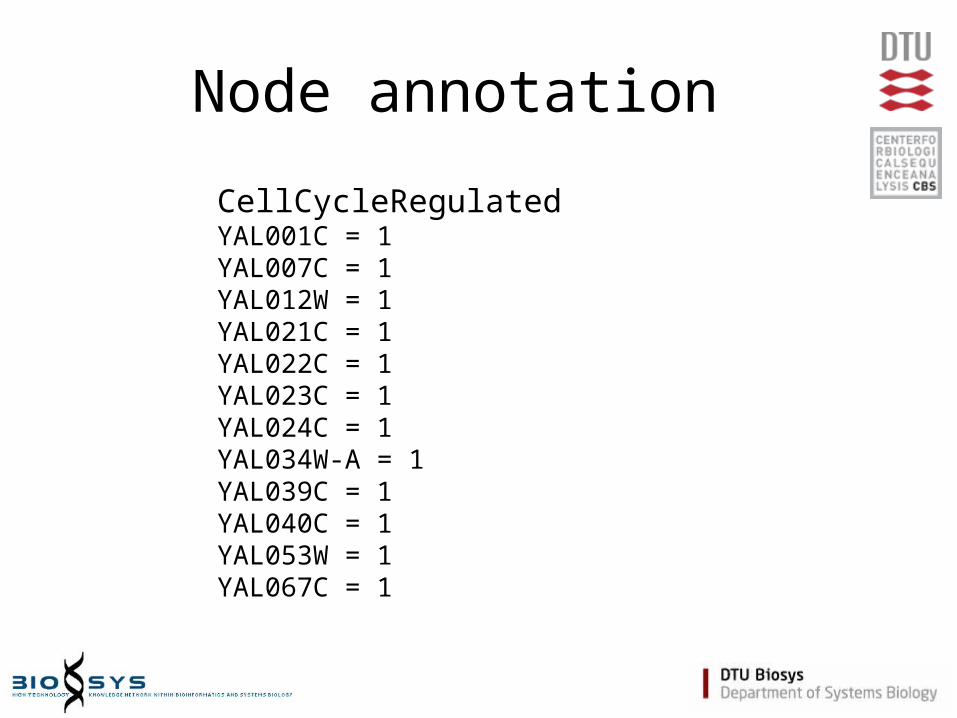
Node annotation
CellCycleRegulatedYAL001C = 1YAL007C = 1YAL012W = 1YAL021C = 1YAL022C = 1YAL023C = 1YAL024C = 1YAL034W-A = 1YAL039C = 1YAL040C = 1YAL053W = 1YAL067C = 1
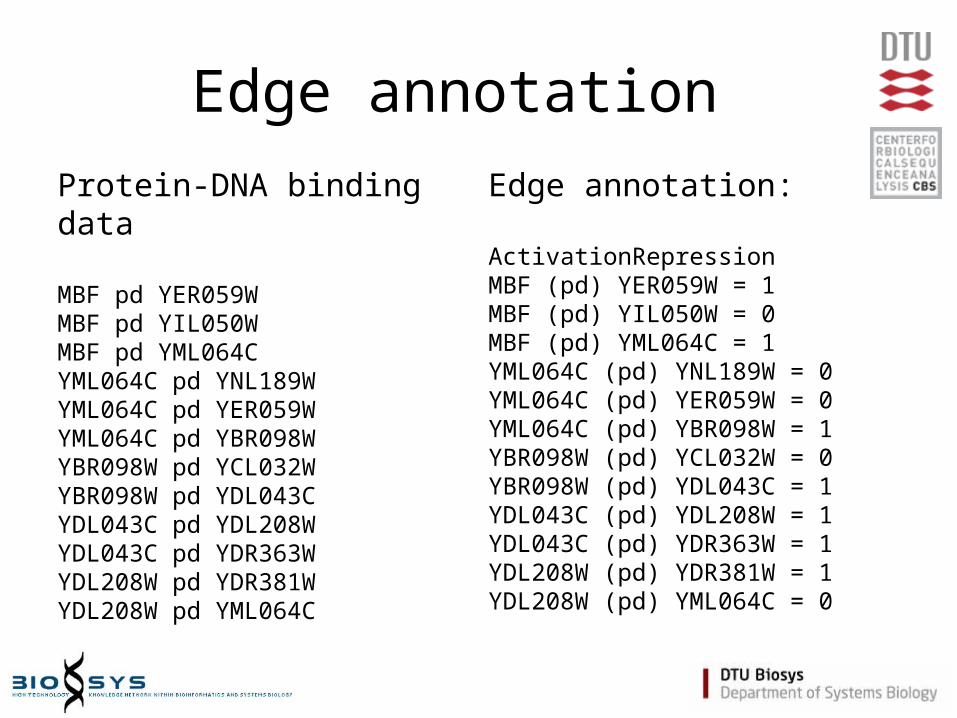
Edge annotation
Protein-DNA binding data
MBF pd YER059WMBF pd YIL050WMBF pd YML064CYML064C pd YNL189WYML064C pd YER059WYML064C pd YBR098WYBR098W pd YCL032WYBR098W pd YDL043CYDL043C pd YDL208WYDL043C pd YDR363WYDL208W pd YDR381WYDL208W pd YML064C
Edge annotation:
ActivationRepressionMBF (pd) YER059W = 1MBF (pd) YIL050W = 0MBF (pd) YML064C = 1YML064C (pd) YNL189W = 0YML064C (pd) YER059W = 0YML064C (pd) YBR098W = 1YBR098W (pd) YCL032W = 0YBR098W (pd) YDL043C = 1YDL043C (pd) YDL208W = 1YDL043C (pd) YDR363W = 1YDL208W (pd) YDR381W = 1YDL208W (pd) YML064C = 0