disease detectives c uw milwaukee regional event …wakker/public_html/public_html/...disease...
TRANSCRIPT

1
Score:_________
Rank:__________
Team Number: __________
School Name: _____________________________________________________
Student Names: ____________________________________________________
Disease Detectives – C
UW Milwaukee Regional Event
January 28th, 2017

2
Please read all questions carefully.
Please mark your answers on the test.
Please write clearly.
1. Match the following terms to their definitions in the table on the following page by writing the
corresponding letter into the column marked ‘Term’. Note that not all terms will be used and
that there is only one correct answer per definition. (16 points)
A. Active Immunity
B. Age adjusted mortality rate
C. Age specific mortality rate
D. Association
E. Case definition
F. Case-control Study
G. Cohort Study
H. Confounding
I. Droplet spread transmission
J. Epidemiology
K. Etiology
L. Fomite
M. Incidence
N. Infectivity
O. Interval Scale
P. Morbidity
Q. Passive Immunity
R. Pathogenicity
S. Point Source
T. Prevalence
U. Propagated Source
V. Prospective study
W. Ratio Scale
X. Vector borne transmission
Y. Vehicle borne transmission
Z. Virulence

3
Term Definition
a type of observational study in which two existing groups differing in outcome are identified and compared on the basis of some supposed causal attribute.
an analytic study in which participants are enrolled before the health outcome of interest has occurred
transmission of an agent by an inanimate object; considered a type of indirect transmission; includes foodborne and waterborne transmission
measure of the degree of disease that a pathogen causes
a measurement scale consisting of quantitative categories whose values are measured on a scale of equally spaced units, but without a true zero point (e.g., date of birth)
a common source outbreak in which the exposure period is relatively brief so that all cases occur within one incubation period
the rate of new cases of illness commencing during a specified time period in a given population
immunity conferred by an antibody produced in another host This type of immunity can be acquired naturally by an infant from its mother or artificially by administration of an antibody-containing preparation (e.g., antiserum or immune globulin)
the distortion of the association between an exposure and a health outcome by a third variable that is related to both
the study of the cause or origin of a disease
a mortality rate that has been statistically modified to eliminate the effect of different age distributions among different populations
an inanimate object that can be the vehicle for transmission of an infectious agent (e.g., bedding, towels, or surgical instruments)
uniform set of criteria that specifies clinical information, details of time, place, and person and is used to determine if an individual is part of an outbreak
the direct transmission of an infectious agent by means of the aerosols produced in sneezing, coughing, or talking that travel only a short distance before falling to the ground
any departure, subjective or objective, from a state of physiological or psychological health and well-being
the study of the distribution and determinants of health conditions or events among populations and the application of that study to control health problems

4
2. Fill in all the blanks in the table. Row 1 is already done. (10 points)
Scientific Name of pathogen
Type of pathogen
Food borne disease caused by pathogen
Transmission/Food Source
Clostridium botulinum
Bacteria Botulism vegetables, canned food
Yersinia enterocolitica
Yersiniosis
perfringens food poisoning
meat poultry
Hepatitis A
Giardia
food, or water that has been contaminated with feces from infected humans or animals.
Toxoplasmosis
Cyclospora cayetanensis
fresh produce contaminted with feces
Shigella Bacteria
Salmonellosis eggs, poultry, dairy
Bacteria Hemorrhagic colitis
The following is modified information taken from “Leveling of Tuberculosis Incidence — United States,
2013–2015” MMWR Weekly / March 25, 2016 / 65(11);273–278:
“After 2 decades of annual declines, TB (Tuberculosis) incidence in the United States has leveled. The
determinants of this leveling in TB incidence are not yet clear; further evaluation of available data is
required to understand the causes of this trend. Health departments in the 50 states and District of
Columbia (DC) electronically report verified tuberculosis (TB) cases that meet the CDC and Council of
State and Territorial Epidemiologists case definition to the National Tuberculosis Surveillance System.”
3. What are the four parts of a case definition? (4 points)
a.
b.
c.
d.
4. What pathogen causes TB (a), how is this disease transmitted (b), and who is credited with its
discovery? (3 points) TIEBRAKER 1
a.
b.
c.

5
The authors of this study compiled some of the data into the following table for interpretation and some
statistical analysis:
TABLE 1. Tuberculosis (TB) case counts and incidence, by U.S. Census division and state — United States, 2014 and 2015

6
Use the data from the table to answer the following questions:
5. What is the TB incidence per 100,000 for the total US population in 2015? (2 points)
6. Calculate the total population in Kansas in 2015. Show your work. (3 points total) TIEBRAKER 2
7. In 2015, which state had the lowest incidence and what was it? (1 point)
8. In 2015, which state had the highest incidence and what was it? (1 point)
9. Based on your two previous answers, what would be more meaningful to calculate in order to
compare state incidence across the entire US, the mean or the median of all state incidence and
why? (3 points total)
10. Calculate the mean (a) and median (b) of reported TB cases for Division 4 for 2014. Show all
your work and round to three digits. (4 points total)
a.
b.
11. Which of the following would help to further decline the incidence of TB? Circle all that apply. (2
points)
a. Strengthen systems that aim to interrupt TB transmission.
b. Increase testing and treatment of people with latent TB infections.
c. Identify specific demographic populations most at risk.
d. Vaccinate populations most at risk.

7
The next set of data is taking from Emerging Infectious Diseases, Volume 19, Number 3—March 2013,
DOI: 10.3201/eid1903.111866:
“Attribution of Foodborne Illnesses, Hospitalizations, and Deaths to Food Commodities by using
Outbreak Data, United States, 1998–2008
Each year, >9 million foodborne illnesses are estimated to be caused by major pathogens
acquired in the United States. Preventing these illnesses is challenging because resources are
limited and linking individual illnesses to a particular food is rarely possible except during an
outbreak. The authors reviewed all outbreaks from 1998, the first year with detailed information
on ingredients, through 2008 that were reported to the CDC by October 2010. For this analysis,
they included all outbreaks with an implicated food vehicle and a single etiologic agent.”
12. Which of the following terms does not apply to vehicle transmission? Circle all that apply. (2
points)
a. Fomite
b. Cooking utensil
c. Indirect
d. Malaria
13. Which of the following is not an etiological agent that can cause a foodborne disease? Circle all
that apply. (2 points)
a. Rotavirus
b. Vibrio vulnificus
c. Trichinella spiralis
d. Yersinia Pestis
14. State and local health departments report foodborne disease outbreaks to the Center for
Disease Control and Prevention (CDC). The ongoing systematic collection and recording of such
data used for analysis, and interpretation is part of which of the following? Circle all that apply.
(2 points)
a. Cluster
b. Surveillance
c. Incidence
d. Prevalence

8
The authors compiled information on %hospitalization in the following table:
Table 2 Estimates of annual hospitalizations for domestically acquired foodborne illnesses attributed to specific food
commodities and commodity groups, by pathogen type, United States, 1998–2008
15. This table lists bacterial, chemical/toxins, parasitic, and viral agents. Which of the following are
characteristics of viruses? Circle all that apply. (2 points)
a. Can replicate outside of a living cell.
b. Can have RNA or DNA
c. Can infect plants.
d. Can be seen with a light microscope.
Commodity or commodity group No. (%) hospitalizations
All agents Bacterial Chemical/toxin Parasitic Viral
Aquatic animals† 3,199 (5.6) 1,158 (3.2) 921 (61.6) 231 (4.7) 889 (5.8)
Fish 1,661 (2.9) 210 (0.6) 894 (59.8) 6 (0.1) 551 (3.6)
Shellfish† 1,538 (2.7) 948 (2.6) 27 (1.8) 225 (4.6) 338 (2.2)
Crustaceans 117 (0.2) 75 (0.2) 7 (0.5) 34 (0.2)
Mollusks 1,421 (2.5) 873 (2.4) 20 (1.3) 225 (4.6) 303 (2.0)
Land animals† 26,118 (45.5) 21,471 (60.0) 198 (13.3) 6 (0.1) 4,443 (29.1)
Dairy 9,284 (16.2) 7,464 (20.9) 23 (1.5) 1,798 (11.8)
Eggs 4,062 (7.1) 2,979 (8.3) 42 (2.8) 1,041 (6.8)
Meat-poultry† 12,772 (22.2) 11,029 (30.8) 134 (8.9) 6 (0.1) 1,604 (10.5)
Meat† 6,138 (10.7) 5,238 (14.6) 15 (1.0) 6 (0.1) 880 (5.8)
Beef 3,075 (5.4) 2,650 (7.4) 4 (0.3) 421 (2.8)
Game 117 (0.2) 94 (0.3) 9 (0.6) 6 (0.1) 8 (0.1)
Pork 2,946 (5.1) 2,494 (7.0) 1 (0.1) 450 (2.9)
Poultry 6,634 (11.5) 5,791 (16.2) 119 (8.0) 724 (4.7)
Plants† 23,506 (40.9) 13,043 (36.4) 377 (25.2) 221 (4.5) 9,865 (64.5)
Grains-beans 1,437 (2.5) 695 (1.9) 78 (5.2) 664 (4.3)
Oils-sugars 184 (0.3) 14 (0.9) 170 (1.1)
Produce† 21,885 (38.1) 12,349 (34.5) 284 (19.0) 221 (4.5) 9,031 (59.1)
Fruits-nuts 5,829 (10.1) 3,279 (9.2) 177 (11.8) 213 (4.4) 2,160 (14.1)
Vegetables† 16,057 (27.9) 9,070 (25.3) 108 (7.2) 8 (0.2) 6,871 (45.0)
Fungi 37 (0.1) 14 (0.0) 23 (1.5)
Leafy 7,769 (13.5) 2,393 (6.7) 55 (3.7) 7 (0.1) 5,314 (34.8)
Root 1,501 (2.6) 793 (2.2) 7 (0.5) 700 (4.6)
Sprout 713 (1.2) 713 (2.0)
Vine-stalk 6,038 (10.5) 5,157 (14.4) 22 (1.5) 1 (0.0) 857 (5.6)
Undetermined 4,639 (8.1) 124 (0.3) 4,428 (90.6) 87 (0.6)
Total 57,462 (100.0) 35,797 (100.0) 1,496 (100.0) 4,886 (100.0) 15,284 (100.0)

9
16. Which of the following does not apply to parasitic protists? Circle all that apply. (2 points)
a. Has RNA and DNA
b. Are not animal, plant, or fungus
c. Require a host for reproduction
d. Diseases they cause can be treated with antibiotic
17. According to the table, which of the following are commodity groups? Circle all that apply. (2
points)
a. Plants
d. Beef
e. Aquatic Animals
f. Shellfish
18. Which single commodity (i.e. not group) listed in the table caused the most hospitalization?
(2 points)
19. For the Leafy commodity listed in the table which agent caused the most hospitalization (a) and
which specific organism was the most likely the highest contributor to that agent (b)? (3 points)
a.
b.
20. For the Fish commodity, chemical/toxin agents caused the most hospitalization. Name a type of
food borne disease caused by chemical/toxins when eating fish (a), symptoms associated with
the disease (b), and the cause of the toxins (c). (3 points) TIEBREAKER 3
a.
b.
c.
10
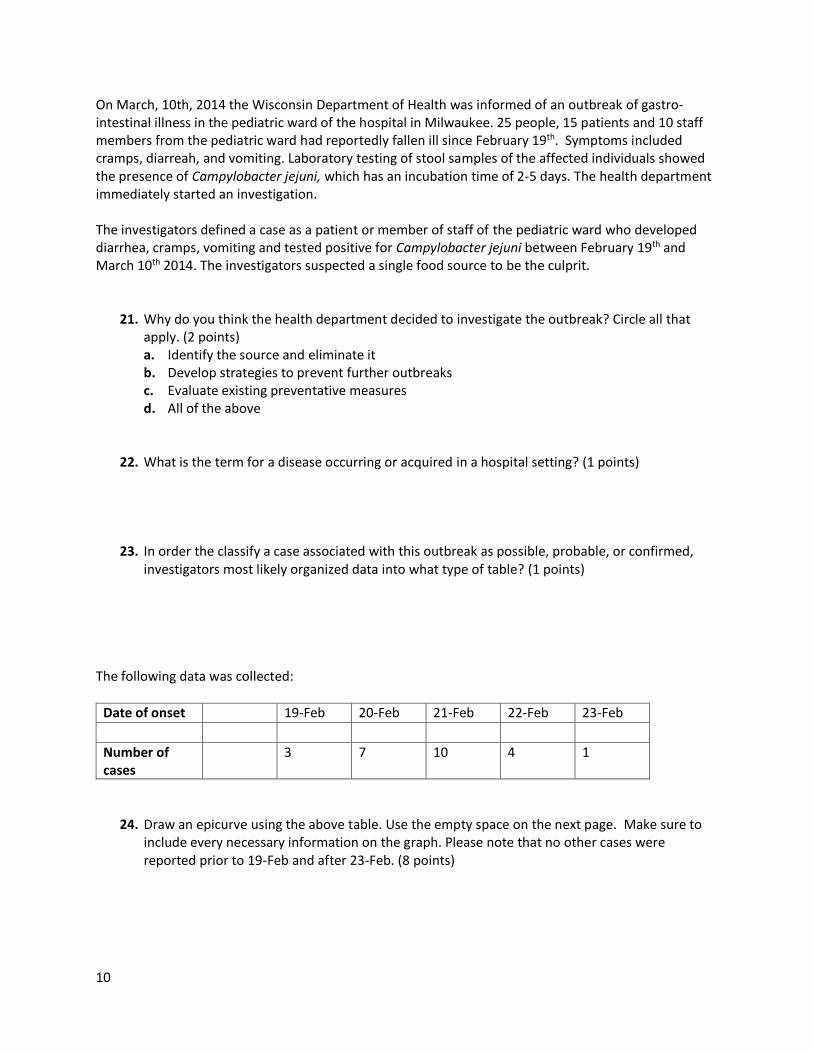
On March, 10th, 2014 the Wisconsin Department of Health was informed of an outbreak of gastro-intestinal illness in the pediatric ward of the hospital in Milwaukee. 25 people, 15 patients and 10 staff members from the pediatric ward had reportedly fallen ill since February 19th. Symptoms included cramps, diarreah, and vomiting. Laboratory testing of stool samples of the affected individuals showed the presence of Campylobacter jejuni, which has an incubation time of 2-5 days. The health department immediately started an investigation. The investigators defined a case as a patient or member of staff of the pediatric ward who developed diarrhea, cramps, vomiting and tested positive for Campylobacter jejuni between February 19th and March 10th 2014. The investigators suspected a single food source to be the culprit.
21. Why do you think the health department decided to investigate the outbreak? Circle all that apply. (2 points) a. Identify the source and eliminate it b. Develop strategies to prevent further outbreaks c. Evaluate existing preventative measures d. All of the above
22. What is the term for a disease occurring or acquired in a hospital setting? (1 points)
23. In order the classify a case associated with this outbreak as possible, probable, or confirmed, investigators most likely organized data into what type of table? (1 points)
The following data was collected:
Date of onset
19-Feb 20-Feb 21-Feb 22-Feb 23-Feb
Number of cases
3 7 10 4 1
24. Draw an epicurve using the above table. Use the empty space on the next page. Make sure to include every necessary information on the graph. Please note that no other cases were reported prior to 19-Feb and after 23-Feb. (8 points)

11
Draw Epi curve here:
25. What type of outbreak does your epi curve indicate (a)? Does this support the suspicion of a single food source as the culprit (b)? Explain your answer. (2 points) a.
b.
26. The investigators are suspecting that all affected individuals consumed the contaminated food
on the same date. On what date was the contaminated food most likely consumed? Explain your answer. (3 points)
One common source of Campylobacter jejuni food poisoning is raw or undercooked chicken. The investigators decided to conduct a study to determine if chicken that was served at the pediatric ward the days preceding the outbreak was the culprit. The investigators were able to gather information about all patients and staff in terms of whether they had eaten the chicken or not. They decided to compare confirmed cases who ate chicken with patients and staff who also ate the chicken but did not become ill. Of the 25 confirmed cases, 23 reported to have eaten chicken. Of the patients and staff who did not become ill, 42 reported to have eaten the chicken. There were a total of 90 patients and staff in the pediatric ward during the days preceding the outbreak.
27. What type of study is this? Circle all that apply. (2 points) a. Cross-sectional b. Experimental c. Observational d. Case-control

12
28. Arrange the information from the above paragraph into a meaningful 2X2 table. (4 points)
29. What can you calculate from the table (a)? Perform the calculation (b), and interpret the result (c). (5 points) a.
b.
c.
30. How do you explain the two confirmed cases that did not eat the chicken? (3 points)
THE END

1
Score:_________
Rank:__________
Team Number: __________
School Name: _____________________________________________________
Student Names: ____________________________________________________
Disease Detectives – C
UW Milwaukee Regional Event
January 28th, 2017

2
Please read all questions carefully.
Please mark your answers on the test.
Please write clearly.
1. Match the following terms to their definitions in the table on the following page by writing the
corresponding letter into the column marked ‘Term’. Note that not all terms will be used and
that there is only one correct answer per definition. (16 points)
A. Active Immunity
B. Age adjusted mortality rate
C. Age specific mortality rate
D. Association
E. Case definition
F. Case-control Study
G. Cohort Study
H. Confounding
I. Droplet spread transmission
J. Epidemiology
K. Etiology
L. Fomite
M. Incidence
N. Infectivity
O. Interval Scale
P. Morbidity
Q. Passive Immunity
R. Pathogenicity
S. Point Source
T. Prevalence
U. Propagated Source
V. Prospective study
W. Ratio Scale
X. Vector borne transmission
Y. Vehicle borne transmission
Z. Virulence

3
Term Definition
F a type of observational study in which two existing groups differing in outcome are identified and compared on the basis of some supposed causal attribute.
V an analytic study in which participants are enrolled before the health outcome of interest has occurred
Y transmission of an agent by an inanimate object; considered a type of indirect transmission; includes foodborne and waterborne transmission
Z measure of the degree of disease that a pathogen causes
O a measurement scale consisting of quantitative categories whose values are measured on a scale of equally spaced units, but without a true zero point (e.g., date of birth)
S a common source outbreak in which the exposure period is relatively brief so that all cases occur within one incubation period
M the rate of new cases of illness commencing during a specified time period in a given population
Q immunity conferred by an antibody produced in another host This type of immunity can be acquired naturally by an infant from its mother or artificially by administration of an antibody-containing preparation (e.g., antiserum or immune globulin)
H the distortion of the association between an exposure and a health outcome by a third variable that is related to both
K the study of the cause or origin of a disease
B a mortality rate that has been statistically modified to eliminate the effect of different age distributions among different populations
L an inanimate object that can be the vehicle for transmission of an infectious agent (e.g., bedding, towels, or surgical instruments)
E uniform set of criteria that specifies clinical information, details of time, place, and person and is used to determine if an individual is part of an outbreak
I the direct transmission of an infectious agent by means of the aerosols produced in sneezing, coughing, or talking that travel only a short distance before falling to the ground
P any departure, subjective or objective, from a state of physiological or psychological health and well-being
J the study of the distribution and determinants of health conditions or events among populations and the application of that study to control health problems
2. Fill in all the blanks in the table. Row 1 is already done. (10 points)

4
Scientific Name of pathogen
Type of pathogen
Food borne disease caused by pathogen
Transmission/Food Source
Clostridium botulinum
Bacteria Botulism vegetables, canned food
Yersinia enterocolitica
Bacteria Yersiniosis Raw or undercooked pork
Clostridium perfringen
Bacteria perfringens food poisoning
meat poultry
Hepatitus A virus
Virus Hepatitis A Contaminated food, water, person-to-person, fish from contaminated water
Giardia Parasite Giardiasis food, or water that has been contaminated with feces from infected humans or animals.
Toxoplasma gondii
Parasite Toxoplasmosis Undercooked contaminated meat, water
Cyclospora cayetanensis
Parasite Cyclosporiasis fresh produce contaminted with feces
Shigella Bacteria Shigellosis Food contaminated with feces
Samonella Bacteria Salmonellosis eggs, poultry, dairy
E. coli O157:H7 Bacteria Hemorrhagic colitis
Undercooked beef, unpasteurized milk, raw fruit, sprouts, contaminated water
The following is modified information taken from “Leveling of Tuberculosis Incidence — United States,
2013–2015” MMWR Weekly / March 25, 2016 / 65(11);273–278:
“After 2 decades of annual declines, TB (Tuberculosis) incidence in the United States has leveled. The
determinants of this leveling in TB incidence are not yet clear; further evaluation of available data is
required to understand the causes of this trend. Health departments in the 50 states and District of
Columbia (DC) electronically report verified tuberculosis (TB) cases that meet the CDC and Council of
State and Territorial Epidemiologists case definition to the National Tuberculosis Surveillance System.”
3. What are the four parts of a case definition? (4 points)
a. time --- 1 point
b. place --- 1 point
c. person --- 1 point
d. clinical features/laboratory confirmed (take either or both answers) --- 1 point
4. What pathogen causes TB (a), how is this disease transmitted (b), and who is credited with its
discovery? (3 points) TIEBRAKER 1
a. Mycobacterium tuberculosis --- 1 point
b. Aerosol (or airborne) --- 1 point
c. Robert Koch --- 1 point

5
The authors of this study compiled some of the data into the following table for interpretation and some
statistical analysis:
TABLE 1. Tuberculosis (TB) case counts and incidence, by U.S. Census division and state — United States, 2014 and 2015

6
Use the data from the table to answer the following questions:
5. What is the TB incidence per 100,000 for the total US population in 2015? (2 points)
3.0
6. Calculate the total population in Kansas in 2015. Show your work. (3 points total) TIEBRAKER 2
Use formula for incidence rate per 100,000. # of new cases/total population at risk * 100,000 =
incidence rate; thus 36/x * 100,000 = 1.2 where x is total population; x = 3,000,000
7. In 2015, which state had the lowest incidence and what was it? (1 point)
West Virgina, 0.5
8. IN 2015, which state had the highest incident and what was it? (1 point)
Alaska, 9.1
9. Based on your two previous answers, what would be more meaningful to calculate in order to
compare state incidence across the entire US, the mean or the median of all state incidence and
why? (3 points total)
Median as data is skewed (outliers, wide range) --- 1 point for correct answer, 2 points for
correct explanation
10. Calculate the mean (a) and media (b) of reported TB cases for Division 4 for 2014? Show all your
work and round to three digits. (4 points total)
a. 54.6 --- 2 points
b. Arrange number of reports from smallest to largest: ---- 2 points
8
15
38
40
54
80
147 Since there is an odd number of reported cases (7), add one to give you 8, then divide by
2, which will give you 4 and is the position in the list that is the median.

7
11. Which of the following would be appropriate choices to help further decline the incidence of
TB? Circle all that apply. (2 points)
a. Strengthen systems that aim to interrupt TB transmission.
b. Increase testing and treatment of people with latent TB infections.
c. Identify specific demographic populations most at risk.
d. Vaccinate populations most at risk.
The next set of data is taking from Emerging Infectious Diseases, Volume 19, Number 3—March 2013,
DOI: 10.3201/eid1903.111866:
“Attribution of Foodborne Illnesses, Hospitalizations, and Deaths to Food Commodities by using
Outbreak Data, United States, 1998–2008
Each year, >9 million foodborne illnesses are estimated to be caused by major pathogens
acquired in the United States. Preventing these illnesses is challenging because resources are
limited and linking individual illnesses to a particular food is rarely possible except during an
outbreak. The authors reviewed all outbreaks from 1998, the first year with detailed information
on ingredients, through 2008 that were reported to the CDC by October 2010. For this analysis,
they included all outbreaks with an implicated food vehicle and a single etiologic agent.”
12. Which of the following terms does not apply to vehicle transmission? Circle all that apply. (2
points)
a. Fomite
b. Cooking utensil
c. Indirect
d. Malaria
13. Which of the following is not an etiological agent that can cause a foodborne disease? Circle all
that apply. (2 points)
a. Rotavirus
b. Vibrio vulnificus
c. Trichinella spiralis
d. Yersinia Pestis
14. State and local health departments report foodborne disease outbreaks to the Center for
Disease Control and Prevention (CDC). The ongoing systematic collection and recording of such
data used for analysis, and interpretation is part of which of the following? Circle all that apply.
(2 points)
a. Cluster
b. Surveillance
c. Incidence
d. Prevalence

8
The authors compiled information on %hospitalization in the following table:
Table 2 Estimates of annual hospitalizations for domestically acquired foodborne illnesses attributed to specific food
commodities and commodity groups, by pathogen type, United States, 1998–2008
15. This table lists bacterial, chemical/toxins, parasitic, and viral agents. Which of the following are
characteristics of viruses? Circle all that apply. (2 points)
a. Can replicate outside of a living cell.
b. Can have RNA or DNA
c. Can infect plants.
d. Can be seen with a light microscope.
Commodity or commodity group No. (%) hospitalizations
All agents Bacterial Chemical/toxin Parasitic Viral
Aquatic animals† 3,199 (5.6) 1,158 (3.2) 921 (61.6) 231 (4.7) 889 (5.8)
Fish 1,661 (2.9) 210 (0.6) 894 (59.8) 6 (0.1) 551 (3.6)
Shellfish† 1,538 (2.7) 948 (2.6) 27 (1.8) 225 (4.6) 338 (2.2)
Crustaceans 117 (0.2) 75 (0.2) 7 (0.5) 34 (0.2)
Mollusks 1,421 (2.5) 873 (2.4) 20 (1.3) 225 (4.6) 303 (2.0)
Land animals† 26,118 (45.5) 21,471 (60.0) 198 (13.3) 6 (0.1) 4,443 (29.1)
Dairy 9,284 (16.2) 7,464 (20.9) 23 (1.5) 1,798 (11.8)
Eggs 4,062 (7.1) 2,979 (8.3) 42 (2.8) 1,041 (6.8)
Meat-poultry† 12,772 (22.2) 11,029 (30.8) 134 (8.9) 6 (0.1) 1,604 (10.5)
Meat† 6,138 (10.7) 5,238 (14.6) 15 (1.0) 6 (0.1) 880 (5.8)
Beef 3,075 (5.4) 2,650 (7.4) 4 (0.3) 421 (2.8)
Game 117 (0.2) 94 (0.3) 9 (0.6) 6 (0.1) 8 (0.1)
Pork 2,946 (5.1) 2,494 (7.0) 1 (0.1) 450 (2.9)
Poultry 6,634 (11.5) 5,791 (16.2) 119 (8.0) 724 (4.7)
Plants† 23,506 (40.9) 13,043 (36.4) 377 (25.2) 221 (4.5) 9,865 (64.5)
Grains-beans 1,437 (2.5) 695 (1.9) 78 (5.2) 664 (4.3)
Oils-sugars 184 (0.3) 14 (0.9) 170 (1.1)
Produce† 21,885 (38.1) 12,349 (34.5) 284 (19.0) 221 (4.5) 9,031 (59.1)
Fruits-nuts 5,829 (10.1) 3,279 (9.2) 177 (11.8) 213 (4.4) 2,160 (14.1)
Vegetables† 16,057 (27.9) 9,070 (25.3) 108 (7.2) 8 (0.2) 6,871 (45.0)
Fungi 37 (0.1) 14 (0.0) 23 (1.5)
Leafy 7,769 (13.5) 2,393 (6.7) 55 (3.7) 7 (0.1) 5,314 (34.8)
Root 1,501 (2.6) 793 (2.2) 7 (0.5) 700 (4.6)
Sprout 713 (1.2) 713 (2.0)
Vine-stalk 6,038 (10.5) 5,157 (14.4) 22 (1.5) 1 (0.0) 857 (5.6)
Undetermined 4,639 (8.1) 124 (0.3) 4,428 (90.6) 87 (0.6)
Total 57,462 (100.0) 35,797 (100.0) 1,496 (100.0) 4,886 (100.0) 15,284 (100.0)

9
16. Which of the following does not apply to parasitic protists? Circle all that apply. (2 points)
a. Has RNA and DNA
b. Are not animal, plant, or fungus
c. Require a host for reproduction
d. Diseases they cause can be treated with antibiotic
17. According to the table, which of the following are commodity groups? Circle all that apply. (2
points)
a. Plants
d. Beef
e. Aquatic Animals
f. Shellfish
18. Which single commodity (i.e. not group) listed in the table caused the most hospitalization?
(2 points)
Dairy
19. For the Leafy commodity listed in the table which agent caused the most hospitalization (a) and
which specific organism was the most likely the highest contributor to that agent (b). (3 points)
a. Virus --- 1 point
b. Norovirus --- 2 points
20. For the Fish commodity, chemical/toxin agents caused the most hospitalization. Name a type of
food borne disease caused by chemical/toxins when eating fish (a), symptoms associated with
the disease (b), and the cause of the toxins (c). (3 points) TIEBREAKER 3
a. Ciguatera or scombroid or shellfish toxin or puffer fish or mercury/ --- 1 point
b. gastrointestinal illness and may also cause neurologic symptoms/ acute allergic
reaction/paralysis/paralysis/mercury associated --- 1 point
c. toxin made by dinoflagellates such as Gambierdiscus toxicus (algae)/ naturally high levels
of histidine (converted to histamine)/toxin made by algae/Tetrodotoxin/environment --- 1
points
On March, 10th, 2014 the Wisconsin Department of Health was informed of an outbreak of gastro-intestinal illness in the pediatric ward of the hospital in Milwaukee. 25 people, 15 patients and 10 staff members from the pediatric ward had reportedly fallen ill since February 19th. Symptoms included cramps, diarreah, and vomiting. Laboratory testing of stool samples of the affected individuals showed the presence of Campylobacter jejuni, which has an incubation time of 2-5 days. The health department immediately started an investigation. The investigators defined a case as a patient or member of staff of pediatric ward who developed diarrhea, cramps, vomiting and tested positive for Campylobacter jejuni between February 19th and March 10th 2014. The investigators suspected a single food source to the culprit.

10
21. Why do you think the health department decided to investigate the outbreak? Circle all that apply. (2 points) a. Identify the source and eliminate it b. Develop strategies to prevent further outbreaks c. Evaluate existing preventative measures d. To learn more about C.jejuni infections
22. What is the term for a disease occurring or acquired in a hospital setting? (1 point)
Nosocomial
23. In order the classify a case associated with this outbreak as possible, probable, or confirmed, investigators most likely organized data into what type of table? (1 point) Line listing
The following data was collected:
Date of onset
19-Feb 20-Feb 21-Feb 22-Feb 23-Feb
Number of cases
3 7 10 4 1
24. Draw an epicurve using the above table. Make sure to include every necessary information on the graph. Please note that no other cases were reported prior to 19-Feb and after 23-Feb. (8 points) Correct label of x- and y-axis as well as title, appropriate scale (1/4 of 2-5 days, pick average incubation time of 1 day for x-axis) --- 2 points for correct graph, 1 point per each axis label, 2 points for correct scale, 2 points for correct title)

11
25. What type of outbreak does your epi curve indicate (a)? Does this support the suspicion of a single food source as the culprit (b)? Explain your answer. (2 points) a. Point source --- 1 point b. Yes as point source is indicative of single exposure --- 1 for correct answer/explanation
26. The investigators are suspecting that all affected individuals consumed the contaminated food
on the same date. On what date was the contaminated food most likely consumed? Explain your answer. (3 points) Feb. 17 due to single point source, incubation time, and first and last cases --- 2 points for date, 1 points for correct explanation
One common source of Campylobacter jejuni food poisoning is raw or undercooked chicken. The investigators decided to conduct a study to determine if chicken that was served at the pediatric ward the days preceding the outbreak was the culprit. The investigators were able to gather information about all patients and staff in terms of whether they had eaten the chicken or not. They decided to compare confirmed cases who ate chicken with patients and staff who also ate the chicken but did not become ill. Of the 25 confirmed cases, 23 reported to have eaten chicken. Of the patients and staff who did not become ill, 42 reported to have eaten the chicken. There were a total of 90 patients and staff in the pediatric ward during the days preceding the outbreak.
27. What type of study is this? Circle all that apply. (2 points) a. Cross-sectional b. Experimental c. Observational d. Case-control
28. Arrange the information from the above paragraph into a meaningful 2X2 table. (4 points)
Cases Controls
Exposed (ate chicken) 23 42 Not exposed (did not eat chicken) 2 23
29. What can you calculate from the table (a), perform the calculation (b), and interpret the result (c). (5 points) a. Odds ration --- 1 point b. (23/42)/(2/23) = 6.11--- 2 points c. People of having eaten the chicken are 6.11 times more likely to become sick than people
who did not. Supports hypothesis that chicken was culprit. --- 2 points Give half credit for RR.
30. How do you explain the two confirmed cases that did not eat the chicken? (3 points) Take any
reasonable explanation

12