disease-modifying drugs for knee osteoarthritis: can they ... · dmoads. there are two measures of...
TRANSCRIPT

Osteoarthritis and Cartilage 21 (2013) 655e667
Disease-modifying drugs for knee osteoarthritis: can they be cost-effective?
E. Losina yzxk*, M.E. Daigle y, L.G. Suter{, D.J. Hunter#, D.H. Solomon zx, R.P. Walensky xyyzz,J.M. Jordan xx, S.A. Burbine y, A.D. Paltiel{, J.N. Katz yzxyOrthopaedic and Arthritis Center for Outcomes Research, Department of Orthopedic Surgery, Brigham and Women’s Hospital, Boston, MA, USAz Section of Clinical Sciences, Division of Rheumatology, Immunology and Allergy, Brigham and Women’s Hospital, Boston, MA, USAxHarvard Medical School, Boston, MA, USAkBoston University School of Public Health, Boston, MA, USA{Yale University, New Haven, CT, USA#University of Sydney, Sydney, AustraliayyDivision of Infectious Disease, Brigham and Women’s Hospital, Boston, MA, USAzzMassachusetts General Hospital, Boston, MA, USAxx Thurston Arthritis Research Center, University of North Carolina, Chapel Hill, NC, USA
a r t i c l e i n f o
Article history:Received 29 August 2012Accepted 25 January 2013
Keywords:Knee osteoarthritisCost-effectivenessQuality of lifeDisease-modifying osteoarthritis drugs(DMOADs)
* Address correspondence and reprint requests toArthritis Center for Outcomes Research, Brigham andSt., OBC-1-4016, Boston, MA 02115, USA. Tel.: 1-617-732
E-mail addresses: [email protected] (E. Lo(M.E. Daigle), [email protected] (L.G. Suter),(D.J. Hunter), [email protected] (D.H. Solom(R.P. Walensky), [email protected] (J.gmail.com (S.A. Burbine), [email protected] (J.N. Katz).
1063-4584/$ e see front matter � 2013 Osteoarthritihttp://dx.doi.org/10.1016/j.joca.2013.01.016
s u m m a r y
Objective: Disease-modifying osteoarthritis drugs (DMOADs) are under development. Our goal was todetermine efficacy, toxicity, and cost thresholds under which DMOADs would be a cost-effective knee OAtreatment.Design: We used the Osteoarthritis Policy Model, a validated computer simulation of knee OA, to compareguideline-concordant care to strategies that insert DMOADs into the care sequence. The guideline-concordant care sequence included conservative pain management, corticosteroid injections, total kneereplacement (TKR), and revision TKR. Base case DMOAD characteristics included: 50% chance of sus-pending progression in the first year (resumption rate of 10% thereafter) and 30% pain relief among thosewith suspended progression; 0.5%/year risk of major toxicity; and costs of $1,000/year. In sensitivity an-alyses, we varied suspended progression (20e100%), pain relief (10e100%), major toxicity (0.1e2%), andcost ($1,000e$7,000). Outcomes included costs, quality-adjusted life expectancy, incremental cost-effectiveness ratios (ICERs), and TKR utilization.Results: Base case DMOADs added 4.00 quality-adjusted life years (QALYs) and $230,000 per 100 persons,with an ICER of $57,500/QALY. DMOADs reduced need for TKR by 15%. Cost-effectiveness was mostsensitive to likelihoods of suspended progression and pain relief. DMOADs costing $3,000/year achievedICERs below $100,000/QALY if the likelihoods of suspended progression and pain relief were 20% and70%. At a cost of $5,000, these ICERs were attained if the likelihoods of suspended progression and painrelief were both 60%.Conclusions: Cost, suspended progression, and pain relief are key drivers of value for DMOADs. Plausiblecombinations of these factors could reduce need for TKR and satisfy commonly cited cost-effectivenesscriteria.
� 2013 Osteoarthritis Research Society International. Published by Elsevier Ltd. All rights reserved.
: E. Losina, Orthopaedic andWomen’s Hospital, 75 Francis-5338; Fax: 1-617-525-7900.sina), [email protected]@sydney.edu.auon), [email protected]. Jordan), sara.burbine@
(A.D. Paltiel), jnkatz@
s Research Society International. P
Introduction
Knee osteoarthritis (OA) is a prevalent and costly disease char-acterized by structural changes in cartilage, bone, synovium, andother joint structures1. Symptomatic knee OA is a leading cause ofdisability, afflicting more than 9.3 million US adults2. The risk forknee OA is growing substantially due to the aging population,obesity epidemic, and an increasing rate of knee injuries in young,active individuals1,3e7.
Current guidelines for knee OA care focus on pain relief andfunctional improvement8e10. Pharmacologic therapies are only
ublished by Elsevier Ltd. All rights reserved.
E. Losina et al. / Osteoarthritis and Cartilage 21 (2013) 655e667656
modestly efficacious and have significant associated toxicities. Forexample, non-steroidal anti-inflammatory drugs (NSAIDs) posegastrointestinal and cardiovascular risks11e13. There are no cur-rently approved OA treatments capable of slowing OA-relatedstructural progression or delaying the need for total knee replace-ment (TKR). Several large pharmaceutical companies are in the latestages of developing and testing disease-modifying OA drugs(DMOADs), and promising agents that may both halt progressionand provide symptom relief are currently being studied14e17.
In light of ongoing efforts to develop DMOADs, we sought toaddress several key questions: Can DMOADs be cost-effective, andif so, at what levels of efficacy, toxicity, and cost? How early in thecourse of treatment should DMOADs be initiated? Do DMOADshave the potential to reduce TKR utilization? To address these keyissues, we propose a novel framework in which model-basedevaluations of cost-effectiveness can be used to pre-evaluate newtreatment strategies before the treatments are actually in wide-spread use. Estimating the effects of particular features of a medi-cation on that medication’s cost-effectiveness can inform thedesign of trials and provide performance targets.
Methods
Analytic overview
We used the Osteoarthritis Policy (OAPol) Model, a validatedstate-transition computer simulation model, to compare clinicaloutcomes and costs between subjects receiving guideline-concordant treatments (the standard of care (SoC)) and subjectsreceiving SoC and DMOADs18,19. Outcomes included costs, quality-adjusted life expectancy (QALE), incremental cost-effectivenessratios (ICERs, the ratio of change in costs to change in QALE), andTKR utilization. In conformity with accepted practice, strategiesthat increased cost while not increasing QALE relative to an alter-native treatment strategy were referred to as “Dominated.” Weperformed the analysis from the health systems perspective(indirect costs were not included), with costs and QALE discountedat a rate of 3%/year, as recommended by the Panel on Cost-Effectiveness in Medicine20.
The OAPol Model
The OAPol Model is a Monte Carlo simulationwith a 1-year cyclelength and health states defined by knee OA severity, presence ofknee pain, comorbidities, and obesity18,19. Each year, subjects maydevelop a comorbid condition, increase in body mass index (BMI),progress in OA severity, and/or die. Progression of OA is defined asan increase by one KellgreneLawrence (KeL) radiographic gradeand is dependent on obesity status and sex21. The model considersfive comorbid conditions: coronary heart disease, diabetesmellitus,chronic obstructive pulmonary disease, cancer, and muscu-loskeletal disorders other than OA. The prevalences of these co-morbid conditions depend on age, sex, race/ethnicity, andobesity22e24. Each subject is followed until death, which may occurin any health state. The OAPol Model uses underlying mortalityrates from US life tables with excess mortality due to specific co-morbid conditions removed25. Individuals with comorbid condi-tions have greater risk of death26,27. Subjects with knee OA mayreceive OA treatments, which are characterized by the ability torelieve pain and suspend OA progression, toxicity, and cost. OAtreatments may carry major (e.g., gastrointestinal bleeding) andminor (e.g., dyspepsia, rash) toxicities, both of which decreasequality of life and increase costs. Major toxicities lead to regimendiscontinuation and may also cause death.
Each year, subjects accrue costs and changes in quality of life dueto OA or OA-related treatments and other underlying medical con-ditions. Quality of life weights are assigned to capture preferencesfor health states; a value of 1.0 denotes a state of perfect healthwhilea value of zero denotes health states that are preferentially equiv-alent to death28. Annual medical costs not directly attributable tokneeOA are based on comorbidities and age22,23,30,33. These data arepresented in Table I. Running tallies of survival, quality-adjustedsurvival, and costs are maintained for each individual and thenaggregated to compute average values for the cohort57. The fol-lowing paragraphs describe the means of modeling the SoC andDMOAD regimens.
Guideline-concordant OA care (SoC)The SoC consists of four, sequentially more invasive regimens:
conservative pain management, including NSAIDs, acetaminophen,supportive devices, and physical therapy (Regimen 1); cortico-steroid injections (Regimen 2); primary TKR (Regimen 3); andrevision TKR (Regimen 4)8e10. Subjects progress to the next regi-men in the sequence only when the current treatment fails or ifa major toxicity occurs. Failure of each regimen is assumed to bedetected in the year it occurs. Fundamental treatment character-istics for the SoC are presented in Table I and described in detail inthe Technical Appendix.
DMOADsWe evaluated treatment strategies where DMOADs were used
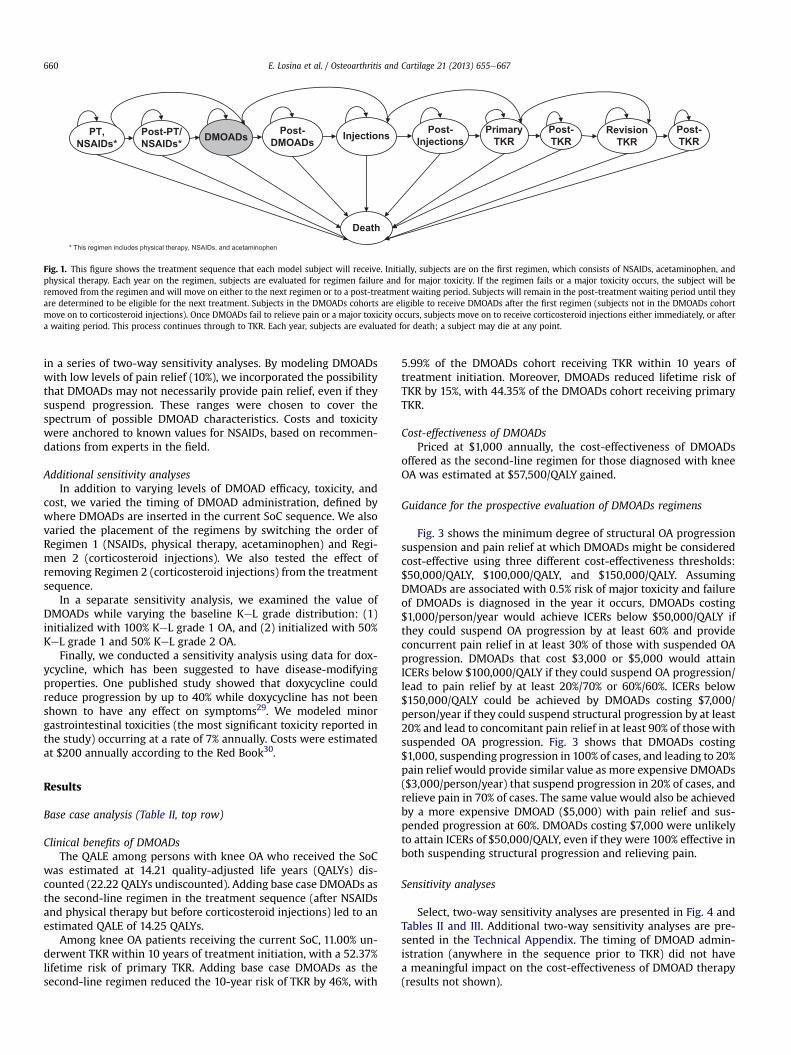
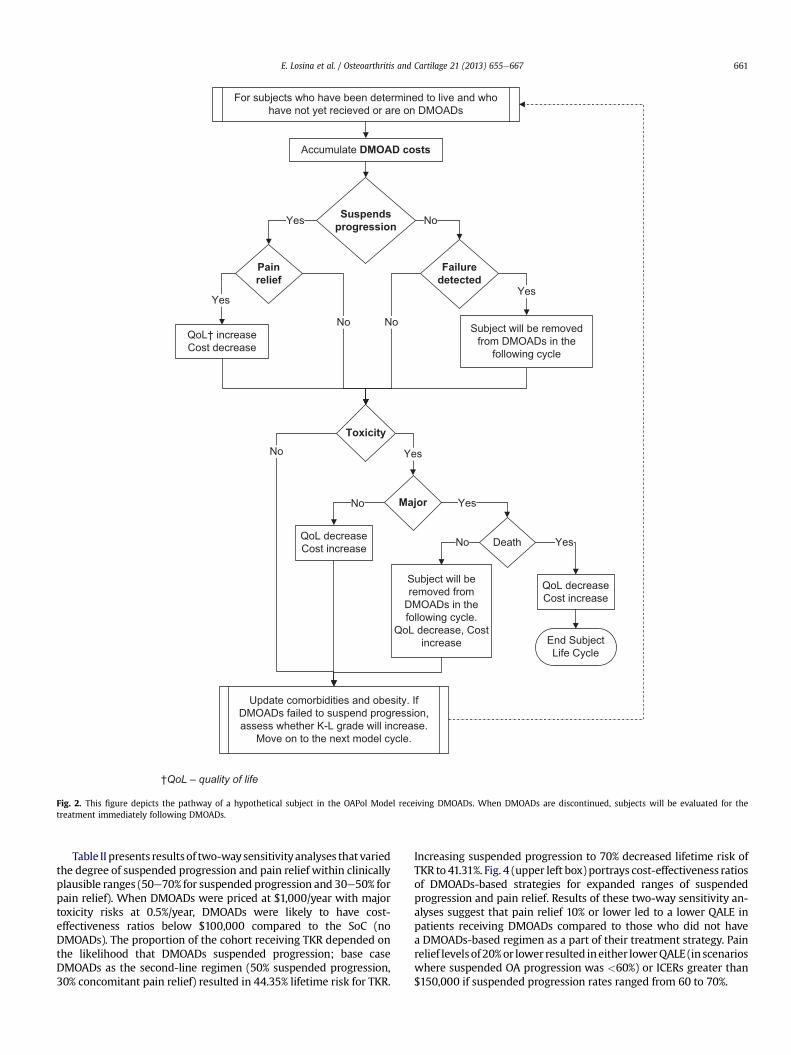
after the first SoC regimen and before the second SoC regimen.Fig. 1 illustrates the treatment sequence for individuals receivingDMOADs. There are two measures of DMOAD efficacy: structuralefficacy and pain relief. Structural efficacy is defined by a relativereduction in the probability of progressing from one KeL grade tothe next. Subjects for whom DMOADs suspend OA progression (i.e.,DMOADs exhibit structural efficacy) remain at their current KeLgrade. Subjects in whom structural progression is suspended mayalso experience pain relief and improvement in quality of life. Toensure a conservative approach with respect to the clinical value ofDMOADs, we assumed that DMOAD-related pain relief is restrictedto subjects in whom knee OA progression is suspended. Delayingprogression at earlier stages of the disease prevents decrements inquality of life associated with advanced OA (KeL grade 3 or 4).Subjects experiencing toxicity (major or minor) have a decrementin quality of life for that year and incur costs to treat the toxicity.Major toxicity carries a small risk of death. Subjects are removedfromDMOADs andmove on to the next treatment in the sequence ifDMOADs fail to suspend progression and that failure is detected, orif a major toxicity occurs. Fig. 2 shows the OAPol Model process forsubjects receiving DMOADs.
Base case DMOAD characteristics and assumptions
As recommended by the Panel on Cost-effectiveness Analyses inHealth and Medicine, we chose a set of “base case” estimates ofDMOAD efficacy, cost, and toxicity, to reflect the most likely set ofparameters of DMOADs based on a review of available literaturewhen possible and otherwise based on extensive discussions withclinicians20. In the base case, we assumed that DMOADs suspendedOA progression in 50% of subjects. Among those in whom DMOADssucceeded in suspending progression in the first year, there wasa 10% failure rate of maintaining the suspension of progression inevery subsequent year. We further assumed that once diseaseprogression resumed, it could no longer be suspended via DMOADs.For the base case analysis we chose to anchor pricing for DMOADsat $1,000/year, similar to the cost of prescription NSAIDs30. Inaddition to the baseline cost of DMOADs, we also considered the
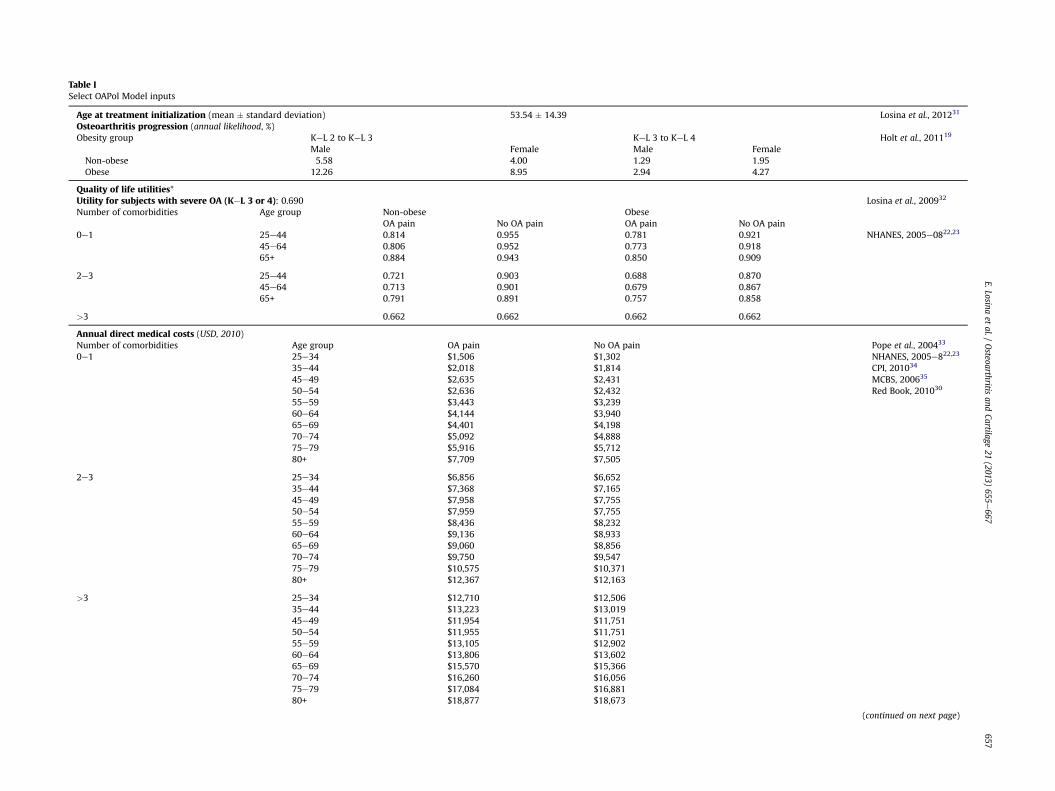
Table ISelect OAPol Model inputs
Age at treatment initialization (mean � standard deviation) 53.54 � 14.39 Losina et al., 201231
Osteoarthritis progression (annual likelihood, %)Obesity group KeL 2 to KeL 3 KeL 3 to KeL 4 Holt et al., 201119
Male Female Male FemaleNon-obese 5.58 4.00 1.29 1.95Obese 12.26 8.95 2.94 4.27
Quality of life utilities*Utility for subjects with severe OA (KeL 3 or 4): 0.690 Losina et al., 200932
Number of comorbidities Age group Non-obese ObeseOA pain No OA pain OA pain No OA pain
0e1 25e44 0.814 0.955 0.781 0.921 NHANES, 2005e0822,23
45e64 0.806 0.952 0.773 0.91865+ 0.884 0.943 0.850 0.909
2e3 25e44 0.721 0.903 0.688 0.87045e64 0.713 0.901 0.679 0.86765+ 0.791 0.891 0.757 0.858
>3 0.662 0.662 0.662 0.662
Annual direct medical costs (USD, 2010)Number of comorbidities Age group OA pain No OA pain Pope et al., 200433
NHANES, 2005e822,23
CPI, 201034
MCBS, 200635
Red Book, 201030
0e1 25e34 $1,506 $1,30235e44 $2,018 $1,81445e49 $2,635 $2,43150e54 $2,636 $2,43255e59 $3,443 $3,23960e64 $4,144 $3,94065e69 $4,401 $4,19870e74 $5,092 $4,88875e79 $5,916 $5,71280+ $7,709 $7,505
2e3 25e34 $6,856 $6,65235e44 $7,368 $7,16545e49 $7,958 $7,75550e54 $7,959 $7,75555e59 $8,436 $8,23260e64 $9,136 $8,93365e69 $9,060 $8,85670e74 $9,750 $9,54775e79 $10,575 $10,37180+ $12,367 $12,163
>3 25e34 $12,710 $12,50635e44 $13,223 $13,01945e49 $11,954 $11,75150e54 $11,955 $11,75155e59 $13,105 $12,90260e64 $13,806 $13,60265e69 $15,570 $15,36670e74 $16,260 $16,05675e79 $17,084 $16,88180+ $18,877 $18,673
(continued on next page)
E.Losinaet
al./Osteoarthritis
andCartilage
21(2013)
655e667
657
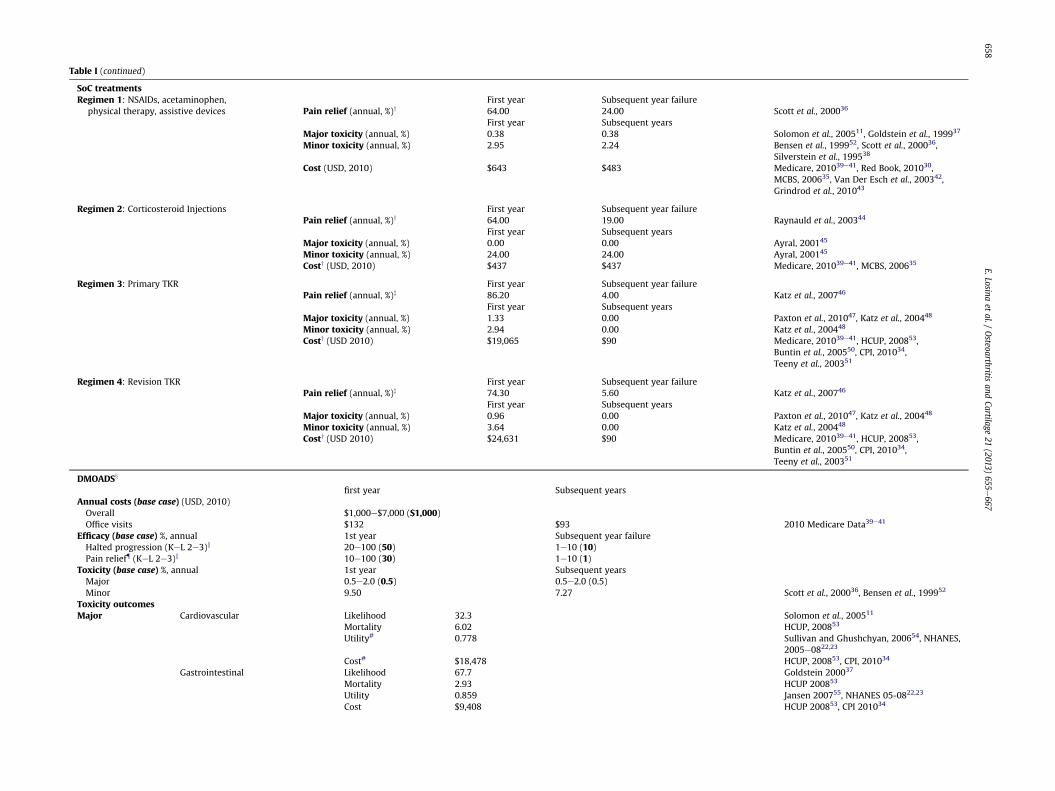
Table I (continued)
SoC treatmentsRegimen 1: NSAIDs, acetaminophen,
physical therapy, assistive devicesFirst year Subsequent year failure
Pain relief (annual, %)y 64.00 24.00 Scott et al., 200036
First year Subsequent yearsMajor toxicity (annual, %) 0.38 0.38 Solomon et al., 200511, Goldstein et al., 199937
Minor toxicity (annual, %) 2.95 2.24 Bensen et al., 199952, Scott et al., 200036,Silverstein et al., 199538
Cost (USD, 2010) $643 $483 Medicare, 201039e41, Red Book, 201030,MCBS, 200635, Van Der Esch et al., 200342,Grindrod et al., 201043
Regimen 2: Corticosteroid Injections First year Subsequent year failurePain relief (annual, %)y 64.00 19.00 Raynauld et al., 200344
First year Subsequent yearsMajor toxicity (annual, %) 0.00 0.00 Ayral, 200145
Minor toxicity (annual, %) 24.00 24.00 Ayral, 200145
Costy (USD, 2010) $437 $437 Medicare, 201039e41, MCBS, 200635
Regimen 3: Primary TKR First year Subsequent year failurePain relief (annual, %)z 86.20 4.00 Katz et al., 200746
First year Subsequent yearsMajor toxicity (annual, %) 1.33 0.00 Paxton et al., 201047, Katz et al., 200448
Minor toxicity (annual, %) 2.94 0.00 Katz et al., 200448
Costy (USD 2010) $19,065 $90 Medicare, 201039e41, HCUP, 200853,Buntin et al., 200550, CPI, 201034,Teeny et al., 200351
Regimen 4: Revision TKR First year Subsequent year failurePain relief (annual, %)z 74.30 5.60 Katz et al., 200746
First year Subsequent yearsMajor toxicity (annual, %) 0.96 0.00 Paxton et al., 201047, Katz et al., 200448
Minor toxicity (annual, %) 3.64 0.00 Katz et al., 200448
Costy (USD 2010) $24,631 $90 Medicare, 201039e41, HCUP, 200853,Buntin et al., 200550, CPI, 201034,Teeny et al., 200351
DMOADSx
first year Subsequent yearsAnnual costs (base case) (USD, 2010)Overall $1,000e$7,000 ($1,000)Office visits $132 $93 2010 Medicare Data39e41
Efficacy (base case) %, annual 1st year Subsequent year failureHalted progression (KeL 2e3)k 20e100 (50) 1e10 (10)Pain relief{ (KeL 2e3)k 10e100 (30) 1e10 (1)
Toxicity (base case) %, annual 1st year Subsequent yearsMajor 0.5e2.0 (0.5) 0.5e2.0 (0.5)Minor 9.50 7.27 Scott et al., 200036, Bensen et al., 199952
Toxicity outcomesMajor Cardiovascular Likelihood 32.3 Solomon et al., 200511
Mortality 6.02 HCUP, 200853
Utility# 0.778 Sullivan and Ghushchyan, 200654, NHANES,2005e0822,23
Cost# $18,478 HCUP, 200853, CPI, 201034
Gastrointestinal Likelihood 67.7 Goldstein 200037
Mortality 2.93 HCUP 200853
Utility 0.859 Jansen 200755, NHANES 05-0822,23
Cost $9,408 HCUP 200853, CPI 201034
E.Losinaet
al./Osteoarthritis
andCartilage
21(2013)
655e667
658
Minor
Gen
eral
minor
even
tsLike
lihoo
d10
0Mortality
0Utility
0.92
3Jansenet
al.,20
0755,N
HANES
,05e
0822,23
Cost
$47
Kam
athet
al.,20
0356,C
PI,2
0103
4
Abb
reviations:
CPI,c
onsu
mer
price
inflationcalculator;
MCBS,
Med
icareCurren
tBen
eficiarySu
rvey
;HCUP,
Hea
lthcare
Costan
dUtiliz
ationProject.
*Thelowestutilityassociated
withthesu
bject’shea
lthstatewas
usedby
themod
el;forex
ample,a
45-yea
r-oldsu
bjectwithseve
reOAan
don
eco
morbiditywou
ldhav
eautilityof
0.69
0,wherea
s,thesamesu
bjectwiththree
comorbiditieswou
ldhav
eautilityof
0.66
2.yEfficacy
forregimen
s1an
d2ap
plie
son
lyto
individualswhoareat
KeLgrad
e2.
zOnly
painrelie
fefficacy
associated
withTK
Ris
show
n.T
KRtech
nical
efficacy
(e.g.,stab
ility
oftheim
plant)
was
grea
terthan
98%forprimaryan
drevision
TKR.
xSe
nsitivity
analysis
range
sforea
chparam
eter
hav
ebe
enpresented;ba
secase
values
appea
rin
bold
within
paren
theses.
kPa
inrelie
fan
dsu
spen
ded
progression
were0%
forsu
bjects
whohav
eprogressedto
KeLgrad
e4.
(KeL4represents
themostseve
releve
lofkn
eeOA,thuspatients
cannot
progressbe
yondit.)
{Pa
inrelie
fon
lyoc
curred
iftherewas
also
susp
ended
progression
.#
Toxicity
utilitiesan
dco
sts(U
SD,2
010)
wereap
plie
don
lyin
theye
arthat
theev
entoc
curred
.
E. Losina et al. / Osteoarthritis and Cartilage 21 (2013) 655e667 659
cost of one office visit per year: $132 in the first year and $93 insubsequent years (reflecting higher costs for new patient visits)58.
In practice, monitoring for drug failure is typically triggeredwhen patients report the persistence or recurrence of pain. Sincedrug failures to suspend disease progression would be accom-panied by pain, we therefore assumed that all DMOAD failureswould be detected in the year they occurred, resulting in dis-continuation of DMOADs and allowing subjects to advance to thenext treatment regimen. We assumed in the base case that thelikelihood of pain relief was 30% given that progression was sus-pended (that is, 15% overall likelihood of pain relief). Amongpatients whose structural progression had been suspended due toDMOADs and who experienced initial pain relief, there wasa 1%/year chance of losing pain relief. The failure to sustain painrelief reflects a multitude of factors, including suboptimal adher-ence and accumulation of additional risk factors such as injury.
We anchored values for both major and minor toxicities ofDMOADs to NSAID toxicity characteristics. The cohort of individualseligible to receive DMOADs will be similar to the population cur-rently utilizing NSAIDs for OA pain; thus, acceptable DMOADadverse event rates are likely to be comparable to those of NSAIDs.The likelihood of major toxicity was assumed to be 0.5% per yearbased on the major toxicity risks of Cox-2 selective NSAIDs11,37.DMOAD minor toxicity was modeled after the toxicity of non-selective NSAIDs, with 9.50% risk in the first year, and 7.27% riskin all subsequent years36,52.
Cohort characteristics
We considered cohorts with a mean age of 53.5 years (standarddeviation 14.4 years) based on estimates of the average age of OAdiagnosis in the US31. Race/ethnicity, sex, and obesity distributionsfor persons with diagnosed knee OA were derived from the Na-tional Health Interview Survey (NHIS) 2007e200824. In the absenceof efficacious DMOADs, annual OA progression rates (percentage ofsubjects who worsened in KeL grade in a year) ranged from 1.29%for non-obese, KeL grade 3 males to 12.26% for obese, KeL grade 2males19. Annual underlying (not related to OA management)medical costs (USD, 2010) ranged from $1,302 for young subjectswith at most one comorbid condition to $18,877 for older subjectswith greater than three comorbid conditions22,23,30,33e35. Quality oflife weights were derived by converting responses to general healthstatus questions in the National Health and Nutrition ExaminationSurvey (NHANES) 2005e2008 to health status ratings on a scale of0e1.022,23,59,60. These ratings were then transformed to preference-based utilities61. The values ranged from 0.95 for young, healthysubjects with no OA pain to 0.66 for older subjects with severalcomorbidities and knee pain. Advanced knee OA (defined assymptomatic KeL grades 3 or 4) had a quality of life weight of0.6932. Prevalence of comorbid conditions were derived fromNHANES 2005e200822,23. Table I summarizes select cohort inputcharacteristics; additional details have been published else-where18,19 or are presented in the Technical Appendix.
Sensitivity analyses
Two-way sensitivity analyses of DMOAD characteristicsWe conducted 21 sets of two-way sensitivity analyses, varying
likelihood of suspending OA progression, pain relief, major toxicity,loss of pain relief and/or resumption of OA progression, and costs.We tested the sensitivity of DMOAD cost-effectiveness to variationsin the initial likelihood of suspended progression (20e100%),failure to suspend progression in subsequent years (1e10%),initial pain relief (10e100%), failure to relieve pain in subsequentyears (1e10%), cost ($1,000e$7,000), and major toxicity (0.1e2%)
PT,
NSAIDs*
Primary
TKR
Revision
TKRDMOADs Injections
Death
Post-
TKR
Post-PT/
NSAIDs*
Post-
DMOADs
Post-
Injections
Post-
TKR
* This regimen includes physical therapy, NSAIDs, and acetaminophen
Fig. 1. This figure shows the treatment sequence that each model subject will receive. Initially, subjects are on the first regimen, which consists of NSAIDs, acetaminophen, andphysical therapy. Each year on the regimen, subjects are evaluated for regimen failure and for major toxicity. If the regimen fails or a major toxicity occurs, the subject will beremoved from the regimen and will move on either to the next regimen or to a post-treatment waiting period. Subjects will remain in the post-treatment waiting period until theyare determined to be eligible for the next treatment. Subjects in the DMOADs cohorts are eligible to receive DMOADs after the first regimen (subjects not in the DMOADs cohortmove on to corticosteroid injections). Once DMOADs fail to relieve pain or a major toxicity occurs, subjects move on to receive corticosteroid injections either immediately, or aftera waiting period. This process continues through to TKR. Each year, subjects are evaluated for death; a subject may die at any point.
E. Losina et al. / Osteoarthritis and Cartilage 21 (2013) 655e667660
in a series of two-way sensitivity analyses. By modeling DMOADswith low levels of pain relief (10%), we incorporated the possibilitythat DMOADs may not necessarily provide pain relief, even if theysuspend progression. These ranges were chosen to cover thespectrum of possible DMOAD characteristics. Costs and toxicitywere anchored to known values for NSAIDs, based on recommen-dations from experts in the field.
Additional sensitivity analysesIn addition to varying levels of DMOAD efficacy, toxicity, and
cost, we varied the timing of DMOAD administration, defined bywhere DMOADs are inserted in the current SoC sequence. We alsovaried the placement of the regimens by switching the order ofRegimen 1 (NSAIDs, physical therapy, acetaminophen) and Regi-men 2 (corticosteroid injections). We also tested the effect ofremoving Regimen 2 (corticosteroid injections) from the treatmentsequence.
In a separate sensitivity analysis, we examined the value ofDMOADs while varying the baseline KeL grade distribution: (1)initialized with 100% KeL grade 1 OA, and (2) initialized with 50%KeL grade 1 and 50% KeL grade 2 OA.
Finally, we conducted a sensitivity analysis using data for dox-ycycline, which has been suggested to have disease-modifyingproperties. One published study showed that doxycycline couldreduce progression by up to 40% while doxycycline has not beenshown to have any effect on symptoms29. We modeled minorgastrointestinal toxicities (the most significant toxicity reported inthe study) occurring at a rate of 7% annually. Costs were estimatedat $200 annually according to the Red Book30.
Results
Base case analysis (Table II, top row)
Clinical benefits of DMOADsThe QALE among persons with knee OA who received the SoC
was estimated at 14.21 quality-adjusted life years (QALYs) dis-counted (22.22 QALYs undiscounted). Adding base case DMOADs asthe second-line regimen in the treatment sequence (after NSAIDsand physical therapy but before corticosteroid injections) led to anestimated QALE of 14.25 QALYs.
Among knee OA patients receiving the current SoC, 11.00% un-derwent TKR within 10 years of treatment initiation, with a 52.37%lifetime risk of primary TKR. Adding base case DMOADs as thesecond-line regimen reduced the 10-year risk of TKR by 46%, with
5.99% of the DMOADs cohort receiving TKR within 10 years oftreatment initiation. Moreover, DMOADs reduced lifetime risk ofTKR by 15%, with 44.35% of the DMOADs cohort receiving primaryTKR.
Cost-effectiveness of DMOADsPriced at $1,000 annually, the cost-effectiveness of DMOADs
offered as the second-line regimen for those diagnosed with kneeOA was estimated at $57,500/QALY gained.
Guidance for the prospective evaluation of DMOADs regimens
Fig. 3 shows the minimum degree of structural OA progressionsuspension and pain relief at which DMOADs might be consideredcost-effective using three different cost-effectiveness thresholds:$50,000/QALY, $100,000/QALY, and $150,000/QALY. AssumingDMOADs are associated with 0.5% risk of major toxicity and failureof DMOADs is diagnosed in the year it occurs, DMOADs costing$1,000/person/year would achieve ICERs below $50,000/QALY ifthey could suspend OA progression by at least 60% and provideconcurrent pain relief in at least 30% of those with suspended OAprogression. DMOADs that cost $3,000 or $5,000 would attainICERs below $100,000/QALY if they could suspend OA progression/lead to pain relief by at least 20%/70% or 60%/60%. ICERs below$150,000/QALY could be achieved by DMOADs costing $7,000/person/year if they could suspend structural progression by at least20% and lead to concomitant pain relief in at least 90% of thosewithsuspended OA progression. Fig. 3 shows that DMOADs costing$1,000, suspending progression in 100% of cases, and leading to 20%pain relief would provide similar value as more expensive DMOADs($3,000/person/year) that suspend progression in 20% of cases, andrelieve pain in 70% of cases. The same value would also be achievedby a more expensive DMOAD ($5,000) with pain relief and sus-pended progression at 60%. DMOADs costing $7,000 were unlikelyto attain ICERs of $50,000/QALY, even if they were 100% effective inboth suspending structural progression and relieving pain.
Sensitivity analyses
Select, two-way sensitivity analyses are presented in Fig. 4 andTables II and III. Additional two-way sensitivity analyses are pre-sented in the Technical Appendix. The timing of DMOAD admin-istration (anywhere in the sequence prior to TKR) did not havea meaningful impact on the cost-effectiveness of DMOAD therapy(results not shown).
Yes
Update comorbidities and obesity. If DMOADs failed to suspend progression, assess whether K-L grade will increase.
Move on to the next model cycle.
Accumulate DMOAD costs
Suspends
progression
Pain
relief
No
Yes
For subjects who have been determined to live and who have not yet recieved or are on DMOADs
No
Failure
detected
Yes
NoQoL† increaseCost decrease
Toxicity
No
Subject will be removed from DMOADs in the
following cycle
MajorNo
Yes
Subject will be removed from
DMOADs in the following cycle.
QoL decrease, Cost increase
Death
Yes
YesNo
End Subject Life Cycle
QoL decreaseCost increase
†QoL – quality of life
QoL decreaseCost increase
Fig. 2. This figure depicts the pathway of a hypothetical subject in the OAPol Model receiving DMOADs. When DMOADs are discontinued, subjects will be evaluated for thetreatment immediately following DMOADs.
E. Losina et al. / Osteoarthritis and Cartilage 21 (2013) 655e667 661
Table II presents resultsof two-waysensitivityanalyses that variedthe degree of suspended progression and pain relief within clinicallyplausible ranges (50e70% for suspended progression and 30e50% forpain relief). When DMOADs were priced at $1,000/year with majortoxicity risks at 0.5%/year, DMOADs were likely to have cost-effectiveness ratios below $100,000 compared to the SoC (noDMOADs). The proportion of the cohort receiving TKR depended onthe likelihood that DMOADs suspended progression; base caseDMOADs as the second-line regimen (50% suspended progression,30% concomitant pain relief) resulted in 44.35% lifetime risk for TKR.
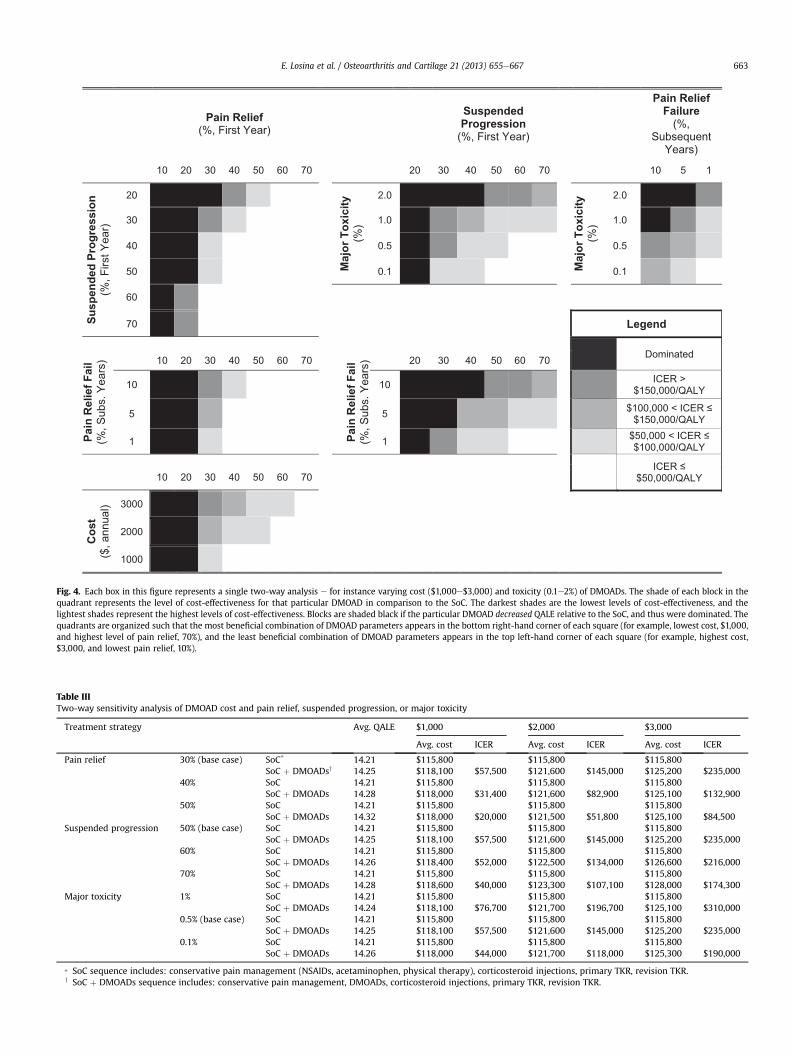
Increasing suspended progression to 70% decreased lifetime risk ofTKR to 41.31%. Fig. 4 (upper left box) portrays cost-effectiveness ratiosof DMOADs-based strategies for expanded ranges of suspendedprogression and pain relief. Results of these two-way sensitivity an-alyses suggest that pain relief 10% or lower led to a lower QALE inpatients receiving DMOADs compared to those who did not havea DMOADs-based regimen as a part of their treatment strategy. Painrelief levelsof20%or lower resulted ineither lowerQALE (in scenarioswhere suspended OA progression was <60%) or ICERs greater than$150,000 if suspended progression rates ranged from 60 to 70%.
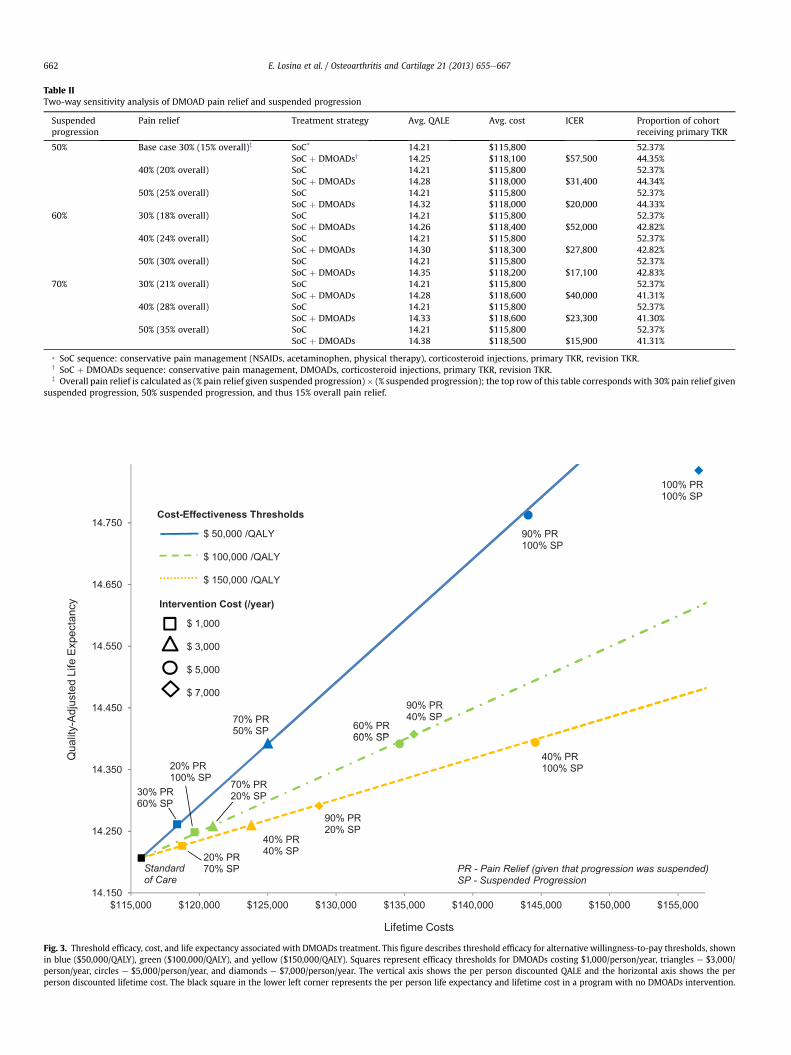
Table IITwo-way sensitivity analysis of DMOAD pain relief and suspended progression
Suspendedprogression
Pain relief Treatment strategy Avg. QALE Avg. cost ICER Proportion of cohortreceiving primary TKR
50% Base case 30% (15% overall)z SoC* 14.21 $115,800 52.37%SoC þ DMOADsy 14.25 $118,100 $57,500 44.35%
40% (20% overall) SoC 14.21 $115,800 52.37%SoC þ DMOADs 14.28 $118,000 $31,400 44.34%
50% (25% overall) SoC 14.21 $115,800 52.37%SoC þ DMOADs 14.32 $118,000 $20,000 44.33%
60% 30% (18% overall) SoC 14.21 $115,800 52.37%SoC þ DMOADs 14.26 $118,400 $52,000 42.82%
40% (24% overall) SoC 14.21 $115,800 52.37%SoC þ DMOADs 14.30 $118,300 $27,800 42.82%
50% (30% overall) SoC 14.21 $115,800 52.37%SoC þ DMOADs 14.35 $118,200 $17,100 42.83%
70% 30% (21% overall) SoC 14.21 $115,800 52.37%SoC þ DMOADs 14.28 $118,600 $40,000 41.31%
40% (28% overall) SoC 14.21 $115,800 52.37%SoC þ DMOADs 14.33 $118,600 $23,300 41.30%
50% (35% overall) SoC 14.21 $115,800 52.37%SoC þ DMOADs 14.38 $118,500 $15,900 41.31%
* SoC sequence: conservative pain management (NSAIDs, acetaminophen, physical therapy), corticosteroid injections, primary TKR, revision TKR.y SoC þ DMOADs sequence: conservative pain management, DMOADs, corticosteroid injections, primary TKR, revision TKR.z Overall pain relief is calculated as (% pain relief given suspended progression)� (% suspended progression); the top row of this table corresponds with 30% pain relief given
suspended progression, 50% suspended progression, and thus 15% overall pain relief.
Fig. 3. Threshold efficacy, cost, and life expectancy associated with DMOADs treatment. This figure describes threshold efficacy for alternative willingness-to-pay thresholds, shownin blue ($50,000/QALY), green ($100,000/QALY), and yellow ($150,000/QALY). Squares represent efficacy thresholds for DMOADs costing $1,000/person/year, triangles e $3,000/person/year, circles e $5,000/person/year, and diamonds e $7,000/person/year. The vertical axis shows the per person discounted QALE and the horizontal axis shows the perperson discounted lifetime cost. The black square in the lower left corner represents the per person life expectancy and lifetime cost in a program with no DMOADs intervention.
E. Losina et al. / Osteoarthritis and Cartilage 21 (2013) 655e667662
Pain Relief
(%, First Year)
Suspended
Progression
(%, First Year)
Pain Relief
Failure
(%, Subsequent
Years)
10 20 30 40 50 60 70 20 30 40 50 60 70 10 5 1
Su
sp
en
ded
P
ro
gressio
n
(%, F
irst Y
ear)
20
Majo
r T
oxicit
y
(%)
2.0
Majo
r T
oxicit
y
(%)
2.0
30 1.0 1.0
40 0.5 0.5
50 0.1 0.1
60
70 Legend
Dominated
Pain
R
elief F
ail
(%, S
ubs.
Yea
rs) 10 20 30 40 50 60 70
Pain
R
elief F
ail
(%, S
ubs.
Yea
rs) 20 30 40 50 60 70
10 10 ICER > $150,000/QALY
5 5 $100,000 < ICER ≤$150,000/QALY
1 1 $50,000 < ICER ≤$100,000/QALY
ICER ≤$50,000/QALY 10 20 30 40 50 60 70
Co
st
($, a
nnua
l) 3000
2000
1000
Fig. 4. Each box in this figure represents a single two-way analysis e for instance varying cost ($1,000e$3,000) and toxicity (0.1e2%) of DMOADs. The shade of each block in thequadrant represents the level of cost-effectiveness for that particular DMOAD in comparison to the SoC. The darkest shades are the lowest levels of cost-effectiveness, and thelightest shades represent the highest levels of cost-effectiveness. Blocks are shaded black if the particular DMOAD decreased QALE relative to the SoC, and thus were dominated. Thequadrants are organized such that the most beneficial combination of DMOAD parameters appears in the bottom right-hand corner of each square (for example, lowest cost, $1,000,and highest level of pain relief, 70%), and the least beneficial combination of DMOAD parameters appears in the top left-hand corner of each square (for example, highest cost,$3,000, and lowest pain relief, 10%).
Table IIITwo-way sensitivity analysis of DMOAD cost and pain relief, suspended progression, or major toxicity
Treatment strategy Avg. QALE $1,000 $2,000 $3,000
Avg. cost ICER Avg. cost ICER Avg. cost ICER
Pain relief 30% (base case) SoC* 14.21 $115,800 $115,800 $115,800SoC þ DMOADsy 14.25 $118,100 $57,500 $121,600 $145,000 $125,200 $235,000
40% SoC 14.21 $115,800 $115,800 $115,800SoC þ DMOADs 14.28 $118,000 $31,400 $121,600 $82,900 $125,100 $132,900
50% SoC 14.21 $115,800 $115,800 $115,800SoC þ DMOADs 14.32 $118,000 $20,000 $121,500 $51,800 $125,100 $84,500
Suspended progression 50% (base case) SoC 14.21 $115,800 $115,800 $115,800SoC þ DMOADs 14.25 $118,100 $57,500 $121,600 $145,000 $125,200 $235,000
60% SoC 14.21 $115,800 $115,800 $115,800SoC þ DMOADs 14.26 $118,400 $52,000 $122,500 $134,000 $126,600 $216,000
70% SoC 14.21 $115,800 $115,800 $115,800SoC þ DMOADs 14.28 $118,600 $40,000 $123,300 $107,100 $128,000 $174,300
Major toxicity 1% SoC 14.21 $115,800 $115,800 $115,800SoC þ DMOADs 14.24 $118,100 $76,700 $121,700 $196,700 $125,100 $310,000
0.5% (base case) SoC 14.21 $115,800 $115,800 $115,800SoC þ DMOADs 14.25 $118,100 $57,500 $121,600 $145,000 $125,200 $235,000
0.1% SoC 14.21 $115,800 $115,800 $115,800SoC þ DMOADs 14.26 $118,000 $44,000 $121,700 $118,000 $125,300 $190,000
* SoC sequence includes: conservative pain management (NSAIDs, acetaminophen, physical therapy), corticosteroid injections, primary TKR, revision TKR.y SoC þ DMOADs sequence includes: conservative pain management, DMOADs, corticosteroid injections, primary TKR, revision TKR.
E. Losina et al. / Osteoarthritis and Cartilage 21 (2013) 655e667 663
E. Losina et al. / Osteoarthritis and Cartilage 21 (2013) 655e667664
Fig. 4 also suggests that the cost-effectiveness of DMOADs wasvery sensitive to the degree of initial pain relief, as well as loss ofpain relief benefits in subsequent years, if initial pain relief wasbetween 30% and 50%. Major toxicity rates played an importantrole, especially if levels of suspended progression were modest(20e50%).
Table III presents results of two-way sensitivity analysesexamining the impact of DMOAD cost, efficacy, and toxicity.Improved pain relief (50%) achieved concurrently with suspendedprogression of 50% led to very favorable cost-effectiveness ratios(<$50,000/QALY); however, ICERs increased over $50,000/QALYwhen DMOADs were priced at $2,000 or $3,000 annually. Priced at$1,000/year, DMOADs had favorable ICERs across a wide range ofplausible values for pain relief, toxicity, and likelihood of suspendedprogression.
ICERs for DMOADs did not vary substantially when we variedthe order of the regimens.When corticosteroid injections (Regimen2) were received before Regimen 1 in the treatment sequence,DMOADs still carried an ICER of $75,000/QALY. If corticosteroidinjections were removed from the treatment sequence altogether,DMOADs carried an ICER of $31,000/QALY.
Altering KeL grade distribution at the time of knee OA diagnosisdid not lead to qualitative changes in ICERs. The DMOAD ICERs forcohorts who were 100% KeL grade 1 at the time of diagnosis were$38,000/QALY. The ICER for the 50% KeL grade 1 and 50% KL grade 2cohort was $43,000/QALY.
Results of the sensitivity analyses modeling doxycycline asa potential DMOAD showed that doxycycline was a dominatedstrategy as it did not lead to meaningful improvements in qualityof life.
Discussion
Using the OAPol Model, a validated computer simulation of theepidemiology and management of knee OA, we have demonstratedthat cost, efficacy, and pain relief are the key drivers of value inDMOADs. We have shown how these drivers trade off with oneanother. In addition, we have described the many plausible com-binations of these drivers which could reduce the need for TKR andsatisfy commonly cited cost-effectiveness criteria. There is nogeneral agreement about what defines “cost-effective.” In theUnited States, maximum willingness-to-pay thresholds rangingfrom $50,000/QALY to $150,000/QALY and beyond are widelycited62e64.
The cost-effectiveness of DMOADs was highly sensitive to vari-ations in those parameters with direct effects on quality of life,particularly pain relief. Variations in the level of pain relief revealeda distinct threshold of 20%, below which DMOADs would not offerclinical benefits relative to standard care. DMOADswith no intrinsicpain-relieving capacity could only improve quality of life if slowingdown progression ultimately reduced pain. Our results validate theimportance of targeting pathways which will both reduce pro-gression and offer pain relief.
Since improvements in quality of life are anchored in pain relief,the cost-effectiveness of DMOADs ultimately depends on the levelof overall symptom relief achieved by suspended structural pro-gression. Greater rates of suspended OA progression were asso-ciated with a lower proportion of the cohort receiving TKR;however, the reduced TKR rates did not translate to greater cost-effectiveness unless DMOADs also offered pain relief becausewhile TKR is costly, it consistently provides pain relief. Thus, inorder to justify prolonged DMOAD use before TKR, even in cases ofsuspended progression, DMOADs must offer pain relief.
Several important limitations of our analyses should be noted.We used the KeL grade as a measure of OA progression65,66. While
a magnetic resonance imaging -based (MRI) definition of OA and itsprogression is receiving growing attention, the validation of MRI-based markers is ongoing67. In order to address this limitationand maintain conservative estimates of pain relief, we did notmodel pain relief as automatically occurring in cases of suspendedprogression; rather, in the base case, only 30% of subjects experi-encing suspended progression also experienced pain relief. More-over, in the model, the efficacy of DMOADs was expressed in termsof slowing or ‘suspending’ progression based on KeL grade. How-ever, KeL grade is a relatively unresponsive marker of radiographicchange and its use may lead to increased time until DMOAD failuredetection68. Since conventional radiographs are a current SoC, ouranalysis is consistent with clinical practice.
We assumed that failure of DMOADs is detected in the year itoccurs. While this assumption biases the results in favor ofDMOADs, it seems reasonable since monitoring for failure is trig-gered by continuous or newly occurring pain.
We chose not to model indirect costs because, at present, thereare no data available on the impact of DMOADs on disability orabsenteeism. As more data become available, this will be a rich areafor future research.
NHIS instruments did not allow for separation between OAoccurring at the knee and OA occurring at other sites. The NHIS alsodid not distinguish OA from gout, RA, lupus, or fibromyalgia. Theseambiguities may distort the distributions of sex, BMI and raceassigned to persons with knee OA.
This analysis did not consider high-tibial osteotomy (a treat-ment option for subjects with uni-compartmental disease) as partof the standard treatment sequence because these procedures areperformed infrequently in the US49. To ensure that results aregeneralizable to the overall population with knee OA, we chose tosimulate the most common OA treatments.
The cost-effectiveness thresholds will vary from country tocountry. The results presented in this paper are based on cost andquality of life data measured in the US. This paper offers method-ology that could be used to assess cost-effectiveness of DMOADs inother countries, using country-specific data on OA natural history,progression, treatment costs, and potentially alternative thresholdsfor economic value.
Although we only modeled the use of one DMOAD as part of theOA treatment sequence, it is likely that multiple DMOADs will ul-timately become available to patients. It is also possible thatDMOADs are more likely to offer pain relief for subjects at earlierstages of OA. However, we did not model varying levels of painrelief based on current KeL grade. In this case, it would be critical tooffer DMOADs early in the treatment sequence, thus catching pa-tients before they progress to more severe OA.
The results of our analyses showed that in the absence ofDMOADs, the lifetime risk of TKR among those with symptomaticknee OA was approximately 50%. These results suggest higher TKRrates than estimated in data derived from large cohort studies suchas the Osteoarthritis Initiative (OAI)69. There are several reasons forthe difference between our model-based estimates and OAI data:(1) persons intending to undergo TKR within 18 months wereexcluded from OAI, and (2) OAI-based estimates, which indicatea 1%/year conversion to TKR, include data from both incident andprevalent cohorts, with a substantial number of persons at KeLgrade 1. In contrast, our model-based estimates used incidence ofTKR data derived from the Multicenter Osteoarthritis Study(MOST), which assumes that only subjects with KeL grade 3 orgreater were eligible for TKR. Among subjects in the OAI with KeLgrade 3 or 4 OA, the conversion to TKR was estimated at about 10%/year69,70. Furthermore, this rate of conversion to TKR among thoseat KeL grade 3 or 4was consistent with nationwide estimates of thenumber of TKRs performed in the US71.

E. Losina et al. / Osteoarthritis and Cartilage 21 (2013) 655e667 665
To the best of our knowledge, the results of the analyses docu-mented here comprise the first pre-evaluation of the effectiveness,costs, and cost-effectiveness of DMOAD therapy for knee OA. Wehave examined the sensitivity of DMOAD value to variations ina wide spectrum of characteristics, most notably efficacy, toxicity,and costs. Our findings may provide critical insights for clinical trialplanning and ensure that drug manufacturers focus the develop-ment of new regimens on parameters that will affect quality of life,in particular, pain relief. These analyses also offer a new approach inwhich simulation modeling can be efficiently used to evaluate newtreatment strategies under development before the implementa-tion of costly clinical trials.
Author contributions
Conception and design: Losina, Paltiel, KatzAnalysis and interpretation of the data: Losina, Daigle, Suter,
Hunter, Solomon, Walensky, Jordan, Burbine, Paltiel, KatzDrafting of the article: Losina, Daigle, KatzCritical revision of the article for important intellectual content:
Losina, Daigle, Suter, Hunter, Solomon, Walensky, Jordan, Burbine,Paltiel, Katz
Final approval of the article: Losina, Daigle, Suter, Hunter,Solomon, Walensky, Jordan, Burbine, Paltiel, Katz
Provision of study materials or patients: LosinaStatistical expertise: LosinaObtaining of funding: LosinaCollection and assembly of data: Losina, Daigle
Role of the funding sourceSupported by: NIH/NIAMS R01 AR053112, K24 AR057827, VAConnecticut Healthcare System (Dr. Suter), and Centers for Medi-care & Medicaid Services, an Agency of the U.S. Department ofHealth and Human Services HHSM-500-2008-0025I/HHSM-500-T0001 (Dr. Suter).
Conflict of interestThe authors do not have any conflict of interest with respect to thecontext of this paper.
Supplementary data
Supplementary data related to this article can be found at http://dx.doi.org/10.1016/j.joca.2013.01.016.
References
1. Felson DT, Lawrence RC, Dieppe PA, Hirsch R, Helmick CG,Jordan JM, et al. Osteoarthritis: new insights. Part 1: the dis-ease and its risk factors. Ann Intern Med Oct 17 2000;133(8):635e46.
2. Lawrence RC, Felson DT, Helmick CG, Arnold LM, Choi H,Deyo RA, et al. Estimates of the prevalence of arthritis andother rheumatic conditions in the United States. Part II.Arthritis Rheum Jan 2008;58(1):26e35.
3. Niu J, Zhang YQ, Torner J, Nevitt M, Lewis CE, Aliabadi P, et al. Isobesity a risk factor for progressive radiographic knee osteo-arthritis? Arthritis Rheum Mar 15 2009;61(3):329e35.
4. Englund M, Lohmander LS. Risk factors for symptomatic kneeosteoarthritis fifteen to twenty-two years after meniscectomy.Arthritis Rheum Sep 2004;50(9):2811e9.
5. von Porat A, Roos EM, Roos H. High prevalence of osteo-arthritis 14 years after an anterior cruciate ligament tear inmale soccer players: a study of radiographic and patientrelevant outcomes. Ann Rheum Dis Mar 2004;63(3):269e73.
6. National Electronic Injury Surveillance System (NEISS),https://www.cpsc.gov/cgibin/NEISSQuery/home.aspx;2000e2009 [accessed 04.08.12].
7. Zhang Y, Jordan JM. Epidemiology of osteoarthritis. Clin GeriatrMed 2010;26(3):355e69.
8. Hochberg MC, Altman RD, April KT, Benkhalti M, Guyatt G,McGowan J, et al. American College of Rheumatology 2012recommendations for the use of nonpharmacologic andpharmacologic therapies in osteoarthritis of the hand, hip, andknee. Arthritis Care Res (Hoboken) 2012;64(4):465e74.
9. Zhang W, Moskowitz RW, Nuki G, Abramson S, Altman RD,Arden N, et al. OARSI recommendations for the management ofhip and knee osteoarthritis, Part II: OARSI evidence-based,expert consensus guidelines. Osteoarthritis Cartilage Feb2008;16(2):137e62.
10. Richmond J, Hunter D, Irrgang J, Jones MH, Snyder-Mackler L,Van Durme D, et al. American academy of orthopaedic sur-geons clinical practice guideline on the treatment of osteo-arthritis (OA) of the knee. J Bone Jt Surg Am April 1,2010;92(4):990e3.
11. Solomon SD, McMurray JJV, Pfeffer MA, Wittes J, Fowler R,Finn P, et al. Cardiovascular risk associated with celecoxib ina clinical trial for colorectal adenoma prevention. New Engl JMed 2005;352(11):1071e80.
12. Silverstein FE, Faich G, Goldstein JL, Simon LS, Pincus T,Whelton A, et al. Gastrointestinal toxicity with celecoxib vsnonsteroidal anti-inflammatory drugs for osteoarthritis andrheumatoid arthritis: the CLASS study: a randomized con-trolled trial. JAMA 2000;284:1247e55.
13. Abramson SB, Attur M, Yazici Y. Prospects for disease mod-ification in osteoarthritis. Nat Clin Pract Rheum 2006;2(6):304e12.
14. Reginster JY, Badurski J, Bellamy N, Bensen W, Chapurlat R,Chevalier X, et al. Efficacy and safety of strontium ranelate inthe treatment of knee osteoarthritis: results of a double-blind,randomised placebo-controlled trial. Ann Rheum Dis Nov 92012.
15. Efficacy and Safety of Oral Salmon Calcitonin in Patients withKneeOsteoarthritis. ClinicalTrials.gov identifier: NCT00486434,http://clinicaltrials.gov/ct2/show/NCT00486434;2010.
16. A Long-term, Placebo-controlled X-ray Study Investigating theSafety and Efficacy of SD-6010 in Subjects with Osteoarthritisof the Knee (ITIC). ClinicalTrials.gov identifier: NCT00565812,http://clinicaltrials.gov/ct2/show/NCT00565812;2010.
17. Hunter DJ. Pharmacologic therapy for osteoarthritisethe eraof disease modification. Nat Rev Rheumatol Jan 2010;7(1):13e22.
18. Losina E, Walensky RP, Reichmann WM, Holt HL, Gerlovin H,Solomon DH, et al. Impact of obesity and knee osteoarthritis onmorbidity and mortality in older Americans. Ann Intern MedFebruary 15, 2011;154(4):217e26.
19. Holt HL, Katz JN, Reichmann WM, Gerlovin H, Wright EA,Hunter DJ, et al. Forecasting the burden of advanced kneeosteoarthritis over a 10-year period in a cohort of 60-64 year-old US adults. Osteoarthritis Cartilage Jan 2011;19(1):44e50.
20. Siegel JE, Weinstein MC, Russell LB, Gold MR. Recommenda-tions for reporting cost-effectiveness analyses. JAMA October23, 1996;276(16):1339e41.
21. Jordan JM, Helmick CG, Renner JB, Luta G, Dragomir AD,Woodard J, et al. Prevalence of knee symptoms and radio-graphic and symptomatic knee osteoarthritis in AfricanAmericans and Caucasians: the Johnston County OsteoarthritisProject. J Rheumatol Jan 2007;34(1):172e80.
22. 2005e2006 National Health and Nutrition Examination Survey(NHANES) Data. National Center for Health Statistics (NCHS).
E. Losina et al. / Osteoarthritis and Cartilage 21 (2013) 655e667666
U.S. Department of Health and Human Services, http://www.cdc.gov/nchs/nhanes/nhanes2005-2006/nhanes05_06.htm;2006 [accessed 04.08.12].
23. 2007e2008 National Health and Nutrition Examination Survey(NHANES) Data. National Center for Health Statistics (NCHS).U.S. Department of Health and Human Services, http://www.cdc.gov/nchs/nhanes/nhanes2007-2008/nhanes07_08.htm;2008 [accessed 04.08.12].
24. National Health Interview Survey (NHIS), http://www.cdc.gov/nchs/nhis.htm;2007 [accessed 04.08.12].
25. Arias E. United States Life Tables, 2006. Hyattsville, Maryland20782e2003. In: National Vital Statistics Reports 2010;vol. 58.USA: National Center for Health Statistics; 2010.
26. Berrington de Gonzalez A, Hartge P, Cerhan JR, Flint AJ,Hannan L, MacInnis RJ, et al. Body-mass index and mortalityamong 1.46 million White adults. New Engl J Med 2010;363(23):2211e9.
27. Centers for Disease Control and Prevention, National Centerfor Health Statistics. Health Data Interactive. Chronic Condi-tions, Ages 18þ: US, http://www.cdc.gov/nchs/hdi.htm;1997e2008 [accessed 04.08.12].
28. Brazier J, Usherwood T, Harper R, Thomas K. Deriving a pref-erence-based single index from the UK SF-36 health survey.J Clin Epidemiol 1998;51(11):1115e28.
29. Brandt KD, Mazzuca SA, Katz BP, Lane KA, Buckwalter KA,Yocum DE, et al. Effects of doxycycline on progression ofosteoarthritis: results of a randomized, placebo-controlled,double-blind trial. Arthritis Rheum Jul 2005;52(7):2015e25.
30. Red Book: Pharmacy’s Fundamental Reference: 2010 Edition.Montvale, NJ: Thomson Healthcare; 2010.
31. Losina E, Weinstein AM, ReichmannWM, Burbine SA, SolomonDH, Daigle ME, et al. Lifetime risk and age of diagnosis ofsymptomatic knee osteoarthritis in the US. Arthritis Care &Res. 2012 [Epub].
32. Losina E, Walensky RP, Kessler CL, Emrani PS, Reichmann WM,Wright EA, et al. Cost-effectiveness of total knee arthroplasty inthe United States: patient risk and hospital volume. Arch InternMed Jun 22 2009;169(12):1113e21. discussion 1121e1112.
33. Pope GC, Kautter J, Ellis RP, Ash AS, Ayanian JZ, Lezzoni LI, et al.Risk adjustment of Medicare capitation payments using theCMS-HCC model. Health Care Financ Rev Summer 2004;25(4):119e41.
34. Consumer Price Index Inflation Calculator, http://www.bls.gov/data/inflation_calculator.htm;2010 [accessed 04.08.12].
35. Medicare Current Beneficiary Survey. Centers for Medicare &Medicaid Services; 2006.
36. ScottDL, BerryH, CapellH, Coppock J, DaymondT,DoyleDV, et al.The long-term effects of non-steroidal anti-inflammatory drugsin osteoarthritis of the knee: a randomized placebo-controlledtrial. Rheumatology October 1, 2000;39(10):1095e101.
37. Goldstein JL, Silverstein FE, Agrawal NM, Hubbard RC, Kaiser J,Maurath CJ, et al. Reduced risk of upper gastrointestinal ulcercomplications with celecoxib, a novel COX-2 inhibitor. Am JGastroenterol 2000;95(7):1681e90.
38. Silverstein FE, Graham DY, Senior JR, Davies HW, Struthers BJ,Bittman RM, et al. Misoprostol reduces serious gastrointestinalcomplications in patients with rheumatoid arthritis receivingnonsteroidal anti-inflammatory drugs. Ann Intern Med August15, 1995;123(4):241e9.
39. Medicare Fee Schedules. Centers for Medicare & Medicaid Ser-vices, http://www.cms.gov/home/medicare.asp;2010 [accessed04.08.12].
40. Medicare Hospital Outpatient Prospective Payment System.Centers for Medicare & Medicaid Services, http://www.cms.gov/HospitalOutpatientPPS/;2010 [accessed 04.08.12].
41. Medicare Hospital Inpatient Prospective Payment System.Centers for Medicare & Medicaid Services, http://www.cms.gov/MedicareFeeforSvcPartsAB/03_MEDPAR.asp;2010[accessed 04.08.12].
42. Van der Esch M, Heijmans M, Dekker J. Factors contributing topossession and use of walking aids among persons withrheumatoid arthritis and osteoarthritis. Arthritis Care Res2003;49(6):838e42.
43. Grindrod KA, Marra CA, Colley L, Cibere J, Tsuyuki RT,Esdaile JM, et al. After patients are diagnosed with kneeosteoarthritis, what do they do? Arthritis Care Res 2010;62(4):510e5.
44. Raynauld JP, Buckland-Wright C, Ward R, Choquette D,Haraoui B, Martel-Pelletier J, et al. Safety and efficacy of long-term intraarticular steroid injections in osteoarthritis of theknee: a randomized, double-blind, placebo-controlled trial.Arthritis Rheum Feb 2003;48(2):370e7.
45. Ayral X. Injections in the treatment of osteoarthritis. Best PractRes Clin Rheumatol 2001;15(4):609e26.
46. Katz JN, Mahomed NN, Baron JA, Barrett JA, Fossel AH,Creel AH, et al. Association of hospital and surgeon proce-dure volume with patient-centered outcomes of total kneereplacement in a population-based cohort of patientsage 65 years and older. Arthritis Rheum Feb 2007;56(2):568e74.
47. Paxton EW, Namba RS, Maletis GB, Khatod M, Yue EJ, Davies M,et al. A prospective study of 80,000 total joint and 5000anterior cruciate ligament reconstruction procedures ina community-based registry in the United States. J Bone Jt SurgAm Dec 2010;92(Suppl 2):117e32.
48. Katz JN, Barrett J, Mahomed NN, Baron JA, Wright RJ, Losina E.Association between hospital and surgeon procedure volumeand the outcomes of total knee replacement. J Bone Jt Surg AmSep 2004;86-A(9):1909e16.
49. Healthcare Cost and Utilization Project (HCUP). NationwideInpatient Sample (NIS), http://hcupnet.ahrq.gov/;2009 [accessed04.08.12].
50. Buntin MB, Garten AD, Paddock S, Saliba D, Totten M,Escarce JJ. How much is postacute care use affected by itsavailability? Health Serv Res Apr 2005;40(2):413e34.
51. Teeny SM, York SC, Mesko JW, Rea RE. Long-term follow-upcare recommendations after total hip and knee arthro-plasty: results of the American Association of Hip andKnee Surgeons’ member survey. J Arthroplasty 2003;18(8):954e62.
52. Bensen WG, Fiechtner JJ, McMillen JI, Zhao WW, Yu SS,Woods EM, et al. Treatment of osteoarthritis with celecoxib,a cyclooxygenase-2 inhibitor: a randomized controlled trial.Mayo Clinic Proc November 1, 1999;74(11):1095e105.
53. Healthcare Cost and Utilization Project (HCUP). NationwideInpatient Sample (NIS). Agency for Healthcare Researchand Quality, http://hcupnet.ahrq.gov/;2008 [accessed04.08.12].
54. Sullivan PW, Ghushchyan V. Preference-based EQ-5D indexscores for chronic conditions in the United States. Med DecisMaking Jul-Aug 2006;26(4):410e20.
55. Jansen JP, Pellissier J, Choy EH, Ostor A, Nash JT, Bacon P, et al.Economic evaluation of etoricoxib versus non-selectiveNSAIDs in the treatment of ankylosing spondylitis in the UK.Curr Med Res Opin Dec 2007;23(12):3069e78.
56. Kamath CC, Kremers HM, Vanness DJ, O’Fallon WM,Cabanela RL, Gabriel SE. The cost-effectiveness of acet-aminophen, NSAIDs, and selective COX-2 inhibitors in thetreatment of symptomatic knee osteoarthritis. Value Health2003;6(2):144e57.
E. Losina et al. / Osteoarthritis and Cartilage 21 (2013) 655e667 667
57. Tan-Torres Edejer T. Making Choices in Health: WHO Guide toCost-effectiveness Analysis. Geneva: World Health Organiza-tion; 2003.
58. Physician Fee Schedule Search. Center for Medicare andMedicaid Services (CMS), http://www.cms.gov/pfslookup/02_PFSearch.asp;2010 [accessed 04.08.12].
59. Reichmann WM, Katz JN, Kessler CL, Jordan JM, Losina E. De-terminants of self-reported health status in a population-based sample of persons with radiographic knee osteo-arthritis. Arthritis Rheum Aug 15 2009;61(8):1046e53.
60. Diehr P, Patrick DL, Spertus J, Kiefe CI, McDonell M, Fihn SD.Transforming self-rated health and the SF-36 scales to includedeath and improve interpretability. Med Care Jul 2001;39(7):670e80.
61. Torrance GW, Feeny DH, Furlong WJ, Barr RD, Zhang Y,Wang Q. Multiattribute utility function for a comprehensivehealth status classification system. Health Utilities Index Mark2. Med Care Jul 1996;34(7):702e22.
62. Braithwaite RS, Meltzer DO, King Jr JT, Leslie D, Roberts MS.What does the value of modern medicine say about the$50,000 per quality-adjusted life-year decision rule? Med CareApr 2008;46(4):349e56.
63. Ubel PA, Hirth RA, Chernew ME, Fendrick AM. What is theprice of life and why doesn’t it increase at the rate of inflation?Arch Intern Med Jul 28 2003;163(14):1637e41.
64. Hidden Costs, Value Lost: Uninsurance in America. Institute ofMedicine of the National Academies; 2003.
65. Neogi T, Felson D, Niu J, Nevitt M, Lewis CE, Aliabadi P, et al.Association between radiographic features of knee osteo-arthritis and pain: results from two cohort studies. BMJ2009;339:b2844.
66. Felson DT, Chaisson CE, Hill CL, Totterman SM, Gale ME,Skinner KM, et al. The association of bone marrow lesions withpain in knee osteoarthritis. Ann Intern Med Apr 3 2001;134(7):541e9.
67. Hunter DJ, Lo GH, Gale D, Grainger AJ, Guermazi A,Conaghan PG. The reliability of a new scoring system for kneeosteoarthritis MRI and the validity of bone marrow lesionassessment: BLOKS (BostoneLeeds Osteoarthritis Knee Score).Ann Rheum Dis February 1, 2008;67(2):206e11.
68. Reichmann WM, Maillefert JF, Hunter DJ, Katz JN,Conaghan PG, Losina E. Responsiveness to change and reli-ability of measurement of radiographic joint space width inosteoarthritis of the knee: a systematic review. OsteoarthritisCartilage. May 2011;19(5):550e6.
69. Osteoarthritis Initiative (OAI), http://oai.epi-ucsf.org/datarelease/default.asp;2010 [accessed 04.08.12].
70. Wise BL, Felson DT, Clancy M, Niu J, Neogi T, Lane NE, et al.Consistency of knee pain and risk of knee replacement: themulticenter osteoarthritis study. J Rheumatol April 15,2011;38(7):1390e5.
71. Healthcare Cost and Utilization Project (HCUP). NationwideInpatient Sample (NIS), http://hcupnet.ahrq.gov/;1999e2009[accessed 04.08.12].