disparity of access_quality_review_of_maternal_mortality_in_5_regions_in_indonesia
TRANSCRIPT

DISPARITY&OF ACCESS QUALITY
2012
REVIEW OF MATERNAL MORTALITYIN FIVE REGION IN INDONESIA
KEMENTRIAN KESEHATAN REPUBLIK INDONESIAUNITED NATIONS POPULATION FUND (UNFPA)

Disclaimer:This Report was made possible through UNFPA support to LitbangkesThe view and opinions expressed in this article are those of authors and do not necessarily reflect the official policy or position of UNFPA.

REVIEW OF MATERNAL MORTALITYIN FIVE REGION IN INDONESIA
DISPARITY&OF ACCESS QUALITY
NATIONAL INSTITUTE OF HEALTH RESEARCH AND DEVELOPMENT
MINISTRY OF HEALTH REPUBLIC OF INDONESIAUNITED NATIONS POPULATION FUND (UNFPA)
2012

ii DISPARITY OF ACCESS AND QUALITY
TEAM
Chief: dr. Teti Tejayanti, MKM
Members:
Dr. dr. Harimat, M.KesKristina Sabatini, SKM, M.EpidTin Afi fah, SKM, M.KesDr. Dwi Hapsari, M.Kesdr. Imran Pambudi, MPHMdr. Yuslely Usman, M.Kesdr. Ika SaptariniAnnisa Rizkianti, SKMDony Lasut, S.Sidr. Wahyu Dwi Astuti, SpPK, M.Kes
Advisor:
Dr. dr. Trihono, M.ScD. Anwar Musadad, SKM, M.Kes
Contributors :
Soeharsono Soemantri, M.Sc, Ph.DProf. dr. Budi Utomo, MPH, Ph.DProf. Terence H. Hull, B.A, M.A, Ph.DProf. Dr. dr. Sudarto Ronoatmodjo, SKM, M.ScAtmarita, MPH, Dr. PHDr. dr. Sabarinah Prasetyo, M.Scdr. Asri C. Adisasmita, MPH, M.Phil, Ph.DIr. Thoman Pardosi, S.E, M.SiDendi Handiyatmo, S.St, M.Si
MINISTRY OF HEALTH REPUBLIC OF INDONESIA
Jl. Percetakan Negara No. 29 Jakarta Kotak Pos 1226
Telp. : (021) 4261088 Fax : (021) 428 72392, 424 1921, 424 3933
Email : [email protected]; [email protected]
Website : http://www.litbang.depkes.go.id; http://www.pusat3.litbang.depkes.go.id
UNITED NATIONS POPULATION FUND (UNFPA)
7th Floor Menara Thamrin Jl. M. H. Thamrin Kav. 3 Jakarta 10250 Indonesia
Telp. : (021) 314 1308, 390 4914 Fax : (021) 390 4914, 319 2702
Website : http://indonesia.unfpa.org

iiiDISPARITY OF ACCESS AND QUALITY
Assalamu’alaikum wr. wb
Praise to the Lord Almighty for His blessings, so this report on “Review of Maternal Mortality in 5 Region in
Indonesia” is well prepared. This review is the fi rst time that nearly 4000 cases of maternal mortality have been
analyzed– that number is around 50 percentof all maternal deaths recorded the 2010 Population Census. With
such a large number of cases being reviewed, it is possible to do inter-regional analysis, comparing results
from Sumatera, Java-Bali, Kalimantan, Sulawesi, and Eastern Indonesia.
This publication examines characteristics and causes of maternal deaths, as well as information on quality of
care and conditions in health facilities, which can be related to the maternal mortality ratio.
I would like to extend my appreciation to the research team, especially Dr. TetiTejayanti, MKM and Ms. Kristina
Sabatini, SKM, M.Epid, who have worked so hard in analyzing and accommodating enormous inputs from
many experts, enabling this report to be presented so well. I would like also to thank UNFPA for its support in
developing and publishing this report. To all contributors, thank you for the invaluable inputs to developing
the review.
This report will be a great reference for improvement in the general health programme and the maternal
health programme in particular. This macro review is expected to be followed up with further research in every
region. The results and recommendations are expected to be implemented to improve the maternal health
programme to accelerate eff orts to achieve MDGs, particularly maternal mortality reduction.
Billahit taufi q walhidayah, wassalamu’alaikum wr. wb.
Head Of Balitbangkes
Dr. dr. Trihono, M.Sc
PREFACE

iv DISPARITY OF ACCESS AND QUALITY
PREFACE ................................................................................................................................................................. iii
TABLE OF CONTENTS ................................................................................................................................................................... iv
LIST OF TABLES ................................................................................................................................................................................ v
LIST OF CHARTS .............................................................................................................................................................................. vi
EXECUTIVE SUMMARY................................................................................................................................................................ vii
BACKGROUND .................................................................................................................................................................................. 1
OBJECTIVES
1. General Objective ........................................................................................................................................................................ 2
2..Specifi c Objectives ..................................................................................................................................................................... 2
FRAMEWORK ..................................................................................................................................................................................... 3
METHODOLOGY
1. Type of research ............................................................................................................................................................................ 4
2. Data ...................................................................................................................................................................................................... 4
3. Data analysis.................................................................................................................................................................................... 4
4. Operational defi nitions ............................................................................................................................................................. 5
RESULT AND DISCUSSIONS
1. Characteristic of maternal death ........................................................................................................................................ 6
2. Number of maternal death .................................................................................................................................................... 6
3. Causes of maternal death ....................................................................................................................................................... 8
a. Maternal death causes by group/ tabulation ........................................................................................................ 8
b. Causes of death without grouping ............................................................................................................................. 13
4. Characteristic of maternal mortality by cause of death ........................................................................................ 14
5. Quality of Care ............................................................................................................................................................................... 16
a. Overall cause of maternal death .................................................................................................................................... 16
b. Pregnancy induced Hypertension ................................................................................................................................ 18
c. Post-partumHemorraghe ................................................................................................................................................... 21
6. Health Facilities .............................................................................................................................................................................. 21
CONCLUSION .................................................................................................................................................................................... 29
RECOMMENDATIONS .................................................................................................................................................................. 31
REFERENCES ....................................................................................................................................................................................... 32
TABLE OF CONTENTS

vDISPARITY OF ACCESS AND QUALITY
Table 1. Number of maternal death based on Population Census 2010 (SP 2010) .................................. 8
Table 2. Proportion causes of maternal death ................................................................................................................ 9
Table 3. Diagnostic code and proportion causes of maternal death ibu among 5 regions based
on ICD 10 WHO (Data SP2010) .............................................................................................................................. 10
Table 4. Diagnosis including in pregnancy induced hypertension (HDK) ..................................................... 11
Table 5. Causes of maternal death in group complication predominantly related
puerperium and other conditions ..................................................................................................................... 11
Table 7. Diagnosis rank for causes of maternal death in 5 region in Indonesia ........................................ 13
Table 6. Ratio causes of maternal death in 5 regions based on ICD 10 WHO (Data SP2010) ............. 13
Table 7. General causes of maternal death ...................................................................................................................... 13
Table 8. Review Case Fatality Rate (CFR) result in RSUP Cipto Mangunkusumo in 2011 .................... 14
Table 9. Maternal death period .............................................................................................................................................. 14
Table 10. The Highest cause of maternal death in Indonesia ................................................................................. 15
Table 11. Characteristic of maternal death based on causes of death (Data SP2010) ............................. 16
Table 12. Maternal Mortality Ratio (Data SP2010) with proportion of quality of maternal health
care in 5 regions in Indonesia (Data Riskesdas 2010 – basic health survey) ............................. 19
Table 13. Maternal Mortality Ratio (Data SP2010) with proportion of HDK in 5 regions in
Indonesia (Data Riskesdas 2010 – basic health survey) .......................................................................... 21
Table 14. Proportion of unavailability of stethoscope in 5 regions in Indonesia .......................................... 22
Table 15. Maternal Mortality Ratio (Data SP2010) with proportion of quality of maternal health
care and PPP in 5 regions in Indonesia (Data Riskesdas 2010) .......................................................... 24
Table 16. Maternal Mortality Ratio (Data SP2010) with puskesmas PONED services based on
5 regions in Indonesia (Data Rifaskes 2010 – health facilities survey) .......................................... 26
Table 17. Percentage puskesmas PONED provide essential drugs and equipment for
pre-eclampsia/eclampsiai ........................................................................................................................................ 28
Table 18. Percentage puskesmas PONED provide essential drugs and equipment for
post-partum hemorrhage (Data Rifaskes 2011) ......................................................................................... 28
Table 19. Proportion of public hospital (RSU Pemerintah) based on criteria PONEK in
5 regions in Indonesia (Data Rifaskes 2011) .................................................................................................. 29
Table 20. Proportion of public hospital (RSU Pemerintah) based on availability of
specialists services (anesthetist, surgeon, obgyn, and pediatrician) in 5 regions
in Indonesia (Data Rifaskes 2011) ........................................................................................................................ 30
Table 21. Proportion of public hospital (RSU Pemerintah) based on availability of supporting
equipment in maternal and child health facilities in
5 region in Indonesia (Data Rifaskes 2011) .................................................................................................... 30
LIST OF TABLES

vi DISPARITY OF ACCESS AND QUALITY
Chart 1. Characteristic of maternal death(Data SP2010) ......................................................................................... 6
Chart 2. Proportion place of date based on areas(urban/ rural) (Data SP2010) ........................................ 16
Chart 3. Coverage health services performance (Data Riskesdas 2010) ....................................................... 18
Chart 4. Map of HDK distribution per District/ City in Indonesia ...................................................................... 20
Chart 5. Map of PPP distribution per District/ City in Indonesia ....................................................................... 20
Chart 6. Proportion city and district that have PONED in 5 regions in Indonesia .................................... 22
Chart 7. Proportion number of hospital based on emergency response (Data Rifaskes 2011) ....... 28
LIST OF CHARTS
viiDISPARITY OF ACCESS AND QUALITY
EXECUTIVE SUMMARY
The Maternal Mortality Ratio (MMR) in Indonesia is higher than those of neighboring countries in ASEAN. It is
estimated that 20,000 women die from complications of pregnancy or childbirth per fi ve million births each
year. According to a UNDP report, the risk of maternal death in Indonesia is 1 in 65 mothers, compared to 1 in
1,100 mothers in Thailand. To reduce maternal death, it is necessary to examine the causes of maternal death.
Much information on the causes of death has been obtained, but this has not been adequately analyzed by
region, despite the disparities among regions. Such information is very important because diff erent health
statuses require diff erent interventions. Therefore, the National Institute of Health Research and Development
(Balitbangkes), under the Ministry of Health, in collaboration with BPS-Statistics Indonesia and University of
Indonesia conducted the SP2010 Follow-up Study and Review Maternal Mortality Determinant in fi ve regions
in order to obtain information on the causes of maternal deaths.
The results show a correlation between high maternal mortality ratio and the highest medical causes of maternal
mortality with low quality of health services at Basic Emergency Obstetric and Neonatal Care (BEONC/ PONED)
and Comprehensive Emergency Obstetric and Neonatal Care (CEONC/ PONEK) facilities. The review found that
the most common causes of maternal deaths are hypertension in pregnancy and post-partumhemorrhage.
The highest maternal mortality ratio for both causes correlated with lowest antenatal care (ANC) coverage and
quality of health services, particularly inadequate essential medicines for maternal health.
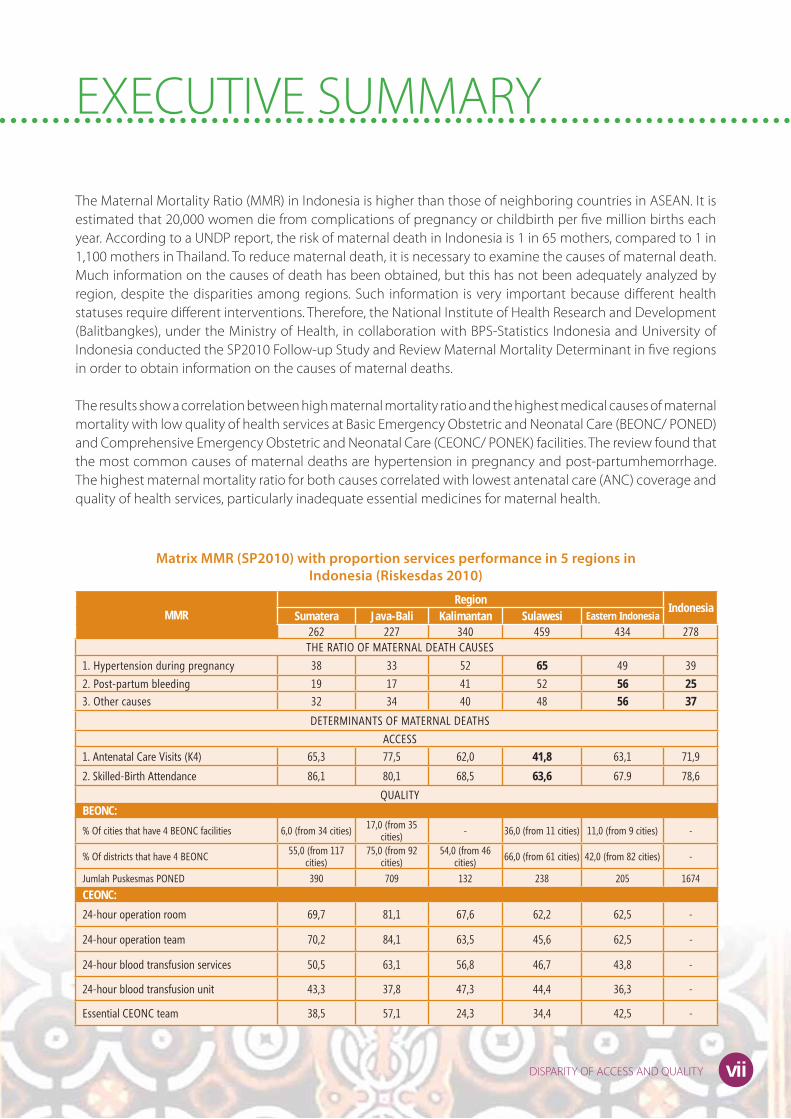
Matrix MMR (SP2010) with proportion services performance in 5 regions in
Indonesia (Riskesdas 2010)
MMR Region
IndonesiaSumatera Java-Bali Kalimantan Sulawesi Eastern Indonesia
262 227 340 459 434 278THE RATIO OF MATERNAL DEATH CAUSES
1. Hypertension during pregnancy 38 33 52 65 49 39
2. Post-partum bleeding 19 17 41 52 56 25
3. Other causes 32 34 40 48 56 37
DETERMINANTS OF MATERNAL DEATHS
ACCESS
1. Antenatal Care Visits (K4) 65,3 77,5 62,0 41,8 63,1 71,9
2. Skilled-Birth Attendance 86,1 80,1 68,5 63,6 67.9 78,6
QUALITYBEONC:
% Of cities that have 4 BEONC facilities 6,0 (from 34 cities) 17,0 (from 35 cities) - 36,0 (from 11 cities) 11,0 (from 9 cities) -
% Of districts that have 4 BEONC 55,0 (from 117 cities)
75,0 (from 92 cities)
54,0 (from 46 cities) 66,0 (from 61 cities) 42,0 (from 82 cities) -
Jumlah Puskesmas PONED 390 709 132 238 205 1674
CEONC:
24-hour operation room 69,7 81,1 67,6 62,2 62,5 -
24-hour operation team 70,2 84,1 63,5 45,6 62,5 -
24-hour blood transfusion services 50,5 63,1 56,8 46,7 43,8 -
24-hour blood transfusion unit 43,3 37,8 47,3 44,4 36,3 -
Essential CEONC team 38,5 57,1 24,3 34,4 42,5 -


1DISPARITY OF ACCESS AND QUALITY
As the fourth most populated country in the world, Indonesia faces both opportunities and threats from its
demographic conditions. More than 80 percent of Indonesians, or about 123 million people, are of working
age (15-64 years), and at least 50 percent of this group are women.
One indicator that refl ects the health status of women is the Maternal Mortality Ratio (MMR),1 which is the
ratio of maternal deaths per 100,000 live births.
When compared to other ASEAN countries, the MMR in Indonesia is relatively high. Here is a glimpse of the
success in MMR reduction in other countries:
According to a World Bank report (2009), Sri Lanka managed to reduce its MMR from 1,056 deaths per
100,000 live births in 1947 to 24 deaths per 100,000 live births by 1996.
Egypt succeeded in reducing its Maternal Mortality Ratio from 174 to 84 during the period of 1992 to 1993.
Malaysia, with an MMR of 1,085 per 100,000 live births in the period 1933-1950, decreased it to 19 by 1997. 2
Meanwhile, in Indonesia an estimated 20,000 women die from complications of pregnancy or childbirth
per fi ve million births each year. The risk of maternal death in Indonesia is 1 in 65 mothers, compared to 1
in 1,100 mothers in Thailand.3
In view of Indonesia’s maternal mortality problem, it is necessary to examine the causes of maternal deathso
that intervention eff orts can be launched to decrease the rate. The national statistics agency BPS-Statistics
Indonesia conducted a Population Census in 2010 (SP2010), which for the fi rst time collected information
on maternal mortality and maternal death, defi ned as the death of a woman aged 10 years or older during
the period of pregnancy until two months after giving birth. The resulting information on maternal mortality
was then followed up by the National Institute of Health Research and Development (Balitbangkes), under
the Ministry of Health, by conducting the SP2010 Follow-up Study (STL SP 2010). From the study, the causes
of maternal mortality in fi ve regions were examined.
Much information on the causes of death has been obtained, but this has not been adequately analyzed by
region, despite the disparities among regions. Such information is very important because diff erent health
statuses require diff erent interventions. In this study, the causes of death and disparities in health care in fi ve
regions from a variety of data sources are further examined. Data on maternal mortality and its causes were
taken from the SP2010, while supporting data on the quality of health care were taken from surviving mothers
in the 2010 Basic Health Research (Riskesdas2010) survey, which included data on antenatal care (ANC).
Data on Basic Emergency Obstetric and Neonatal Care (BEONC/ PONED) and Comprehensive Emergency
Obstetric and Neonatal Care (CEONC/PONEK) were taken from Research on Health Facilities (Rifaskes 2011). 4
BACKGROUND

2 DISPARITY OF ACCESS AND QUALITY
GENERAL OBJECTIVE
In general, this study aims to determine causes and characteristics of maternal mortality in fi ve regions in
Indonesia, based on the SP2010 Follow-up Study.
SPECIFIC OBJECTIVES
The specifi c objectives of the study are:
1. To obtain information on the causes of maternal mortality in fi ve regions based on data from the SP2010
Follow-up Study.
2. To assess the characteristics of maternal mortality by cause of death, based on data from the SP2010
Follow-up Study.
3. To assess regional diff erentials in cases of pregnancy-induced hypertension under
pregnancy, childbirth and post-partum care in fi ve regions based on the Riskesdas 2010.
4. To assess regional diff erentials in cases of post-partum hemorrhage during pregnancy, childbirth and
post-partum care in fi ve regions, based on data from the Riskesdas 2010.
5. To assess the availability of services and facilities for PONED and PONEK in five regions based on
the Rifaskes 2011.
OBJECTIVES

3DISPARITY OF ACCESS AND QUALITY
General characteristics
of maternal mortality
Characteristics by
cause of maternal death
Number of maternal deaths
Direct and indirect causes of maternal death in fi ve regions
Causes of maternal death in eight groups and
in fi ve regions
Region with the highest riskby cause of death
(uncorrected MMR by region)
Major complications in fi ve regions that lead to maternal
death; pregnancy-induced hypertension; Post-partum
hemorrhage
Data of Basic Health Research (Riskesdas) 2010
• ANC infi ve regions
• Childbirth in fi ve regions
• Postnatal carein fi ve regions
Data of Health Facility Research
(Rifaskes) 2011
• PONED in fi ve regions
• PONEK in fi ve regions
Data of 2010 Population CensusFollow-up Study
Maternal mortality in fi ve
regions in Indonesia
FRAMEWORK

4 DISPARITY OF ACCESS AND QUALITY
1. Type of research: Secondary data study
2. Data:
a) 2010 Follow-up Study to Population Census (STL SP 2010)
The research scope of the SP 2010 Study of the Causes of Death included all incidents of pregnancy-
related death from SP 2010 data. The sample provided by BPS provided an overview of all of Indonesia,
and a specifi c focus on fi ve regions. The sampling method was the Probability Proportional to Size (PPS)
technique. Distribution of regions was as follows:
a. All provinces in Sumatra;
b. All provinces in Java and Bali;
c. All provinces in Kalimantan;
d. All provinces in Sulawesi;
e. Eastern Indonesia, including the provinces of West Nusa Tenggara (NTB), East Nusa Tenggara (NTT),
Maluku, North Maluku and Papua.
Out of 8,464 cases of pregnancy-related death in the results of SP 2010 data, 4,167 cases occurred in
134 sample districts/cities in 27 provinces, 3,384 of which have been selected based on the defi nition
of maternal death.
The instrument used in data collection was a verbal autopsy questionnaire, responses to which were
then summarized and a diagnosis or cause of death determined by a physician using MMDS rules, and
coded based on the ICD 10, WHO. Identifi cation of the cause of death was based on the underlying
cause of death, not the direct cause of death. The reason for this is based on the interests of public
health, which prioritizes preventive eff orts, although curative eff orts must still be carried out in cases
of emergency as life-saving measures.
b) Riskesdas 2010
The scope of Riskesdas in this study is mothers who have been pregnant and have given birth in the
last fi ve years, selected from one particular year. Data was collected in 2010.
c) Rifaskes 2011
Rifaskes data looks at 8,981 puskesmas, or nearly all the puskesmas in Indonesia. In particular, this
study focused on PONED and PONEK data throughout Indonesia.
3. Data analysis: Descriptive, using proportions and ratios.
METHODOLOGY

5DISPARITY OF ACCESS AND QUALITY
4. Operational defi nitions
a. Maternal mortality or death
Defi nition: The death of a woman while pregnant or within 42 days of termination of pregnancy, from
any cause related to or aggravated by the pregnancy or its management but not from accidental or
incidental causes (ICD 9, WHO) .5
b. Direct cause
Defi nition: Deaths resulting from obstetric complications of the pregnant state (pregnancy, delivery
and post-partum), interventions, omissions, incorrect treatment, or a chain of events resulting from
any of the above. (ICD 9, WHO)5.
c. Indirect cause
Defi nition: Deaths resulting from previously existing diseases, or from diseases that developed during
pregnancy and did not have direct obstetric causes but were aggravated by the physiological eff ects
of pregnancy. (ICD 10, WHO).5
d. Pregnancy-related death
Defi nition: The death of a woman while pregnant or within 42 days of termination of pregnancy,
irrespective of the cause of death. (ICD 10, WHO). 5
e. Maternal Mortality Ratio (MMR)
The numerator is the number of maternal deaths in the SP 2010 results, while the denominator is the
number of live births, obtained from the SP 2010, then multiplied by 100,000. The result, which is
verifi ed and determined based on the fi nal underlying cause of death, is called the Maternal Mortality
Ratio (MMR), since it is a ratio of maternal deaths to live births.
f. Live Birth (LB) Refers to a live birth during the year as reported by girls and women aged 10-54 years
who are still alive plus proxy live births from girls and women in this age group who have died from
maternal causes (BPS, 2012).
g. Hypertension in pregnancy (HDK) : Hypertension in pregnancy (HDK), or pregnancy-induced
hypertension, is classifi ed as a disease according to code O10-O16, ICD 10, WHO, as follows:
Code O10 : Pre-existing hypertension complicating pregnancy, childbirth and the puerperium.
Code O11 : Pre-existing hypertension disorder with superimposed proteinuria.
Code O12 : Gestational (pregnancy-induced) edema and proteinuria without hypertension.
Code O13 : Gestational (pregnancy-induced) hypertension without signifi cant proteinuria.
Code O14 : Pre eclampsia
Code O15 : Eclampsia
Code O16 : Unspecifi ed maternal hypertension
h. Post-partum hemorrhage according to code O72, ICD 10, WHO.
Maternal deaths (direct and indirect)
Live birthsX k

6 DISPARITY OF ACCESS AND QUALITY
1. CHARACTERISTICS OF MATERNAL DEATH
As shown in Chart 1, the SP 2010 Follow-up Study found the highest number of maternal deaths in the
age group of 20-35 years, at 65.1 percent, with 96.3 percent of this group already married. In addition,
55 percent of mothers already had one child, and most lived in rural areas (63.6%), with educational
attainment up to secondary level (junior or senior high school), at 47.9 percent. With regards to place
of death, 41.9 percent of mothers died at public hospitals, 16.1 percent at private hospitals, 29.4 percent
at home, and 7.9 percent in other places, including mothers who died in transportation (6%) and in the
workplace (1.9%).
2. NUMBER OF MATERNAL DEATHS
An important aspect in reducing maternal death is not only to know the causes of maternal mortality, but
also todetermine whether eff orts to reduce it have succeeded and eff orts to prepare the next course of
29.4
RESULTS AND DISCUSSIONS
Data Source : Follow Up Study SP 2010
Chart 1: Characteristics of maternal death, as found in the SP2010 Follow-up Study.
65.125.7
6.9
1.61.1
0.30.10.1
55.028.4
14.747.9
45.16.6
63.636.4
0.00.10.10.20.30.50.92.3
7.916.1
41.9
96.3
528 42
14 72
11 74
46
636 43
0 03
0002
71
24
46 6
46
1 69
0
Age
Mar
ital
Sta
tus
Nu
mb
er
Of
Ch
ild
ren
Ed
uca
tio
nR
esi-
den
ceP
lace
of
Dea
th
20-35 yrs> 35 yrs< 20 yrsMarried
Living togetherNever married
DivorcedSeparatedWidowed
1-23-4> 4
Completed Secondary (SMP/SMA)No Education/some primary (SD)
Completed UniversityRural
UrbanPustu - Aid Puskesmas
Polindes/Poskesdes - Maternity HutTBA’s House
Private Practice DoctorsMCH Hospital
Private Practice MidwivesMaternity Hospital
PuskesmasOthers
Private HospitalHome
Public Hospital

7DISPARITY OF ACCESS AND QUALITY
action. For this, the Maternal Mortality Ratio (MMR) must be calculated. This study seeks to present MMR
based on source data from the National Statistics Agency (BPS), which is then sorted out specifi cally for
maternal mortality to produce an uncorrected ratio of maternal mortality by region and a corrected ratio
based on the completeness.
From the SP2010 Follow-Up Study, it was found that 50 percent of the 8,609 cases of maternal mortality,
or 4,167 deaths occurred within the 17-month period. Upon being assessed by doctors based on
the defi nition of maternal mortality, 3,384 cases of maternal mortality were confi rmed. To refl ect the
population, weighting is carried out by BPS, and the result was 7,524 maternal deaths. Meanwhile, data
on the number of live births in the last 12 months were also obtained from BPS. Table 1 below shows the
resulting Maternal Mortality Ratios:
From Table 1, the uncorrected Maternal Mortality Ratio in Indonesia was found to be 121 per 100,000 live
births. The term ‘uncorrected ratio’ was used as the fi gure had yet to be corrected. Therefore, this ratio should
not be used as a reference of maternal mortality. According to Kenneth Hill (2001), correction is necessary
because upon examination of data collection for the SP 2010, evidence was found of under-reporting. For
MMR calculation, the required correction is 0.4352 (R = 0.94) (Soemantri, 2012)6 , so that when completeness
is taken into account or corrected, Indonesia’s MMR increases from 121 to 278 per 100,000 live births.
Results of this study revealed disparities of uncorrected ratios among regions, ranging from the highest in
Sulawesi, with 200 per 100,000 live births, to the lowest in Java and Bali, with 99 per 100,000 live births.
One commitment of the MDGs is to reduce maternal mortality by three-quarters between 1990 and 2015,
implying that by 2015 Indonesia’s MMR will have reached 102 per 100,000 live births.7 The uncorrected
MMR that has been corrected in this study on causes of death, as well as the calculation of experts
mentioned above, shows that maternal mortality remains high, demanding intensive eff orts by the
Government of Indonesia to reduce MMR. As an eff ort to reduce maternal mortality, antenatal care (ANC)
must be “available, accessible and acceptable to all women in the service area”.8 In essence, this
Table 1. Number of maternal deaths in Population Census, 2010
Number of deaths in months REGION
IndonesiaSumatera Java-Bali Kalimantan Sulawesi Eastern
Indonesia
Number of deaths in 17 months 1738 3333 587 979 888 7524
Number of deaths in 12 months 1227 2353 414 691 627 5311
Number of Live Births in 12 months 1.072.588 2.371.448 280.717 345.556 331.845 4.402.154
Uncorrected Maternal Mortality Ratio per 100.000
kelahiran hidup114 99 148 200 189 121
Maternal Mortality ratio per 100.000 Live Births 261 227 340 459 434 278

8 DISPARITY OF ACCESS AND QUALITY
means that planned interventions should consider the “persistent disparity issue” that occurs in Indonesia.
People should be able to access health care at the desired place and time, regardless of income, culture
and physical location8. The MMR disparities and subsequent results of this study are expected to be
considered in the planning of health services for mothers to reduce disparities among regions.
3. CAUSES OF MATERNAL DEATH
a. Maternal death causes by group/tabulation
To fi nd a way of reducing MMR, it is necessary to know the causes of death. Causes of maternal death
according to ICD 10 and the WHO classifi cation table are grouped into direct and indirect causes. The
SP2010 Follow-up Study results are as follows in Table 2:
The results indicate that the causes of maternal death in the form of obstetric complication during
pregnancy, delivery and post-partum (direct causes) are still higher than indirect causes in Indonesia.
Interestingly, the percentage of indirect causes (Table 2) in Java, Bali and Eastern Indonesia is higher
than in other regions. However, the indirect causes in these regions are diff erent. In Java and Bali,
the main indirect causes are cardiovascular (O99.4=7.7%) and cardiomyopatic (O90.3=2%) diseases,
whereas in Eastern Indonesia, indirect causes are non-puerperal infections such as malaria (O98.6=5%)
and tuberculosis (O98.0=4.9%).
To get more specifi c causes, there are groups of causes of death in the ICD 10, WHO tabulation list.
Below is a table of diagnosis codes of eight groups of causes of maternal death, along with results of
proportion analysis of maternal deaths by region based on SP2010:
Table 2. Proportion of Causes of Maternal Death
Cause of maternal deathRegion
IndonesiaSumatera Java-Bali Kalimantan Sulawesi
Eastern Indonesia
Direct obstetric deaths (O00-O95) 81.5 73.8 80.9 80.2 75.7 77.2
Indirect obstetric deaths (O98-O99) 18.5 26.2 19.1 19.8 24.3 22.8
Total 100.0 (N=1738)
100.0 (N=3333)
100.0 (N=587)
100.0 (N=979)
100.0 (N=888)
100.0 (N=7524)
Source : STL SP2010

9DISPARITY OF ACCESS AND QUALITY
In the tabulation above, a modifi cation has been made. According to ICD 10 WHO, spontaneous
abortion, medical abortion and other pregnancies with abortive outcome are not in one group of
diagnosis, but in this study they are lumped together in the group of pregnancies with abortive
outcome due to small number of cases (Table 3).
In Table 3, it can be seen that the highest percentage of maternal death causes is the group of edema,
proteinuria, and hypertensive disorder, or pregnancy-induced hypertension (HDK/Hipertensi Dalam
Kehamilan) at 32.4 percent. The percentages of cases of death from the HDK group are as follows:
Establishment of death diagnosis in this study is limited to the underlying cause of death that provides
one single diagnosis; the multiple diagnoses option is not yet possible. Although maternal mortality
can be caused by a variety of complications, it is understood that those complications may include a
basic cause, intermediate cause and direct cause. In the HDK group, it can be traced to mothers who
have two complications, namely HDK as the primary cause and post-partum hemorrhage (PPP) as
Table 3. Diagnosis code and proportion of causes of maternal death in fi ve regions
based on ICD 10 WHO
Table 4. Diagnosis under the HDK group
Kode ICD 10, WHO
Underlying cause of maternal death
RegionIndonesia
Sumatera Java-Bali Kalimantan Sulawesi Eastern Indonesia
O00-O08 Pregnancy with abortive outcome 3.7 4.2 2.7 5.6 4.2 4.1
O10-O16 Oedema, proteinuria, and hypertensive disorder (HDK) 33.3 33.1 34.9 32.6 25.8 32.4
O44-O46Placenta previa, premature separation of placenta and Antepartum haemorrhage
4.4 2.7 4.3 2.3 3.6 3.3
O30-O43, O47-O48
Other maternal care related tofetus and amniotic cavity and possible delivery problems
3.0 1.7 0.0 0.8 0.1 1.6
O64-O66 Obstructed Labour 0.5 1.1 0.0 0.6 1.0 0.8
O72 Postpartum haemorrhage (PPP) 16.4 16.8 28.1 26.3 29.8 20.3
O20-O29, O60-O63, O67-O71, O73-O75,
O81-O84
Other complications of pregnancy and delivery 11.1 6.0 2.9 7.9 5.9 7.2
O85-O99Complication predominantly related puerperium and other conditions
27.6 34.3 27.1 23.9 29.7 30.2
Total 100.0 (N=1737)
100.0 (N=3334)
100.0 (N=587)
100.0 (N=979)
100.0 (N=887)
1000 (N=7524)
Code Pregnancy-induced hypertension group (O10-O16) Number %
O10 Pre-existing hypertension complicating pregnancy, childbird and the puerperium 227 3
O11 Pre-existing hypertension disorder with superimposed proteinuria 18 0.2
O12 Gestasional (pregnancy induced) oedema and proteinuria without hypertension 67 0.9
O13 Gestasional (pregnancy induced) hypertension without signifi cant proteinuria 281 3.7
O14 Pre eclampsia 538 7.1
O15 Eclampsia 1222 16.2
O16 Unspecifi ed maternal hypertension 96 1.3
Total 2449 32.4

10 DISPARITY OF ACCESS AND QUALITY
the direct, intermediate or contributing cause, which makes up 13.6 percent of HDK, or 0.1 percent
of total cases, so the case of post-partum hemorrhages is 20.4 percent. The second highest cause of
maternal mortality is other groups, or complications predominantly related to puerperium and other
conditions, at 30.2 percent (Table 3). The following is a list of causes in the predominantly related
complications of puerperium and other conditions:
From Table 5, the most common cause is the group of puerperal sepsis at 2.9 percent, and other
maternal diseases classifi able elsewhere but complicating pregnancy, childbirth and the puerperium
at 13.6 percent. The last group of O99 is broken down into:
O99.0 : Anemia.
O99.1 : Other diseases ofthe blood.
O99.2 : Endocrine, nutritionla and metabolic diss.
O99.3 : Mental disorders
O99.4 : Diss. of circulatory system
O99.5 : Diss. of respiratory system
O99.6 : Diss.of digestive system
O99.7 : Diseases of skin & subcutaneus
O99.8 : Other sepsifi c condition
Because other maternal diseases classifi able elsewhere but complicating pregnancy, childbirth and
the puerperium was a pathophysiologically diff erent group and too small a percentage, the cause
will not be discussed in this study.
To determine the risk of maternal mortality in a region, calculation of a ratio was conducted, i.e.
the number of maternal deaths in a region divided by the number of live births in the region. To
understand more about the risk of maternal mortality by cause, see the following table based on SP
2010:
Table 5. Causes of maternal death in the group of Complications Predominantly Related to Puerperium and Other Conditions
Code Description n %
O85 Puerperal sepsis 222 2.9
O86 Other puerperal infections 32 0.4
O87 Venous complications in the puerperium 2 0.2
O88 Obstetric embolism 80 1.1
O90 Complications of the puerperium, not elsewhere classifi ed 194 2.6
O92 Other disorders of breast and lactation associated with childbirth 3 0
O95 Death from sequelae of direct obstetric causes 20 0.3
O98 Maternal infectious and parasitic diseases classifi able elsewhere but complicating pregnancy, childbirth and the puerperium 684 9.1
O99 Other maternal diseases classifi able elsewhere but complicating pregnancy, childbirth and the puerperium 1024 13.6
Total Cases 2262 30.2

11DISPARITY OF ACCESS AND QUALITY
The result of this study (Table 6) shows that rank of regions at the greatest risk of HDK is as follows:
1. Sulawesi at 65 per 100,000 live births
2. Kalimantan at 52 per 100,000 live births
3. Eastern Indonesia at 49 per 100,000 live births
4. Sumatra at 38 per 100,000 live births
5. Java-Bali at 33 per 100,000 live births
After HDK, the most frequent cause found in this study was post-partum hemorrhage (PPP/Pendarahan
Post-partum). PPP caused by retained placenta was at 43.3 percent. The following is a ranking of regions
at the greatest risk of PPP:
1. Eastern Indonesia at 56 per 100,000 live births
2. Sulawesi at 52 per 100,000 live births
3. Kalimantan at 41 per 100,000 live births
4. Sumatra at 19 per 100,000 live births
5. Java-Bali at 17 per 100,000 live births
Based on the tables above, the leading causes of death in Indonesia are HDK and post-partum
hemorrhage. Deaths from HDK and PPP are preventable. Based on the results of research conducted
in Australia, England and Wales, and the United States, the percentage of deaths that can be avoided
due to HDK and PPP is 50 percent (Table 7) .9
To what extent can these two complications be managed? The following table consist of the sources
that inform cases of preventable death from pregnancy complications:
Table 6. Ratios of maternal death causes in fi ve regions based on ICD 10 WHO
*denominator: live birth data of SP 2010 (BPS)
No Underlying cause of maternal death Region*
IndonesiaSumatera Jawa-Bali Kalimantan Sulawesi EI
1 Pregnancy with abortive outcome 4 4 4 11 8 5
2 Oedema, proteinuria, and hypertensive disorder (HDK) 38 33 52 65 49 39
3 Placenta previa, premature separation of placenta and Antepartum haemorrhage 5 3 6 5 7 4
4 Other maternal care related to fetus and amnioticcavity and possible delivery problems 3 2 0 2 0 2
5 Obstructed Labour 1 1 0 1 2 16 Postpartum haemorrhage (PPP) 19 17 41 52 56 257 Other complications of pregnancy and delivery 13 6 4 15 11 9
8 Complication predominantly related puerperium and other conditions 32 34 40 48 56 37
Uncorrected Maternal Mortality Ratio per 100.000 Live Births 114 99 148 200 189 121
Maternal Mortality Ratio per 100.000 Live Births 261 227 340 459 434 278
12 DISPARITY OF ACCESS AND QUALITY
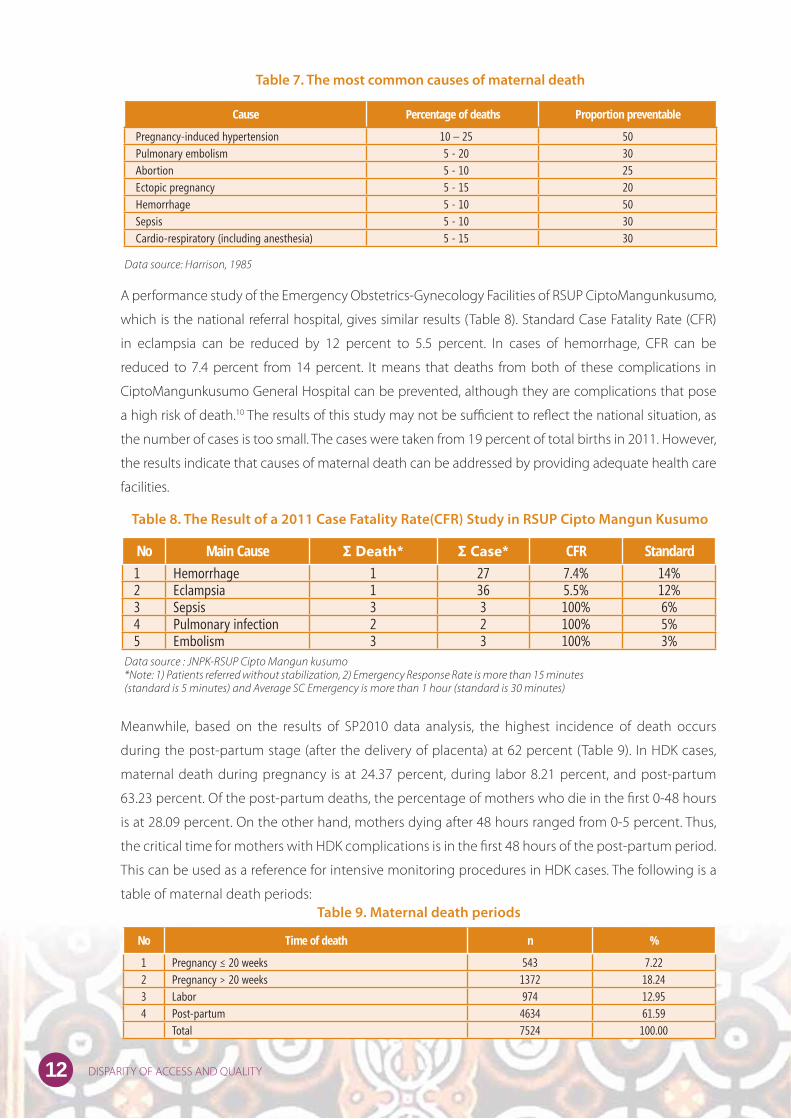
A performance study of the Emergency Obstetrics-Gynecology Facilities of RSUP CiptoMangunkusumo,
which is the national referral hospital, gives similar results (Table 8). Standard Case Fatality Rate (CFR)
in eclampsia can be reduced by 12 percent to 5.5 percent. In cases of hemorrhage, CFR can be
reduced to 7.4 percent from 14 percent. It means that deaths from both of these complications in
CiptoMangunkusumo General Hospital can be prevented, although they are complications that pose
a high risk of death.10 The results of this study may not be suffi cient to refl ect the national situation, as
the number of cases is too small. The cases were taken from 19 percent of total births in 2011. However,
the results indicate that causes of maternal death can be addressed by providing adequate health care
facilities.
Meanwhile, based on the results of SP2010 data analysis, the highest incidence of death occurs
during the post-partum stage (after the delivery of placenta) at 62 percent (Table 9). In HDK cases,
maternal death during pregnancy is at 24.37 percent, during labor 8.21 percent, and post-partum
63.23 percent. Of the post-partum deaths, the percentage of mothers who die in the fi rst 0-48 hours
is at 28.09 percent. On the other hand, mothers dying after 48 hours ranged from 0-5 percent. Thus,
the critical time for mothers with HDK complications is in the fi rst 48 hours of the post-partum period.
This can be used as a reference for intensive monitoring procedures in HDK cases. The following is a
table of maternal death periods:
Table 7. The most common causes of maternal death
Table 8. The Result of a 2011 Case Fatality Rate(CFR) Study in RSUP Cipto Mangun Kusumo
Cause Percentage of deaths Proportion preventable
Pregnancy-induced hypertension 10 – 25 50Pulmonary embolism 5 - 20 30Abortion 5 - 10 25Ectopic pregnancy 5 - 15 20Hemorrhage 5 - 10 50Sepsis 5 - 10 30Cardio-respiratory (including anesthesia) 5 - 15 30
Data source: Harrison, 1985
No Main Cause Σ Death* Σ Case* CFR Standard
1 Hemorrhage 1 27 7.4% 14%2 Eclampsia 1 36 5.5% 12%3 Sepsis 3 3 100% 6%4 Pulmonary infection 2 2 100% 5%5 Embolism 3 3 100% 3%
Data source : JNPK-RSUP Cipto Mangun kusumo*Note: 1) Patients referred without stabilization, 2) Emergency Response Rate is more than 15 minutes (standard is 5 minutes) and Average SC Emergency is more than 1 hour (standard is 30 minutes)
Table 9. Maternal death periods
No Time of death n %
1 Pregnancy ≤ 20 weeks 543 7.222 Pregnancy > 20 weeks 1372 18.243 Labor 974 12.954 Post-partum 4634 61.59 Total 7524 100.00

13DISPARITY OF ACCESS AND QUALITY
b. Causes of death without grouping (except for hypertension disorder and abortion)
If causes of maternal death were not grouped according to ICD 10 WHO (except for hypertension
disorder and abortion), there would be 64 causes of maternal death. In this study, the top 20 causes
of maternal mortality in Indonesia are presented. The number one cause is post-partum hemorrhage,
the second is eclampsia, the third is hypertension and edema disorder, and so on (Table 10). As
seen in Table 10, the highest is post-partum hemorrhage, which diff ers when causes of death are
grouped, in which case the highest is HDK followed by eclampsia, pre-eclampsia and hypertension.
In addition, edema disorders were not included in the HDK group, but stood alone. The HDK group
starts with symptoms of high blood pressure (hypertension), which is induced in pregnancy or before
pregnancy, swelling (edema) and elevated protein levels in the urine (proteinuria), which will end
up with poisoning of pregnancy or pre-eclampsia or eclampsia. Intervention for the HDK group is
the same, that is, to prevent complication of hypertension from becoming a dangerous and diffi cult
complication, i.e. eclampsia. The conclusion from the intervention point of view is in grouping: HDK
is the highest cause of death followed by post-partum hemorrhage. Intervention on both causes
of death is important since the HDK group accounts for one-third of maternal mortality and post-
partum hemorrhage if combined with ante-partum hemorrhage and placenta previa will account for
another one third of maternal deaths. For more details see the table below:
4. CHARACTERISTICS OF MATERNAL MORTALITY BY CAUSE OF DEATH
The characteristics of maternal mortality discussed herein are specifi cally in the HDK and PPP groups,
as both are the highest compared to other maternal death causes. The following table explains the
Tabel 10. 20 Penyebab Tertinggi Kematian Ibu di Indonesia
No. Code ICD 10 Cause of death N %
1 O72 Post-partum hemorrhage 1533 20.4
2 O15 Eclampsia 1222 16.2
3 O10-O13,O16 Hypertension and Edema disorder 694 9.2
4 O14 Pre-eclampsia 535 7.1
5 O99.4 Diseases of circulatory system 480 6.4
6 O00-O08 Abortion outcome (abortion, KET, MolaHidatidosa) 311 4.1
7 O98.0 Tuberculosis 307 4.1
8 O85 Puerperal sepsis 222 2.9
9 O99.5 Diseases of Respiratory System 196 2.6
10 O46 Antepartum Hemorrhage 174 2.3
11 O99.8 Other specifi c diseases & conditions 167 2.2
12 O90.3 Cardiomyopathy in puerperium 126 1.7
13 O32 Malpresentation of fetus 108 1.4
14 O88 Obstetric embolism 82 1.1
15 O36 Suspect fetal problems 80 1.1
16 O63 Long Labor 77 1
17 O42 Prematurely ruptured membrane 74 1
18 O44 Placenta previa 72 1
19 O45 Premature separation of placenta (abruptio placenta) 75 1
20 O21 Excessive vomiting in pregnancy 66 0.9

14 DISPARITY OF ACCESS AND QUALITY
characteristics of maternal mortality by cause of death according to SP2010.
Age at death
Characteristics of age of maternal death are classifi ed into three groups, namely aged below 20, 20 to
35, and over 35. Table 11 shows that more mothers who died from HDK were in the age group of below
Table 11. Characteristics of maternal mortality by cause of death
*Note: 1. Pregnancy with abortive outcome, 2.Oedema, proteinuria, and hypertensive disorder (HDK), 3.Placenta previa, premature separation of placenta and Antepartum hemorrhage, 4. Other maternal care related to fetus and amniotic cavity and possible delivery problems, 5. Obstructed Labor, 6.Post-partum hemorrhage (PPP), 7.Other complications of pregnancy and delivery, 8. Complication predominantly related puerperium and other conditions
Characteristics of
the mothers
Underlying cause of maternal deathTotal
1* 2* 3* 4* 5* 6* 7* 8*
Age
• <20 5.7 38.6 2.9 1.0 0.6 17.0 5.4 28.9 100.0 (N=521)
• 20-35 4.3 29.5 3.1 1.9 0.9 20.7 7.3 32.3 100.0 (N=4901)
•>35 3.7 37.6 3.8 1.0 0.6 20.8 7.0 25.4 100.0 (N=1931)
Status kawin
• Single 5.7 37.9 5.7 0.0 0.0 27.6 4.6 18.4 100.0 (N=86)
• Married 4.0 32.5 3.3 1.6 0.8 20.0 7.3 30.5 100.0 (N=7243)
• Live together 11.5 23.8 2.5 0.0 0.0 33.6 0.8 27.9 100.0 (N=123)
• Separated 0.0 0.0 0.0 0.0 0.0 0.0 0.0 100.0 100.0 (N=8)
• Divorced 12.5 29.2 0.0 0.0 0.0 29.2 8.3 20.8 100.0 (N=24)
• Widowed 0.0 0.0 0.0 0.0 0.0 20.0 0.0 80.0 100.0 (N=6)
Number of children
• 1-2 children 4.4 31.2 3.4 1.6 0.8 18.0 7.3 33.2 100.0 (N=4138)
• 3-4 children 3.8 35.1 2.8 1.4 0.5 23.0 6.6 26.8 100.0 (N=2136)
•>4 children 4.0 30.5 3.6 2.2 1.3 25.2 7.3 26.0 100.0 (N=1103)
Level of education
• No education/ elementary school graduate 3.4 29.4 3.5 1.3 1.0 25.4 6.9 29.1 100.0 (N=3604)
• Secondary school graduate 4.9 34.9 3.4 1.9 0.5 15.9 7.3 31.1 100.0 (N=500)
• Higher education 3.4 34.1 0.8 1.0 1.6 17.4 8.0 33.7 100.0 (N=2740)
Area
• Urban 4.6 36.2 3.6 1.5 0.8 14.3 6.6 32.5 100.0 (N=2740)
• Rural 3.9 30.2 3.1 1.7 0.8 23.8 7.4 29.1 100.0 (N=4784)
Place of death
• Government hospital 3.7 38.7 3.9 1.4 0.8 16.4 6.8 28.2 100.0 (N=3150)
• Private hospital 2.6 33.8 4.0 2.6 1.4 18.0 6.5 30.9 100.0 (N=1211)
• RSIA 0.0 32.0 0.0 0.0 0.0 36.0 8.0 24.0 100.0 (N=25)
• RSB 8.7 24.6 1.4 2.9 0.0 40.6 2.9 18.8 100.0 (N=69)
• Puskesmas 5.8 26.7 2.9 0.0 1.2 33.7 5.8 23.8 100.0 (N=172)
• Pustu 0.0 0.0 0.0 0.0 0.0 100.0 0.0 0.0 100.0 (N=2)
• Polindes/poskesdes 0.0 16.7 0.0 0.0 0.0 50.0 0.0 33.3 100.0 (N=6)
• Private practicing doctor 20.0 13.3 0.0 0.0 0.0 40.0 13.3 13.3 100.0 (N=16)
• Private practicing midwife 0.0 12.5 7.5 0.0 0.0 32.5 20.0 27.5 100.0 (N=39)
• Trad. midwife’s home 0.0 62.5 0.0 0.0 0.0 0.0 25.0 12.5 100.0 (N=7)
• Own home 5.6 25.2 2.3 1.4 0.6 21.2 6.9 36.6 100.0 (N=7)
• Others 2.3 26.3 2.3 1.8 0.2 33.6 11.2 22.1 100.0 (N=595)
15DISPARITY OF ACCESS AND QUALITY
20 (38.6%) and over 35 (37.6%) than those in the age group of 20-35 (29.5%). In Nigeria, women aged
15 have an MMR seven times higher than those of women aged 20-25.10.10,11 Another study suggests
that teenagers under 20 years old are more vulnerable to preeclampsia.12 Upon knowing the proportion
of HDK in such specifi c age groups, we recommend that eff orts should be taken to prevent pregnancy
before age 20 and after 35. However, in the event of pregnancy in that age group, improved ANC is
needed to prevent HDK complications. In the case of maternal death from PPP, there is no signifi cant
diff erence in the percentage across age groups (Table 11).
Marital status
Table 11 shows the percentage of mothers who died from HDK, which is higher in the single group
(37.9%) compared to those with HDK in other status groups. Whereas among mothers died from PPP, the
highest is in the live-together group (33.6%), compared to those with PPP in other status groups.
Number of children (parity)
The results of this study showed that among mothers who died from HDK, the percentages across diff erent
parity groups were virtually the same (Table 11). Whereas among mothers died of PPP complications,
those having more than four children had a higher percentage than those in other groups.
Education
According to Table 11, the highest percentage of mothers dying from HDK were in the junior-senior
high school graduate group, at 34.9 percent, whereas among mothers with PPP, the percentage of no-
education to elementary school graduates was higher (25.4%) compared to mothers with PPP in other
education level groups.
Area (Rural / Urban)
The result of this study showed that the number of mothers who died from HDK was higher in urban areas
(36.2%) than in rural areas (30.2%). Conversely, the number of mothers who died from PPP was higher
in rural areas (23.8%) than urban areas (14.3%). PPP is a case of complications that requires immediate
emergency care. The results showed that access in rural areas is more diffi cult than that in urban areas,
leading to high maternal mortality from PPP in rural areas.
Place of death
Table 11 shows that at government hospitals, private hospitals and traditional midwives’ homes, many
mothers died from HDK complications. Meanwhile, at RSIA, RSB, Puskesmas, Polindes, and private
doctors’ or midwives’ practices, and also on the way to one of these options (others), more mothers died
from PPP complications. Other mothers died at home from HDK (25.3%) and PPP (21.2%) complications.
Many mothers died at home from other complications, and under further examination, the main cause
was found to be cardiovascular diseases.

16 DISPARITY OF ACCESS AND QUALITY
Access : Place of death in rural and urban areas
Rural and urban areas may refl ect access to health services. Urban areas are assumed to have better
access than rural areas. In Chart 2B, it can be seen that more mothers died at hospitals in urban areas,
whereas more mothers died at home in rural areas. This indicates greater diffi culties for access to health
facilities in rural areas.
5. QUALITY OF CARE
The purpose of analyzing quality of care is to see the diff erence in service patterns that exist among
regions. The analysis on service performance uses data from Riskesdas2010.13 The performance indicator
used is ANC (antenatal care) by nakes (health workers), ANC examination types (blood pressure, blood
and urine), ANC K4 visits (1,1,2), birth attendants by health worker (Linakes/ SBA) and post-natal visits
one day after delivery (KunjunganNifas/ KF). The results of service performance based on the cause of
maternal death are as follows:
a. The overall cause of maternal death
Below is the proportion of service performance in fi ve regions based on Riskesdas 2010:
Chart 2. Place of death proportion by rural and urban areas
49.1
60.0
50.0
40.0
30.0
20.0
10.0
0.0
37.7
24.5
0.6 1.3 0.5 0.0 0.1 0.2 0.2 0.2
17.8
36.1
5.1
9.5
Urban
Publi
c Hos
pital
Priva
te Hos
pital
MCH H
ospit
alM
atern
ity H
ospit
alPu
skesm
as
Pustu
- Aid
Pusk
esmas
Polin
des/
Posk
esdes
Priva
te Pr
actic
e Doc
tors
Priva
te Pr
actic
e Midw
ives
TBA’s H
ouse
Home
Others
Rural

17DISPARITY OF ACCESS AND QUALITY
The above table indicates whether a high uncorrected ratio of maternal death rate is followed by low
quality service. The study shows consistent fi gures between a high maternal death rate uncorrected
ratio with low quality service. Such fi gures are found in Sulawesi, where the uncorrected ratio of
maternal death is high (201/100,000 live births) and service and coverage quality of ANC, K4, and
Linakes is the lowest.
Eastern Indonesia showed the second highest uncorrected ratio of maternal death after Sulawesi,
at 191/100,000 live births. The service performance also appeared to be the second lowest after
Sulawesi. It can be concluded that a high maternal death uncorrected ratio is followed by low quality
ANC, K4, Linakes and post-natal visit (KF) service coverage.
Other crucial issues are ANC, K4 and Linakes coverages in Java and Bali, which performed better
than the others. However, the KF, or post-natal visit coverage, is lower. It is surprising that in terms of
accessibility, Java- and Bali perform better than the other regions. This implies poor KF service quality.
In Java and Bali, unvisited KF by the health workers in the fi rst three days are between 0.8 and 15.6
percent. STL SP 2010 sample shows that the unvisited regions with above 10-percent range are West
Jakarta (15.6%) and Tangerang (11.7%). Further study is required to respond to the problem.
This study revealed a service performance proportion toward maternal death. Furthermore, the study also
described pregnancy, labor, and post-natal health service outcomes as shown in the following chart based
on Riskesdas 2010:
Table 12. Maternal death Uncorrected Ratio (SP2010 data) with service performance
proportion in fi ve regions in Indonesia
RegionIndonesia
Sumatera Jawa-Bali Kalimantan Sulawesi Eastern Indonesia
Maternal Death Uncorrected Ratio 261 227 390 459 434 278
Health Service Performance Proportion (Data from Riskesdas 2010)
Pregnancy Check Examiner
~ Health Worker (Nakes) 83.2 86.9 79.9 69.6 73.6 83.8
(N=883320) (N=3945334) (N=112935) (N=411173) (N=321729) (N=5674491)
ANC (K4) Visit
~ K4 65.3 77.5 62 41.8 63.1 71.5
(N=634543) (N=3388520) (N=76389) (N=222236) (N=242005) (N=4563693)
Last Birth Attendant (Linakes)
~ Health Worker 86.1 80.1 68.5 63.6 67.9 78.6
(N=903425) (N=3587247) (N=96134) (N=363598) (N=289397) (N=5239801)
Post-natal Visit (KF1)
~ Day 1-3 Visits 71.8 60.6 79.4 85.3 68.9 65.1
(N=530903) (N=2142836) (N=80601) (N=351555) (N=197513) (N=3303408)

18 DISPARITY OF ACCESS AND QUALITY
As shown in Chart 3, there is a disparity in pregnancy, labor and post-natal service in all regions. In
aggregated data, Sulawesi is the lowest in the coverage of competent health workers in examining
pregnancy and ANC (K4) visits at 41.8 percent, while ANC coverage standard is at 100 percent and K4
is at 95 percent. 14
b. Pregnancy-Induced Hypertension (HDK/Hipertensi dalam Kehamilan)
The table below describes service performance proportion among mothers with HDK in the fi ve
selected regions in Indonesia, based on Riskesdas 2010:
Chart 3. Service Performance Coverage (Data from Riskesdas 2010)
Table 13. Maternal death uncorrected ratio (Data of SP2010) with service performance
proportion among mothers with HDK in fi ve regions in Indonesia with weighted N.
100
80
60
40
20
0
86.9
69.9
K4; 41.8
Skilled Workers
Skilled Workers
Sumatera Java-Bali Kalimantan Sulawesi IBT Indonesia
K4; 77.5 SBA 80.1
SBA 63.6 KF1 60.6
KF1 85.3
RegionIndonesia
Sumatera Java-Bali Kalimantan Sulawesi Eastern Indonesia
HDK Related Maternal Death Uncorrected Ratio (Data of SP2010) 38 33 52 65 49 39
Health Service Performance Proportion (Data from Riskesdas 2010)
Pregnancy Check Examiner
• Health Worker (Nakes) 81.1 82.8 70.9 73.3 82.8 81.2
(N=67213) (N=329712) (N=13840) (N=42889) (N=31534) (N=485188)
Test Type
•No blood pressure test 11.2 6.2 0.0 4.6 8.5 6.7
(N=8663) (N=23809) (N=0) (N=2471) (N=2914) (N=37857)
• No urine test 51.0 49.6 58.9 80.7 55.0 53.3
(N=39339) (N=188931) (N=9166) (N=43632) (N=18941) (N=301009)
• No blood test 70.3 59 74.5 76.9 44.7 61.8
(N=54171) (N=383266) (N=11597) (N=41578) (N=15370) (N=348684)
ANC (K4) Visit
• K4 56.1 78.4 44.7 47.5 71.6 71.1
(N=43277) (N=300464) (N=6956) (N=25713) (N=24644) (N=401054)
Last Birth Attendant (Linakes)
• Health Worker 89.6 80.3 54.6 59.1 78.5 78.5
(N=70805) (N=307849) (N=10664) (N=32683) (N=26857) (N=448858)
Post-natal Visit (KF1)
• Day 1-3 Visit 61.4 62.9 86.9 82.6 59.5 65.2
(N=34896) (N=197114) (N=14614) (N=35504) (N=17945) (N=300073)*Note : N were weighted
19DISPARITY OF ACCESS AND QUALITY
The regional disparity regarding HDK cases as shown in the table above shows that the highest
uncorrected ratio of HDK-related maternal death is in Sulawesi, followed by Kalimantan in second
place. By service quality, based on Riskesdas 2010 data in Table 13, both regions have low ANC (K4)
and Linakes coverage. This shows a consistency between a high maternal death ratio and low service
quality.
The primary indicators in HDK cases are increased blood pressure, protein in the urine, and edema.
When the high HDK-related maternal death uncorrected ratio is compared with no blood and urine
tests, Sulawesi is of the highest in maternal death uncorrected ratio (495/100,000 live births). It is
followed by Kalimantan with (420/100,000 live births). It is also found that ANC (K4) and Linakes
coverage in both regions are lower than the others. Hypertension is often examined by urine testing.
Few urine tests for hypertension were carried out in Sulawesi (80.7%) compared to the other regions.
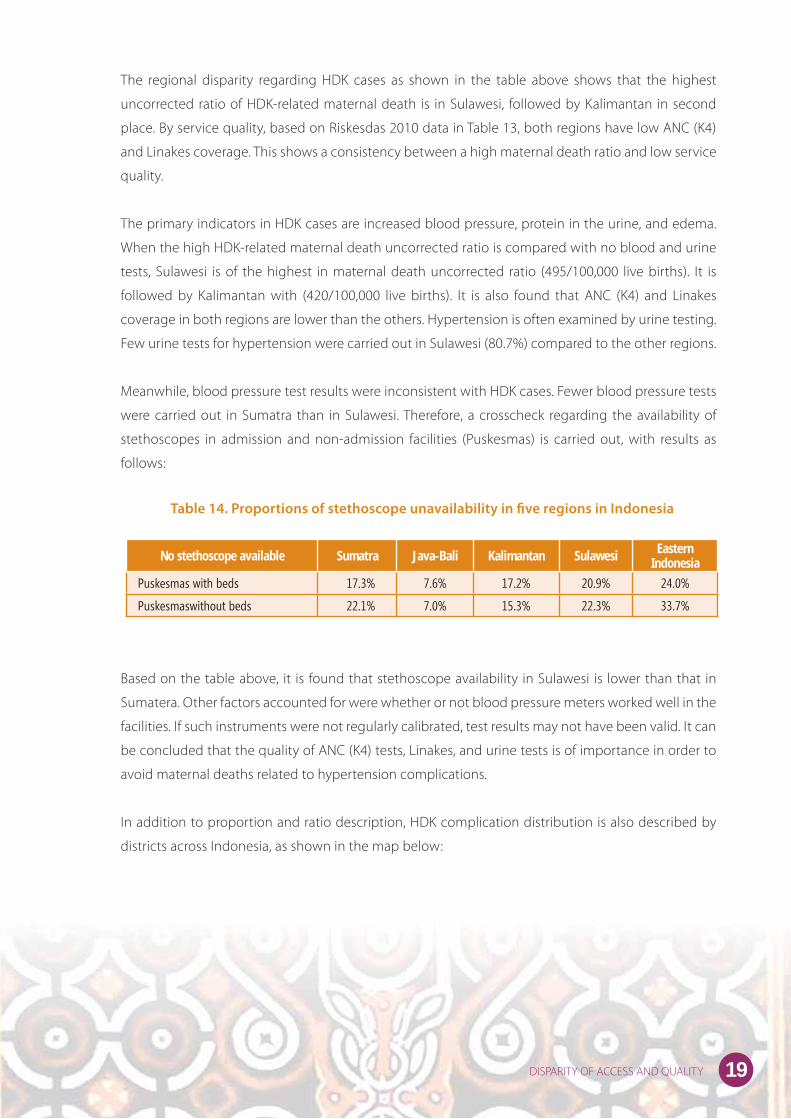
Meanwhile, blood pressure test results were inconsistent with HDK cases. Fewer blood pressure tests
were carried out in Sumatra than in Sulawesi. Therefore, a crosscheck regarding the availability of
stethoscopes in admission and non-admission facilities (Puskesmas) is carried out, with results as
follows:
Based on the table above, it is found that stethoscope availability in Sulawesi is lower than that in
Sumatera. Other factors accounted for were whether or not blood pressure meters worked well in the
facilities. If such instruments were not regularly calibrated, test results may not have been valid. It can
be concluded that the quality of ANC (K4) tests, Linakes, and urine tests is of importance in order to
avoid maternal deaths related to hypertension complications.
In addition to proportion and ratio description, HDK complication distribution is also described by
districts across Indonesia, as shown in the map below:
Table 14. Proportions of stethoscope unavailability in fi ve regions in Indonesia
No stethoscope available Sumatra Java-Bali Kalimantan Sulawesi Eastern Indonesia
Puskesmas with beds 17.3% 7.6% 17.2% 20.9% 24.0%
Puskesmaswithout beds 22.1% 7.0% 15.3% 22.3% 33.7%

20 DISPARITY OF ACCESS AND QUALITY
Chart 5. PPP distribution map by districts/cities in Indonesia
Chart 4. HDK distribution map by districts/cities in Indonesia
Pregnancy-induced Hypertension in 134 selected districts of
Indonesia
PPH in 134 selected districts of Indonesia

21DISPARITY OF ACCESS AND QUALITY
c. Post-partum Hemorrhage (PPP/Perdarahan Post-partum)
Below is a table of service performance proportion among mothers with PPP in the fi ve regions in
Indonesia, based on Riskesdas 2010:
The highest PPP-related maternal death uncorrected ratio is found in Eastern Indonesia. However,
ANC (K4), Linakes, and KF coverage did not show lower fi ndings when compared to the other regions.
This is because PPP is a complication case that requires a quick response. When a mother suff ers from
severe bleeding and does not get a blood transfusion immediately, or treatment in less than one
hour, the mother will not survive. The above coverage only mentions Linakes, but not the facilities.
The only facility with capacity to give a blood transfusion is a hospital. Meanwhile, in the access
section of this study, the geographical condition of the villages, cities and the patient’s location of
death in Eastern Indonesia impedes them from reaching a hospital in the rural regions. Therefore, it
is concluded that to prevent death due to PPP complications, access to immediate blood transfusion
should be improved and maintained.
6. HEALTH FACILITIES
This analysis of the Rifaskes 2011 study cannot clearly describe the population needs for ratio-based
analysis. Basic Obstetric and Neonatal Emergency Services (PONED) are conducted in Puskesmas. A policy
Table 15. Maternal death uncorrected ratio (Data of SP2010) with service performance
proportion among mothers with PPP in fi ve regions in Indonesia with weighted N.
RegionIndonesia
Sumatera Java-Bali Kalimantan Sulawesi Eastern Indonesia
PPP Related Maternal Death Uncorrected Ratio(Data of SP2010)
43 39 94 119 128 57
Health Service Performance Proportion (Data from Riskesdas 2010)
Pregnancy Check Examiner (K1)
• Health Workers 83.7 85.0 79.1 69.6 81.5 82.8
(N=22591) (N=132121) (N=6540) (N=17218) (N=10310) (N=188780)
Test Type
• No blood pressure test 6.4 7.6 0.0 0.0 4.4 6.2
(N=1716) (N=11732) (N=0) (N=0) (N=551) (N=13999)
• No urine test 47.9 50.7 46.5 80.4 49.8 53.0
(N=12936) (N=78543) (N=3846) (N=17353) (N=6303) (N=118981)
• No blood test 73.1 60.3 70.5 74.6 35.9 62.2
(N=19718) (N=93348) (N=5831) (N=16095) (N=4535) (N=139527)
ANC (K4) Visit
• K4 56.5 74.5 54.0 46.2 73.2 68.8
(N=15248) (N=115390) (N=4465) (N=9977) (N=9252) (N=154332)
Last Birth Attendant
• Health Workers 96.5 88.5 65.6 61.8 92.0 86
(N=24080) (N=129727) (N=5426) (N=13622) (N=10926) (N=183781)
Post-natal Visit
• Day 1-3 Visit 76.1 67.3 80.5 89.8 44.1 70.1
(N=16151) (N=90656) (N=6068) (N=19763) (N=4488) (N=137126)
*Keterangan : N sudat dibobot.

22 DISPARITY OF ACCESS AND QUALITY
from the Ministry of Health determines that there should be at least four PONEDs available in a district,
providing 24-hour health services.
Based on the data of Rifaskes 2011, Indonesia has approximately 98 cities and 398 districts. From among
the 98 cities, only 13 percent of them have at least four Puskesmas PONED. From 398 districts, only
61 percent of them have at least four Puskesmas PONED.15 The percentage of cities with at least four
Puskesmas PONED by region is as follows:
1) Sulawesi : 36% of 11 cities
2) Java-Bali : 17% of 35 cities
3) Eastern Indonesia: 11% of 9 cities
4) Sumatera : 6% of 34 cities
Meanwhile, the districts with at least four PONED Puskesmasare as the follows:
1) Java-Bali :75% of 92 districts
2) Sulawesi : 66% of 61 districts
3) Sumatra : 55% of 117 districts
4) Kalimantan: 54% of 46 districts
5) Eastern Indonesia: 42% of 82 46 districts
Description of Puskesmas PONED in the districts by region can be observed from the following chart:
Chart 6. Proportion of districts with Puskesmas PONED in fi ve regions in Indonesia
% Cities with at least 4 Puskesmas PONED
% Districts with at least 4 Puskesmas PONED
Indonesia
Kalimantan
Sumatera
Eastern Indonesia
Java Bali
Sulawesi
Indonesia
Eastern Indonesia
Kalimantan
Sumatera
Sulawesi
Java Bali
13% 61%
42%
54%
55%
66%
75%
0%
6%
11%
17%
36%
0% 0%10% 20%20% 40%30% 60%40% 80%

23DISPARITY OF ACCESS AND QUALITY
Service in Puskesmas PONED (BEONC/ Basic Emergency Obstetric and Neonatal Care)
Puskesmas PONED is defi ned as an emergency service for obstetric and neonatal emergency cases which
can be handled in Puskesmas. It means that Puskesmas have to provide appropriate services as required
by the standards. Service provided by Puskesmas PONED by region can be observed from the table below,
based on Rifaskes 2011 fi ndings:
Nationally, from the existing total of 1,674 Puskesmas PONED, as many as 78 percent provide 24-hour
service, while 28 percent of the remainder do not. Regionally, the percentage of Puskesmas PONED with
24-hour service is 71 percent in Eastern Indonesia, which is the least and is almost on par with in Sumatra
(73%) (Table 16). However, the maternal death uncorrected ratio in Eastern Indonesia and Sumatra shows
disparity. This suggests that 24-hour provision will not guarantee the prevention of death risks when
access remains diffi cult and supporting instruments and drugs are not available. It can be concluded that
Puskesmas PONED can reduce maternal risk when access is made available.
Table 16. Maternal death uncorrected ratio (Data of SP2010) with
Puskesmas PONED service by fi ve regions in Indonesia
*Skilled worker = PONED skilled doctors, midwives and nurses are available
RegionIndonesia
Sumatera Java-Bali Kalimantan Sulawesi Eastern Indonesia
Maternal Death Uncorrected Ratio 115 99 148 201 191 121
24 hour service 73% 82% 75% 83% 71% 78%
Skilled worker 50% 41% 55% 39% 48% 45%
Fully equipped
≥ 80% equipped 10% 14% 11% 7% 7% 12%
40-79% equipped 44% 55% 36% 45% 40% 48%
< 40% equipped 46% 31% 54% 48% 53% 40%
Full-length Drugs
≥ 80% equipped 2% 5% 1% 2% 1% 3%
40-79% equipped 28% 35% 31% 17% 23% 30%
< 40% equipped 70% 60% 68% 81% 76% 66%
100% (N= 390)
100%(N=709)
100% (N=132)
100%(N=238)
100%(N=205)
100%(N=1674)

24 DISPARITY OF ACCESS AND QUALITY
In Rifaskes 2011, information regarding the availability of skilled workers at PONED was collected in
2009 and 2010. Availability of skilled workers can be defi ned as the availability of at least one doctor,
one midwife and one nurse skilled in PONED. Regionally, Java and Bali together have the second-lowest
percentage of skilled workers (41%) compared to other regions. However, Java and Bali also have the
highest number of Puskesmas PONED compared to the other regions. The uncorrected proportion in Java
and Bali is also the lowest. This means that a low percentage of skilled workers can reduce maternal death
risks, since it is accompanied by its equivalent with population numbers and easier access to facilities
across the region of Java and Bali.
Well equipped facilities and availability of drugs are the fundamental requirements to deal with
complicated cases. Regionally, Sulawesi and Eastern Indonesia clearly show the highest maternal death
uncorrected ratio compared to other regions. Supporting equipment and drugs are also the poorest of
all regions. It can be concluded that availability of equipment and drugs can reduce the risk of maternal
death.
Puskesmas PONED Readiness in Dealing with Pre-eclampsia/Eclampsia and Post-Partum
Hemorrhage Cases (PPP)
Major causes of maternal death include post-partum hemorrhage, pre-eclampsia/eclampsia and
hypertension during pregnancy. Puskesmas PONED must be able to deal with these cases, or at least
provide fi rst aid prior to referring the patient to a PONEK facility. The readiness of Puskesmas PONED to
provide services in such cases can be observed from the availability of equipment and drugs needed
for treatment. For instance, in the case of pre-eclampsia/eclampsia, MGSO4 20-percent and 40-percent
injections must be available. The following table describes the availability of MGSO4 and vacuum
instruments used in delivery. Immediate delivery for mothers with eclampsia complications can reduce
the risk of maternal death. Therefore, such instruments are badly needed to save the lives of mothers and
babies (Rifaskes 2011).
It can be observed from the above table that 52 percent of Puskesmas PONED are equipped with
extraction vacuums, while the remaining 48 percent are not. The lowest availability of extraction vacuums
was found in Eastern Indonesia (39%) with MgSO4 of 20 percent and 40 percent when compared to that
of other regions.
Table 17. Percentage of Puskesmas PONED providing primary drugs and
instruments for treating pre-eclampsia/eclampsia cases
RegionIndonesia
Sumatera Java-Bali Kalimantan Sulawesi Eastern Indonesia
Number of PONED 390 709 132 238 205 1674
MgSO4 20% 35% 46% 44% 35% 23% 42%
MgSO4 40% 34% 51% 46% 39% 24% 47%
Extraction vacuum 54% 54% 46% 48% 39% 52%

25DISPARITY OF ACCESS AND QUALITY
Table 18 above describes the availability of drugs for dealing with bleeding emergency cases. Generally,
drug availability is less than 80 percent, and regionally, there is no disparity. However, the uncorrected
ratio shows a big disparity between Eastern Indonesia and other regions. Such inequality suggests
that drugs may not be adequately available. In addition, blood supply, which is a crucial need, has yet
to be madeimmediately available. In severe bleeding cases, there is a risk of death in less than one
hour. In reality, blood transfusions are often unavailable in Puskesmas PONED. Blood transfusions are
conducted only in hospitals. Because of this, deaths due to post-partum bleeding can take place on
the way to the hospital (as in other cases), making up 33.3 percent of incidences. It is crucial that the
problem of transfusion supply should be addressed.
Comprehensive Obstetric and Neonatal Emergency Services (PONEK) in Public Hospitals (RSU)
In order to reduce maternal death in hospitals, Comprehensive Obstetric and Neonatal Services
(PONEK) are conducted. Regionally, there is a disparity in PONEK services. The Java-Bali region has
a better proportion of public hospitals with the capacity to meet PONEK requirements compared
to other regions, including the provision of an Essential PONEK team. In the Java-Bali region, about
57.1 percent out of 233 public hospitals have an Essential PONEK team. PONEK teams are assigned
based on a Director Decision Letter and are comprised of one obstetric and gynecology specialist, one
pediatrician, one doctor in the emergency unit, three midwives (one coordinator and two supervisors)
and two nurses. Rifaskes 2011 results are shown in the table below:
Table 18. Percentage of Puskesmas PONED providing primary drugs and
instruments in the post-partum hemorrhage service
Region
IndonesiaSumatera Java-Bali Kalimantan Sulawesi
Eastern
Indonesia
Number of PONED 390 709 132 238 205 1674
Dextrose 5% 64% 79% 73% 64% 72% 76%
NaCl 0.9% 66% 77% 70% 65% 68% 75%
Ergometrine inj. 57% 80% 70% 71% 69% 74%
Oxytocine inj. 55% 82% 69% 74% 63% 75%

26 DISPARITY OF ACCESS AND QUALITY
This study acknowledges that the major cause of maternal death is HDK complication. The region with
the highest maternal death ratio due to hypertension is Sulawesi. In terms of facility services in Puskesmas
PONED, the region with the lowest proportion of drug availability in overcoming HDK is Sulawesi, which
is why referral to a hospital is possible. This study shows that HDK-related maternal death mostly happens
in public hospitals. The above table shows a consistency between the high maternal death uncorrected
ratio in Sulawesi with the low PONEK criteria coverage in the region. Among nine PONEK criteria, Sulawesi
only covers six of them, making this region the lowest in coverage. It can be concluded that maternal
death at the regional level due to HDK cases is related to PONED and PONEK facilities with low coverage.
An immediate emergency system is badly needed for handling post-partum bleeding complications.
The percentage of emergency readiness in Eastern Indonesia is not too diff erent from that of Sulawesi:
only six out of nine criteria can be covered with a low percentage. The primary response for post-partum
hemorrhage is blood transfusion. The results of this study show that Eastern Indonesia has the highest
post-partum HDK-related maternal death uncorrected ratio. As for the availability of 24-hour blood
service units, Eastern Indonesia showed the lowest percentage. Hence, it can be concluded that blood
transfusion supply is a fi rst priority at hospitals, and primarily public hospitals as referral hospitals. The
following table based on Rifaskes 2011 data describes the proportion of public hospitals based on the
availability of anesthetic specialists, surgeons, pediatricians, midwives and gynecologists in fi ve regions
in Indonesia:
Table 19. The proportion of public hospitals based on the fulfi lment of
PONEK criteria in fi ve regions in Indonesia
No. PONEK CriteriaSumatera Jabal Kalimantan Sulawesi
Eastern Indonesia
N % N % N % N % n %
1 24-hour operation room 208 69.7 233 81.1 74 67.6 90 62.2 80 62.5
2 24-hour operation team 208 70.2 233 84.1 74 63.5 90 45.6 80 62.5
3 24-hour blood service 208 50.5 233 63.1 74 56.8 90 46.7 80 43.8
4 24-hour laboratory service 208 61.1 233 75.1 74 63.5 90 52.2 80 52.5
5 24-hour radiology service 208 56.3 233 70.0 74 55.4 90 41.1 80 47.5
6 24-hour pharmacy and other supporting instruments/services 208 60.1 233 77.3 74 67.6 90 60.0 80 55.0
7 24-hour admission room 208 49.0 233 68.7 74 44.6 90 40.0 80 35.0
8 24-hour blood service unit 208 43.3 233 37.8 74 47.3 90 44.4 80 36.3
9 Essential PONEK Team 208 38.5 233 57.1 74 24.3 90 34.4 80 42.5

27DISPARITY OF ACCESS AND QUALITY
As far as the availability of obstetric gynecologists is concerned, Sulawesi has a good percentage of
available gynecologists after the Java-Bali region. However, the maternal death uncorrected ratio
in Sulawesi is high compared to that in other regions. This suggests that competence of education,
training and operational matters for human resources should be supported by competence of facilities
and equipment. When those competence standards are neglected, the risk of maternal death remains
high. The following table based on Rifaskes 2011 describes the proportion:
The correlation of emergency and electrical power is vital. Due to cases that require immediate
operation, electricity should be available 24 hours a day. At present, this is fulfilled in 90 percent of
public hospitals. However, the remaining 10 percent should be addressed immediately, since an
electrical blackout in the middle of an emergency procedure or operation could prove fatal.
Table 20. Proportion of public hospitals based on the availability of anesthetic specialists,
surgeons, pediatricians, midwives and gynecologists in fi ve regions in Indonesia
Table 21. Proportion of public hospitals based on the availability of supporting facilities for
mother and child health by fi ve regions in Indonesia
SpecializationSumatera Java-Bali Kalimantan Sulawesi
Eastern Indonesia
N % N % N % N % N %
Anesthetists 208 37.5 233 74.2 74 35.1 90 38.9 80 27.5
Surgeons 208 76.4 233 91.0 74 71.6 90 82.2 80 58.8
Pediatricians 208 76.0 233 86.7 74 68.9 90 71.1 80 52.5
Obstetric Gynecologists 208 82.2 233 90.6 74 82.3 90 87.8 80 57.5
Mother and Child Health
Supporting Facility
Sumatera Jabal Kalimantan SulawesiEastern
Indonesia
N % N % N % N % N %
24-hour clean water 208 90.9 233 99.1 74 91.9 90 87.8 80 91.3
Water Reservoir 208 91.8 233 98.7 74 97.3 90 93.3 80 96.3
Water Availability 208 82.7 233 97.4 74 89.2 90 81.1 80 86.3
24-hour electricity 208 98.6 233 100 74 97.3 90 97.8 80 91.3
Electricity generator 208 98.1 233 98.7 74 100.0 90 95.6 80 92.5
Telephone 208 100.0 233 100 74 94.6 90 84.4 80 85.0
Ambulance 208 99.0 233 100 74 98.6 90 98.9 80 98.8

28 DISPARITY OF ACCESS AND QUALITY
Nationally, blood supply units are available in about 47.9 percent of public hospitals, with doctors as
the leading managers in about 33.5 percent of units, and 40.9 percent of units ready to provide 24-hour
service. The following table, based on Rifaskes 2011 data, describes the situation:
It has been previously mentioned in this report that ANC, K4, Linakes and KF coverage cannot prevent
maternal deaths. Maternal deaths may be avoided by an eff ort to provide immediate and reachable blood
supply to deal with diffi cult PPP complications in less than one hour. Based on information and experience
from the Head of Obstetrics and Gynecology in the Emergency Unit of Cipto Mangunkusumo General
Hospital in Jakarta, success in preventing the fatality rate caused by bleeding complications depends on
the availability of 3-5 bags of blood per patient to ensure survival.
Chart 7. Proportion of hospitals based on the emergency handling capability
50
40
30
20
10
0
47.9
Blood supply unit Lead by doctor 24-Hour Services
33.5
40.9

29DISPARITY OF ACCESS AND QUALITY
1. The results show that the uncorrected ratio for maternal deaths in Indonesia is 121 per 100,000
live births, based on data related to maternal deaths and live birth rates in the 2010 Population
Census. An uncorrected ratio for maternal deaths signifies figures that have not yet been corrected
and cannot be considered to represent an official maternal death ratio. Correction of figures will
be carried with recognition of underreporting in data collection for the 2010 Population Census.
2. In this review, correction with complete calculation of 0.4352 (121/0.4352) is required to gain a more
accurate maternal mortality ratio (MMR), specifi cally for this review, the MMR is 278 per 100,000 live births.
3. Ratios for maternal deaths are shown in the following list, from the highest in number by region:
• Sulawesi (200/100,000 live births)
• Eastern Indonesia (189/100,000 live births)
• Kalimantan (148/100,000 live births)
• Sumatra (114/100,000 live births)
• Java and Bali (99/100,000 live births)
Indonesia total : 121/100,000 live births.
4. There is some a disparity in the uncorrected ratio for maternal deaths in the fi ve regions. However,
Sulawesi and Eastern Indonesia only show a small diff erence. Only when Nusa Tenggara, Maluku and
Papua, which comprise Eastern Indonesia, were separated did one of the three provinces show a
possible higher maternal death rate than that in Sulawesi.
5. An estimated 77.2 percent of maternal deaths were due to direct causes, while 22.8 percent were due to
indirect causes.
6. In Java and Bali as a single region, indirect causes for maternal deaths were higher than that of other
regions. Cardiovascular and TB cases were mostly responsible for indirect causes of maternal death in
Java and Bali.Meanwhile, in Eastern Indonesia, TB and malaria cases were a more common cause of
maternal death.
7. Patterns of causes of death in the fi ve regions based on the causal groups were no diff erent. The highest
cause of maternal death in the fi ve regions was hypertension, at 32.4 percent, and post-partum
hemorrhage, at 20.3 percent.
8. The high maternal death ratio, according to SP2010, is related to low service performance, as per Riskesdas
2010 and Rifaskes 2011, and is consistent with low availability of equipment and drugs supplies.
9. Sulawesi shows the highest uncorrected ratio for HDK-related maternal deaths. In addition, Sulawesi’s
service performance coverage − i.e. health worker examination, ANC K4 visit quality, delivery assistance
by health workers (Linakes) − was low compared to the other regions (Riskesdas 2010). Sulawesi also
showed the lowest PONED criteria, i.e. the lowest skilled workers and lowest availability of drugs. Similarly,
six of the nine PONEK criteria were also the lowest in Sulawesi, according to Rifaskes 2011 data.
10. The highest uncorrected ratio for HDK-related maternal death was in Sulawesi, according to its
coverage quality in ANC test, in which Sulawesi showed the highest rates of a lack of urine testing and
blood testing compared to the other regions under study.
CONCLUSIONS

30 DISPARITY OF ACCESS AND QUALITY
11. Urine tests became an important indicator as a preventive measure to avoid maternal deaths due to
severe complications.
12. Availability of HDK drugs was found to be crucial for reducing case fatality rate (CFR) in HDK cases.
13. The critical period of HDK cases during treatment is 0 to 48 hours after delivery. Eff orts to provide
complete supplies of HDK drugs in PONED and PONEK should be the fi rst priority.
14. The highest post-partum hemorrhage (PPP)-related maternal death rate was recorded in Eastern
Indonesia, where service coverage, or that of post-natal visit coverage, was the lowest.
15. The case fatality rate (CFR) of post-partum hemorrhage (PPP) can be reduced by a continuously
supplied blood unit system.
16. Although ANC, K4, Linakes and KF coverage is good, delivery in places other than health facilities with
an immediate blood supply in less than one hour may have caused an increased risk of death due to
post-partum haemorrhage complications.
17. There is no guarantee that a large number of OBGYN doctors can help lower maternal death rates
without decent hospital facilities and competent human resources, as shown in the case of Sulawesi,
where the rate of maternal death is still high despite having such facilities.
18. There was a disparity of PONED and PONEK instruments and facilities in the fi ve regions.
19. Overall, the disparity was closely related to access and service quality.
31DISPARITY OF ACCESS AND QUALITY
• Regional disparity in access and quality of maternal health care should be accounted for in reducing
maternal deaths.
• In minimally setting facilities, there is a need for improving collaboration
• Pregnancy before the mother turns 20 years old or after 35 years old should be avoided, however, when
such cases happened, the coverage of quality of care should be improved.
• Case fatality rate (CFR) for pregnancy induced Hypertension and post-partumhaemorrhage is very high,
therefore prevention is the main eff ort to overcome this.
• For preventive scheme, fi rst priority is ensuring the quality of urine and blood pressure tests and laboratory
functions should be improved.
• For curative scheme:
- Availability of pre-eclampsia and eclampsia drugs in puskesmas and hospitals.
- Access to blood transfusion unit is improved.
- Availability of Caesarean Section and Vacuum Extraction to reduce mortality cases.
• According to prevailing regulations, the Government of Indonesia is responsible for the improvement
of blood service quality and access. Therefore, it is essential that the National Commission on Blood
Services (Komite Nasional Pelayanan Darah) and other inter-sectoral partiesensure improvement in the
systems and organization of blood supply.
• PONED and PONEK shall always refer to the 3A principles of availability, accessibility and acceptability
• It is suggested that further studies should be conducted on HDK and post-partum hemorrhage (PPP)
intervention such as operational research or implementation research.
RECOMMENDATIONS

32 DISPARITY OF ACCESS AND QUALITY
1 UNFPA. 2012. Universal Access to Reproductive Health Service: An Unfi nished Task. Celebrating World
Population Day 11 July 2012. Jakarta, UNFPA.
2 UNFPA. 2011. Report on Jampersal Program Implementation Review in 6 Districts (A Working Document).
Jakarta: UNFPA and MoH RI.
3 UNDP. Progress Report on the Achievement of Millenium Development Goals in Indonesia. Goal 5: Improving
Maternal Health. Jakarta: UNDP.
4 Afi fah, Tin.,Tejayanti, Teti., Usman, Yuslely., et al. Initial Report on the Study of SP2010 Data Follow Up to Obtain
the Cause of Maternal Death and Regional Assessment of Registration System. Jakarta: Balitbangkes RI.
5 WHO. 2007. Behind Numbers. Study of Maternal Death and Complication to Get Safer Pregnancy. Jakarta: WHO.
6 Hartanto,Wendy.2012. Presentation in Bangkok.
7 Soemantri, Soeharsono. 2012. General Death Completeness (Brass Growth Balance Method) by Diff erent Set
Data Fitting.
8 Bappenas. 2009. Health and Nutrition Development in Indonesia. Overview and Future Objectives, Background
Study RPJMN 2010-2014, hal.235.State Ministry of National Development Plan.
9 WHO. 2010. Packages of Interventions for fammily Planning, Safe Abortion care, Maternal Newborn and Child Health.
10 Harrison, K.A. 1985. Child bearing, Health and Social Prioritis.A survey of 22.774 consecutive births in Zaria,
Northen, Nigeria.British Journal of Obtetries and Gynecology.
11 Santoso, Budi Iman. 2012. Performance of Obstetric-Gynecology Emergency Facilities of RSUPN Cipto
Mangunkusumo. Jakarta: JNPK RSUP Cipto Mangunkusumo.
12 Neutra, R.A. 1973. Cases control study for estimating the risk of eclampsia in call, Colombia.Am.J. Obstetry
Gynaecology:894-903.
13 Royton, Erica. 1989. (Division of Family Health Word Health, Organization), Geneva, Switzerland & Sw.
Amstrong(freelance Journalis, London, England).
14 Balitbangkes.2010. Riset Kesehatan Dasar (Riskesdas/Basic Health Survey) 2010.Jakarta: Institute of Research
and Development of the Ministry of Health of Republic of Indonesia..15 Kemenkes RI. 2010. Rencana Strategis
Kementerian Kesehatan Tahun 2010-2014. Jakarta : Kementerian Kesehatan Republik Indonesia
15 C. Ronsmans, S. Scott, SN Qomariyah, et al. 2009. Professional Assistance During Birth and Maternal Mortality
in Two Indonesian Districs. Bulletin of the World Health Organization No. 87 Page 416-423.
16 UNFPA. 2010. Population Situation Analyisis. A Conceptual and Methodological Guide.UNFPA and Technical
Division.
17 Bappenas. 2010. Summary of The Roadmap to Accelerate Achievement of The MDGs in Indonesia. Jakarta: Board
of National Development Plan.
18 MoH RI. 2010. Ministry of Health Strategic Plan 2010-2014. Jakarta: Ministry of Health of the Republic of
Indonesia.
19 MoH RI. 2010. Rifaskes/Health Facility Research 2011. Jakarta: Institute of Research and Development of the
Ministry of Health of Republic of Indonesia.
20 Hill, Kenneth. 2001.Measuring Maternal Mortality from a Census: Guidelines for Potential Users.Measure
Evaluation Manual Series No.4. USA: WHO, Measure Evaluation, USAID
REFERENCES