dispersal and attenuation of trace contaminants …
TRANSCRIPT
Published: May 18, 2011
r 2011 American Chemical Society 5147 dx.doi.org/10.1021/es200850y | Environ. Sci. Technol. 2011, 45, 5147–5155
ARTICLE
pubs.acs.org/est
Dispersal and Attenuation of Trace Contaminants Downstream ofthe Ajka Bauxite Residue (Red Mud) Depository Failure, HungaryWilliam M. Mayes,*,† Adam P. Jarvis,‡ Ian T. Burke,§ Melanie Walton,† Vikt�oria Feigl,|| Orsolya Klebercz,||
and Katalin Gruiz||
†Centre for Environmental and Marine Sciences, University of Hull, Scarborough, YO11 3AZ, U.K.‡School of Civil Engineering and Geosciences, Newcastle University, Newcastle upon Tyne, NE1 7RU, U.K.§School of Earth and Environment, University of Leeds, Leeds, LS2 9JT, U.K.
)Department of Applied Biotechnology and Food Science, Budapest University of Technology and Economics, 1111 Budapest,St. Gell�ert sq. 4, Hungary
bS Supporting Information
’ INTRODUCTION
The dike breach at the bauxite processing residue (red mud)depository at the Ajkai Timfoldgyar Zrt alumina plant inHungary on October 4, 2010 released between 600 000 and700 000 m3 of caustic red mud suspension.1 Although there havebeen other notable examples of accidental release of causticwastes to river systems,2,3 the Ajka incident is unprecedentedgiven the scale of the release and the type of material involved.Immediate scientific efforts at the site have assessed the phyto-toxicty of the red mud given the vast areas (estimated to be800 ha)4 of agricultural land inundated and the public health risksassociated with dust blows from the terrestrial deposits.5,6
Red mud is the fine fraction byproduct of alumina refining, ofwhich between 70 million and 120 million tonnes are producedannually.4,7,8 The specific composition of red mud deposits, andtheir trace element constituent in particular, depends on the qualityof the bauxite ore from which they are enriched in the residue. Thebulkmatrix of redmud typically comprises residual iron oxides (e.g.,hematite), quartz, sodium aluminosilicates, titanium dioxide,calciumcarbonate/aluminate, and sodiumhydroxide (which elevatespH up to 13).5,9 At Ajka, previous studies have highlighted thepresence of radionuclides (226Ra, 232Th, and 40K) in the deposits7
and characterization studies soon after the spill highlighted elevated
concentrations of V, Cr,Ni, andCo in two isolated redmud samplestaken from deposits downstream of the site.4 Immediate studies onthe bioavailability of potential trace contaminants to plants suggestthat trace contaminant availability (e.g., Cr, Co, Ni, and V) is asecondary issue compared to an elevated Na content of thematerial.4 These findings are consistent with other assessmentsundertaken on red mud deposits from sites elsewhere globally10
suggesting that the material, while enriched in various traceelements, can be relatively benign. Indeed, multiple after-uses forred mud have been assessed in building materials7 and as anenvironmental ameliorant.11 Red mud and derivative media havebeen shown to limit the mobility of many trace contaminants invarious contaminated land settings (e.g., mine sites) due primarily tosorption and coprecipitationwith the abundant ferric and aluminumoxides in the material.12�14
Red mud leachates are hyperalkaline (pH 9�13) due to theNaOH digestant used in the Bayer Process.15 High pH itself insurface waters can be a source of direct toxicity to aquatic life.16
Received: March 26, 2011Accepted: May 6, 2011Revised: May 4, 2011
ABSTRACT: This paper identifies the spatial extent of bauxite processingresidue (red mud)-derived contaminants and modes of transport within theMarcal and R�aba river systems after the dike failure at Ajka, western Hungary.The geochemical signature of the red mud is apparent throughout the 3076 km2
Marcal system principally with elevated Al, V, As, and Mo. Elevated concentra-tions of Cr, Ga, and Ni are also observed within 2 km of the source areas inaqueous and particulate phases where hyperalkalinity (pH < 13.1) is apparent.Although the concentrations of some trace elements exceed aquatic lifestandards in waters (e.g., V, As) and fluvial sediments (As, Cr, Ni, V), thespatial extent of these is limited to the Torna Creek and part of the upperMarcal.Source samples show a bimodal particle size distribution (peaks at 0.7 and 1.3μm)which lends the material to ready fluvial transport. Where elevated con-centrations are found in fluvial sediments, sequential extraction suggests thebulk of the As, Cr, Ni, and V are associated with residual (aqua-regia/HF digest) phases and unlikely to be mobile in theenvironment. However, at some depositional hotspots, association of As, Cr, and V with weak acid-extractable phases is observed.

5148 dx.doi.org/10.1021/es200850y |Environ. Sci. Technol. 2011, 45, 5147–5155
Environmental Science & Technology ARTICLE
However, an equally important issue is the greater mobility ofoxyanionic trace elements such as As, Cr, Mo, and V at elevatedpH.17 These contaminants have been documented to occur inconcentrations of 2�5 mg L�1 at a former mine pit lake in whichred mud was dumped in western Poland.15 Studies in analogoushyperalkaline settings have also documented some of theseelements occurring at environmentally significant concentra-tions, such as in waters draining steel slag mounds,18 chromiteore residue sites,19 and fly ash disposal sites.20
This paper presents an integrated assessment of water quality,contaminant transport and fate in the water courses immediatelydownstream of the Ajka red mud disposal site. Specific objectivesof the work are to (1) assess the impact, composition, andbehavior of residual aqueous releases from the disposal site, and(2) determine the spatial extent and form of red mud-derivedcontaminants in the fluvial sediments downstream of the site.
’EXPERIMENTAL SECTION
Study Site. Sample locations along the course of the TornaCreek, Marcal, R�aba, and Mosoni-Duna rivers are shown inFigure 1. Land cover across the catchments is dominated byagriculture, with principal urban areas at Ajka, P�apa, and towardthe confluence with the Mosoni-Duna around the town of Gy 00or.Bedrock geology in the upper catchment is dominated bydolomites and limestones of Triassic age which lie beneath asequence of fluvial marls, slates, and interbedded sands ofMiocene age.1 The Torna, Marcal, and R�aba are all extensivelychannelized with levees minimizing floodplain extent, particu-larly downstream of P�apa (Figure 1).Water Analyses.Water and sediment samples were collected
from the locations shown in Figure 1 under consistent low-to-moderate winter flow conditions on December 1 and 2, 2010
(mean daily flow atM4 was 11.5 m3 s�1 on both days). Field dataand water samples were collected according to standard samplingprotocols (see Supporting Information). Major anion concen-trations were determined using a Dionex 100 ion chromatographand cation and minor element concentrations were determinedusing a Perkin-Elmer Elan DRCII inductively coupled plasma�mass spectrometer (ICP-MS; for As, Cr, and Mo) and anOptima 5300 DV ICP-OES for all other elements quotedhereafter.Sediment Samples. At each station triplicate bulk (≈ 500 g)
sediment samples were collected by aggregating three randomlycollected subsamples from a 12m2 area of stream bed (9 separatelocations sampled at each reach to give three replicates). Addi-tional spot samples of transported red mud from floodplaindeposits at Soml�ov�as�arhely (S1), fly ash (that formed thedisposal cell wall), stock-piled gypsum (used to dose waters inthe spill aftermath), and gypsum-affected fluvial sediments weretaken at selected sites. Sediments were homogenized, air-dried,disaggregated gently, and sieved (2 mm aperture) prior tomicrowave-assisted total digestion (aqua regia andHF) followingstandard methods.21 Elemental concentrations in digests wereanalyzed as per aqueous trace element analyses. Selected driedand disaggregated samples from K1 and S1 were also preparedfor SEM/EDS and particle size analysis. Sequential extraction oncombined triplicate samples from the sample stations was under-taken to increase extractant solution/sediment ratio.22 ExtractantpH was checked after each stage and conformed to standardvalues. All statistical analyses were undertaken in Minitab v15.Data were not normally distributed even after log-transformation(Kolmogorov�Smirnov p > 0.05) so nonparametric methodswere used. Principal Component Analysis (PCA) was under-taken on standardized sediment element concentration data.
’RESULTS AND DISCUSSION
Major Ion Chemistry.Reference samples (T2, M1) across theupper catchment are similar in composition, being slightly alka-line, dominated by Ca�Mg�HCO3 type, consistent with watersdraining from the Triassic dolomites (Table 1). Waters at site K1characterize those draining Cell X (Figure 1), which was theactive cell at the western-most end of the disposal site andcontained fine-grained bauxite residue (red mud).1 The K1waters characterize the leachate and red mud suspension preaciddosing, and show Na�CO3�OH dominated waters with hyper-alkaline pH (13.1), low Eh, high suspended solid content (13.3 gL�1), and high SO4
2- concentrations. The K1 site lies at the baseof a permeable reactive fly ash barrier (constructed usingmaterialfrom the dam wall), built within 2 weeks of the accident acrossthe dike breach. Downstream of K1 the waters are directedthrough a series of settlement lagoons and acid dosing units (HCland H2SO4) prior to the confluence of the northerly branch ofthe Torna Creek with its southerly branch (Figure 1). Thedecrease in pH between K1 and K2 is explicable by dilution ofthe waters from Cell X with uncontaminated waters on thenorthern branch of the Torna Creek. Lagoons and check damsshortly downstream of K1 appear effective in substantiallyreducing the suspended solid content of the water, while furtherdecreases in pH are apparent downstream (K3) due to aciddosing (Table 1). While the drainage from K1 represents asignificant point source of hyperalkaline leachate to surfacewaters around the site, there are additional inputs of leachatefrom Cell X into the southerly branch of the Torna Creek
Figure 1. Location map of sample stations (circles). Centers ofpopulation shown with diamonds. Reference site labels in italics.

5149 dx.doi.org/10.1021/es200850y |Environ. Sci. Technol. 2011, 45, 5147–5155
Environmental Science & Technology ARTICLE
Table1.
Hydrochem
icalCom
position
oftheWatersin
theTorna
Creek
andUpp
erMarcalo
nDecem
ber1,2010
a
determ
inand
T2
K1
K2
K3
T1
T3
T4
T5
T6
M1
pH8.30
13.06
10.50
10.08
8.40
8.34
8.46
8.71
8.60
8.31
temperature(�C)
2.8
3.6
4.2
3.9
53.3
2.6
1.3
1.6
0.7
specificconductance(μScm
�2 )
825
162900
3597
1715
1448
1505
1175
1076
966
911
ORP(V
)0.125
0.023
0.057
0.003
0.033
0.054
0.040
0.038
0.111
0.106
meanvelocity(m
s�1 )
0.81
<0.01
0.76
0.21
1.27
1.70
1.04
0.90
0.65
-
major
ions/elementsmgL-
1
Ca
143(138)
1515
(1.3)
89.13(16.86)
37.50(15.21)
213.08
(198.99)
184.91
(175.02)
169.30
(161.52)
140.51
(134.22)
136.76
(132.91)
121.31
(120.80)
Mg
37(36)
9.7(0.001)
21.92(13.29)
12.48(9.02)
53.11(50.58)
45.52(44.56)
39.45(39.07)
38.78(38.38)
36.62(36.39)
41.27(41.36)
K5(5)
115(85)
35.24(35.60)
35.14(35.24)
8.33
(8.04)
11.10(11.39)
8.45
(8.43)
8.68
(8.64)
7.25
(7.15)
7.55
(7.69)
Na
13(12)
(701)
374.15
(369.12)
393.90
(392.73)
68.42(67.25)
139.38
(137.57)
79.10(78.37)
79.59(79.10)
52.85(52.14)
24.30(24.34)
Al
0.2(0.01)
1228
(659)
18.19(11.63)
12.73(9.02)
9.96
(0.25)
9.83
(0.37)
4.01
(0.41)
3.75
(0.64)
1.88
(0.23)
0.22
(0.04)
Cl
2583
49.70
116
34.60
110
50.90
47.20
3731.20
SO4
67727
283
260
363
321
256
185
154
97.40
totalalkalinity
340
7160
570
440
342
334
300
348(316)
298(296)
346(340)
OHcalculated
1125.8
1.10
CO3calculated
2445.8
248
HCO3calculated
414.80
1.40
165.20
536.80
417.24
407.48
366.00
424.56
363.56
422.12
suspendedsolids
49.6
13260
490.0
208.0
139.6
105.6
82.0
87.6
70.8
0.4
traceelem
ents(μgL-
1 )
As
<0.1
3926
(3612)
224(156)
181(147)
108(29)
124(1)
43(4)
37(4)
33(4)
<0.1
B<2
1009
(900)
30(30)
<2<2
<2<2
<2<2
<2Ba
50(46)
297(1)
34(3)
14(3)
45(33)
39(23)
39(27)
39(27)
41(33)
47(45)
Be
<0.1
46(<0.1)
<0.1
<0.1
<0.1
<0.1
<0.1
<0.1
<0.1
<0.1
Cd
<0.1
59(53)
3(<0.1)
<0.1
<0.1
2(<0.1)
<0.1
<0.1
<0.1
<0.1
Co
<117
(<1)
<1<1
<1<1
<1<1
<1<1
Cr
<0.1
356(49)
1.2(0.9)
5.8(4.5)
8.7(5.6)
6.6(4.3)
1.4(<0.1)
4.6(<0.1)
1.0(<0.1)
<0.1
Cu
3(2)
390(310)
15(9)
18(14)
5(2)
5(3)
4(2)
4(2)
3(2)
2(2)
Fe346(<10)
10212(<10)
1080
(<10)
610(<10)
760(<10)
380(<10)
360(<10)
430(<10)
500(<10)
150(<10)
Ga
12(11)
2350
(2340)
129(120)
122(117)
79(31)
72(39)
47(35)
40(37)
22(19)
18(<1)
Li4(4)
303(27)
215(213)
197(197)
22(19)
37(36)
20(20)
20(18)
13(13)
8(7)
Mn
84(39)
9894
(<1)
130(3)
77(8)
208(67)
205(87)
161(81)
175(86)
210(86)
29(20)
Mo
19(11)
5443
(4114)
405(398)
420(416)
77(74)
155(152)
83(78)
93(77)
58(44)
13(11)
Ni
5(<1)
267(36)
6.7(4.5)
6.9(4.6)
9.0(6.0)
8.6(6.1)
7.6(5.9)
8.6(4.5)
9.1(5.8)
1.8(1.4)
Pb12
(2)
<10.00
(0.01)
<1<1
<12(<1)
7(<1)
4(<1)
<1
Si3389
(3211)
499248
(668)
4473
(1524)
2635
(1044)
3808
(2885)
3644
(2588)
3077
(2110)
3062
(2052)
3206
(2609)
3099
(2884)
Sr251(241)
8819
(2)
334(153)
165(107)
909(848)
755(711)
582(557)
553(528)
512(500)
509(499)
V<1
6398
(5709)
334(323)
347(343)
66(26)
103(60)
48(39)
47(41)
35(30)
<1
W<5
510(483)
19(10)
19(9)
<5<5
<5<5
<5<5
Zn
13(10)
446(49)
20(2)
8(1)
27(14)
21(16)
23(13)
16(10)
13(10)
21(19)
aDatapresenttotalvalueswith
filtered(0.45μ
mfilter)datainparentheses.‘<’denotes
values
belowthegivenlim
itof
detection.

5150 dx.doi.org/10.1021/es200850y |Environ. Sci. Technol. 2011, 45, 5147–5155
Environmental Science & Technology ARTICLE
(just upstream of T1) via an acid dosing unit (reflected in SO42-
elevations above reference sites) to the south of Cell X. Thedilution of the contaminated water with progress downstream isreflected in monotonic decrease in Naþ and SO4
2- towardbaseline concentrations, which are achieved toward the confluenceof the R�aba and the Mosoni-Duna.Major and Trace Elements. In hyperalkaline conditions at K1
numerous trace elements are elevated in both the particulate anddissolved phase. Dissolved concentrations of Al, As, Cr, Ga, Mo,Ni, Se, V, and U (Table 1) are similar to those documentedelsewhere.15 Soluble oxy(anionic) species are generally onlydetected in the northern branch of the Torna Creek where pHremains elevated prior to acid dosing (Table 1, Figure S1) andsubsequent dilution at T1�T3. Cr, Ni, Se, and U concentrationsdecrease to baseline (similar to reference site) levels or belowdetection limits by K3, due to changing solubility with thedecrease in pH (from 13.1 to 10.1)17 and dilution. The traceelements for which elevated concentrations in the water columnare seen to propagate furthest downstream are As, Mo, and V(Table 1, Figure S1). These form oxyanions in moderate tohighly alkaline conditions and are a well-documented waterquality issue in waters draining high pH industrial residues.20,23
In the circum-neutral pH, oxic conditions downstream of K3,arsenic would be expected to be immobilized by sorption orcoprecipitation with both hydrous ferric oxide (HFO) and oxidesof Al24,25for which numerous phases are predicted to be over-saturated around source areas. Mass loading data highlight such
rapid attenuation of dissolved As between K3 and T3. Arsenicshows significant (p < 0.05) positive correlation with particulateAl, Ca, and Ti (rs = 0.49�0.54) and no significant (p < 0.05)correlation with Fe, which may be a feature of consistently highFe concentrations throughout the system from both Ajka andnatural lithogeneous sources.At the water pH values measured the element V is predicted to
be present principally as vanadate (VO43-)26 and analysis of
fractions within the water column via sequential filtration high-light a significant portion of V (typically 51�77%) beingtransported in the dissolved phase around the source areas(K1�T3; Figure 2). The total loading of V (Figure 2) staysrelatively constant throughout the lower Torna and into theMarcal. However, the proportion of particulate and colloidal V inparticular becomes more important with distance down theTorna, suggesting sorption and/or (co)precipitation of dissolvedV (Figure 2). There are strong and significant (p < 0.001)correlations between particulate V and all major particulatevectors (Al, Ca, Fe, Si, Ti; rs = 0.76�0.92) alluding to theirimportance in V attenuation and transport.27,28 The total Vconcentrations exceed recommended freshwater EQS29 at theencountered hardness from K1 to T3 at Devecser (5.2 km fromsource) suggesting that the elevated aqueous V concentration isof relatively limited extent due primarily to dilution (given therelatively consistent loading). Similar patterns are evident forMo, with predominant transport in the dissolved phase betweenK1 and K3 (Figure 2). The bulk sediment analyses reports only
Figure 2. Partitioning of load (kg day�1) of selected metals and metalloids with distance downstream of the dike breach alongside suspended solidloading (kg day�1). Particulate loading for major elements only shown in upper left image alongside suspended solids (SS). Note also logarithmic y axison upper left image. All other images show total loading (Δmarker with solid black line), filtered (0.45 μm) loading (bmarker with dashed black line),and dissolved (passes 10 kDa centrifuge filter) loading (2 marker with solid black line).

5151 dx.doi.org/10.1021/es200850y |Environ. Sci. Technol. 2011, 45, 5147–5155
Environmental Science & Technology ARTICLE
moderate concentrations ofMo in the redmud samples (K1a�c:11�18mg kg�1; Table 2), with peak concentrations in the fly ashitself (53 mg kg�1). Whether the enrichment of Mo in K1 watersis enhanced by the dissolution of Mo-bearing phases at pH 13 inthe fly ash20 permeable reactive barrier is uncertain. At the pHvalues measured Mo is predicted to be predominantly present asthe stable molybdate oxyanion (MoO4
2-)26 in the waters of theTorna Creek. With pH changes downstream of K3, colloidalfractions subsequently dominate instream Mo loading, whichlevels off in the Torna before further increase in the Marcal. Nosignificant correlations (p > 0.05) were apparent however forparticulate Mo with any of the major elements in particulatephase (Al, Ca, Fe, Si, Ti) although attenuation by oxides and clayswould be anticipated.29
There is a rapid transition of Al from dissolved phase (at K1)to particulate phases at T2 (Table 1). This is consistent with thedecrease in pH along the north branch of the Torna Creek.Particulate Al loading shows a marked decrease from peakinstantaneous loading of 1540 kg d�1 downstream of K3 andT1 to less than half of that at T6, suggesting significant instreamattenuation via settlement of Al phases during the Torna Creek(Figure 2). After the confluence with the Marcal, loadingincreases again with increased stream competence. Loadingsdata through the Torna Creek highlight a general trend of
increase in Fe, Ti, and Si loading downstream consistent withsuspended solids load trends. Particulate Ca loading curves showmajor gains downstream of Kolont�ar and Devecser (T3) reflect-ing entrainment of both natural fines and gypsum-amendedsubstrates with increasing stream competence. Total suspendedsediment loading in the Torna Creek (Figure 2) highlights theincreasing transport of particulates with transit downstream ofthe site reflecting diffuse inputs (e.g., runoff from red-mud-inundatedland), as well as entrainment of instream sediments. Thishighlights the role of the Torna and upper Marcal catchmentas a net exporter of red-mud-derived sediments under surveyconditions.Bulk Sediment Analyses. Table 2 presents mean bulk con-
centrations of major and trace elements in the fluvial sediments.Of particular note in the source samples (K1) is enrichment ofAs, Ce, Co, Cr, Ni, Pt, U, V, and Zn (Table 2). All are at meanconcentrations slightly higher than initial reports4 and of a similarorder to sites elsewhere.30,31 Concentrations reported at the S1sample are similar to those reported elsewhere after the spill4 andare consistent with the sampling location 10 km downstreamfrom the breach. Table 2 and Figure 3 highlight a general declinein key red-mud-associated trace elements (As, Cd, Co, Cr, Ni,and V) downstream from K1, albeit with several hotspots ofenrichment and some areas of preferential dilution. Low
Table 2. Mean Composition of Digested Fluvial Sediments (n = 3) at Selected Sample Stations on the Torna Creek and MarcalRivera
element K1 FA K2 K3 T1 T3 T4 S1 T5 T6 M2 M1 T2 TEL (PEL)b
Ca 53501 156762 107091 79138 79910 88713 82587 47909 73069 67855 62944 17083 40409
Mg 2982 10336 16105 7111 8733 10650 8831 3674 7718 6741 6045 3859 10534
K 737 1365 10148 5543 5476 7056 6025 2637 5239 4634 4170 8166 9235
Na 39918 2782 6630 19391 21980 16000 19123 43224 26116 29488 32942 5350 9522
Fe 210265 16558 37398 113480 141564 48123 30841 174425 29266 81109 80965 11142 13055
Al 75160 20132 48407 56318 59628 54785 56910 65307 59001 60406 61571 22829 27292
Si 27925 26544 91417 75909 65084 77470 72821 47717 66002 62180 58633 339271 54682
As 78.5 29.9 32.3 51.9 54.3 46.2 50.8 61.3 52.8 54.9 56.3 5.8 1.7 5.9 (17)
Ba 59.8 18.6 174.7 168.4 134.3 159.1 153.9 52.0 121.7 109.2 94.3 183.7 163.9 0.7c
Be 9.1 0.6 1.8 4.6 5.6 1.9 1.2 7.3 1.7 3.5 3.2 0.8 <0.1
Cd 4.0 <0.1 0.6 1.7 2.1 1.5 1.8 2.7 2.0 2.1 2.3 0.3 0.1 0.6 (3.5)
Ce 473.2 8.4 66.4 254.8 264.8 195.3 238.3 422.5 285.4 315.4 341.1 25.5 27.5
Co 97.1 4.9 13.0 52.4 54.1 39.8 48.8 85.3 58.0 64.0 69.1 6.0 8.5 10c
Cr 810.7 43.6 84.4 372.6 422.6 293.2 362.8 592.8 416.3 457.3 488.8 30.3 29.2 37.3 (90)
Cu 60.3 14.9 18.4 42.6 40.5 33.8 39.0 47.6 40.1 42.2 43.3 9.3 15.1 35.7 (197)
Ga 79.3 16.6 28.2 52.9 53.4 44.8 50.4 69.0 54.7 58.0 60.6 8.9 13.0
Li 57.5 30.1 46.6 60.5 54.9 54.0 56.5 65.3 58.6 60.1 61.4 12.7 13.6
Mn 2565.8 182.0 443.6 1606.8 1538.7 1196.4 1447.3 2462.3 1702.0 1870.5 2011.6 292.8 420.8 400c
Mo 14.4 53.0 8.8 7.3 10.1 8.7 8.7 11.2 9.5 9.8 10.2 7.7 5.4
Ni 291.7 26.8 28.3 140.7 153.5 107.5 133.9 246.0 162.5 180.8 196.4 12.5 7.6 18 (35.9)
Pb 79.8 1.8 3.5 39.6 41.0 28.0 36.2 68.1 44.1 49.5 53.9 1.3 2.6 35 (91.3)
Sr 290.2 375.7 214.9 235.0 246.7 232.2 237.9 299.1 256.4 264.5 273.3 91.5 124.3 49c
Ti 24848.2 1249.2 3435.1 12415.5 15073.5 5456.9 4764.7 21474.5 3721.8 9707.5 8019.3 1692.2 3665.2
U 338.5 57.6 36.9 156.9 177.5 123.8 152.7 247.1 174.6 191.5 204.4 <0.5 2.1
V 891.2 185.6 114.8 458.9 488.3 354.0 433.7 743.2 510.3 562.4 605.3 28.9 34.4 50c
Zn 173.2 29.2 58.5 104.3 112.0 91.6 102.7 132.0 108.8 114.5 118.4 26.3 26.6 123 (315)
Zr 628.9 21.2 72.2 323.1 341.4 245.5 303.3 531.8 360.2 398.4 430.2 18.4 35.1aAll values inmg kg�1. Reference samplesM1 andT2 shown on right hand side (italics). FA: fly ash from impoundment wall, S1: floodplain deposit fromSoml�ov�as�arhely. Sb and Se below detection limits of 0.1 mg kg�1 bTEL: Threshold Effects Level; PEL: Predicted Effects Level. c “Background” level. Allfor freshwater sediments.32
5152 dx.doi.org/10.1021/es200850y |Environ. Sci. Technol. 2011, 45, 5147–5155
Environmental Science & Technology ARTICLE
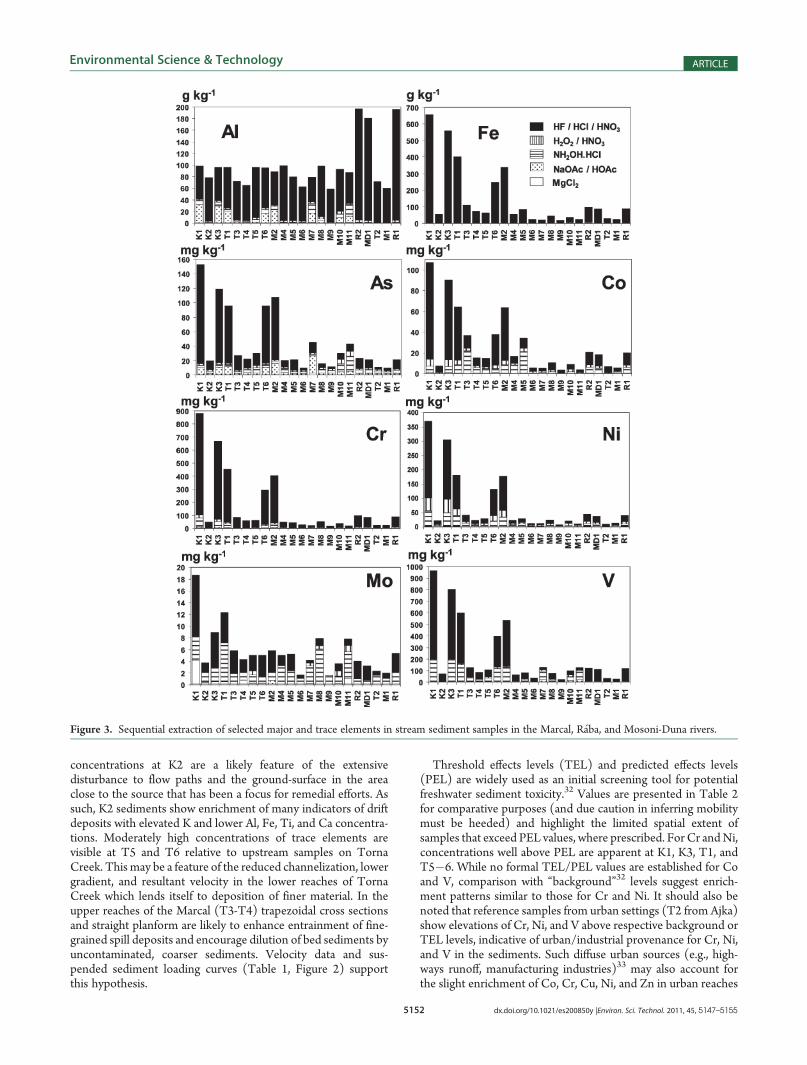
concentrations at K2 are a likely feature of the extensivedisturbance to flow paths and the ground-surface in the areaclose to the source that has been a focus for remedial efforts. Assuch, K2 sediments show enrichment of many indicators of driftdeposits with elevated K and lower Al, Fe, Ti, and Ca concentra-tions. Moderately high concentrations of trace elements arevisible at T5 and T6 relative to upstream samples on TornaCreek. This may be a feature of the reduced channelization, lowergradient, and resultant velocity in the lower reaches of TornaCreek which lends itself to deposition of finer material. In theupper reaches of the Marcal (T3-T4) trapezoidal cross sectionsand straight planform are likely to enhance entrainment of fine-grained spill deposits and encourage dilution of bed sediments byuncontaminated, coarser sediments. Velocity data and sus-pended sediment loading curves (Table 1, Figure 2) supportthis hypothesis.
Threshold effects levels (TEL) and predicted effects levels(PEL) are widely used as an initial screening tool for potentialfreshwater sediment toxicity.32 Values are presented in Table 2for comparative purposes (and due caution in inferring mobilitymust be heeded) and highlight the limited spatial extent ofsamples that exceed PEL values, where prescribed. For Cr andNi,concentrations well above PEL are apparent at K1, K3, T1, andT5�6. While no formal TEL/PEL values are established for Coand V, comparison with “background”32 levels suggest enrich-ment patterns similar to those for Cr and Ni. It should also benoted that reference samples from urban settings (T2 from Ajka)show elevations of Cr, Ni, and V above respective background orTEL levels, indicative of urban/industrial provenance for Cr, Ni,and V in the sediments. Such diffuse urban sources (e.g., high-ways runoff, manufacturing industries)33 may also account forthe slight enrichment of Co, Cr, Cu, Ni, and Zn in urban reaches
Figure 3. Sequential extraction of selected major and trace elements in stream sediment samples in the Marcal, R�aba, and Mosoni-Duna rivers.

5153 dx.doi.org/10.1021/es200850y |Environ. Sci. Technol. 2011, 45, 5147–5155
Environmental Science & Technology ARTICLE
of the R�aba and Mosoni-Duna (samples R2 and MD1, Table 2).Cd samples only show significant enrichment above PEL valuesat site K1. Arsenic enrichment is apparent in source samples andon the Marcal at downstream stations M5 and M9 (Figure 3).PCA analysis (Figure 4) highlights the key indicators of the red
mud in the fluvial sediments and shows the mixing gradient withprogression through the Torna Creek, Marcal, R�aba, and Mosoni-Duna Rivers. Reference sediments (R1, T2, M1) are indicatedby elevated Ba, Mg, and K relative to red-mud-contaminatedsediments and indicative of lithogeneous weathering (dolomitesand drift deposits1). PCA axis 1 shows the rapid dilution of redmudfrom K1 through Torna Creek, with occasional red-mud-enriched
samples from the upper Marcal (M2). The second axis is character-ized by theCa-rich, gypsum-amended substrates in the lowerMarcal(M11), which plots close to the fly ash sample from the dam wallgiven similar Ca content. Gypsum dosing of stream waters tookplace from Kolont�ar to R�abaszentmih�aly (Figure 1) at bridgecrossings and stream access points to neutralize waters.6
Sequential extraction data (Figure 3) show the majority ofpotential contaminants in the HF/aqua-regia step. This supportsinterpretation of previous site data with regard to the relativelylimited potential bioavailability of many trace elements.4 High Alconcentrations in the residual fraction are apparent in bothundisturbed and impacted samples. Enrichment of Al in the
Figure 4. PCA of total fluvial sediment elemental concentrations in the studied rivers. Figures show PCA biplot by site (left image) and witheigenvectors for analyzed elements (right image).
Figure 5. SEM and particle size distribution of samples K1 (source material) and S1 (transported red mud). EDS spectra for point “a” in S1.
5154 dx.doi.org/10.1021/es200850y |Environ. Sci. Technol. 2011, 45, 5147–5155
Environmental Science & Technology ARTICLE
NaOAc and NH2OH 3HCl steps is apparent in source samplesand suggests reasonable quantities of Al that could be trans-formed in suitable redox settings. Although significant inven-tories of Fe are associated with the NH2OH 3HCl step(800�3300 mg kg�1), they represent only a fraction of the totalFe concentration, which is largely present as stable, well-crystallized,residual phases, such as hemeatite which is usually extractedin step 5.5,34 Cr, Co, and Ni show broadly similar patterns withresidual phases predominant, similar to patterns reported atother sites.31 H2O2 and NH2OH 3HCl extracts contain increas-ing concentrations of Ni and Co downstream, while a smallnumber of the heavily red-mud-impacted sediments (e.g., K3,T1, T6, M1) report moderate Cr inventories in weakly extrac-table phases such as amorphous Fe/Mn oxides and carbonates.For themoremobile elements in the aqueous phase (As,Mo, andV),greater proportions are found in nonresidual phases in trans-ported samples in the lower Torna Creek and upper Marcal. Asignificant portion of V is associated with the NH2OH 3HClextraction (16�60%) in samples downstream of source areas,while between 22 and 77% of Mo is associated with this fraction,suggesting the importance of oxides in attenuation of Mo and V.The importance of residual phases declines for As from sourcematerial (90%) with progress downstream (minimum of 24% atM11). Concentrations of As in the NaOAc and NH2OH 3HClextraction phases reach up to 26 mg kg�1 at M7. These patternsfor As, Mo, and V are likely to reflect instream attenuationprocesses (e.g., sorption to readily extractable Fe, Al oxides, andcarbonate phases) during transit through the system, throughwhich dissolved loads typically decline (Figure 2).SEM and Particle Size Analysis. SEM analysis (Figure 5) of
source material (sample K1) highlights predominant fine grainedmaterial (<4 μm in diameter) which follows a bimodal distribu-tion comprising (1) larger, plate-like particles (diameter typically1�6 μm), and (2) finer, more rounded particles of diameter50�100 nm typically forming as aggregates up to 1 μm in size.The former are rich in Al, Si, and Na with significant Ca, S, Fe,and Ti (Supporting Information), consistent with cancrinitewhich has been identified elsewhere in samples from the site.5
EDS spectra from the finer fractions shows consistent enrich-ment with Fe and O indicative of iron oxide phases (e.g.,hematite) being largely hosted in these smaller particles. Thesenanoparticulate aggregates are likely to be driving the observedpattern of increasing suspended solid loading through the TornaCreek and Marcal River and are likely to be readily entrainedeven under low velocities. Analysis of transported floodplainsamples (S1) shows an additional group of particles 10�40 μmin diameter indicative of entrainment of uncontaminated surfacesediments (hence dilution of total concentrations at S1) in thedownstream floodplain deposits (Figure 5).Implications for System Recovery. The particularly fine-
grained nature of the contaminant-bearing phases in red mud isin contrast to most river systems impacted by accidental con-taminant release. Most examples of tailings failure concernmetalliferous, acidic, and/or cyanide-rich materials, where sedi-ment-borne contaminants are concentrated in fractions of theorder of 10�500 μm35 and the signal of metal contaminationremains in the river system several years after the spill.36 The datafrom this study suggest that within-channel storage of largeinventories of red mud appears to be relatively limited in extent.Even where moderately high concentrations of trace elements(e.g., As, Cr, V) are reported, they are predominantly associatedwith residual phases suggesting limited potential mobility in the
environment. At some depositional hotspots, association of As,Cr, and V with weak acid and oxalate extractable phases givesscope for some future mobility and should be the focus forlonger-term study. Given the volume of material that wasreleased from the impoundment and the relatively low gradientof the river system downstream of Ajka (mean gradient of0.93 m km�1), the rapid dilution of sediment-borne contami-nants is encouraging and likely to reflect the preferential trans-port out of the system of the <10 μm fractions that characterizethe released material.
’ASSOCIATED CONTENT
bS Supporting Information. Detailed methods, EDS spectra,contaminant correlation, and mineral phase data.This material isavailable free of charge via the Internet at http://pubs.acs.org.
’AUTHOR INFORMATION
Corresponding Author*Tel: þ44(0)1723357292; fax: þ44(0)1723370815; e-mail:[email protected].
’ACKNOWLEDGMENT
This work was funded by the UK Natural EnvironmentResearch Council (grant NE/I019468/1). We are indebtedto Bob Knight (University of Hull), Jane Davis (NewcastleUniversity), Eric Condliffe and Gareth Keevil (both Universityof Leeds) for analyses. We also thank M�aria Tolner, ErmeseVaszita (Budapest University of Technology and Economics) forfield support; Gyozo Jordan (Geological Institute of Hungary),Kovacs Laszlo and Istv�an Csonki (Central Danubian Water andEnvironment Authority) for site information; Gy€orgy Istv�anT�oth for flow data and Krisztina Kocsis (British Embassy) forfacilitating site access.
’REFERENCES
(1) Reeves, H. J.; Wealthall, G.; Younger, P. L. Advisory visit to thebauxite processing tailings dam near Ajka, Vespr�em County, westernHungary; British Geological Survey, Keyworth, UK, 2011; Open ReportOR/11/006.
(2) Cairns, J.; Dickson, K. L.; Crossman, J. S. The biological recoveryof the Clinch River following a fly ash pond spill. In 25th Industrial WasteConference Proceedings; Purdue University, West Lafayette, Indiana,1972; pp182�192.
(3) Younger, P. L.; Banwart, S. A.; Hedin, R. S. Mine Water:Hydrology, Pollution, Remediation; Kluwer Academic Publishers, Holland,2002.
(4) Ruyters, S.; Mertens, J.; Vassilieva, E.; Dehandschutter, B.;Poffijn, A.; Smolders, E. The red mud accident in Ajka (Hungary):Plant toxicity and trace metal bioavailability in red mud contaminatedsoil. Environ. Sci. Technol. 2011, 45, 1616–1622.
(5) Gelencs�er, A.; Kov�ats, N.; Tur�ooczi, B.; Rost�asi, �A.; Hoffer, A.;Imre, K.; Nyir 00o-K�osa, I.; Cs�akber�enyi-Malasics, D.; T�oth, �A.; Czitrovsky,A.; Nagy, A.; Nagy, S.; �Acs, A.; Kov�acs, A.; Ferincz, �A.; Harty�ani, Z.;P�osfai, M. The red mud accident in Ajka (Hungary): Characterizationand potential health effects of fugitive dust. Environ. Sci. Technol. 2011,45, 1608–1615.
(6) Gruiz, K. Environmental Information: The red mud catastrophe inHungary. http://enfo.agt.bme.hu/drupal/en/gallery/8081 2010.
(7) Power, G.; Gr€afe, M.; Klauber, C. Review of Current BauxiteResidue Management, Disposal and Storage: Practices, Engineering andScience; CSIRO Document DMR-3608, 2009.

5155 dx.doi.org/10.1021/es200850y |Environ. Sci. Technol. 2011, 45, 5147–5155
Environmental Science & Technology ARTICLE
(8) Palmer, S. J.; Frost, R. L.; Nguyen, T. Hydrotalcites and their rolein coordination of anions in Bayer liquors: anion binding in layereddouble hydroxides. Coord. Chem. Rev. 2009, 253, 250–267.(9) Somlai, J.; Jobb�agy, V.; Kov�acs, J.; Tarj�an, S.; Kov�acs, T.
Radiological aspects of the usability of red mud as building materialadditive. J. Hazard. Mater. 2008, 150, 541–545.(10) Courtney, R. G.; Timpson, J. P. Reclamation of fine fraction
bauxite processing residue (red mud) amended with coarse fractionresidue and gypsum. Water, Soil Air Pollut. 2005, 164, 91–102.(11) Zijlstra, J. J. P.; Dess, R.; Peretti, R.; Zucca., A. Treatment of
percolate from metal sulphide mine tailings with a permeable reactivebarrier of transformed red mud. Water Environ. Res. 2010,82, 319–327.(12) Feigl, V.; Uzinger, N.; Gruiz, K. Chemical stabilisation of toxic
metals in soil microcosms. Land Contam. Reclam. 2009, 17, 485–496.(13) Munro, L. D.; Clark, M. W.; McConchie., D. A BauxsolTM-
based permeable reactive barrier for the treatment of acid rock drainage.Mine Water Environ. 2004, 23, 183–194.(14) Khaitan, S.; Dzombak, D. A.; Lowry, G. V. Neutralization of
bauxite residue with acidic fly ash. Environ. Eng. Sci. 2009, 26, 431–440.(15) Czop, M.; Motyka, J.; Sracek, C; Szuwarzynski, O. Geochemistry
of the hyperalkaline Gorka Pit Lake (pH > 13) in the Chrzanow Region,Southern Poland.Water, Air Soil Pollut. 2011, 214, 423–434.(16) Wilkie, M. P.; Wood, C.M. The adaptations of fish to extremely
alkaline environments. Comp. Biochem. Physiol. 1996, 113B, 665–673.(17) Langmuir, D. Aqueous Environmental Geochemistry; Prentice-
Hall: Upper Saddle River, NJ, 1997.(18) Mayes, W. M.; Younger, P. L.; Aumonier, J. Hydrogeochemistry
of alkaline steel slag leachates in the UK. Water, Air Soil Pollut. 2008,195, 35–50.(19) Stewart, D. I.; Burke, I. T.; Hughes-Berry, D. V.; Whittleston,
R. A. Microbially-mediated chromate reduction in soil contaminated byhighly alkaline leachate from chromium containing waste. Ecol. Eng.2010, 36, 211–221.(20) Cornelis, G.; Johnson, C. A.; Van Gerven, T.; Vandecasteele, C.
Leaching mechanisms of oxyanionic metalloid and metal species inalkaline solid wastes: a review. Appl. Geochem. 2008, 23, 955–976.(21) USEPA.Microwave assisted acid digestion of siliceous and organically
based matrices; USEPA Method 2052; Washinton, DC, 1996(22) Rauret, G.; Rubio, R.; Lopez-Sanchez, J. F. Optimization of
Tessier Procedure for Metal Solid Speciation in river sediments. Int. J.Environ. Anal. Chem. 1989, 36, 69–83.(23) F€allman, A.-M. Leaching of chromium and barium from steel
slag in laboratory and field tests� a solubility controlled process?WasteManage. 2000, 20, 149–154.(24) Gupta, S. K.; Chen, K. Y. Arsenic removal by adsorption.
J. Water Pollut. Control Fed. 1978, 50, 493–506.(25) Dzombak, D. A.; Morel, F. M. M. Surface Complexation Model-
ling: Hydrous Ferric Oxide; Wiley-Interscience: New York, 1990.(26) Takeno, N. Atlas of Eh-pH Diagrams: Intercomparison of Ther-
modynamic Databases; Geological Survey of Japan, Open File Report no.149, 2005.(27) Naeem, A.; Westerhoff, P.; Mustafa, S. Vanadium removal by
metal (hydr)oxide adsorbents. Water Res. 2007, 41, 1596–1602.(28) W€allstedt, T.; Bj€orkvald, L.; Gustafsson, J. P. Increasing
concentrations of arsenic and vanadium in (southern) Swedish streams.Appl. Geochem. 2010, 25, 1162–1175.(29) Goldberg, S.; Forster, H. S.; Godfrey, C. L. Molybdenum
adsorption on oxides, clay minerals and soils. Soil Sci. Soc. Am. J. 1996,60, 425–432.(30) Khaitan, S.; Dzombak, D. A.; Lowry, G. V. Chemistry and acid
neutralization capacity of bauxite residue. Environ. Eng. Sci. 2009,26, 873–881.(31) Ghosh, I.; Guha, S.; Balasubramaniam, R; Kumar, A. V. R.
Leaching of metals from fresh and sintered red mud. J. Hazard. Mater.2011, 185, 662–668.(32) Buchman, M. F. NOAA Screening Quick Reference Tables;
NOAA HAZMAT Report 99-1; Coastal Protection and Restoration
Division, National Oceanic and Atmospheric Administration: Seattle,WA, 1999; 12 pp.
(33) Westerlund, C.; Viklander, M.; B€ackstr€om, M. Seasonal varia-tions in road runoff quality in Lule�a, Sweden. Water Sci. Technol. 2003,48, 93–101.
(34) Xiao-Quan, S; Bin, C. Evaluation of sequential extraction forspeciation of trace metals in model soil containing natural minerals andhumic acid. Anal. Chem. 1993, 65, 802–807.
(35) Hudson-Edwards, K. A.; Macklin, M. G.; Jamieson, H. E.;Brewer, P. A.; Coulthard, T. J.; Howard, A. J.; Turner, J. N. The impactof tailings dam spills and clean-up operations on sediment and waterquality in river systems: the Ríos Agrio�Guadiamar, Aznalc�ollar, Spain.Appl. Geochem. 2003, 18, 221–239.
(36) Macklin, M. G.; Brewer, P. A.; Balteanu, D.; Coulthard, T. J.;Driga, B.; Howard, A. J.; Zaharia, S. The long term fate and environ-mental significance of contaminant metals released by the January andMarch 2000 mining tailings dam failures in Maramures County, upperTisa Basin, Romania. Appl. Geochem. 2003, 18, 241–257.