dispersion of carbon nanotubes in polyamide 6 for ... polym...limitations to the preparation of...
TRANSCRIPT
ORIGINAL PAPER
Dispersion of carbon nanotubes in polyamide6 for microinjection moulding
Tânia Ferreira & Maria Conceição Paiva &
António J. Pontes
Received: 7 March 2013 /Accepted: 10 October 2013# Springer Science+Business Media Dordrecht 2013
Abstract The focus of this study was to investigate thedispersion state of pure and functionalized carbon nanotubesin polyamide 6, on composites prepared by twin-screwextrusion and then processed by microinjection moulding.Nanocomposites were prepared with different carbonnanotube compositions, with and without functionalization.The nanotubes were functionalized by the 1,3-dipolarcycloaddition reaction. The dispersion of the carbon nanotubeagglomerates was quantified using optical microscopy andimage analysis. The effect of functionalization on thepolyamide 6/carbon nanotube interface, the nanocompositemorphology and the mechanical and electrical properties werestudied. It was observed that the microinjected compositeswith functionalized carbon nanotubes presented improveddispersion, with smaller carbon nanotube agglomerate arearatio compared to the composites with pure nanotubes. Thefunctionalized nanotubes showed better adhesion topolyamide 6 compared to pure nanotubes, as observed byscanning electron microscopy. The incorporation of carbonnanotubes considerably improved the mechanical properties.The effect of high polymer shear rate on carbon nanotubealignment during microinjection moulding was assessed bycomparing the electrical resistivity of the composite afterextrusion and after microinjection moulding, through thethickness and along the flow direction. The experimentsshowed that the mould design and processing conditionssignificantly affected electrical resistivity.
Keywords Carbon nanotubes . Functionalization .
Dispersion .Microinjectionmoulding
Introduction
The investigation of polymer nanocomposites and thedevelopment of new nanostructured materials have attractedconsiderable interest in recent years, aiming at applicationsthat require high performance and exceptional electrical andmechanical properties.
Carbon nanotubes (CNT) have attracted the attention ofresearchers in various fields such as chemistry, physics,materials science and engineering, due to their uniquestructure, large aspect ratio, low density, exceptional thermaland electrical conductivity, and mechanical properties [1, 2].Several potential applications have been proposed for CNT,including those involving the production of nanocompositeswith polymer matrices [3, 4]. In this area, polymer-basednanocomposites are particularly interesting, due to the easeof fabrication, the range of shapes that may be produced andthe possibility of miniaturization [5].
The main challenge is to convey the excellent properties ofCNT to the composites, to form electrically conductivematerials with significantly enhanced mechanical properties,at low filler contents. The composite percolation thresholddepends on several parameters such as the type of CNT, thematrix composition and morphology, and the filler dispersionstate [1, 6].
Nanocomposite properties are limited by the ability toconveniently disperse the CNT in the polymer, forming aconductive network. The optimization of the composite’smechanical properties also depends on the ability to extensivelydisperse the CNT agglomerates, and to establish a strong CNT-polymer interface. The chemical inertia of the CNTs surface andweak interactions between the CNTs and most polymers are
T. Ferreira :M. C. Paiva (*) :A. J. PontesDepartment of Polymer Engineering, Institute for Polymers andComposites/I3N, University of Minho, 4800-058 Guimarães,Portugale-mail: [email protected]
M. C. Paivae-mail: [email protected]
J Polym Res (2013) 20:301DOI 10.1007/s10965-013-0301-7
limitations to the preparation of nanocomposites with goodmechanical properties. The chemical modification of the CNTsurface to improve the compatibility with the polymer is astrategy that is proving to be efficient for the enhancement ofthe composite’s properties. For example, Li et al. [7] increasedthe compatibility and dispersion ofmultiwall CNTs in polyamide6 (PA6) by amino-functionalization. CNT functionalization mayenhance their dispersion, but its main role is expected to be theestablishment of efficient load transfer from the polymer to thenanotube network [2]. Liu et al. improved the elastic modulusand yield strength of PA6 composite prepared via melt mixingand compression moulding, attributing this to good dispersionand adhesion [8]. The improvement in mechanical propertiesand changes in the crystallization behaviour of the PA6composites prepared by melt compounding and microinjectionmoulding were associated to CNT functionalization byamidation that improved wettability and dispersion [9].
The dispersion of CNT in the polymer to the exact levelrequired for the establishment of a CNT network with the lowerCNT content possible, together with a good CNT-polymerinterface, appear to be the key factors for the formation ofnanocomposites with good mechanical and electrical properties.Thus, the characterization of the CNTdispersion level is importantfor the understanding of the nanocomposite physical andmechanical properties. The study of the agglomerate dispersionmechanisms inmelt mixing reported byG. R.Kasaliwal et al. [10]provides an interpretation based on agglomerate rupture anderosion mechanisms. The authors concluded that CNTagglomerate dispersion by rupture mechanism requires less timeand high shear stress, whereas at low shear stress the erosionmechanism dominates, requiring a longer time to act. Opticalmicroscopy (OM) was used to investigate the CNT agglomeratemorphology in the composites, to quantify CNT dispersion anddistribution and to analyze the presence of remaining primaryagglomerates, and may help to establish a relationship betweenstructure, properties and process conditions [3].
Several processing methods such as solution mixing [11], insitu polymerization [12] and melt-mixing [13–17] have beentried to produce homogeneous dispersion of CNTs in a polymermatrix. Among these, melt mixing with thermoplastic polymersis the more convenient given its compatibility with currentindustrial practices, higher yield and solvent free procedure.In this area, only a small number of studies report mi-croinjection molding (μIM) as the method of shaping theconductive polymer composites, and its influence on thecomposite properties [18, 19].
The process of μIM is one of the most efficient and economicprocesses for the large-scale production of thermoplastic polymermicroparts with high precision, with the ability to producecomplicated 3D parts for the miniaturization of components.This is a global trend for application in many industrial sectors:automotive, aeronautics, telecommunications, electronics,biomedical, informatics [5]. Significant work on μIM was
reported along the last decade, most of it concerning neatpolymers [20, 21]. The complex thermomechanical historyimposed on the polymer, extreme injection pressure, high shear,elongational flow, cooling rate and very short cycle time,influence the polymer morphology [22]. When formingnanocomposite parts, these processing conditions affect theestablishment of a nanotube network, and thus thenanocomposite properties. For the composite electricalproperties, it was reported that the percolation threshold isusually found to be higher for thermoplastic matrices. Abassiet al. [19] concluded that the shear flow in theμIM process couldinduce significant CNT alignment, decreasing CNTcontact, andshifting the percolation threshold to higher filler contents. Theyreported a percolation threshold of 9 wt. % forμIM PC/MWNTcomposites, compared to 3 wt. % observed for compressionmoulded samples. For polyamide nanocomposites the reportedvalues of the percolation thresholdwere found to be in the rangeof 2,5-7 wt. % for melt-mixed and compression moulded films[6] and 4–6 wt. % for injection moulded samples [15].
According to theoretical investigations using Monte Carlosimulations, a minimum resistivity occurs for a partially alignedrather than for a perfectly aligned nanotube film and, when theCNT are highly aligned, the resistivity strongly depends on themeasurement direction, increasing two orders of magnitudewhen alignment and measurement directions are not similar[23]. Recently, Mahmoodi et al. compare the electricalresistivity in the flow and thickness directions for μIM sampleswith different mold cavities and compression molding [24].They concluded that μIM through an edge gate led to highervolume resistivity in the flow direction and lower in thethickness direction, compared to μIM through a fan gate.
In the present workμIMwas used to produce nanocompositespecimens based on PA 6 and CNTs. The CNTs and PA 6 weremelt blended by mini twin screw extrusion and processed byμIM to mold micro-size test bars. The CNTs used were asreceived and chemically functionalized, using a non-aggressive chemical procedure that covalently bonds pyrrolidinegroups to the CNTsurface [25, 26]. This procedure modifies theCNT surface without breaking or oxidizing the CNT. Theinfluence of the processing steps on the CNT dispersion statewas analyzed by OM and scanning electron microscopy. Thecomposites were characterized in terms of the electricalconductivity and tensile properties.
Experimental section
Carbon nanotube functionalization and characterization
The CNT used were NC7000 from Nanocyl, Belgium. Theywere chemically functionalized using the 1,3 – dipolarcycloaddition reaction of azomethine ylides using theexperimental route described in [27].
301, Page 2 of 9 J Polym Res (2013) 20:301
The amino acid used was N-benzyloxycarbonylglycine (Z-gly-OH, 99 %, from Aldrich). Paraformaldehyde (reagent gradefrom Sigma) was used to form formaldehyde by thermaldecomposition. The reagents were blended in a 1:5 molar ratio.The mixture of reagents and CNT was suspended in a smallvolume of diethyl ether, sonicated during 3 min and heated in around bottom flask until total evaporation of the solvent. Then,the mixture was heated for 3 h at 250 °C. The resulting CNTwere washed with ethanol, filtered and dried. The functionalizedCNTwere analyzed by thermogravimetric analysis (TGA) on aTA Q500, and by X-ray photoelectron spectroscopy (XPS), onan AxiS Ultra photoelectron spectrometer.
Preparation of carbon nanotube/polyamide 6 composites
The nanocomposites were prepared by melt mixing PA6(Badamid®B70) with 1, 1.5, 3 and 4.5 wt. % of nonfunctionalized CNT (p-CNT) and functionalized CNT (f-CNT) on a mini twin-screw extruder. The operating variableswere temperature, throughput and screw speed. Thetemperature profile selected was 245, 255, 255, 255 and235 °C from feeding zone to die. The throughput was keptconstant at 120 g/h.
The extruded nanocomposites were microinjectionmoulded using a Boy 12 A. The microinjection mouldingmachine has an injection screw of ∅14 mm (Dr Boy,Germany) that combines technical characteristics requiredfor microinjection and affordability. The injection mouldingcell also includes a mould temperature regulator and anexternal control unit for the cartridge heaters used in thetemperature control system of the mould. The Boy 12 Amachine is able to meter an injection volume of 0.1 cm3 at ahigh flow rate, up to 15.6 cm3 s−1. The injection pressure islimited to 240 MPa.
μIM of the PA/CNT nanocomposites was carried out at atemperature profile in the injection unit ranging from 210,220, 230, 235, 245 to 270 °C, under a pressure of 100 bar,while the speed was kept constant at 240 mm/s. The moldtemperature was optimized and kept at ~100°C.
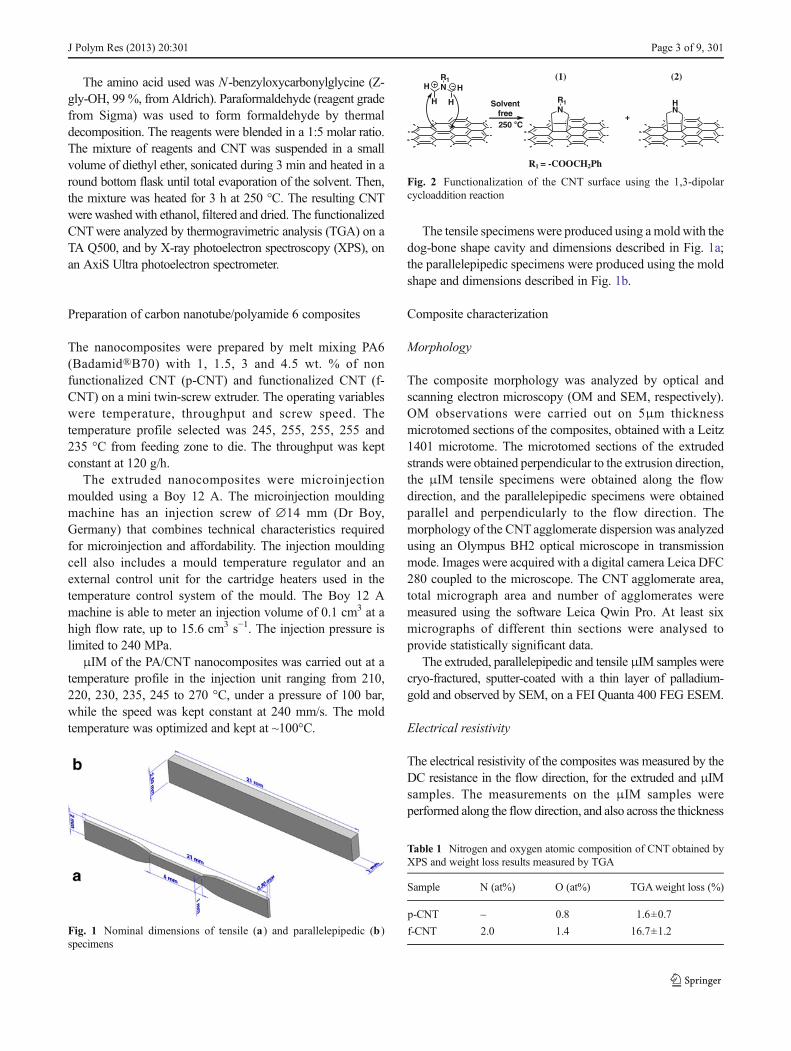
The tensile specimens were produced using a moldwith thedog-bone shape cavity and dimensions described in Fig. 1a;the parallelepipedic specimens were produced using the moldshape and dimensions described in Fig. 1b.
Composite characterization
Morphology
The composite morphology was analyzed by optical andscanning electron microscopy (OM and SEM, respectively).OM observations were carried out on 5μm thicknessmicrotomed sections of the composites, obtained with a Leitz1401 microtome. The microtomed sections of the extrudedstrands were obtained perpendicular to the extrusion direction,the μIM tensile specimens were obtained along the flowdirection, and the parallelepipedic specimens were obtainedparallel and perpendicularly to the flow direction. Themorphology of the CNTagglomerate dispersion was analyzedusing an Olympus BH2 optical microscope in transmissionmode. Images were acquired with a digital camera Leica DFC280 coupled to the microscope. The CNT agglomerate area,total micrograph area and number of agglomerates weremeasured using the software Leica Qwin Pro. At least sixmicrographs of different thin sections were analysed toprovide statistically significant data.
The extruded, parallelepipedic and tensile μIM samples werecryo-fractured, sputter-coated with a thin layer of palladium-gold and observed by SEM, on a FEI Quanta 400 FEG ESEM.
Electrical resistivity
The electrical resistivity of the composites was measured by theDC resistance in the flow direction, for the extruded and μIMsamples. The measurements on the μIM samples wereperformed along the flow direction, and also across the thickness
Fig. 1 Nominal dimensions of tensile (a) and parallelepipedic (b )specimens
NR1
H
H
H
HNR1 H
NSolvent
free250 C
+
R1 = -COOCH2Ph
(1) (2)
°
Fig. 2 Functionalization of the CNT surface using the 1,3-dipolarcycloaddition reaction
Table 1 Nitrogen and oxygen atomic composition of CNT obtained byXPS and weight loss results measured by TGA
Sample N (at%) O (at%) TGAweight loss (%)
p-CNT – 0.8 1.6±0.7
f-CNT 2.0 1.4 16.7±1.2
J Polym Res (2013) 20:301 Page 3 of 9, 301

for the parallelepipedic samples. For the measurements in theflow direction, samples with approximately 2–3 mm lengthwere cut fromμIM parallelepiped samples and extruded strands,while for tensile specimens the surface was polished to removethe insulating thin layer of polymer previously observed byOM.The same procedure was used for the μIM parallelepipedsamples, for resistance measurements across the thickness. Thecontact area was coated beforehand with a thin layer of silverlacquer (Agar Scientific Batch No. O416) to ensure goodcontact of the sample surface with the electrodes.
The measurements were carried out at room temperatureusing a Picoamperimeter/voltage source Keythley 6487equipped with a two probe test fixture. For each sample theI -V curves were obtained in the range of −10 V to 10 V, andthe resistance was determined from the slope of the curve. Theresistance was then converted to volume resistivity accountingfor the sample geometry.
Mechanical properties
The tensile tests were performed on a Instron 4505 at roomtemperature, at a constant speed of 5 mm/min, 14 mm ofgauge length, and using a load cell of 1 kN. The tensilestrength, elongation at break and Young’s modulus weremeasured. The reported values are an average over six testedspecimens, for each composition and condition.
Results and Discussion
CNT functionalization and characterization
The 1,3-dipolar cycloaddition reaction was carried out usingan α-amino acid and an aldeyde, under solvent freeconditions, as described elsewhere [27]. The dipole formedmay react with the CNT surface through cycloaddition,forming pyrrolidine groups at the CNTsurface, as representedin Fig. 2. The pyrrolidine groups may establish stronginteractions with the amide groups of PA6, thus it is expectedto improve the CNT/PA6 interface, and the impregnation ofthe CNT agglomerates by the polymer. Thus, thefunctionalization is expected to improve the polymer/CNTinterface and facilitate the CNT dispersion.
Based on a previous study [25], it was observed that thereaction may yield two products: benzyl carbamate cycloadduct(1) and/or pyrrolidine (2) on the CNT surface.
According to XPS results for as received and functionalizedCNT (Table 1) and considering that the increase in N
0
0.02
0.04
0.06
0.08
80
84
88
92
96
100
100 200 300 400 500 600 700 800
Der
iv. W
eig
ht
Wei
gh
t /
%
T / °C
p-CNT
f-CNT
f-CNT
Fig. 3 Thermogravimetric analysis plots for as received andfunctionalized CNT, and the TGA curve derivative
10 µm
2 µm
10 µm
2 µm
a
c
b
d
Fig. 4 SEM micrographs of asreceived (a and c) andfunctionalized (b and d) CNT
301, Page 4 of 9 J Polym Res (2013) 20:301

concentration is attributed to groups 1 and 2, the degree offunctionalization is 2.0 % of functional groups relative to Catoms. Since the increase in oxygen concentration results fromthe O present in the protective group of the cyclic amine 1, thechemical composition of the functional groups was estimated tobe approximately 15 % of benzyl carbamate, 1 , and 85 % ofpyrrolidine, 2 .
The thermal stability of the f-CNT in dry conditions wasinvestigated and compared to p-CNT. The correspondingTGA curves are depicted in Fig. 3 and the weight losspresented in Table 1.
The as received and functionalized CNT were observed bySEM. Figure 4 shows representative images at twomagnification
levels. Higher magnifications, Fig. 4c and d reveals longentangled CNT bundles, for p-CNT and f-CNT, demonstratingthe mild nature of the functionalization route.
Study of carbon nanotube dispersion
OM was used to measure the area of the CNT agglomeratesobserved on composite sections and to assess their distributionin the polymer. The micrographs obtained by OM wereanalyzed, and all the CNT agglomerates with area greater than5 μm2 were measured. The average agglomerate area, numberof agglomerates per unit area, and agglomerate area ratio definedas the ratio of the total area covered by agglomerates to the total
Fig. 5 a to d represent the cumulative area ratio for the composites prepared by extrusion (dashed line) and μIM tensile (continuous line); e comparesthe cumulative area ratio for the composites obtained from μIM tensile (continuous line) and parallelepipedic specimens (dotted line)
J Polym Res (2013) 20:301 Page 5 of 9, 301

composite area analyzed, AR, were determined. The variation ofthe cumulative agglomerate area ratio distribution, F, with thearea of the agglomerates, illustrates the major characteristics ofthe non-dispersed CNT fraction, as explained elsewhere [26].This representation is obtained by ranking the agglomerateareas measured, Ai, in increasing order of magnitude andplotting their cumulative area (the sum of the agglomerateareas ∑i =1
j Ai, from the smaller to the jth agglomerate, dividedby the total agglomerate area, A=∑i =1
n Ai) as a function of theagglomerate areas Aj. This is represented in Fig. 5 for thecomposites with 1, 1.5, 3 and 4.5 wt. % of p-CNT and f-CNT.The plots highlight the fraction of agglomerates with areassmaller than 250 μm2 present in each composite. The resultsshow that the composites obtained after extrusion under thecurrent processing conditions presented the larger CNTagglomerates, while after μIM the fraction of smallagglomerates increased considerably. The effect of CNTfunctionalization was, for most of the composites, to reducethe size of the CNT agglomerates.
Figure 5e compares the cumulative agglomerate area ratiofor μIM composites obtained with tensile and parallelepipedicspecimenmolds. It was observed that the shape of the μI moldaffected the CNT agglomerate size, the mold with smallerthickness (Fig. 1a) leading to the composites with smallerCNT agglomerates.
While the cumulative area ratio distributions obtainedcompare the morphology of the CNT agglomerates formedunder the different composite processing conditions, it doesnot provide information about the CNT fraction that waseffectively dispersed during the process. The latter may beassessed by the AR, that is inversely proportional to thedispersion level: the smaller the composite area covered withCNT agglomerates, the larger the fraction of CNTs that wereeffectively dispersed. Figure 6 illustrates how the differentprocessing steps and CNT functionalization affected the AR.
Figure 6 shows that, except for the lower p-CNTcomposition, AR was always larger for the extruded composites.Thus, the μIM step performed after composite extrusionimproved the level of CNT dispersion. Functionalizationenhanced CNT dispersion for the μIM composites, but thiseffect was not systematically observed for the extrudedcomposites. For all compositions, μIM composites presentedthe lowest AR values.
Optical micrographs of the nanocomposites with 4.5 wt.%of f-CNT or p-CNT revealed differences in the CNTagglomerate size, shape and number, as illustrated in Fig. 7.The CNTagglomerates in the extruded nanocomposites showa circular shape while the agglomerates in μIM samplespresent an elongated shape in the flow direction.
The cryo-fractured composites were observed by SEM, tomonitor the dispersion of the non-agglomerated CNT. Thecross-sections of the extruded and μIM composites, and in thelatter case, the tensile and parallelepipedic bars, formed with p-
CNT and f-CNT, were observed perpendicularly to the flowdirection as illustrated in Fig. 7. The SEM micrographs showedthat all the composites presented a large concentration of CNToutside the agglomerates with good CNT distribution.Comparison of the p-CNT and f-CNT composites shows thatthe latter have a better interface with the polymer, as evidencedby the longer p-CNT pull-out length, revealing a lower p-CNT/PA interaction.
The CNT agglomerate characterization depicted in Figs. 5and 6, and Table 2, provide important information about thedifferences in the dispersion mechanisms of f-CNT and p-CNT in PA 6. The extrusion process generally induced higherCNTagglomerate rupture for the f-CNTcomposites comparedto p-CNT, generating smaller agglomerates in the former, butwithout considerably affecting the overall dispersed CNTfraction, leading to similar AR (Table 2). The higher shearflow developed during μIM (relative to extrusion) lead tofurther enhancement of the agglomerate rupture for p- and f-CNT composites, with a greater effect on the f-CNTagglomerates. The CNT agglomerate size distribution in thepolymer considerably varied with the flow geometry. Thetensile bars with smaller thickness induce higher shear in thepolymer melt, which enhanced the dispersion of the f-CNTand reduced their agglomerate size.
Electrical properties
The percolation threshold for PA/CNT composites is in therange of 4–6 wt. % for μIM samples [15], thus this step of ourstudy will focus only on the 4.5 % composition.
The electrical resistivity was measured for the compositesprepared by extrusion and μIM, in tensile and parallelepipedictest specimens. The measurements were performed in thedirection of the flow (L) for all composites, and theparallelepipedic μIM samples were also analyzed in theperpendicular direction to the polymer flow (T). The resultsobtained are presented in Table 2 and Fig. 8.
Fig. 6 Total agglomerate area ratios obtained for the composites withdifferent CNT content
301, Page 6 of 9 J Polym Res (2013) 20:301

It was observed that the extruded p-CNT composites wereelectrically conductive, but the μIM process considerablyincreased the electrical resistivity of the composites, in spiteof their larger fraction of dispersed CNT. Thus, it is possiblethat p-CNT orientation was induced by the high shear actingon the polymer melt during μIM, disrupting the CNTconductive network generated during the extrusion process.The tensile-shaped μIM specimens showed a larger increasein electrical resistivity, probably due to greater CNTorientation induced by higher polymer shear flow rate. Theparallelepipedic specimens, whose electrical resistivity wasmeasured in the L and T directions, showed lower resistivityalong the flow direction (L) compared to the thicknessdirection (T). This type of observation is compatible with
CNT alignment effects, and was described by A. Behnamet al. [23] that reported the influence of the measurement angleon the electrical resistivity of composites with aligned CNT.The improved dispersion observed for the μIM compositeswith p-CNT, traduced by the lower AR and smalleragglomerates obtained compared to the extruded material,resulted in higher composite electrical resistivity.
A remarkable difference was observed for the electricalresponse of the composites with p-CNTand f-CNT, the formeralways presenting lower electrical resistivity, irrespective ofthe processing method. Since the functionalization alone doesnot affect the f-CNTelectrical properties (it was demonstratedbefore that the electrical conductivity of f-CNT pellets wassimilar to that of pure CNT pellets [26]) this effect may be due
Table 2 Optical microscopy and electrical resistivity characterization of the composites with 4.5 % p-CNT and f-CNT
Sample Processing method Average agglomerate area (μm2) Number of agglomerates/μm2 AR Electrical resistivity (Ω.m)
PA+4.5 % p-CNT μIM-tensile 45 8.6×10⁻⁴ 3.9 7.4×10⁵
μIM-parall 39 7.2×10⁻⁴ 2.9 3.9×10²
Extrusion 146 3.7×10⁻⁴ 5.4 4.9
PA+4.5 % f-CNT μIM-tensile 29 1.1×10⁻³ 3.0 2.6×10⁶
μIM-parall 29 1.5×10⁻³ 4.3 1.1×10⁶
Extrusion 55 9.7×10⁻⁴ 5.3 3.4×10⁸
Fig. 7 OM (left) and SEM (right) micrographs of the composites with4.5 wt.% CNT, obtained after extrusion and μIM (for tensile andparallelepipedic specimens). OM illustrates the influence of μIM on the
CNT agglomerate size and shape. SEM micrographs show the CNTdispersed fraction, presenting an insert with a higher magnificationimage. All the SEM images have the same scale as the first
J Polym Res (2013) 20:301 Page 7 of 9, 301

to the insulating action of the large polymer/f-CNT interphaseformed. Nevertheless, the composites presenting higher AR
and larger agglomerate areas also show higher electricalresistivity, in opposition to what was observed for thecomposites with p-CNT. The electrical resistivity decreasedfor the μIM p-CNT composites, presenting the lower valuesfor the parallelepipedic specimens, in the L direction. Figure 8depicts the tendency for increase in electrical resistivity fromextruded to μIM p-CNT composites, and the electricalbehavior observed for the composites with f-CNT, that donot show a clear variation with the processing method.
Mechanical properties
Typical stress–strain curves of PA6 and all compositions ofPA6/CNT μIM nanocomposites are shown in Fig. 9.
The elongation at break of PA increaseswith the incorporationof CNT (pure or functionalized), becoming much larger than thePA matrix. This result is confirmed in Fig. 10b.
Figure 10a shows that the tensile strength of the nano-composites is always greater than that of neat PA6, presentinghigher values for the p-CNT composites.
Figures 10 and 11 present the tensile properties of PA6 andPA6/CNT composites, illustrating the improvement induced bythe incorporation of p-CNTs and f-CNTs. The composites withp-CNT presented the best tensile properties, leading to anincrease in 43 % for the modulus, relative to PA6, for the4.5 wt.% p-CNT composites. It should be noticed that the
Fig. 10 Tensile strength (a) and strain at break (b) ofμIM tensile-shapedspecimens of PA6 and PA6/CNT samples with p-CNT and f-CNT
Fig. 11 Young’s moduli variation for PA6/CNT composites relative tothe neat polymer
0
10
20
30
40
50
60
70
80
0 0.2 0.4 0.6 0.8 1 1.2
Str
ess
(MP
a)
Strain (%)
PA 1% p-CNT 1,5% p-CNT
3% p-CNT 4,5% p-CNT 1% f-CNT
1,5% f-CNT 3% f-CNT 4,5% f-CNT
Fig. 9 Typical stress–strain curves obtained for PA6 and PA6/CNTcomposites
4.9E
+00
3.9E
+02
1.7E
+04
7.4E
+053.
4E+0
8
1.1E
+06
7.5E
+05
2.6E
+07
1.0E+00
1.0E+02
1.0E+04
1.0E+06
1.0E+08
Extrusion µIM (parall, L) µIM (parall, T) µIM (tensile)
Ele
ctri
cal R
esis
tivi
ty (Ω
.m)
p-CNT f-CNT
Fig. 8 Electrical resistivity of the composites prepared by the differentprocessing methods and with different μIM molds
301, Page 8 of 9 J Polym Res (2013) 20:301
incorporation of 1% p-CNT increased the modulus by 26% andthe tensile strength by 33 %, the latter showing a similarimprovement to that obtained with 4.5 wt.% of p-CNT. Asreported in otherworks, our results also showed that the optimumtensile properties are achieved at low CNT loadings [28]. Thecomposites with f-CNTs also presented improved tensileproperties compared to PA6, but they were proportionally lowerthan those obtained for the corresponding p-CNT composites.This result was surprising, considering the good f-CNT wettingby PA6 observed by SEM. It may be due to the formation ofthermal degradation products at the CNT/PA6 interface, since thecomposites were prepared at a higher temperature than the CNTfunctionalization temperature (270 °C versus 250 °C), or to otherstructural or morphological differences between p- and f-CNTcomposites, requiring further investigation.
Conclusions
PA6 composites with CNT, as received and functionalized,were prepared bymelt blending on a mini twin-screw extruderand small specimens were produced by μIM.
The composites obtained after extrusion and μIM werecharacterized in terms of their morphology, measuring theCNTagglomerates size and number and observing the dispersedCNT, to contribute to the interpretation of the electricalresistivity and tensile properties results.
The composites with p-CNT showed, in general, a smallernumber of larger agglomerates compared to f-CNT.
The tensile strength, elongation at break and modulus of thenanocomposites were significantly improved by the addition ofCNT. The type of processing strongly affected the electricalconductivity of the nanocomposites. The specimens producedpresented electrical conductivity in the semiconductor range.
Acknowledgments The authors are thankful to Fundação para a Ciênciae Tecnologia for project PEst-C/CTM/LA0025/2013 (Strategic Project - LA25 - 2013–2014), and for PhD grant for T. Ferreira (SFRH/BD/39119/2007).
References
1. Shaffer MSP, Sandler JKW (2006) In: Advani SG (ed) Processingand properties of nanocomposites. USA,World Scientific PublishingCompany
2. Coleman J, Khan U, Blau W, Gun’ko Y (2006) Carbon 44:1624–1652
3. McNally T, Pötschke P (2011) Polymer-carbon nanotube composites:Preparation, properties and applications. Woodhead Publishing
4. Baughman RH, Zakhidov AA, Heer WA (2002) Science 297:7875. Tosello G, Hansen HN (2010) In: Qin Y (ed) Micro-manufacturing
engineering and technology, 1st edn. United Kingdom, Elsevier6. Bauhofer W, Kovacs JZ (2009) Composites Science and Technology
69:1486–14987. Li J, Fang Z, Tong Li GA, Liu F (2007) Journal of Applied Polymer
Science 106:2898–29068. Liu T, Phang I, Shen L, Chow S, Zhang W (2004) Macromolecules
37:7214–72229. Liu H, Wang X, Fang P, Wang S, Qi X, Pan C, Xie G, Liew KM
(2010) Carbon 48:721–72910. Kasaliwal GR, Pegel S, Göldel A, Pötschke P, Heinrich G (2010)
Polymer 51:2708–272011. Qian D, Dickey EC, Andrews R, Rantell T (2000) Appl Phys Lett
76(20):2868–7012. Yoo HJ, Jung YC, Sahoo NG, Cho JW (2006) J Macromol Sci Part B
Phys 45:441–45113. Zhang WD, Shen L, Phang IY (2004) Liu T Macromolecules 37:
256–25914. Manchado MAL, Valentini L, Biagiotti J, Kenny JM (2005) Carbon
43:1499–150515. Meincke O, Kaempfer D, Weickmann H, Friedrich C, Vathauer M,
Warth H (2004) Polymer 45(3):739–4816. Schartel B, Pötschke P, Knoll U, Abdel-Goad M (2005) European
Polymer Journal 41(5):1061–7017. Pötschke P, Bhattacharyya AR, Janke A, Pegel S, Leonhardt A,
Christine Täschner C, Ritschel M, Roth S, Hornbostel B, Cech J(2005) Fullerenes Nanotubes, and Carbon Nanostructures 13(1):211–224
18. Abbasi S, Derdouri, A, Carreau, PJ Proceedings of the 8th (2009)World Congress of Chemical Engineering: 2009–08
19. Abbasi S, Carreau PJ, Derdouri A (2010) Polymer 51:922–93520. Giboz J, Coppnnex T, Mélé P (2009) J Micromech Microeng 19:
02502321. Sha B, Dimov S, Griffiths C, Packianather MS (2007) Journal of
Materials Processing Technology 183:284–29622. Pontes AJ, Sepúlveda AT, Sampaio M, Cortez J, Cunha AM
Proceedings of 24th (2008) annual meeting of the PolymerProcessing Society: 2008–06
23. Behnam A, Guo J, Ural A (2007) Journal of Applied Physics 102:044313
24. Mahmoodi M, Arjmand M, Sundararaj U, Park S (2012) Carbon 50:1455–1464
25. Araújo R, Paiva MC, Proença MF, Silva CJR (2007) CompositesScience and Technology 67:806–810
26. Novais RM, Covas JA, Paiva MC (2012) Composites: Part A 43:833–841
27. Paiva M, Simon F, Novais R, Ferreira T, Proença M, Xu W,Besenbacher F (2010) ACS Nano 4(12):7379–7386
28. Shen J, HuangW,Wu L, HuY, YeM (2007) Composites Science andTechnology 67:3041–3050
J Polym Res (2013) 20:301 Page 9 of 9, 301