dissertação para obtenção do grau de mestre ... - ulisboa · production and purification of new...
TRANSCRIPT

Production and Purification of New Microbial Cellul ases
Bárbara Sofia Silva Rodrigues
Dissertação para obtenção do Grau de Mestre em Engenharia Biológica
Júri
Presidente: Professor Duarte Miguel de França Teixeira dos Prazeres (IST)
Orientadores: Professora Maria Manuela Fonseca (IST)
Professor Francesco Molinari (UNIMI)
Vogal: Doutora Maria Teresa Ferreira Cesário (IST)
Novembro 2011

i
Acknowledgments
This thesis was made possible by the support and assistance of a number of people
whom I would like to personally thank.
First and foremost, I would like to express my gratitude to Dr. Diego Romano and my
supervisor Prof. Francesco Molinari, whose expertise and understanding guided me through my
internship, providing useful advice for the improvement of this work.
A special thank also goes to my lab partner, Tiziana Granato, for making experiments
look amusing, even when they were humourless, for sharing her knowledge, and also for the
encouragement and generous help during the internship and writing. Big thanks also go to
Giovanni, Ilaria, Francesca, and Chiara for helping me fit in and feel welcome from the moment
I arrived in DISTAM. A special thanks to Matteo and Mauro for the unlimited patience to explain
me every doubt I had during my internship.
I would also like to acknowledge my supervisor at IST, Prof. Manuela Fonseca, for her
availability to meet me, to review drafts of this document and for her extremely valuable and
detailed comments.
I wish to express my great gratitude to all my Erasmus and ESN friends that contributed
to making this work and my stay in Milan an enjoyable and fulfilling experience.
A special thanks to my great friends Inês Santos, Catarina Gomes and Sandra Ferreira
for the joy, companionship and unlimited support given throughout the writing part of this work.
The last but not the least, I would like to express my gratitude to my Family for the
support they provided me through my studies. This would not have been possible without their
support and understanding.

ii
Abstract
Recently there has been a significant effort on the development of renewable
alternatives to fossil fuels. One approach is to produce a liquid fuel by enzymatically hydrolyzing
carbohydrate polymers from biomass, such as cellulose, to sugars and fermenting them to
ethanol. Cellulases are the enzymes responsible for this phenomenon and despite extensive
research there are major gaps in understanding how they hydrolyze crystalline cellulose and act
synergistically.
To address this matter, experiments were conducted to optimize the production of
cellulases by two strains, A-1 and N-Y, of a fungal source: Aspergillus terreus. On a first
approach, different concentrations of cellulose were tested as the sole carbon source. The
maximum activity achieved by A.terreus A-1 strain was at the concentration of 30 g⋅L-1 of
cellulose, whereas A.terreus N-Y better produced cellulases at 20 g⋅L-1 of cellulose. Both strains
reached maximum cellulasic activity between 72h and 96h of incubation at 30ºC. The
concentration of spores utilized in the inoculum was also optimized and proven to be best at 0.1
OD/mL. Different sources of nitrogen, MgSO4 concentration and optimal pH were further
assayed. The best cellulolytic activities were obtained by using sodium nitrate as nitrogen
source and a concentration 0.5 g·L-1 of MgSO4·7H2O, at pH 6.
Stability tests regarding the effect of temperature and the use of protease inhibitors on
cellulase activity were also performed.
Finally, the release of sugars from the enzymatic reaction between cellulases from
A.terreus A-1 and commercial cellulose was analyzed by High Performance Liquid
Chromatography (HPLC).
Keywords : Production; Cellulases; Cellulose; Aspergillus terreus; Ethanol

iii
Resumo
Nos últimos tempos têm sido dirigidos esforços no sentido de desenvolver alternativas
energéticas sustentáveis aos combustíveis fósseis. Uma alternativa possível será a produção
de um combustível líquido a partir da hidrólise enzimática de polímeros de carbohidratos
existentes na biomassa, tais como a celulose, a açúcares e a sua posterior fermentação a
etanol. As celulases são as enzimas responsáveis por este fenómeno e, apesar da intensa
pesquisa já realizada, existem lacunas no conhecimento de como estas interagem
sinergisticamente para hidrolisar a celulose.
A fim de colmatar estas lacunas, foram desenvolvidas experiências de forma a
optimizar a produção de celulases a partir de duas estirpes, A-1 e N-Y, do fungo Aspergillus
terreus. Numa primeira abordagem, foram testadas diferentes concentrações de celulose como
única fonte de carbono. A actividade enzimática máxima das celulases produzidas pela estirpe
A-1 foi obtida utilizando uma concentração de celulose de 30 g⋅L-1, enquanto a estirpe N-Y
produziu maior quantidade de celulases usando uma concentração de 20 g⋅L-1 de celulose.
Ambas as estirpes registaram maior actividade celulásica entre as 72h e 96h de incubação do
fungo a 30ºC. A concentração de esporos a utilizar no inóculo foi optimizada, tendo-se
registado os melhores resultados para uma concentração de 0.1 OD/mL. Dois meios de cultura
com diferentes fontes de azoto, concentração de MgSO4 e pH óptimos foram também testados.
As melhores actividades enzimáticas foram obtidas aquando da utilização de nitrato de sódio
como fonte de azoto, e uma concentração de 0.5 g·L-1 de MgSO4·7H2O ao pH 6.
Foram ainda realizados testes de estabilidade de modo a avaliar o efeito da
temperatura e o uso de inibidores de proteases na actividade enzimática das celulases.
Por fim, a produção de açúcares a partir da reacção enzimática entre as celulases
produzidas pela estirpe A-1 de Aspergillus terreus e celulose foi analisada por Cromatografia
Líquida de Alta Eficiência (HPLC).
Palavras-chave : Produção; Celulases; Celulose; Aspergillus terreus; Etanol

iv
Table of Contents
Acknowledgments .................................................................................. i
Abstract .................................................................................................. ii
Resumo ................................................................................................. iii
List of Figures ....................................................................................... vi
List of Tables ....................................................................................... xii
Abbreviations ...................................................................................... xiii
1. Introduction ...................................................................................... 1
1.1 Motivation and Background: Cellulases and Second Generation
Biofuels ................................................................................................. 1
1.1.1 Economic Analysis of Bioethanol Production ................................. 2
1.2 Aspergillus ...................................................................................... 3
1.3 Cellulose ......................................................................................... 4
1.4 Cellulases ....................................................................................... 6
1.4.1 Characterization and Properties .................................................... 7
1.4.2 Cellulase Production ..................................................................... 9
1.4.3 Applications................................................................................. 10
1.4.4 The Challenges in Cellulase Research – Future Perspectives .... 11
1.5 Aim of this Study........................................................................... 12
2. Materials and Methods ................................................................... 14
2.1 Microorganism ............................................................................. 14
2.2 Culture Media ............................................................................... 14
2.3 Maintenance and Growth Conditions............................................ 14
2.4 Characterization of Cellulases ...................................................... 15
2.4.1 Harvest and Separation of Enzymes ........................................... 15
2.4.2 Cellulase Activity Assay .............................................................. 15
2.4.3 Protein Assay – Bradford Method ................................................ 17

v
2.5 Recovery and Concentration of Cellulases ................................... 18
2.5.1 Vacuum Filtration ........................................................................ 18
2.5.2 Ultrafiltration ................................................................................ 18
2.6 Validation Methods of Cellulasic Activity ...................................... 18
2.6.1 Enzymatic Reaction with Commercial Cellulose .......................... 18
2.6.2 HPLC Analysis ............................................................................ 19
2.7 Stability Tests ............................................................................... 19
2.7.1 Effect of Temperature on Cellulase Activity and Stability ............. 19
2.7.2 Effect of EDTA and a Protease Inhibitor Cocktail on Cellulase
Activity and Stability ............................................................................. 20
3. Results and Discussion .................................................................. 21
3.1 Factors Affecting Cellulase Production ......................................... 21
3.1.1 Effect of Cellulose Concentration on Cellulase Activity ................ 21
3.1.2 Effect of Initializing Fungal Growth at Different Spore
Concentration (OD/mL) on Cellulase Activity ........................................ 23
3.1.3 Effect of Medium Composition on Cellulase Activity .................... 25
3.1.4 Effect of Temperature on Cellulase Activity and Stability ............. 29
3.1.5 Effect of EDTA and a Protease Inhibitor Cocktail on Cellulase
Activity and Stability ............................................................................. 30
3.2 Evaluation of the Cellulase System .............................................. 33
3.3 Identification of Sugars Released from the Enzymatic Hydrolysis of
Cellulose ............................................................................................ 35
4. Conclusions and Future Perspectives ........................................... 47
5. References ....................................................................................... 50
Appendix I ............................................................................................ 54
Appendix II ........................................................................................... 62

vi
List of Figures
Figure 1 – Structure and composition of cellulose fibers. The glucose chains are held together
by hydrogen bonds and form crystalline cellulose that is arranged in microfibrils. These are
linked by hemicellulose and lignin, forming the recalcitrant cellulose fibers (Goldschmidt, 2008).
....................................................................................................................................................... 6
Figure 2 - Schematic view of the biodegradation of cellulose. Cellobiohydrolases act on the
nonreducing or reducing termini of cellulose fibers to processively release cellobiose. Endo-β-
1,4-glucanases randomly cleave cellulose chains. Β-glucosidases hydrolyze cellobiose or cello-
oligomers to glucose from nonreducing ends (Watanabe, et al., 2009)........................................ 8
Figure 3 – Aspergillus terreus endo-Cellulase calibration curve performed by using commercial
SIGMA cellulase. Measurements were carried out by using a commercial soluble substrate
(AZOCM-CELLULOSE, Megazyme). Assay conditions: T=40ºC; Incubation time= 30 min. ...... 22
Figure 4 – Effect of different concentrations of cellulose on the enzymatic activity of cellulases
produced by Aspergillus terreus A-1 strain during 9 days of incubation at 30ºC. ....................... 22
Figure 5 - Effect of different concentrations of cellulose on the enzymatic activity of cellulases
produced by Aspergillus terreus N-Y strain during 9 days of incubation at 30ºC. ...................... 23
Figure 6 - Effect of different concentration of spores (0.1, 0.2, 0.5 OD/mL) on the enzymatic
activity of cellulases produced by Aspergillus terreus A-1 strain, along 10 days of incubation at
30ºC in alternative agitation. ....................................................................................................... 24
Figure 7 - Effect of different concentration of spores (0.1, 0.2, 0.5 OD/mL) on the enzymatic
activity of cellulases produced by Aspergillus terreus N-Y strain, along 10 days of incubation at
30ºC in alternative agitation. ....................................................................................................... 24
Figure 8 - Effect of different medium composition, using a 0.1 OD/mL concentration of spores,
on the enzymatic activity of cellulases produced by Aspergillus terreus A-1 strain, along 9 days
of incubation at 30ºC in alternative agitation. .............................................................................. 26
Figure 9 - Effect of different medium composition, using a 0.5 OD/mL concentration of spores,
on the enzymatic activity of cellulases produced by Aspergillus terreus A-1 strain, along 9 days
of incubation at 30ºC in alternative agitation. .............................................................................. 26

vii
Figure 10 - Effect of different medium composition, using a 0.1 OD/mL concentration of spores,
on the enzymatic activity of cellulases produced by Aspergillus terreus N-Y strain, along 9 days
of incubation at 30ºC in alternative agitation. .............................................................................. 27
Figure 11 - Effect of different medium composition, using a 0.5 OD/mL concentration of spores,
on the enzymatic activity of cellulases produced by Aspergillus terreus N-Y strain, along 9 days
of incubation at 30ºC in alternative agitation. .............................................................................. 27
Figure 12 - Enzymatic activity (total Units) of cellulases before ultrafiltration (unconcentrated
cellulases) and recovered in the concentrate and in the permeate after ultrafiltration, using a
PES 50-kDa MWCO membrane in a stirred-cell apparatus. ....................................................... 29
Figure 13 – Effect of temperature on the activity of A. terreus A-1 cellulases, recovered in the
concentrate, after 48h at 25ºC and -20ºC. The control (samples at 25ºC) was taken as having
100% activity. .............................................................................................................................. 30
Figure 14 – Effect of a protease inhibitor cocktail and EDTA on the activity of cellulases from
Aspergillus terreus A-1 strain after 48h at 25ºC. ......................................................................... 31
Figure 15 - Effect of EDTA (2mM) on the activity of cellulases produced by Aspergillus terreus
A-1 after 96h of cultivation at 30ºC in basal media 1 and 2. After 96h of growth cultures were
vacuum filtered and ultrafiltrated, and kept at 25ºC in a room for the next 11 days. .................. 32
Figure 16 - Effect of EDTA (2mM) on the activity of cellulases produced after 96h of cultivation
at 30ºC of Aspergillus terreus A-1 cultures in Medium 1. After 96h of growth cultures were
vacuum filtered and ultrafiltrated, and left at 25ºC for the next 7 days. ...................................... 33
Figure 17 – Activity of cellulases produced by Aspergillus terreus A-1, using different substrates
(Azo-CMcellulose, NPG and NPA), different media (1 and 2), and with or without the addition of
EDTA (at 0h and at 96h of incubation at 30ºC). Samples were conserved at -20ºC and taken
from assays 8, 9 and 10. ............................................................................................................. 34
Figure 18 - HPLC chromatogram for 24h of reaction between commercial cellulose and the
enzyme mixture present in the concentrate solution, recovered from ultrafiltration of cellulases
produced by A. terreus A-1 growing on Medium 1. The identified peaks correspond to:
Cellobiose (12. 8 min); Glucose (15.4 min). ................................................................................ 36
Figure 19 - HPLC chromatogram for 24h of reaction between commercial cellulose and the
enzyme mixture present in the concentrate solution, recovered from ultrafiltration of cellulases

viii
produced by A. terreus A-1 growing on Medium 2. The identified peaks correspond to:
Cellobiose (12.9 min) and Xylose (16.4 min). ............................................................................. 37
Figure 20 - HPLC chromatogram for a 10 g·L-1 mixed sugar solution, showing elution times of
Glucose (6.3 min) , Xylose (10.0 min) and Cellobiose (22.6 min) with a mobile flow rate of 1
mL/min at 23ºC. Column: Lichrospher 100 NH2 ; Mobile phase: 85%Acetonitrile/15%Water. .. 38
Figure 21 – HPLC chromatogram for 24h of reaction between commercial cellulose (10 g·L-1)
and the enzyme mixture present in the concentrate solution, recovered from ultrafiltration of
cellulases produced by A. terreus A-1 growing on Medium 1 (“Control”). Column: Lichrospher
100 NH2 ; Mobile phase: 85%Acetonitrile/15%Water ; Flow rate 1 mL/min at 23ºC. The
identified peaks correspond to: Millipore Water (3.2 min) and Xylose (11.2 min). ...................... 39
Figure 22 - HPLC chromatogram for 48h of reaction between commercial cellulose (10 g·L-1)
and the enzyme mixture present in the concentrate solution, recovered from ultrafiltration of
cellulases produced by A. terreus A-1 growing on Medium 1 (“Control”). Column: Lichrospher
100 NH2 ; Mobile phase: 85%Acetonitrile/15%Water ; Flow rate 1 mL/min at 23ºC. The
identified peaks correspond to: Millipore Water (3.2 min) and Xylose (11.4 min). ...................... 40
Figure 23 - HPLC chromatogram for 24h of reaction between commercial cellulose (10 g·L-1)
and the enzyme mixture present in the concentrate solution recovered from ultrafiltration, which
contained EDTA (2mM), added at 96h of cultivation of A. terreus A-1 growing on Medium 1.
Column :Lichrospher 100 NH2 ; Mobile phase: 85%Acetonitrile/15%Water ; Flow rate 1 mL/min
at 23ºC The identified peaks correspond to: Millipore Water (3.3 min) and Xylose (9.8 min). ... 41
Figure 24 - HPLC chromatogram for 96h of reaction between commercial cellulose (30 g·L-1)
and the enzyme mixture (20 times more concentrated) present in the concentrate solution,
recovered from ultrafiltration of cellulases produced by A. terreus A-1 growing on Medium 1
(“Control”). Column :Lichrospher 100 NH2 ; Mobile phase: 85%Acetonitrile/15%Water ; Flow
rate 1 mL/min at 23ºC. The identified peaks correspond to: Millipore Water (3.2 min) and
Cellobiose (23.5 min). ................................................................................................................. 42
Figure 25 - HPLC chromatogram for 186h of reaction between commercial cellulose (30 g·L-1)
and the enzyme mixture (20 times more concentrated) present in the concentrate solution,
recovered from ultrafiltration of cellulases produced by A. terreus A-1 growing on Medium 1
(“Control”). Column :Lichrospher 100 NH2 ; Mobile phase: 85%Acetonitrile/15%Water ; Flow

ix
rate 1 mL/min at 23ºC. The identified peaks correspond to: Millipore Water (3.4 min) and
Cellobiose (23.8 min). ................................................................................................................. 43
Figure 26 - HPLC chromatogram for 96h of reaction between commercial cellulose (30 g·L-1)
and the enzyme mixture (20 times more concentrated) present in the concentrate solution after
ultrafiltration, which contained EDTA (2mM), added at 96h of cultivation of A. terreus A-1
growing on Medium 1. Column :Lichrospher 100 NH2 ; Mobile phase:
85%Acetonitrile/15%Water ; Flow rate 1 mL/min at 23ºC. The identified peaks correspond to:
Millipore Water (3.4 min) and Cellobiose (23.1 min). ................................................................. 44
Figure 27 - HPLC chromatogram for 186h of reaction between commercial cellulose (30 g·L-1)
and the enzyme mixture (20 times more concentrated) present in the concentrate solution after
ultrafiltration, which contained EDTA (2mM), added at 96h of cultivation of A. terreus A-1
growing on Medium 1. Column: Lichrospher 100 NH2 ; Mobile phase:
85%Acetonitrile/15%Water ; Flow rate 1 mL/min at 23ºC. The identified peaks correspond to:
Millipore Water (2.9 min) and Cellobiose (23.1 min). .................................................................. 45
Figure 28 - HPLC chromatogram for a standard solution of Cellobiose (10 g·L-1). Column:
Prepacked Column RT Polyspher-OA HY (300 x 6.5 mm) with a H2SO4 0.0025 M mobile phase.
Flow rate: 0.3 mL/min ; P=23 bar ; T=65ºC. ................................................................................ 54
Figure 29 - HPLC chromatogram for a standard solution of Glucose (10 g·L-1). Column:
Prepacked Column RT Polyspher-OA HY (300 x 6.5 mm) with a H2SO4 0.0025 M mobile phase.
Flow rate: 0.3 mL/min ; P=23 bar ; T=65ºC. ................................................................................ 55
Figure 30 - HPLC chromatogram for a standard solution of Xylose (10 g·L-1). Column:
Prepacked Column RT Polyspher-OA HY (300 x 6.5 mm) with a H2SO4 0.0025 M mobile phase.
Flow rate: 0.3 mL/min ; P=23 bar ; T=65ºC. ................................................................................ 55
Figure 31 - HPLC chromatogram for a standard solution of Arabinose (10 g·L-1). Column:
Prepacked Column RT Polyspher-OA HY (300 x 6.5 mm) with a H2SO4 0.0025 M mobile phase.
Flow rate: 0.3 mL/min ; P=23 bar ; T=65ºC. ................................................................................ 56
Figure 32 - HPLC chromatogram for 0h of reaction between commercial cellulose and the
enzyme mixture present in the concentrate solution, recovered from ultrafiltration of cellulases
produced by A. terreus A-1 growing on Medium 1. ..................................................................... 57

x
Figure 33 - HPLC chromatogram for 1h of reaction between commercial cellulose and the
enzyme mixture present in the concentrate solution, recovered from ultrafiltration of cellulases
produced by A. terreus A-1 growing on Medium 1. ..................................................................... 58
Figure 34 - HPLC chromatogram for 18h of reaction between commercial cellulose and the
enzyme mixture present in the concentrate solution, recovered from ultrafiltration of cellulases
produced by A. terreus A-1 growing on Medium 1. The peaks identified for Cellobiose (12.8)
and Glucose (15.4) were superimposed. .................................................................................... 59
Figure 35 - HPLC chromatogram for 0h of reaction between commercial cellulose and the
enzyme mixture present in the concentrate solution, recovered from ultrafiltration of cellulases
produced by A. terreus A-1 growing on Medium 2. ..................................................................... 60
Figure 36 - HPLC chromatogram for 1h of reaction between commercial cellulose and the
enzyme mixture present in the concentrate solution, recovered from ultrafiltration of cellulases
produced by A. terreus A-1 growing on Medium 2. ..................................................................... 61
Figure 37 - HPLC chromatogram for 18h of reaction between commercial cellulose and the
enzyme mixture present in the concentrate solution, recovered from ultrafiltration of cellulases
produced by A. terreus A-1 growing on Medium 2. ..................................................................... 61
Figure 38 – HPLC chromatogram for 0h of reaction between commercial cellulose (10 g·L-1)
and the enzyme mixture present in the concentrate solution, recovered from ultrafiltration of
cellulases produced by A. terreus A-1 growing on Medium 1 (“Control”). The identified peak
corresponds to: Millipore Water (3.6 min) ................................................................................... 62
Figure 39 - HPLC chromatogram for 2h of reaction between commercial cellulose (10 g·L-1) and
the enzyme mixture present in the concentrate solution, recovered from ultrafiltration of
cellulases produced by A. terreus A-1 growing on Medium 1 (“Control”). The identified peak
corresponds to: Millipore Water (3.4 min) ................................................................................... 63
Figure 40 - HPLC chromatogram for 0h of reaction between commercial cellulose (10 g·L-1) and
the enzyme mixture present in the concentrate solution recovered from ultrafiltration, which
contained EDTA (2mM), added at 96h of cultivation of A. terreus A-1 growing on Medium 1. The
identified peak corresponds to: Millipore Water (3.6 min) ........................................................... 64
Figure 41 - HPLC chromatogram for 2h of reaction between commercial cellulose (10 g·L-1) and
the enzyme mixture present in the concentrate solution recovered from ultrafiltration, which

xi
contained EDTA (2mM), added at 96h of cultivation of A. terreus A-1 growing on Medium 1. The
identified peak corresponds to: Millipore Water (3.6 min). .......................................................... 65
Figure 42 - HPLC chromatogram for 24h of reaction between commercial cellulose (30 g·L-1)
and the enzyme mixture (20 times more concentrated) present in the concentrate solution,
recovered from ultrafiltration of cellulases produced by A. terreus A-1 growing on Medium 1
(“Control”). The identified peaks correspond to: Millipore Water (3.3 min) and Cellobiose (23.5
min). ............................................................................................................................................. 66

xii
List of Tables
Table 1 – Cellulase enzyme production by different fungi in a solid state fermentation (Jahromi,
et al., 2011). ................................................................................................................................... 4
Table 2 – Specific activities (U/mg of protein) obtained for cellulases produced by Aspergillus
terreus A-1 growing on media 1 and 2. The enzyme assay was specific for the endo-1,4-β-D-
glucanase activity and was performed using Azo-CMcellulose as substrate. ............................ 35
Table 3 – HPLC retention times obtained for a 10 g·L-1 mixed sugar solution containing glucose,
xylose and cellobiose. The column used was Lichrospher 100 NH2 with a
85%Acetonitrile/15%Water mobile phase at a 1 mL/min flow rate and 23ºC. ............................ 38

xiii
Abbreviations
A.aculeatus Aspergillus aculeatus
A.carbonarius Aspergillus carbonarius
A.ellipticus Aspergillus ellipticus
A.foetidus Aspergillus foetidus
A.heteromorphus Aspergillus heteromorphus
A.japonicus Aspergillus japonicus
A.nidulans Aspergillus nidulans
A.niger Aspergillus niger
A.terreus Aspergillus terreus
A.tubingensis Aspergillus tubingensis
CBH Cellobiohydrolase
CMC Carboxymethyl cellulose
CMCase Carboxymethyl cellulase
DOE U.S. Department of Energy
EG Endoglucanase
EDTA Ethylene diamine tetra acetate
FPase Filter Paper activity for cellulases
HPLC High Performance Liquid Chromatography
MWCO Molecular weight cut-off
NPA 4-nitrophenyl-α-arabinofuranoside
NPG 4-nitrophenyl-β-glucopyranoside
NREL National Renewable Energy Laboratory
OD Optical Density
PES Polyethersulfone
T.reesei Trichoderma reesei
Tris hydroxymethylaminomethane
UF Ultrafiltration

1
1. Introduction
1.1 Motivation and Background: Cellulases and Secon d
Generation Biofuels
Rising oil prices in the last few years and environmental concerns due to climate
change have led to an increasing interest in biofuels. Biofuels are renewable, can substitute
fossil fuels, reduce fossil greenhouse gas emissions and they can be produced, where they are
needed, to reduce the dependence on oil producing countries. First generation biofuels, such as
bioethanol produced from sugarcane and maize, and biodiesel, produced from soybeans, are
the only ones used on an industrial scale at the time.
Because first generation biofuels have had some drawbacks due to environmental and
social impacts from food crops, the bioethanol that is generated from cellulosic materials, so
called second generation biofuel, has become an object of interest. (Goldschmidt, 2008) The
majority of fermentable sugars from biomass feedstocks, with greatest interest for second-
generation ethanol production, are in the form of cellulose.
Organisms with cellulase systems that are capable of converting biomass to alcohol
directly are already reported. But none of these systems described are effective alone to yield a
commercially viable process. The strategy employed currently in bioethanol production from
lignocellulosic residues is a multi-step process involving pre-treatment of the residue to remove
lignin and hemicellulose fraction, cellulose treatment at 50ºC to hydrolyze the cellulosic residue
to generate fermentable sugars, and finally use of a fermentative microorganism to produce
alcohol from the hydrolyzed cellulosic material (Sukumaran, et al., 2005). The cellulose
preparation needed for the bioethanol plant is prepared using a lignocellulosic residue as
substrate, and the organism employed is almost always T.reesei, although other fungi like
Humicola, Penicillium and Aspergillus have also the ability to yield high levels of extracellular
cellulases (Sukumaran, et al., 2005).
To develop efficient technologies for biofuel production, significant research has been
directed towards the identification of efficient cellulase systems and process conditions, as well
as studies have been directed at the biochemical and genetic improvement of the existing
organisms utilized in the process.
The use of pure enzymes in the conversion of biomass to ethanol or to fermentation
products is currently uneconomical due to the high cost of commercial cellulases. Cellulosic
biomass is an attractive resource that can serve as substrate for the production of value added
metabolites and cellulases as such. Again, the most critical part in producing products from

2
lignocellulosic materials is the enzyme production cost. In early process designs, enzymes
accounted for more than 50% of the ethanol production cost. (Cleantech, 2010) Regardless of
the type of cellulosic feedstock, the cost and hydrolytic efficiency of enzymes are major factors
that restrict the commercialization of the biomass bioconversion processes. (Gusakov, et al.,
2007) Improving the effectiveness of enzymes, while reducing the quantity needed, is thus one
of the key challenges that must be overcome to make second-generation ethanol commercially
viable.
1.1.1 Economic analysis of bioethanol production:
About 15 years ago the cost of ethanol production from cellulosic substrates was
US$4.0/gallon (Verma, et al., 2011).
In 2009 the U.S. Department of Energy (DOE), who promotes the production of ethanol
and other liquid fuels from lignocellulosic biomass feedstocks by funding research, estimated
that the enzyme cost contribution to a bioethanol production plant should be $0.35/gal (2007$)
and should decrease to $0.12/gal ethanol by 2012. (Humbird, et al., 2011) By February 2010
the major enzyme manufacturers, Genencor and Novozymes, announced new commercial-
grade cellulase enzyme preparations capable of higher performance at lower loadings.
However, both cited an enzyme cost contribution of approximately $0.50/gal of ethanol
(Humbird, et al., 2011).
Earlier this year (2011), the National Renewable Energy Laboratory (NREL)
investigated the production economics of ethanol using lignocellulosic biomass feedstocks. A
biorefinery using a process design that converts corn stover to ethanol by dilute-acid
pretreatment, enzymatic saccharification, and co-fermentation, processing 2.205 dry ton/day at
76% theoretical ethanol yield (79 gal/dry ton), was described to have an ethanol selling price of
$2.15/gal in 2007$. However, the predicted cost of enzymes to the ethanol plant is $0.34/gal of
ethanol (Humbird, et al., 2011).
If enzymatic processing and biomass improvement together are met, the projected cost
would be as low as US $ 0.20 per liter by 2015 (Verma, et al., 2011).

3
1.2 Aspergillus
Aspergillus species are highly aerobic and are found in almost all oxygen-rich
environments, where they commonly grow as molds on the surface of a substrate, as a result of
the high oxygen tension. Molds derive energy from the organic matter in which they live.
Typically, molds secrete hydrolytic enzymes, mainly from the hyphal tips. These enzymes
degrade complex biopolymers such as starch, cellulose and lignin into simpler substances
which can be absorbed by the hyphae. In this way, molds play a major role in causing
decomposition of organic material, enabling the recycling of nutrients throughout ecosystems.
The genus Aspergillus is group of filamentous fungi with a large number of species. In
1926 a first classification of these fungi was proposed describing 11 groups within the genus
(DeVries, et al., 2001). A re-examination of the groups was performed by Thom and Raper and
14 distinct groups were identified (DeVries, et al., 2001). In addition to the morphological
techniques traditionally applied, new molecular and biochemical techniques have been used in
the reclassification of this group of aspergilli. These analyses resulted in the clear distinction of
eight groups of black aspergilli (A. niger, A. tubingensis, A. foetidus, A. carbonarius,
A. japonicus, A. aculeatus, A. heteromorphus, and A. ellipticus), which are important for
industrial applications. The black aspergilli have a number of characteristics which make them
ideal organisms for industrial applications, such as good fermentation capabilities and high
levels of protein secretion; ability to assimilate various organic substrates; suppress the
development of other microorganisms; and high sporulation capacity (DeVries, et al., 2001).
The majority of Aspergillus species are accepted to be mitosporic, without any known
sexual spore production, although some species have been described to have a teleomorphic
state. Around 20 species have so far been reported as causative agents of opportunistic
infections in man, although Aspergillus terreus is among the ones less commonly isolated as
opportunistic pathogens (Kassebullah, 2006).
Filamentous fungi, such as Aspergillus, have the ability to produce enzymes involved in
the degradation of plant cell wall materials (cellulases, hemicellulases, pectinases,
glycosidases, phytases), starch (amylases), lipids (lipases) and proteins (proteases and
peptidases) and the oxidation of phenolic compounds (laccases) (MacCabe, et al., 2002).
Strains of Aspergillus terreus produce neutral and alkaline type of proteases (Hussain, et al.,
2010).
Industrial applications of cellulases have mainly focused on fungal enzymes. Aspergillus
terreus is a fungus used for producing cellulolytic enzymes. It is a thermoacidophilic fungus
commonly isolated from soil, plant debris, and indoor air environment. Different studies have
reported the ability of A. terreus for the production of FPase (exoglucanase), CMCase
(endoglucanase) and β-glucosidase, xylanase and amyloglucosidase, which are important in
the process of cell wall degradation of biomass (Jahromi, et al., 2011). Aspergillus strains are

4
also known for their ability to produce β–glucosidase with significantly higher yields than
Trichoderma species (Damisa, et al., 2011).
Abilities of different fungi for the production of cellulases from literature are shown in
Table 1 (Jahromi, et al., 2011).
Table 1 – Cellulase enzyme production by different fungi in a solid state fermentation (Jahromi, et
al., 2011).
Microorganism Carbon
source
Enzyme activity (U/g DM)
CMCase Fpase β-Glucosidase
Fusarium
oxysporum Corn Stover 304 0.14
Trichoderma reesei
MGG77 Rice brain 2.31
Trichoderma reesei
ZU-02 Corncob 158
Aspergillus niger
KK2 Rice straw 129 19.5 100
A. terreus M11 Corn stover 581 243 128
1.3 Cellulose
Most carbohydrates in plants are in the form of lignocellulose, which can be converted
into products that are of commercial interest, such as ethanol. Lignocellulosic biomass makes
about 50% of the total biomass in the world with an estimated annual production of 10-50 billion
tons. (Goldschmidt, 2008) The major polysaccharides comprising lignocellulosic residues are
cellulose (30 to 56%) and hemicellulose (10 to 27%) (Emtiazi, et al., 2001).
Cellulose is the most common organic polymer, representing about 1.5x10¹² tons of the
total annual biomass production through photosynthesis, and is considered to be an almost
inexhaustible source of raw material for different products. It is the most abundant and
renewable biopolymer on earth and the dominating waste material from agriculture (Sukumaran,
et al., 2005).
The basic structure of cellulose are 1,4-β-glycosidic linked D-glucose molecules that
form un-branched chains, consisting of several thousands of glucose molecules. The number
of glucose units in the cellulose molecules varies and the degree of polymerization ranges from
250 to well over 10000, depending on the source and treatment method (Sukumaran, et al.,
5
2005). Though lignocellulosic biomass is generally recalcitrant to microbial action, suitable
pretreatments resulting in the disruption of lignin structure and increase accessibility of enzymes
have been shown to increase the rate of its biodegradation (Sukumaran, et al., 2005).
Cellulose is a crystalline polymer, an unusual feature among biopolymers. Cellulose
chains in the crystals are stiffened by inter and intra chain hydrogen bonds and the adjacent
sheets which overlie one another are held by weak Van-der Waals forces. The result of this
process is a crystalline structure which is very difficult to degrade. However, cellulose fibers are
not completely crystalline, but contain several types of irregularities, such as micropores or
kinks, with amorphous character. These regions are the points of attack for the cellulolytic
enzymes. When the cellulolytic enzymes cleave the glucose chains, the results are called
cellodextrins, which are short glucose chains of various lengths. The shortest ones, i.e. glucose
dimers, are called cellobiose and are sometimes not included in the cellodextrin classification
(Goldschmidt, 2008).
In nature, cellulose is present in nearly pure state in a few instances, while in most
cases the cellulose fibers are embedded in a matrix of other structural biopolymers, primarily
hemicelluloses and lignin (Sukumaran, et al., 2005). Hemicellulose is a mixture of short linear
and branched polymers consisting of different pentose and hexose sugars. 20-35% of the plant
dry weight consists of hemicellulose, thus it is the second most abundant polymer in the world
(Goldschmidt, 2008). It mostly consists of xylose, a pentose sugar, which implies a problem for
bioethanol production, because not all microbes can metabolize xylose. If it is not possible to
overcome this problem, a large fraction of the sugars in the cellulosic biomass will not be
available for fermentation (Goldschmidt, 2008).

6
Figure 1 – Structure and composition of cellulose fi bers. The glucose chains are held together by
hydrogen bonds and form crystalline cellulose that is arranged in microfibrils. These are linked by
hemicellulose and lignin, forming the recalcitrant cellulose fibers (Goldschmidt, 2008) .
1.4 Cellulases
Cellulases have been the target of active research for over five decades, and are
currently the third largest industrial enzyme worldwide (by dollar volume) because of their use in
cotton processing, paper recycling, as detergent enzymes, in juice extraction, and as animal
feed additives (Wilson, 2009). Thus, if ethanol (or another fermentation product of sugars),
produced from biomass by enzymes, becomes a major transportation fuel, cellulases will
become the largest volume industrial enzyme (Wilson, 2009).
The enzymatic hydrolysis of cellulose releases soluble sugars including glucose, xylose,
and other hexoses and pentoses. To make the sugar monomers available for fermentation, the
cellulose and hemicellulose chains have to be hydrolyzed. The hydrolysis of hemicelluloses are
catalyzed by xylanases, together with other accessory enzymes (α-L-arabinofuranosidases,
feruloyl and acetylxylan esterases, β-xylosidases, etc), while the hydrolysis of cellulose can be
undertaken by microorganisms that produce enzymes known as the cellulase systems
(Gusakov, et al., 2007).

7
Cellulolytic microbes are primarily carbohydrate degraders and are generally unable to
use proteins or lipids as energy sources for growth (Sukumaran, et al., 2005). Cellulases used
for current industrial applications are mainly produced from aerobic cellulolytic fungi, such as
Trichoderma reesei and Aspergillus species primarily due to efficiencies in fungal enzyme
secretion (Wilson, 2009). In fact these organisms produce a complex mix of enzymes at high
productivity and catalytic efficiency, both of which are required for low-cost enzyme supply.
The cellulolytic enzymes can be either secreted into the substrate or attached to the cell
wall of the microorganism (Goldschmidt, 2008). Unlike most bacteria, fungal cellulases are
typically secreted into the growth medium, allowing easy harvest and consequent cost-efficient
separation of the active enzymes in a liquid form.
Furthermore, it is possible to genetically modify these fungal strains to tailor the set of
enzymes they produce, so as to give optimal activity for specific uses (Wilson, 2009).
1.4.1 Characterization and Properties
Cellulases are often modular, containing a catalytic core, a linker and a carbohydrate-
binding module (Teter, et al., 2005). These enzymes are classified into glycosyl hydrolase
families considering the degree of sequence identity. Based on mechanism, cellulases can be
divided into three groups based on their enzymatic activities: endoglucanases; exoglucanases
and β-glucosidases. They all have in common the ability of hydrolyzing the 1,4-β-glycosidic
bond between the D-glucose molecules, but they differ in their starting point and substrate when
hydrolyzing (Goldschmidt, 2008).
Endoglucanases (EG), also known as 1,4-β-D glucan-4-glucanohydrolases, attach to
the cellulose at arbitrary internal amorphous sites and cleave the polysaccharide chain by
inserting a water molecule in the 1,4-β bond. The results are oligosaccharides of various lengths
with a reducing and a non-reducing end (Goldschmidt, 2008). The molecular weight of an endo-
β-1,4-glucanase from a thermoacidophilic fungus, Aspergillus terreus M11 was found to be 25
kDa (Gao, et al., 2007). EGs activities can be measured using a soluble cellulose derivative with
a high degree of polymerization such as carboxymethylcellulose (CMC). In early studies
regarding cellulases the available enzyme preparations would scarcely hydrolyze insoluble
cellulose, although they often broke down soluble derivatives such as carboxymethyl cellulose
(CMC) readily. The reason for this was that they consisted chiefly of endo-β-glucanases and
lacked the exo-β-glucanases. Thus, for cellulase preparations derived from organisms such as
Aspergillus niger, carboxymethylcellulose is used as substrate (Mandels, et al., 1976).
The exoglucanases start at either the reducing or non-reducing end of the
oligosaccharide chains, resultant from EGs action, and release either glucose or a cellobiose
dimer. The glucose releasing enzymes are called glucanases and the cellobiose releasing

8
enzymes cellobiohydrolases (CBH). The exoglucanases can also work autonomously and peel
cellulose chains from microcrystalline cellulose. Finally, the β-glucosidases hydrolyze the
glucose dimers (cellobiose) and the cellodextrins of various lengths to glucose (Goldschmidt,
2008). These fundamentally different catalytic mechanisms allow different types of cellulases to
interact synergistically (Figure 2). At high concentrations, cellobiose inhibits cellobiohydrolase
activity. Hence, β-glucosidase, which converts cellobiose into glucose, is often required for
optimal cellulose performance in conditions where cellobiose accumulates, preventing end-
product inhibition.
Figure 2 - Schematic view of the biodegradation of c ellulose. Cellobiohydrolases act on the nonreducing or reducing termini of cellulose fibers to processively release cellobiose. Endo- β-1,4-
glucanases randomly cleave cellulose chains. Β-glucosidases hydrolyze cellobiose or cello-oligomers to glucose from nonreducing ends (Watanab e, et al., 2009).
1.4.1.1 Physical and Chemical Properties
Most cellulases studied have similar pH optima, solubility and amino acid composition.
Thermal stability and exact substrate specificity may vary. However, it should be taken into
account that cellulase preparations generally contain other enzymatic activities besides
cellulolytic activity, and these may also affect the properties of the preparations.

9
• Optimum pH: Cellulase preparations are effective between pH 3 and 7. The
optimum pH generally lies between 4 and 5 (GmbH, 2011);
• Optimum temperature : The optimum temperature for cellulolytic activities of A.
niger was 30 ºC and 35 ºC for A. nidulans. (Usama, et al., 2008) A maximum yield of
cellulases from A. terreus QTC 828 was achieved at 40 ºC (Ali, et al., 1991).
Temperature is a cardinal factor affecting the extent and rate of growth of an organism
and the increasing temperature has the general effect of increasing enzyme activity, but
the enzyme begins to suffer thermal inactivation at higher temperatures.
• Inhibitors: Cellulase is inhibited by its reaction products i.e. glucose,
cellobiose. Moreover, Hg inhibits cellulases completely, whereas Mn, Ag,Cu and Zn
ions are only slightly inhibitory (GmbH, 2011);
• Stability and storage: The activity of cellulase preparations were found to be
completely destroyed after 10-15 minutes at 80 °C. Solutions of cellulase at pH 5-7 are
stable for 24 hours at 4°C. These products should b e stored at 4 °C, in a dry place in
tightly-closed containers. If stored in this manner, lyophilized preparations are stable for
several months without significant loss of activity (GmbH, 2011).
1.4.2 Cellulase Production
Commercial production of cellulases on a commercial scale is induced by growing the
fungus on solid cellulose or by culturing the organism in the presence of a disaccharide inducer,
such as lactose. However, on an industrial scale, both methods of induction result in high costs.
Since the enzymes are inducible by cellulose, it is possible to use cellulose containing media for
production, although the process is controlled by the dynamics of induction and repression. At
low concentrations of cellulose, glucose production may be too slow to meet the metabolic
needs of active cell growth and function. On the other hand, cellulase synthesis can be stopped
by glucose repression when glucose generation is faster than consumption. Thus, expensive
process control schemes are required to provide slow substrate addition and monitoring of
glucose concentration (Sukumaran, et al., 2005).
In vivo cellulase production is associated to growth and is influenced by various factors.
Interactions amongst these factors can affect cellulase productivity (Sukumaran, et al., 2005).
Because cellulases are inducible extracellular enzymes, their rate of production is greatly
influenced by nutrient medium composition. In the majority of commercial cellulase
fermentations the carbon sources are cellulosic biomass including straw, spent hulls of cereals,
rice or wheat bran, bagasse, paper industry waste and various other lignocellulosic residues
(Sukumaran, et al., 2005). Though fermentation conditions for the development of economically

10
feasible bioprocesses are still being sought, combinatorial interactions of medium components
with the production of the desired compounds are numerous, and optimum processes may be
developed using an effective experimental design method.
The challenges in cellulase production involve developing suitable bioprocesses and
media for cellulase fermentation, besides identification of cheaper substrates and inducers.
Genetic modification of the cellulase producers to improve cellulase activity has gone a long
way to give better producers with high enzyme titers, but still cellulase production economics
needs further improvement for commercial production of ethanol from biomass (Sukumaran, et
al., 2005).
1.4.3 Applications
Cellulases are used in the textile industry, in detergents, pulp and paper industry,
improving digestibility of animal feeds, in food industry, and these enzymes account for a
significant share of the world enzyme market (Sukumaran, et al., 2005).
Cellulases were initially investigated several decades back for the bioconversion of
biomass which gave way to research in the industrial applications of the enzymes in animal
feed, food, textiles and detergents and in the paper industry (Sukumaran, et al., 2005). With the
shortage of fossil fuels and the arising need to find alternative source for renewable energy and
fuels, there is a renewal of interest in the bioconversion of lignocellulosic biomass using
cellulases and other enzymes.
Perhaps the most important application currently being investigated is in the utilization
of lignocellulosic wastes for the production of biofuel (Sukumaran, et al., 2005). The
lignocellulosic residues represent the most abundant renewable resource available to mankind,
but their use is limited due to lack of cost effective technologies. A potential application of
cellulase is the conversion of cellulosic materials to glucose and other fermentable sugars,
which in turn can be used as microbial substrates for the production of single cell proteins or a
variety of fermentation products like ethanol.

11
1.4.4 The Challenges in Cellulase Research – Future Perspectives
Lignocellulose is the potential source of biofuels, bio-fertilizers, animal feed and
chemicals, besides being the raw material for paper industry. (Sukumaran, et al., 2005)
Exploitation of this renewable resource needs either chemical or biological treatment of the
material and, in the latter context, cellulases have gained wide popularity over the past several
decades. Research has shed light into the mechanisms of microbial cellulase production and
has led to the development of technologies for production and applications of cellulose
degrading enzymes. However, there is no single process, which is cost effective, and efficient in
the conversion of the natural lignocellulosic materials for production of useful metabolites or
biofuel. The use of the current commercial preparations of cellulose for bioconversion of
lignocellulosic waste is economically not feasible (Sukumaran, et al., 2005).
The major goals for future cellulase research would be the reduction in the cost of its
production and the improvement of the performance of cellulases to make them more effective,
so that less enzyme is needed. The former task may include such measures such as optimizing
growth conditions or processes, while the latter requires directed efforts in protein engineering
and microbial genetics to improve the properties of the enzymes (Sukumaran, et al., 2005).
Optimization of growth conditions and processes has been attempted to a large extent
in improving cellulase production. For instance, empirical optimization of process variables to
improve productivity has been the focus of many of the works using fermentation for the
production of cellulases (Sukumaran, et al., 2005). Many of the current commercial production
technologies utilize submerged fermentation technology and employ hyper producing mutants.
Despite several efforts directed at generating hyper producers by directed evolution, the cost of
enzymes has remained high. Alternative strategies in cellulase production include mainly solid
substrate fermentation on lignocellulosic biomass, particularly by using host/substrate specific
microorganisms. There are several reports on such use of filamentous fungi in production of
optimal enzyme complex for the degradation of host lignocellulose (Sukumaran, et al., 2005).
Feedback inhibition of cellulase biosynthesis by the end products, glucose and
cellobiose, generated by endogenous cellulolytic activity on the substrate is another major
problem encountered in cellulase production. Cellobiose is an extremely potent inhibitor of the
CBH and EG biosynthesis. Trichoderma and the other cellulase-producing microbes make very
little β-glucosidase compared to other cellulolytic enzymes. The low amount of β-glucosidase
results in a shortage of capacity to hydrolyze the cellobiose to glucose, resulting in a feedback
inhibition of enzyme production and, in the particular case of biomass conversion applications,
in the inhibition of cellulases. This issue has been addressed by various means such as the

12
addition of exogenous β-glucosidases to remove the cellobiose and engineering β-glucosidase
genes into the organism so that it is overproduced (Sukumaran, et al., 2005). In the future,
developments in process design and medium formulations will no longer be enough and
controlled genetic interventions into the physiology of cellulase producers to improve production
will be key to make the cellulase production process more cost effective. The major tasks ahead
include overriding the feedback control by glucose and development of integrated bioprocesses
for the production of cellulases.
Improvements in cellulase activities or giving of desired features to enzymes by protein
engineering are probably other areas where cellulase research has to advance. Active site
modifications can be imparted through site directed mutagenesis and the mutant proteins can
be used for understanding the mechanisms of action as well as for altering the substrate
specificities or improving the activities (Sukumaran, et al., 2005).
Protein engineering has been successfully employed to improve the stability of a
cellulase from Humicola in the presence of detergents; better the thermostability of a mesophilic
endo-1,4-β-glucanase from alkaliphilic Bacillus sp., as well as altering the pH profile of a
cellobiohydrolase and, more recently, endoglucanase from T. reesei (Sukumaran, et al., 2005).
Such modifications affecting the enzyme properties may be useful for a better overall
performance of cellulases, as well as understanding their mode of action, which will therefore
enable the use of such enzymes for biomass conversion. More basic research is needed to
make designer enzymes suited for specific applications.
1.5 Aim of this study
The goal of this project is to study the use of new cellulases, produced by Aspergillus
terreus, as catalysts for the hydrolysis of cellulose from plant biomass, for further use in
energetic applications.
With this objective in mind, work is done in order to optimize the production of cellulases
from Aspergillus terreus. The experimental conditions studied are close to recent works found in
literature (Usama, et al., 2008), (Nour, et al., 2011). Different Aspergillus terreus strains, various
concentration of spores utilized to prepare the inoculum, different cellulose concentrations
supplemented to growth media, as well as the use of another basal medium (with another pH
and nitrogen and Mg2+ sources) are tested for optimum cellulase activity. It should be noted that
almost all the research is focused on an enzyme activity assay specific for an endo-cellulase
(endo-β1,4-glucanase) and not for total enzyme activity. However, experiments are also
conducted to investigate and compare the activity of β-glucosidase in the enzyme mixtures.

13
Furthermore, stability tests are performed to analyze the influence of temperature in the
enzymatic activity of cellulases, as well as the impact of a protease inhibitor cocktail and EDTA
(a metalloprotease inhibitor) on cellulasic activity.
Finally, after selecting the best performing enzyme preparation, cellulases are tested by
HPLC for their capability to hydrolyze commercial cellulose to their precursor sugars, such as
glucose, xylose and cellobiose.

14
2. Materials and Methods
2.1 Microorganism
Applied fungus was Aspergillus terreus strains named A-1 and N-Y, isolated from soil.
2.2 Culture Media
The basal medium (without carbon source) utilized for cellulase production (Medium 1)
had the following composition (g⋅L-1):
o NaNO3 2.0
o KH2PO4 1.0
o MgSO4⋅7H2O 0.5
o KCl 0.5
o FeSO4 0.01
o pH 6.5
In order to optimize the production of cellulases, trials were made changing the
nitrogen source, magnesium concentration and the pH. The medium used (Medium 2) had the
following composition (g⋅L-1):
o Peptone 6.0
o KH2PO4 1.0
o MgSO4⋅7H2O 1.72
o KCl 0.5
o FeSO4 0.01
o pH 5.5
The media were sterilized in the autoclave at 116ºC for 20 min.
2.3 Maintenance and Growth Conditions
Strains were routinely maintained on agar-malt at 30ºC until sporulation occurred and
conserved at 4ºC. The fungi were grown in 1 L Erlenmeyer baffled flasks containing 150 mL of
the basal medium supplemented with different concentrations of cellulose (Sigma Aldrich) or
sucrose. Cellular growth regards the following phases:

15
a) Pre-inoculum
On a first approach, spores from 10-days old cultures on malt slants were re-suspended
with 6 mL of sterilized water and the obtained suspension was utilized to prepare the inoculum
for the flasks.
On a second approach, spores from slants were re-suspended with 6 mL of sterilized
water and filtered using sterile glass-whole filters. The amount of spores was determined by
reading the O.D. of the suspension at 595 nm in a UV/Visible spectrophotometer (Pharmacia
Biotech, Ultrospec 1000). The filtered solution was used to make the inoculum of the flasks.
b) Growth in Flasks
On the first approach, each flask was inoculated with 10 mL of spore suspension. On
the second approach, the O.D. of the inoculum was read and the flasks inoculated with either
0.1 ; 0.2 or 0.5 OD/mL concentrations of spores.
In both cases, the cultures were incubated at 30ºC under alternative agitation (120 spm)
up to 216h.
2.4 Characterization of Cellulases
2.4.1 Harvest and Enzyme Separation
Samples of 6 mL were collected from each flask, under sterile conditions, on a 24h
basis, up to 216 h. These were then centrifuged at 5000 rpm for 15 minutes and the
supernatant was collected to 10 mL sterile tubes and stored at -20ºC for further use in enzyme
assays.
2.4.2 Cellulase Activity Assay
a) endo-1,4-β-D-glucanase activity
The method for the enzyme assay used in most of the work is specific for the endo-1,4-
β-D-glucanase activity (endo-cellulase) present in cellulose preparations.

16
• Substrate
The substrate Azo-Alpha Cellulose (Megazyme) utilized for the enzyme assays was
prepared by Megazyme by dyeing CM-Cellulose 4M with Remazolbrilliant Blue dye, to a dye
content of approx. one dye molecule per 20 sugar residues. Alpha-cellulose is an amorphous
alkali-resistant cellulose and is a potential substrate for the assay of endo-1,4-β-D-glucanase
(endo-cellulase).
• Solutions
The solutions used during the cellulase activity assays were the following:
• Sodium Acetate buffer
Sodium Acetate Trihydrate 2 M in demineralized water. The pH was adjusted to 4.5 with
HCl 0.5 N.
• Substrate solution
Two grams of powdered substrate were added to 80 mL of boiling and vigorously stirred
water on a hot-plate with a magnetic stirrer. The heat was turned off and was carried out with
stirring until the solution was homogeneous (approx. 20 min). A volume of 5 mL of sodium
acetate buffer (2 M; pH 4.5) was added and the solution was cooled at room temperature. The
pH was adjusted to 4.5 and the volume to 100 mL. The solution was stored at 4ºC for posterior
use.
• Precipitant solution
Forty grams of sodium acetate trihydrate and four grams of zinc acetate were dissolved
in 150 mL of demineralized water. The pH was adjusted to 5.0 with 5 M HCl and the volume to
200 mL with demineralized water. Two hundred milliliters of this solution was added to 800 mL
of ethanol (95%), mixed well and stored at room temperature in a well-sealed bottle.
The procedure used for the enzyme assay is specific for the endo-1,4-β-D-glucanase
activity (endo-cellulase) present in cellulose preparations. When incubating dyed CMC with
cellulase, the substrate is depolymerized by an endo-mechanism to produce low molecular
weight dyed fragments, which remain in solution after the addition of a precipitant solution to the
reaction mixture. High-molecular material is removed by centrifugation and the color of the
supernatant is measured.

17
• Assay Procedure
An aliquot of 0.1 mL of a pre-equilibrated substrate solution was added to 0.1 mL of
enzyme solution (pre-equilibrated at 40ºC) and stirred on a vortex mixer. The mixture was
incubated at 40ºC for exactly 30 minutes and the reaction was then terminated by the addition
of 0.5 mL of precipitant solution (the high-molecular weight unhydrolysed substrate was
precipitated). The reaction tubes were equilibrated to room temperature for 10 min and
vigorously stirred for 10 sec on a vortex mixer. The tubes were then centrifuged (Eppendorf
Centrifuge 5415D) at 12000 rpm for 10 min. The supernatant solution was poured directly into a
spectrophotometer cuvette and the absorbance of the reaction solutions was measured
(Microplate Reader BIO RAD Model 3550) at 595 nm against the reaction blank.
b) β-glucosidase activity
In order to evaluate other eventual cellulase activities, β-glucosidase and α-
arabinosidase were also assayed. The substrates used were NPG (4-nitrophenyl-β-
glucopyranoside) and NPA (4-nitrophenyl-α-arabinofuranoside) from Sigma-Aldrich. An aliquot
(0.1 mL) of diluted enzyme was added to 0.9 mL of a 5 mM solution of the appropriate glycoside
(NPG or NPA). Buffer was 50 mM citrate, adjusted at the appropriate pHopt for each activity (3.6
for α-arabinosidase and 4.8 for β-glucosidase) . After 5 min at 25ºC, the reaction was stopped
by adding 1 mL of 200 mM sodium carbonate. The absorbance of the reaction solutions was
measured at 400 nm against a reaction blank, on a UV/Visible Ultrospec 1100 Pro
Spectrophotometer (Amersham Biosciences).
2.4.3 Protein Assay - Bradford Method
Protein content was measured according to the method of (Bradford, 1976) using
bovine serum albumin (BSA, Sigma) as a standard. This method analyzes the interaction
between the proteins’ aminoacids and the colorant Coomassie Blue G-250 on an acid solution.
An aliquot of 100 µL of sample was added to 1 mL of standard and the reading was made at
595 nm on a UV/Visible Ultrospec 1100 Pro Spectrophotometer (Amersham Biosciences). The
values of absorbance were compared with a standard curve for bovine serum albumin. Each
assay was performed in duplicate.

18
2.5 Recovery and Concentration of Cellulases
2.5.1 Vacuum Filtration
After incubation for 96h, mycelia from Erlenmeyer flasks were harvested by vacuum
filtration using a Buckner filter. Vacuum filtration was run until filtrate was no longer being
collected (about 5 min), and the resulting filter cake was scraped off. The filtrate was used in
subsequent experiments.
2.5.2 Ultrafiltration
Ultrafiltration was carried out to concentrate the cellulase solution by recovering any
soluble enzymes present in the culture filtrate.
On a first approach, a 4.45-cm-diameter polyethersulfone membrane disk from
Millipore, with a 50-kDa molecular weight cut-off was used in a stirred-cell apparatus
(Ultrafiltration Cell Model 8050, AMICON Corp.). The stirred-cell was pressurized with nitrogen
to a maximum pressure of 1.5 bar. After ultrafiltration the stirred-cell was two times washed with
Tris-HCl 10 mM (pH=7.4) buffer. Finally, a volume of 150 mL that remained in the stirred cell
(concentrate) was collected. The concentrate was maintained at 4ºC. Protein transmission
during vacuum filtration and protein rejection during ultrafiltration were measured by
spectrophotometry using the previously described enzyme assay for the endo-1,4-β-D-
glucanase activity.
A different approach to concentrate cellulases was made using VIVASPIN 2
Concentrator (Viva Science) ultrafiltration devices containing a polyethersulfone membrane with
10 kDa molecular weight cut-off. A volume of 4 mL from the vacuum filtrate was centrifuged at
5000 rpm for 15 minutes. The devices were then washed two times with Tris-HCl 2 mM
(pH=7.4) buffer and a volume of 0.5 mL was collected as the concentrate.
2.6 Validation Methods of Cellulasic Activity
2.6.1 Enzymatic reaction with commercial cellulose

19
To evaluate the capability of cellulases produced by Aspergillus terreus to release
fermentable sugars (such as glucose, xylose, cellobiose and arabinose), the reaction of the
enzyme mixture with cellulose was assayed.
The reaction was carried out in glass tubes with a screw cap, in a water bath at 30ºC
and under magnetic agitation. Each tube contained:
o 1 mL of a 10 g⋅L-1 solution of commercial cellulose (Sigma Aldrich)
o 500 µL of enzyme recovered from ultrafiltration
An aliquot of 100 µL from each reaction tube was taken at different times and
centrifuged at 13000 rpm for 3 minutes. The sample was then injected in an HPLC system.
2.6.2 HPLC analysis
Hydrolytic products released from cellulose were analyzed by high performance liquid
chromatography (HPLC). On a first approach, soluble products were separated by using a
Prepacked Column RT Polyspher-OA HY (300 x 6.5 mm). The column was washed with
Millipore water and then eluted with a solution of H2SO4 0.0025 M at a flow rate of 0.3 ml/min
and temperature of 65ºC. The analysis of the hydrolysis products was performed using a
refractive index detector (BIO-RAD Refractive Index Monitor).
A second HPLC analytical assay was performed was performed on a Lichrospher
100 NH2 column (4 x 250 mm) 5 µm + Pre-Column (with the same stationary phase) with a
degassed 85:15 (v/v) acetonitrile/water (Sigma-Aldrich/Milli-Q) eluent system at a 1 mL/min flow
rate, at room temperature (23ºC). The analysis of the hydrolysis products was performed using
the same refractive index detector.
2.7 Stability Tests
2.7.1 Effect of Temperature on Cellulase Activity a nd Stability
Temperature effects on enzyme activity were assayed at the following temperatures:
-20ºC and 25ºC. For the measurement of thermal stability, samples (in duplicate) of the
concentrate, recovered from ultrafiltration, were kept at temperatures -20ºC and 25ºC for 2

20
days. The cellulase activity was determined using the standard enzyme (endo-1,4-β-D-
glucanase) assay conditions. The control (sample at 25ºC) was taken as having 100% activity.
2.7.2 Effect of EDTA and a Protease Inhibitor Cockt ail on
Cellulase Activity and Stability
This experiment was carried out to test the effect of ethylene diamine tetra acetate
(EDTA) and of a protease inhibitor cocktail (Sigma-Aldrich), attempting at the stabilization of
cellulases present in the concentrate solution after ultrafiltration. The activity of cellulases was
assayed under standard enzyme (endo-1,4-β-D-glucanase) conditions, in the presence of EDTA
(2mM) and a protease inhibitor cocktail after 2 days at 25ºC. Samples were assayed in
duplicate and the control (without any additive) was taken as having 100% activity.
21
3. Results and Discussion
3.1 Factors Affecting Cellulase Production
3.1.2 Effect of Cellulose Concentration on Cellulas e Activity
Aspergillus terreus A-1 and N-Y strains were grown in Erlenmeyer flasks containing
basal Medium 1 supplemented with different concentrations of cellulose (the sole carbon
source), in order to study the effect on enzyme production. Flasks containing sucrose as the
sole carbon source were used as control, as in this case no cellulolytic activity is required for
growth of the microorganism. (DISMA Biochemistry Lab., 2010)
The enzymatic activity of cellulases produced by the fungi was measured according to
the procedure described for the endo-1,4-β-D-glucanase. Activity is expressed in equivalent
U/mL calculated on the basis of a calibration curve performed by using commercial Sigma-
Aldrich cellulase (Figure 3). Measurements were carried out by using a commercial soluble
chromogenic substrate (AZO-CM-CELLULOSE; Megazyme).
Since no assays to evaluate the variation of Absorbance (595 nm) during the reaction
time course were performed due to a tight schedule, throughout this work the enzyme activity is
expressed in relation to the reaction time (30 min), instead of in relation to the initial reaction
rates. Also, no calibration curve was established between the Absorbance595nm and the amount
of glucose released from the action of endo-cellulases on the substrate (CMC-4M). Under these
circumstances, one “Unit of activity” is defined as micrograms of substrate which give rise to
one unit of Absorbance595nm at pH 4.5 and 40°C.

22
Figure 3 – Aspergillus terreus endo-Cellulase calibration curve performed by usin g commercial
SIGMA cellulase. Measurements were carried out by us ing a commercial soluble substrate (AZOCM-CELLULOSE, Megazyme). Assay conditions: T=40ºC; Incubation time= 30 min.
As expected, the fungi did not produce cellulases when grown on sucrose (Figure 4
Figure 5). In contrast, cellulases were produced extracellularly by both strains of the fungi when
grown on cellulose. As shown in Figure 4, the activity of cellulases produced by A.terreus A-1
strain had a maximum (13.2 U/mL) after 72h of incubation (30ºC) and at the concentration of 30
g⋅L-1 of cellulose, the sole carbon source. On the other hand, the maximum production of
cellulases by N-Y strain (10.2 U/mL) was shown to be at the concentration of 20 g⋅L-1 of
cellulose, also after 72h of incubation (Figure 5). This value of cellulase enzymatic activity was
higher than that obtained from cellulases produced by A. niger grown on basal medium
supplemented with 20 g⋅L-1 of cellulose (Gautam, et al., 2010).
Figure 4 – Effect of different concentrations of cel lulose on the enzymatic activity of cellulases produced by Aspergillus terreus A-1 strain during 9 days of incubation at 30ºC.
S30 – Concentration of Sucrose 30 g⋅L-1; C20 – Concentration of cellulose 20 g⋅L-1 ; C30 – Concentration of cellulose 30 g⋅L-1 ; C40 – Concentration of cellulose 40 g⋅L-1 ; C50 – Concentration of cellulose 50 g⋅L-1 ;
C60 – Concentration of cellulose 60 g⋅L-1
y = 0,036x + 0,032
R² = 0,9724
0
0,05
0,1
0,15
0,2
0,25
0,3
0,35
0,4
0,45
0 2 4 6 8 10 12
Ab
sorb
an
ce,
59
5 n
m
µg of substrate (CMC-4M) /0,1 mL
-2
0
2
4
6
8
10
12
14
0 24 48 72 96 120 144 168 192 216 240
U/m
L
Time (hours)
S30
C20
C30
C40
C50
C60

23
Figure 5 - Effect of different concentrations of cel lulose on the enzymatic activity of cellulases produced by Aspergillus terreus N-Y strain during 9 days of incubation at 30ºC.
S30 – Concentration of Sucrose 30 g⋅L-1; C20 – Concentration of cellulose 20 g⋅L-1 ; C30 – Concentration of cellulose 30 g⋅L-1 ; C40 – Concentration of cellulose 40 g⋅L-1 ; C50 – Concentration of cellulose 50 g⋅L-1 ;
C60 – Concentration of cellulose 60 g⋅L-1
For both strains the activity of cellulases decreased abruptly after its maximum value at
72h of incubation, but increased again from 96h until 168h of incubation. However, in both
cases, the activity of cellulases started to decay after 168h (7 days) of incubation of the fungus.
In order to attempt getting more reproducible results, a new approach using a specific amount
of spores was conducted.
3.1.2 Effect of Initializing Fungal Growth at Diffe rent Spore
Concentration (OD/mL) on Cellulase Activity
A second assay was performed by growing Aspergillus terreus A-1 and N-Y strains in
Erlenmeyer flasks containing basal Medium 1, this time supplemented only with a 30 g⋅L-1
concentration of cellulose (sole carbon source). The flasks were inoculated with the following
concentration of spores: 0.1, 0.2, 0.5 OD/mL.
Figure 6 and Figure 7 show the activity of cellulases produced by A.terreus A-1 and N-Y
strains using a 30 g⋅L-1 concentration of cellulose and different concentration of spores along 10
days of incubation at 30ºC, respectively.
-2
0
2
4
6
8
10
12
0 24 48 72 96 120 144 168 192 216 240
U/m
L
Time (hours)
S20
C20
C30
C40
C50
C60

24
Figure 6 - Effect of different concentration of spor es (0.1, 0.2, 0.5 OD/mL) on the enzymatic activity of cellulases produced by Aspergillus terreus A-1 strain, along 10 days of incubation at 30ºC in
alternative agitation.
Figure 7 - Effect of different concentration of spor es (0.1, 0.2, 0.5 OD/mL) on the enzymatic activity of cellulases produced by Aspergillus terreus N-Y strain, along 10 days of incubation at 30ºC in
alternative agitation.
For both strains and each concentration of spores utilized the maximum cellulasic
activity occurs between 72h and 96h of incubation. Subsequently, the enzyme activities
decreased, and in the case of N-Y strain, only about half of the maximum activities could be
detected on the seventh day (168h). These results are in agreement with a similar study on
Aspergillus glaucus XC9 where the optimal cultivation period for cellulase production was 3– 4
days (Chang, et al., 2006). However, the time course required to reach maximum levels of
0
0,5
1
1,5
2
2,5
3
3,5
0 24 48 72 96 120 144 168 192 216 240 264
U/m
L
Time (hours)
A. terreus A-1
0,1 OD/mL 0,2 OD/mL 0,5 OD/mL
-1
0
1
2
3
0 24 48 72 96 120 144 168 192 216 240 264
U/m
L
Time (hours)
A. terreus N-Y
0,1 OD/mL 0,2 OD/mL 0,5 OD/mL

25
activity may be affected by several factors, such as the presence of different ratios of
amorphous to crystalline cellulose (Ogel, et al., 2001).
It is also noticeable that the cultures that received higher concentrated inocula (0.5
OD/mL) showed the highest cellulasic activity (2.8 U/mL for either strains). A previous study on
Aspergillus sp. SU14 showed the importance of inoculum density in cellulase production
(VanHanh, et al., 2010). These authors reported that higher inoculum levels increased the spore
number per gram of substrate, hindering the penetration of oxygen in the medium and leading
to inhibition of fungal growth and cellulase production. However, a lower density may result in
excessive growth of the mycelium and in the delay of enzyme production.
3.1.3 Effect of Medium Composition on Cellulase Act ivity
Because the rate of production of cellulase, an inducible extracellular enzyme, is greatly
influenced by nutrient medium composition, optimum processes may be developed using
effective experimental design methods (Nour, et al., 2011). In order to further optimize the
production of cellulases (obtain higher cellulasic activity), a different basal medium (Medium 2)
was tested, under the previously described conditions. This new medium contained a different
nitrogen source (peptone, at the concentration of 6 g⋅L-1); MgSO4 (7mM); and different pHopt
(5.5), found in literature to be optimal (Nour, et al., 2011). Concentrations of spores of 0.1 and
0.5 OD/mL were used to inoculate the flasks.
Figure 8Figure 11 show the activity of cellulases produced by A.terreus A-1 and N-Y
strains in different media and different concentration of spores (0.1 or 0.5 OD/mL) along 9 days
of incubation at 30ºC, respectively.

26
Figure 8 - Effect of different medium composition, u sing a 0.1 OD/mL concentration of spores, on the enzymatic activity of cellulases produced by Aspergillus terreus A-1 strain, along 9 days of
incubation at 30ºC in alternative agitation.
Figure 9 - Effect of different medium composition, u sing a 0.5 OD/mL concentration of spores, on the enzymatic activity of cellulases produced by Aspergillus terreus A-1 strain, along 9 days of
incubation at 30ºC in alternative agitation.
-2
-1
0
1
2
3
4
5
0 24 48 72 96 120 144 168 192 216 240
U/m
L
Time (hours)
A. terreus A-1, 0.1 OD/mL
Medium 1 Medium 2
0
0,5
1
1,5
2
2,5
3
3,5
0 24 48 72 96 120 144 168 192 216 240
U/m
L
Time (hours)
A. terreus A-1, 0.5 OD/mL
Medium 1 Medium 2

27
Figure 10 - Effect of different medium composition, using a 0.1 OD/mL concentration of spores, on the enzymatic activity of cellulases produced by Aspergillus terreus N-Y strain, along 9 days of
incubation at 30ºC in alternative agitation.
Figure 11 - Effect of different medium composition, using a 0.5 OD/mL concentration of spores, on the enzymatic activity of cellulases produced by Aspergillus terreus N-Y strain, along 9 days of
incubation at 30ºC in alternative agitation.
Comparing the production of cellulases by A.terreus A-1 and N-Y strains when
cultivated in different basal media supplemented with cellulose (30 g⋅L-1), the cellulasic activity
was more remarkable when using Medium 1. These data were in accordance to previous
reports on Aspergillus niger and A. nidulans, where sodium nitrate enhanced cellulolytic
activities (Usama, et al., 2008). Nonetheless, a study on Aspergillus terreus M11 (Gao, et al.,
-1,5
-1
-0,5
0
0,5
1
1,5
2
2,5
3
0 24 48 72 96 120 144 168 192 216 240
U/m
L
Time (hours)
A. terreus N-Y, 0.1 OD/mL
Medium 1 Medium 2
-1
-0,5
0
0,5
1
1,5
2
0 24 48 72 96 120 144 168 192 216 240
U/m
L
Time (hours)
A. terreus N-Y, 0.5 OD/mL
Medium 1 Medium 2

28
2008) showed that enzyme activities were higher using peptone and yeast extract as nitrogen
sources.
The cellulasic activity obtained using a 0.5 OD/mL concentration of spores was similar
or lower than the activity obtained when using a 0.1 OD/mL concentration. For this reason an
inoculum concentration of 0.1 OD/mL was used in the following experiments. Also, because A.
terreus A-1 strain seemed to follow a more regular pattern, it was the chosen to perform the
next trials.
At this point of the experimental work, the optimal conditions found for the production of
cellulases by Aspergillus terreus were:
• Strain (A-1 ; N-Y) : A-1
• Concentration of cellulose (20 - 60 g·L-1) : 30 g·L-1
• Concentration of Spores (0.1 , 0.2 , 0.5 OD/mL) : 0.1 OD/mL
• Time of growth (24h – 216 h) : between 72h and 96h
• Basal medium (Medium 1 ; Medium 2) : Medium 1
A different approach was attempted, this time introducing a vacuum filtration followed by
an ultrafiltration, after cultivation of A. terreus A-1 cultures for 96h at 30ºC. The conditions
chosen for cellulase production were basal media 1 and 2, supplemented with 30 g·L-1 of
cellulose and a 0.1 OD/mL concentration of spores.
The purpose of the use of vacuum filtration was to remove the mycelium, whereas
ultrafiltration was used to concentrate the cellulase solution obtained from the previous filtration.
The utilization of an ultrafiltration membrane with appropriate molecular weight cut-off can keep
the enzymes and cellulose in the concentrate, while low molecular weight molecules, such as
sugars, can pass through the membrane and leave as permeate.
The molecular weight of an endo-1,4-β-glucanase from Aspergillus terreus M11 was
found in literature to be 25 kDa (Gao, et al., 2007). However, due to the lack of membranes in
the laboratory with a lower molecular weight cut-off (MWCO), it was decided, on a first
approach, to use a polyethersulfone membrane disk with a 50-kDa MWCO in a stirred-cell
system.
Due to experimental errors, the results are shown only for cellulases produced by A.
terreus A-1 growing on basal Medium 2. A volume of 23 mL that remained in the stirred cell
(concentrate) was collected and kept at 4ºC for further spectrophotometry measurement at 595
nm. The same was done for the permeate (250 mL) to check eventual cellulase transmission
through the membrane. The enzymatic activity of cellulases was measured according to the
procedure described for the endo-1,4-β-D-glucanase.

29
Figure 12 - Enzymatic activity (total Units) of cell ulases before ultrafiltration (unconcentrated cellulases) and recovered in the concentrate and in the permeate after ultrafiltration, using a PES
50-kDa MWCO membrane in a stirred-cell apparatus.
As can be observed in Figure 12, the activity of cellulases decreased after ultrafiltration.
One possible drawback of cellulase separations using UF membranes is thus cellulase
deactivation. In fact, previous studies reported losses in cellulase activity due to shear
inactivation (Ganesh, et al., 2000).
On the other hand, the enzyme activity found in the permeate was 69% higher than the
activity of cellulases present in the concentrate. This may have occurred due to the fact that the
membrane cut-off was not the most appropriate, i.e. cellulases from Aspergillus terreus A-1
strain with molecular weight lower than 50 kDa may have permeated the ultrafiltration
membrane. A study made on cellulases produced by T.reesei showed that their recovery in the
permeate increased from 2 to 6% for polyethersulfone membranes with 30 and 50-kDa
molecular weight cut-offs, respectively (Mores, et al., 2001).
3.1.4 Effect of Temperature on Enzyme Activity and Stability
Stability is an interesting property of enzymes because (1) it is of great industrial
importance, (2) it is relatively easy to screen for, and (3) the molecular basis of stability relates
closely to contemporary issues in protein science, such as the protein folding problem. Thus,
engineering enzyme stability is of both commercial and scientific interest.
Naturally available enzymes are usually not optimally suited for industrial applications.
This incompatibility often relates to the stability of the enzymes under process conditions. The
stability of an enzyme is affected by many factors, temperature being one of them.
380.0
70.3
119.2
0
50
100
150
200
250
300
350
400
Uto
tal
Unconcentrated cellulases Concentrate (4ºC) Permeate (4º C)

30
Hence, to test the thermal stability of cellulases present in the concentrate solution
recovered from ultrafiltration, samples (in duplicate) were maintained at -20ºC and 25ºC for 48h.
The cellulase activity was determined under standard enzyme (endo-1,4-β-D-glucanase) assay
conditions. The control (samples at 25ºC) was taken as having 100% activity.
Figure 13 – Effect of temperature on the activity of A. terreus A-1 cellulases, recovered in the concentrate, after 48h at 25ºC and -20ºC. The contr ol (samples at 25ºC) was taken as having 100%
activity.
As shown in Figure 13 samples at -20 ºC were deactivated after 48h. The decrease of
cellulase activity after 48h at -20ºC suggests that proteases had some effect on enzyme activity.
For this reason, the effect of protease inhibitors on cellulase activity was tested. Also, it was
decided to perform cellulase activity assays right after the harvest of the cells and separation of
cellulases.
3.1.5 Effect of EDTA and a Protease Inhibitor Cockt ail on
Enzyme Activity and Stability
Protease inhibitors are commonly used with the purpose to protect proteins from
digestion by proteases. Metalloproteases are common and can be readily deactivated by the
addition of EDTA, which binds to the metal ions that the proteases need to function.
Many kinds of cellulases have serine-rich sequences which are very sensitive to
protease if they are not protected in any way (Wang, et al., 2006). Several alkaline proteases
from the different species of Aspergilli have been characterized in detail. For instance, in a
study by Charles, et al., 2008, an isolate of A. nidulans has shown to exhibit the ability to secret
an alkaline protease, whose activity was completely inhibited by the protease inhibitor cocktail.
100.0
88.5
0
20
40
60
80
100
120
25ºC -20ºC
Re
lati
ve
en
zym
e a
ctiv
ity
(%
)
Effect of temperature on the activity of A.
terreus A-1 cellulases

31
Other protease inhibitors, such as EDTA, inhibited the enzyme activity at 79%. More recently, it
has been shown that strains of Aspergillus terreus also produced neutral and alkaline type of
proteases, the latter type of which was inhibited by serine protease inhibitors and also by EDTA
(Hussain, et al., 2010).
Since it was not known whether cellulases produced from A. terreus A-1 strain were
protease resistant, some experiments were undertaken in order to evaluate the effect of
protease inhibitors on cellulase activity and stability. The experiments were performed based on
the idea that the presence of protease inhibitors could help to stabilize cellulases, in a way that
they would inhibit possible proteases present in the supernatant, and therefore
maintain/increase the activity of cellulases.
In the first set of experiments, a protease inhibitor cocktail and EDTA (2mM) were
added to concentrate solutions recovered from the previously described ultrafiltration. Samples
were assayed in duplicate and the activity of cellulases was determined under standard enzyme
(endo-1,4-β-D-glucanase) conditions. The control (without any additive) was taken as having
100% activity.
Figure 14 – Effect of a protease inhibitor cocktail and EDTA on the activity of cellulases from Aspergillus terreus A-1 strain after 48h at 25ºC.
The addition of a protease inhibitor cocktail, as well as EDTA (2 mM) helped to stabilize
cellulases, as their relative activity is 35.4 and 41%, respectively, higher than the cellulases
present in the control mixture, which did not contain any additive Figure 14. Due to economic
reasons it was chosen to use EDTA (2 mM) over the protease inhibitor cocktail in subsequent
tests on cellulase stability.
100.0
135.4
141.0
0
20
40
60
80
100
120
140
160
Control Protease inhibitor EDTA
Re
lati
ve
act
ivit
y (
%)

32
In the next experiments A. terreus A-1 cultures grown for 96h at 30ºC were vacuum
filtered and ultrafiltrated, this time using VIVASPIN 2 Concentrator (Viva Science) ultrafiltration
devices containing a polyethersulfone membrane with a 10 kDa molecular weight cut-off. The
conditions chosen for cellulase production were basal media 1 and 2, supplemented with 30
g·L-1 of cellulose and a 0.1 OD/mL concentration of spores.
Figure 15 - Effect of EDTA (2mM) on the activity of c ellulases produced by Aspergillus terreus A-1 after 96h of cultivation at 30ºC in basal media 1 a nd 2. After 96h of growth cultures were vacuum
filtered and ultrafiltrated, and kept at 25ºC in a room for the next 11 days.
It is apparent that the addition of EDTA (2mM) to the mixture (after 96h of cultivation at
30ºC) increased the enzyme activity of A. terreus A-1 cultures cultivated in both media (Figure
15). Although the trend of the activity of cellulases was more regular for Medium 2 after the
addition of EDTA at 96h, the enzyme activity was more pronounced for cellulases produced by
A.terreus A-1 when growing on Medium 1.
A similar experiment was undertaken, this time growing A. terreus A-1 cultures only on
basal medium 1, supplemented with 30 g·L-1 of cellulose and with a 0,1 OD/mL concentration of
spores. The cultures grown for 96h at 30ºC were vacuum filtered and ultrafiltrated. The addition
of EDTA (2 mM) to concentrate solutions at 96h was also tested and the activity of cellulases
was compared to a control sample, which did not contain any additive. Samples were assayed
in duplicate and the activity of cellulases was determined under standard enzyme (endo-1,4-β-
D-glucanase) conditions.
0
1
2
3
4
5
0 24 48 72 96 120 144 168 192 216 240 264 288 312 336 360 384
U/m
L
Time (hours)
Effect of the addition of EDTA (at 96h) on
cellulase activity
Medium 1 Medium 2

33
Figure 16 - Effect of EDTA (2mM) on the activity of c ellulases produced after 96h of cultivation at 30ºC of Aspergillus terreus A-1 cultures in Medium 1. After 96h of growth cult ures were vacuum
filtered and ultrafiltrated, and left at 25ºC for t he next 7 days.
As shown on Figure 16, the effect of EDTA (2mM) on cellulase activity was two-edged:
the activity of cellulases from 144h until the end of the monitored time period (264h) remained
almost constant and enzymes were apparently stable, yet the activities achieved were lower
than the ones observed for the control mixture (without the addition of EDTA).
The results described in literature regarding the effect of EDTA on cellulases are
variable. For example, in the case of Aspergillus terreus GN1, EDTA did not have any
significant effect on CMCase activity, suggesting that the enzymes produced were not
dependent on a metallic co-factor at its active site (Garg, et al., 1982). The same result was
obtained by (Elshafei, et al., 2009) in a study using Aspergillus terreus DSM 826. Furthermore,
the addition of EDTA (2 mM) did not have any noteworthy effects on the activity of a protease-
resistant cellulase produced by Aspergillus niger (Akiba, et al., 1995).
On the other hand, partial inhibition was observed by Ajayi, et al., 2007 when adding
various concentrations of EDTA (0 mM, 2 mM, 4 mM,6 mM and 8 mM) to a partially purified
cellulase from tomato fruits deteriorated by Aspergillus flavus. The inhibition was more
pronounced at increased EDTA concentrations.
3.2 Evaluation of the Cellulase System
Cellulases are a mixture of enzymes that act synergistically, (i.e., individual purified
enzymes have little or no action on insoluble cellulose, although an appropriate mixture can
0
1
2
3
4
0 24 48 72 96 120 144 168 192 216 240 264 288
U/m
L
Time (hours)
Effect of the addition of EDTA (at 96h) on
cellulase activity
Control EDTA t=96h

34
totally convert it to glucose) and thus cellulase systems from different microbial sources may
have a different mode of action.
This experiment was carried out to evaluate other eventual cellulase activities, besides
endo-1,4-β-D-glucanase, present in samples collected after 96h of incubation of Aspergillus
terreus A-1, growing on basal media 1 and 2 and supplemented with 30 g·L-1 of cellulose.
Therefore, an alternative enzyme assay, specific for β-glucosidase and α-arabinosidase, was
performed. The substrates used were NPG (4-nitrophenyl-β-glucopyranoside) and NPA (4-
nitrophenyl-α-arabinofuranoside) from Sigma-Aldrich. The absorbance was measured at 400
nm according to standard β-glucosidase assay conditions.
In order to compare the various activities, the same enzyme mixtures were tested
according to the assay specific for the endo-1,4-β-D-glucanase. The substrate here used was
Azo-CMcellulose from Megazyme.
Figure 17 – Activity of cellulases produced by Aspergillus terreus A-1, using different substrates (Azo-CMcellulose, NPG and NPA), different media (1 an d 2), and with or without the addition of EDTA (at 0h and at 96h of incubation at 30ºC). Sample s were conserved at -20ºC and taken from
assays 8, 9 and 10.
As it can be noted on Figure 17, cellulases produced by A.terreus A-1 showed β-
glucosidase and α-arabinosidase activities besides endo-1,4-β-D-glucanase, confirming the
synergism of the cellulase system.
The activity of cellulases growing on Medium 1 was considerably higher compared to
those growing on Medium 2, suggesting that the former medium is, in fact, optimal for the
production of cellulases from A.terreus A-1. In general, the activity of the endo-1,4-β-D-
0
0,1
0,2
0,3
0,4
0,5
0,6
0,7
0,8
0,9
Medium 1
(8)
Medium 2
(8)
Medium 1,
Control (9)
Medium 1,
EDTA t=0h
(9)
Medium 1,
EDTA t=96h
(9)
Medium 1,
Control (10)
Medium 1,
EDTA t=96h
(10)
Ab
sorb
an
ce
Azo-CMcellulose
β-NPG
α-NPA

35
glucanase was higher compared to the β-glucosidase activity. Furthermore, the activity of endo-
1,4-β-D-glucanase was always higher than the activity of α-arabinosidase, which is responsible
for releasing arabinose from hemicellulose. Nevertheless, taking, for instance, the control
sample (without the addition of EDTA) of assay number 9, the activities achieved, using each
kind of substrate, were much alike.
Only a small amount of cellulases was produced when adding EDTA at the beginning of
incubation (t=0h) of A. terreus A-1 cultures growing on basal Medium 1. Moreover, the activities
observed were lower when compared to those achieved by cellulases growing without any
EDTA (Control, assay number 9). It can be inferred that the addition of EDTA at the beginning
of cultivation (t=0h) of A. terreus A-1 may inhibit cellulase production.
The exact protein concentration of cellulases produced by Aspergillus terreus A-1 strain
was determined by the Bradford assay. The obtained values, together with the endo-1,4-β-D-
glucanase activity assay, gave the specific activities shown on Table 2.
Table 2 – Specific activities (U/mg of protein) obta ined for cellulases produced by Aspergillus terreus A-1 growing on media 1 and 2. The enzyme assay was specific for the endo-1,4- β-D-
glucanase activity and was performed using Azo-CMce llulose as substrate.
U/mg
protein
Medium 1 (8) 33,7
Medium 2 (8) 9,13
Medium 1, Control (9) 5,12
Medium 1, EDTA t=96h (9) 11,3
Medium 1, Control (10) 11,4
Medium 1, EDTA t=96h (10) 28,2
3.3 Identification of Sugars Released From the Enzy matic
Hydrolysis of Cellulose
To evaluate the capability of cellulases produced by Aspergillus terreus to release
fermentable sugars (such as glucose, xylose, cellobiose and arabinose), the reaction of the
enzyme mixture on cellulose was assayed.
The products released from the enzymatic reaction with commercial cellulose were
qualitatively analyzed, at different times, by high performance liquid chromatography (HPLC)
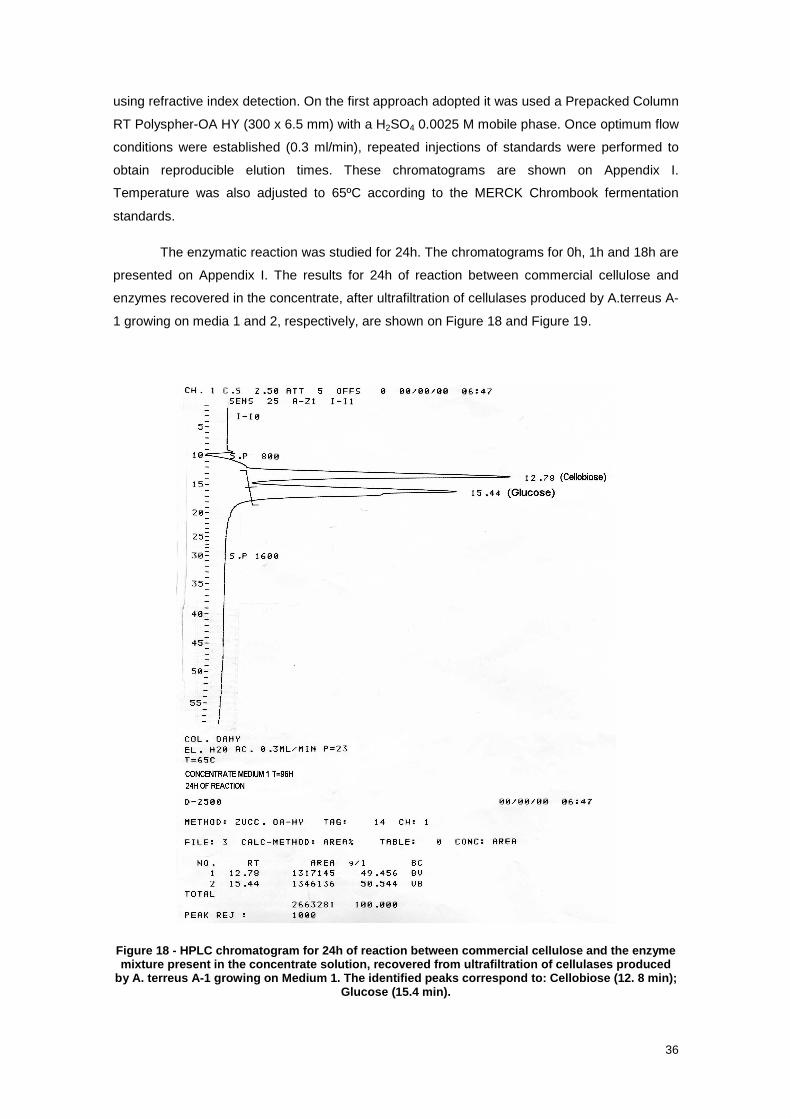
36
using refractive index detection. On the first approach adopted it was used a Prepacked Column
RT Polyspher-OA HY (300 x 6.5 mm) with a H2SO4 0.0025 M mobile phase. Once optimum flow
conditions were established (0.3 ml/min), repeated injections of standards were performed to
obtain reproducible elution times. These chromatograms are shown on Appendix I.
Temperature was also adjusted to 65ºC according to the MERCK Chrombook fermentation
standards.
The enzymatic reaction was studied for 24h. The chromatograms for 0h, 1h and 18h are
presented on Appendix I. The results for 24h of reaction between commercial cellulose and
enzymes recovered in the concentrate, after ultrafiltration of cellulases produced by A.terreus A-
1 growing on media 1 and 2, respectively, are shown on Figure 18 and Figure 19.
Figure 18 - HPLC chromatogram for 24h of reaction be tween commercial cellulose and the enzyme mixture present in the concentrate solution, recove red from ultrafiltration of cellulases produced
by A. terreus A-1 growing on Medium 1. The identified peaks corr espond to: Cellobiose (12. 8 min); Glucose (15.4 min).

37
Figure 19 - HPLC chromatogram for 24h of reaction be tween commercial cellulose and the enzyme mixture present in the concentrate solution, recove red from ultrafiltration of cellulases produced by A. terreus A-1 growing on Medium 2. The identified peaks corr espond to: Cellobiose (12.9 min)
and Xylose (16.4 min).
The chromatograms above show that different sugars are released when using
cellulases from A. terreus A-1 growing on media 1 or 2. For instance, xylose is only released
from the reaction between commercial cellulose and the cellulase mixture produced by A.
terreus A-1 growing on Medium 2. However, with this column and these operating conditions it
was not possible to separate both peaks of glucose and xylose, which had similar retention
times.
In order to improve the results and attempt at a better separation of sugars, a second
HPLC analytical assay was performed on a Lichrospher 100 NH2 column (4 x 250 mm)
using a 85:15 (v/v) acetonitrile/water mobile phase. The flow rate was adjusted to 1 mL/min and
the temperature was 23ºC. Again, injections of standards (10 g·L-1) were performed to obtain
reproducible elution times (Figure 20).

38
Figure 20 - HPLC chromatogram for a 10 g·L -1 mixed sugar solution, showing elution times of
Glucose (6.3 min) , Xylose (10.0 min) and Cellobios e (22.6 min) with a mobile flow rate of 1 mL/min at 23ºC. Column: Lichrospher 100 NH 2 ; Mobile phase: 85%Acetonitrile/15%Water.
Table 3 – HPLC retention times obtained for a 10 g ·L-1 mixed sugar solution containing glucose, xylose and cellobiose. The column used was Lichrosp her 100 NH2 with a 85%Acetonitrile/15%Water mobile phase at a 1 mL/min flow rate and 23ºC.
Retention time (min)
Glucose 6.3
Xylose 10
Cellobiose 22.6
In order to identify the sugars produced from the enzymatic reaction between
commercial cellulose (10 g·L-1) and the cellulase mixture present in the concentrate (recovered
from ultrafiltration of cellulases produced by A. terreus A-1 growing on basal Medium 1),
samples were taken along 48h of reaction. The addition of EDTA (2 mM) to concentrate
solutions after 96h of cultivation of A. terreus A-1 was also tested, and the release of sugars in
this case was compared to a control sample, which did not contain any additive.
When analyzing the “Control” samples, no peaks were registered at 0h nor at 2h of
reaction (see Appendix II). The best results were obtained after 24h and 48h from start, when a
Minutes
0 2 4 6 8 10 12 14 16 18 20 22 24 26 28 30
mV
olts
-100
0
100
200
300
400
500
600
700
800
900
1000
1100
1200
mV
olts
-100
0
100
200
300
400
500
600
700
800
900
1000
1100
1200
3,48
5 5
8,69
5 3
9492
368
6,27
3 1
4,22
5 9
5709
96
10,0
38
13,9
02
9354
019
22,5
77
13,1
79
8867
227
UV L-7400mixglucxylcellobiosio10grL_13.07.11
Retention TimeArea PercentArea

39
peak of xylose could be identified at 11 min of retention time (Figure 21 Figure 22). The huge
peak at around 3 minutes represents the water from the eluent and will be present in all HPLC
chromatograms, despite being irrelevant to the present study. As the reaction time increases, so
does the area of the peak of xylose, indicating that increased numbers of hemicellulose chains
are breaking down into smaller sugar units.
Figure 21 – HPLC chromatogram for 24h of reaction be tween commercial cellulose (10 g ·L-1) and the enzyme mixture present in the concentrate solut ion, recovered from ultrafiltration of cellulases
produced by A. terreus A-1 growing on Medium 1 (“Control”). Column: Lichr ospher 100 NH 2 ; Mobile phase: 85%Acetonitrile/15%Water ; Flow rate 1 mL/min at 23ºC. The identified peaks
correspond to: Millipore Water (3.2 min) and Xylose (11.2 min).
Minutes
0 2 4 6 8 10 12 14 16 18 20 22 24 26 28 30
mV
olts
-800
-600
-400
-200
0
200
400
600
800
mV
olts
-800
-600
-400
-200
0
200
400
600
800
3,16
1 9
5,25
2 4
2055
274 11
,199
4,
748
209
6202
UV L-7400tvcontrollo_24h
Retention TimeArea PercentArea

40
Figure 22 - HPLC chromatogram for 48h of reaction be tween commercial cellulose (10 g·L -1) and the enzyme mixture present in the concentrate solut ion, recovered from ultrafiltration of cellulases
produced by A. terreus A-1 growing on Medium 1 (“Control”). Column: Lichr ospher 100 NH 2 ; Mobile phase: 85%Acetonitrile/15%Water ; Flow rate 1 mL/min at 23ºC. The identified peaks
correspond to: Millipore Water (3.2 min) and Xylose (11.4 min).
Figure 23 displays the chromatogram at 24h of reaction between commercial cellulose
and the enzyme mixture present in the concentrate solution, which contained EDTA (2mM)
added to the cellulase solution produced after 96h of cultivation of A.terreus A-1 growing on
basal Medium 1. Note that, once again, no peaks were registered at 0h and at 2h of reaction
(see Appendix II).
Minutes
0 2 4 6 8 10 12 14 16 18 20 22 24 26 28 30
mV
olts
-800
-700
-600
-500
-400
-300
-200
-100
0
100
200
300
400
500
600
700
800
mV
olts
-800
-700
-600
-500
-400
-300
-200
-100
0
100
200
300
400
500
600
700
800
3,15
8 9
0,82
7 3
8586
879
6,83
8 0
,742
31
5170
11,3
89
8,02
7 3
4100
66
26,1
45
0,40
4 1
7171
8
UV L-7400tvcontrollo_48h
Retention TimeArea PercentArea

41
Figure 23 - HPLC chromatogram for 24h of reaction be tween commercial cellulose (10 g·L -1) and the enzyme mixture present in the concentrate solut ion recovered from ultrafiltration, which
contained EDTA (2mM), added at 96h of cultivation of A. terreus A-1 growing on Medium 1. Column :Lichrospher 100 NH 2 ; Mobile phase: 85%Acetonitrile/15%Water ; Flow r ate 1 mL/min at 23ºC The
identified peaks correspond to: Millipore Water (3. 3 min) and Xylose (9.8 min).
The chromatogram on Figure 23 showed little variation between sugars produced from
the reaction of cellulases from the concentrate which contained EDTA (2mM) and the ones
produced from the enzyme mixture that did not contain any additive (Figure 21). One was only
able to identify xylose at approximately 10 minutes of retention time, despite the peak was less
noticeable than the one identified for the reaction between cellulose and the enzyme mixture
from the “Control” sample.
Because the peak of xylose had a residual area, and glucose and cellobiose peaks
were not even present, the conditions of the assay had to be improved. It was therefore chosen
to concentrate the enzyme mixture about twenty times more in the ultrafiltration step and also to
change the concentration of commercial cellulose from 10 g·L-1 to 30 g·L-1. Note that at this
point and due to inexperience, the experiments were being conducted on a trial and error basis.
The reaction was studied after 24h, 96h, 186h from start. The results for 96h and 186h
of reaction between commercial cellulose (30 g·L-1) and the cellulase mixture present in the
concentrate, which did not contain any additive (“Control”), are displayed on Figure 24 Figure
25.
Minutes
0 2 4 6 8 10 12 14 16 18 20 22 24 26 28 30
mV
olts
-100
0
100
200
300
400
500
600
700
800
900
1000
1100
1200
mV
olts
-100
0
100
200
300
400
500
600
700
800
900
1000
1100
1200
3,33
8 9
6,74
0 3
1802
229
9,79
6 2
,903
95
4322
21,4
32
0,35
7 1
1733
3
UV L-7400edta22hseconda_13.07.11
Retention TimeArea PercentArea

42
Figure 24 - HPLC chromatogram for 96h of reaction b etween commercial cellulose (30 g·L -1) and the enzyme mixture (20 times more concentrated) pre sent in the concentrate solution, recovered
from ultrafiltration of cellulases produced by A. terreus A-1 growing on Medium 1 (“Control”). Column :Lichrospher 100 NH 2 ; Mobile phase: 85%Acetonitrile/15%Water ; Flow r ate 1 mL/min at
23ºC. The identified peaks correspond to: Millipore Water (3.2 min) and Cellobiose (23.5 min).
Minutes
0 2 4 6 8 10 12 14 16 18 20 22 24 26 28 30
mV
olts
-100
0
100
200
300
400
500
600
700
800
900
1000
1100
1200
mV
olts
-100
0
100
200
300
400
500
600
700
800
900
1000
1100
1200
3,24
5 9
5,88
9 3
8098
936
23,5
43
4,11
1 1
6334
87
UV L-7400edtapiuconcentrato48h(15.07)_18.07.11
Retention TimeArea PercentArea

43
Figure 25 - HPLC chromatogram for 186h of reaction b etween commercial cellulose (30 g·L -1) and the enzyme mixture (20 times more concentrated) pre sent in the concentrate solution, recovered
from ultrafiltration of cellulases produced by A. terreus A-1 growing on Medium 1 (“Control”). Column :Lichrospher 100 NH 2 ; Mobile phase: 85%Acetonitrile/15%Water ; Flow r ate 1 mL/min at
23ºC. The identified peaks correspond to: Millipore Water (3.4 min) and Cellobiose (23.8 min).
As shown in Figure 24 and Figure 25, cellobiose was detected (RT=23 min) as the main
product of the reaction between commercial cellulose (30 g·L-1) and the enzyme mixture (20
times more concentrated) present in the “Control”. The peaks were, again, not very noticeable,
however it seems that the intensity of the cellobiose peak is slightly higher after 186h of reaction
than the one at 96h.
The following chromatograms (Figure 26 Figure 27) track the sugars released from the
enzymatic reaction of commercial cellulose (30 g·L-1) with the enzyme mixture (20 times more
concentrated) containing EDTA (2mM) over 96h and 186h of reaction time.
Minutes
0 2 4 6 8 10 12 14 16 18 20 22 24 26 28 30
mV
olts
-100
0
100
200
300
400
500
600
700
800
900
1000
1100
1200
mV
olts
-100
0
100
200
300
400
500
600
700
800
900
1000
1100
1200
3,36
0 9
2,90
1 3
6838
053
23,8
40
7,09
9 2
8151
42
UV L-7400controllopiuconcentrato96h+90h_19.07.11
Retention TimeArea PercentArea

44
Figure 26 - HPLC chromatogram for 96h of reaction be tween commercial cellulose (30 g·L -1) and
the enzyme mixture (20 times more concentrated) pre sent in the concentrate solution after ultrafiltration, which contained EDTA (2mM), added a t 96h of cultivation of A. terreus A-1 growing
on Medium 1. Column :Lichrospher 100 NH 2 ; Mobile phase: 85%Acetonitrile/15%Water ; Flow r ate 1 mL/min at 23ºC. The identified peaks correspond t o: Millipore Water (3.4 min) and Cellobiose
(23.1 min).
Minutes
0 2 4 6 8 10 12 14 16 18 20 22 24 26 28 30
mV
olts
-100
0
100
200
300
400
500
600
700
800
900
1000
1100
1200
mV
olts
-100
0
100
200
300
400
500
600
700
800
900
1000
1100
1200
3,40
3 9
7,74
1 3
5663
701
23,0
70
2,25
9 8
2442
2
UV L-7400edtapiuconcentrato92h_18.07.11
Retention TimeArea PercentArea

45
Figure 27 - HPLC chromatogram for 186h of reaction b etween commercial cellulose (30 g·L -1) and the enzyme mixture (20 times more concentrated) pre sent in the concentrate solution after
ultrafiltration, which contained EDTA (2mM), added a t 96h of cultivation of A. terreus A-1 growing on Medium 1. Column: Lichrospher 100 NH 2 ; Mobile phase: 85%Acetonitrile/15%Water ; Flow ra te
1 mL/min at 23ºC. The identified peaks correspond t o: Millipore Water (2.9 min) and Cellobiose (23.1 min).
The results of HPLC analysis shown on Figure 26 and Figure 27 show that cellobiose
was slightly detected at 23 min of retention time, although the results were, again, very
unsatisfactory, since the same samples recovered from ultrafiltration proved to have significant
endo-cellulasic activity. Still, it is worthy of note that while the activities estimated for cellulases
were specific for an endocellulase (the substrate used in the enzyme assay was CM-cellulose),
in this test one did not check only for the individual cellulose polysaccharide chains produced
from the action of endocellulases, but for the end products, such as cellobiose and glucose,
released from all cellulases acting synergistically. Activity tests regarding exocellulasic activity
should have been conducted in order to further analyze this aspect. It would be expected
however, to obtain glucose as an end product of the enzymatic reaction, since the NPG assay
showed β-glucosidase activity (Figure 17).
Comparing the sugars released from the reaction between cellulose and the enzyme
mixture containing EDTA (2mM) in the concentrate and the ones that did not contain an additive
(“Control”), one can observe that in both cases the same sugars are released, although lower
intensities of the peaks were observed when EDTA was added to the concentrate.
Minutes
0 2 4 6 8 10 12 14 16 18 20 22 24 26 28 30
mV
olts
-100
0
100
200
300
400
500
600
700
800
900
1000
1100
1200
mV
olts
-100
0
100
200
300
400
500
600
700
800
900
1000
1100
1200
2,93
8 9
6,92
4 3
4090
919
23,0
79
3,07
6 1
0818
98
UV L-7400edtapiuconcentrato96h+91h_19.07.11
Retention TimeArea PercentArea

46
All things considered, the results from HPLC analysis confirm the existence of
cellulases in the enzyme mixture produced by Aspergillus terreus A-1 strain, that act
synergistically to release sugars, such as xylose and cellobiose.
It is, however, possible that these results are not very realistic, since the sensitivity of
the refractive index detector was seriously affected and one struggled with adjusting the base
line, as well as with the recurrent presence of air bubbles in the system.

47
4. Conclusions and Future Perspectives
In this work cellulases were successfully produced by two strains, A-1 and N-Y, of
Aspergillus terreus isolated from soil. A. terreus A-1 strain seemed to follow a more regular
pattern and was, therefore, used in most of the experiments.
Different concentrations of cellulose, ranging from 20 g·L-1 to 60 g·L-1, were assayed as
the sole carbon source of the growth medium of A.terreus A-1 and N-Y strains. In this
experiment the activity of cellulases produced by A.terreus A-1 strain had a maximum (13.2
U/mL) at the concentration of 30 g⋅L-1 of cellulose. On the other hand, the maximum production
of cellulases by N-Y strain (10.2 U/mL) was obtained on 20 g⋅L-1 of cellulose.
For both strains the maximum cellulasic activity occurred between 72h and 96h of
incubation at 30ºC. Furthermore, when testing different concentration of spores to prepare the
inoculum, the cellulasic activity obtained using a 0.5 OD/mL concentration of spores was similar
or lower than the activity obtained when using a 0.1 OD/mL concentration.
The rate of production of cellulases, since they are extracellular enzymes, is greatly
influenced by the nutrient medium composition. Accordingly, two media containing different
sources of nitrogen, different MgSO4 concentration and different optimal pH were assayed in
order to achieve the optimal production of cellulases, in an attempt to maximize the cellulasic
activity. The use of sodium nitrate (2 g⋅L-1) instead of peptone (6 g⋅L-1), and a concentration 0.5
g·L-1 of MgSO4·7H2O instead of 1.72 g·L-1 proved to enhance the cellulolytic activities of
A.terreus A-1 and N-Y strains.
A different approach was performed introducing a vacuum filtration followed by an
ultrafiltration, after cultivation of A. terreus A-1 cultures for 96h at 30ºC. The vacuum filtration
successfully removed the mycelium, whereas the cellulase solution obtained from the previous
step was concentrated by ultrafiltration. The results obtained after performing the enzyme
activity assay were, however, unsatisfactory, as the activity of cellulases decreased after
ultrafiltration. This may have occurred due to the use of a membrane with an inappropriate
molecular weight cut-off (50 kDa), and thus cellulases with a molecular weight less than 50 kDa
may have passed to the permeate.
The stability of an enzyme is affected by various factors, such as temperature, which
can make them unsuitable for industrial applications. Hence, experiments were conducted in
order to test the thermal stability of cellulases present in the concentrate solution recovered
from ultrafiltration. The results obtained suggest that proteases had some effect on enzyme
activity, since it decreased after 48h of incubation at -20ºC. Therefore, it was decided to perform

48
cellulase activity assays right after the harvest of the cells and separation of cellulases, in order
to avoid undesirable protease action.
In addition, some experiments were carried out in order to assess the effect of protease
inhibitors on cellulase activity and stability. The results indicate that the protease inhibitor
cocktail and EDTA (2 mM) helped to stabilize cellulases, as their relative activity is 35.4 and
41%, respectively, higher than the activity of cellulases present in the control mixture, which did
not contain any additive. Other trials were performed with the same purpose, showing that the
addition of EDTA (2mM) to the mixture (after 96h of cultivation at 30ºC) increased the enzyme
activity of A. terreus A-1 cultures growing on media 1 and 2. Despite, the enzyme activity was
more pronounced for cellulases produced by A.terreus A-1 when growing on Medium 1. As for
the enzyme mixtures that contained EDTA (2mM) and the ones without an additive, the results
on cellulase activity were two-edged: the activity of cellulases, after the addition of EDTA,
remained almost constant and enzymes were apparently stable, yet the activities achieved were
lower than the ones obtained for the control mixture (without the addition of EDTA).
Moreover, it was investigated whether other cellulase activities existed besides endo-
1,4-β-D-glucanase in the enzyme mixture collected after 96h of incubation of Aspergillus terreus
A-1 cultures. Hence, an enzyme assay specific for β-glucosidase and α-arabinosidase was
conducted. In these experiments, cellulases produced by A.terreus A-1 showed β-glucosidase
and α-arabinosidase activities in addition to endo-1,4-β-D-glucanase, confirming the synergism
of the cellulase system. The activity of cellulases produced from fungi growing on Medium 1
was considerably higher compared to those produced by A.terreus grown on Medium 2,
suggesting that the former medium is optimal for the production of cellulases from A.terreus A-1.
It was also noted that the addition of EDTA (2 mM) at the beginning of cultivation (t=0h) of A.
terreus A-1 inhibited cellulase production, since the activities observed were much lower than
the ones obtained by cellulases growing without any additive.
In order to evaluate the capability of cellulases produced by Aspergillus terreus to
release fermentable sugars when reacting with commercial cellulose, the products of the
reaction were qualitatively analyzed, at different times, by HPLC using refractive index
detection. Overall, the results from HPLC analysis confirm the existence of cellulases in the
enzyme mixture produced by Aspergillus terreus A-1, that act synergistically to release sugars,
such as xylose and cellobiose. Samples containing EDTA (2mM) in the concentrate released
the same sugar as those that did not contain any additive (“Control”), when reacting with
commercial cellulose, although lower intensities of the peaks were observed in the former case.
It should be mentioned, however, that it is possible that these results are not very realistic, since
the sensitivity of the refractive index detector was seriously affected.

49
Future work
Although the results were not as expected, due to the available time and lack of
knowledge on the composition of the cellulases produced from A. terreus A-1 and N-Y strains, it
would be possible, in the future, to initiate the second phase of experiments: the fermentation of
the sugars released from the reaction of the enzyme mixture produced by Aspergillus terreus on
cellulose from plant biomass, using strains such as Saccharomyces cerevisiae, which are
known for their ability to produce ethanol in high concentrations. Because this particular yeast is
unable to ferment pentoses, such as xylose and arabinose, another future prospect would be
the use of non-conventional yeasts, such as Brettanomyces naardenensis, to ferment
substrates obtained in the previous step. The acquisition of information on carbon metabolism
by yeasts capable of fermenting xylose will allow the definition of the most appropriate mode of
the fermentation process (batch, fed-batch, or continuous culture) and the parameters for
chemical/physical optima (pH, temperature, oxygenation) for the development of the production
process of bioethanol on an industrial scale.
The bioprocess aspects regarding cellulosic biomass will become the crux of future
researches involving cellulases and cellulolytic microorganisms. The problems that require
attention are not limited to cellulase production alone, but need a concerted effort in
understanding the basic physiology of cellulolytic microbes. The use of this knowledge coupled
with engineering principles will, hopefully, enable better processing and the utilization of this
most abundant natural resource.

50
5. References
Ajayi and Adejuwon A.O., Awojobi O.K., Olutiola P.O . 2007. Effect of Cations and Chemicals
on the Activity of Partially Purified Cellulase from Tomato (Lycopersicon esculentum Mill) Fruits
Deteriorated by Aspergillus flavus, Pakistan Journal of Nutrition, 2007. pp. 198-200. Vol. 6.
Akiba and Kimura Y., Yamamoto K., Kumagai. 1995. Purification and Characterization of a
Protease-Resistant Cellulase from Aspergillus niger, Journal of Fermentation and
Bioengineering, 1995. pp. 125-130. Vol. 79.
Ali, S. and Sayed A., Sarker R. I., Alam R. 1991. Factors affecting cellulase production by
Aspergillus terreus using water hyacinth, World J. of Microbial and Biotechnol., 1991. pp. 62-66.
Vol. 7.
Babel, et al. 2007. Advances in Biochemical Engineering/Biotechnology: Biofuels, Springer,
2007.
Blondin, B. 1983. Purification and properties of the β-glucosidase of a yeast capable of
fermenting cellobiose to ethanol, Eur. J. Appl. Microb. Biotech., 1983.
Bradford, M. 1976. A Rapid and Sensitive Method for the Quantitation of Microgram Quantities
of Protein Utilizing the Principle of Protein-Dye Binding, ANALYTICAL BIOCHEMISTRY, 1976.
pp. 248-254.
Chang, X. and Minnan L., Xiaobing W., Huijuan X., Z hongan C., Fengzhang Z., Liangshu
X. 2006. Screening and Characterization of the High-Cellulase-Producing Strain Aspergillus
glaucus XC9, Higher Education Press and Springer-Verlag, 2006.
Charles, P. and Devanathan V., Anbu P., Ponnuswamy M. N., Kalaichelvan P. T., Hur B.
2008. Purification, characterization and crystallization of an extracellular alkaline protease from
Aspergillus nidulans HA-10, Journal of Basic Microbiology, 2008. pp. 347–352. Vol. 48 .
Cleantech, Magazine. 2010. Low cost enzymes could catalyse a revolution in ethanol
production. [Online] April 2010. http://www.cleantechinvestor.com/portal/bioenergy/5164-
enzymes.html.
Damisa, D. and Ameh, J.B., Egbe, N.E.L. 2011. Cellulase Production by native Aspergillus
niger obtained from soil environments. 2011.
DeVries, R.P. and J., Visser. 2001. Aspergillus Enzymes Involved in Degradation of Plant Cell
Wall Polysaccharides, American Society for Microbiology, 2001.
DISMA Biochemistry Lab., University of Milan. 2010. Molecular details of the interaction
between cellylolytic enzymes and their substrates. 2010.

51
Elshafei, A. M. and Hassan, M. M., Haroun, B. M., A bdel-Fatah, O. M., Atta, H. M. and
Othman, A. M. 2009. Purification and properties of an endoglucanase of Aspergillus terreus
DSM 826, Journal of Basic Microbiology, 2009. pp. 426–432. Vol. 49.
Emtiazi, G. and Naghavi N., Bordbar A. 2001. Biodegradation of lignocellulosic waste by
Aspergillus terreus. 2001.
Ganesh, K. and Joshi J.B., Sawant S.B. 2000. Cellulase deactivation in a stirred reactor,
Biochemical Engineering Journal 4, 2000. pp. 137-141.
Gao, J. and Weng H., Yu Xi, Daheng Zhu, Shaoyin Han . 2007. Purification and
characterization of a novel endo-b-1,4-glucanase from the thermoacidophilic Aspergillus
terreus, Springer Science, 2007.
Gao, J. and Weng H., Zhu D., Yuan M., Guan F., Xi Y . 2008. Production and characterization
of cellulolytic enzymes from the thermoacidophilic fungal Aspergillus terreus M11 under solid-
state cultivation of corn stover, Bioresource Technology, 2008.
Garg, S. K. and Neelakantan, S. 1982. Studies on the properties of cellulase enzyme from
Aspergillus terreus GN1, Biotechnology and Bioengineering,, 1982. pp. 737–742. Vol. 24.
Gautam, S.P. and Bundela P.S., Pandey A.K., Awasthi M.K., Sarsaiya S. 2010. Effect of
different carbon sources on production of cellulases by Aspergillus niger, Journal of Applied
Sciences in Environmental Sanitation, 2010.
GmbH, SERVA Electrophoresis. 2011. SERVA Electrophoresis GmbH. Cellulases. [Online]
2011. http://www.serva.de/servaWeb/www_root/documents/16419_26.pdf.
Goldschmidt, Felix. 2008. From Cellulose to Ethanol: Engineering Microorganisms to Produce
Biofuel. Institute of Biogeochemistry and Pollutant Dynamics, Department Environmental
Sciences. Zurich, 2008.
Gusakov, A. V. and Salanovich T. N., Antonov A. I., Ustinov B. B., Okunev O. N.,
Burlingame R., Emalfarb M., Baez M., Sinitsyn A. P. 2007. Design of Highly Efficient
Cellulase Mixtures, Wiley InterScience, 2007.
Henrissat, B. et al. 1985. Biotechnology. 1985. pp. 722-6. Vol. 3.
Humbird, D. and Davis R., Tao L.,Kinchin C., Hsu D. , Aden A. 2011. Process Design and
Economics for Biochemical Conversion of Lignocellulosic Biomass to Ethanol (Dilute-Acid
Pretreatment and Enzymatic Hydrolysis of Corn Stover). [Online] National Renewable Energy
Laboratory, May 2011. [Cited: September 16, 2011.]
http://www.nrel.gov/biomass/pdfs/47764.pdf.

52
Hussain, A. and Mannan A., Zubair H., Mirza B. 2010 . Purification and Characterization of
Alkaline Proteases from Aspergillus terreus, J. Chem. Soc. Pak., 2010. Vol. 32.
Jahromi, M. F. and J.B. Liang, M. Rosfarizan, Y.M. Goh, P. Shokryazdan, Y.W. Ho. 2011.
Efficiency of rice straw lignocelluloses degradability by Aspergillus terreus ATCC 74135 in solid
state fermentation. 2011.
Kassebullah, M. N. B. 2006. Production of cellulase enzyme from Aspergillus terreus SUK-1
using sugar cane waste: The effect of substrate concentration and assay temperature. Faculty
of Chemical Engineering and Natural Resources. Malaysia, 2006.
MacCabe, A. P. and Orejas M., Tamayo E.N., Villanue va A., Ramón D. 2002. Improving
extracellular production of food-use enzymes from Aspergillus nidulans. Instituto de
Agroquimica y Tecnologia de Alimentos (CSIC). Valencia, Spain : Journal of Biotechnology,
2002.
Mandels, M. and Andreotti R., Roche C. 1976. Measurement of saccharifying cellulase,
Biotechnol Bioeng Symp, 1976. pp. 21–33.
Mores, W. D. and Knutsen J. S., Davis R. H. 2001. Cellulase Recovery via Membrane
Filtration, Department of Chemical Engineering, University of Colorado, 2001.
Nour, M.S. and Wahab M.N.A., Ariff A., Mohamad R. 2 011. Optimization of Cellulase
Production by Aspergillus Terreus under Submerged Fermentation Using Response Surface
Methodology, Australian Journal of Basic and Applied Sciences, 2011.
Ogel, Z.B. and K. Yarangumeli, H. Du, J. Ifrij. 200 1. Submerged cultivation of Scytalidium
thermophilum on complex lignocellulosic biomass. s.l. : Enzyme Micobiol. Technol. 28, 2001.
pp. 689-695.
Sukumaran, R. K. and Sighania R. R., Pandey A. 2005 . Microbial cellulases - Production,
applications and challenges. s.l. : Journal of Scientific & Industrial Research, 2005.
Teter, S. and Joel, R. Cherry. 2005. Improving Cellulose Hydrolysis with New Cellulase
Compositions. Novozymes, Inc. 2005.
Usama, F. A. and SaadEl-Dein, H. S. 2008. Production and Partial Purification of Cellulase
Complex by Aspergillus niger and A. nidulans Grown on Water Hyacinth Blend, Journal of
Applied Sciences Research, 2008.
VanHanh and Pham T.A., Kim K. 2010. Improvement of Fungal Cellulase Production by
Mutation and Optimization of Solid State Fermentation, Mycobiology, 2010.

53
Verma, N. and Vivek K., Bansal M.C. 2011. Importance of cellulases in bioethanol from
biomass: A review. [Online] 2011. [Cited: September 16, 2011.] www.compete-
bioafrica.net/events/events2/seminar_india/.../5-5-Verma.pdf.
Wang, H. T. and T., Hsu J. 2006. Usage of Enzyme Substrate to Protect the Activities of
Cellulase, Protease and α-Amylase in Simulations of Monogastric Animal and Avian Sequential
Total Tract Digestion, Asian-Aust. J. Anim. Sci., 2006. pp. 1164-1173. Vol. 19 .
Watanabe, H. and Tokuda, G. 2009. Cellulolytic Systems in Insects, Annual Review of
Entomology, 2009.
Wikipedia. 2011. Types of Cellulases. [Online] 2011.
http://en.wikipedia.org/wiki/File:Types_of_Cellulase2.png.
Wilson, D. B. 2009. Cellulases and biofuels. Elsevier, 2009.

54
Appendix I
HPLC Analysis Sugar Standards
Column: Prepacked Column RT Polyspher-OA HY (300 x 6.5 mm) ; M obile Phase: H 2SO4 0.0025 M
Flow rate: 0.3 mL/min ; P=23 bar ; T=65ºC.
Figure 28 - HPLC chromatogram for a standard solutio n of Cellobiose (10 g·L -1). Column:
Prepacked Column RT Polyspher-OA HY (300 x 6.5 mm) wit h a H2SO4 0.0025 M mobile phase. Flow rate: 0.3 mL/min ; P=23 bar ; T=65ºC.

55
Figure 29 - HPLC chromatogram for a standard solutio n of Glucose (10 g·L -1). Column: Prepacked Column RT Polyspher-OA HY (300 x 6.5 mm) with a H 2SO4 0.0025 M mobile phase. Flow rate: 0.3
mL/min ; P=23 bar ; T=65ºC.
Figure 30 - HPLC chromatogram for a standard solutio n of Xylose (10 g·L -1). Column: Prepacked Column RT Polyspher-OA HY (300 x 6.5 mm) with a H 2SO4 0.0025 M mobile phase. Flow rate: 0.3
mL/min ; P=23 bar ; T=65ºC.

56
Figure 31 - HPLC chromatogram for a standard solution of Arabino se (10 g·L -1). Column: Prepacked Column RT Polyspher-OA HY (300 x 6.5 mm) wit h a H2SO4 0.0025 M mobile phase. Flow
rate: 0.3 mL/min ; P=23 bar ; T=65ºC.

57
Concentrate solution, medium 1
Column: Prepacked Column RT Polyspher-OA HY (300 x 6.5 mm) ; M obile Phase: H 2SO4 0.0025 M
Flow rate: 0.3 mL/min ; P=23 bar ; T=65ºC.
Time of reaction: 0h
Figure 32 - HPLC chromatogram for 0h of reaction bet ween commercial cellulose and the enzyme mixture present in the concentrate solution, recove red from ultrafiltration of cellulases produced
by A. terreus A-1 growing on Medium 1.

58
Time of reaction: 1h
Figure 33 - HPLC chromatogram for 1h of reaction bet ween commercial cellulose and the enzyme mixture present in the concentrate solution, recove red from ultrafiltration of cellulases produced
by A. terreus A-1 growing on Medium 1.

59
Time of reaction: 18h
Figure 34 - HPLC chromatogram for 18h of reaction be tween commercial cellulose and the enzyme mixture present in the concentrate solution, recove red from ultrafiltration of cellulases produced
by A. terreus A-1 growing on Medium 1. The peaks id entified for Cellobiose (12.8) and Glucose (15.4) were superimposed.

60
Concentrate solution, medium 2
Column: Prepacked Column RT Polyspher-OA HY (300 x 6.5 mm) ; M obile Phase: H 2SO4 0.0025 M
Flow rate: 0.3 mL/min ; P=23 bar ; T=65ºC.
Time of reaction: 0h
Figure 35 - HPLC chromatogram for 0h of reaction bet ween commercial cellulose and the enzyme mixture present in the concentrate solution, recove red from ultrafiltration of cellulases produced
by A. terreus A-1 growing on Medium 2.

61
Time of reaction: 1h
Figure 36 - HPLC chromatogram for 1h of reaction bet ween commercial cellulose and the enzyme mixture present in the concentrate solution, recove red from ultrafiltration of cellulases produced
by A. terreus A-1 growing on Medium 2.
Time of reaction: 18h
Figure 37 - HPLC chromatogram for 18h of reaction be tween commercial cellulose and the enzyme mixture present in the concentrate solution, recove red from ultrafiltration of cellulases produced
by A. terreus A-1 growing on Medium 2.

62
Appendix II
HPLC Analysis Column: Lichrospher 100 NH 2 column (4 x 250 mm) ; Mobile Phase: 85:15 (v/v) a cetonitrile/water
Flow rate: 1 mL/min ; Temperature: 23ºC.
Control sample, Time of reaction: 0h
Figure 38 – HPLC chromatogram for 0h of reaction bet ween commercial cellulose (10 g·L -1) and the enzyme mixture present in the concentrate solution, recovered from ultrafiltration of cellulases
produced by A. terreus A-1 growing on Medium 1 (“Control”). The identifie d peak corresponds to: Millipore Water (3.6 min)
Minutes
0 2 4 6 8 10 12 14 16 18 20 22 24 26 28 30
mV
olts
-100
0
100
200
300
400
500
600
700
800
900
1000
1100
1200
mV
olts
-100
0
100
200
300
400
500
600
700
800
900
1000
1100
1200
3,65
0 1
00,0
00
3933
5240
UV L-7400controllo0h_12.07.11
Retention TimeArea PercentArea

63
Control sample, Time of reaction: 2h
Figure 39 - HPLC chromatogram for 2h of reaction bet ween commercial cellulose (10 g·L -1) and the enzyme mixture present in the concentrate solution, recovered from ultrafiltration of cellulases
produced by A. terreus A-1 growing on Medium 1 (“Control”). The identifie d peak corresponds to: Millipore Water (3.4 min)
Minutes
0 2 4 6 8 10 12 14 16 18 20 22 24 26 28 30
mV
olts
-100
0
100
200
300
400
500
600
700
800
900
1000
1100
1200
mV
olts
-100
0
100
200
300
400
500
600
700
800
900
1000
1100
1200
3,36
8 1
00,0
00
4249
9139
UV L-7400controllo2h_12.07.11
Retention TimeArea PercentArea

64
EDTA t=96h sample, Time of reaction: 0h
Figure 40 - HPLC chromatogram for 0h of reaction bet ween commercial cellulose (10 g·L -1) and the enzyme mixture present in the concentrate solution recovered from ultrafiltration, which contained
EDTA (2mM), added at 96h of cultivation of A. terreus A-1 growing on Medium 1. The identified peak corresponds to: Millipore Water (3.6 min)
Minutes
0 2 4 6 8 10 12 14 16 18 20 22 24 26 28 30
mV
olts
-100
0
100
200
300
400
500
600
700
800
900
1000
1100
1200
mV
olts
-100
0
100
200
300
400
500
600
700
800
900
1000
1100
1200
3,64
8 1
00,0
00
3931
3879
UV L-7400edta0h_12.07.11
Retention TimeArea PercentArea

65
EDTA t=96h sample, Time of reaction: 2h
Figure 41 - HPLC chromatogram for 2h of reaction bet ween commercial cellulose (10 g·L -1) and the enzyme mixture present in the concentrate solution recovered from ultrafiltration, which contained
EDTA (2mM), added at 96h of cultivation of A. terreus A-1 growing on Medium 1. The identified peak corresponds to: Millipore Water (3.6 min).
Minutes
0 2 4 6 8 10 12 14 16 18 20 22 24 26 28 30
mV
olts
0
100
200
300
400
500
600
700
800
900
1000
1100
1200
mV
olts
0
100
200
300
400
500
600
700
800
900
1000
1100
1200
3,67
0 9
9,45
7 3
9115
402 24,6
75
0,54
3 2
1365
7
UV L-7400edta2h_12.07.11
Retention TimeArea PercentArea

66
Control sample (20 times more concentrated), Time of reaction: 24h
Figure 42 - HPLC chromatogram for 24h of reaction be tween commercial cellulose (30 g·L -1) and the enzyme mixture (20 times more concentrated) pre sent in the concentrate solution, recovered
from ultrafiltration of cellulases produced by A. terreus A-1 growing on Medium 1 (“Control”). The identified peaks correspond to: Millipore Water (3. 3 min) and Cellobiose (23.5 min).
Minutes
0 2 4 6 8 10 12 14 16 18 20 22 24 26 28 30
mV
olts
-100
0
100
200
300
400
500
600
700
800
900
1000
1100
1200
mV
olts
-100
0
100
200
300
400
500
600
700
800
900
1000
1100
1200
3,24
5 9
5,88
9 3
8098
936
23,5
43
4,11
1 1
6334
87
UV L-7400edtapiuconcentrato48h(15.07)_18.07.11
Retention TimeArea PercentArea