dissertation pathophysiology of cutaneous t-cell lymphoma
TRANSCRIPT

1
Dissertation
Pathophysiology of cutaneous T-cell lymphoma: Understanding of neoplastic T-
cells and non-malignant infiltrate in lesional skin
submitted by
Pablo Augusto VIEYRA GARCIA
for the Academic Degree of
Doctor of Philosophy
(PhD)
at the
Medical University of Graz
Department of Dermatology
under the Supervision of
Prof. Dr. Peter WOLF
2016

2
Hereby, I disclose that part of the results included in this dissertation was
published in The Clinical Cancer Research journal in a paper entitled “STAT3/5-
Dependent IL9 Overexpression Contributes to Neoplastic Cell Survival in
Mycosis Fungoides” (Jul 1st 2016, doi: 10.1158/1078-0432.CCR-15-1784). The
inclusion of such materials was done under the permission of the publisher.
I declare that this dissertation is my own original work and that I have fully
acknowledged by name all of those individuals and organizations that have
contributed to the research for this dissertation. Due acknowledgement has
been made in the text to all other material used. Throughout this dissertation
and in all related publications I followed the guidelines of “Good Scientific
Practice”
January 2017.

3
El universo tiene un plan general, las minucias de ese plan queda
a cargo de la ejecución de los actores
JL Borges reviewing “The free will controversy” (M Davidson, 1943)

4
Table of Contents
Abstract (English) 1
Abstract (Deutsch) 3
Introduction 5 Cutaneous T-cell lymphoma 5 Mycosis fungoides 6 Genomic instability 8 Gain and loss of function mutations 8 Cytokine and chemokine microenvironment 10 Cell of origin 13 High throughput TCR sequencing 15 Non-malignant infiltrating immune cells 16 Local therapy for MF 17
Research problem statement 21
Results 22 Transcriptional profile of early MF 22 Inflammatory signals on CTCL cell lines 32 Targeting inflammatory signals limits malignant cell development/activity 38 Animal models highlight the importance of inflammatory signals 43 Therapies in humans like PUVA modulate inflammatory signals without complete elimination of malignant cells 48
Discussion 72
Conclusions 81
Materials and methods 83 Patients 83 Cell lines 83 Nanostring analysis 84 KEGG pathway analyses 84 Enzyme linked immunoassay 84 Flow cytometry 85 Genetic material isolation and polymerase chain reaction 85 Proliferation assay 86 Supernatant supplementation 86 In vitro IL-9 stimulation and inhibition 86 In vitro PUVA 87 In vitro JAK/STAT and IRF4 inhibition 87 EL-4 lymphoma animal model 87 PUVA In vivo 88 Depletion of IL-9 in vivo 88 mSWAT and CAILS clinical assessment 88 High throughput TCR sequencing 90 Histological examinations 91 Fluorescence imaging and analyses 94 Statistics 95
References 96
Appendices 112

5
Abbreviations 112 Conference presentations 114 Awards 115 Publications 115
Acknowledgements: 116

1
Abstract (English)
In Mycosis fungoides (MF), neoplastic T-cells feed from chronic inflammation,
their survival and resilience to therapy is closely tied to an abnormal pro-
inflammatory microenvironment. Malignant cells produce recruitment mediators
and growth factors and as disease progress, these cells accumulate mutations
that enable them to better suit their environment. As skin lesions deteriorate,
patients are left unable to fence off opportunistic pathogens and recurrent
infections may end up with fatal consequences. Neoplastic cells are just a
fraction of the infiltrating cells found in lesional MF skin. Although these cells in
most cases outnumber with their predominant clonality the rest of the T-cell
population, benign T-cells and other immune cell types nevertheless play an
important role in the disease. This is evidenced by the fact that therapeutic
strategies that induce immune tolerance and apoptosis like psoralen + UVA
(PUVA) and extracorporeal photopheresis have a high degree of efficiency;
nonetheless, the mechanistic effect of immune modulation has remained
elusive.
In this work, the effects of PUVA on neoplastic cells, benign T-cells, and other
immune cells that infiltrate skin lesions of MF patients were investigated.
Transcriptional analyses of lesional skin showed enriched expression of T-cell
activation-related, antigen processing-presentation and JAK-STAT signalling
genes. After PUVA therapy, the expression of many of these genes was
partially normalized.
Lesional skin had a high number of neoplastic and benign T-cells producing IL-
9. In vitro studies indicated that the production of this cytokine was regulated
by STAT3/5 and IRF4. High throughput sequencing (HTS) of the T-cell receptor
(TCR) was used to look at the T-cell repertoire and identified malignant clones
in skin biopsies from patients. Although patients had a significant clinical
improvement to PUVA, remaining malignant clones were found in biopsies after
treatment and clinical response correlated with benign T-cell turnover.
Multicolour immunofluorescence was used to look at the composition of the cell

2
infiltrate in lesional skin and a decrease of Langerhans cells and skin resident
T-cells was observed after PUVA.
These results emphasize the importance of inflammatory mediators like IL-9
and its regulators as well as the non-malignant immune cell infiltrate in the
pathophysiology of MF. The mouse in vivo studies of this work in which the
administration of an IL-9 blocking antibody delayed tumour growth and
prolonged survival of animals, suggested that such anti-inflammatory treatment
strategy could be beneficial to MF patients. Further efforts are needed to
explore the targeting of neoplastic cells like the ones here presented with IL-9
as one of the key molecules in the onset of MF.

3
Abstract (Deutsch)
Mycosis fungoides (MF) ist charakterisiert durch neoplastische T-Zellen, die
von chronischer Entzündung zehren. Das Überleben dieser Zellen und ihre
Widerstandsfähigkeit gegen Therapien ist eng mit Abnormitäten der pro-
inflammatorischen Mikroumgebung vergesellschaftet. Maligne Zellen
produzieren Wachstumsfaktoren sowie Mediatoren zur weiteren
Zellrekrutierung und mit fortschreitender Erkrankung sammeln sich Mutationen
an, die den malignen Zellen bessere Anpassung an ihre Umgebung erlauben.
Mit Verschlechterung der Hautveränderungen wird es Patienten unmöglich,
opportunistische Pathogene abzuwehren, sodass wiederkehrende Infektionen
fatal enden können. Neoplastische Zellen sind jedoch nur ein Teil der Zellen,
die läsionale Haut von MF Patienten infiltrieren. Obwohl diese Zellen in den
meisten Fällen mit ihrer prädominanten Klonalität die restliche T-Zell Population
an Zahl übertreffen, so spielen benigne T-Zellen und andere Immunzelltypen
dennoch eine wichtige Rolle in der Erkrankung. Dies ist bewiesen durch die
Tatsache, dass therapeutische Strategien welche Immuntoleranz und
Apoptose induzieren, so wie etwa Psoralen + UVA (PUVA) und Extrakorporale
Photopherese, ein hohes Maß an Effizienz aufweisen; dennoch, der
Mechanismus der Immunmodulation blieb bisher verschleiert.
In dieser Arbeit wurden die Effekte von PUVA auf neoplastische Zellen,
benigne T-Zellen und andere Immunzellen, welche die Hautläsionen von MF
Patienten infiltrieren, untersucht. Transkriptionsanalysen von läsionaler Haut
zeigten gehäufte Expression von Genen der T-Zellaktivierung, der
Antigenprozessierung und -präsentation, sowie des JAK-STAT Signalweges.
Nach PUVA-Therapie war die Expression vieler dieser Gene teilweise
normalisiert.
Hautläsionen wiesen eine große Anzahl an IL-9-produzierenden
neoplastischen und benignen T-Zellen vor. In vitro Studien zeigten, dass die
Produktion dieses Zytokins durch STAT3/5 und IRF4 reguliert ist. High-
Throughput-Sequenzierung (HTS) des T-Zell Rezeptors (TCR) wurde
angewendet um das T-Zell Repertoire zu untersuchen und maligne Klone in

4
Hautbiopsien von Patienten zu identifizieren. Obwohl Patienten klinisch
signifikante Besserung nach PUVA zeigten, konnten auch in Biopsien nach
Therapie verbleibende maligne Klone gefunden werden. Die klinische
Besserung korrelierte mit Umsatz benigner T-Zellen. Mithilfe von Multicolor-
Immunfloreszenz konnte die Komposition der Zellinfiltrate in Hautläsionen
untersucht und eine Abnahme von Langerhans-Zellen und Haut sesshaften T-
Zellen beobachtet werden.
Diese Ergebnisse unterstreichen die Bedeutung inflammatorischer Mediatoren
wie IL-9 und deren Regulatoren ebenso wie die der nicht-malignen Zellinfiltrate
in der Pathophysiologie der MF. Die In-vivo-Studien im Mausmodell dieser
Arbeit, bei welchen die Verabreichung eines IL-9-blockierenden Antikörpers
das Tumorwachstum verlangsamte und das Überleben der Tiere verlängerte,
deuten darauf hin, dass eine solche anti-inflammatorische
Behandlungsstrategie bei MF Patienten wirksam sein könnte. Es bedarf
weiterer Anstrengungen das Targeting maligner Zellen wie in dieser Arbeit mit
IL-9 als einem der Schlüsselmoleküle in der Anfangsphase von MF zu
untersuchen.

5
Introduction
Biologic understanding of cancer is fundamental to improve and save the lives
of the thousands of people suffering from it. Although lymphomas account for
only a small proportion of the total number of malignancies diagnosed every
year, they are a general challenge in diagnosis and treatment. Just in the United
States there are approximately 750 new diagnoses of cutaneous lymphomas
every year (Bradford et al., 2009) and over 70% of them are cutaneous T-cell
lymphomas (CTCL). This is the leading type of lymphocytic malignancy
observed in the skin and yet many aspects about the aetiology of this disease
remain elusive. Skin lesions expand slowly but steadily and the majority of
patients in remission end up relapsing, sometimes after years of treatment
(Wilcox, 2016).
Cutaneous T-cell lymphoma
CTCL is a heterogeneous group of lymphoproliferative diseases characterized
by the accumulation of CD3 lymphocytes in the skin. CTCL has two major
forms; mycosis fungoides (MF), is the form of this disease limited to the skin
and Sèzary syndrome (SS) or leukemic-CTCL (L-CTCL), a condition where the
neoplastic cells not only harbour in the skin but also circulate in blood and
invade lymphoid tissue (Willemze et al., 2005). Together they account for two
thirds of the total number of CTCL cases reported per year in the United States
(Criscione and Weinstock, 2007). The incidence of these malignancies
increases every year. By 2015, about 6.4 million CTCL patients were affected
according to the Surveillance, Epidemiology, and End Results (SEER) registry
data (Wilcox, 2016). In the region of lower Austria in St. Pölten, between 2006
and 2013, 86 primary cutaneous lymphoma patients were diagnosed. 83% of
these cases were CTCL from whom 47 patients were classified as MF (Eder et
al., 2015). The numbers in other parts of Austria are very similar. Globally, the
demographics of CTCL indicate a higher occurrence in males with African-
American people being more frequently affected (Bradford et al., 2009). The
mean age of CTCL occurrence is between 50 to 60 years and the risk grows
higher with age. The risk of developing CTCL in over 70 year-olds is four times
higher to the younger population (Agar et al., 2010).

6
The causes of CTCL remain controversial. No epidemiological study has shown
a consistent environmentally or virally associated cause for CTCL. However,
infection with human T-lymphotropic virus 1 (HTLV-1) leads to adult T-cell
leukemia (Whittemore et al., 1989). More recently an association of MF with
hydrochlorothiazide was found in a set of patients with early stage MF.
However, the MF-like lesions in these patients did not show TCR monoclonality
(Jahan-Tigh et al., 2013). Nevertheless, this observation indicates that certain
drugs may play a role in initiation and the promotion of the disease.
A good assessment of clinical signs, extent of affected skin and extra-
cutaneous involvement as well as precise staging is fundamental to establish
an accurate prognosis for these patients (Arulogun et al., 2008). The
management of the disease benefits from the search for surface cell
biomarkers such as CD26 and CD7 (Pierson et al., 2008) that help to estimate
malignant T-cell burden and distinguish the phenotype of neoplastic cells from
benign T-cells.
Mycosis fungoides
MF is the most common type of CTCL with a yearly rate of 54% of primary skin
T-cell lymphomas (Weinstock and Gardstein, 1999). Under the microscope,
neoplastic cells have a characteristic cerebriform nucleus and vary in size from
small to medium (Willemze et al., 2005). An epidermotropic band-like infiltrate
is formed involving papillary dermis accompanied by substantial epidermal
spongiosis. In many cases, malignant cells harbour in epidermal compartments
named Pautrier’s micro-abscesses (Girardi et al., 2004). Definitive diagnosis of
MF is challenging as many of the clinical and pathologic features are not
specific and many of them are shared with eczema and parapsoriasis.
Therefore, patients are monitored sometimes even for years before a definitive
diagnosis is made (Arulogun et al., 2008). Lesional skin usually evolves through
several phases, in which most affected individuals start with lesions classified
as patches; flat, scaly pink-reddish pigmented areas sometimes accompanied
by pruritus. Patches form on the lower abdomen, upper thighs, buttocks and
breasts. In most individuals some or all patches progress to plaques, i.e. raised

7
lesions with often a more severe hyperpigmentation and itch. Usually these
lesions are in the same location of the initial patch or arise independently at a
different location and the patient can present both kinds of lesions. Patches and
plaques can remain stable for years or may advance into tumour stage early
on. MF tumours have a substantially increased cellularity. Their raised skin is
even more pronounced and the infiltrate goes deeper into the tissue. The skin
barrier function is compromised which may lead to severe, most often
opportunistic infections (Yamashita et al., 2012). Up to 30% of MF patients have
a concomitant infection with S. aureus. Many cases of MF have non-malignant
clones that proliferate and secrete inflammatory mediators in response to
bacterial toxins acting as super-antigens (Jackow et al., 1997).
Patients with a high ratio of CD8 positive cells (Hoppe et al., 1995) and CD1a
positive Langerhans cells (Meissner et al., 1990) in skin lesions have a better
prognosis, however, the role of these cells at the onset of MF is not fully
understood. High serum levels of LDH, 2-microglobulin and IL-2 have been
associated with higher severity of the disease and poor prognosis
(Diamandidou et al., 1999). Local therapy is preferred in early stage MF while
systemic treatment is often reserved for more advanced stages (Al Hothali,
2013).
SS is the second most common type of CTCL; it is an aggressive presentation
of the disease that rarely is preceded by MF lesions. SS patients are affected
by erythroderma, pruritus, lymphadenopathy and have the distinctive
characteristic of neoplastic cells circulating in blood (Yamashita et al., 2012).
Although malignant cells in MF and SS appear similar, molecular biology
studies have shown how different these diseases actually are. High resolution
genomic hybridization uncovered the chromosomal alterations most commonly
observed in MF and highlighted the difference with those seen in SS. MF
patients had duplications of chromosomes 7q21-36 and 1p36-2 and deletions
in 5q13 and 9p21. In contrast, SS patients had duplications in 17q22-25 and
8q22-24 and deletions in 17p13 and 10q25. These findings were fundamental

8
to change the misconception of SS being a severe stage of MF and separate
the diseases into two distinct entities (van Doorn et al., 2009).
Genomic instability
Altered chromosomal copy numbers are relevant for the prognosis of numerous
malignancies (Zack et al., 2013). In CTCL, risk stratification based on gene
expression and cytogenetic analysis is only beginning to be explored. An
inverse correlation between time of survival and absolute copy number
alterations has been described (Salgado et al., 2010). Patients with less than
three copy number alterations have a mean survival of 93 months while patients
with more than 3 alterations have a survival mean of only 67 months, a rate
substantially lower than those with fewer alterations (Caprini et al., 2009). As
disease progresses, patients accumulate structural and numerical
chromosomal aberrations with recurrent deletions in 1p, 6q, 9p, 10q, 17p and
19p (Karenko et al., 2003, Batista et al., 2006). More than 70% of patients
present a spectrum of chromosomal abnormalities (Mao et al., 2002).
Microsatellite instability is a reflection of impaired DNA repair mechanisms and
contributes to mutagenesis in tumour-suppression genes. It is frequently seen
in MF patients and is accentuated in advanced stages (Scarisbrick et al., 2003).
Three groups of genes with significant abnormalities were found in the seminal
study with 62 patients of Shin et al. In this work, genes were clustered into those
that maintain chronic activation of T-cell proliferation, cell adhesion or skin
homing molecules (Shin et al., 2007). Additionally, genes belonging to the TNF
signalling pathway have been found altered in CTCL (Litvinov et al., 2010).
Gain and loss of function mutations
One of the hallmarks of carcinogenesis is the acquisition of gain of functions
through mutations; resulting in the expression of genes making neoplastic cells
better suited to their environment (Hanahan and Weinberg, 2011). Such
mutations may be caused by chromosomal translocations, leading to a series
of gene expression abnormalities like; gene silencing, fusion proteins, up
regulation through duplication of genes and chronic activation (Margolskee et
al., 2016). Intriguingly, malignant cells replicate the diversity of T-cell

9
populations in the skin and gain of function mutations seem to magnify the
phenotype from which the malignant cells arise. This has been seen in a subset
of SS patients who may have a malignant clone with a regulatory T-cell (Treg)
like phenotype, positive for Foxp3 and a cytokine secretion profile enriched with
TGF- and IL-10 (Berger et al., 2005). Another group of SS patients develops
malignant clones with a Th2-like phenotype, positive for GATA3, IL-4, IL-13 and
IL-5 (Wang et al., 2014, Vowels et al., 1994). Furthermore, Th17 phenotype
malignant clones resulting from JAK3 V722I activating mutations have been
described in a group of CTCL patients (Ehrentraut et al., 2016). In accordance
to this, animal models have shown an up regulation of IL-17F in aggressive
lymphoma whereas IL-17A has been found overexpressed in MF patients
(Krejsgaard et al., 2013). Furthermore, activating mutations in genes required
for T-cell differentiation like in PLCG1 a trans-activator of NFAT have been
reported in CTCL (Vaque et al., 2014). IRF4 is an oncogene mutated in myeloid
and B-cell leukemia and it has also been found translocated reciprocally with
TCR-α in CD30 positive CTCL (Pham-Ledard et al., 2010). Recent results by
our group and also presented in this work have shown up-regulation of IRF4 in
IL-9 producing cells in MF (Vieyra-Garcia et al., 2016). Over 90% of MF patients
are positive for nuclear NFB p65, implying that constitutive activation through
mutation of this pathway is fundamental for malignant T-cell transformation.
Constant activation of NFB leads to resistance to apoptosis and
chemotherapeutic agents in neoplastic T-cells (Sors et al., 2006).
Several reports describe a consensus on the relevance of the JAK/STAT
signalling pathway in CTCL, showing a consistent translocation of STAT3 to
the nucleus (Nielsen et al., 1997). This results in deregulation of apoptosis
mediators like Bcl-2/Bax (Verma et al., 2010) and up regulation of DNMT1, a
promoter of epigenetic silencing of tumour suppression genes (Zhang et al.,
2006). Additionally, STAT5 induces expression of miR-21 (Lindahl et al., 2016)
and miR-155 (Kopp et al., 2013), promoting cell proliferation and evading
apoptosis.

10
CTCL neoplastic cells lose expression of Fas by a variety of mechanisms such
as methylation of the promoter region (Wu and Wood, 2011), inactivating
mutations (Dereure et al., 2002) and loss of the long arm of chromosome 10
(Scarisbrick et al., 2000). All of them lead to a reduced sensitivity to Fas-L
mediated apoptosis (Wu et al., 2009).
Cell cycle regulators like CDKN2A and CDKN2B frequently acquire aberrant
mutations in CTCL. Genetic loss of any of these two genes is associated with
poor prognosis, linked to an aggressive subset of CTCL both in SS and MF
(Laharanne et al., 2010a). Furthermore, up regulation of cyclin D1 and loss of
its regulator RB1 lead to impaired control of cell cycle in malignant cells (Mao
et al., 2006). It is believed that many of mutations in CDKN2A and CDKN2B are
part of a second line of alterations, once transformation has occurred and they
are by-products of the increased genomic instability. Nonetheless they
potentiate the aggressiveness of the disease.
Cytokine and chemokine microenvironment
Abundant cells infiltrating the skin in MF lead to the secretion of many pro-
inflammatory mediators that may exacerbate the disease of these patients
(Table I). Pruritus is a common symptom of CTCL and many inflammatory
diseases. It has been shown that IL-31 mediates itch in MF (Cedeno-Laurent
et al., 2015) released through activation of STAT6 and NFκB (Maier et al.,
2014). In vitro experiments showed that histone deacetylase inhibitors (a group
of drugs used in MF) reduce secretion of IL-31. IL-7 has been shown to promote
cell proliferation (Yamanaka et al., 2006b) and together with IL-15 its effect is
potentiated by activation of BCL-2 and c-Myd in malignant cells (Aubry et al.,
2001). IL-21 has been associated with disease progression in patients bearing
MEKK4 positive cells (Fredholm et al., 2016). This cytokine is involved in the
constitutive activation of STAT3 in SS patients (van der Fits et al., 2012a). IL-
4, a common gamma chain cytokine, together with IL-13 are the main
interleukins produced by Th2 polarized cells. These cytokines are thought to be
crucial in CTCL, as most patients have a predominant Th2 phenotype (Geskin
et al., 2015) and its expression correlates with advanced stages of skin

11
involvement (Vowels et al., 1994). Most alterations in cytokine secretion have
been described locally. Only a few mediators are known to be altered
systemically. Nonetheless, a subset of patients has shown a substantial
systemic increase of IL-18 and IgE together with caspase 1, the protease
responsible for IL-18 activation (Yamanaka et al., 2006a). Furthermore,
eosinophilia and high levels of IgE correlate with an increased bacterial
infection incidence in CTCL patients (Nielsen et al., 2002). Many patients
express one or many subunits of TNFr (Dulmage and Geskin, 2013) and it is
thought that together with IFNγ signalling they mediate epidermotropism of
malignant cells (Daliani et al., 1998). Evidence suggests that keratinocytes in
lesional skin are the source of many cytokines that drive cell recruitment in
CTCL (Celerier et al., 1997). Neoplastic T-cell survival is closely linked to
alterations in the cytokine microenvironment. Several unsuccessful attempts to
grow malignant cells have shown how challenging the generation of stable cell
lines is without the right microenvironment. The addition of pro-inflammatory
mediators in vitro is crucial to expand malignant cells and only a few cell lines
have been established. The relevance of an active microenvironment that
provides the cytokines needed by the neoplastic T-cells comes from a study
where staphylococcal enterotoxin A was seen to activate STAT3 promoting IL-
17 secretion by malignant cells only in the presence of non-malignant T-cells
(Willerslev-Olsen et al., 2016). The majority of malignant cells expressed IL-17r
(Krejsgaard et al., 2013) that made them responsive to IL-17 stimulation with
augmented proliferation (Krejsgaard et al., 2011), constituting an autocrine
circuit that potentiated malignancy.

12
Table I: Selection of inflammatory mediators described in CTCL
Molecule Function Reference
IL-2 T-cell activation by STAT5 phosphorylation (Marzec et al., 2008)
IL-4 Increased production in neoplastic cells implicated in neoplastic cells dissemination (Hsi et al., 2015)
IL-5 Produced by Th2-polarized malignant cells, recruitment of inflammatory cells (Rook et al., 1997)
IL-7 Autocrine induction of neoplastic cell proliferation (Dalloul et al., 1992)
IL-9 Neoplastic cell growth factor overproduced by STAT3/5 IRF4 pathway (Vieyra-Garcia et al., 2016)
IL-10 Suppression of non-malignant T-cells by neoplastic cells
(Krejsgaard et al., 2008) (Kasprzycka et al., 2008)
IL-13 Synergistic effect with IL-4 to promote neoplastic cell proliferation (Geskin et al., 2015)
IL-15 Autocrine growth factor of neoplastic cells (Dobbeling et al., 1998)
IL-17 Malignant cell growth factor, up regulated in response to S. Aureus toxin (Willerslev-Olsen et al., 2016)
IL-18 High levels in lesional skin and plasma. Promotion of TNF production (Yamanaka et al., 2006a)
IL-21 Autocrine triggering factor of STAT3 (van der Fits et al., 2012a)
IL-31 Involved in severity of pruritus. (Nattkemper et al., 2016)
IFNγ Epidermotropism factor mediated by IP-10 activation (Daliani et al., 1998)
MEKK4 Together with p38 promotes IL-21 production (Fredholm et al., 2016)
STAT3 Apoptosis inhibition, cytokine production and T-cell polarization (Willerslev-Olsen et al., 2016)
STAT5 Induction of miR-21 and apoptosis evasion (Lindahl et al., 2016)
STAT6 Promotion of Th2 cytokine production in malignant cells (Litvinov et al., 2014)
TGF-β Suppression of non-malignant T-cell activation (Krejsgaard et al., 2008)
TNF Non-canonical NFκB activation and apoptosis evasion (Ungewickell et al., 2015)

13
Cell of origin
Although the classification of CTCL provided by the EORTC correlates well with
prognosis and survival (Campo et al., 2011), it does not consider genetic
alterations and does not provide means to identify patients with high risk of
progressive disease. Among the numerous efforts to understand the aberrant
genetic phenotype in CTCL, a study published in 2010 led to the discovery that
the majority of CTCL cases fall in the following categories: a) epidermotropic-
CTCL including anaplastic large-cell lymphoma, b) leukemic-CTCL or SS and
c) a hybrid category of primary MF and transformed MF of a secondary episode
and blood involvement (Laharanne et al., 2010b). The authors proposed that
on top of the consensus classification in CTCL and the clustering of patients in
these three groups, comorbidities and histological criteria could provide a more
assertive diagnosis, which in turn helps to select a more efficient treatment.
T-cells allocated in the skin express cutaneous lymphocytic antigen (CLA)
(Clark et al., 2006) and skin trafficking chemokine receptors like CCR4, CCR8
and CCR10 (Reiss et al., 2001). In CTCL, neoplastic T-cells share the
expression of these markers and regardless of their presence in the skin or
blood, they lack CD26 and CD7 expression (Jones et al., 2001). Additionally,
the population of T-cells in normal and inflamed conditions is a mixture of cells
with a memory and effector phenotype. There is a subset of memory cells that
infiltrate extra-nodal sites but keep their ability to get into blood circulation:
these cells are named central memory T-cells (TCM). In contrast, cells that stay
in extra-nodal sites like the skin, develop from effector memory T-cells
expressing T-cell receptors of high affinity (Frost et al., 2015) which are
classified as resident memory T-cells (TRM). In normal conditions, TRM are the
main sub-population of T-cells in the skin (Watanabe et al., 2015). The
phenotype of neoplastic cells in SS and MF with secondary blood involvement
share markers of TCM like CCR7 and L-selectin (Campbell et al., 2010).
Furthermore, treatment with alemtuzumab (an anti-CD52 antibody) is an
efficient therapy particularly in CTCL patients with blood involvement. The
majority of MF patients remain unresponsive due to the low availability of the
antibody in affected tissue (Clark et al., 2012) and their permanent residence

14
in the skin by the expression of TRM markers like CLA and CCR4 (Campbell et
al., 2010).
Figure I: Theoretical T-cell origin for the neoplastic cells in the main forms of
CTCL. Multiple subsets of T-cells populating the skin have been described
based on the expression of cell adhesion and chemokine receptors. The
phenotype of the neoplastic cells in the main forms of CTCL has a high
resemblance to such populations. Malignant cells in SS, L-CTCL and relapse
MF with secondary blood involvement express CD45RO, CD62L and lack
CCR7, as TCM. Neoplastic cells in MF express CD69, CD103 and CCR4, a
phenotype shared with TRM. TMM cells are a recently described T-cell subset
with high mobility within extra nodal tissue and certain degree of blood re-
circulation; these cells express CCR7, CD103 and lack CD62L. MF patients
with lesions not fully delimited may carry malignant cells derived from T-cells
with TMM phenotype. The three cell types have expression of CD52 at different
degrees however the responsiveness of patients to anti-CD52 antibody
treatment may be determined by the mobility patterns of neoplastic cells.

15
The majority of MF patients present well-defined lesions. Generally, site and
extension restriction suggests a TRM origin. Moreover, some patients present
poorly demarcated patches or plaques with larger extension of skin
involvement. These characteristics suggest higher mobility within the tissue and
possible blood recirculation. Migratory memory cells (TMM) are a subpopulation
of T-cells in the skin with expression of CCR7 and lack of CD62L. These cells
are thought to have these mobility patterns; hence the malignant clone may
arise from TMM in those patients (Watanabe et al., 2015).
High throughput TCR sequencing
To date, CTCL diagnosis relays on clinical presentation, demographic risk
factors and suggestive histopathology. Molecular biology techniques like flow
cytometry looking at the expression of CD7 and CD26 (Hristov et al., 2011) or
clonal rearrangement by qPCR (Xu et al., 2011) are currently used as tools in
the differential diagnosis of CTCL. Nevertheless, these techniques are limited
by their sensitivity to detect malignant cells with low frequency in lesional skin.
In MF, this is particularly accentuated since the malignant cells constitute a
minority of the T-cell population (Fivenson et al., 1994). This highlights the need
for techniques with higher resolution to identify malignant clones and improve
diagnosis. Studies addressing the clonality in CTCL indicate that even at early
stages, most cases have a predominant clone with a complex chromosomal
aberration (Marcus Muche et al., 2004). Finding the malignant clone is the first
step to look into the mutations these cells have acquired. Multiplex/HD PCR on
PAGE is routinely used in CTCL. However, its sensitivity is not ideal; for
instance one study showed that was only 76% in T1 stage MF and it required
the combination with other techniques like capillary electrophoresis with
GeneScan to increase its sensitivity (Ponti et al., 2008). The impact of these
limitations is evident by the fact that in average definitive diagnosis of MF may
take up to 6 years (van Doorn et al., 2000). In the worst-case scenario, patients
may get unsuitable treatment that may let malignant cells progress and become
more aggressive.

16
The rapid evolvement of high throughput sequencing (HTS) of DNA has found
application in many fields. T-cell biology has gained an instrument that allows
a profound exploration of the T-cell repertoire by analysing millions of short
sequences in parallel. Deep sequencing of the CDR3 region of the TCR is
performed by generating a library of template molecules that are amplified with
a universal polymerase chain reaction set of primers in both ends. Each
template is immobilized in a solid surface resulting in groups of template
clusters. The nucleotide sequence of each rearranged beta chain of any
number of T-cells is identified. Quantitative studies on the frequency of every
clone and the total number of distinct clonotypes are assessed (Robins et al.,
2009). The estimated diversity of the entire αβ T-cell repertoire is theoretically
assessed in as much as 1016 different possible rearrangements (Arstila et al.,
1999). By just looking at the β chain with this technique, the actual number of
distinct clonotypes was 4 times higher than the original estimate, presumably
related to the higher resolution of single-molecule DNA sequencing that provide
sufficient depth to accurately assess diversity (Robins et al., 2009).
HTS of the TCR has been used to identify malignant clones in CTCL and has
successfully identified the malignant clone in all of the 46 patients analysed in
a recent study (Kirsch et al., 2015). Additionally, this study shed light to the
putative origin of malignant cells and brought evidence to discard the
hypothesis on a precursor cell background of neoplastic T-cells, acquiring T-
cell markers during transformation process. It was shown that malignant cells
had 1.8 rearrangements in the gamma chain in average, similar to that one
commonly observed in mature peripheral blood αβ T-cells (Sherwood et al.,
2011).
Non-malignant infiltrating immune cells
Despite the accumulation of many cell growth driving mutations in MF, that
silence tumour suppression genes and enhance activation of oncogenes, it is
unlikely that malignant T-cells can sustain their growth on their own. Growing
neoplastic T-cells in vitro usually requires the addition of cytokines like IL-7
(Dalloul et al., 1992) or immature dendritic cells (Berger et al., 2002). Moreover,

17
animal models such as RAG knockout mice have a low rate of successful
tumour engraftment and do require the “humanization” of mice (van der Fits et
al., 2012b), indicating the relevance of an appropriate microenvironment to
foster neoplastic cells. In SS, CD40L, a key molecule for T-cell activation is
missing (French et al., 2005). Thus, in vitro expansion of neoplastic SS cell
requires the addition of co-stimulatory mediators like CD28, demonstrating the
crucial role of co-stimulatory signals provided by external sources in CTCL
(McCusker et al., 1997).
The phenotype of macrophages infiltrating tumours such as in follicular
lymphoma and classic Hodgkin lymphoma has a prediction value for the
survival of patients (Dave et al., 2004, Steidl et al., 2010). In CTCL, it has been
described that lesional skin accumulates high numbers of DC-SIGN positive
dendritic cells (Schlapbach et al., 2010) with an immature phenotype, possibly
contributing to immune escape of the proliferating malignant clones. In vitro
addition of immature DCs has extended malignant cell survival for up to 3
months (Berger et al., 2002). Monocyte-derived cells have also been found
accumulated in lymphoproliferative disorders. These cells are recruited by
tumour-produced CCL5 and in turn provide resistance to apoptosis and
promote engraftment of malignant cells in non-obese diabetic mouse models
(Wilcox et al., 2009). Malignant cells may also alter the phenotype of DC by
producing IL-10, keeping these cells from activating anti-tumour immunity, thus,
making them more suitable to their microenvironment (Wilcox, 2010).
Local therapy for MF
Early stage MF frequently has low or no systemic involvement and detection of
blood circulating malignant cells requires techniques with high sensitivity.
Malignant cells accumulate in lesional skin, a feature that makes local therapies
the first option to manage these patients. The majority of early MF patients (60-
80%) has a good response to such therapies (Lansigan and Foss, 2010), which
aim to control the inflammation and induce apoptosis of neoplastic cells. The
main local therapies for CTCL are narrow band UVB, psoralen plus UVA

18
(PUVA), topic steroids, retinoids, nitrogen mustard and total skin electron-beam
radiation (Querfeld et al., 2005).
Corticoid steroids have a success rate of 90% in T1 stage patients that drops
to 25% in T2 stage (Zackheim et al., 1998). These drugs have minor side effects
and are preferred as first line therapy for early stage patients in the United
States (Zackheim, 2003). Retinoids are drugs commonly used in combination
regimes. They pass through the cell membrane by endocytosis and are
transferred to the nucleus by cellular retinoic acid-binding proteins (CRABPs).
Their biological effect is mediated by a group of retinoic acid receptors,
members of a nuclear hormone receptor family. Retinoids form hetero-
complexes that bind to specific DNA sequences, activating the transcription of
retinoid response elements, leading to apoptosis (Zackheim, 1999).
Due to its favourable safety profile, narrow band UVB is recommended
nowadays as first treatment choice for MF patients with superficial plaques and
patches (Trautinger, 2011). For instance, the complete response rate of MF
patients treated with narrow band UVB was 76% and no major side effects were
observed in the study by Abdallat et al (Abdallat et al., 2014). PUVA is advised
in patients who do not respond to narrow band UVB and those with
folliculotropic MF (Trautinger et al., 2006). PUVA combines orally given 8-
methoxypsoralen followed by the exposure of the affected skin to UVA light.
Patients are commonly treated two to three times per week with increasing light
exposure dosages. PUVA is also used in combination with bexarotene, or type
I interferons in cases with poor response or with low tolerance to light irradiation
alone. Combination regimes are used to decrease light doses and the number
of therapy sessions (Li et al., 2012). In average, MF patients have been shown
having a stratified response to PUVA with 90% complete response in stage IA
patients, 76% in stage IB, 78% in stage IIA and 59% in stage IIB (Herrmann et
al., 1995a). In most clinical settings, PUVA is used as a second line of treatment
due to its high efficacy but an associated risk of ultraviolet related secondary
malignancies (Trautinger et al., 2006).

19
Extracorporeal photopheresis (ECP) is a variant of PUVA developed for the
treatment of systemic involvement in CTCL like in erythrodermic MF or SS. In
ECP, blood leukocytes are irradiated ex vivo and re-infused into the patient.
Despite that only 2% of the total blood circulating cells are irradiated, ECP
treated patients have a good clinical response, possibly related to immune
tolerance induction that synergises with the depletion of malignant cells
(McKenna et al., 2006).
Total skin electron beam is an aggressive therapy used as last resort in patients
unresponsive to previous therapies. It has a complete response in
approximately 60% of cases in average. This treatment is an alternative for
patients difficult to manage, who often develop moderate to severe cosmetic
effects (Navi et al., 2011).
Histone deacetylase inhibitors are an emerging group of drugs in the treatment
for many lymphocytic malignancies. By keeping an open state chromatin, the
transcription of cell cycle regulators and pro-apoptotic genes is increased,
leading to malignant cell depletion (Johnstone, 2002). In phase II studies,
patients treated with the histone deacetylase inhibitor Vorinostat achieved an
overall response of 30% within approximately 10 weeks (Kavanaugh et al.,
2010), whereas Romidepsin (another histone deacetylase inhibitor) had a 34%
response rate (Whittaker et al., 2010). However, both studies had a low number
of patients with complete response after treatment with either of these drugs.
The growing understanding of tumour biology is making its way into
translational medicine and many immunology-based treatments are under
investigation. Alemtuzumab had an overall response rate of 55% with 32% of
patients in remission in a study by Lundin et al (Lundin et al., 2003). The results
of a study testing Mogaluzimab, an anti CCR4 antibody targeting skin-homing
T-cells, showed an overall response rate of 37% with minor side effects in
treated patients, which led to a phase III clinical study (Duvic et al., 2015a).
CD30 is expressed in a large proportion of CTCL cases and is considered a
good prognostic indicator. Brentuximab vedotin is a conjugate antibody

20
targeting CD30 bound to the cytotoxic tubulin agent monomethyl auristatin.
Patients treated with this antibody had an overall response of 70%, with a 73%
reduction of modified Severity Weight Assessment Tool (mSWAT). CD30
positive patients were the best responders to this treatment (Kim et al., 2015,
Duvic et al., 2015b). Although, treatment with biologic drugs has the
disadvantage of being yet expensive and requiring long periods of treatment,
they constitute a solid step towards personalized medicine, powered by a
profound understanding of this malignancy.

21
Research problem statement
The accumulating knowledge about the biology of CTCL and more precisely,
the targeting of molecules expressed by malignant cells has started a revolution
in the care of these patients. Antibodies designed to recognize CD52, CD25
and CCR4 are currently under evaluation or have been used to stimulate the
immune system to eliminate malignant clones. In different degrees, these
approaches have been successful. However, none of them addresses the
inflammatory microenvironment where the malignant cells reside. Until very
recently, there has been a lack of tools to study the non-malignant inflammatory
cell composition and its role on the pathophysiology of the disease in response
to treatment.
The literature suggests, that benign T-cell may play an important role in CTCL.
An oligoclonal T-cell response to a toxin from S. aureus may cause severe
inflammation that may support the growth of the malignant clone (Jackow et al.,
1997), worsening the disease of CTCL patients. The frequency of this
phenomenon hasn’t been investigated but in a cohort of 42 patients, 76% had
S. aureus carrying genes coding for the toxin. Therapies that induce immune
tolerance like ECP lead to a significant improvement in SS patients. The
therapeutic effect of ECP does not necessarily involve the direct irradiation of
the malignant cells given that only 2% of the total cells in circulation are
exposed to the treatment and yet it is still effective. Malignant cells also have
the potential to polarize benign T-cells into cells producing Th2 cytokines
(Guenova et al., 2013), implying a favourable microenvironment for their
survival.
This work aims to address the role of inflammatory mediators in early stage MF.
Patients in this stage are often difficult to diagnose by the low frequency of
neoplastic cells. Moreover, not much literature is available on the mechanistic
effect of therapies like PUVA, the transcriptional profile of lesional skin and the
changes in the T-cell repertoire throughout treatment.

22
Results
Transcriptional profile of early MF
Lesional skin in MF presents an increased number of T-cells infiltrating the skin
associated to a chronic inflammatory state. To understand the feedback of
inflammatory signals a characterization of the transcription profile of lesional
skin was performed. RNA isolated from biopsies taken at baseline were
compared with RNA obtained from normal skin took from individuals
undergoing surgical procedures. The PanCancer Immune Profiling Panel from
Nanostring was selected due to the following advantages: this is an assay
capable to analyse the expression of up to 770 genes in a relatively small
sample using only 100ng of RNA without requirement of amplification by
polymerase chain reaction. With this assay, the expression of genes related to
humoral responses, cancer, adaptive and innate immunity markers were
examined. This technology also includes a set of 40 housekeeping genes to
get a thorough normalization of gene expression and comes with an easy to
use analysis tool. To identify genes differentially expressed in lesional skin
compared to normal tissue, threshold values were established in which only
genes that had a difference in mean expression with a p-value under 0.05 and
a false discovery rate (FDR. Based on correction of p-value for multiple testing
(Noble, 2009) under 0.5 were considered. The resulting genes were graphed
in a volcano plot to visualize positive/negative fold change values as well as
their statistic evaluations (p-value, FDR) (Fig. 1). A total of 221 differentially
expressed genes were found. Among these, 130 genes were up regulated and
91 genes were down regulated in lesional skin compared to normal skin.
Among the genes with the highest degree of differential expression, markers of
antigen processing (HLA-G, HLA-DPA1, TAP1), lysosome formation (CTSH),
T-cell co-stimulatory signals (CD40), cytokine signalling (RELA, MAPK1,
MAP2K1) and adhesion molecules (CD47, ITGAE) (Fig. 2) were found. Up
regulation of T-cell markers was expected, however T-cell markers were
accompanied by a high degree of B-cell (CD20) and innate immunity related
molecules (MRC1, CD163 and CD209).
To have a better understanding of critical pathways altered in lesional skin, the

23
KEGG database was used to integrate our nanostring results into signalling
maps that incorporate gene-to-gene interactions. The KEGG database is a
platform from the Kyoto University with a vast collection of drawings on various
cell functions, able to elucidate biological systems out of sequencing data,
microarray, nanostring, etc. A map on T-cell receptor signalling is presented
(Fig. 3). The higher expression of several elements of the TCR (in red)
correlates with higher expression of downstream molecules like ZAP70 and
NFκB regulatory elements. Higher expression of T helper (CD4) and cytotoxic
(CD8) cells as well as protein tyrosine phosphatase receptor type C (CD45)
and its downstream molecule LCK were found. The NFAT pathway seems to
be reduced in lesional skin (in green) and a significant activation of NFκB and
down regulation of some of its negative regulatory elements like IKK proteins
were observed. An up regulation of phosphatidylinositol-4,5-biphosphate 3-
kinase (PI3K) was found. The map did not show the triggering of PI3K by JAK
proteins, however an up regulation of JAK/STAT and Src signalling was found.
Furthermore, increased expression of B-cell activation (Fig. 4) like CD20, Ig
(CD79) and the tyrosine kinase LYN a downstream molecule of BCR signalling
was found. Controversially, a higher expression of the BCR signalling inhibitor
SHIP and the IFN element response LEU13 that belongs to the CD19-21
activation complex was found. This analysis was particularly aimed to look into
the cytokine microenvironment of diseased skin since the finding of key
mediators of the constant inflammatory process is a promising target for novel
therapies. A map of cytokine and chemokines with their described receptors
was drawn (Fig. 6). Chemokines like CXCL2, CXCL5, CCL25, CCL3, CCL16,
and CCL15 were down regulated together with the chemokine receptors CCR9,
and CCR3. This profile contrasted with the up regulation of CXCL9, CXCL10,
CXCL16, CCL13, CCL5 and CCL18. The expression of chemokine receptors
correlates with the profile on the chemokines found; CXCR3 (receptor of
CXCL9/10), CXCR1, CCR2 (receptor of CCL13), CCR5 and CCR1 (both
receptors of CCL5) were up regulated. Furthermore, several cytokines down
regulated on lesional skin were found: IL-1, IL-6, IL-11, IL-4, IL-3, IL-24, IL-28,
IL-17B/E and type I IFN. A high expression of IL-10 receptor alpha and the
gamma (IL-2r-gamma) chain of the IL-2 receptor were found. IL-2r-gamma is

24
molecule involved in the signalling of a wide number of cytokines (IL-2, IL-4, IL-
7, IL-9, IL-15 and IL-21). However, these analyses did not detect an up
regulation on any of these cytokines. An up regulation of many genes of the
TNF family was found: TNF, TNFSF10, TNFSF14, TNFSF13B and TNFSF8.
The receptors SF14, SF7 and CD40 (a co-stimulatory signal member of the
TNF receptor family) were up regulated. Furthermore, a close look into TNF
signalling (Fig. 5) found that TRAF2 and TRAF5 downstream mediators of TNF
were also up regulated.
A visualization of these results in the context of T cell populations and other cell
types provides a better overview of what specific signature was enriched in
lesional skin. Many specific T cell markers were represented (Fig. 7A), from
surface antigens to intracellular molecules like ITK (a tyrosine kinase expressed
in response to IL-2), NFATC3 (expressed on activated T-cells) and LCP1 (a
cytosolic protein expressed in lymphocytes). Taking total RNA from non-
dissected tissue makes it challenging to attribute results of markers to specific
cell populations. The markers CCL5 and CCR5 linked to Th1 sub-populations
were found up regulated. However, an up regulation of T-bet, the master
regulator of Th1 cells, was not found. STAT3 was found up regulated which
known to be associated to activation of Th17 cells; however, expression of IL-
17B/E was decreased. Expression of markers associated to Treg cells was
altered, with a higher expression of LAG3, IDO and STAT5. These results also
indicated a prominent activity of CD8 T-cells since granzyme and perforin were
up regulated together with STAT1. Moreover, markers of antigen presenting
cells (Fig. 7B) like co-stimulatory signals CD80 and CD86, many genes member
of the MHC-I (HLA A-C) and MHC-II (HLA-DM-DR), LAMP1, CD1b and MR1
were up regulated. Together these results indicate that lesional skin in MF has
profound diversity of cells with the secretion of many pro inflammatory markers
when compared to lesional skin.

25
Figure 1: Deregulated inflammatory gene expression in early stage MF. Volcano
plot showing gene expression data from nanostring analyses. Skin biopsies from
lesional MF skin were taken at baseline and compared to normal tissue. Fold-change
is shown in the X-axis, statistical significance is plotted in the y-axis. Genes with high
statistical value are annotated. False discovery rate (FDR) thresholds (for different p-
value levels ranging from <0.01 to <0.5, after correction for multiple testing) are
indicated with dotted, dashed and solid lines.

26
Figure 2: Top 20 up regulated genes in early stage MF. List of the top 20 up
regulated genes in lesional MF skin. A cut off was applied of p-value of 0.001 and a
threshold for false discovery rate (FDR) of 0.2. A biological context of the genes is
given under “biologic classification/function”.

27
Figure 3: T-cell signalling alterations in early stage MF. Based on gene expression
results, altered genes that play a role in T-cell signalling are visualised on a KEGG
map generated with Pathview. Genes with higher expression in lesional skin compared
to normal skin are shown in red, genes with lower expression in lesional skin are shown
in green. Subunits of the TCR, ZAP70 and co-stimulatory signals were up regulated.
AP1, p38, and Th2 cytokines were down regulated. The use of this map is licenced by
its developer Kyoto Encyclopaedia of Genes and Genomes (KEGG) with Pathway
Solutions Inc.

28
Figure 4: B-cell signalling alterations in early stage MF. Based on gene expression
results, altered genes that play a role in B-cell signalling are visualised on a KEGG
map generated with Pathview. Genes with higher expression in lesional skin compared
to normal skin are shown in red, genes with lower expression in lesional skin are shown
in green. Alpha globulin, CD225 and PI3K were up regulated. NFκB suppressors IKKα
and IKKβ were down regulated. The use of this map is licenced by its developer Kyoto
Encyclopaedia of Genes and Genomes (KEGG) with Pathway Solutions Inc.

29
Figure 5: TNF signalling alterations in early stage MF. Based on gene expression
results, altered genes that play a role in TNF signalling are visualised on a KEGG map
generated with Pathview. Genes with higher expression in lesional skin compared to
normal skin are shown in red, genes with lower expression in lesional skin are shown
in green. TNF, NFκB, ERK and LTA were up regulated. CASP10, IL-6, Fos and CREB
were down regulated. The use of this map is licenced by its developer Kyoto
Encyclopaedia of Genes and Genomes (KEGG) with Pathway Solutions Inc.

30
Figure 6: Cytokine to cytokine receptor alterations in early stage MF. Based on
gene expression results, cytokines and their receptors are visualised on a KEGG map
generated with Pathview. Genes with higher expression in lesional skin compared to
normal skin are shown in red, genes with lower expression in lesional skin are shown
in green. CXCL9/10, CCL5/13 CCL18 and their corresponding receptors CXCR3,
CCR1/5 and the common gamma receptor were up regulated. CXCL2/5,
CCL25/3/16/15, the receptors CCR9/3, IL24 and type I IFN were down regulated. The
use of this map is licenced by its developer Kyoto Encyclopaedia of Genes and
Genomes (KEGG) with Pathway Solutions Inc.

31
Figure 7: T-cell subsets and antigen presenting cells in early stage MF. A) Based
on gene expression results of lesional skin compared to normal skin, genes associated
to the main T-cell subsets were grouped: Th1, Th2, Th17, Treg and cytotoxic T-cells.
Up regulated genes are shown in red, down regulated genes are shown in blue. Th2
associated cytokines and STAT6 were down regulated. STAT3 and STAT5, cytotoxic
molecules and immunosuppressive IDO and LAG3 were up regulated. B) Genes
associated to antigen presenting cells, antigen processing or T-cell co-stimulatory
molecules are depicted.
A
B

32
Inflammatory signals on CTCL cell lines
CTCL cell lines from MF and SS patients were established in the middle 70’s
and have been widely accepted as in vitro models to explore metabolism,
expression biomarkers and to test new target molecules to treat patients. The
cell lines, Hut78 and SeAx derived from an SS patient and MyLa2000 derived
from an MF patient were used. Given the nature of cutaneous T-cell lymphoma;
epidermotropic T-cells with deregulated cell cycle and cytokine production, the
expression of transcription factors that govern T-cell polarization was analysed.
Flow cytometry was used to determine the positivity of T-Bet, RORγT, Foxp3
and PU.1 (Fig. 8) and observed a differential expression pattern. Hut78 cells
had a low expression of Foxp3 and lacked expression of t-Bet, RORγT and
PU.1. MyLa2000 cells had a high expression of the four transcription factors.
SeAx cells lacked expression of t-Bet, RORγT and PU.1 but had a high
expression of Foxp3. MyLa2000 cells had the most diverse transcriptional
profile and were positive for all transcription factors; this may reflect an elevated
secretion of different cytokines.
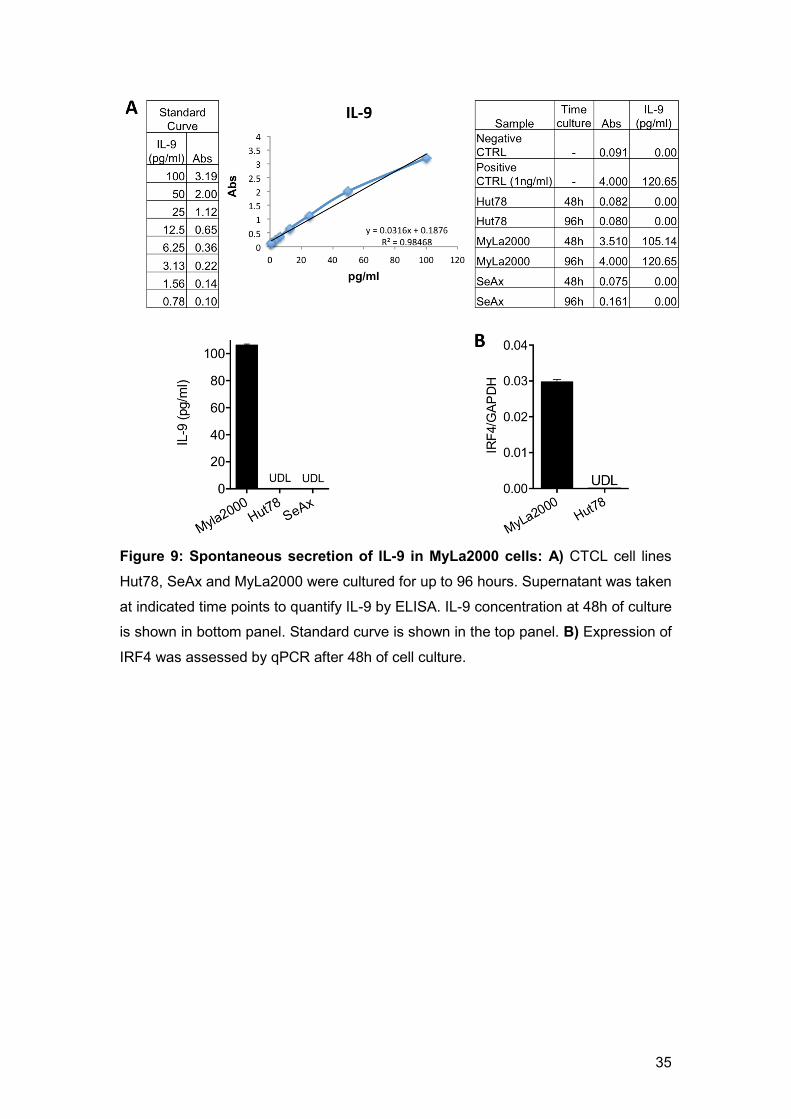
To assess the secretory potential of MyLa2000 cells as a model of malignant
cells in tissue, analysing secretion of IL-9 was initiated since MyLa2000 was
the only cell line with expression of PU.1. Furthermore, it has been reported
that memory T cells in the skin have a large production of IL-9 and a remarkable
role in immunity and disease (12). ELISA was used to determine the production
of IL-9 in the supernatants of Hut78, SeAx and MyLa2000 cells after 2 and 4
days of culture (Fig. 9A). Hut78 and SeAx did not produce detectable levels of
IL-9, whereas MyLa2000 cells had a high production of this cytokine sustained
for up to 4 days. This result indicated that MyLa2000 cells were the most active
cells among the cells tested in terms of cytokine production. A particular interest
in this cytokine came across since it has been described that IL-9 and its
downstream molecules are important targets in immune therapies for other
lymphomas (Chen and Wang, 2014). The expression of IRF4 was determined
to test for the polarization to a Th9 population (Fig. 9B) of MyLa2000 cells and
compared them to Hut78 cells (negative for IL-9 production). In consistence
with these results, MyLa2000 cells were positive for IRF4 while Hut78 cells
were negative.

33
IL-9 secretion in the skin has been suggested to be a driving force of
vascularization (Singh et al., 2013). IL-9 is highly produced in psoriatic lesions
and has paracrine functions among T-cells and other cell types (Schlapbach et
al., 2014). To assess if the cytokines produced by MyLa2000 cells can indeed
function as growth factors, supernatant from MyLa2000 cells in culture for up
to 96h was collected. A mixture of this supernatant with fresh medium was used
to culture SeAx and HaCat cells to determine proliferation by 3H-thymidine
incorporation (Fig. 10). HaCat cells were used since it is known that IL-9 can
support their growth (Sismanopoulos et al., 2012). The supernatant from Hut78
cells was used as negative control. Both cell lines cultured with 10% of
supernatant from MyLa2000 had higher proliferation rate than the ones cultured
with Hut78 supernatant. SeAx cells had even a more drastic boost of
proliferation with 30% of MyLa2000 supernatant while supernatant at 50%
reduced their proliferation. In contrast to SeAx cells, HaCat cells did not further
increase proliferation response with the mixture of Hut78 or Myla2000 at both
concentrations 30% and 50%. Additionally the direct effect of IL-9 on cell
proliferation of HaCat (as a model for keratinocytes) and SS cell lines Hut78
and SeAx cells was determined. These cells were stimulated with increasing
amounts of recombinant IL-9 (Fig. 11). A tendency of higher cell growth in
HaCat cells at 96h in an IL-9 concentration dependent manner was observed.
Hut78 and SeAx cells also exhibited an IL-9 dependent cell growth as early as
48h of culture. These results provide insight into the role of IL-9 as a mediator
of malignant cell growth in MF.

34
Figure 8: Expression of polarization related transcription factors in CTCL cells.
Intracellular stain of t-Bet, RORγT, Foxp3 and PU.1 on Hut78, MyLa2000 and SeAx
performed in cell cultured for 48h.
35
Figure 9: Spontaneous secretion of IL-9 in MyLa2000 cells: A) CTCL cell lines
Hut78, SeAx and MyLa2000 were cultured for up to 96 hours. Supernatant was taken
at indicated time points to quantify IL-9 by ELISA. IL-9 concentration at 48h of culture
is shown in bottom panel. Standard curve is shown in the top panel. B) Expression of
IRF4 was assessed by qPCR after 48h of cell culture.

36
Figure 10: MyLa2000 supernatant increase cell proliferation of CTCL and
keratinocyte cell lines. SeAx and HaCat cells were cultured on media supplemented
with supernatant of 96h culture of MyLa2000 (black dots) cells or Hut78 (used as
control, grey dots). After 48h of culture cells were harvested to determine cell
proliferation by thymidine incorporation. Counts per minute are shown. Statistical
significance was assessed by student t-test. p values are shown

37
Figure 11: IL-9 increases proliferation in keratinocyte and CTCL cell lines. HaCat,
Hut78 and SeAx cells were cultured in medium supplemented with increasing
concentrations of recombinant IL-9 (0.1ng – 100ng/ml). After 48h of culture cells were
harvested to determine cell proliferation by thymidine incorporation. Counts per minute
are shown. Statistical significance was assessed by Dunnet post-test. p values are
shown.

38
Targeting inflammatory signals limits malignant cell
development/activity
The fact that in CTCL cell lines and HaCat cells IL-9 serves as growth factor
prompted the possibility to target this cytokine as a therapeutic approach. The
blockade of IL-9 was evaluated to reduce on cells by seeding HaCat and SeAx
cells in medium supplemented with IL-9 and adding increasing amounts of anti-
IL-9 antibody (Fig. 12). HaCat cells had a dose dependent reduction of
proliferation at 48h of culture, SeAx cells did not show inhibition with 100ng/ml
but a significant decreased proliferation with 200ng/ml and 500ng/ml of anti-IL-
9 antibody. This set of experiments was carried out in MyLa2000 cells without
IL-9 supplement but did not observe a reduction in cell growth.
Furthermore, given the fact that the therapeutic potency of PUVA in MF patients
improves when patients are given concomitant treatment like with steroids or
recombinant type 1 interferon (Nikolaou et al., 2011), the combination of IL-9
depletion with PUVA may be another strategy to increase the therapeutic effect
of treatment. Myla2000 cells with PUVA alone or in combination with an anti-
IL-9 antibody were cultured for 48h to determine viability by AnnexinV and
propidium iodide incorporation (Fig. 13A). Supplementation of IFN2b was
used as control based on previous findings on its capacity to increase PUVA
efficacy. The combination of PUVA with IFN2b reduced cell viability to 38%
while PUVA treatment alone reduced it by 56%. PUVA/anti-IL-9 treatment
exhibited a reduction in cell viability of 37%, similar to IFN2b treated group,
and the combination of PUVA/IFNa2b/anti-IL-9 reduced viability with a small
additive effect down to 35%.
Having seen in vitro that targeting IL-9 can potentiate PUVA effect, downstream
molecules of the IL-9 pathway were analysed. STAT5 was one of the main
interests since it is one of the immediate molecules triggered by IL-9
stimulation. Silencing RNA (siRNA) ON-TARGETplus from Dharmacon was
used since it is a platform that combines a set of primers that hybridize in four
different sites to magnify the silencing of the gene targeted. MyLa2000 cells
were transfected with siRNA specific for STAT5 or control RNA (siCTRL) 24

39
hours before PUVA treatment. Treated cells were kept in culture for 48h to
determine cell viability (Fig 13B). A decrease of cell viability in PUVA/siSTAT5–
treated cells down to 18% compared with 58% on the 8-MOP alone and 42%
in PUVA/siCTRL group.
As a closer approach to therapeutic alternatives to target cytokine pathways
with drugs already available in the market, the effect of ruxolitinib was analysed.
This selective JAK1/2 inhibitor developed by Novartis for the treatment of
myeloproliferative disorders in bone marrow (Mascarenhas and Hoffman, 2013)
and is currently under examination for the treatment of plaque psoriasis (Hsu
and Armstrong, 2014) and alopecia areata (Blume-Peytavi and Vogt, 2015).
The kinetics of IL-9 expression by qPCR on Myla2000 cells treated with
Ruxolitinib for up to 48h (Fig. 14A) was determined. The peak of IL-9 expression
was reached at 8h and decreased by 48h. Treated cells exhibited a reduction
of IL-9 expression at all time points investigated without a significant loss of cell
viability (data not shown). Transfection of MyLa2000 cells with siRNA targeting
STAT3 or STAT5, the two regulators of the IL-9 signalling pathway was done
and IL-9 expression was determined for up to 48h (Fig. 14B,C). Silencing was
confirmed by western blotting at 24 and 48 hours after transfection (Fig. 14D).
siSTAT5-transfected cells had a high reduction of IL-9 expression at 24 hours.
By 48 hours, both siSTAT3 and siSTAT5 reduced IL-9 expression significantly.
Similar results were found with a reduction of IL-9 expression when IRF4 was
silenced as early as at 24h and up to 96h (Fig. 14E). These data indicate that
direct targeting of IL-9 or its regulators can limit the growth and transcriptional
activity of malignant cells.

40
Figure 12: IL-9 blockade limits cell proliferation in keratinocyte and CTCL cell
lines. HaCat and SeAx cells were cultured in low bovine serum conditions and
100ng/ml IL-9. A blocking antibody targeting IL-9 was added at increasing
concentrations (100 – 500ng/ml). After 48h of culture cells were harvested to
determine cell proliferation by thymidine incorporation. Counts per minute are shown.
Statistical significance was assessed by Dunnet post-test. p values are shown.

41
Figure 13: Targeting IL-9 and its downstream regulators potentiate the effect of
PUVA. A) MyLa2000 cells were given PUVA followed by incubation in media
supplemented with IFNa2b (1,500 U/mL), goat polyclonal anti-human IL-9 antibody (20
mg/mL) or the two combined. B) MyLa2000 cells were transfected with siSTAT5 or
siCTRL 24 hours before treated with PUVA in vitro (1 mmol/L 8-MOP, 0.4 J/cm2).
Viability was assessed by AnnexinV/PI incorporation after 48 hours of culture.
Statistical significance was assessed by Dunnet post-test. These results are part of a
recent publication (Vieyra-Garcia et al., 2016) and are included in this document under
agreement with the publisher.

42
Figure 14: STAT3/5 pathway regulates IL-9 production in MyLa2000 cells. A)
MyLa2000 cells were treated with 180nmol/L of ruxolitinib and cultured for up to 48h.
IL-9 expression was quantified by qPCR at indicated time points; not treated (NT) cells
were used as controls. (B-C) MyLa2000 cells were transfected with siRNA targeting
STAT3 and STAT5. IL-9 expression was quantified by qPCR at indicated time points;
fold change is shown normalized with unspecific siRNA-treated cells (siCTRL) as
reference control. D) Western blot for STAT3 and STAT5 on siRNA transfected cells.
E) siRNA was used to silence IRF4 and IL-9 expression was determined for up to 96
hours of transfection. Statistical significance was assessed by Dunnet post-test; p-
values are shown. These results are part of a recent publication (Vieyra-Garcia et al.,
2016) and are included in this document under agreement with the publisher.

43
Animal models highlight the importance of inflammatory signals
The study of new therapeutic targets such as IL-9 and mechanistic aspects of
therapies like PUVA in cutaneous T-cell lymphoma require developing an
animal model. The cell line EL-4 (a mouse CD4 T-cell line) was used for a
syngeneic mouse model by intradermal injections in the back of C57BL/6 mice.
By doing so, mice developed skin lesions that turned into tumours within 2
weeks. Using a cell line from a mouse background allowed experiments that
took into account the contribution of the autologous immune system of the
animals and assessed the influence to the bona fide of the tumours or to the
protection of the host. Moreover, EL-4 cells have been used previously in
lymphoma models like acute lymphoblastic leukemia (Jacoby et al., 2014) and
lymphatic metastasis (Ochsenbein et al., 1999). At first this model was
developed to look into therapeutic mechanisms of PUVA. After 24h of injection
of the malignant cells, PUVA was initiated and given in subsequent rounds
every 72h. Tumour diameter was determined to assess efficacy of PUVA,
however no significant reduction of tumour growth as measured by
macroscopic diameter was observed in treated mice. Nevertheless, by looking
at the structure of the tumours in a H&E staining (Fig. 15A) at day 14 after cell
injection, it was evident that PUVA treated mice had a reduction in the
thickening of the epidermis and a band of clearance in the superficial area of
the dermis. The frequency of regulatory T-cells was determined by flow
cytometry in spleen and lymph nodes (Fig. 15B). A high number of T-cells with
expression of Foxp3 were found in the inguinal lymph nodes and spleen in
PUVA treated mice, suggesting that local therapy had an impact on systemic
anti-tumour response and supporting previous findings on immunomodulation
effect of PUVA.
After recognizing that MyLa2000 cells produce IL-9, and that this cytokine
increased the growth of HaCat and CTCL cell lines. Experiments to examine
the effect of targeting this molecule in the lymphoma animal model were carried
out. First, the effect of IL-9 in the growth of EL-4 was determined in vitro. These
cells were stimulated with increasing concentrations of recombinant IL-9 and
cell proliferation was measured after 48h (Fig. 16A). EL-4 cells had a
concentration dependent proliferation, which prompted the evaluation of the

44
role of IL-9 in vivo. After 6h of the injection of EL-4, anti-IL-9 antibody was
administered by a series of intralesional injections every 48h (Fig. 16B). IL-9
depleted animals had a slower growth of tumour that increased the survival rate
of these animals compared to isotype antibody injected mice (Fig. 16C). The
frequency of regulatory T-cells and antigen experienced T-cells was evaluated
as a measure of anti-tumour response in inguinal lymph nodes. It was found
that IL-9 depleted animals had higher frequencies of Treg cells (Fig. 16D), CD4
(Fig. 16E) and CD8 (Fig. 16F) antigen experienced cells. These results
indicated that IL-9 is an important modulator of tumour development.

45
Figure 15: PUVA limits the growth of malignant cells in the superficial dermis
and increases systemic number of Treg cells. A) Mice were injected intradermically
with 104 EL-4 cells in the dorsal skin (n5), PUVA treatment (filled dots) was given two
times per week (8-Methoxypsoralen 1%, 1500 mJ/cm2). Two weeks after injection mice
were sacrificed and lesion skin was examined by histology. H&E staining showed
thickening of epidermis and clearance of infiltrate in the superficial layer of the dermis.
B) Inguinal lymph nodes and spleen were analysed by flow cytometry to determine Treg
cell frequency by expression of CD3+, CD4+ CD25+ and Foxp3+. t-test was used for
statistical analysis; p value is depicted on top.

46
Figure 16: IL-9 increases proliferation of malignant cells in a lymphoma mouse
model. A) EL-4 cells were cultured in medium supplemented with increasing
concentrations of recombinant IL-9 (1ng – 200ng/ml). After 48h of culture cells were
harvested to determine cell proliferation by thymidine incorporation. Counts per minute
are shown. B-E) Mouse T-cell lymphoma cell line EL4 (104 cells) were injected
intradermally into the backs of C57BL/6 mice. Polyclonal goat anti-IL-9 antibodies (20

47
µg) or isotype control was given together with the cells and repeatedly every 48 hours
(n10 mice per experimental group). Tumour growth was assessed daily for 14 days
using a Mitutoyo Mini-calliper, tumour diameter mean is depicted (B). Mice were
sacrificed when tumour size reached 1 cm of diameter; survival is shown (C). Inguinal
lymph nodes were taken on day 14 to analyse the frequency of Treg cells (D) and
antigen experienced (CD44high, CD62Llow) CD4 (E) and CD8 T-cells (E) by flow
cytometry. Statistical analyses were done by Dunnet post-test (A), Mantel Cox (C) and
student t (B, D-F). These results (B-E) are part of a recent publication (Vieyra-Garcia
et al., 2016) and are included in this document under agreement with the publisher.

48
Therapies in humans like PUVA modulate inflammatory signals without
complete elimination of malignant cells
A detailed analysis of the cells that infiltrate lesional skin is needed to have a
better understanding of the complexity of the visible inflammation in MF
patients. The first step was to analyse the landscape of T-cells that invade the
skin, given the fact that lesional skin in MF not only is invaded by malignant
clones but also benign T-cells. This is a challenging task due to the few
molecular markers described that permit the identification of cells with aberrant
phenotype within the diffuse infiltrate seen in histological preparations. Beta
chain HTS of the TCR was used to study the entire T-cell repertoire to identify
unique clones, look at the length of the CDR3 region, estimate the frequency of
each clone within the population and classify clones by their constitutive
variable (V) and joint (J) genes. 300ng of total DNA extracted from lesional skin
was used to perform the sequencing in collaboration with Adaptive
Biotechnologies, a Seattle (USA) based company that did the sequencing and
provided an online tool analysis software; Immunoseq. Malignant clones were
identified by their high frequency. In average, the frequency of any T-cell clone
is not higher than 1%, in contrast, malignant T-cells had several folds higher
frequency than the rest of benign T-cells that populate the skin. A three-
dimensional plot is presented as representative of these findings (Fig. 17).
In this patient, a particular expanded sequence was found, outnumbering the
rest of the cellular population (blue bar indicative of an expanded malignant
clone). This clonotype constituted nearly 3% from all cells with functional T-cell
receptors (after excluding non-functional rearrangements or fragmented
sequences) and had almost 10 times higher frequency when compared with
the second most frequent clone (Fig. 18A). The malignant clone carried the
TCRbV02-01001 and TCRbJ01-01001 genetic fragments and with these
findings, experiments were carried out to visualize the malignant clone on
histological sections by using commercially available antibodies (70% of the
total T-cell clonotypes are covered by monoclonal antibodies). The Vb22
antibody recognizes the annotated TCRbV02 and by using sequencing data,
an estimate of 38% from all Vb22-positive cells was projected to belong to the
malignant clonal population (Fig. 18A,B). Furthermore, an analysis of whether

49
the malignant cells were producing IL-9 in the tissue was carried out. An IL-
9/CD3 double staining was performed to analyse the expression of IL-9 in the
total T-cell population (Fig. 19A). It was found that IL-9 was exclusively
produced by T-cells since only CD3+ cells co-stained with IL-9. Next, the
assessment of whether malignant cells exclusively produced IL-9 was
performed and Vb22/IL-9 double positive cells were found located at the basal
epidermis and across the infiltrate of the dermis (Fig. 19B). Furthermore, IL-9-
producing cells, negative for Vb22 were present, suggesting that IL-9 is
produced not only by T-cells but also by benign cells together with malignant
cells are the source of the IL-9. This presumably leads to an enriched
microenvironment of this cytokine. To test whether malignant cells in tissue also
expressed the Th9 related transcription factor IRF4 in correlation with the
observations in MyLa2000 cells, a Vb22/IRF4 stain was done (Fig. 19C).
Several Vb22-positive cells had expression of IRF4; in fact, IRF4 single positive
cells with lymphocyte morphology were found, suggesting that IL-9 expression
involves IRF4 in both malignant and benign T-cells.
After finding that the results from in vitro and the in vivo animal model correlated
with expression of IL-9 in lesional skin of patients, the question of whether
patients with clinical response to phototherapy also experience a decrease in
IL-9-producing cells in lesional skin was addressed. Biopsies taken at baseline
and after 6-45 weeks of treatment (the time when complete clinical response
was achieved) were used to carry out histological examinations. These biopsies
came from the archive of the Department of Dermatology. A summary of
medical information about these biopsies is presented in the methodology
section (M&M table 4). As shown in Fig. 19A, a significant number of IL-9-
positive cells populating the dermis before the patients were treated with PUVA
was observed. The biopsies taken after clinical response showed that the total
infiltrate of IL-9-positive cells was reduced by 69% (from 245 to 77 cells/mm2;
Fig. 20A). Additionally, a staining for IL-9 receptor was performed with the aim
to estimate the potential number of cells responsive to IL-9. A substantial
reduction of IL-9r-positive cells by a 64% (from 187 cells/mm2 before treatment
to 68 cells/mm2 after treatment was observed; Fig. 20B).

50
Subsequent from this, a follow up of patients undergoing PUVA was set up to
characterize the mechanistic effect of this therapy. A clinical study to recruit
early stage MF patients was initiated. After signature of an inform consent, the
patients were treated with PUVA two times per week. Scheduled data collection
visits with the patients were programed to evaluate clinical response and to
take biopsies from lesional skin. Two reference tools to assess the degree of
clinical improvement were used: The mSWAT score, a grade system that
weights the overall involvement of body surface and CAILS, a score for a
particular index lesion. In order to keep track of clinical response, a defined
(marker) lesion was selected on the first visit to take a baseline biopsy and
subsequent biopsies from a site in close proximity whenever possible. The
clinical scoring after 12-16 weeks of PUVA is presented (Fig. 21). The patients
had a mean improvement of 88% in the mSWAT score, as well as 81% in
CAILS, meaning that all patients had significant response to the treatment both
in overall and at the site of marker lesion.
Next, an examination of the total number of T-cells in the skin was done by high
throughput sequencing of the TCR and making an estimation of number of
sequences per 100ng of DNA (Fig. 22). A decrease of nearly 50% of the total
T cells after treatment was observed. Furthermore, the frequency of the
malignant clone was examined. At baseline, a clone outnumbering by several
orders of magnitude the rest of the population was found in all patients. These
cells were considered as malignant clones. Surprisingly, after an evident clinical
response, malignant cells were still found at high frequency in the majority of
cases (Fig. 23), at least in the early phase of treatment with 12-16 weeks of
exposure to PUVA. After a careful analysis of the sequencing data at baseline,
it was clear that patients fell into two categories; patients with a high burden
(n5) of malignant cells and patients with low burden of malignant clones (n3).
Despite having patients with two degrees of malignant T-cell burden, no
significant differences were found in the improvement of mSWAT and CAILS
scores (Fig. 24) when the two groups were compared.
After treatment, only one patient of the high burden group had a lower
percentage of the malignant clone. Two patients had similar percentages of
malignant cells and 2 patients had even higher percentages of malignant cells

51
than at baseline. Patients of the low burden group all had a significant reduction
of the malignant clone. The benign T-cells for each patient at baseline
compared to after PUVA were classified into four groups (Fig. 25): Malignant
cells (red), persistent benign T-cells found at baseline and after PUVA (blue),
benign T-cells not found (or eliminated) after PUVA (light green) and benign T-
cells newly recruited after PUVA (dark green). In the majority of cases (6 out of
8) a considerable percentage of malignant cells at baseline and after PUVA
were found. A relatively low number of benign T-cells that remained in tissue
after therapy was observed, however, a sizable proportion of benign T-cells left
the skin after therapy, which meant that the majority of benign T-cells found
after PUVA was newly recruited. Furthermore, a possible association between
the significant improvement after treatment with PUVA and the redistribution of
the T-cell repertoire was examined. A linear regression analysis was carried
out to look for a correlation of mSWAT reduction (due to its indicative
significance of systemic improvement) with alterations in T-cell populations.
mSWAT improvement did not correlate with changes in the percentage of
malignant cells. However, a significant correlation between benign T-cell
elimination and clinical response was found (Fig. 26). In fact, in all patients there
was a significant turnover of benign T-cells after PUVA (Fig. 27).
Moreover, nanostring analyses were done on biopsies of these patients to
examine possible treatment-induced changes on the MF transcriptional profile
(comparing baseline to after-treatment biopsies). The signature of MF that is
described in figures 1-7 was partially normalized after treatment. Although
clustering of groups before and after treatment wasn’t found, genes involved in
T cell responses, antigen processing, chemokine signalling, macrophages and
dendritic cells were down regulated after PUVA therapy, suggesting that
immunomodulation by PUVA is a significant element of its therapeutic
mechanism (Fig. 28A). From the top genes (many of them related to immune
regulation) with lower expression found at baseline, only four genes lost
significance, suggesting that the restoring of homeostasis does not primarily
depend on compensatory immune responses. In contrast, the majority of genes
with higher expression at baseline lost significance in patients with clinical
response (Fig. 28B), indicating the relevance of down regulated genes that

52
diminish visible inflammation as an effective approach on limiting the severity
of this disease.
Previous reports suggest that MF lesional skin infiltrate is composed by a high
diversity of cell types. However, so far there hasn’t been a quantitative analysis
of the cell infiltrate composition, partially due to the lack of analytical tools in
microscopy that can carry out systematic quantification of cells in histological
sections. To gain an insight in of which cells and in which proportion such cells
populate lesional skin, tyramide signal amplification (TSA) based
immunofluorescence was performed. This assay allowed us to use up to 5
primary antibodies on a single slide. The principle of this technique is that after
binding of a primary antibody, a biotinylated secondary antibody is applied
followed by streptavidin-HRP. This constitutes a signal amplification complex
that when tyramide bound fluorophores are added, fluorescent molecules form
stable covalent bonds deposit as fluorescent dyes. By applying heat to the
sample, the whole complex is destabilised and the slide keeps the fluorescence
deposited. A new primary antibody with different specificity can be added to
have a second signal, and this can be expanded with as many fluorescent dyes
available in the detection spectrum of an instrument. PerkinElmer’s imaging
system Mantra and the analysis tool inForm with a trainable algorithm to assign
phenotypes on cells with a specific fluorescent dye were used to quantify
immune fluorescence. Three different panels of antibodies were employed to
quantify adaptive immune cells (Fig. 29), innate immune cells (Fig. 30) and
certain specific subpopulations of T cells (Fig. 31). In this methodology, an
image of the immunofluorescence is composed by a series of pictures taken at
different wavelengths stacked into one file. The software identifies the peak
emission of each fluorescent dye and generates layers of individual stains used
for analyses and training of the algorithm (refined by the user criteria). After
training, the program generates a composite image of the phenotype of each
cell based on the training. Biopsies taken at baseline and after treatment were
analysed to make a comparison of the infiltrate composition.
In the adaptive immune cell panel, stains for CD4, CD8, CD20 and the
residence marker for T-cells CD103 (Mackay et al., 2013) were done (Fig. 29).

53
A decrease of 50% on the number of CD4 positive cells per square millimetre
was found. This result correlated with our findings by TCR HTS. A decrease in
the number of B-cells, and CD103 cells (summing cells positive for either CD4
or CD8) was found, whereas the number of CD8 positive cells had only a minor
decrease after PUVA (Fig 32A, 33A). In the innate immune cell panel (Fig. 30),
the marker for Langerhans cells CD1a, the marker for conventional dendritic
cells CD11c, and two markers for macrophages CD68 and CD163 were used.
A significant decrease of CD1a positive cells, mainly located in the epidermis
and superficial dermis was found. Due to the morphology and low expression
of CD11c, these cells were classified as Langerhans cells. A modest increase
in CD1a/CD11c double positive and CD11c single positive cells was found after
PUVA, whereas the number of CD68/CD163 double positive macrophages
remained unchanged (Fig. 32). It is very likely that the cells located at the most
superficial sites in the tissue were directly affected by PUVA therapy.
Additionally, a panel to look into subpopulation of T-cells with antibodies against
CD4, CD8, CD69 and Foxp3 was used (Fig. 31). In this part of the analysis, the
positivity of CD4 or CD8 was determined first, and then the expression of either
CD69 or Foxp3 was evaluated. The results are shown in three categories of
cells; CD8 and CD4 positive cells were grouped together for CD69 positivity or
negativity (referred to as CD69+ or CD69-). CD4 positive cells positive for
Foxp3 were referred to as Foxp3+. A discrete reduction of CD69- cells was
observed while Foxp3+ and CD69+ numbers remained nearly unchanged after
therapy. CD103 positive T-cells were reduced after PUVA.
To have a better understanding of which proportion each phenotype
represents, the percentage of each population within the total immune cells that
infiltrate lesional skin was calculated (Fig. 32B, 33B). CD4 cells were the main
population of the skin, however they suffered a slight contraction from 46% to
37%. Macrophages were the second most frequent cells and although their
total numbers didn’t change significantly, they increased up to 20% in the total
infiltrate. CD8 T-cells did change insubstantially from 10% to 12%, however, B-
cells (defined by CD20 positivity) decreased from 10% to 5%. CD1a/11c double
positive cells increased from 4% to 10% in correlation with their absolute
numbers. CD1a cells decreased almost by half from 13% to 7% while CD11c

54
went from 3% to 9%. In the distribution of T-cell subpopulations, the majority of
T-cells were CD69- and they contracted from 81% down to 74%. CD69 positive
cells increased from 10% up to 19% arguing in favour of an influx of new cells
likely being recruited from the blood. CD103 positive cells decreased from 7%
to 2% and Foxp3 cells increased from 2% to 5%. These results suggested that
on top of the decreased cellularity of the skin after treatment, the remaining
cells were still diverse in cell types, which implied a different cell-to-cell
interaction that may have contributed to ease the severity of skin lesions.

55
Figure 17: T-cell repertoire of early stage MF. Total DNA from lesional skin before
and after treatment was used to carry out HTS of the CDR3 region in the beta chain of
the TCR. The total number of sequence reads (y axis) was plotted in a 3D histogram
(B) distributed by their constituent variable and joint regions (x and z axis). The
malignant clone was identified by its outstanding frequency in the total T-cell repertoire
(red arrow). The exact designation of the constituent V and J fragments are annotated
above the arrow. These results are part of a recent publication (Vieyra-Garcia et al.,
2016) and are included in this document under agreement with the publisher.

56
Figure 18: Malignant clones outnumber benign T-cells by several folds. A)
Analysis of the top 10 Functional TCR sequences in lesional MF skin. The amino acid
sequence of the CDR3 is shown (CASRHGPWTEAFF TCRBV02-01*01, TCRBJ01-
01*01) and frequency of this clone was 3.5%. B) Immunohistochemical double stain;
Vb22 (blue) and mouse isotype control (red). These results are part of a recent
publication (Vieyra-Garcia et al., 2016) and are included in this document under
agreement with the publisher.

57
Figure 19: IL-9 is produced by benign and malignant T-cells. Paraffin-embedded
skin biopsies from early stage MF patients were stained by two-colour
immunohistochemistry (blue/red). A) Sections stained with CD3/IL-9, magnified areas
are indicated (detailed scoring of double stains are shown in M&M table 4). B-C)
Sections stain with the Vb22 antibody to identify the malignant clone by the expression
of the TCRbV02-01 gene product (selected based on sequencing results), co-stained
with IL-9 (B) or IRF4 (C) (patient A4 is shown). These results are part of a recent
publication (Vieyra-Garcia et al., 2016) and are included in this document under
agreement with the publisher.

58
Figure 20: IL-9 production is reduced in MF patients treated with PUVA. Samples
from MF patients before and after treatment (M&M table 4) were analysed for IL-9 (A)
and IL-9r (B) expression (micrographs from patient A1 are shown). The average of
positive cells in three 40x fields per sample is presented: adjusted to the unit of area
(mm2). Statistical significance was assessed by paired student t test. These results are
part of a recent publication (Vieyra-Garcia et al., 2016) and are included in this
document under agreement with the publisher.

59
Figure 21: Clinical response of early stage MF patients to PUVA treatment. MF
patients (n8, additional information of patients in M&M table 3) were treated with a
standard regime of PUVA (described in materials and methods). Clinical response was
evaluated systemically with mSWAT score. A marker lesion in a particular body site
was selected to quantify response to therapy with the CAILS score. Both evaluations
were done at baseline and after treatment (12-16 weeks). Overall percentage of
improvement is shown.

60
Figure 22: PUVA reduces the total T-cell infiltrate in MF lesions. Lesional skin was
taken at baseline and after PUVA (12-16 weeks) to carry out HTS of the TCR. The
total number of reads was adjusted to 100ng of DNA sequenced. Statistical
significance was assessed by paired student t test.

61
Figure 23: Clinical response does not eliminate malignant T-cell clones. 3D
histogram of the T-cell repertoire at baseline (upper panel). The clinical photograph
shows the body site biopsied and the degree of lesional skin at baseline. In the lower
panel, the T-cell repertoire is shown after 12 weeks of PUVA. The patient showed
clinical response (as seen in clinical photograph), however, the malignant clone was
still present. A biopsy taken in a different body site with residual skin lesion showed
the persistence of the same clone.

62
Figure 24: Malignant T-cell burden is not a prognostic marker for response to
treatment. A) By using HTS data, the frequency of malignant clones in the total T-cell
population was estimated at baseline and after PUVA. Patients were grouped in sets
individuals having lesional skin with low (n3) or high (n5) burden of malignant cells. B)
Percentage of clinical improvement in mSWAT and CAILS in the different sets of
patients.

63
Figure 25: PUVA alters the T-cell repertoire in lesional MF skin by inducing
benign T-cell turnover. Based on HTS data of lesional skin at baseline and after
PUVA, the T-cell composition of the infiltrate was classified into four categories,
according to their T-cell repertoire. Percentages of the different categories are shown:
Malignant clone (red), persistent benign T-cells found in the tissue before and after
treatment (blue), benign T-cells that left the skin (or were eliminated) after PUVA (light
green) and benign T-cells recruited after PUVA (dark green). Results from a patient
with complete response on mSWAT and CAILS are shown.

64
Figure 26: Clinical response correlates with benign T-cell turnover. The
percentage of reduction in the severity of the mSWAT score was calculated. A
correlation analysis was performed by linear regression of mSWAT to the percentage
of malignant T-cell elimination (left panel) or to the percentage of benign T-cells
eliminated (right panel). The p-value and R2 score are shown.

65
Figure 27: After PUVA newly recruited cells constitute the majority of the benign
T-cell population. Composition of the benign T-cell population in each patient is
depicted at baseline and after PUVA therapy. T-cells found in the tissue before and
after treatment (blue), T-cells that left the skin (or were eliminated) after PUVA (light
green) and benign T-cells recruited after therapy (dark green).

66
Figure 28: Transcriptional signature of early stage MF is partially normalized
after PUVA. Frozen skin biopsies from lesional skin at baseline and after PUVA were
used to extract RNA. The expression of inflammatory related genes, oncogenes and
tumour suppressor genes was assessed by nanostring and compared to normal skin.
A) Genes were grouped based on their biological function: T-cell activation, antigen
processing, B-cell, macrophage, dendritic cell, chemokine signalling, and
granulocytes. B) Waterfall plot (fold change) with down/up regulated genes at baseline
(red) and after PUVA (grey) compared to normal skin. The cut-off value was +2.5, p
value under 0.05 and FDR of 0.5.

67
Figure 29: Adaptive immune infiltrate in lesional MF skin. Immunofluorescence
imaging of lesional skin was done at baseline and after PUVA. A) Micrograph from all
fluorophores (top left), DAPI, CD4, CD8, CD20 and CD103. B) Composite images from
all markers except DAPI (left panel) and phenotyped image (right panel) were
generated with inFrom software from baseline sections (upper panel) and after PUVA
(lower panel).

68
Figure 30: Innate immune infiltrate in lesional MF skin. A) Immunofluorescence
stain of lesional skin at baseline and after PUVA. Nuclear staining of DAPI, CD68/163,
CD1a, CD11c and CD1a/11c are shown. B) Composite images from all markers
except DAPI (left panel) and phenotyped image (right panel) were generated with
inFrom software from baseline sections (upper panel) and after PUVA (lower panel).

69
Figure 31: T-cell subpopulations infiltrate in lesional MF skin.
Immunofluorescence stain of lesional skin was done at baseline and after PUVA. A)
Nuclear staining with DAPI, CD4, CD8, CD69 and Foxp3. B) Composite images from
all markers except DAPI (left panel) and phenotyped image (right panel) were
generated with inFrom software from baseline sections (upper panel) and after PUVA
(lower panel).

70
Figure 32: Quantitative analyses of cell infiltrate in lesional MF skin. A) Cell
counts per mm2 at baseline and after PUVA. Cells were phenotyped for CD4, CD8,
CD20, CD1a, CD11c positivity and CD1a/CD11c or CD68/163 double positivity. B)
Composition of infiltrating cell populations at baseline and after PUVA. Statistical
significance was assessed by paired student t test.
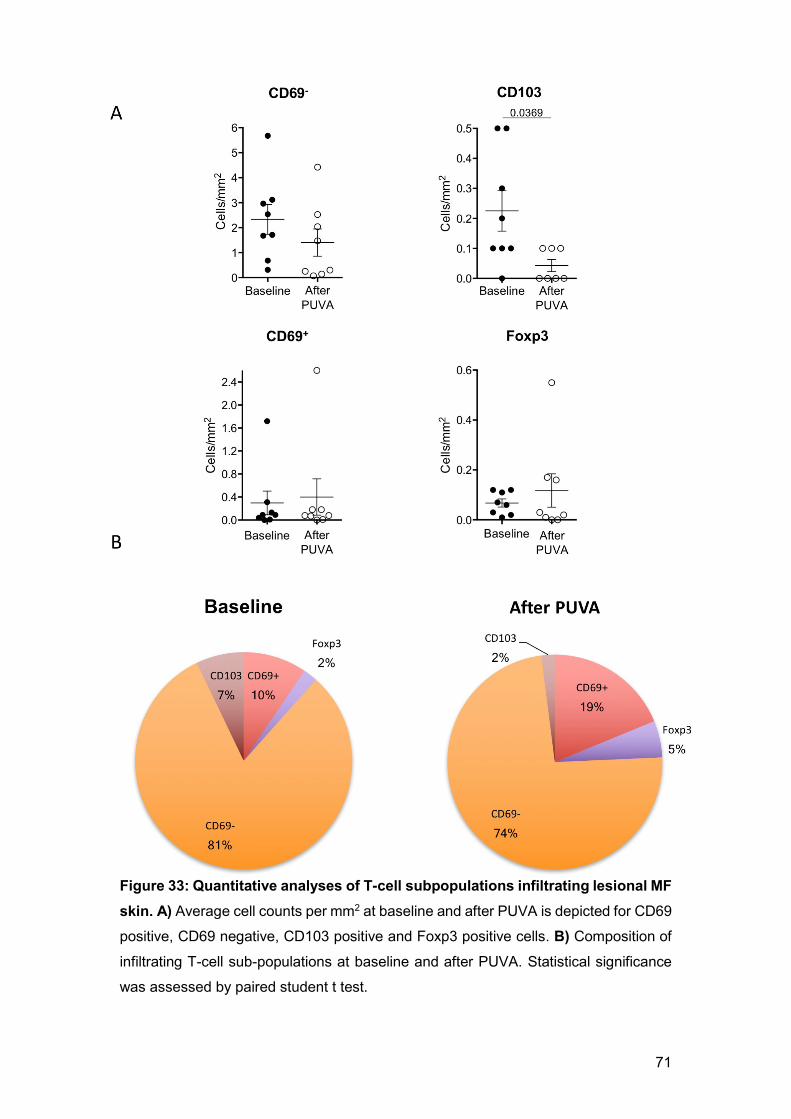
71
Figure 33: Quantitative analyses of T-cell subpopulations infiltrating lesional MF
skin. A) Average cell counts per mm2 at baseline and after PUVA is depicted for CD69
positive, CD69 negative, CD103 positive and Foxp3 positive cells. B) Composition of
infiltrating T-cell sub-populations at baseline and after PUVA. Statistical significance
was assessed by paired student t test.

72
Discussion
Recent advances in sequencing techniques and multiplex mRNA quantification
have made the profound analyses of the imbalanced transcriptional landscape
possible in a wide range of malignancies. Numerous reports on the genomic
profile of MF and SS (Woollard et al., 2016, Ungewickell et al., 2015) coincide
in the high heterogeneity of acquired mutations in these diseases, rising up the
challenge of the discovery of genes to target in new therapies. However,
alterations in p53, TNF family members and JAK/STAT signalling seem to be
commonly shared among MF patients with a progressive malignant phenotype.
Despite the advantage of having the genomic signature of malignant cells
separated by cell sorting, as many of these studies do, the primary interest lays
on alterations not only attributed to the neoplastic T-cells but their whole
environment. This study aimed to have a better understanding of the pro-
inflammatory microenvironment that the malignant clone is accompanied by;
this has a particular relevance in the context of the alterations of basic functions
of the skin, like losing skin barrier function that can lead to opportunistic
infections (Mirvish et al., 2013). Alterations in p53 were not found in this
analysis, most likely by the fact that the material analysed was total skin and
the RNA of neoplastic cells was not predominant. However, the increase in
TNF, TNFSF14 and TNFSF8 expression highlighted the relevance of TNF
signalling. This result is also supported by previous findings (Cabal-Hierro and
Lazo, 2012) which demonstrated recurrent activating mutations and genomic
gains in TNFRSF1B leading to enhanced non canonical NFκB activation
(Ungewickell et al., 2015). An up regulation of the NFκB mediator RelB (non-
canonical) and RelA was found in MF patients (Fig. 2). Previous studies have
linked CTSH with a metastatic phenotype in solid tumours (Nagai et al., 2003),
consistent with the results here reported. CD154, a marker associated with
chronic inflammation and autoimmune diseases, binds to CD40 and other
integrins like αIIbβ3 and α5β1. After binding with the α5β1, Fas-mediated cell
death is inhibited (Bachsais et al., 2016). This was particularly relevant to this
study, since both CD154 and CD40 were up regulated in lesional skin. The
search for common alterations in CTCL transcriptome has provided a small
group of altered genes frequently seen in other lymphomas. MAPK, ERK, and

73
JAK/STAT activation have been recently described in MF (Woollard et al.,
2016, Kiel et al., 2015), emphasising the role of pro-inflammatory signals
fostering the malignant clones.
Various cytokines have been reported as important mediators of the pro-
inflammatory microenvironment in MF. In this study, the cytokine panel showed
an up regulation of TNF and the increased expression of IL-7R. This in context
of previous findings of IL-7, as a proliferation-triggering factor in CTCL
(Yamanaka et al., 2006b, Dalloul et al., 1992), suggests that targeting this
cytokine might be a viable option for therapy to test in this disease.
The observed lower production of cytokines like IL-11, IL-4 and IL-15 in lesional
skin compared to normal skin suggests that the microenvironment that keeps
homeostasis (Hanel et al., 2013), builds on a diverse set of cytokines. It can be
speculated that the malignant clones affect the microenvironment of the skin
and in exchange, the secretion of cytokines like TNF is augmented.
LAG3, IDO and STAT5 as markers of Treg cells were overexpressed in lesional
skin. However, an up regulation of Foxp3 or IL-10 and TGF-β was not observed.
Several studies have tried to assess the role of Treg cells given that immune
suppression is common in MF patients and may favour infections with
opportunistic pathogens. Despite many efforts to uncover the role of Treg cells
in MF, the function of these cells in the context of this malignancy remains
controversial. In a study looking at skin lesions of 44 MF patients, Foxp3 was
only expressed by infiltrating benign lymphocytes and not malignant cells
(Wada et al., 2010). Furthermore, another study showed that cells expressing
Foxp3 also had a low expression of CD4, suggesting a phenotype of chronic
effector T-cell activation rather than T-cells with regulatory function (Clark et al.,
2011).
In this work STAT3 was found up regulated, supporting the notion of Th17 cell
involvement in lesional skin contributing to the pro-inflammatory
microenvironment. It has been shown that patients with progressive disease
have a substantial increase of IL-17F secretion (Krejsgaard et al., 2013).
74
Although in this study IL-17 was not up regulated, the expression of IL-17r was
increased, suggesting an important role of this cytokine in accordance with
previous reports (Krejsgaard et al., 2013).
It has been shown that IL-9 is secreted in inflammatory skin diseases like
psoriasis (Singh et al., 2013) (Schlapbach et al., 2014). More recently, the
importance of this cytokine in infection models of C. albicans and other
extracellular pathogens in the skin have been described (Schlapbach et al.,
2014). IL-9 was expressed spontaneously in cells with an aberrant phenotype
(Fig. 9), similarly to what is known in other malignancies like diffuse large B-cell
lymphoma (Lv et al., 2013) and leukemia with HTLV-1 transformed T-cells
(Kobayashi et al., 2012). IL-9’s function as growth factor, angiogenesis
promoter and anti-apoptotic mediator suggests a potential role of this cytokine
in cell transformation and tumour development. Nevertheless, only MyLa2000
cells produced this cytokine while the other two cell lines tested did not. This
may be inherited by the differential origin of the cells analysed (MF vs. SS) or
may also indicate that SS cells produce this cytokine only after stimulation. This
work did not elucidate the later condition in vitro but results from the serum of
a SS patient indicated a considerable production of IL-9 with around 20pg/ml
(data not shown).
By characterizing MyLa2000 cells, it was evident that these cells were positive
for PU.1 and IRF4, two transcription factors strongly associated to IL-9
production. Controversially, PU.1 has been found as a tumour suppressor in B-
cell lymphomas (Yuki et al., 2013) whereas IRF4 has been described as an
oncogene under NFκB regulation in T-cell lymphomas (Boddicker et al., 2015).
The phenotype found in cells from MF patients differed with regard of
expression of PU.1 in MyLa2000 cells. In MF lesional skin, many PU.1 positive
cells infiltrating the tissue were found. However, none of them were T-cells. In
fact, PU.1 positive cells were CD1a positive (data not shown) suggesting a
Langerhans phenotype. CD3 positive cells co-stained with IRF4, meaning that
IL-9 was produced by the infiltrating T-cells, a finding that will be discussed
further below.

75
The supernatant of MyLa2000 cells contained a substantial amount of IL-9,
which triggered cell growth in other CTCL cell lines like SeAx and keratinocyte-
originated HaCat cells (Fig. 10). Meanwhile, the stimulation with IL-9 increased
proliferation of both SeAx and HaCat cells in a dose dependent manner (Fig.
11), highlighting the relevance of this cytokine in the amplification of visible
inflammation in diseased skin. IL-9 increased the production of VEGF in
keratinocytes (Wu et al., 2014) and activated the PI3K/Akt/mTOR signalling
pathway on lymphoid cells (Kundu-Raychaudhuri et al., 2016). IL-9 blockade
emphasized the role of this cytokine as a growth factor. The possibility of
targeting this cytokine for therapeutic purpose is suggested as there are anti-
IL-9 humanized antibodies in evaluation for treating inflammatory airway
diseases like asthma (Antoniu, 2010).
The investigations carried out with MyLa2000 cells to test IL-9 targeting,
showed how viable this strategy is. By using an anti-IL-9 antibody together with
PUVA, an increase of cell death induction was found. These experiments had
IFNα2b as standard adjuvant therapy, given its frequent use in patients with low
response (Nikolaou et al., 2011) or low tolerance (Rupoli et al., 2005) to PUVA.
A comparable response between IFNα2b and anti-IL-9 was found when cells
were treated together with PUVA. Furthermore, anti-IL-9 treatment alone did
not have a significant effect on cell viability (data not shown). This was perhaps
due to exceeding production of IL-9, not matched by the limited availability of
the antibody, which prompted us to use silencing RNA as different approach to
block the signalling pathway of this cytokine both in vitro and in vivo (Fig. 14,
16).
The JAK1/2 inhibitor ruxolitinib reduced the production of IL-9 in MyLa2000
cells without a significant decrease in cell viability. Moreover, blockade of
STAT3, STAT5 and IRF4 with siRNA further decreased IL-9 production,
meaning that both the efferent and afferent branches of IL-9 signalling are good
candidates for blocking the spontaneous production of this cytokine. It remains
to be determined if any of the JAK/STAT activation mutations described for
CTCL (da Silva Almeida et al., 2015, Wang et al., 2015) have been acquired by
MyLa2000 cells.

76
The in vitro assay with EL-4 cells, suggested that IL-9 promotes proliferation
mouse origin T-cells. Furthermore, the tumour mouse model had the key
mycosis fungoides characteristic of being restricted only to the skin. It also
offered a suitable time for tumour formation within two weeks with a relatively
low number of injected tumour cells (104 cells). PUVA therapy was not powerful
enough to entirely stop EL-4 cell growth but it had a systemic effect by inducing
a higher percentage of Treg cells in inguinal lymph nodes and spleen. This
finding goes in line with previous observations in SS patients treated with ECP.
After therapy, these patients had higher numbers of Treg cells (Rao et al., 2009)
with an augmented regulatory function, triggered by the conversion of ATP to
adenosine by CD39 ectonucleotidase activity (Schmitt et al., 2009).
Additionally, in a TGF-β transgenic mouse model of psoriasis in which animals
treated with PUVA showed an increased number of skin tropic (CLA-positive)
Treg cells in lymph nodes (Singh et al., 2012).
This model was also useful to evaluate the role of IL-9 in tumour formation. In
vivo depletion of IL-9 led to a slower tumour growth and higher number of Treg
cells in draining lymph nodes. A similar model with EL-4 cells has been
validated in previous studies looking at the role of mast cells (Rabenhorst et al.,
2012), tumour-associated macrophages with M2 phenotype (Wu et al., 2014),
cytokine secretion and oncogenic pathways (Wu et al., 2011) in cutaneous
lymphomas. Important to note, all of these investigations primarily focused on
inflammatory mediators relevant in MF.
This work was developed in parallel to a clinical study, which offered the
advantage to get freshly isolated biopsy material from MF patients. The follow
up of these patients throughout treatment offered the means to analyse the
therapeutic effect of PUVA with molecular biology methods. The usage of two
different score systems to evaluate clinical status provided a clear readout of
overall clinical response (mSWAT) and local marker lesions (CAILS). The HTS
results showed a profound reduction of the total number of T-cells after therapy
and allowed the identification of the malignant clones in every patient. The
stratification of patients was done based on the relative individual proportion of

77
the malignant clone and its T-cell repertoire. Only few studies have looked at
the tumour infiltrating lymphocytes with the major limitation that in patients with
low number of neoplastic cells, the malignant clone is usually not detectable by
current technology (Kirsch et al., 2015). Previous reports on a polyclonal
response to super antigens of S. aureus showed that inflammatory mediators
against S. aureus toxin fuels the rise of neoplastic clones, thus, spurring the
debate on the pathophysiology of the disease at early stages (Willerslev-Olsen
et al., 2013). With that in mind, a robust study is much needed to understand
the role of benign T-cell infiltrate in MF. Moreover, this work is among the first
studies that use sequencing data to conduct histological studies with antibodies
that recognize the malignant clone, estimate the relative frequency of the
neoplastic cell and visualize it in conjunction with other antibodies and
scrutinize neoplastic cell production of inflammatory mediators like IL-9. This
allowed the examination to attribute the high production of this cytokine to the
malignant clone. However, it also showed that benign T-cells produced this
cytokine, bringing support to the paradigm of an active benign population that
feeds the malignant clone. A possible explanation of this is that malignant cells
can reprogram benign T-cells in producing cytokines and other growth factors
(Guenova et al., 2013). Nevertheless, the malignant cells had the distinct
expression of IRF4, while only a handful of benign T-cells expressed this
transcription factor. This is arguing on the distinct Th9 phenotype of the
malignant cells and making IRF4 a possible marker of malignancy as seen in
multiple myeloma. In this disease, IRF4 has an extensive network of targeted
genes by a trans-activation of Myc (Shaffer et al., 2008).
Despite a significant reduction of the total TCR count as a measure of T-cell
infiltration accompanied by clinical response to PUVA, a generalized pattern of
predominance of the malignant clone over the rest of residual T cell population
was observed (Fig. 24). This effect was accentuated in those patients with high
burden of malignant cells. Nevertheless, both high and low burden patients had
a substantial benign T-cell turnover and a low percentage of benign clones
surviving after therapy (Fig. 26). This finding uncovers the underlying role of
benign T-cell infiltration and brings up several questions: Are these patients
cured? Is it necessary to kill all the malignant clones in order to get a sustained

78
response? Does malignant T-cell burden in clinical remission correlate with
earlier relapse? The pragmatic point of view indicates that absolute depletion
of the malignant clone is not necessary and many treatments like PUVA, ECP
and immune modulatory therapy fall into a set of therapeutic alternatives that
silence the disease while accomplishing a long lasting remission. PUVA may
reach long-term disease free status in some patients after complete initial
response (Herrmann et al., 1995b). ECP requires a long time of therapy to get
the patient into remission, however, not enough evidence is available regarding
the duration of clinical response (Geskin, 2007). The combination of immune
modulatory regimes like IFNα and retinoids can achieve up to 6 years of
remission in CTCL patients (Polansky et al., 2015). These data indicates that
there are still many areas for improvement and studies like this one bring light
into what can be expected from the therapies in current use and helps to
understand their advantages and limitations. In fact, the data presented
correlate benign T-cell turnover with clinical response (Fig. 26). PUVA offers
the possibility to understand the general mechanism of anti CTCL treatments
by elucidating the role of the cells that are depleted and those that repopulate
the skin lesions. Early analyses showed that newly recruited cells have a high
diversity (data not shown) and a lower degree of activation by lower expression
of TCR signalling pathways like ZAP70, NFAT, LCK and SH2D1A (Fig. 28).
After therapy, changes in T-cell activation markers were not alone, MHC-II and
B-cell and macrophage markers were down regulated, suggesting a decrease
of non-T-cell infiltrate. Furthermore, many of the genes with high expression in
diseased skin lost statistical significance after therapy and were normalized to
levels as observed in healthy skin. Moreover, most genes down regulated in
diseased skin compared to normal skin remained unchanged and only a few of
them went back to normal levels after treatment (Fig. 28), suggesting that it is
the exacerbated inflammation related to the genes up regulated in the untreated
lesional skin that causes clinical signs of disease.
These findings opened a new avenue of research taking into account the role
of immune cells other than T-cells in the onset of visible inflammation. A
quantitative analyses regarding the kind of cells that infiltrate the skin in MF, an

79
estimation of the density and distribution of these cells and the fate of these
cells after therapy were areas to address in this work. The significance of the
analyses is that all these studies such as co-staining of the Vb22 segment of
the T-cell receptor were done in situ, looking at the cells embedded in the
microenvironment of the lesional skin. The ability to do immunofluorescence for
several markers of inflammatory cells in sections of lesions had the advantage
of looking at the spatial relations of cells to each other that provided more
information rather than just looking at the absolute numbers.
As expected, CD4 positive cells were the most abundant cell type in lesional
skin before and at much lower density after treatment. Cells intercalated in the
infiltrate of lesional skin like CD8, CD20 (B-cells), CD1a and CD68/CD163
(macrophages) double positive cells were decreased (some of them
significantly) after therapy compared to baseline. The majority of these cells
were uniformly distributed in the dermis, although, many CD1a single positive
cells allocated only in the epidermis (not unexpected since Langerhans cells
harbour this marker) and its number was significantly reduced by PUVA.
The ratio of CD4 positive cells to macrophages was approximately 3.2:1 similar
compared to the ratio of CD1a single positive cells to CD4 positive cells of 3.5:1
(Fig. 32). Importantly, the T-cell compartment only accounted for 46% of the
total cellularity while the approximate other half was constituted by other
inflammatory cell types. This may explain why the immune modulatory effect of
PUVA plays an important role, by causing a reduction of the visible
inflammation. This can be attributed also to the reduction of those cells not
belonging to the T-cell compartment (Fig. 31). Previous reports explore this
angle of infiltrating cells in CTCL, functioning as elements of tumour
surveillance vs. tumour tolerance. M2 macrophages providing VEGF, CCL18
and IL-10 (Gunther et al., 2011, Wu et al., 2011), immature DC-SIGN+ DCs
inducing tolerance (Schlapbach et al., 2010) (Ni and Duvic, 2011) and targeted
B-cell have been proposed as means to re-establish immunologic tumour-
control in early MF (Theurich et al., 2016). Additionally, in response to PUVA
the T-cell composition of the infiltrate in MF skin was redistributed and a minor
contraction of CD69 negative cells and an increase of Foxp3 cells and CD69

80
positive cells was observed in MF cases, findings going in line with previous
reports of ECP in leukemic CTCL (Shiue et al., 2015). These results
complemented the current discussion on the role of TRM cells in CTCL. Although
the expression of TRM related markers was not observed directly in neoplastic
T-cells, lesional skin had an abundance of TRM when compared to normal tissue
and the expression levels of ITGAE, CD96 and NFAT among others were
reduced after therapy. These findings suggested that these cells are involved
in the severity of MF, a question currently addressed by many research groups
trying to identify players that may limit or contribute to this disease.
This work highlighted the role of the T-cell repertoire in the onset of early stage
mycosis fungoides. Despite its limitations like the restricted number of patients
analysed and an animal model in which the malignant clone used doesn’t share
all the characteristics of CTCL neoplastic cells it did show that that PUVA
changes the composition of the infiltrating benign T-cells and that growth
factors like IL-9 are produced by both benign and malignant T-cells.

81
Conclusions
We found a transcriptional signature of lesional skin in early stage MF enriched
with expression of T-cell activation-related, antigen processing-presentation
and JAK-STAT signalling genes. This signature was partially normalized after
PUVA therapy.
MF patients had T-cells positive for IL-9, IL-9r, IRF4 and STAT3 in their skin
lesions. By using HTS data the malignant clone was identified and IL-9
production was found to come from both malignant and benign T-cells. In vitro
assays suggested a high expression of IL-9 driven by STAT3/5 and IRF4
activation.
Patients with both low and high burden of malignant cells responded well to
PUVA as evident by a lower score of mSWAT and CAILS after treatment.
Despite this, determination of the T-cell repertoire in the biopsies taken after
PUVA from suspicious sites of residual MF showed that the malignant clone
was still present in many cases and had the highest frequency in the T-cell
infiltrate and clinical improvement correlated with benign T-cell turnover. After
treatment, the total number of CD4 T-cells was reduced by 50%, a result
confirmed by HTS and immunofluorescence. Langerhans cells (CD1a positive)
and skin resident T-cells (CD103 positive) also had a substantial reduction in
skin after therapy.
The EL-4 mouse model showed that PUVA triggered systemic immune
suppression by induction of higher frequencies of Treg cells, despite the fact,
that the model failed to replicate in full the therapeutic effect of PUVA against
tumour formation. IL-9 blockade in mice delayed tumour growth and increased
the frequency of activated T-cells in spleen and lymph nodes, highlighting the
role of IL-9 in tumour development.
Together, these results highlight the relevance of the inflammation that
accompanies the growth of neoplastic T-cells in the tissue and suggest a close
interaction between malignant T-cells and other immune cells in lesional skin

82
in MF. Benign T-cells may support the growth of malignant T-cells by feeding
them with cytokines, chemokines and other inflammatory mediators. Interfering
with those factors may pave the way for novel treatments.

83
Materials and methods
Patients
Human tissue samples from two sets of patients were available. Archived
biopsies were tracked by computer-assisted search in the electronic patient
documentation system of the Phototherapy Unit at the Department of
Dermatology in the Medical University of Graz. Paraffin-embedded samples
from eight patients with MF who had complete clinical and histological response
to photo(chemo)therapy were identified. The patients had been treated with
PUVA (n5) or 311-nm UVB (n3). The biopsies were taken before and after
therapy in the period of 2002-2012. The second set of biopsies came from a
clinical study (NCT01686594), where patients with MF clinical stage IA–IIB
were treated in a standardized manner by oral PUVA (8-MOP, 10 mg per 20 kg
of body weight; UVA 2x week). Biopsies were taken at baseline and after 12-
16 weeks of therapy for histological analysis, high throughput TCR sequencing
and nanostring. Normal lesion-adjacent skin samples were available from
patients who had undergone surgery for skin lesions (i.e., melanocytic nevus
or basal cell carcinoma) or cosmetic procedures. The ethics committee of the
Medical University of Graz reviewed all procedures and gave their approval
(protocols no. 25-294 ex 12/13; 24-169 ex 11/12; 21-080 ex 09/10; and 18-068
ex 06/07). This study was performed in compliance with the Declaration of
Helsinki.
Cell lines
Cell lines derived from CTCL patients were used: MyLa2000 cells derived from
a patient with MF, Hut78 and SeAx cells derived from patients with Sèzary
syndrome were kindly provided by Professor Robert Gniadecki (Department of
Dermatology, Bispebjerg Hospital, Copenhagen University, Denmark).
MyLa2000 and SeAx cell lines were cultured in high glucose DMEM medium
with 10% FBS, 50μM 2-mercaptoethanol and 50U/ml penicillin and 50μg/ml
streptomycin. Hut78 cells were maintained in RPMI 1640 medium with 10%
FBS, 2mM L-glutamine, 1mM sodium pyruvate, 10mM HEPES, 50U/ml
penicillin and 50μg/ml streptomycin. HaCat cells were used for IL-9

84
supplementation experiments. The cells were cultivated in high glucose DMEM
medium with 10% FBS, 50μM 2-mercaptoethanol and 50U/ml penicillin and
50μg/ml streptomycin.
For the animal lymphoma model the mouse T-cell lymphoma cell line EL-4 was
used. EL-4 cells were purchased in ATCC and maintained in high glucose
DMEM medium with 10% FBS, 50μM 2-mercaptoethanol and 50U/ml penicillin
and 50μg/ml streptomycin.
Nanostring analysis
A robust gene expression analysis with nanostring technology was performed,
using the PanCancer Immune Profiling Panel (Nanostring). The expression of
770 genes involved in immune responses and cancer driving genes together
with 40 reference genes were examined. 100ng of RNA extracted from lesional
skin (see methods below) was used after being checked on RNA quality by the
bioanalyzer system (Agilent). The assay was performed by the molecular core
facility of the Brigham and Woman’s Hospital (Harvard Medical School, Boston,
MA, USA). The results were analysed with the nCounter software (Nanostring)
making a comparison between healthy skin, lesional skin at baseline and after
PUVA therapy.
KEGG pathway analyses
The KEGG platform was used to analyse the biological interactions of the
nanostring data. The fold change values of healthy skin compared to lesional
biopsies were put into the KEGG algorithm to generate a graphical
representation of enriched pathways in TCR and BCR signalling as well as
cytokine-cytokine receptor interaction and signalling.
Enzyme linked immunoassay
The production of IL-9 by the cell lines MyLa2000 and Hut78 was quantified in
the supernatant. The Human IL-9 ELISA kit (eBioscience, 88-7958-22) was
used according to the manufacturer's instructions. The assay is a sandwich

85
version of a conventional ELISA with a capture antibody bound to the bottom
of the wells. 50µl of sample to test and a HRP linked secondary antibody was
used. After substrate addition, a spectrophotometer machine at an optical
wavelength of 450 nm was used to quantify the colorimetric reaction.
Flow cytometry
0.25 - 0.5 x 10⁶ cells were used to carry out flow cytometry analyses. To stain
PU.1, MyLa2000 and Hut78 cell lines were fixed with Fixation/Permeabilization
buffer (eBioscience, 00-5123) for 30 minutes. An isotype control antibody or an
anti-IRF4-eFlour660 antibody (eBioscience, 50-9858-82) was added in
permeabilization buffer (eBioscience, 00-8333) and incubated for 30 minutes.
For analysis of mouse cells, lymph nodes were minced in PBS to make cell
suspensions. Cells (0.5x10⁶) were stained with an anti-CD3-BrilliantViolet421
(Biolegend, 100335), anti-CD4- PercP (eBioscience, 45-0042-82), anti-CD8-
APC (Biolegend, 100711), anti-CD44-PE-eFlour610 (eBioscience, 61-0441),
anti-CD62L-APC-Cy7 (Biolegend, 104428) and anti-CD25-Pe-Cy7
(eBioscience, 25-0251-82) antibody for 20 minutes. Intracellular staining of
Foxp3 (eBioscience, 17-5773-82) was carried out as described above. All
samples were examined in the FACS LSR-II (BD Biosciences) and analysed
with FlowJo V9.3.2 (Tree Star).
Genetic material isolation and polymerase chain reaction
Total DNA and RNA were isolated from frozen material of lesional skin biopsies,
healthy skin or cell suspensions using the AllPrep DNA/RNA Mini Kit (Qiagen
80204) in accordance with the manufacturer instructions. The samples were
homogenized with the MagNa liser (Roche) and a column based DNA/RNA
extraction was performed. The concentration of DNA/RNA obtained was
quantified with a nanodrop (Thermo-Scientific). For cDNA synthesis, 0.5µg of
RNA were used for reverse transcription (Applied Biosystems, 4368814). For
quantitative expression analyses 5ng of cDNA were used to test for IL-9
(Forward 5'-CTCTGTTTGGGCATTCCCTCT-3', reverse 5'-
GGGTATCTTGTTTGCATGGTGG-3’) by qPCR with Power SYBR Green
(Applied Biosystems, 4367659). Results were normalized by adjusting against

86
GAPDH with the ΔCt method to calculate relative expression. For in vitro
silencing of STAT3/5 and IRF4, gene expression was quantified by purifying
total RNA with RNeasy Mini Kit (Qiagen, 74104). 1µg of RNA was used to
generate cDNA by RT-PCR (Applied Biosystems, 4368814) and TaqMan
based qPCR was performed to test for IL-9 (Applied Biosystems, HS00914237-
m1). IL-32 was used as control cytokine (Applied Biosystems,HS00992441-
m1). Gene expression was normalized on the basis of GAPDH quantification
(Applied Biosystems, HS02758991-g1). Relative units are reported.
Proliferation assay
Proliferation was determined by determined by measuring thymidine
incorporation. 104 cells were seeded in supplemented RPMI medium and
incubated for 48h. Thymidine was added 16h before harvesting and transferred
the cells into 96-wells filtered plates (PerkinElmer, 6005174). As cells
synthetize DNA, daughter cells are labelled with thymidine and non-
incorporated thymidine flows through the membrane. The amount of ionizing
radiation was measured with a scintillation counter (PerkinElmer, Wallac Oy
1450 Microbeta)
Supernatant supplementation
Cells were seeded with different ratios of supernatant from 96h-cultured
MyLa2000 or Hut78. The ratios were 1:10, 3:10 5:10 supernatant:fresh medium
without FBS and cells were incubated for 48h to measure proliferation.
In vitro IL-9 stimulation and inhibition
HaCat, Hut78 and SeAx cells were seeded in RPMI medium without FBS
supplemented with increasing concentrations of recombinant human IL-9. For
blocking experiments, the medium was supplemented with 100ng/ml of IL-9
and added anti IL-9 blocking antibody (R&D Systems, AB-209-NA) was added
in increasing concentrations. After 48h of cell culture, proliferation was
determined.

87
In vitro PUVA
MyLa2000 cells were treated with 1 mmol/l of 8-Methoxypsoralen (8-MOP) 2
hours before UVA irradiation. A sub-lethal dose of UVA light (0.4 or 0.8 J/cm2)
was given to the cells and which were then incubated in DMEM supplemented
with 1,500 U/mL of IFNa2b (Merck-Millipore, GF417) and 20 mg/mL of goat
polyclonal anti-human IL-9 antibody. For siRNA experiments, MyLa2000 cells
were transfected with STAT5ab-siRNA or siCTRL and incubated for 24 hours
before PUVA treatment. Forty-eight hours after UVA irradiation, the cells were
stained with the apoptosis kit AnnexinV-FITC and PI (Beckman Coulter, PN-
IM2375) and analysed by flow cytometry (Beckman Coulter, Cell-Lab-Quanta-
SC-MPL).
In vitro JAK/STAT and IRF4 inhibition
MyLa2000 cells were treated with 180 nmol/L of the JAK1/2 inhibitor ruxolitinib
(Selleck Chemicals, INCB018424), and cultured for up to 48h to test for IL-9
expression by qPCR with the TaqMan method described above.
MyLa2000 cells were transfected using the SMART pool ON-TARGETplus
specific siRNA to STAT3, STAT5ab, or negative control siRNA (siCTRL;
Thermo Scientific, L-003544-00-0005, L-005169-00- 000, and L-010539-00-
0005; each at 0.041 nmol/106 cells), siRNA targeting IRF4 (Ambion, AM16708-
145051), or siCTRL (Ambion, AM4611; 0.05 nmol/106 cells) with an Amaxa
Nucleofector (Lonza). Silencing was confirmed by western blotting. Cells were
lysed in a RIPA buffer (EDTA 1%). Protein quantification was done with a Pierce
BCA Protein Assay kit (Thermo Scientific). A 4%–12% PAGE gel (Bio-Rad,
345-0125) was used to separate protein content and plotted on a 0.45-µm
nitrocellulose membrane (Bio-Rad, 9004-70-0, 170-4071). Antibodies against
IRF4 (Abcam, ab133590), STAT5, phospho-STAT5 (Y694), (Cell Signalling
Technology; 9363 and 9356) or b-actin (Sigma, A5441) were used for labelling.
EL-4 lymphoma animal model
This model was based on previous publications (Wu et al., 2014) (Rabenhorst
et al., 2012). C57BL/6 mice were purchased from Charles River (Boston, USA)
and used to implant lymphoma cells. 6-8 weeks old female mice were used for

88
experiments. Animals were shaved on their backs and EL-4 cells were
administered in a 100μl PBS solution (1x10⁵ cell/ml) by intradermal injection.
Mice were killed by cervical dislocation at the indicated time points or when
tumour diameter exceeded 1cm. Tumours and draining lymph nodes were
excised to carry out histological analyses and flow cytometry. All experimental
animal procedures were done with the approval of the Federal Ministry of
Science, Research and Economy of Austria (protocol number: BMWF-
66.010/0022-II/3b/2013).
PUVA In vivo
Mice were treated with PUVA every 72h. After 24h of cell injection, the back of
mice was treated with 60µl of 8-Methoxypsoralen 1% in oily vehicle. After 15
minutes to let the compound penetrate the skin, mice were irradiated with 1500
mJ/cm2 of UVA, a dose below the minimal phototoxic dose (MPD). The MPD
was determined in previous experiments by giving increasing doses of UVA
and measuring skin swelling after 24 and 48h, being 2000 mJ/cm2 the MPD
established in two separate experiments.
Depletion of IL-9 in vivo
20µg of anti-IL-9 antibody (R&D Systems, ab-409-na) was administered 6
hours after tumour cell injection and subsequent doses were given every 48h
for up to 2 weeks. A goat antibody was used as isotype control (R&D Systems,
ab-108-c). Tumour growth was monitored daily by measuring lesion diameter
in two opposite axes with a vernier calliper (Mitutoyo).
mSWAT and CAILS clinical assessment
The extent of skin involvement was assessed by the modified Severity
Weighted Assessment Tool (mSWAT). This score is based on a system of 12
areas of the body and rates the involved body surface area adjusted by a weight
factor (patch=1, plaque=2 and tumour=4). It is expressed as the sum of the total
as shown in M&M table 1. Additionally, the Composite Assessment of Index
Lesion Severity score (CAILS), takes into account erythema scaling, plaque

89
elevation, pigmentation and lesion size in a scale of 0-8 as shown in M&M table
2 was used to monitor marker lesions.
Materials & methods table 1: Modified Severity Weighted Assessment Tool
Taken from Olsen et al (Olsen et al., 2011)
Materials & methods table 2: Composite Assessment of Index Lesion
Severity

90
Taken from Olsen et al (Olsen et al., 2011)
High throughput TCR sequencing
Sequencing of the beta chain of the TCR was performed using 400ng of DNA
isolated from lesional skin. Amplicon libraries of 80-120 bp were generated with
a set of primers on the variable (V) and joint (J) segments flanking the CDR3
region. The sequencing was carried out on the ImmunoSEQ platform (Adaptive
Biotechnologies) with an approximate coverage of 20x. Sets of clustering
algorithms were used to correct sequencing errors and amplicon alignment.
Sequence reads were annotated in accordance to the ImmunoGeneTics
collaboration to assemble the contributing V, D and J segments to every
rearranged functional TCR (Ruiz et al., 2000).
Materials & methods table 3: Clinical examination and identification of
malignant clones

91
Patients from the clinical PUVA trial (ClinicalTrials.gov no. NCT01686594) were
treated with oral 8-MOP (10mg per 20kg of body weight) and UVA (PUVA) two
times per week. The patients were started on treatment with 50% of the minimal
phototoxic dose (MPD) and UVA dose was increased thereafter by 0-30% per
week, depending on the individual preceding erythema response.
Histological examinations
Tissue sections of 3µm thickness from mouse or human FFPE blocks were
used. For histological assessment, haematoxylin and eosin stainings were
done. Sections from mouse skin having tumours were evaluated in 5 different
fields per sample to determine the effect of PUVA. Image analyses were done
to quantify tumour infiltration and epidermal alterations.
For human samples, FFPE sections were rehydrated by immersing them in
xylene and increasing dilutions of ethanol. Antigen retrieval was performed in
TRIS-EDTA buffer at pH 9 (Dako, S2367) or citrate buffer at pH 6 according to
the particular antibody used. The following antibodies were used for chromogen
stainings: IL-9 (Abcam, ab134434), IL-9r (Abcam, ab61196), IRF4 (Abcam,
ab124691), STAT3 (Abcam, ab50761-100), CD3 (Novocastra, NCL-CD3-PS1)
and PU.1 (Abcam, ab76543). The Peroxidase/AEC, rabbit/mouse REAL
detection system (Dako, K5003) was used for detection in single stains. Briefly
described: After overnight incubation with the primary antibody, the slides were
covered with a secondary antibody for 10 minutes, followed by streptavidin-
HRP binding incubation for 10 minutes, and addition of AEC/H2O2 substrate.
Nuclei were counterstained with haematoxylin and cell quantification was
performed by imaging with the 40x objective. Positive cells were counted in
three different view fields and the mean number of cells per square millimetre
Basleine After PUVA Basleine After PUVA
P1 Ia Patch PUVA 8.6 2.1 12 3 TCRBV24
P2 Ib Patch PUVA 35.5 3.2 8 4 TCRBV20
P3 Ia Patch PUVA 15 5 11 4 TCRBV06
P4 Ia Patch PUVA 8.25 0 5 0 TCRBV10-03*01
P5 Ib Patch PUVA 13 2 13 2 TCRBV12
P6 Ib Patch PUVA 47.5 0 4 1 TCRBV02-01*01
P7 Ia Patch PUVA 10 0 5 0 TCRBV02-01*01
P8 Ia Patch PUVA 20 0 7 0 TCRBV05-06*01
Clone found
mSWAT CAILS
Patient No.
Diagnosis
(EORTC-ISCL
classification)
Type of skin
lesion
biopsied
Type of
treatment

92
was calculated. Double stainings were prepared with the MultiVision polymer
detection system (Thermo Scientific, TL-012-MARH). Two primary antibodies
were added (one raised in rabbit and the other in mouse) and incubated
overnight. Ultra V block solution was applied for 10 minutes followed by the
MultiVision polymer cocktail (anti-rabbit/HRP and anti-mouse/AP) for 30
minutes. Then, LVBlue chromogen (reacting with anti-mouse/AP
immunoglobulins) was added for 10 minutes, followed by the LVRed
chromogen (reacting with anti-rabbit/HRP immunoglobulins) for 10 minutes.
Four washes with TBS-Tween 20 (0.5%) were done in between every step. For
visualization of the malignant clone, the TCR sequencing data was used to
select the anti-TCRVb22 antibody (Beckman Coulter, IM1484) to co-stain with
IL-9 and IRF4 by the MultiVision stain system. For immunofluorescence
imaging, the Opal 6c kit (PerkinElmer, NEL796001KT) was used. After antigen
retrieval the slides were covered with a primary antibody, incubated for 1h at
4ºC. The slides were incubated with a biotinylated secondary antibody and then
with a streptavidin-HRP linked (Dako, Advance HRP K4069) for 10 minutes
each. Then, the fluorescent opal dye was added and incubated for 10 minutes.
This kit uses tyramide-HRP interactions to activate the fluorescence of the
compound and amplify the signal. In order to use a second, third, etc. antibody,
the slides were put in citrate buffer and heated at 70ºC in a steam cooker for
15 minutes. These steps destabilized the antigen-antibody interaction and
caused the separation of the reaction complex. However, the florescent dye
remained fixed to the surface of the slide. A second primary antibody was
added and the same set of steps as previously described was followed to get
fluorescent signals of each antibody at different wavelengths. The advantage
of this technique over conventional immunofluorescence is the high degree of
specific signal amplification, the possibility of usage of antibodies with different
specificity on the same panel, regardless of species origin and the narrow
spectrum of fluorescence emission by the synthetic opal compounds. The last
step was the addition of the nuclear dye DAPI in the mount medium before
imaging.

93
Materials & methods table 4: Set of samples from archived materials
Patients were treated under daily life conditions with standard 311nm
UVB phototherapy or photochemotherapy with 8- or 5-methoxypsoralen.
Additional treatment with bexarotene or steroids was given as depicted.
Single or double stains immunohistochemistry (IHC) were performed as
indicated. The preparations were evaluated as containing single positive
(SP) or double positive (DP) cells (mainly in the dermis) at baseline by a
0-4 score system of positivity with 0, <10%; 1, 10-25%; 2, 25-50%; 3, 50-
75%; and 4, 75-100%. No clinical signs of skin lesions and lack of infiltrate
in histological examination were considered as complete response (CR).
Supplementary Table 2
Patient
No. Sex
Age (y)
baseline
biopsy
Diagnosis
(EORTC-ISCL
classification)
Type of
skin lesion
biopsied
IHC
CD3/IL-9
(0-4)
IHC
STAT3
(0-4)
IHC
CD3/IRF4
(0-4)
IHC
CD3/PU1
(0-4)
Type of
treatment
Length of
treatment
(weeks) Response
A1 M 95 Ib Patch DP, 2 3 DP 1 SP 3,2 311nm UVB 12 CR
A2 M 75 Ib Patch DP, 1 3 0 SP 3,2PUVA,
Bexarotene18 CR
A3 M 60 Ib Patch DP, 2 3 DP, 2 SP 4,4 311nm UVB 2 CR
A4 M 47 Ib Patch DP, 3 2 DP, 2 SP 4,3 PUVA 48 CR
A5 M 90 III Tumor 0 2 DP, 1 SP 4,2PUVA,
steroids6 CR
A6 M 71 Ia Patch 0 1 0 0 PUVA 45 CR
A7 M 69 Ia Patch DP, 1 3 DP, 1 SP 3,2 311nm UVB 6 CR
A8 F 59 Ia Patch DP, 1 1 0 SP 1,0 PUVA 6 CR
Patients were treated under daily life conditions with standard 311nm UVB phototherapy or photochemotherapy
with 8- or 5-methoxypsoralen. Additional treatment with bexarotene or steroids was given as depicted. Single or
double stains immunohistochemistry (IHC) were perfomed as indicated. The preparations were evaluated as
containing single positive (SP) or double positive (DP) cells (mainly in the dermis) at baseline by a 0-4 score
system of positivity with 0, <10%; 1, 10-25%; 2, 25-50%; 3, 50-75%; and 4, 75-100%. No clinical signs of skin
lesions and lack of infiltrate in histological examination was considered as complete response (CR).
Supplementary table 2: Set of samples from archived materials

94
Fluorescence imaging and analyses
The Mantra Quantitative Pathology Workstation (PerkinElmer) and the inForm
software analysis tool (PerkinElmer) were used to analyse fluorescence
preparations. The microscope was calibrated for panels of 5 fluorescent dyes
as described in M&M table 5. A minimum of 3 different fields per slide (20x
objective) was captured with a ratio of 90/10% of dermis/epidermis. The
cellularity of each image was determined by the number of DAPI stained nuclei
and a trained algorithm was used with a minimum of 150 user-curated positive
cells for each phenotype based on the expression of each marker. The average
number of cells positive for the respective marker in all samples was calculated
for all samples.
Materials & methods table 5: Panels of antibodies used for multicolour
immunofluorescence
Adaptive immune cells
Antigen Manufacturer Catalog number
CD4 Novus Biologicals NBP1-19371
CD8 Novus Biologicals NBP2-29475
CD20 Santa Cruz sc-58985
CD103 Novocastra PA0374
Innate immune cells
CD68 Dako M0876
CD163 Acris BM4041
CD1a Acris DB 071-0.1
CD11c Abcam Ab52632
T-cell subset panel
CD4 Novus Biologicals NBP1-19371
CD8 Novus Biologicals NBP2-29475
CD69 Sigma HPA050525
Foxp3 Abcam Ab20034

95
Statistics
The data was analysed in two steps; first testing for normal distribution with
Shapiro test on SPSS 22 (IBM) and based on these results, the most
appropriate post-test analyses was chosen for each experiment as indicated in
the figure legend. Charts were generated with GraphPad Prism 6 (GraphPad).

96
References
ABDALLAT, S. A., ALQAQAA, A. S., OBAIDAT, N. A. & ALNUEIMI, R. F. 2014. Efficacy and Side Effects of Narrowband-UVB in Early Stage Cutaneous T-Cell Lymphoma in Jordanian Patients. ISRN Dermatol, 2014, 951821.
AGAR, N. S., WEDGEWORTH, E., CRICHTON, S., MITCHELL, T. J., COX, M., FERREIRA, S., ROBSON, A., CALONJE, E., STEFANATO, C. M., WAIN, E. M., WILKINS, B., FIELDS, P. A., DEAN, A., WEBB, K., SCARISBRICK, J., MORRIS, S. & WHITTAKER, S. J. 2010. Survival outcomes and prognostic factors in mycosis fungoides/Sezary syndrome: validation of the revised International Society for Cutaneous Lymphomas/European Organisation for Research and Treatment of Cancer staging proposal. J Clin Oncol, 28, 4730-9.
AL HOTHALI, G. I. 2013. Review of the treatment of mycosis fungoides and Sezary syndrome: A stage-based approach. Int J Health Sci (Qassim), 7, 220-39.
ANTONIU, S. A. 2010. MEDI-528, an anti-IL-9 humanized antibody for the treatment of asthma. Curr Opin Mol Ther, 12, 233-9.
ARSTILA, T. P., CASROUGE, A., BARON, V., EVEN, J., KANELLOPOULOS, J. & KOURILSKY, P. 1999. A direct estimate of the human alphabeta T cell receptor diversity. Science, 286, 958-61.
ARULOGUN, S. O., PRINCE, H. M., NG, J., LADE, S., RYAN, G. F., BLEWITT, O. & MCCORMACK, C. 2008. Long-term outcomes of patients with advanced-stage cutaneous T-cell lymphoma and large cell transformation. Blood, 112, 3082-7.
AUBRY, F., SATIE, A. P., RIOUX-LECLERCQ, N., RAJPERT-DE MEYTS, E., SPAGNOLI, G. C., CHOMEZ, P., DE BACKER, O., JEGOU, B. & SAMSON, M. 2001. MAGE-A4, a germ cell specific marker, is expressed differentially in testicular tumors. Cancer, 92, 2778-85.
BACHSAIS, M., NADDAF, N., YACOUB, D., SALTI, S., ALAAEDDINE, N., AOUDJIT, F., HASSAN, G. S. & MOURAD, W. 2016. The Interaction of CD154 with the alpha5beta1 Integrin Inhibits Fas-Induced T Cell Death. PLoS One, 11, e0158987.
BATISTA, D. A., VONDERHEID, E. C., HAWKINS, A., MORSBERGER, L., LONG, P., MURPHY, K. M. & GRIFFIN, C. A. 2006. Multicolor fluorescence in situ hybridization (SKY) in mycosis fungoides and Sezary syndrome: search for recurrent chromosome abnormalities. Genes Chromosomes Cancer, 45, 383-91.
BERGER, C. L., HANLON, D., KANADA, D., DHODAPKAR, M., LOMBILLO, V., WANG, N., CHRISTENSEN, I., HOWE, G., CROUCH, J., EL-FISHAWY, P. & EDELSON, R. 2002. The growth of cutaneous T-cell lymphoma is stimulated by immature dendritic cells. Blood, 99, 2929-39.
BERGER, C. L., TIGELAAR, R., COHEN, J., MARIWALLA, K., TRINH, J., WANG, N. & EDELSON, R. L. 2005. Cutaneous T-cell lymphoma: malignant proliferation of T-regulatory cells. Blood, 105, 1640-7.
BLUME-PEYTAVI, U. & VOGT, A. 2015. Translational Positioning of Janus Kinase (JAK) Inhibitors in Alopecia Areata. EBioMedicine, 2, 282-3.
BODDICKER, R. L., KIP, N. S., XING, X., ZENG, Y., YANG, Z. Z., LEE, J. H., ALMADA, L. L., ELSAWA, S. F., KNUDSON, R. A., LAW, M. E.,

97
KETTERLING, R. P., CUNNINGHAM, J. M., WU, Y., MAURER, M. J., O'BYRNE, M. M., CERHAN, J. R., SLAGER, S. L., LINK, B. K., PORCHER, J. C., GROTE, D. M., JELINEK, D. F., DOGAN, A., ANSELL, S. M., FERNANDEZ-ZAPICO, M. E. & FELDMAN, A. L. 2015. The oncogenic transcription factor IRF4 is regulated by a novel CD30/NF-kappaB positive feedback loop in peripheral T-cell lymphoma. Blood, 125, 3118-27.
BRADFORD, P. T., DEVESA, S. S., ANDERSON, W. F. & TORO, J. R. 2009. Cutaneous lymphoma incidence patterns in the United States: a population-based study of 3884 cases. Blood, 113, 5064-73.
CABAL-HIERRO, L. & LAZO, P. S. 2012. Signal transduction by tumor necrosis factor receptors. Cell Signal, 24, 1297-305.
CAMPBELL, J. J., CLARK, R. A., WATANABE, R. & KUPPER, T. S. 2010. Sezary syndrome and mycosis fungoides arise from distinct T-cell subsets: a biologic rationale for their distinct clinical behaviors. Blood, 116, 767-71.
CAMPO, E., SWERDLOW, S. H., HARRIS, N. L., PILERI, S., STEIN, H. & JAFFE, E. S. 2011. The 2008 WHO classification of lymphoid neoplasms and beyond: evolving concepts and practical applications. Blood, 117, 5019-32.
CAPRINI, E., CRISTOFOLETTI, C., ARCELLI, D., FADDA, P., CITTERICH, M. H., SAMPOGNA, F., MAGRELLI, A., CENSI, F., TORRERI, P., FRONTANI, M., SCALA, E., PICCHIO, M. C., TEMPERANI, P., MONOPOLI, A., LOMBARDO, G. A., TARUSCIO, D., NARDUCCI, M. G. & RUSSO, G. 2009. Identification of key regions and genes important in the pathogenesis of sezary syndrome by combining genomic and expression microarrays. Cancer Res, 69, 8438-46.
CEDENO-LAURENT, F., SINGER, E. M., WYSOCKA, M., BENOIT, B. M., VITTORIO, C. C., KIM, E. J., YOSIPOVITCH, G. & ROOK, A. H. 2015. Improved pruritus correlates with lower levels of IL-31 in CTCL patients under different therapeutic modalities. Clin Immunol, 158, 1-7.
CELERIER, P., BUREAU, B., LITOUX, P. & DRENO, B. 1997. Keratinocyte-lymphocyte interaction in cutaneous T-cell lymphoma. Modulation of keratinocyte antigen My7 by a soluble factor produced by T lymphocytes. Arch Dermatol, 133, 837-40.
CHEN, N. & WANG, X. 2014. Role of IL-9 and STATs in hematological malignancies (Review). Oncol Lett, 7, 602-610.
CLARK, R. A., CHONG, B., MIRCHANDANI, N., BRINSTER, N. K., YAMANAKA, K., DOWGIERT, R. K. & KUPPER, T. S. 2006. The vast majority of CLA+ T cells are resident in normal skin. J Immunol, 176, 4431-9.
CLARK, R. A., SHACKELTON, J. B., WATANABE, R., CALARESE, A., YAMANAKA, K., CAMPBELL, J. J., TEAGUE, J. E., KUO, H. P., HIJNEN, D. & KUPPER, T. S. 2011. High-scatter T cells: a reliable biomarker for malignant T cells in cutaneous T-cell lymphoma. Blood, 117, 1966-76.
CLARK, R. A., WATANABE, R., TEAGUE, J. E., SCHLAPBACH, C., TAWA, M. C., ADAMS, N., DOROSARIO, A. A., CHANEY, K. S., CUTLER, C. S., LEBOEUF, N. R., CARTER, J. B., FISHER, D. C. & KUPPER, T. S. 2012. Skin effector memory T cells do not recirculate and provide

98
immune protection in alemtuzumab-treated CTCL patients. Sci Transl Med, 4, 117ra7.
CRISCIONE, V. D. & WEINSTOCK, M. A. 2007. Incidence of cutaneous T-cell lymphoma in the United States, 1973-2002. Arch Dermatol, 143, 854-9.
DA SILVA ALMEIDA, A. C., ABATE, F., KHIABANIAN, H., MARTINEZ-ESCALA, E., GUITART, J., TENSEN, C. P., VERMEER, M. H., RABADAN, R., FERRANDO, A. & PALOMERO, T. 2015. The mutational landscape of cutaneous T cell lymphoma and Sezary syndrome. Nat Genet, 47, 1465-70.
DALIANI, D., ULMER, R. A., JACKOW, C., PUGH, W., GANSBACHER, B., CABANILLAS, F., DUVIC, M. & SARRIS, A. H. 1998. Tumor necrosis factor-alpha and interferon-gamma, but not HTLV-I tax, are likely factors in the epidermotropism of cutaneous T-cell lymphoma via induction of interferon-inducible protein-10. Leuk Lymphoma, 29, 315-28.
DALLOUL, A., LAROCHE, L., BAGOT, M., MOSSALAYI, M. D., FOURCADE, C., THACKER, D. J., HOGGE, D. E., MERLE-BERAL, H., DEBRE, P. & SCHMITT, C. 1992. Interleukin-7 is a growth factor for Sezary lymphoma cells. J Clin Invest, 90, 1054-60.
DAVE, S. S., WRIGHT, G., TAN, B., ROSENWALD, A., GASCOYNE, R. D., CHAN, W. C., FISHER, R. I., BRAZIEL, R. M., RIMSZA, L. M., GROGAN, T. M., MILLER, T. P., LEBLANC, M., GREINER, T. C., WEISENBURGER, D. D., LYNCH, J. C., VOSE, J., ARMITAGE, J. O., SMELAND, E. B., KVALOY, S., HOLTE, H., DELABIE, J., CONNORS, J. M., LANSDORP, P. M., OUYANG, Q., LISTER, T. A., DAVIES, A. J., NORTON, A. J., MULLER-HERMELINK, H. K., OTT, G., CAMPO, E., MONTSERRAT, E., WILSON, W. H., JAFFE, E. S., SIMON, R., YANG, L., POWELL, J., ZHAO, H., GOLDSCHMIDT, N., CHIORAZZI, M. & STAUDT, L. M. 2004. Prediction of survival in follicular lymphoma based on molecular features of tumor-infiltrating immune cells. N Engl J Med, 351, 2159-69.
DEREURE, O., LEVI, E., VONDERHEID, E. C. & KADIN, M. E. 2002. Infrequent Fas mutations but no Bax or p53 mutations in early mycosis fungoides: a possible mechanism for the accumulation of malignant T lymphocytes in the skin. J Invest Dermatol, 118, 949-56.
DIAMANDIDOU, E., COLOME, M., FAYAD, L., DUVIC, M. & KURZROCK, R. 1999. Prognostic factor analysis in mycosis fungoides/Sezary syndrome. J Am Acad Dermatol, 40, 914-24.
DOBBELING, U., DUMMER, R., LAINE, E., POTOCZNA, N., QIN, J. Z. & BURG, G. 1998. Interleukin-15 is an autocrine/paracrine viability factor for cutaneous T-cell lymphoma cells. Blood, 92, 252-8.
DULMAGE, B. O. & GESKIN, L. J. 2013. Lessons learned from gene expression profiling of cutaneous T-cell lymphoma. Br J Dermatol, 169, 1188-97.
DUVIC, M., PINTER-BROWN, L. C., FOSS, F. M., SOKOL, L., JORGENSEN, J. L., CHALLAGUNDLA, P., DWYER, K. M., ZHANG, X., KURMAN, M. R., BALLERINI, R., LIU, L. & KIM, Y. H. 2015a. Phase 1/2 study of mogamulizumab, a defucosylated anti-CCR4 antibody, in previously treated patients with cutaneous T-cell lymphoma. Blood, 125, 1883-9.
DUVIC, M., TETZLAFF, M. T., GANGAR, P., CLOS, A. L., SUI, D. & TALPUR, R. 2015b. Results of a Phase II Trial of Brentuximab Vedotin for CD30+

99
Cutaneous T-Cell Lymphoma and Lymphomatoid Papulosis. J Clin Oncol, 33, 3759-65.
EDER, J., KERN, A., MOSER, J., KITZWOGERER, M., SEDIVY, R. & TRAUTINGER, F. 2015. Frequency of primary cutaneous lymphoma variants in Austria: retrospective data from a dermatology referral centre between 2006 and 2013. J Eur Acad Dermatol Venereol, 29, 1517-23.
EHRENTRAUT, S., SCHNEIDER, B., NAGEL, S., POMMERENKE, C., QUENTMEIER, H., GEFFERS, R., FEIST, M., KAUFMANN, M., MEYER, C., KADIN, M. E., DREXLER, H. G. & MACLEOD, R. A. 2016. Th17 cytokine differentiation and loss of plasticity after SOCS1 inactivation in a cutaneous T-cell lymphoma. Oncotarget, 7, 34201-16.
FIVENSON, D. P., HANSON, C. A. & NICKOLOFF, B. J. 1994. Localization of clonal T cells to the epidermis in cutaneous T-cell lymphoma. J Am Acad Dermatol, 31, 717-23.
FREDHOLM, S., LITVINOV, I. V., MONGAN, N. P., SCHIELE, S., WILLERSLEV-OLSEN, A., PETERSEN, D. L., KREJSGAARD, T., SIBBESEN, N., NASTASI, C., BONEFELD, C. M., PERSSON, J. L., STRATEN, P. T., ANDERSEN, M. H., KORALOV, S. B., WASIK, M. M., GEISLER, C., SASSEVILLE, D., WOETMANN, A. & ODUM, N. 2016. The Expression of IL-21 Is Promoted by MEKK4 in Malignant T Cells and Associated with Increased Progression Risk in Cutaneous T-Cell Lymphoma. J Invest Dermatol, 136, 866-9.
FRENCH, L. E., HUARD, B., WYSOCKA, M., SHANE, R., CONTASSOT, E., ARRIGHI, J. F., PIGUET, V., CALDERARA, S. & ROOK, A. H. 2005. Impaired CD40L signaling is a cause of defective IL-12 and TNF-alpha production in Sezary syndrome: circumvention by hexameric soluble CD40L. Blood, 105, 219-25.
FROST, E. L., KERSH, A. E., EVAVOLD, B. D. & LUKACHER, A. E. 2015. Cutting Edge: Resident Memory CD8 T Cells Express High-Affinity TCRs. J Immunol, 195, 3520-4.
GESKIN, L. 2007. ECP versus PUVA for the treatment of cutaneous T-cell lymphoma. Skin Therapy Lett, 12, 1-4.
GESKIN, L. J., VIRAGOVA, S., STOLZ, D. B. & FUSCHIOTTI, P. 2015. Interleukin-13 is overexpressed in cutaneous T-cell lymphoma cells and regulates their proliferation. Blood, 125, 2798-805.
GIRARDI, M., HEALD, P. W. & WILSON, L. D. 2004. The pathogenesis of mycosis fungoides. N Engl J Med, 350, 1978-88.
GUENOVA, E., WATANABE, R., TEAGUE, J. E., DESIMONE, J. A., JIANG, Y., DOWLATSHAHI, M., SCHLAPBACH, C., SCHAEKEL, K., ROOK, A. H., TAWA, M., FISHER, D. C., KUPPER, T. S. & CLARK, R. A. 2013. TH2 cytokines from malignant cells suppress TH1 responses and enforce a global TH2 bias in leukemic cutaneous T-cell lymphoma. Clin Cancer Res, 19, 3755-63.
GUNTHER, C., ZIMMERMANN, N., BERNDT, N., GROSSER, M., STEIN, A., KOCH, A. & MEURER, M. 2011. Up-regulation of the chemokine CCL18 by macrophages is a potential immunomodulatory pathway in cutaneous T-cell lymphoma. Am J Pathol, 179, 1434-42.
HANAHAN, D. & WEINBERG, R. A. 2011. Hallmarks of cancer: the next generation. Cell, 144, 646-74.

100
HANEL, K. H., CORNELISSEN, C., LUSCHER, B. & BARON, J. M. 2013. Cytokines and the skin barrier. Int J Mol Sci, 14, 6720-45.
HERRMANN, J. J., ROENIGK, H. H., JR. & HONIGSMANN, H. 1995a. Ultraviolet radiation for treatment of cutaneous T-cell lymphoma. Hematol Oncol Clin North Am, 9, 1077-88.
HERRMANN, J. J., ROENIGK, H. H., JR., HURRIA, A., KUZEL, T. M., SAMUELSON, E., RADEMAKER, A. W. & ROSEN, S. T. 1995b. Treatment of mycosis fungoides with photochemotherapy (PUVA): long-term follow-up. J Am Acad Dermatol, 33, 234-42.
HOPPE, R. T., MEDEIROS, L. J., WARNKE, R. A. & WOOD, G. S. 1995. CD8-positive tumor-infiltrating lymphocytes influence the long-term survival of patients with mycosis fungoides. J Am Acad Dermatol, 32, 448-53.
HRISTOV, A. C., VONDERHEID, E. C. & BOROWITZ, M. J. 2011. Simplified flow cytometric assessment in mycosis fungoides and Sezary syndrome. Am J Clin Pathol, 136, 944-53.
HSI, A. C., LEE, S. J., ROSMAN, I. S., CARSON, K. R., KELLEY, A., VIELE, V., PANG, X., MUSIEK, A. & SCHAFFER, A. 2015. Expression of helper T cell master regulators in inflammatory dermatoses and primary cutaneous T-cell lymphomas: diagnostic implications. J Am Acad Dermatol, 72, 159-67.
HSU, L. & ARMSTRONG, A. W. 2014. JAK inhibitors: treatment efficacy and safety profile in patients with psoriasis. J Immunol Res, 2014, 283617.
JACKOW, C. M., CATHER, J. C., HEARNE, V., ASANO, A. T., MUSSER, J. M. & DUVIC, M. 1997. Association of erythrodermic cutaneous T-cell lymphoma, superantigen-positive Staphylococcus aureus, and oligoclonal T-cell receptor V beta gene expansion. Blood, 89, 32-40.
JACOBY, E., CHIEN, C. D. & FRY, T. J. 2014. Murine models of acute leukemia: important tools in current pediatric leukemia research. Front Oncol, 4, 95.
JAHAN-TIGH, R. R., HUEN, A. O., LEE, G. L., POZADZIDES, J. V., LIU, P. & DUVIC, M. 2013. Hydrochlorothiazide and cutaneous T cell lymphoma: prospective analysis and case series. Cancer, 119, 825-31.
JOHNSTONE, R. W. 2002. Histone-deacetylase inhibitors: novel drugs for the treatment of cancer. Nat Rev Drug Discov, 1, 287-99.
JONES, D., DANG, N. H., DUVIC, M., WASHINGTON, L. T. & HUH, Y. O. 2001. Absence of CD26 expression is a useful marker for diagnosis of T-cell lymphoma in peripheral blood. Am J Clin Pathol, 115, 885-92.
KARENKO, L., SARNA, S., KAHKONEN, M. & RANKI, A. 2003. Chromosomal abnormalities in relation to clinical disease in patients with cutaneous T-cell lymphoma: a 5-year follow-up study. Br J Dermatol, 148, 55-64.
KASPRZYCKA, M., ZHANG, Q., WITKIEWICZ, A., MARZEC, M., POTOCZEK, M., LIU, X., WANG, H. Y., MILONE, M., BASU, S., MAUGER, J., CHOI, J. K., ABRAMS, J. T., HOU, J. S., ROOK, A. H., VONDERHEID, E., WOETMANN, A., ODUM, N. & WASIK, M. A. 2008. Gamma c-signaling cytokines induce a regulatory T cell phenotype in malignant CD4+ T lymphocytes. J Immunol, 181, 2506-12.
KAVANAUGH, S. M., WHITE, L. A. & KOLESAR, J. M. 2010. Vorinostat: A novel therapy for the treatment of cutaneous T-cell lymphoma. Am J Health Syst Pharm, 67, 793-7.

101
KIEL, M. J., SAHASRABUDDHE, A. A., ROLLAND, D. C., VELUSAMY, T., CHUNG, F., SCHALLER, M., BAILEY, N. G., BETZ, B. L., MIRANDA, R. N., PORCU, P., BYRD, J. C., JEFFREY MEDEIROS, L., KUNKEL, S. L., BAHLER, D. W., LIM, M. S. & ELENITOBA-JOHNSON, K. S. 2015. Genomic analyses reveal recurrent mutations in epigenetic modifiers and the JAK-STAT pathway in Sezary syndrome. Nat Commun, 6, 8470.
KIM, Y. H., TAVALLAEE, M., SUNDRAM, U., SALVA, K. A., WOOD, G. S., LI, S., ROZATI, S., NAGPAL, S., KRATHEN, M., REDDY, S., HOPPE, R. T., NGUYEN-LIN, A., WENG, W. K., ARMSTRONG, R., PULITZER, M., ADVANI, R. H. & HORWITZ, S. M. 2015. Phase II Investigator-Initiated Study of Brentuximab Vedotin in Mycosis Fungoides and Sezary Syndrome With Variable CD30 Expression Level: A Multi-Institution Collaborative Project. J Clin Oncol, 33, 3750-8.
KIRSCH, I. R., WATANABE, R., O'MALLEY, J. T., WILLIAMSON, D. W., SCOTT, L. L., ELCO, C. P., TEAGUE, J. E., GEHAD, A., LOWRY, E. L., LEBOEUF, N. R., KRUEGER, J. G., ROBINS, H. S., KUPPER, T. S. & CLARK, R. A. 2015. TCR sequencing facilitates diagnosis and identifies mature T cells as the cell of origin in CTCL. Sci Transl Med, 7, 308ra158.
KOBAYASHI, H., KUMAI, T., HAYASHI, S., MATSUDA, Y., AOKI, N., SATO, K., KIMURA, S. & CELIS, E. 2012. A naturally processed HLA-DR-bound peptide from the IL-9 receptor alpha of HTLV-1-transformed T cells serves as a T helper epitope. Cancer Immunol Immunother, 61, 2215-25.
KOPP, K. L., RALFKIAER, U., GJERDRUM, L. M., HELVAD, R., PEDERSEN, I. H., LITMAN, T., JONSON, L., HAGEDORN, P. H., KREJSGAARD, T., GNIADECKI, R., BONEFELD, C. M., SKOV, L., GEISLER, C., WASIK, M. A., RALFKIAER, E., ODUM, N. & WOETMANN, A. 2013. STAT5-mediated expression of oncogenic miR-155 in cutaneous T-cell lymphoma. Cell Cycle, 12, 1939-47.
KREJSGAARD, T., GJERDRUM, L. M., RALFKIAER, E., LAUENBORG, B., ERIKSEN, K. W., MATHIESEN, A. M., BOVIN, L. F., GNIADECKI, R., GEISLER, C., RYDER, L. P., ZHANG, Q., WASIK, M. A., ODUM, N. & WOETMANN, A. 2008. Malignant Tregs express low molecular splice forms of FOXP3 in Sezary syndrome. Leukemia, 22, 2230-9.
KREJSGAARD, T., LITVINOV, I. V., WANG, Y., XIA, L., WILLERSLEV-OLSEN, A., KORALOV, S. B., KOPP, K. L., BONEFELD, C. M., WASIK, M. A., GEISLER, C., WOETMANN, A., ZHOU, Y., SASSEVILLE, D. & ODUM, N. 2013. Elucidating the role of interleukin-17F in cutaneous T-cell lymphoma. Blood, 122, 943-50.
KREJSGAARD, T., RALFKIAER, U., CLASEN-LINDE, E., ERIKSEN, K. W., KOPP, K. L., BONEFELD, C. M., GEISLER, C., DABELSTEEN, S., WASIK, M. A., RALFKIAER, E., WOETMANN, A. & ODUM, N. 2011. Malignant cutaneous T-cell lymphoma cells express IL-17 utilizing the Jak3/Stat3 signaling pathway. J Invest Dermatol, 131, 1331-8.
KUNDU-RAYCHAUDHURI, S., ABRIA, C. & RAYCHAUDHURI, S. P. 2016. IL-9, a local growth factor for synovial T cells in inflammatory arthritis. Cytokine, 79, 45-51.
LAHARANNE, E., CHEVRET, E., IDRISSI, Y., GENTIL, C., LONGY, M., FERRER, J., DUBUS, P., JOUARY, T., VERGIER, B., BEYLOT-BARRY, M. & MERLIO, J. P. 2010a. CDKN2A-CDKN2B deletion defines

102
an aggressive subset of cutaneous T-cell lymphoma. Mod Pathol, 23, 547-58.
LAHARANNE, E., OUMOUHOU, N., BONNET, F., CARLOTTI, M., GENTIL, C., CHEVRET, E., JOUARY, T., LONGY, M., VERGIER, B., BEYLOT-BARRY, M. & MERLIO, J. P. 2010b. Genome-wide analysis of cutaneous T-cell lymphomas identifies three clinically relevant classes. J Invest Dermatol, 130, 1707-18.
LANSIGAN, F. & FOSS, F. M. 2010. Current and emerging treatment strategies for cutaneous T-cell lymphoma. Drugs, 70, 273-86.
LI, J. Y., HORWITZ, S., MOSKOWITZ, A., MYSKOWSKI, P. L., PULITZER, M. & QUERFELD, C. 2012. Management of cutaneous T cell lymphoma: new and emerging targets and treatment options. Cancer Manag Res, 4, 75-89.
LINDAHL, L. M., FREDHOLM, S., JOSEPH, C., NIELSEN, B. S., JONSON, L., WILLERSLEV-OLSEN, A., GLUUD, M., BLUMEL, E., PETERSEN, D. L., SIBBESEN, N., HU, T., NASTASI, C., KREJSGAARD, T., JAEHGER, D., PERSSON, J. L., MONGAN, N., WASIK, M. A., LITVINOV, I. V., SASSEVILLE, D., KORALOV, S. B., BONEFELD, C. M., GEISLER, C., WOETMANN, A., RALFKIAER, E., IVERSEN, L. & ODUM, N. 2016. STAT5 induces miR-21 expression in cutaneous T cell lymphoma. Oncotarget.
LITVINOV, I. V., CORDEIRO, B., FREDHOLM, S., ODUM, N., ZARGHAM, H., HUANG, Y., ZHOU, Y., PEHR, K., KUPPER, T. S., WOETMANN, A. & SASSEVILLE, D. 2014. Analysis of STAT4 expression in cutaneous T-cell lymphoma (CTCL) patients and patient-derived cell lines. Cell Cycle, 13, 2975-82.
LITVINOV, I. V., JONES, D. A., SASSEVILLE, D. & KUPPER, T. S. 2010. Transcriptional profiles predict disease outcome in patients with cutaneous T-cell lymphoma. Clin Cancer Res, 16, 2106-14.
LUNDIN, J., HAGBERG, H., REPP, R., CAVALLIN-STAHL, E., FREDEN, S., JULIUSSON, G., ROSENBLAD, E., TJONNFJORD, G., WIKLUND, T. & OSTERBORG, A. 2003. Phase 2 study of alemtuzumab (anti-CD52 monoclonal antibody) in patients with advanced mycosis fungoides/Sezary syndrome. Blood, 101, 4267-72.
LV, X., FENG, L., FANG, X., JIANG, Y. & WANG, X. 2013. Overexpression of IL-9 receptor in diffuse large B-cell lymphoma. Int J Clin Exp Pathol, 6, 911-6.
MACKAY, L. K., RAHIMPOUR, A., MA, J. Z., COLLINS, N., STOCK, A. T., HAFON, M. L., VEGA-RAMOS, J., LAUZURICA, P., MUELLER, S. N., STEFANOVIC, T., TSCHARKE, D. C., HEATH, W. R., INOUYE, M., CARBONE, F. R. & GEBHARDT, T. 2013. The developmental pathway for CD103(+)CD8+ tissue-resident memory T cells of skin. Nat Immunol, 14, 1294-301.
MAIER, E., WERNER, D., DUSCHL, A., BOHLE, B. & HOREJS-HOECK, J. 2014. Human Th2 but not Th9 cells release IL-31 in a STAT6/NF-kappaB-dependent way. J Immunol, 193, 645-54.
MAO, X., LILLINGTON, D., CHILD, F., RUSSELL-JONES, R., YOUNG, B. & WHITTAKER, S. 2002. Comparative genomic hybridization analysis of primary cutaneous B-cell lymphomas: identification of common genomic

103
alterations in disease pathogenesis. Genes Chromosomes Cancer, 35, 144-55.
MAO, X., ORCHARD, G., VONDERHEID, E. C., NOWELL, P. C., BAGOT, M., BENSUSSAN, A., RUSSELL-JONES, R., YOUNG, B. D. & WHITTAKER, S. J. 2006. Heterogeneous abnormalities of CCND1 and RB1 in primary cutaneous T-Cell lymphomas suggesting impaired cell cycle control in disease pathogenesis. J Invest Dermatol, 126, 1388-95.
MARCUS MUCHE, J., KARENKO, L., GELLRICH, S., KARHU, R., KYTOLA, S., KAHKONEN, M., LUKOWSKY, A., STERRY, W. & RANKI, A. 2004. Cellular coincidence of clonal T cell receptor rearrangements and complex clonal chromosomal aberrations-a hallmark of malignancy in cutaneous T cell lymphoma. J Invest Dermatol, 122, 574-8.
MARGOLSKEE, E., JOBANPUTRA, V., JAIN, P., CHEN, J., GANAPATHI, K., NAHUM, O., LEVY, B., MORSCIO, J., MURTY, V., TOUSSEYN, T., ALOBEID, B., MANSUKHANI, M. & BHAGAT, G. 2016. Genetic landscape of T- and NK-cell post-transplant lymphoproliferative disorders. Oncotarget.
MARZEC, M., HALASA, K., KASPRZYCKA, M., WYSOCKA, M., LIU, X., TOBIAS, J. W., BALDWIN, D., ZHANG, Q., ODUM, N., ROOK, A. H. & WASIK, M. A. 2008. Differential effects of interleukin-2 and interleukin-15 versus interleukin-21 on CD4+ cutaneous T-cell lymphoma cells. Cancer Res, 68, 1083-91.
MASCARENHAS, J. & HOFFMAN, R. 2013. A comprehensive review and analysis of the effect of ruxolitinib therapy on the survival of patients with myelofibrosis. Blood, 121, 4832-7.
MCCUSKER, M. E., GARIFALLOU, M. & BOGEN, S. A. 1997. Sezary lineage cells can be induced to proliferate via CD28-mediated costimulation. J Immunol, 158, 4984-91.
MCKENNA, K. E., WHITTAKER, S., RHODES, L. E., TAYLOR, P., LLOYD, J., IBBOTSON, S., RUSSELL-JONES, R., BRITISH PHOTODERMATOLOGY, G. & GROUP, U. K. S. L. 2006. Evidence-based practice of photopheresis 1987-2001: a report of a workshop of the British Photodermatology Group and the U.K. Skin Lymphoma Group. Br J Dermatol, 154, 7-20.
MEISSNER, K., MICHAELIS, K., REHPENNING, W. & LONING, T. 1990. Epidermal Langerhans' cell densities influence survival in mycosis fungoides and Sezary syndrome. Cancer, 65, 2069-73.
MIRVISH, J. J., POMERANTZ, R. G., FALO, L. D., JR. & GESKIN, L. J. 2013. Role of infectious agents in cutaneous T-cell lymphoma: facts and controversies. Clin Dermatol, 31, 423-31.
NAGAI, A., TERASHIMA, M., HARADA, T., SHIMODE, K., TAKEUCHI, H., MURAKAWA, Y., NAGASAKI, M., NAKANO, A. & KOBAYASHI, S. 2003. Cathepsin B and H activities and cystatin C concentrations in cerebrospinal fluid from patients with leptomeningeal metastasis. Clin Chim Acta, 329, 53-60.
NATTKEMPER, L. A., MARTINEZ-ESCALA, M. E., GELMAN, A. B., SINGER, E. M., ROOK, A. H., GUITART, J. & YOSIPOVITCH, G. 2016. Cutaneous T-Cell Lymphoma and Pruritus: the Expression of IL-31 and its Receptors in the Skin. Acta Derm Venereol.

104
NAVI, D., RIAZ, N., LEVIN, Y. S., SULLIVAN, N. C., KIM, Y. H. & HOPPE, R. T. 2011. The Stanford University experience with conventional-dose, total skin electron-beam therapy in the treatment of generalized patch or plaque (T2) and tumor (T3) mycosis fungoides. Arch Dermatol, 147, 561-7.
NI, X. & DUVIC, M. 2011. Dendritic cells and cutaneous T-cell lymphomas. G Ital Dermatol Venereol, 146, 103-13.
NIELSEN, M., KALTOFT, K., NORDAHL, M., ROPKE, C., GEISLER, C., MUSTELIN, T., DOBSON, P., SVEJGAARD, A. & ODUM, N. 1997. Constitutive activation of a slowly migrating isoform of Stat3 in mycosis fungoides: tyrphostin AG490 inhibits Stat3 activation and growth of mycosis fungoides tumor cell lines. Proc Natl Acad Sci U S A, 94, 6764-9.
NIELSEN, M., NISSEN, M. H., GERWIEN, J., ZOCCA, M. B., RASMUSSEN, H. M., NAKAJIMA, K., ROPKE, C., GEISLER, C., KALTOFT, K. & ODUM, N. 2002. Spontaneous interleukin-5 production in cutaneous T-cell lymphoma lines is mediated by constitutively activated Stat3. Blood, 99, 973-7.
NIKOLAOU, V., SIAKANTARIS, M. P., VASSILAKOPOULOS, T. P., PAPADAVID, E., STRATIGOS, A., ECONOMIDI, A., MARINOS, L., PAPADAKI, T. & ANTONIOU, C. 2011. PUVA plus interferon alpha2b in the treatment of advanced or refractory to PUVA early stage mycosis fungoides: a case series. J Eur Acad Dermatol Venereol, 25, 354-7.
NOBLE, W. S. 2009. How does multiple testing correction work? Nat Biotechnol, 27, 1135-7.
OCHSENBEIN, A. F., KLENERMAN, P., KARRER, U., LUDEWIG, B., PERICIN, M., HENGARTNER, H. & ZINKERNAGEL, R. M. 1999. Immune surveillance against a solid tumor fails because of immunological ignorance. Proc Natl Acad Sci U S A, 96, 2233-8.
OLSEN, E. A., WHITTAKER, S., KIM, Y. H., DUVIC, M., PRINCE, H. M., LESSIN, S. R., WOOD, G. S., WILLEMZE, R., DEMIERRE, M. F., PIMPINELLI, N., BERNENGO, M. G., ORTIZ-ROMERO, P. L., BAGOT, M., ESTRACH, T., GUITART, J., KNOBLER, R., SANCHES, J. A., IWATSUKI, K., SUGAYA, M., DUMMER, R., PITTELKOW, M., HOPPE, R., PARKER, S., GESKIN, L., PINTER-BROWN, L., GIRARDI, M., BURG, G., RANKI, A., VERMEER, M., HORWITZ, S., HEALD, P., ROSEN, S., CERRONI, L., DRENO, B., VONDERHEID, E. C., INTERNATIONAL SOCIETY FOR CUTANEOUS, L., UNITED STATES CUTANEOUS LYMPHOMA, C., CUTANEOUS LYMPHOMA TASK FORCE OF THE EUROPEAN ORGANISATION FOR, R. & TREATMENT OF, C. 2011. Clinical end points and response criteria in mycosis fungoides and Sezary syndrome: a consensus statement of the International Society for Cutaneous Lymphomas, the United States Cutaneous Lymphoma Consortium, and the Cutaneous Lymphoma Task Force of the European Organisation for Research and Treatment of Cancer. J Clin Oncol, 29, 2598-607.
PHAM-LEDARD, A., PROCHAZKOVA-CARLOTTI, M., LAHARANNE, E., VERGIER, B., JOUARY, T., BEYLOT-BARRY, M. & MERLIO, J. P. 2010. IRF4 gene rearrangements define a subgroup of CD30-positive

105
cutaneous T-cell lymphoma: a study of 54 cases. J Invest Dermatol, 130, 816-25.
PIERSON, D. M., JONES, D., MUZZAFAR, T., KERSH, M. J., CHALLAGUNDLA, P., MEDEIROS, L. J. & JORGENSEN, J. L. 2008. Utility of CD26 in flow cytometric immunophenotyping of T-cell lymphomas in tissue and body fluid specimens. Cytometry B Clin Cytom, 74, 341-8.
POLANSKY, M., TALPUR, R., DAULAT, S., HOSING, C., DABAJA, B. & DUVIC, M. 2015. Long-Term Complete Responses to Combination Therapies and Allogeneic Stem Cell Transplants in Patients With Sezary Syndrome. Clin Lymphoma Myeloma Leuk, 15, e83-93.
PONTI, R., FIERRO, M. T., QUAGLINO, P., LISA, B., PAOLA, F., MICHELA, O., PAOLO, F., COMESSATTI, A., NOVELLI, M. & BERNENGO, M. G. 2008. TCRgamma-chain gene rearrangement by PCR-based GeneScan: diagnostic accuracy improvement and clonal heterogeneity analysis in multiple cutaneous T-cell lymphoma samples. J Invest Dermatol, 128, 1030-8.
QUERFELD, C., ROSEN, S. T., KUZEL, T. M., KIRBY, K. A., ROENIGK, H. H., JR., PRINZ, B. M. & GUITART, J. 2005. Long-term follow-up of patients with early-stage cutaneous T-cell lymphoma who achieved complete remission with psoralen plus UV-A monotherapy. Arch Dermatol, 141, 305-11.
RABENHORST, A., SCHLAAK, M., HEUKAMP, L. C., FORSTER, A., THEURICH, S., VON BERGWELT-BAILDON, M., BUTTNER, R., KURSCHAT, P., MAUCH, C., ROERS, A. & HARTMANN, K. 2012. Mast cells play a protumorigenic role in primary cutaneous lymphoma. Blood, 120, 2042-54.
RAO, V., SAUNES, M., JORSTAD, S. & MOEN, T. 2009. Cutaneous T cell lymphoma and graft-versus-host disease: a comparison of in vivo effects of extracorporeal photochemotherapy on Foxp3+ regulatory T cells. Clin Immunol, 133, 303-13.
REISS, Y., PROUDFOOT, A. E., POWER, C. A., CAMPBELL, J. J. & BUTCHER, E. C. 2001. CC chemokine receptor (CCR)4 and the CCR10 ligand cutaneous T cell-attracting chemokine (CTACK) in lymphocyte trafficking to inflamed skin. J Exp Med, 194, 1541-7.
ROBINS, H. S., CAMPREGHER, P. V., SRIVASTAVA, S. K., WACHER, A., TURTLE, C. J., KAHSAI, O., RIDDELL, S. R., WARREN, E. H. & CARLSON, C. S. 2009. Comprehensive assessment of T-cell receptor beta-chain diversity in alphabeta T cells. Blood, 114, 4099-107.
ROOK, A. H., GOTTLIEB, S. L., WOLFE, J. T., VOWELS, B. R., SOOD, S. S., NIU, Z., LESSIN, S. R. & FOX, F. E. 1997. Pathogenesis of cutaneous T-cell lymphoma: implications for the use of recombinant cytokines and photopheresis. Clin Exp Immunol, 107 Suppl 1, 16-20.
RUIZ, M., GIUDICELLI, V., GINESTOUX, C., STOEHR, P., ROBINSON, J., BODMER, J., MARSH, S. G., BONTROP, R., LEMAITRE, M., LEFRANC, G., CHAUME, D. & LEFRANC, M. P. 2000. IMGT, the international ImMunoGeneTics database. Nucleic Acids Res, 28, 219-21.
RUPOLI, S., GOTERI, G., PULINI, S., FILOSA, A., TASSETTI, A., OFFIDANI, M., FILOSA, G., MOZZICAFREDDO, G., GIACCHETTI, A.,

106
BRANDOZZI, G., CATALDI, I., BARULLI, S., RANALDI, R., SCORTECHINI, A. R., CAPRETTI, R., FABRIS, G., LEONI, P. & MARCHE REGIONAL MULTICENTRIC STUDY GROUP OF CUTANEOUS, L. 2005. Long-term experience with low-dose interferon-alpha and PUVA in the management of early mycosis fungoides. Eur J Haematol, 75, 136-45.
SALGADO, R., SERVITJE, O., GALLARDO, F., VERMEER, M. H., ORTIZ-ROMERO, P. L., KARPOVA, M. B., ZIPSER, M. C., MUNIESA, C., GARCIA-MURET, M. P., ESTRACH, T., SALIDO, M., SANCHEZ-SCHMIDT, J., HERRERA, M., ROMAGOSA, V., SUELA, J., FERREIRA, B. I., CIGUDOSA, J. C., BARRANCO, C., SERRANO, S., DUMMER, R., TENSEN, C. P., SOLE, F., PUJOL, R. M. & ESPINET, B. 2010. Oligonucleotide array-CGH identifies genomic subgroups and prognostic markers for tumor stage mycosis fungoides. J Invest Dermatol, 130, 1126-35.
SCARISBRICK, J. J., MITCHELL, T. J., CALONJE, E., ORCHARD, G., RUSSELL-JONES, R. & WHITTAKER, S. J. 2003. Microsatellite instability is associated with hypermethylation of the hMLH1 gene and reduced gene expression in mycosis fungoides. J Invest Dermatol, 121, 894-901.
SCARISBRICK, J. J., WOOLFORD, A. J., RUSSELL-JONES, R. & WHITTAKER, S. J. 2000. Loss of heterozygosity on 10q and microsatellite instability in advanced stages of primary cutaneous T-cell lymphoma and possible association with homozygous deletion of PTEN. Blood, 95, 2937-42.
SCHLAPBACH, C., GEHAD, A., YANG, C., WATANABE, R., GUENOVA, E., TEAGUE, J. E., CAMPBELL, L., YAWALKAR, N., KUPPER, T. S. & CLARK, R. A. 2014. Human TH9 cells are skin-tropic and have autocrine and paracrine proinflammatory capacity. Sci Transl Med, 6, 219ra8.
SCHLAPBACH, C., OCHSENBEIN, A., KAELIN, U., HASSAN, A. S., HUNGER, R. E. & YAWALKAR, N. 2010. High numbers of DC-SIGN+ dendritic cells in lesional skin of cutaneous T-cell lymphoma. J Am Acad Dermatol, 62, 995-1004.
SCHMITT, S., JOHNSON, T. S., KARAKHANOVA, S., NAHER, H., MAHNKE, K. & ENK, A. H. 2009. Extracorporeal photophoresis augments function of CD4+CD25+FoxP3+ regulatory T cells by triggering adenosine production. Transplantation, 88, 411-6.
SHAFFER, A. L., EMRE, N. C., LAMY, L., NGO, V. N., WRIGHT, G., XIAO, W., POWELL, J., DAVE, S., YU, X., ZHAO, H., ZENG, Y., CHEN, B., EPSTEIN, J. & STAUDT, L. M. 2008. IRF4 addiction in multiple myeloma. Nature, 454, 226-31.
SHERWOOD, A. M., DESMARAIS, C., LIVINGSTON, R. J., ANDRIESEN, J., HAUSSLER, M., CARLSON, C. S. & ROBINS, H. 2011. Deep sequencing of the human TCRgamma and TCRbeta repertoires suggests that TCRbeta rearranges after alphabeta and gammadelta T cell commitment. Sci Transl Med, 3, 90ra61.
SHIN, J., MONTI, S., AIRES, D. J., DUVIC, M., GOLUB, T., JONES, D. A. & KUPPER, T. S. 2007. Lesional gene expression profiling in cutaneous T-cell lymphoma reveals natural clusters associated with disease outcome. Blood, 110, 3015-27.

107
SHIUE, L. H., COUTURIER, J., LEWIS, D. E., WEI, C., NI, X. & DUVIC, M. 2015. The effect of extracorporeal photopheresis alone or in combination therapy on circulating CD4(+) Foxp3(+) CD25(-) T cells in patients with leukemic cutaneous T-cell lymphoma. Photodermatol Photoimmunol Photomed, 31, 184-94.
SINGH, T. P., SCHON, M. P., WALLBRECHT, K., GRUBER-WACKERNAGEL, A., WANG, X. J. & WOLF, P. 2013. Involvement of IL-9 in Th17-associated inflammation and angiogenesis of psoriasis. PLoS One, 8, e51752.
SINGH, T. P., SCHON, M. P., WALLBRECHT, K. & WOLF, P. 2012. 8-Methoxypsoralen plus UVA treatment increases the proportion of CLA+ CD25+ CD4+ T cells in lymph nodes of K5.hTGFbeta1 transgenic mice. Exp Dermatol, 21, 228-30.
SISMANOPOULOS, N., DELIVANIS, D. A., ALYSANDRATOS, K. D., ANGELIDOU, A., VASIADI, M., THERIANOU, A. & THEOHARIDES, T. C. 2012. IL-9 induces VEGF secretion from human mast cells and IL-9/IL-9 receptor genes are overexpressed in atopic dermatitis. PLoS One, 7, e33271.
SORS, A., JEAN-LOUIS, F., PELLET, C., LAROCHE, L., DUBERTRET, L., COURTOIS, G., BACHELEZ, H. & MICHEL, L. 2006. Down-regulating constitutive activation of the NF-kappaB canonical pathway overcomes the resistance of cutaneous T-cell lymphoma to apoptosis. Blood, 107, 2354-63.
STEIDL, C., LEE, T., SHAH, S. P., FARINHA, P., HAN, G., NAYAR, T., DELANEY, A., JONES, S. J., IQBAL, J., WEISENBURGER, D. D., BAST, M. A., ROSENWALD, A., MULLER-HERMELINK, H. K., RIMSZA, L. M., CAMPO, E., DELABIE, J., BRAZIEL, R. M., COOK, J. R., TUBBS, R. R., JAFFE, E. S., LENZ, G., CONNORS, J. M., STAUDT, L. M., CHAN, W. C. & GASCOYNE, R. D. 2010. Tumor-associated macrophages and survival in classic Hodgkin's lymphoma. N Engl J Med, 362, 875-85.
THEURICH, S., SCHLAAK, M., STEGUWEIT, H., HEUKAMP, L. C., WENNHOLD, K., KURSCHAT, P., RABENHORST, A., HARTMANN, K., SCHLOSSER, H., SHIMABUKURO-VORNHAGEN, A., HOLTICK, U., HALLEK, M., STADLER, R. & VON BERGWELT-BAILDON, M. 2016. Targeting Tumor-Infiltrating B Cells in Cutaneous T-Cell Lymphoma. J Clin Oncol, 34, e110-6.
TRAUTINGER, F. 2011. Phototherapy of mycosis fungoides. Photodermatol Photoimmunol Photomed, 27, 68-74.
TRAUTINGER, F., KNOBLER, R., WILLEMZE, R., PERIS, K., STADLER, R., LAROCHE, L., D'INCAN, M., RANKI, A., PIMPINELLI, N., ORTIZ-ROMERO, P., DUMMER, R., ESTRACH, T. & WHITTAKER, S. 2006. EORTC consensus recommendations for the treatment of mycosis fungoides/Sezary syndrome. Eur J Cancer, 42, 1014-30.
UNGEWICKELL, A., BHADURI, A., RIOS, E., REUTER, J., LEE, C. S., MAH, A., ZEHNDER, A., OHGAMI, R., KULKARNI, S., ARMSTRONG, R., WENG, W. K., GRATZINGER, D., TAVALLAEE, M., ROOK, A., SNYDER, M., KIM, Y. & KHAVARI, P. A. 2015. Genomic analysis of mycosis fungoides and Sezary syndrome identifies recurrent alterations in TNFR2. Nat Genet, 47, 1056-60.

108
VAN DER FITS, L., OUT-LUITING, J. J., VAN LEEUWEN, M. A., SAMSOM, J. N., WILLEMZE, R., TENSEN, C. P. & VERMEER, M. H. 2012a. Autocrine IL-21 stimulation is involved in the maintenance of constitutive STAT3 activation in Sezary syndrome. J Invest Dermatol, 132, 440-7.
VAN DER FITS, L., REBEL, H. G., OUT-LUITING, J. J., POUW, S. M., SMIT, F., VERMEER, K. G., VAN ZIJL, L., TENSEN, C. P., WEIJER, K. & VERMEER, M. H. 2012b. A novel mouse model for Sezary syndrome using xenotransplantation of Sezary cells into immunodeficient RAG2(-/-) gammac(-/-) mice. Exp Dermatol, 21, 706-9.
VAN DOORN, R., VAN HASELEN, C. W., VAN VOORST VADER, P. C., GEERTS, M. L., HEULE, F., DE RIE, M., STEIJLEN, P. M., DEKKER, S. K., VAN VLOTEN, W. A. & WILLEMZE, R. 2000. Mycosis fungoides: disease evolution and prognosis of 309 Dutch patients. Arch Dermatol, 136, 504-10.
VAN DOORN, R., VAN KESTER, M. S., DIJKMAN, R., VERMEER, M. H., MULDER, A. A., SZUHAI, K., KNIJNENBURG, J., BOER, J. M., WILLEMZE, R. & TENSEN, C. P. 2009. Oncogenomic analysis of mycosis fungoides reveals major differences with Sezary syndrome. Blood, 113, 127-36.
VAQUE, J. P., GOMEZ-LOPEZ, G., MONSALVEZ, V., VARELA, I., MARTINEZ, N., PEREZ, C., DOMINGUEZ, O., GRANA, O., RODRIGUEZ-PERALTO, J. L., RODRIGUEZ-PINILLA, S. M., GONZALEZ-VELA, C., RUBIO-CAMARILLO, M., MARTIN-SANCHEZ, E., PISANO, D. G., PAPADAVID, E., PAPADAKI, T., REQUENA, L., GARCIA-MARCO, J. A., MENDEZ, M., PROVENCIO, M., HOSPITAL, M., SUAREZ-MASSA, D., POSTIGO, C., SAN SEGUNDO, D., LOPEZ-HOYOS, M., ORTIZ-ROMERO, P. L., PIRIS, M. A. & SANCHEZ-BEATO, M. 2014. PLCG1 mutations in cutaneous T-cell lymphomas. Blood, 123, 2034-43.
VERMA, N. K., DAVIES, A. M., LONG, A., KELLEHER, D. & VOLKOV, Y. 2010. STAT3 knockdown by siRNA induces apoptosis in human cutaneous T-cell lymphoma line Hut78 via downregulation of Bcl-xL. Cell Mol Biol Lett, 15, 342-55.
VIEYRA-GARCIA, P. A., WEI, T., NAYM, D. G., FREDHOLM, S., FINK-PUCHES, R., CERRONI, L., ODUM, N., O'MALLEY, J. T., GNIADECKI, R. & WOLF, P. 2016. STAT3/5-Dependent IL9 Overexpression Contributes to Neoplastic Cell Survival in Mycosis Fungoides. Clin Cancer Res, 22, 3328-39.
VOWELS, B. R., LESSIN, S. R., CASSIN, M., JAWORSKY, C., BENOIT, B., WOLFE, J. T. & ROOK, A. H. 1994. Th2 cytokine mRNA expression in skin in cutaneous T-cell lymphoma. J Invest Dermatol, 103, 669-73.
WADA, D. A., WILCOX, R. A., WEENIG, R. H. & GIBSON, L. E. 2010. Paucity of intraepidermal FoxP3-positive T cells in cutaneous T-cell lymphoma in contrast with spongiotic and lichenoid dermatitis. J Cutan Pathol, 37, 535-41.
WANG, L., NI, X., COVINGTON, K. R., YANG, B. Y., SHIU, J., ZHANG, X., XI, L., MENG, Q., LANGRIDGE, T., DRUMMOND, J., DONEHOWER, L. A., DODDAPANENI, H., MUZNY, D. M., GIBBS, R. A., WHEELER, D. A. & DUVIC, M. 2015. Genomic profiling of Sezary syndrome identifies

109
alterations of key T cell signaling and differentiation genes. Nat Genet, 47, 1426-34.
WANG, T., FELDMAN, A. L., WADA, D. A., LU, Y., POLK, A., BRISKI, R., RISTOW, K., HABERMANN, T. M., THOMAS, D., ZIESMER, S. C., WELLIK, L. E., LANIGAN, T. M., WITZIG, T. E., PITTELKOW, M. R., BAILEY, N. G., HRISTOV, A. C., LIM, M. S., ANSELL, S. M. & WILCOX, R. A. 2014. GATA-3 expression identifies a high-risk subset of PTCL, NOS with distinct molecular and clinical features. Blood, 123, 3007-15.
WATANABE, R., GEHAD, A., YANG, C., SCOTT, L. L., TEAGUE, J. E., SCHLAPBACH, C., ELCO, C. P., HUANG, V., MATOS, T. R., KUPPER, T. S. & CLARK, R. A. 2015. Human skin is protected by four functionally and phenotypically discrete populations of resident and recirculating memory T cells. Sci Transl Med, 7, 279ra39.
WEINSTOCK, M. A. & GARDSTEIN, B. 1999. Twenty-year trends in the reported incidence of mycosis fungoides and associated mortality. Am J Public Health, 89, 1240-4.
WHITTAKER, S. J., DEMIERRE, M. F., KIM, E. J., ROOK, A. H., LERNER, A., DUVIC, M., SCARISBRICK, J., REDDY, S., ROBAK, T., BECKER, J. C., SAMTSOV, A., MCCULLOCH, W. & KIM, Y. H. 2010. Final results from a multicenter, international, pivotal study of romidepsin in refractory cutaneous T-cell lymphoma. J Clin Oncol, 28, 4485-91.
WHITTEMORE, A. S., HOLLY, E. A., LEE, I. M., ABEL, E. A., ADAMS, R. M., NICKOLOFF, B. J., BLEY, L., PETERS, J. M. & GIBNEY, C. 1989. Mycosis fungoides in relation to environmental exposures and immune response: a case-control study. J Natl Cancer Inst, 81, 1560-7.
WILCOX, R. A. 2010. Cancer-associated myeloproliferation: old association, new therapeutic target. Mayo Clin Proc, 85, 656-63.
WILCOX, R. A. 2016. Cutaneous T-cell lymphoma: 2016 update on diagnosis, risk-stratification, and management. Am J Hematol, 91, 151-65.
WILCOX, R. A., WADA, D. A., ZIESMER, S. C., ELSAWA, S. F., COMFERE, N. I., DIETZ, A. B., NOVAK, A. J., WITZIG, T. E., FELDMAN, A. L., PITTELKOW, M. R. & ANSELL, S. M. 2009. Monocytes promote tumor cell survival in T-cell lymphoproliferative disorders and are impaired in their ability to differentiate into mature dendritic cells. Blood, 114, 2936-44.
WILLEMZE, R., JAFFE, E. S., BURG, G., CERRONI, L., BERTI, E., SWERDLOW, S. H., RALFKIAER, E., CHIMENTI, S., DIAZ-PEREZ, J. L., DUNCAN, L. M., GRANGE, F., HARRIS, N. L., KEMPF, W., KERL, H., KURRER, M., KNOBLER, R., PIMPINELLI, N., SANDER, C., SANTUCCI, M., STERRY, W., VERMEER, M. H., WECHSLER, J., WHITTAKER, S. & MEIJER, C. J. 2005. WHO-EORTC classification for cutaneous lymphomas. Blood, 105, 3768-85.
WILLERSLEV-OLSEN, A., KREJSGAARD, T., LINDAHL, L. M., BONEFELD, C. M., WASIK, M. A., KORALOV, S. B., GEISLER, C., KILIAN, M., IVERSEN, L., WOETMANN, A. & ODUM, N. 2013. Bacterial toxins fuel disease progression in cutaneous T-cell lymphoma. Toxins (Basel), 5, 1402-21.
WILLERSLEV-OLSEN, A., KREJSGAARD, T., LINDAHL, L. M., LITVINOV, I. V., FREDHOLM, S., PETERSEN, D. L., NASTASI, C., GNIADECKI, R., MONGAN, N. P., SASSEVILLE, D., WASIK, M. A., BONEFELD, C. M.,

110
GEISLER, C., WOETMANN, A., IVERSEN, L., KILIAN, M., KORALOV, S. B. & ODUM, N. 2016. Staphylococcal enterotoxin A (SEA) stimulates STAT3 activation and IL-17 expression in cutaneous T-cell lymphoma. Blood, 127, 1287-96.
WOOLLARD, W. J., PULLABHATLA, V., LORENC, A., PATEL, V. M., BUTLER, R. M., BAYEGA, A., BEGUM, N., BAKR, F., DEDHIA, K., FISHER, J., AGUILAR-DURAN, S., FLANAGAN, C., GHASEMI, A. A., HOFFMANN, R. M., CASTILLO-MOSQUERA, N., NUTTALL, E. A., PAUL, A., ROBERTS, C. A., SOLOMONIDIS, E. G., TARRANT, R., YOXALL, A., BEYERS, C. Z., FERREIRA, S., TOSI, I., SIMPSON, M. A., DE RINALDIS, E., MITCHELL, T. J. & WHITTAKER, S. J. 2016. Candidate driver genes involved in genome maintenance and DNA repair in Sezary syndrome. Blood, 127, 3387-97.
WU, J., NIHAL, M., SIDDIQUI, J., VONDERHEID, E. C. & WOOD, G. S. 2009. Low FAS/CD95 expression by CTCL correlates with reduced sensitivity to apoptosis that can be restored by FAS upregulation. J Invest Dermatol, 129, 1165-73.
WU, J. & WOOD, G. S. 2011. Reduction of Fas/CD95 promoter methylation, upregulation of Fas protein, and enhancement of sensitivity to apoptosis in cutaneous T-cell lymphoma. Arch Dermatol, 147, 443-9.
WU, X., SCHULTE, B. C., ZHOU, Y., HARIBHAI, D., MACKINNON, A. C., PLAZA, J. A., WILLIAMS, C. B. & HWANG, S. T. 2014. Depletion of M2-like tumor-associated macrophages delays cutaneous T-cell lymphoma development in vivo. J Invest Dermatol, 134, 2814-22.
WU, X., SELLS, R. E. & HWANG, S. T. 2011. Upregulation of inflammatory cytokines and oncogenic signal pathways preceding tumor formation in a murine model of T-cell lymphoma in skin. J Invest Dermatol, 131, 1727-34.
XU, C., WAN, C., WANG, L., YANG, H. J., TANG, Y. & LIU, W. P. 2011. Diagnostic significance of TCR gene clonal rearrangement analysis in early mycosis fungoides. Chin J Cancer, 30, 264-72.
YAMANAKA, K., CLARK, R., DOWGIERT, R., HURWITZ, D., SHIBATA, M., RICH, B. E., HIRAHARA, K., JONES, D. A., EAPEN, S., MIZUTANI, H. & KUPPER, T. S. 2006a. Expression of interleukin-18 and caspase-1 in cutaneous T-cell lymphoma. Clin Cancer Res, 12, 376-82.
YAMANAKA, K., CLARK, R., RICH, B., DOWGIERT, R., HIRAHARA, K., HURWITZ, D., SHIBATA, M., MIRCHANDANI, N., JONES, D. A., GODDARD, D. S., EAPEN, S., MIZUTANI, H. & KUPPER, T. S. 2006b. Skin-derived interleukin-7 contributes to the proliferation of lymphocytes in cutaneous T-cell lymphoma. Blood, 107, 2440-5.
YAMASHITA, T., ABBADE, L. P., MARQUES, M. E. & MARQUES, S. A. 2012. Mycosis fungoides and Sezary syndrome: clinical, histopathological and immunohistochemical review and update. An Bras Dermatol, 87, 817-28; quiz 829-30.
YUKI, H., UENO, S., TATETSU, H., NIIRO, H., IINO, T., ENDO, S., KAWANO, Y., KOMOHARA, Y., TAKEYA, M., HATA, H., OKADA, S., WATANABE, T., AKASHI, K., MITSUYA, H. & OKUNO, Y. 2013. PU.1 is a potent tumor suppressor in classical Hodgkin lymphoma cells. Blood, 121, 962-70.
111
ZACK, T. I., SCHUMACHER, S. E., CARTER, S. L., CHERNIACK, A. D., SAKSENA, G., TABAK, B., LAWRENCE, M. S., ZHSNG, C. Z., WALA, J., MERMEL, C. H., SOUGNEZ, C., GABRIEL, S. B., HERNANDEZ, B., SHEN, H., LAIRD, P. W., GETZ, G., MEYERSON, M. & BEROUKHIM, R. 2013. Pan-cancer patterns of somatic copy number alteration. Nat Genet, 45, 1134-40.
ZACKHEIM, H. S. 1999. Cutaneous T cell lymphoma: update of treatment. Dermatology, 199, 102-5.
ZACKHEIM, H. S. 2003. Treatment of patch-stage mycosis fungoides with topical corticosteroids. Dermatol Ther, 16, 283-7.
ZACKHEIM, H. S., KASHANI-SABET, M. & AMIN, S. 1998. Topical corticosteroids for mycosis fungoides. Experience in 79 patients. Arch Dermatol, 134, 949-54.
ZHANG, Q., WANG, H. Y., WOETMANN, A., RAGHUNATH, P. N., ODUM, N. & WASIK, M. A. 2006. STAT3 induces transcription of the DNA methyltransferase 1 gene (DNMT1) in malignant T lymphocytes. Blood, 108, 1058-64.

112
Appendices
Abbreviations
AKT Protein kinase (also PKB)
ATP Adenosine triphosphate
Bax BCL2-associated X protein
Bcl-2 B-cell lymphoma 2
BCR B-cell Receptor
c-MYD c-Myelocytomatosis Viral Oncogene (also MYC)
CAILS Composite Assessment of Index Lesion Severity
CCL Chemokine ligand
CCR Chemokine receptor
CD Cluster differentiation
CDKN Cyclin-dependent kinase inhibitor
CDR3 Complementarity-determining region
CLA Cutaneous lymphocyte-associated antigen
CRABPs Cellular retinoic acid-binding protein
CTCL Cutaneous T-cell lymphoma
CTSH Cathepsin H
CXCL Chemokine (C-X-C motif) ligand
CXCR Chemokine (C-X-C motif) receptor
DC Dendritic cell
DC-SIGN Cluster of Differentiation 209
DNA Deoxyribonucleic acid
DNMT1 DNA (cytosine-5)-methyltransferase 1
ECP Extracorporeal photophoresis
ELISA Enzyme-Linked Immunosorbent Assay
EORTC European Organization for Research and Treatment of Cancer
ERK Extracellular regulated kinase
FAS Apoptosis antigen 1 (also APO-1)
FOXP3 Fork head box P3
GATA3 GATA binding protein 3
HLA Human leukocyte antigen
HRP Enzyme horseradish peroxidase
HTLV-1 Human T-lymphotropic virus 1
HTS High throughput sequencing
IDO Indoleamine-pyrrole 2,3-dioxygenase
IFNγ Interferon gamma
IRF4 Interferon regulatory factor 4
ITGAE Integrin Subunit Alpha E
ITK IL2 Inducible T-Cell Kinase
JAK Janus kinase
KEGG Kyoto Encyclopedia of Genes and Genomes
L-CTCL Leukemic-CTCL
LAMP1 Lysosomal Associated Membrane Protein 1

113
LCK Lymphocyte specific protein tyrosine kinase
LCP1 Lymphocyte Cytosolic Protein 1
LDH Lactate dehydrogenase
LEU13 Interferon-induced trans-membrane protein 1 (also IFITM1)
LYN Lck/Yes novel tyrosine kinase
MAPK Mitogen-activated protein kinase MEKK4 Mitogen-activated protein kinase 4 (also MAP3K4)
MF Mycosis fungoides
miR- Micro-RNA
MR1 Myofibrillogenesis regulator 1
MRC OX-2 membrane glycoprotein (also CD200)
mSWAT Modified Severity Weight Assessment Tool
mTOR Mechanistic target of rapamycin
NFAT Nuclear factor of activated T-cells
NFκB Nuclear factor kappa-light-chain-enhancer of activated B cells
PAGE Polyacrylamide gel electrophoresis
PI3K Phosphatidylinositol-4,5-biphosphate 3-kinase
PLCG1 Phospholipase C, gamma 1
PU.1 Transcription factor PU.1 (also SPI1)
PUVA psoralen + UVA
qPCR Quantitative polymerase chain reaction
RAG Recombination-activating gene
RB1 Retinoblastoma protein 1
RELA p65 subunit NFκB
RNA Ribonucleic acid
RORγT RAR-related orphan receptor gamma
SEER Surveillance, Epidemiology, and End Results
SH2D1A SH2 domain–containing protein 1A
SHIP Inositol Polyphosphate-5-Phosphatase D (also INPP5D)
siCTRL Silencing RNA control
siRNA Silencing RNA
SS Sèzary syndrome
STAT Signal transducer and activator of transcription
t-BET T-box transcription factor TBX21 (also TBX21)
TAP Transporter associated with Antigen Processing
TCM Central memory T-cell
TCR T-cell receptor
TGF-β Transforming growth factor beta
TMM Migrant memory T-cell
TNF Tumor necrosis factor
TRAF TNF receptor-associated factor
TRM Resident memory T-cell
TSA Tyramide Signal Amplification
UVB Ultraviolet light B
VEGF Vascular endothelial growth factor A
ZAP70 Zeta-chain-associated protein kinase 70

114
Conference presentations
1. Vieyra-Garcia PA, O'Malley JT, Teague J, Lowry EL, Gehad A, Clark RO
and Wolf P. Understanding benign T-cell infiltration in mycosis fungoides:
Malignant clones are not alone. ESDR Annual meeting 2016 (Munich, 2016).
[Poster]
2. Vieyra PA, O'Malley JT, Teague J, Lowry EL, Gehad A, Wolf P and Clark R.
PUVA therapy fails to deplete malignant T cells in CTCL and instead exerts
its clinical effect by modulating benign T cell populations. Society of
Investigative Dermatology Annual meeting 2016 (Arizona, USA). [Oral
presentation, Plenary session]
3. O’Malley JT, Lowry EL, Gehad A, Teague J, Elco CP, Vieyra PA, LeBoeuf
N, Devlin P, Kupper TS and Clark R. Low-dose radiation preferentially kills
malignant T cells, recruits benign T cells and normalizes the immune milieu
in mycosis fungoides. Society of Investigative Dermatology Annual meeting
2016 (Arizona, USA). [Poster]
4. Vieyra-Garcia PA, Mayer G, Pressl H, Reginato E, Schweintzger N,
Bambach I, Legat F, Hofer A, Gruber-Wackernagel A, Cerroni L, Fink-
Puches R and Wolf P.
Higher frequencies but impaired suppressive capacity of regulatory T cells
after PUVA in cutaneous T-cell lymphoma. Inflammatory Skin Disease
Summit 2014 (Vienna, Austria). [Poster]
5. Vieyra-Garcia PA, Mayer G, Pressl H, Reginato E, Schweintzger NA,
Bambach I, Hofer A, Gruber-Wackernagel A, Cerroni L and Wolf P.
Increased frequency of regulatory T cells with impaired suppressive capacity
after PUVA in cutaneous T-cell lymphoma. ESDR Annual meeting 2014
(Copenhagen, Denmark). [Poster]

115
Awards
Non-Melanoma Skin Cancer award 2016. Austrian Society of Dermatology and
Venereology Annual meeting, Vienna (AT). November 2016.
Michael Hornstein Award. EADV Annual meeting, Vienna (AT). October 2016.
Best poster award, 2nd DK-MOLIN Retreat. Schloss Seggau (AT), October 2014.
Best presentation, 2nd place, Doctoral Day 2013. Graz (AT), December 2013.
Publications
1. Vieyra-Garcia, P; Wei, T; Gram Naym, D; Fredholm, S; Fink-Puches, R;
Cerroni, L; Odum, N; T. O’Malley, J; Gniadecki, R; and Wolf, P.
STAT3/5 dependent IL-9 overexpression contributes to neoplastic cell
survival in mycosis fungoides.
Clinical Cancer Research. 2016: Jul 1;22(13):3328-39.
2. Tenorio, EP; Olguín, JE; Fernández, J; Vieyra, P; Saavedra, R
Reduction of Foxp3+ cells by depletion with the PC61 mAb induces mortality
in resistant BALB/c mice infected with Toxoplasma gondii.
Journal Biomedicine Biotechnology. 2010; 2010:786078-786078 [OPEN
ACCESS]

116
Light up the darkness
Acknowledgements:
I’m in one of the happiest times of my life, there is a long list of people I had the fortune
to meet that intentionally or by accident have had an important role to get me to this
point.
Mom, Dad, Gero and Tania, with no question you have been the core of my life and as
new people get close to us, I realize that a new chapter has opened in our lives with
the coming of Victoria. I have trust and I smile by just imagining the things to come.
Rebecca, you are the closest person to me, I cherish every second with you. Where
are the oceans, the clouds and the mountains without gravity?
I want to thank Professor Wolf for the opportunity and all the freedom he gave me to
educate myself. He supported me to explore every idea I had, even some of the bad
ones. He guided me and listened to me when I much needed it and above all, he
trusted me.
I want to thank Rachael Clark for opening the door of her lab, for her mentorship,
support, and enthusiasm and for being fundamental in realizing the potential of a bold
idea.
I want to thank the help and guidance from Gerlinde, Isabella, Nitesh, Vijay, Jessica,
Lizzy and Beatrice on both sides of the Atlantic. Their friendship and constant input
have been essential for the accomplishments in these PhD years.
I want to thank our collaborators in Denmark and the US, together we have done things
that I thought were much more difficult to achieve.
I want to thank Akos Heinemann, Miriam Sedej and everyone in the DK-MOLIN
especially to Mina, Angela and Ana. The opportunities, guidance and laughter I got
from them helped in a great deal to make Austria my home in these years. In that line
I also want to thank people in Mexico and the US: Abraham, Jose Manuel and Laura.