dissertation - rutgers university
TRANSCRIPT

DIFFERENTIAL SHOPLIFTING RISKS OF FAST-MOVING CONSUMER GOODS
By Brian Thomas Smith
A dissertation submitted to the Graduate School – Newark
Rutgers, The State University of New Jersey in partial fulfillment of requirements
for the degree of Doctor of Philosophy
Graduate Program in Criminal Justice Written under the direction of Professor Ronald V. Clarke
and approved by
___________________________________ Dr. Ronald V. Clarke, Chair
___________________________________ Dr. Andres Rengifo
___________________________________ Dr. Anthony Braga
___________________________________ Dr. Marcus Felson, Outside Reader
Newark, New Jersey May, 2013
08 Fall

© 2013 Brian T. Smith
ALL RIGHTS RESERVED
iii
ABSTRACT
Differential Shoplifting Risks of Fast-Moving Consumer Goods
By Brian T. Smith
Dissertation Chair: Ronald V. Clarke
In 2011, shoplifting accounted for over $50 billion in costs to retailers. It has been
estimated that, in 2012, stores had to “mark-up” the price of products by 10 to 15 percent
to make up for losses. Thus, shoplifting is a burden paid for by stores and honest
customers. Shoplifting is an opportunistic crime and shoplifters are attracted to expensive
and luxurious products. However, there is a good deal of theft of lower-priced and
“everyday” products known as fast-moving consumer goods (FMCG). FMCG are found
in drug, grocery and supermarket stores. Some examples of FMCG are toothpaste, razors,
vitamins, deodorants, and cosmetics. Although these products are relatively inexpensive,
they are purchased, consumed and shoplifted more than other products because of their
nature and purpose. Their total dollar values of theft easily surpass other, less-frequently
stolen but luxurious products. They are also the main products to be shoplifted and resold
at illicit markets. A large amount of FMCG shoplifting is motivated by illicit market
demand. Certain products are preferred over others because of their attributes. Models of
theft preferences (e.g., CRAVED) have proven effective promise in explaining variation
in general theft. To better understand variation in product theft, this study tests CRAVED
– the general model of theft preferences, and a new model of theft preferences – AT CUT
PRICES – which is based on disposability attributes. This study produced three main
findings: 1) CRAVED explained variation in FMCG theft better than the new, theoretical
AT CUT PRICES model; 2) The availability and size of products were the strongest

iv
predictors of theft in both models; and 3) An exploratory analysis found some evidence
that some products, having roles or function in illicit drug use, are stolen at high rates.
There are theoretical and policy implications derived from this research, including: 1)
Designing and manufacturing products and their packaging so they are difficult to
conceal; 2) Notifying stores to be aware of which products are stolen for their drug
properties, so they can safeguard them appropriately; and 3) Informing stores and
government agencies of the nature and extent of theft for commonly-abused non-
prescription drugs.

v
TABLE OF CONTENTS
ABSTRACT ............................................................................................................................................ III TABLE OF FIGURES ............................................................................................................................. VII DISSERTATION SUMMARY .................................................................................................................. 1 CHAPTER 1. UNDERSTANDING SHOPLIFTING ............................................................................. 5 WHAT IS SHOPLIFTING? ........................................................................................................................................... 5 METHODS OF SHOPLIFTING ..................................................................................................................................... 5 THE NEGATIVE EFFECTS CAUSED BY SHOPLIFTING ............................................................................................ 7 TYPES OF SHOPLIFTERS ............................................................................................................................................ 8 ORGANIZED RETAIL CRIME GROUPS ...................................................................................................................... 9 RETAIL RESPONSES TO SHOPLIFTING ................................................................................................................. 12 LAW ENFORCEMENT RESPONSES AND OFFICIAL SANCTIONS ........................................................................ 17 MEASURING SHOPLIFTING .................................................................................................................................... 20 SHOPLIFTING OF FAST-‐MOVING CONSUMER GOODS ....................................................................................... 23 SHOPLIFTING AND DRUG ABUSE .......................................................................................................................... 25 THE SPECIAL PROBLEM OF SHOPLIFTED PRODUCTS WITH ROLES IN ILLICIT DRUG USE ........................ 25 CHAPTER SUMMARY ............................................................................................................................................... 26
CHAPTER 2. THEORETICAL FRAMEWORK .................................................................................. 28 ENVIRONMENTAL AND SITUATIONAL EXPLANATIONS OF THEFT ................................................................. 28 ROUTINE ACTIVITY THEORY ................................................................................................................................. 30 RATIONAL CHOICE THEORY .................................................................................................................................. 31 “HOT PRODUCTS” AND THE CRAVED MODEL ................................................................................................. 34 FMCG, DISPOSABILITY, AND THE AT CUT PRICES MODEL ......................................................................... 40 CHAPTER SUMMARY ............................................................................................................................................... 42
CHAPTER 3. OVERVIEW OF RESEARCH DESIGN AND METHODOLOGY .............................. 43 DATA SOURCE AND DESCRIPTION ....................................................................................................................... 43 DEPENDENT VARIABLE – THEFT RATE .............................................................................................................. 49 DESCRIPTIVE STATISTICS OF THEFT RATE ........................................................................................................ 50
CHAPTER 4. TESTING THE AT CUT PRICES MODEL .................................................................. 51 OVERVIEW OF THE STUDY DESIGN ...................................................................................................................... 51 ANALYTIC STRATEGY ............................................................................................................................................. 51 RESEARCH QUESTIONS AND NULL HYPOTHESES ............................................................................................. 52 DEFINITION AND MEASUREMENT OF THE AT CUT PRICES ATTRIBUTES ................................................. 53 AT CUT PRICES ATTRIBUTES – MEASURED INDEPENDENT VARIABLES .................................................. 53 AT CUT PRICES ATTRIBUTES – NOT MEASURED .......................................................................................... 55 DESCRIPTIVE STATISTICS OF AT CUT PRICES VARIABLES .......................................................................... 58 BIVARIATE COEFFICIENTS FOR AT CUT PRICES & THEFT RATE ............................................................... 59 MULTIVARIATE RESULTS ...................................................................................................................................... 60 CHAPTER SUMMARY ............................................................................................................................................... 62
CHAPTER 5. TESTING THE CRAVED MODEL ............................................................................... 64 OVERVIEW OF THE STUDY DESIGN ...................................................................................................................... 64 ANALYTIC STRATEGY ............................................................................................................................................. 64 RESEARCH QUESTIONS AND NULL HYPOTHESES ............................................................................................. 64 CRAVED ATTRIBUTES – MEASURED INDEPENDENT VARIABLES ................................................................ 65 CRAVED ATTRIBUTES – NOT MEASURED ........................................................................................................ 67 DESCRIPTIVE STATISTICS ...................................................................................................................................... 68

vi
BIVARIATE RESULTS .............................................................................................................................................. 69 MULTIVARIATE RESULTS ...................................................................................................................................... 70 CHAPTER SUMMARY ............................................................................................................................................... 71
CHAPTER 6. ANALYZING THEFT RATES OF PRODUCTS WITH ROLES IN ILLICIT DRUG USE ............................................................................................................................................................ 72 OVERVIEW OF THE STUDY DESIGN ...................................................................................................................... 72 RESEARCH QUESTIONS AND NULL HYPOTHESES ............................................................................................. 72 IDENTIFYING FREQUENTLY MISUSED AND ABUSED PRODUCTS .................................................................... 73 THE 5 ROLES OF PRODUCTS WITH DRUG ABUSE FUNCTIONS ....................................................................... 73 ANALYTIC STRATEGY ............................................................................................................................................. 79 DESCRIPTIVES OF STOLEN PRODUCTS WITH ILLICIT DRUG FUNCTIONS (INDEPENDENT VARIABLE) ... 81 BIVARIATE RESULTS .............................................................................................................................................. 84 CHAPTER SUMMARY ............................................................................................................................................... 84
CHAPTER 7. CONCLUSIONS ............................................................................................................... 85 THEORETICAL IMPLICATIONS ............................................................................................................................... 86 POLICY IMPLICATIONS ........................................................................................................................................... 89 SITUATIONAL CRIME PREVENTION ..................................................................................................................... 92 DATA LIMITATIONS ................................................................................................................................................ 96 IMPLICATIONS FOR PRODUCTS WITH ILLICIT DRUG FUNCTIONS STUDY ..................................................... 97
REFERENCES ....................................................................................................................................... 100 APPENDICES ....................................................................................................................................... 120 APPENDIX 1. METHOD FOR GATHERING FMCG SAMPLE ............................................................................. 120 APPENDIX 2. COUNT OF FMCG LOST/STOLEN FOR 2010-‐11 STUDY PERIOD (N=8,522) ................. 120 APPENDIX 3. COUNT OF FMCG STOLEN FOR 2010-‐11 STUDY PERIOD (N=8,522) ............................. 121 APPENDIX 4. CODING SCHEME – IDENTIFYING PRODUCTS ROLES IN ILLICIT DRUG USE ....................... 122
VITA ...................................................................................................................................................... 128
vii
TABLE OF FIGURES Table 1. The Main Groups of Shoplifting Offenders ................................................................................ 8 Figure 2. Stolen Product Disposal by Professional Shoplifters ....................................................... 12 Table 3. CRAVED Definitions ......................................................................................................................... 36 Table 4. AT CUT PRICES Definitions ........................................................................................................... 37 Table 5 AT CUT PRICES: Features, and Examples of FMCG ............................................................. 41 Table 6. Method for Gathering FMCG Sample ........................................................................................ 45 Figure 7. Product Terminology Flow Chart ........................................................................................... 46 Figure 8. Count of FMCG Stolen for 2010-‐11 Study Period (N=8,522) ........................................ 47 Figure 9. Count of FMCG Sold for 2010-‐11 Study Period (N=8,522) ............................................ 48 Table 10. Definition and Coding of Theft Rate – Dependent Variable ......................................... 50 Table 11. Descriptive Statistics of Dependent Variable – Theft Rate (N = 8,522) .................. 50 Table 12. AT CUT PRICES Measures and Coding Scheme ................................................................. 57 Table 13. Descriptive Statistics of Independent Variables – AT CUT PRICES ......................... 58 Table 14. Pearson’s r Coefficients for AT CUT PRICES Variables (N = 8,522) .......................... 60 Table 15. Multivariate Regression of AT CUT PRICES and Theft Rate (N = 8,522) ............... 62 Table 16. CRAVED Measures and Coding Scheme ................................................................................ 68 Table 17. Descriptive Statistics of Independent Variables – CRAVED (N=8,522) ................... 69 Table 20. Illicit Drug Role Measures and Coding Scheme ................................................................. 81 Table 21. Descriptive Statistics of Shoplifted Products with Roles in Illicit Drug Use; 204 Supermarkets, 2010-‐11. ................................................................................................................................... 83 Table 22. Pearson’s r Coefficient for Drug Function ........................................................................... 84 Table 19. Multivariate Regression of CRAVED and Theft Rate (N = 8,522) .............................. 71 Table 18. Pearson’s r Correlation Coefficients for the CRAVED Model (N = 8,522) ............... 70

1
DISSERTATION SUMMARY
This goal of this study is to understand how certain properties of products would cause
their shoplifting rates to vary. More specifically, the study investigates the variation and
patterns in rates of theft for fast-moving consumer goods (FMCG) from U.S.
supermarkets based on a number of product attributes. The study has seven chapters,
which are summarized below.
Chapter one introduces the general problem of shoplifting and presents a review of the
literature. First, the crime of shoplifting is defined and described. Methods of shoplifting
are then covered; a typical sequence of events shoplifters follow is also presented. Next,
the many negative effects caused by shoplifting are presented. The next section provides
a typology of shoplifters, including petty thieves, more determined thieves, and organized
groups. A section is then dedicated to a review of the literature on organized retail crime
groups. The next sections discuss retail and law enforcement responses to shoplifting, as
well as official sanctions. The topic of how shoplifting incidents is measured is next. The
final two sections of the chapter discuss the shoplifting of fast-moving consumer goods,
how shoplifting is related to drug abuse, and the special problem of shoplifted products
with roles in illicit drug use.
Chapter two provides an overview of the theoretical background that guided the
methodology of this study. First, a general description of the environmental and
situational explanations of theft is presented. Next, the two guiding theories for the

2
research – Routine Activity Theory and Rational Choice Theory are summarized. The
concept of “hot products” and the CRAVED model are then discussed. Finally, the new
model being tested first in this research – AT CUT PRICES – is discussed.
Chapter three provides an overview of the study’s research design. Information about the
source of the data analyzed and the operationalized dependent variable is discussed. For
this study, stolen FMCG products were the unit of analysis. A rate of theft was calculated
that served as the dependent variable and proxy measure for theft. This measure was used
as the dependent variable in all three analyses in the study.
Chapter four presents the results of the AT CUT PRICES analysis, which measures
variation in product theft rates as a result of change in disposability attributes. The
chapter presents an introduction and overview of the design of the study. Then, research
questions and null hypotheses are provided. Next, each of the AT CUT PRICES variables
are operationalized. Descriptive and frequency statistics, bivariate correlations and
multivariate results are then presented. The analysis found significant relationships
existed between all five measurable AT CUT PRICES components and theft rate. All
coefficients between the independent variables and dependent variable were highly
significant predictors in the bivariate and multivariate analyses. The model explained
roughly 13.5% of the theft variation (R2 = .135). It is apparent by the results that smaller
products are stolen at higher rates than larger products. Of the measured variables, the
size and how concealable a product is was the strongest predictor of theft.

3
Chapter five is very similar to chapter four, however it tests the CRAVED model of theft
preferences. This is useful to determine if AT CUT PRICES advances CRAVED in the
explanation of FMCG theft variation. Chapter five presents the results that measured the
effects of AT CUT PRICES attributes on product theft rate. In this chapter, results were
presented from the study that measured the effects of the CRAVED model’s four
measurable attributes – Concealable, Available, Valuable and Enjoyable on product theft
rate. All of the CRAVED independent variables were significant predictors of theft rate.
More concealable, higher valued and more enjoyable products are stolen more often.
Available was the strongest predictor of theft in this model. Compared to the AT CUT
PRICES model, the CRAVED model explained more variation in theft (R2 = .196)
Chapter six is an exploratory analysis, assessing the theft risks of products based on
whether they have a function or role in the illicit use of drugs. First, a short review of the
literature provides the different ways in which products serve roles in drug abuse are
presented. Then, the research questions and hypotheses are presented. Next, the
operationalization of the independent variables is displayed. The descriptive statistics are
presented in a table that cross lists products’ theft rates with their respective roles in drug
abuse. Bivariate correlations are presented as well. The results suggest that products with
drug abuse value have a higher risk of being shoplifted. Less than ten percent of all
sampled products (N = 635) had roles in illicit drug abuse, but their mean theft rate (.051)
was higher than the overall mean theft rate of the remaining products (N = 7,887) in the
sample (.032). This study indicates that products with these roles are stolen at higher
rates, which may suggest their being targeted by thieves because of this.

4
Chapter seven presents a summary of results, a discussion of findings, and conclusions
drawn from the study. The findings are compared to the research questions and null
hypotheses. A section on the strengths and limitations of the study is located in this
chapter. The techniques of situational crime prevention are considered to lower theft and
those techniques that could potentially lower theft are presented when applicable. The
implications for theory and practice and directions for further research are then presented.
The policy implications are targeted at manufacturers of hot products, and the designers
of their packaging. Also, the manner in which these products are displayed in stores is
considered. More research is needed – especially qualitative research – to better
understand the theft attributes of FMCG. The exploratory study of products with drug
roles also demands further research to determine if people are stealing those products
because of their drug use properties.
5
CHAPTER 1. UNDERSTANDING SHOPLIFTING
What is Shoplifting?
Shoplifting is the theft of goods from retail establishments. More specifically, it is
perpetrated by non-employees during business hours of the establishment. It is also
commonly known as “shop theft” in the U.K., “shrinkage” within the retail industry and
“boosting” to street criminals. Unlike other forms of theft, shoplifting typically will go
unnoticed for a while, or may not be detected for weeks, or never – especially in the
larger, big-box retail chain stores. Most shoplifting offenders are opportunistic amateurs
who conceal goods in their pockets, carried bags, or otherwise on their person. However,
there are other people and groups who make their living from shoplifting, who are much
more skilled at theft. The different types of offenders are discussed, in detail, in the
“Types of Shoplifters” section.
Methods of Shoplifting
There is a typical sequence of events of which shoplifters follow. Their decisions are
based on the environment and situation they are met with. Gill (2010) organized
shoplifter decision-making into six conceptual phases:
1. Choosing the store: Shoplifters will make their choice depending on products
targeted, proximity of store, and chance of being recognized by staff, visible security,
and staff awareness.
2. Entering the store: One of the most important points to remember is that shoplifters
have to feel as if they are not being noticed. If they are approached by store staff or
feel that it is too quiet or too busy, they may become less likely to steal. The

6
shoplifter then will make a choice about whether the security is enough to deter the
theft.
3. Locating the product: Depending on the suspect, they may already know where the
product is, or have to locate it.
4. Concealing the product: This step is when professional and amateur shoplifters are
more easily identifiable. Professionals typically subscribe to the belief that the more
time they spend in a store, the more likely they will be caught — they tend to conceal
a product quickly and secretly. On the other hand, amateurs typically will walk
around with the product in their hand looking for a good spot to conceal, or perhaps
be thinking (or worrying) about what will happen to them when they are caught.
Their methods of concealment are usually not as 'smooth' as professionals and
sometimes appear nervous and out of place.
5. Leaving the store: Professional shoplifters will leave the store as quickly as possible
and try their hardest to look like they are any other citizen walking out. Amateurs
often get nervous and double-back at the exits, making themselves look even more
out of place.
6. Disposing of the products: Many professionals sell or 'fence' the products they
shoplift and depend on others to pay for their services. Most amateurs shoplift
products from themselves and keep the product to use for themselves or friends and
family members.
(Adapted from Gill, 2010)

7
The Negative Effects Caused by Shoplifting
Our society’s views of domestic crime have shifted to include international terrorism
after 9/11. However, both before and after 9/11, the most costly crimes1 in the U.S. were
employee theft and shoplifting (Langton and Hollinger, 2005). Although shoplifting is
generally regarded as a minor crime, it consistently ranks as a very costly property crime.
In 2011, shoplifting accounted for an estimated $51 billion in retail loss. (Bamfield,
2012). It is also a very common crime, with approximately one in 11 people regularly
stealing merchandise from retailers (Blanco et al., 2008). It is also relatively easy to
commit shoplifting without being caught, in comparison to other crimes. Roughly one in
150 shoplifting incidents leads to an arrest and police action (Farrington, 1999).
There are several ways in which shoplifting can cause problems. First, shoplifting costs
stores, manufacturers and consumers. Second, the criminal justice system must budget for
prosecuting shoplifters from arrest to court and through to corrections. Third, shoplifting
creates a host of other tangible and intangible costs to society. For example, shoplifting is
often considered a “gateway crime” for which juveniles commit and graduate to more
serious crimes. Prolific burglars often refer to it as a “fallback crime” when burglary is
impractical, but needing to steal to carry on (Schneider 2005; Sutton, 2010). Finally,
there is a link between shoplifting and drug abuse – it is widely recognized that drug
addicts shoplift to obtain merchandise – to sell or trade – to further their drug habits.
1 These crimes are measured in terms of US Dollars lost per year.

8
Shoplifting is a costly crime to consumers – stores must raise prices of products that are
stolen to offset their losses. Shoplifting is also costly to the criminal justice system since
it is largely a non-violent crime and is one of the most common petty crimes. The losses
suffered by retailers are the most visible problem caused by shoplifting. Clarke (2003)
states, “[Shoplifting] can seriously erode profits and result in store closures. This can
depress employment prospects and further erode the amenities in such neighborhoods”
(3). In addition to the enormous negative financial impacts of shoplifting on both
employees and consumers, there are tangible and intangible costs. These costs include
reduced staff morale, loss of work because of physical and psychological damage, and
even loss of life (Geason and Wilson, 1992).
Types of Shoplifters
Clarke and Petrossian (In Press) identify three main offender groups responsible for
shoplifting: These include: 1) opportunistic or petty thieves (i.e., amateurs); 2) more
determined thieves (i.e., professionals); and 3) organized groups (ORC groups)
These three distinct offender groups are presented in Table 1 below.
Table 1. The Main Groups of Shoplifting Offenders
Petty Thieves
These shoplifters differ little different from a store’s regular clientele. Many of them seem to believe that shoplifting harms no one except an anonymous business. Stores that attract juveniles, males in particular, are more likely to experience shoplifting and some behavioral cues have been found to be characteristic of shoplifters, such as entering the store but making no purchase and tampering with packaging. Some research has claimed to identify psychological reasons for theft, but this work has little relevance for policing strategies.
More Determined Thieves
Shoplifters who steal regularly to support a drug habit or to provide income show more evidence of planning, such as adapting clothing to facilitate thefts. They often work with lower-level fences, who dispose of the goods by selling them to higher-level fences or out of their own homes, in flea markets or taverns, on the Internet, or through gas

9
stations, bodegas, and pawnshops that they operate.
Organized Groups
Organized shoplifter groups frequently comprise immigrants (legal or not) from the Middle East, South America, or Asia, perhaps because they can sell the goods to fellow immigrants who run small businesses. They concentrate their activities in particular states including, Florida, Texas, Georgia, California, and New York. Their arrival in a city might be signaled by a spike in reports of goods being shoplifted in large quantities. Each group consists of members with distinct roles: “boosters” steal the goods; “handlers” sell the goods to fences; and others take care of transport and logistics. Boosters act either alone or in groups. They are often provided with a “fence sheet” of the items to be stolen and the quantities requested. They carry tools to remove security tags, they use foil-lined bags to defeat electronic tags, and they may use cell phones to communicate with other group members while shoplifting. They may change bar codes so merchandise registers at much lower price at checkout (“ticket switching”). They may use stolen credit cards and use the receipts to return stolen goods to the store for cash. In some cases, they may brazenly wheel carts full of merchandise out the doors to a waiting getaway van. The stolen goods may be held in rented storage units before being taken to the group’s home base. The goods are often sold to fences who clean and repackage them to look like new and who then sell them to wholesale diverters, who might mix them with legitimate goods for sale to retailers.
Source: (Clarke and Petrossian, In Press)
Organized Retail Crime Groups
Organized retail crime (ORC) groups can not only wreak havoc on a company’s entire
operating system but may also cause serious harm to store employees and shoppers if the
gangs become violent. Thieves often travel in groups that shoplift and travel together for
a living. Boosters will typically 'hit' a store (or several stores if the stores are located in a
mall) and remove thousands of dollars’ worth of merchandise in one visit, sometimes
within the span of less than 30 seconds. For example, department clothing stores will

10
start displaying their leather jackets in autumn. Shoplifting teams will scout different
stores looking for these products. As an example, a team may notice 40 leather coats on
a rack with attached security cables and consider them to be a suitable target. The
shoplifters have been known to pull a large van or truck up to the curb outside of the
store, at which point other members of the team quickly roll the entire rack of coats out of
the store and into the van. The entire act can be complete in less than 30 seconds, and the
loss of 40 top-end leather coats could cost thousands of dollars.
Professional shoplifters (i.e., boosters) are less concerned with concealment relative to
amateurs. These brazen shoplifters have been known to enter a store with nothing and
walk out with large, expensive stolen products without being noticed or questioned. For
example, hardware stores (e.g., Home Depot and Lowes) routinely report stolen lawn
mowers and tractors that may have been pushed or driven out of their stores into pickup
trucks and subsequently driven away. If stopped or questioned by store staff,
professional shoplifters may produce old or counterfeit receipts to thwart apprehension.
Groups, gangs and sometimes individuals are engaged in illegally obtaining substantial
quantities of retail merchandise through both theft and fraud as part of a criminal
enterprise. These crime rings generally consist of 'boosters,' who methodically steal
merchandise from retail stores, and fence operators, who convert the products into cash
or drugs as part of the criminal enterprise. Sophisticated criminals have discovered how
to switch the UPC bar codes on merchandise such that these products ring up differently
at checkout. This technique is commonly called 'ticket switching.' Others use stolen or

11
cloned credit cards to obtain merchandise, tamper with retail equipment (e.g., pin-pads)
or produce fictitious receipts to return unpaid products back to retail stores.
The members of organized professional shoplifting gangs have designated roles, such as
driver, lookout, picker, packer and supervisor. They use hand signals, cell phones, GPS
devices and comprehensive product lists. Tools of the trade include foil-lined shopping
bags, purses, boxes and signal jammers to defeat inventory control tags. Some criminals
will use computers to replicate fake receipts that allow them to make cash returns,
whereas others will use fake credit cards or checks to purchase gift cards and other
expensive products. Stores are targeted for gift cards using fraudulent tender or return.
In some cases, employees are recruited to ignore criminal activities or provide details
about camera or security systems. Figure 2 below displays a flow chart of how ORC
shoplifters dispose (i.e., sell) goods they have stolen and received illegally.

12
Figure 2. Stolen Product Disposal by Professional Shoplifters
(Source: National Retail Federation, 2011)
Retail Responses to Shoplifting
Despite sustained investments in retail security (e.g., uniformed guards, closed circuit
television [CCTV] cameras, plain clothes store detectives, employee training and other
loss prevention tactics), retail theft remains a substantial problem to most retailers
(Carmel-Gilfilen, 2011). Even seasoned loss prevention officers are not always able to
easily identify professional shoplifters at work. Professionals quickly move in and out of
the store and blend in well. It is much harder to catch a professional shoplifter than an
amateur shoplifter. The easiest shoplifters to detect and apprehend are amateurs who
show signs of indecision, guilt, and concern (Zalewski, 2007).

13
Loss prevention officers experience considerable stress while 'making a stop' (i.e.,
apprehending a suspect). Loss prevention officers (who are typically only armed with an
identification card and handcuffs) use cameras, walk around undercover, and perform
other duties to apprehend shoplifters. In many instances, some of the officers are in the
camera room, and others are on the sales floor. The officers in the camera room can
direct the officers on the floor with radios. The officers typically will detect and
apprehend shoplifters by employing a simple system consisting of the following steps
listed below:
1) Apprehend the suspect.
2) Identify the suspect,
3) Interview the suspect,
4) Perform paperwork
5) Report the incident to the local police and have the suspect arrested, on occasion.
For the most part, these apprehensions take place without incident and without customers
even noticing. Occasionally, shoplifters try to run or fight the officers when confronted.
An assault can present a problem. It not only puts the officer, the suspect, the people in
the vicinity, and the store itself at risk, it is also an undesirable outcome that can tarnish a
merchant’s commercial image (Budden, 2009). An assault on a store employee, while
attempting to make a lawful arrest for shoplifting, usually incurs a robbery charge for the
suspect as well.

14
It is important to note that, in most U.S. states, security officers working for merchants
have the authority to apprehend shoplifting suspects, although this authority is quite
limited and vague. Typically, the various state laws give merchants the right to
apprehend shoplifters, recover the stolen merchandise, process the suspect (i.e., fill out
paperwork and note their identification), and release or summon the police for an arrest.
Most merchants are able to serve them with a civil restitution demand (in New Jersey this
usually is in the form of $150 payable to the store), and then turn the suspect over to the
local police department. All of these steps must be followed in a professional and
reasonable manner, or the officers and the store could be exposed to civil lawsuits.
The decision to prosecute apprehended shoplifters varies by the store. Hollinger and
Davis (2002) conducted a national survey showing that retailers prosecute approximately
24% of all of the shoplifters that they apprehend. In many of these stores, the in-store
detectives must conform to certain benchmarks when making the decision to prosecute or
release a shoplifter. For example, a store may instruct its store detectives to prosecute
only if a suspect shoplifts $50 or more. However, most stores will notify the police if the
suspect does not have proper identification, refused to cooperate or fought with the
store’s security personnel during the apprehension process. The decision to notify the
police can seem somewhat arbitrary, especially if a senior store employee is involved in
the apprehension.
If suspects who do not carry stolen merchandise are stopped and if there is no physical or
video evidence implicating the suspect in criminal behavior, the merchants will face their

15
biggest and perhaps most costly problem. Once security personnel stop the person, he or
she is essentially held in a 'citizen’s arrest' situation. Most states allow citizens who are
acting in good faith to apprehend other citizens and hold them for the police. A problem
arises if these civilian loss prevention employees have no police immunities and
apprehend someone who has not shoplifted. Essentially, these employees can now be
charged with civil and criminal charges. The innocent person will eventually be released
after the mistake is known. Most merchants have an emergency strategy for this
situation. The manager of the store will generally extend an apology and frequently give
the person free store credit for their troubles. Loss prevention and operational store
managers believe that doing so can quickly calm the person down such that they do not
file criminal and/or civil charges against the store and the involved employees.
When a victimized customer files charges of wrongful arrest, his or her actions can have
serious effects on the merchant and employees involved in the incident. The victim can
report the incident to the local police, who can then charge the LP employees with
various crimes, such as criminal restraint, kidnapping, assault, and harassment (Elliot,
2002). Furthermore, the attorneys of these victims have been known to recover millions
of dollars in civil court decisions or settlements. This little-known fact regarding the loss
prevention business causes retailers to hesitate occasionally when considering stopping a
suspected shoplifter. As a result, shoplifters can operate more easily.
Some companies have excellent loss prevention officers and routinely recover hundreds
of thousands of dollars in stolen property every year. However, only one 'bad stop' (i.e.,

16
wrongful apprehension) can negate the positive work performed by these officers. Some
companies that have had to address these problems with a heightened frequency have
changed their apprehension policies accordingly. Some companies stop apprehending
shoplifters and focus on observing, detecting, and deterring shoplifters. This questionable
tactic requires the shoplifter to drop the merchandise based only on the fact that the
shoplifter knows that he or she is being watched but not approached.
Other merchants have changed their apprehension policies to ensure that apprehended
suspects are, in fact, guilty of shoplifting. Simple methods and checklists are used by
store employees to ensure as much as possible that an apprehension will result in the
discovery of stolen merchandise on the suspect. Most large-business merchants require
their loss prevention employees to use a tool termed the five steps2. These steps are listed
below. Employees will, almost without exception, have to meet all of these steps before
they are permitted to apprehend a suspect:
1) See the suspect enter the store.
2) Observe the suspect select merchandise from the sales rack, floor or showroom.
3) Observe the suspect conceal the product.
4) Maintain unbroken surveillance on the suspect.
5) Observe the suspect pass all points of sale and exit the store without making payment
for the product.
2 Source: Anonymous retail corporation policies and procedures, 2011

17
Law Enforcement Responses and Official Sanctions
Both the laws and penalties related to shoplifting vary. First-time shoplifters may receive
sanctions, such as jail time, community service, or a fine. Some local jurisdictions have
ordinances in place to downgrade shoplifting to a non-criminal petty offense. This fact
has led some researchers to suggest that policymakers and police departments should
elevate the importance of the crime of shoplifting (Schneider, 2005). However, similar to
police executives, policymakers sometimes believe that retailers are responsible for being
vigilant of crimes in their own place of business. When responding to complaints from
concerned retailers, some police departments have indicated that retailers have not
sufficiently involved the police (Schneider, 2005). In fact, because corporate retailers
have performed little to engage law enforcement, the police seem to be content with
letting businesses deal with their own crime problems (Gill & Clarke, 2012).
It is important to understand whether official sanctions deter shoplifters from
recidivating. In Cameron’s article (1964), she concluded from her research that few of
the nonprofessional shoplifters (i.e., 2% of the females, 6% of the males) continued to
shoplift following an apprehension. She reasoned that because this group is not
integrated into supportive criminal subcultures and do not think of themselves as thieves
prior to their apprehension, the shock and shame of the experience of being caught in
such an act is frequently sufficient to deter future shoplifting behavior.
Cohen and Stark (1973) reached the same conclusion when they found only 3 repeat
offenders among 371 apprehended shoplifters in the files of a major private security

18
company. A host of other investigators in the field have supported this view (Arboleda-
Florez et al., 1977; Kallis and Dinoo, 1985; Kraut, 1976). In contrast, based on self-
report data from 1,189 youth, Klemke (1978) found that 40% of those apprehended by
store personnel and 54% of those apprehended by parents continued to shoplift. Among
those youth who experienced police intervention, 48% continued to shoplift. Klemke
reported that this much higher rate of continued shoplifting is due to the use of the self-
report method.
Gold (1969) reported similar findings after using this method of investigation. In fact,
both studies revealed that the rates of subsequent delinquency for apprehended youth
were higher than those of a matching sample of non-apprehended delinquents. Klemke
(1978, 1992) also notes that apprehended youth were more likely to identify with the
delinquent persona. However, this tendency may reflect a pre-existing identity that
supports rather than results from the apprehension and continued criminal involvement.
Moreover, these self-report studies revealed that simply getting caught (and not
necessarily arrested) was an effective means of stopping roughly half of the teenage
shoplifters from repeating this activity (Gold, 1969; Klemke, 1978).
A large proportion of apprehended shoplifters are never formally charged (Lundman,
1978; Murphy, 1986). Adams and Cutshall (1984) specifically examined how shoplifters
were dealt with following their arrest. Their analysis of 745 cases from the District of
Columbia revealed that arrested shoplifters were most likely to have their cases dismissed
when they had no or only one prior arrest. The somewhat less predictive factors were

19
gender and race: females and Caucasians were more likely to have their cases dismissed.
Davis, Lundman, and Martinez (1991) found differences in the manner in which a large
mall store handled apprehended shoplifters. The analysis revealed that shoplifters were
more likely to be arrested when they had stolen expensive products, resisted
apprehension, had no local addresses, or lived in less affluent neighborhoods. The more
affluent shoplifters were sent through the civil recovery process because they were likely
to pay the civil penalty, whereas the less affluent were sent into the criminal justice
system.
Sherman and Gartin (1986) cooperated with the Detroit police department and nine
branches of a department store to examine the recidivism rates of apprehended shoplifters
who were either arrested or released. The researchers found that 5.7% of the arrested
shoplifters were rearrested for shoplifting and that 5.9% of the released shoplifters were
rearrested in the 6-month period after their apprehension. These researchers concluded
that being arrested did not provide a significant deterrent effect to the apprehension
experience.
Overall, the existing research has shown that within a generally short time frame (i.e., 6
months to 1 year), 1 to 6% of apprehended shoplifters will be apprehended for this crime
again, regardless of whether they were arrested for this crime. The shoplifting rate for
those who were not apprehended and continue to engage in this behavior is considered to
be much higher. It appears likely that there is much variability between stores and
judicial districts with regard to who is apprehended, arrested, and convicted for

20
shoplifting. Legalistic factors, such as prior arrests and the seriousness of the offense, are
considered to have the greatest weight in this arena (Adams & Cutshall, 1984; Cohen &
Stark, 1974; Klemke, 1992). The stores and judicial districts also vary with respect to the
treatment of the convicted shoplifter.
Measuring Shoplifting
The sources that provide the official U.S. crime statistics are generally inadequate
measures of the total number of shoplifting incidents. The National Crime Victimization
Survey (NCVS) only records larceny-thefts against persons. Because larceny-thefts from
organizations are excluded from the survey, it ignores shoplifting. The FBI’s Uniform
Crime Reports (UCR) are based on police measures of crime. Shoplifting is grouped
under larceny-theft as a Part II crime, but it can be analyzed separately. However, Part II
crimes are recorded only if the arrestee has been formally charged with a crime because
individual states may have varying definitions of these crimes (Maxfield & Babbie,
2001). Another source of error is created by the hierarchy rule used by police agencies.
This rule counts only the most serious crimes (out of the crimes committed in one
incident) in the UCR.
Apprehension data from store security can be even more problematic because only a
small fraction of shoplifters are turned over to the police, and even smaller percentages
are formally charged (Klemke, 1992). The detection and apprehension of suspected
shoplifters is the responsibility of the retail store’s security personnel because police
officers generally do not have the jurisdiction to patrol private property. If retail store
21
requests police services, officers are dispatched to that location to either arrest or issue a
summons to the suspect. Such crimes are not considered to be as serious as those against
private citizens; however, processing of a shoplifter still requires a substantial amount of
paperwork if an arrest is made. Subsequently, “officers often choose to issue a warning
or downgrade the formal charge when possible” (Dabney et al., 2004). Therefore, many
calls for service in shoplifting incidents may never materialize into a recorded incident or
a criminal prosecution.
Shoplifting losses tend to be bundled with other types of losses when stores calculate
their 'shrinkage' rates. Most people in the loss prevention field broadly define shrinkage
as unexplained losses of physical inventory (Masuda, 1992). More precisely, shrinkage
is the financial cost of the merchandise lost because of a combination of deviant events
(principally employee theft, shoplifting, administrative error and vendor fraud), which are
reported as a percentage of gross sales (Langton and Hollinger, 2005). Because the
calculation of shrinkage requires one to physically count every piece of merchandise in a
store, many retailers opt to perform full inventories only once or twice per year.
It is difficult to disaggregate the true amount of shoplifting from the overall shrinkage.
Beck (2004) reported that approximately two-thirds of shrinkage occurs at the end of the
retail supply chain (i.e., in-store). Beck proposed that the majority of shrinkage occurs in
stores because customers and thieves can handle merchandise first-hand in stores.
Surveys of retail executives reveal that they are unable to accurately determine the
proportion of missing inventory that is directly attributed to shoplifting; the best estimate

22
is that it accounts for approximately 40% of the total shrinkage (Dabney et al., 2004;
Hollinger and Davis, 2002).
Counting items in the inventory is one of the oldest and most useful shoplifting
measurement techniques (Farrington et al., 1993, 1999). However, physically counting
items by hand is time-consuming and costly. Recently, technology has permitted a more
valid and reliable estimation of store theft. Many stores perform inventory 'spot' checks.
The store providing the data for this research employs workers to systematically count
and perform repeat counts of specific products. These checks, which are performed by
employees using handheld scanners, can provide more valid shoplifting estimates3 than
traditional inventories. These data are available to store staff on a regular basis (e.g.,
several times per day) for the number of products sold, damaged, or stolen.
Policymakers address shoplifting in unique ways in that the laws and rules regarding
shoplifting are determined by each individual state and by local jurisdictions.
Furthermore, store employees may detect, apprehend, process, interview and demand
civil restitution from the shoplifter before a police officer arrives on the scene4. Police
officers respond to the call and then arrest and process the suspect before completing a
3 It is a common belief in retail loss prevention that these checks provide better estimates of shoplifting frequency than estimates based on shrinkage (i.e., all of the losses incurred by the store). 4 This fact is generally true. However, some stores may employ off-duty police officers as additional security. These officers have the authority to make arrests at their own discretion.

23
great deal of paperwork5. Police officers generally regard shoplifting arrests as mundane
and time-consuming. Line police officers are generally more concerned with their
performance indicators, which are mostly composed of self-initiated activities and arrests
(e.g., foiling a burglary and arresting a suspect).6 Another problem is the amount of time
that is required for an officer to fill out reports on shoplifting arrests and investigations.
The paperwork to be completed by a police officer in a shoplifting case often consumes
more time than is required for many 'more serious' crimes (e.g., felony drug possession,
domestic violence, and grand theft auto). 7
Shoplifting of Fast-Moving Consumer Goods
FMCG were selected as the unit of analysis because of their high level of theft for resale
purposes. FMCGs (i.e., consumer packaged products) are products that are sold quickly
and at a relatively low cost. Although the absolute profits made on FMCG products are
relatively small, these products generally sell in large quantities such that the cumulative
profits made on these products can be large (Majumdar, 2004). Examples of FMCGs
include non-durable products, such as food and drinks, as well as durable products, such
as batteries and toiletries. These products are commonly found at grocery and drug stores.
This research will omit perishable FMCGs (i.e., non-durable products) from the sample
5 If the police respond to a store that has a shoplifter in custody, the police will almost always make an arrest. Depending on the jurisdiction, the suspect can be released with a citation or transported to the police headquarters for processing. 6 This information is based on the candidate’s training and experience as a former patrol officer in New Jersey. 7 This information is based on personal conversations (February, 2011) with unnamed state and local police executives.

24
because of their relatively low theft rates and the apparent absence of illicit markets
dealing in perishable food products8.
Of all the different types of products that can be shoplifted, products known as fast
moving consumer goods (FMCG) have received little attention. These products are
generally lower-priced and are consumed in large quantities frequently by most people.
Although these products are relatively inexpensive, they are more purchased and
shoplifted than any other products because of their nature – consumers must purchase and
replenish these products on a regular basis (e.g. daily, weekly, etc.). Examples of FMCG
include: toothpaste, razors, vitamins, deodorants, cosmetics and food. Their total dollar
values of sales and theft easily surpass other, less-frequently purchased products (i.e.,
very likely all other possible categories of products).
Although a significant number of studies have examined shoplifting, little has been
written on the subject of FMCG theft (Gill and Clarke, 2012). This finding is surprising
considering that the annual global losses related to FMCG theft have been estimated to be
more than (U.S.) $56 billion9 (Gill and Clarke, 2012). Although some research has
investigated illicit markets that carry FMCGs (e.g., Stevenson and Forsythe, 1998; Sutton
et al., 1998), scholars have only recently proposed the need to understand shoplifters’
preferences for FMCGs. This is especially of interest when disposal of products is their
ultimate goal (Gill and Clarke, 2012). 8 Based on the information obtained from conversations between the candidate and several law enforcement and loss prevention executives from major retailers. 9 These data are based on figures from 2003.

25
Shoplifting and Drug Abuse
Drug abusers commit a significant amount of theft. Almost a third of thieves arrested in
the U.K. are heroin or cocaine users (Bennett et al., 2001; Sutton, 2010). Often, thieves
are driven to steal to further their drug habits. They may commit robbery, burglary or
shoplifting to obtain items or cash to feed their drug habits. What is stolen depends on
characteristics of the target, type of theft, motive and resources of the thief (Clarke,
1999). Property crimes like burglary and shoplifting are often crimes of choice for the
drug abuser. Thus, shoplifting can be said to fuel the drug trade, as it provides the income
some addicts need to trade or buy illegal drugs.
Shoplifting is often preferred by drug users and addicts since it has relatively less risk of
detection and sanctions, as well as often being overlooked as a minor theft, compared to
burglary or robbery. Further, shoplifting is sometimes considered the next best option to
other “more serious” crimes like burglary or robbery. Prolific burglars often refer to it as
a “fallback crime” when needing to steal to further their drug habits (Schneider 2005;
Sutton, 2010). Individuals will steal products and sell or exchange them to obtain drugs.
But many of products themselves can be abused directly for drug purposes, serving some
function in drug abuse and can even provide the ‘high’ which drug users seek.
The Special Problem of Shoplifted Products with Roles in Illicit Drug Use
The abuse of harmful legal products, including inhaling or ingesting everyday household
products and over-the-counter (OTC) drugs, constitutes a growing health problem for
American society (Crouch et al., 2005; Johnston et al., 2010). The abuse of OTC drugs,

26
in particular, is also recognized as a growing international problem (Lessenger and
Feinberg, 2008; Conca and Worthen, 2011). Research also indicates a decrease in illicit
drug use while rates of legal drug abuse have risen (Johnston et al., 2010). Some people,
seeking cheap “highs,” have discovered that by purposely overdosing certain OTC drugs
they can achieve cheap highs. Further, harmful legal household products are often the
first category of substances to be abused by adolescents and thus can constitute a gateway
drug (Anderson and Loomis, 2003). The recreational abuse of OTC medications and
other products is a serious, growing global health problem that causes significant
morbidity and mortality, especially in younger individuals (Conca and Worthen, 2012).
This dissertation is believed to be the first study that considers differential theft rates of
commonly abused products. This study also finds some evidence of higher theft rates of
products having roles or functions in drug abuse (Smith, 2013).
Chapter Summary
By several accounts, shoplifting is a costly crime to the United States, as well as other
countries. And, almost without exception, most of these governments continue to view
shoplifting as a minor crime or even a rite of passage through adolescence. Yet, there are
many companies taking the problem on themselves with or without government
assistance. Many of these approaches deal with deterring thieves from shoplifting by
altering the environment. Perhaps most importantly, stores and manufacturers have been
designing products with crime in mind. Focusing on target-hardening of these products is
addressed in the following chapter, which provides the theoretical framework for

27
analyzing shoplifting data. This chapter also summarizes the results of an analysis to
understand what relationship, if any, exists between products with illicit drug roles and
theft variation. Based on the premise that many forms of theft are driven by drug use and
abuse, the study seeks understand if some products are stolen for their own abuse
properties.

28
CHAPTER 2. THEORETICAL FRAMEWORK This chapter establishes the theoretical background for understanding why certain
products are preferred targets of theft. The chapter begins with an overview of
environmental criminology and then describes Rational Choice Theory (Clarke and
Cornish, 1985; Cornish and Clarke, 1986) and Routine Activity Theory (Cohen and
Felson, 1979; Felson, 1995). Both theories offer explanations of the criminal event itself
and, to a lesser extent, the criminality of the perpetrator. CRAVED (Clarke, 1999), a
mnemonic designed to analyze theft choices, is then described. Finally, AT CUT
PRICES (Gill and Clarke, 2012), an acronym that is a CRAVED-derived approach to
understanding theft choices based strictly on disposability, is illustrated.
Environmental and Situational Explanations of Theft
Although traditional theories of crime and criminality tend to focus on why people
commit crimes, environmental criminology focuses on the criminal environment and
situation at the time of the incident. Thus, theories falling under environmental
criminology (e.g., Routine Activity Theory, Rational Choice Theory) analyze the crime
event itself and place less emphasis on the criminal. However, the proponents of these
perspectives do not discount the value of determining the drivers of criminal behavior.
Rather, pragmatic approaches to prevent the opportunities to perform specific types of
crimes are developed. It is also important to note that environmental criminology
theories assume that people can be motivated to commit crimes based on opportunities
and other environmental factors at a specific moment in time.

29
Shoplifting is a crime that is perhaps best understood through the lens of environmental
criminology, but few studies have described how the environment can alter potential
shoplifters’ decision-making processes. Even fewer studies have addressed the target-
hardening of specific products in stores to prevent shoplifting (e.g., Brookson et al., 2007;
Burrows, 1988; Clarke, 1999, 2003; DiLonardo, 1997; DiLonardo and Clarke, 1996;
Ekblom, 1986, 2005; Farrington, 1999; Handford, 1994; Hayes, 1993, 2005; Hayes et al.,
2006; Hayes et al., 2011; Lindblom et al., 2011; Walsh, 1978; Wyld et al., 2009).
Because shoplifters tend to select certain products to steal, it seems logical to identify
these types of products and to design measures that defend these specific products from
theft.
The environmental approach to crime is not a new idea. Although traditional or
deterministic theories have dominated criminology for the last century, classical theory
did so before the last century. Deterrence theory reflects the ideas of classical theory:
people are rational and choose to engage in crime if they believe doing so is to their
advantage. In the 1980s and 1990s, scholars once again became interested in thinking
about crime in these terms (mainly after Rational Choice Theory and Routine Activity
Theory were introduced). These theories quickly gained popularity, in part because of
their simplicity and ability to effectively diagnose crime-related problems. At present, the
following theories are considered to fall under environmental criminology: Rational
Choice Theory, Routine Activity Theory, Crime Pattern Theory and Lifestyle theory.
Rational Choice Theory and Routine Activity Theory are further discussed to illustrate
the conceptualization of this research.

30
Routine Activity Theory
Cohen and Felson’s (1979) Routine Activity Theory addresses the factors that influence
the range of choices available to potential offenders. Because Routine Activity Theory
views crime as a single event in time, offenders choose from the choices available to
them at that time. Felson (1986) states that, “people make choices, but they cannot
choose the choices available to them” (119).
According to Routine Activity Theory, three elements must come together at a moment in
time for a crime to occur. These elements are a motivated offender, a suitable target and
the absence of a capable guardian. Similar to Rational Choice Theory, Routine Activity
Theory assumes that there are always motivated offenders willing to engage in criminal
behavior if the right opportunity arises. Therefore, variations in crime are explained by
variations in opportunities (i.e., the supply of suitable targets and absence of capable
guardians). According to Cohen and Felson (1979), the supply of suitable targets and the
presence of capable guardians naturally occur as part of everyday routine activities.
Thus, variations in time and space can influence crime rates. According to Wiles and
Costello (2000), many studies have confirmed that potential offenders often indirectly
survey potential targets and guardians as part of their everyday routines.
This theory was originally applied to direct-contact predatory offenses but has since been
extended to a broad range of crimes (Felson, 1998, 2001). This approach to crime has
benefited practical crime prevention applications by altering situations to render crime

31
less attractive to potential offenders. To do so, practitioners must identify and alter the
availability of suitable targets and enhance the guardianship of potential criminals.
Routine Activity Theory is beneficial for those attempting to understand and prevent
shoplifting. Cohen and Felson (1979) argue that increases in the production and
availability of lightweight durable products (e.g., FMCGs) have accounted for the rise in
crimes such as shoplifting over the past fifty years. In addition, Cohen and Felson (1979)
contend that the trend of people spending more time away from their homes has created a
“modern society [that] invites high crime rates by offering a multitude of illegal
opportunities” (911). This argument has been supported by researchers who have found
that potential offenders are attracted to products that are expensive, transportable,
disposable and difficult to identify (Kock et al., 1997; Van Hofer and Tham, 2000). As a
result, researchers have stressed that manufacturers of top-selling products, such as
FMCGs, should identify which products are most at risk of being stolen and alter their
designs to reduce their desirability (Clarke, 1999, 2000; Clarke et al., 2001).
Rational Choice Theory
Building on classical and deterrence theories, Clarke and Cornish (1985, 1986) developed
Rational Choice Theory in the mid-1980s. Since then, it has come to have a major
impact on efforts to understand and control crime. Taking care to not assume that people
are perfectly rational, the theory assumes that offenders seek to benefit themselves by
engaging in criminal behavior if the right circumstances exist (Cullen and Agnew, 2003).
Cornish and Clarke write, “This involves the making of decisions and of choices,
however rudimentary on occasion these processes might be; and that these processes
32
exhibit a measure of rationality, albeit constrained by limits of time and ability and the
availability of relevant information” (Cornish and Clarke, 1986: 1).
Whereas classical and deterrence theories assume that the costs of crime are largely a
function of formal sanctions, Clarke and Cornish state that a variety of individual and
social factors influence the individual’s estimate of the benefits and costs of crime.
Subsequently, the costs of crime include both formal and informal sanctions and moral
costs (e.g., the guilt that one may experience from breaking the law). Therefore, Rational
Choice Theory appears to be much broader than classical and deterrence theories (Cullen
and Agnew, 2003).
According to Rational Choice Theory, two components comprise the decision-making
process of potential offenders. First, a potential offender decides to commit a particular
offense. The potential offender makes this decision based on a number of factors, but the
short-term and long-term benefits and consequences are central to the rational choice
perspective. Second, potential offenders make event decisions based on specific
situational factors. These decisions are the 'choice structuring properties' of different
crimes (Cornish and Clarke, 1987). Thus, choice structuring properties affect decision-
making based on properties such as rewards, risks, personal enjoyment, and possible
obstructions.
A number of factors impact an offender’s ability to make critical decisions. Thought
processes may vary from highly rational and careful to little more than opportunistic

33
thinking. Any criminal act can lead to a number of possible rewards and risks that an
offender may fail to consider. As stated earlier, not all offenders will be perfectly
rational when making decisions. Simon’s (1955, 1979, 1982) concept of 'bounded
rationality' may explain this idea best. Offenders often make decisions that are designed
to meet their own specific needs while expending the least amount of effort.
Although some critics have argued that Rational Choice Theory does not adequately
address the causes of crime and criminality, proponents of the theory disagree. For
example, Clarke and Harris (1992) argue that, “a much more serious effort must be made
to extend criminological [theorizing] beyond the roots of criminality to encompass the
choices made by offenders and the situational and environmental contexts that influence
their decisions” (40). Subsequently, since Rational Choice Theory was introduced
twenty-five years ago, countless researchers and policymakers alike have used the
perspective to more clearly identify and understand the nature of crime. One could
deduce the success of the theory in crime analysis simply by observing that Clarke has
become one of the most commonly cited authors in modern criminological journals
(Cohn and Farrington, 1999).
Rational Choice Theory seems to be a very pragmatic way at looking at why shoplifters
choose to commit the offense. The chances of getting caught are quite low, and the risks
of severe punishment are very small, that most researchers believe shoplifters pay little
attention to the possible costs of their offenses (Bamfield, 1997; Burrows, 1988; Clarke,
2003)

34
“Hot Products” and the CRAVED Model
At the introduction of Routine Activity Theory, Cohen and Felson created an approach
for studying suitable targets (1979). To determine a target’s vulnerability, the researchers
created the acronym VIVA. VIVA refers to the target’s attributes: value, inertia,
visibility and accessibility. Value depends on the specific offender who assesses the
target and does not depend on the actual economic worth of the target. Inertia refers to
the size of the target and the offender’s ability to remove that target. Visibility refers to
the offender’s awareness of the target. Accessibility refers to the offender’s ability to
access the target and retreat or escape after stealing the target.
Although VIVA is useful, it makes no distinction in terms of the target, which could be
an object or a person. VIVA did not include the motivational factors and the target
characteristics related to the concealment or disposability of the target products.
However, Felson has stated that VIVA was initially formulated as a brief concept and
was not intended to be the final authority on crime explanation10. This definition left
room for a more detailed formulation of the attributes of suitable theft targets.
Clarke’s (1999) study of “hot products” reformulated and refined VIVA. Studies on hot
products analyze the variation in theft to understand why some products are stolen at
much higher frequencies than other products. For example, FMCGs such as alcohol,
cigarettes, beauty products, and contraceptives are shoplifted from stores in much higher
quantities than other products (Clarke, 1999). Knowing why these products are
10 This information is based on personal conversation between the candidate and Felson.

35
specifically targeted by thieves can provide preventive solutions to help reduce their
theft. Similar to other hot products, FMCGs are stolen and sold at a high rate and
demonstrate the variation in theft mentioned above. Clarke’s (1999) study resulted in the
formulation of CRAVED, which incorporates and advances the characteristics of VIVA.
The CRAVED model advances the 'suitable target' concept (Cohen and Felson, 1979) by
helping to explain the variation in the theft of 'hot products' (Clarke, 1999). Therefore,
the products that are most at risk for theft will also be concealable, removable, available,
valuable, enjoyable and disposable. Table 2.1 displays the six attributes of CRAVED and
their respective definition
36
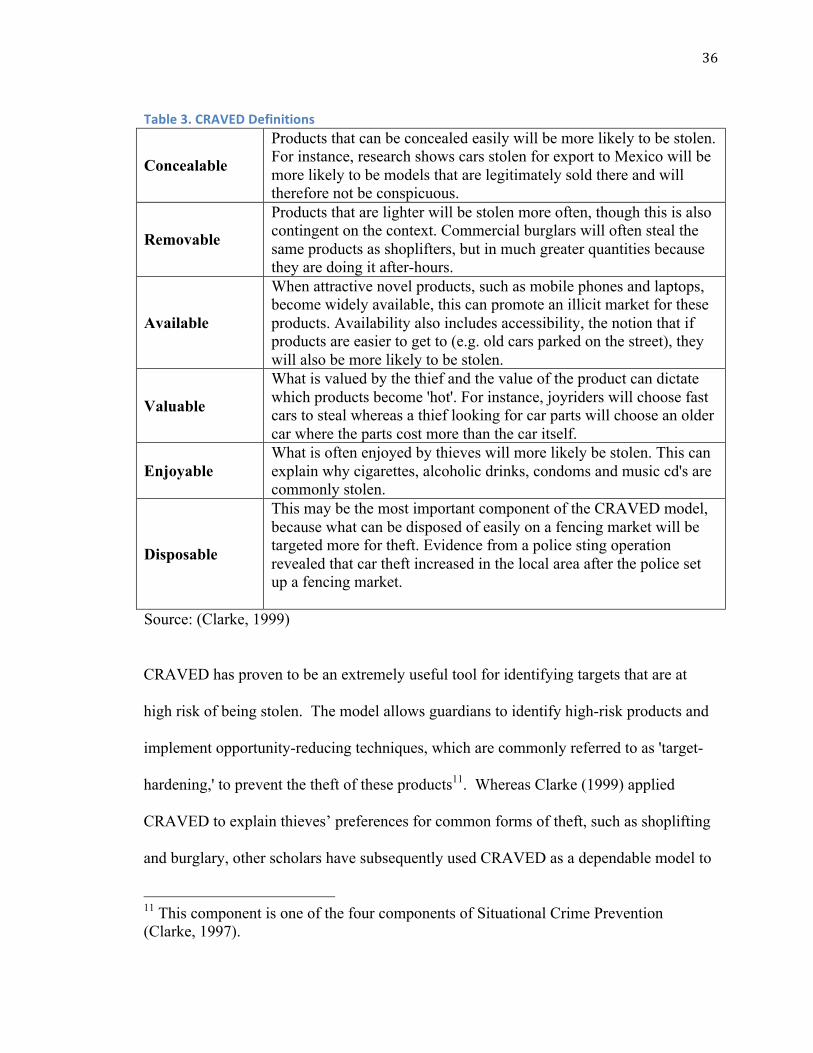
Table 3. CRAVED Definitions
Concealable
Products that can be concealed easily will be more likely to be stolen. For instance, research shows cars stolen for export to Mexico will be more likely to be models that are legitimately sold there and will therefore not be conspicuous.
Removable
Products that are lighter will be stolen more often, though this is also contingent on the context. Commercial burglars will often steal the same products as shoplifters, but in much greater quantities because they are doing it after-hours.
Available
When attractive novel products, such as mobile phones and laptops, become widely available, this can promote an illicit market for these products. Availability also includes accessibility, the notion that if products are easier to get to (e.g. old cars parked on the street), they will also be more likely to be stolen.
Valuable
What is valued by the thief and the value of the product can dictate which products become 'hot'. For instance, joyriders will choose fast cars to steal whereas a thief looking for car parts will choose an older car where the parts cost more than the car itself.
Enjoyable What is often enjoyed by thieves will more likely be stolen. This can explain why cigarettes, alcoholic drinks, condoms and music cd's are commonly stolen.
Disposable
This may be the most important component of the CRAVED model, because what can be disposed of easily on a fencing market will be targeted more for theft. Evidence from a police sting operation revealed that car theft increased in the local area after the police set up a fencing market.
Source: (Clarke, 1999)
CRAVED has proven to be an extremely useful tool for identifying targets that are at
high risk of being stolen. The model allows guardians to identify high-risk products and
implement opportunity-reducing techniques, which are commonly referred to as 'target-
hardening,' to prevent the theft of these products11. Whereas Clarke (1999) applied
CRAVED to explain thieves’ preferences for common forms of theft, such as shoplifting
and burglary, other scholars have subsequently used CRAVED as a dependable model to
11 This component is one of the four components of Situational Crime Prevention (Clarke, 1997).

37
explain other forms of crime. The CRAVED model has been used as a tool to help
explain variations in timber theft in the Appalachian Mountains (Baker, 2003), stolen
products in pawn shops (Fass and Francis, 2004), bag theft in licensed premises (Smith et
al., 2006; Sidebottom and Bowers 2010), cell phone theft (Whitehead et al., 2008),
domestic violence (Wellsmith and Burrell, 2005), and wildlife crimes, such as poaching
(Pires and Clarke, 2011).
Table 4. AT CUT PRICES Definitions Attribute Definition
Affordable
Products sell best in illicit markets if the offer price is within the ready means of the likely buyers. Typically, these products are sold at a discount. Products are most affordable if their costs are low. The shoplifter who steals for resale purposes knows that all people shopping at illegal markets and flea markets must pay with cash. Therefore, the cost of the stolen product must be equal to or less than the amount of cash that a buyer has at that moment for a sale to occur. These markets typically discount a product by one-quarter or even one-half of the original retail prices. Grocery store products that are likely to be sold on the black market are most likely to be FMCGs, which generally have low values. If the product is to be traded for another, the same principle typically applies.
Transportable
Products are more disposable if they allow the sellers to always have the products at hand when a potential buyer appears. More portable products are easier to move and sell in different locations. Products stolen by professional shoplifters or organized retail crime groups are typically collected and sold on the black market. These products then have to be transported to a market. Common sense tells us that the more products that can be brought to a market, the greater the profit that can be earned. Therefore, the size and weight of the products is a tangible consideration when transporting products to markets. For FMCGs, most products tend to be smaller in size. Therefore, weight but not space is usually the primary logistical concern for transporters of stolen products.
Concealable
Products that are less bulky and that can be hidden easily are more attractive to thieves, potentially because there is less risk in stealing them. Shoplifters are more likely to steal products that can be easily concealed in their clothing, purses, or shopping bags. Smaller products are much easier to shoplift. Sometimes smaller products can be heavy, making them harder to conceal.
Untraceable Buyers of products that do not have unique serial numbers are easier to find. With the exception of a few products, FMCGs do not have

38
individual identifying serial numbers. Manufacturers usually do not assign individual serial numbers to low-valued products because of their low value. Nevertheless, some products (even those of low value) have unique serial numbers printed or branded on the products.
Tradeable
Disposability is enhanced if the products are tradeable (i.e., if they can be exchanged for other products, such as drugs, rather than for cash). Shoplifters who steal to support their drug habits comprise a significant portion of the shoplifters who trade their stolen products. Most organized retail crime groups and professional shoplifters steal strictly for resale purposes. Therefore, we must also consider which products are most at risk of theft by drug-addicted shoplifters. The 'hot product' literature indicates that these shoplifters opt to steal the more expensive, most in-demand hot products.
Profitable
Products must be valued and sold at certain prices such that shoplifters, handlers and sellers can all make ample profits. The products that are most profitable to licit markets are similarly profitable at illicit markets. The most profitable products are determined by their gross margins (i.e., mark up from the base price).
Reputable
The products that are well-known and associated with reputable brands are most recognizable to buyers, who may then purchase them with confidence. Because those buying illicit products are sometimes concerned about buying counterfeit products, the value of these products can be greater if they are easily evaluable. Some products will be well-known brands and easily evaluable, whereas others will be generic and less well-known.
Imperishable
If products can be kept for a long time without expiring, buyers will take advantage of the low prices and buy large stocks, even if the amount bought represents many years’ worth of supply. Almost all of the products in a grocery market, including most FMCGs, have shelf lives or expiration dates. Products with longer shelf lives are more imperishable.
Consumable Products that are used up and need to be replenished or replaced by buyers are more disposable. Many of these products are used by people daily and may require constant replenishment.
Evaluable
After their theft, if products are being traded or sold to buyers, the ability of the second-hand buyer to evaluate the product. It is if a product can be handled and verified as the valid product or otherwise examined to make sure they are buying the real thing.
Shiftable
Products that are sold regularly and that are easily shifted from market to market appeal to thieves because these products help provide ongoing incomes. The more popular and in demand a product is, the easier it is for illicit sellers to shift these products to other markets and sell them elsewhere. Products are most 'shiftable' if they can be sold at different markets and continue to be in high demand. These products are fast-moving and purchased frequently.
Adapted from Gill and Clarke (2012)

39
Retail loss prevention personnel and FMCG manufacturers routinely label certain
products as high risk based on attributes synonymous with CRAVED to prevent
shoplifting. In grocery supermarkets, high-risk FMCGs are more difficult to steal
because these products have additional security features (e.g., they are kept in locked
cases, sold in plastic cases that are larger and bulkier than the product itself, and use
electronic article surveillance tags). As noted in the literature review, these tactics are
known to deter some offenders from shoplifting.
Although the CRAVED model explains crime in terms of multiple attributes, the
disposability of a product may be the most important aspect of the model. Each element
of CRAVED is important, but the frequency of theft seems to be most highly dependent
on the disposability element because thieves who make a living by selling the products
that they steal must be able to dispose of them quickly and regularly (Clarke, 1999).
This dissertation will test the measurable attributes of CRAVED. Also, to the knowledge
of the author, the unintended roles or functions that some FMCG (namely, OTC drugs)
play in illicit drug abuse will be part of the Enjoyability attribute. This will be explored
and analyzed in a separate chapter.
Coupled with the need to understand which FMCGs are in demand and which need to be
stolen to fuel the thriving illicit markets, this belief led to the development of a
disposability-only model: an offshoot of CRAVED known as AT CUT PRICES.
40
FMCG, Disposability, and the AT CUT PRICES Model
Gill and colleagues examined illicit markets for stolen FMCGs in 2004. Although the
research team mainly studied illicit FMCG markets, the team also considered the
characteristics of 'hot' FMCGs. Through this research and another study (Gill and Clarke,
2012), the 'D' (disposability) of the CRAVED model was extrapolated upon which
generated another acronym: AT CUT PRICES. The validity of the AT CUT PRICES
model has not been established. To remedy this, Gill and Clarke (2012) proposed two
research methods to test the validity of AT CUT PRICES. One method involves
interviewing shoplifters to understand their decision-making when they shoplift products
for resale purposes. The second method, which developed into a section of this research,
involves analyzing store product data to determine the theft risks of FMCGs. Because this
research is the first study conducted to test the model’s validity, each of the eleven
attributes (i.e., independent variables) required specific definitions. Furthermore, these
definitions were essential to creating coding schemes for each variable. These
disposability attributes were briefly described in two articles (Gill et al., 2004; Gill and
Clarke, 2012) and are compiled below in Table 2.2. Table 2.3 provides examples that
illustrate how AT CUT PRICES can be applied to FMCGs.

41
Table 5 AT CUT PRICES: Features, and Examples of FMCG The feature Examples of what feature
would include
Examples of what would not
be included
Affordable Batteries Computers
Transportable Cigarettes Canned food
Concealable Cosmetics VCRs
Untraceable Most FMCG Burgled household products
Tradeable CDs Few FMCG fail this test
Profitable Branded products Unbranded products
Reputable Viagra Generic Viagra
Imperishable Razor blade cartridges Fresh meat
Consumable Pain relievers CDs and DVDs
Evaluable Perfumes with store stickers Opaque packages
Shiftable Bottles of spirits Foodstuffs
Source: Gill and Clarke (2012).
There is a good deal of medical and public health literature, along with substantial
anecdotal reports, which identify the common household products that serve drug abuse
functions. The current study seeks to identify those products targeted for drug abuse,
while determining how often they are shoplifted. By examining shoplifting data of

42
supermarket products, an opportunity arises to test the relationship between the products’
drug roles or functions and their theft.
Chapter Summary
This chapter covered the theories most often used to explain theft variance in shoplifting
incidents. These included environmental criminology approaches, namely rational choice
and routine activity theories. Clarke’s study of “hot products” (1999), resulting in
CRAVED – is a well-established starting point for understanding the general theft
preferences of thieves – was described in detail. Further, AT CUT PRICES – a
disposability-based offshoot of CRAVED is described in detail. Both of the mnemonics
are operationalized and tested in subsequent chapters.

43
CHAPTER 3. OVERVIEW OF RESEARCH DESIGN AND METHODOLOGY This study builds upon previous theft preference research – which is described in detail in
the previous chapter. Initially, this study set out only to test the new and hypothetical AT
CUT PRICES model of theft disposability preferences. However, the CRAVED model of
theft preferences – of which AT CUT PRICES is derived – was also tested for a
comparison between the two models. In addition to these two analyses, an exploratory
analysis was conducted, which assessed theft variation of products having roles in illicit
drug abuse. These three analyses are detailed in the three chapters following the current
one. This chapter provides an overview of the research design which includes description
of the data source and description, the dependent variable, and the design and analytic
strategies of the three analyses.
Data Source and Description
The data analyzed in this study were provided by 204 supermarkets, owned and operated
by a Fortune 500 supermarket chain in the U.S. The supermarkets are located in 4 states,
encompassing a major metropolitan market. Each of the stores are connected to a national
computer which keeps track of products sold and products lost, among other descriptive
information about the products.
Each store is equipped with standard loss prevention measures like closed-circuit
television cameras (CCTV), locked cases holding expensive items, and other security
measures. Loss prevention officers work at different stores, sometimes rotating in and out

44
of stores to be random and hopefully detect and apprehend shoplifters. The stores all had
the same products for sale and at the same price. The registers and physical layout of the
stores were very similar.
The aforementioned retail corporation maintains detailed records of “known thefts.” This
the data received provides for the total number of “known thefts” per product line per
year. The list was zero-truncated – there were no zero counts of products for a few
reasons: 1) theft data only included products which had been stolen once or more, 2) the
stores’ inventories are always changing, making it difficult to know how many products
stores possessed at any single time, and 3) every product sampled had one or more thefts
per year – including the larger population the current sample was drawn from.
The data received was one-year worth of data. There was a category of “known theft”
within the data received. To determine how many products are considered stolen (i.e.,
known theft), the company uses several methods to measure this. First, the company
differentiates losses from internal store reasons and external theft (i.e., shoplifting). These
data are compiled into a database that generates theft reports (i.e., products unaccounted
for equal known thefts) for all of the products on sale. This database provides more
validity for measurements of shoplifting than traditional reports derived from inventories,
which are often performed only once or twice a year in smaller retail stores. The number
of thefts per product per year was is not a good measure for how often a product is stolen.
Rather, a rate of theft – in this case being number of products stolen divided by the
number of products sold – is a much better proxy measure of theft.

45
Sample
There were upwards of 20,000 products sold in the stores during the study period of
2010-2011. Non-food fast-moving consumer goods were drawn from this population.
This meant that perishable food products (i.e., meat, milk) were not included in the
sample. Further, some products were not food and not FMCG (i.e., lawn chairs,
televisions) and were not sampled. The remaining sample of FMCG were non-food goods
and made up the final sample of 8,522 products. 474 products were missing one or more
data points (for inches – dimensions) and were deleted listwise. Below, Table 6
summarizes how the sample was formed through various reductions from the population.
Table 6. Method for Gathering FMCG Sample All Products 21,264
Food products removed (-)11,922 9,272
Non-FMCG removed (-)276 8,996
Products missing size data (-) 474 8,522
Research Sample 8,522
The units of analysis are for the study are individual products that match the present
research definition of FMCGs. Products may be similar in nature and seem to be the
same, especially to those differentiating among similar products that belong to the same
product line. The Gillette Mach 3 razor is a good example of this problem. The Mach 3
is one 'line' of Gillette products, and there are several products offered for sale from this
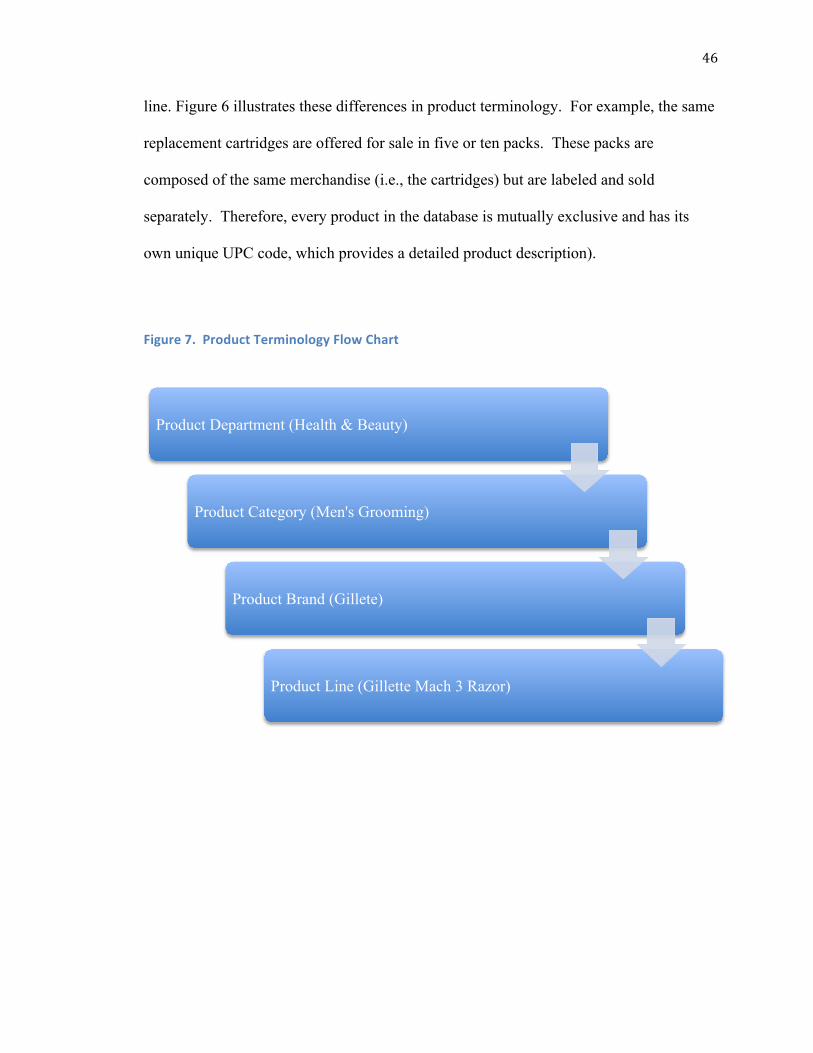
46
line. Figure 6 illustrates these differences in product terminology. For example, the same
replacement cartridges are offered for sale in five or ten packs. These packs are
composed of the same merchandise (i.e., the cartridges) but are labeled and sold
separately. Therefore, every product in the database is mutually exclusive and has its
own unique UPC code, which provides a detailed product description).
Figure 7. Product Terminology Flow Chart
Product Department (Health & Beauty)
Product Category (Men's Grooming)
Product Brand (Gillete)
Product Line (Gillette Mach 3 Razor)

47
Figure 8. Count of FMCG Stolen for 2010-‐11 Study Period (N=8,522)

48
Figure 9. Count of FMCG Sold for 2010-‐11 Study Period (N=8,522)
The distributions of “Number Lost” and “Number Sold” were both positively-skewed,
non-zero counts. Thus, there was some presence of multicollinearity and covariance
between these two variables. This was likely because the demand for goods, whether
obtained legally or illegally, were both similar. This makes sense for more consumable
goods, in that products like razor blades are purchased often and used often, are
purchased often and stolen often. Other goods may only be purchased once in a while. To
49
better understand why these two measures covary, it may be beneficial to perform further
analysis.
It is necessary to mention here, that the dependent variable first was considered to be only
the counts of “Number Lost,” but certain data limitations and concerns (see Chapter 3)
led the candidate to consider a rate as the best alternative. “Number Sold” was the only
variable that could have been used as a denominator for this rate – based on the data
made available. Further, data analysts from the company supplying these data
commented to the candidate that they routinely use the same rate (Number Stolen /
Number Sold) as a rate to better understand and make inferences concerning theft of
products.
Dependent Variable – Theft Rate
Theft rate is a proxy measure of theft and serves as the dependent variable. The rate is
calculated by dividing the total number of stolen products by the total number of sold
products. If it was known how many goods are on the shelf at all times, a perfect theft
rate could have been established. Some displays hold hundreds of one product, while
some displays may only contain five or ten of the same product. Since the total inventory
all the stores is not known, the best proxy measure for theft – which can be compared
across other products – is the number stolen divided by number sold. Table 3.1 below
displays the theft rate as the dependent variable for all analyses.
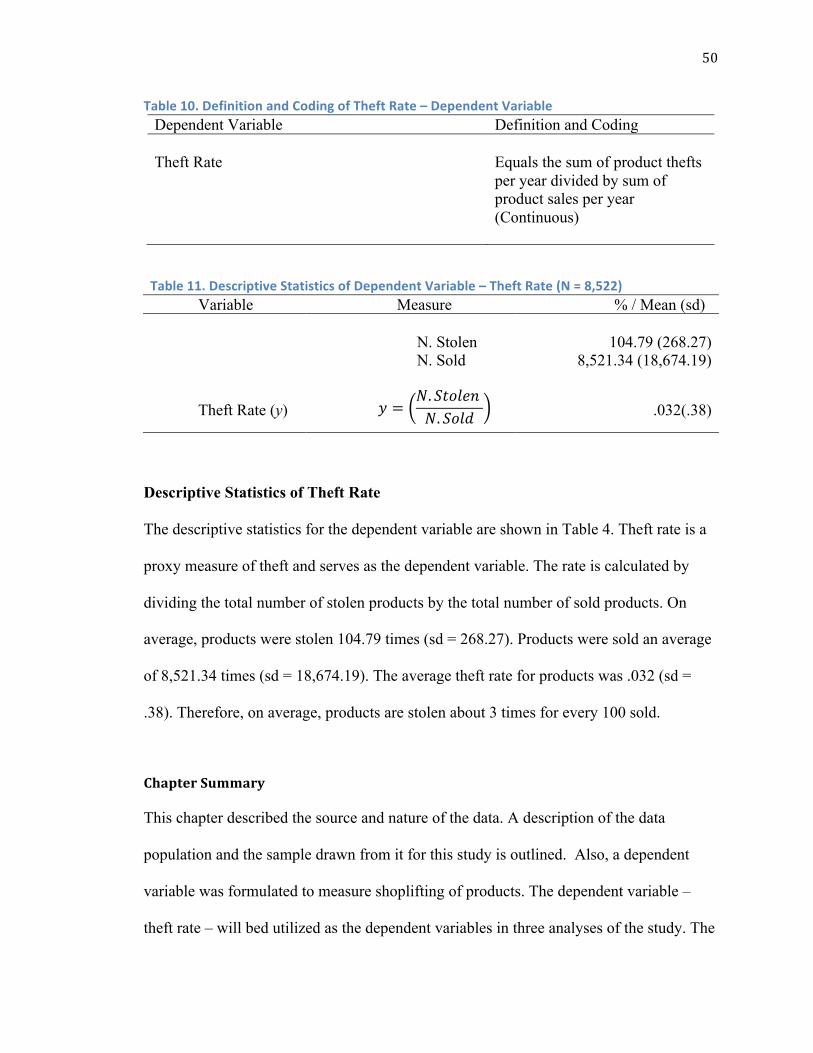
50
Table 10. Definition and Coding of Theft Rate – Dependent Variable Dependent Variable Definition and Coding Theft Rate
Equals the sum of product thefts per year divided by sum of product sales per year (Continuous)
Table 11. Descriptive Statistics of Dependent Variable – Theft Rate (N = 8,522) Variable Measure % / Mean (sd)
N. Stolen
104.79 (268.27) N. Sold 8,521.34 (18,674.19)
Theft Rate (y)
𝑦 =𝑁. 𝑆𝑡𝑜𝑙𝑒𝑛 𝑁. 𝑆𝑜𝑙𝑑
.032(.38)
Descriptive Statistics of Theft Rate
The descriptive statistics for the dependent variable are shown in Table 4. Theft rate is a
proxy measure of theft and serves as the dependent variable. The rate is calculated by
dividing the total number of stolen products by the total number of sold products. On
average, products were stolen 104.79 times (sd = 268.27). Products were sold an average
of 8,521.34 times (sd = 18,674.19). The average theft rate for products was .032 (sd =
.38). Therefore, on average, products are stolen about 3 times for every 100 sold.
Chapter Summary
This chapter described the source and nature of the data. A description of the data
population and the sample drawn from it for this study is outlined. Also, a dependent
variable was formulated to measure shoplifting of products. The dependent variable –
theft rate – will bed utilized as the dependent variables in three analyses of the study. The
51
descriptive statistics are presented in this chapter. The next three chapters incorporate the
main study of three analyses which are 1) Testing the AT CUT PRICES model; 2)
Testing the CRAVED model; and 3) Exploring the relationship between unintended
product roles in drug abuse and their theft variation.
CHAPTER 4. TESTING THE AT CUT PRICES MODEL
Overview of the Study Design
This chapter summarizes the results of the AT CUT PRICES study. The validity of the
AT CUT PRICES model has not been established before the study. To remedy this, Gill
and Clarke (2012) proposed two research methods to test the validity of AT CUT
PRICES. One method involves interviewing shoplifters to understand their decision-
making when they shoplift products for resale purposes. The second method, which
developed into this chapter and section of the study, involves analyzing store product data
to determine the theft risks of FMCGs.
Analytic Strategy
Because this research is the first study conducted to test the model’s validity, each of the
eleven attributes (i.e., independent variables) required specific definitions. Furthermore,
these definitions were essential to creating coding schemes for each variable. Below,
each of the operationalized independent variables are defined. The five measureable AT
CUT PRICES attributes of products are: Affordable, Concealable, Profitable, Reputable
and Consumable. Table 1 describes how the measures of these attributes are defined and

52
coded for further analysis. The dependent variable used in this analysis is Theft Rate,
which is described in more detail in Chapter 3. Below, the research questions and null
hypotheses for this analysis are detailed. Descriptives for the independent variables were
calculated first. Second a bivariate correlation matrix was constructed. Finally, a multiple
regression analysis was performed at the product-level for the study or shoplifted FMCG
in the target locations during 2010-2011. The data provided the number stolen and
number sold, forming a theft rate proxy measure. Theft rates of individual FMCG were
used as the unit of analysis, as a continuous dependent variable. A series of predictor
variables including were developed to test whether certain attributes of FMCG varied
affect their theft: Concealable, Profitable, Reputable and Consumable.
Research Questions and Null Hypotheses
Primary Research Question
1) What is the relationship between products with AT CUT PRICES attributes and
their rates of theft? The null hypothesis is there is no significant difference between
products with AT CUT PRICES attributes and their rate of theft.
Secondary Research Questions
2) Are products, which are more easily Concealable, stolen at higher rates?
The null hypothesis is there is no significant difference in theft rates of products that are
more Concealable than other products.
3) Are Profitable products (i.e., to the thief at resale) more likely to be stolen than
less profitable products? The null hypothesis is there is no significant difference in theft
rates of products that are more Profitable than other products.

53
4) Are well-known brands and Reputable products stolen at higher rates than
lesser known brands? The null hypothesis is there is no significant difference in theft
rates of products that are more Reputable than other products.
5) Are products that are more Consumable stolen at higher rates than products
less frequently purchased and used? The null hypothesis is there is no significant
difference in theft rates of products that are more Consumable than other products.
Definition and Measurement of the AT CUT PRICES Attributes
AT CUT PRICES Independent Variables
Table 9 displays the independent variables for the AT CUT PRICES study. Six of the 11
attributes were not measured: Transportable, Untraceable, Tradeable, Imperishable,
Evaluable, and Shiftable. With the exception of Untraceable and Imperishable, the other
four attributes could only be measured by thieves (after-the-fact of the theft), fences, or
perhaps black market buyers (i.e. evaluable). Untraceable was not measured since all but
2 products in the entire sample did not have any extra coding besides a UPC code.
Likewise, imperishable was not measured since this dissertation focused on using non-
food products.
AT CUT PRICES Attributes – Measured Independent Variables
Of the 11 AT CUT PRICES attributes, all but 4 can be measured using the after-the-fact
theft data. The remaining seven attributes can only be measured using qualitative
information from the shoplifters, and, in many cases the black market seller. More

54
Concealable
This measure is directed towards the initial shoplifting from stores. Essentially the more
concealable (usually smaller in size) an item is, the easier it is to shoplift. Concealable is
measured here in terms of size. The dimensions of each product (length x width x height)
serves as a very good measure for this continuous independent variable.
Profitable
Profitable has to do with the amount of money black market sellers can make on
products. It can be argued that the most expensive products would be the most profitable.
However, the first attribute of the AT CUT PRICES indicates that products should be
affordable. Therefore, profitable will be measured in the same manner in which any store
would measure it. The gross margin of products will be calculated to form a continuous
variable – profitable. Thus, if a store paid $5.00 for a product from the manufacturer and
then sells the products to consumers at a markup of $3.00, the total cost to the consumer
is $8.00 The gross margin is the difference between the final sales price and it’s “base
price” (dollar amount paid to manufacturer).
Reputable
Buyers of questionable products prefer to purchase brand-name or well-known brands of
products. Thus, this attribute is operationalized as a dichotomous variable. Brand-name
products = 1, while store-brand products = 0.
Consumable

55
This attribute deals identifies the highest grossing products to measure products that
needed to be replaced or replenished at high rates. This measure is formulated by the total
sales of a product for the year (in dollars).
AT CUT PRICES Attributes – Not Measured
Affordable
Affordable, in this respect, refers to how affordable it a product is to buyers at illegal
(i.e., black) markets dealing in stolen merchandise. Other research, on the prices dealers
or “fences” ell stolen products is needed to fill this gap. Because of the inability to
measure this attribute, it was excluded from the analyses.
Transportable
Transportability deals with the weight of products. Of the dataset, few weights for
products were available. The operators of the stores where the dataset came from
informed the candidate that they were more concerned with dimensions; specifically,
assessing how many products would fit on shelves or pallets. In sum, for this store and
dataset, the size would matter most because less than three products weighed less than
one pound (U.S.) rendering this variable not quite
Untraceable
None of the products was traceable. Each product had a unique UPC code, but none of
the products were tagged again with more unique identifying features. Since FMCG are
generally lower-priced, this perhaps would be more suiting to stores dealing in more

56
expensive products willing to spend more on high-tech identifying features like RFID
tagging (electronic article surveillance unique tags for expensive products.
Tradeable
This, attribute, is something that can only be known by the thief, their fence and the illicit
buyer. They would be negotiating for a something else, perhaps drugs or money. Some
anecdotal evidence exists that drug dealers were taking certain things in trade, but it
might be only one dealer in one city not acting like other dealers in other geographic
areas.
Imperishable
Perishable products are typically not stolen for resale, although certain high-quality meats
and cheeses always top the list of stolen items each year. Those foods are probably for
the the shoplifter themselves to eat and enjoy. After those one or two highly perishable
items, most products on the top stolen lists each year are non-food durable consumer
goods, like electronics, razors, batteries, non-prescription drugs.
Evaluable
Of all the AT CUT PRICES attributes, this would be the most difficult to measure. The
definition of evaluable is if a product is stolen from a store, the black market seller their
customers view, look at, perhaps hold to assure it is the “real thing.” Therefore being able
to evaluate a product is very important to customers, but for this analysis, it cannot be
measured.

57
Shiftable
Shiftable products are those which the fence or black market seller can move around to
different jurisdictions and people will buy the shoplifted products at all of them. In other
words, the attribute is measuring the black market demand for the products in different
localities.
Table 12. AT CUT PRICES Measures and Coding Scheme AT CUT PRICES Attribute Independent Variable Definition and Coding Affordable
--
--
Transportable -- --
Concealable Dimensions Sum of product height, width and length in inches (Continuous)
Untraceable -- --
Tradeable -- --
Profitable Gross Margin Difference between base and sales price of product in dollars (Continuous)
Reputable Brand Name Product is brand name or store-brand (0 = Store-brand, 1 = Brand-name)
Imperishable
--
--
Consumable
Gross Revenue
Total sales of product for year in dollars (Continuous)
Evaluable
--
--
Shiftable
--
--

58
Descriptive Statistics of AT CUT PRICES Variables
A total of 8,522 products were analyzed. Table 3 displays the descriptives and
frequencies for the 4 AT CUT PRICES independent variables which were
operationalized and tested. The average dimensions of products were 11.29 inches (sd =
6.57 in). The gross margin statistic reveals that stores, on average, sold products for $2.21
(sd = 2.07) more than they paid for them from the manufacturers. Most products stolen
(91.5%) were brand-name products as opposed to store-brand (8.5%). The total yearly
revenue for products (i.e., sum of sales in dollars) averaged $33,035.41 (sd = 71,441.18)
for the year. For the subsequent bivariate and multivariate regressions, the
aforementioned Dependent Variable, “Theft Rate” is used (see Table 3.1).
Table 13. Descriptive Statistics of Independent Variables – AT CUT PRICES Variable Measure % / Mean (sd) Affordable
--
--
Tradeable
--
--
Concealable
Dimensions (inches)
11.29 (6.57)
Untraceable
--
--
Tradeable
--
--
Profitable
Gross Margin (dollars)
2.21 (2.07)
Reputable
Brand Name
91.5
Imperishable
--
--
Consumable
Gross Revenue (dollars)
33,035.41 (71,441.18)
Evaluable -- -- Shiftable
--
--

59
Bivariate Coefficients for AT CUT PRICES & Theft Rate
Table 11 presents a bivariate correlation matrix for the variables in this analysis. All but
one of the coefficients were significant at the p < .001 level. This is likely due to the
relatively large number of cases in the sample (N = 8,522). Most of the correlations
between the independent variables and theft rate (DV) were consistent with the directions
of the hypothesized causal relationships. Concealable had the strongest relationship with
theft rate. The negative relationship (r = -.236, p < .001) was expected, as smaller
products are stolen more often than larger ones. Profitable had a positive relationship to
theft rate (r = .179, p < .001). Therefore, products that are priced higher by stores (after
purchasing them for less from manufacturers) have higher theft rates than products with
lower gross margins. Consumable was also positively correlated with theft rate (r = .178,
p < .001). The measure for consumable is the total yearly revenue brought in by a
product. Thus, the most popular, and perhaps most consumable, are stolen more often
than products bringing in less revenue. Affordable (sales price) was positively related to
theft rate (r = .151, p < .001). Thus, theft of expensive products is more likely than that of
cheaper products. Finally, reputable had the weakest relationship with theft rate. The
positive correlation (r = .136, p < .001) indicates that brand name products are more
likely to be stolen at higher rates than store-brand products.

60
Table 14. Pearson’s r Coefficients for AT CUT PRICES Variables (N = 8,522)
Multivariate Results
Before any of the multivariate analysis was conducted, tests for the presence of
multicollinearity were performed. Multicollinearity diagnostics were performed to test
whether the independent variables are related to each other, rather than the outcome
variable. Multicollinearity was tested using tolerance and variance inflation factor (VIF)
statistical analysis. Generally, tolerance scores of .01 or less indicate multicollinearity
problems (Meyers et al., 2006). In this study, the tolerance scores ranged from .663 to
.949, which exceed the .01 threshold for multicollinearity issues. The VIF statistics
ranged from 1.035 to 1.509, which do not approach the conventional level of 10 where
multicollinearity issues arise (Stevens, 1992).
(1) (2) (3) (4) (5)
Theft Rate (1) 1
Concealable (2) -.236** 1
Profitable (3) .179** .143** 1
Reputable (4) .136** -.051** -.011 1
Consumable (5) .178** .144** -.036** -.109** 1

61
The AT CUT PRICES independent variables were assessed for their influence on product
theft rate through the use a multivariate linear regression model. The results are shown in
11, which displays the standardized and unstandardized coefficients, standard errors and
significance levels of the independent variables. All variables were statistically
significant at the p < .001 level. The direction of the predictors’ relationships remained
consistent from the bivariate level. Further, the predictors held their relationship when
other variables were entered in the same model. As in the bivariate results, Concealable
was the strongest predictor of theft rate (β = -.247, p < .001). As expected, and products
which are smaller in size are stolen more often than larger products. Again, like the
bivariate results, Profitable was the second strongest predictor (β = .152, p < .001).
Therefore, products with larger gross margins (i.e., marked up more by the store after
purchase from the manufacturer) are stolen at higher rates. Consumable was the next
strongest predictor (β = .130, p < .001), also mirroring the bivariate results. Reputable (β
= .104, p < .001) become a stronger predictor and Affordable (β = .082, p < .001) became
a weaker predictor, in comparison to the bivariate results. The adjusted R2 statistic
indicates that the predictors in the model, when taken together, account for approximately
13.5% of the variation in the dependent variable (theft rate).

62
Table 15. Multivariate Regression of AT CUT PRICES and Theft Rate (N = 8,522) B (SE) Beta t Sig.
Concealable -.003 (.000) -.247 -24.073 .000
Profitable .006 (.001) .152 10.674 .000
Reputable .032 (.003) .104 10.246 .000
Consumable 1.548 (.000) .130 12.716 .000
Constant .042 (.003) 11.983 .000
Adjusted R2 = .135
F = 270.699, p < .001 (df = 5, 8517)
Chapter Summary
This study measured the effects of AT CUT PRICES attributes on product theft rate. The
method found significant relationships existed between all five measurable AT CUT
PRICES components and theft rate. All coefficients between the independent variables
and dependent variable were highly significant (p < .001) in the bivariate and multivariate
analyses. It is clear by the results that smaller products are stolen at higher rates than
larger products. Of the measured variables, the concealability of a product seems to be
the strongest predictor of its rate of theft. After stores purchase products from
manufacturers, they sell those products at higher prices. The difference between the
stores selling price and what they paid for the product is known as gross margin. It is
clear that products having larger gross margins (i.e., high mark-ups) have higher rates of

63
theft. Reputable products are stolen more often than store-brand products. Also, products
are stolen more as their price increases. This is contradictory to the hypothesis that more
affordable products are stolen than more expensive ones.

64
CHAPTER 5. TESTING THE CRAVED MODEL
Overview of the Study Design
This chapter summarizes the results of the analysis testing several CRAVED attributes
for predictive value of FMCG theft. Among the six CRAVED attributes, all but two were
measured. It was decided that all of the products in the sample were removable.
Disposable was not measured because it was not possible to be able to determine what
buyers would prefer after the product was stolen and up for sale in the black market.
Table 13 summarizes how the four measurable CRAVED attributes are defined and
coded as independent variables. A rate was calculated to measure for theft, which was
used as the dependent variable (see Table 2).
Analytic Strategy
This analysis is very similar to the AT CUT PRICES study. Using the same proxy
measure for theft (theft rate) as dependent variable, each of the following statistical
results were found: descriptive statistics, bivariate correlations and a multiple regression.
Again, theft rates were used as the proxy for theft and as the unit of analysis, as a
continuous outcome variable. The series of predictor variables to test were: Concealable,
Available, Valuable and Enjoyable.
Research Questions and Null Hypotheses
Primary Research Question
6) What is the relationship between products with CRAVED attributes and their
theft rates? The null hypothesis is there is no significant difference in theft rates for
products with or without CRAVED attributes.

65
Secondary Research Questions
7) To what extent do products with Concealable attributes correlate with theft
rate? The null hypothesis is there are no significant correlations between Concealable
and increased theft rate.
8) To what extent do products with Available attributes significantly influence
their rate of theft? The null hypothesis is there is no significant difference between
Available products and increased theft rates.
9) Are more Valuable products stolen at higher rates than products that are worth
less? The null hypothesis is there is no significant difference in theft rates of products
that are more valuable than other products.
10) Are products that are Enjoyable to own, possess, or use are stolen more often
than other products? The null hypothesis is there is no significant difference in theft rates
of products with Enjoyable attributes and those without them.
11) Compared to the AT CUT PRICES model, does the CRAVED model of theft
preferences less, the same, or more theft variation? The null hypothesis is there is no
significant difference between the AT CUT PRICES model and the CRAVED model in
terms of explanation of theft variance.
CRAVED Attributes – Measured Independent Variables
Concealable
This is the same measure as in the AT CUT PRICES. Concealable is measured here in
terms of size. The dimensions of each product (length x width x height) serves as a very
good measure for this continuous independent variable.

66
Available
At first glance into a supermarket, walking down aisles with thousands of products on the
shelf, one might think availability of products do not matter. However, certain products
only offer a small selection (e.g., less than five lines) while others offer perhaps over 100
lines. For example, men’s contraceptives may only offer 2 or 3 lines. On the other hand,
men’s razors may offer 35 lines of blades. To account for this, availability is measured by
dividing the number of product lines by product type, which is a continuous variable.
Valuable
Very simply, this is the sales price of products. In other words valuable is defined as the
price of the product sold by store (after mark-up) by stores in dollars.
Enjoyable
There is some evidence that shoplifters prefer to steal products that are generally
enjoyable things to own or consume. Alcoholic drinks, tobacco, electronics and perhaps
condoms are enjoyable products sought by thieves (Walsh, 1974). Clarke (1999) states
that the theft of these products “may reflect the pleasure-loving lifestyle of many thieves
and the people who buy from them. Walsh referred to the aforementioned goods as
luxuries. Products were coded for their Enjoyability based on their luxuriousness and if
they were “unnecessary” products. This variable is dichotomous – (0 = no, 1 = yes). Each
product was approached with the question of “Is this product necessary for normal life or
is it an unnecessary luxury?” Enjoyable offers the most validity and reliability issues of
all the independent variables tested, in that some people may find one thing enjoyable

67
while others do not at all. For example, some men buy the newest razors and shaving
creams and claim to enjoy owning the product as well as using it. Other men view
shaving as any other chore and will purchase the less expensive disposable kind. Thus,
the expensive newest razors are not required or necessary for the customers; the
disposable cheapest kinds were not considered to be enjoyable.
CRAVED Attributes – Not Measured
Removable
All of the products in the sample were removable from the store. The products which
were in locked cases or behind counters, requiring store staff to get the products were
removed from the database.
Disposable
Disposability is not measured since AT CUT PRICES specifically addresses the lack in
addressing disposability in CRAVED.
13 displays the independent variables for the CRAVED study. Two of the six attributes
were not measured since the model: Removable and Disposable. Removable was not
measured since only those products that could be removed from the store were included.
Disposable was not measured since AT CUT PRICES is a whole model trying to measure
disposability.
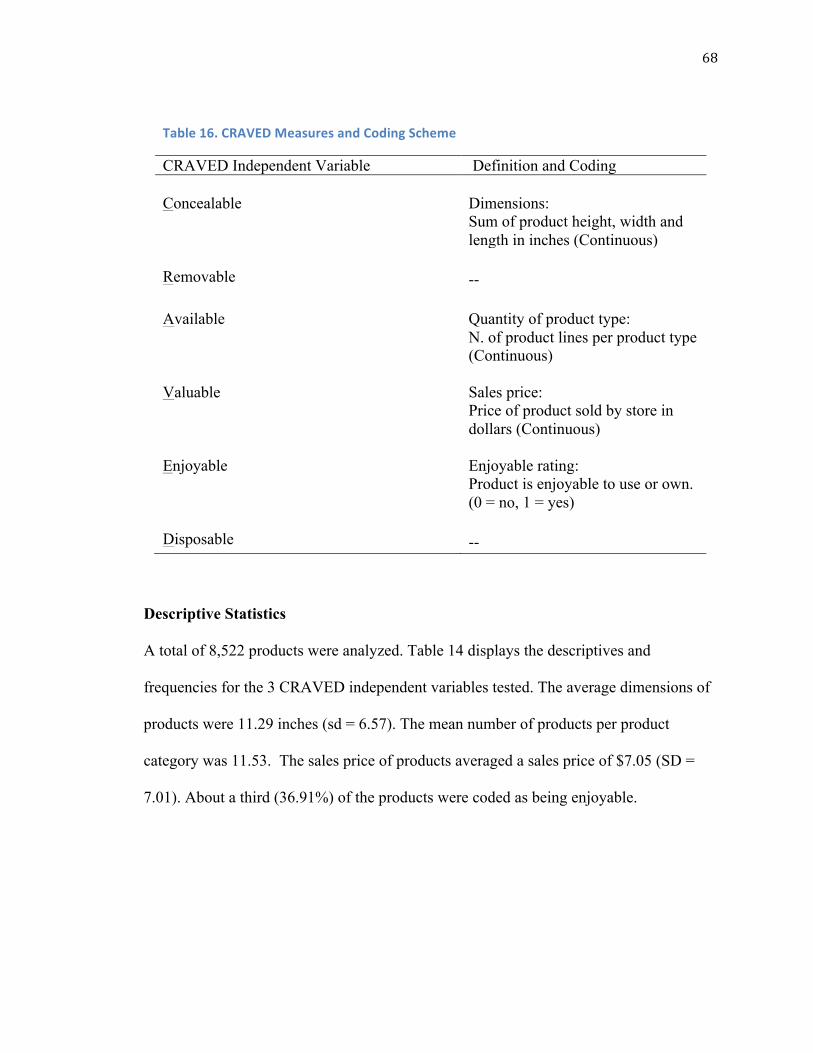
68
Table 16. CRAVED Measures and Coding Scheme
CRAVED Independent Variable Definition and Coding Concealable
Dimensions: Sum of product height, width and length in inches (Continuous)
Removable
--
Available
Quantity of product type: N. of product lines per product type (Continuous)
Valuable
Sales price: Price of product sold by store in dollars (Continuous)
Enjoyable
Enjoyable rating: Product is enjoyable to use or own. (0 = no, 1 = yes)
Disposable
--
Descriptive Statistics
A total of 8,522 products were analyzed. Table 14 displays the descriptives and
frequencies for the 3 CRAVED independent variables tested. The average dimensions of
products were 11.29 inches (sd = 6.57). The mean number of products per product
category was 11.53. The sales price of products averaged a sales price of $7.05 (SD =
7.01). About a third (36.91%) of the products were coded as being enjoyable.
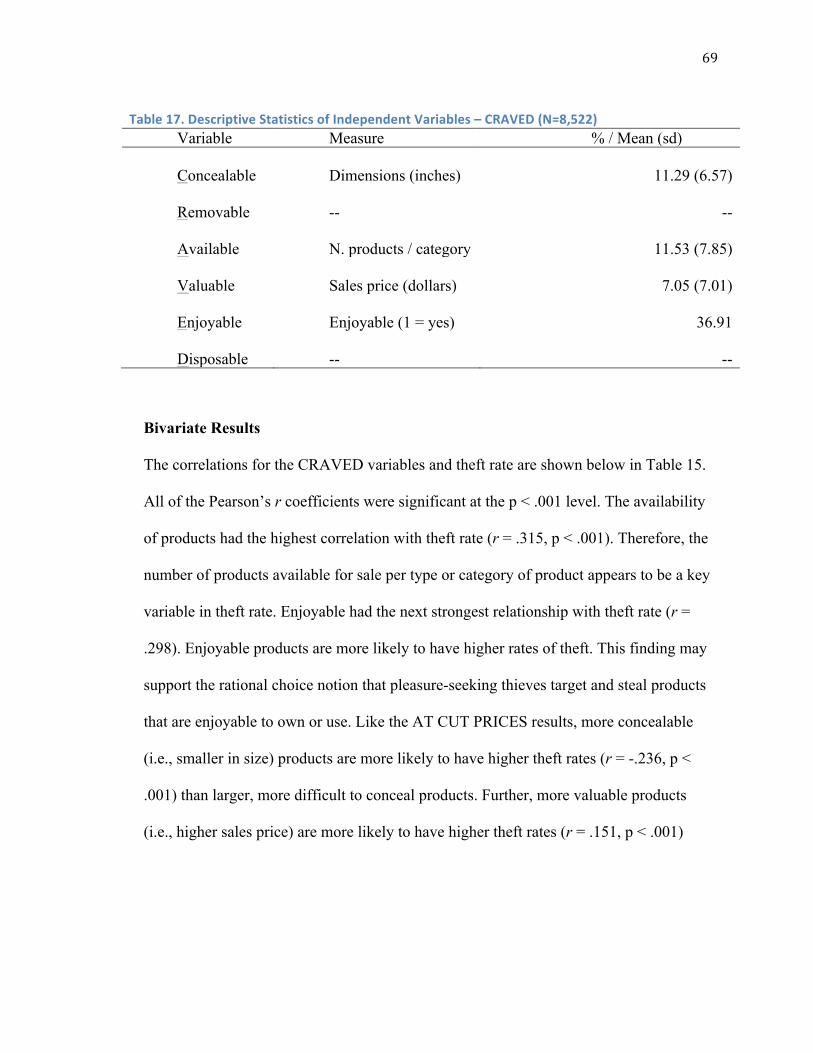
69
Table 17. Descriptive Statistics of Independent Variables – CRAVED (N=8,522) Variable Measure % / Mean (sd) Concealable
Dimensions (inches)
11.29 (6.57)
Removable
--
--
Available
N. products / category
11.53 (7.85)
Valuable
Sales price (dollars)
7.05 (7.01)
Enjoyable
Enjoyable (1 = yes)
36.91
Disposable
--
--
Bivariate Results
The correlations for the CRAVED variables and theft rate are shown below in Table 15.
All of the Pearson’s r coefficients were significant at the p < .001 level. The availability
of products had the highest correlation with theft rate (r = .315, p < .001). Therefore, the
number of products available for sale per type or category of product appears to be a key
variable in theft rate. Enjoyable had the next strongest relationship with theft rate (r =
.298). Enjoyable products are more likely to have higher rates of theft. This finding may
support the rational choice notion that pleasure-seeking thieves target and steal products
that are enjoyable to own or use. Like the AT CUT PRICES results, more concealable
(i.e., smaller in size) products are more likely to have higher theft rates (r = -.236, p <
.001) than larger, more difficult to conceal products. Further, more valuable products
(i.e., higher sales price) are more likely to have higher theft rates (r = .151, p < .001)

70
Table 18. Pearson’s r Correlation Coefficients for the CRAVED Model (N = 8,522) (1) (2) (3) (4)
Theft Rate (1) 1
Concealable (2) -.236** 1
Available (3) .315** -.040** 1
Valuable (4) .151** .159** .035** 1
Enjoyable (5) .298** -.205** .360** .155** 1
** p < .001
Multivariate Results
A multiple regression model was constructed in order to determine the relative predictive
impact of the CRAVED variables on product theft rate. The results are useful in
comparing the CRAVED and AT CUT PRICES models of predicting product theft. The
results of the regression are shown in Table 16, which displays the standardized and
unstandardized coefficients, standard errors and significance levels of the independent
variables. All variables were statistically significant at the p < .001 level. The direction of
the predictors’ relationships remained consistent from the bivariate level. Further, the
predictors held their relationship when other variables were entered in the same model.
Available again was the strongest predictor of theft (β = .251, p < .001). Concealable was
the next strongest predictor of theft (β = -.222, p < .001). Next was Enjoyable (β = .157, p
< .001), and finally, Valuable was the weakest predictor of the theft (β = .149, p < .001).
Compared to the results of the AT CUT PRICES model, the CRAVED variables proved
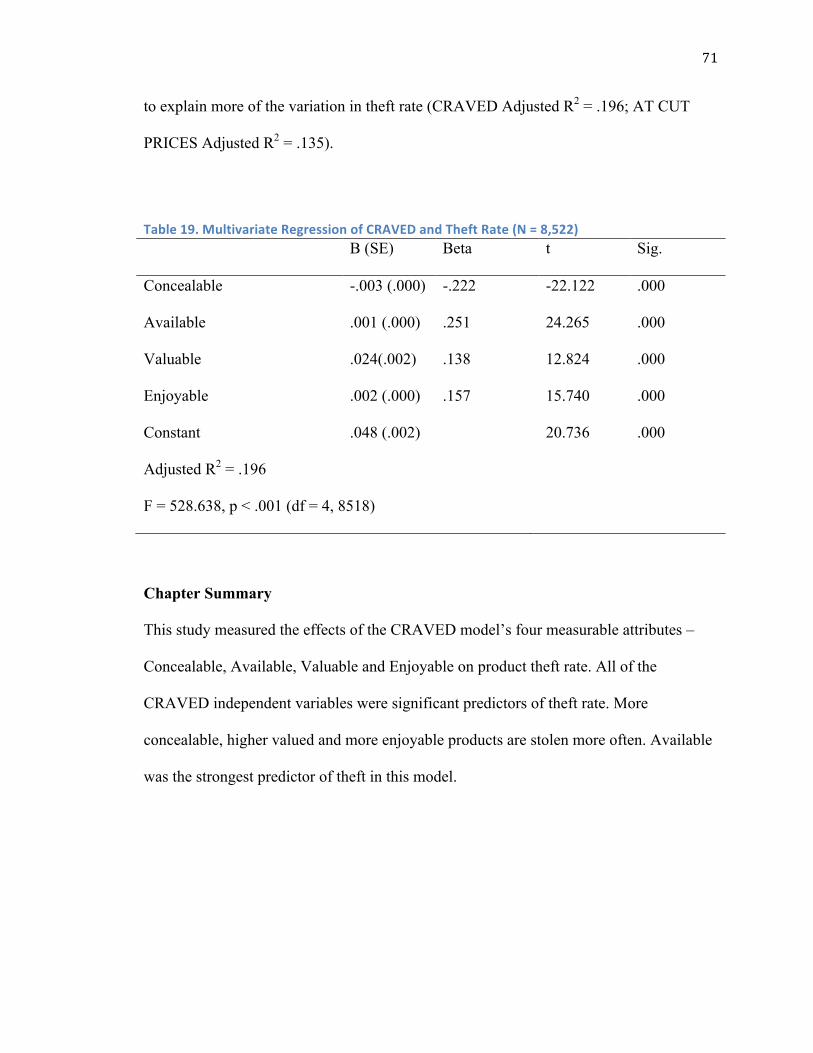
71
to explain more of the variation in theft rate (CRAVED Adjusted R2 = .196; AT CUT
PRICES Adjusted R2 = .135).
Table 19. Multivariate Regression of CRAVED and Theft Rate (N = 8,522) B (SE) Beta t Sig.
Concealable -.003 (.000) -.222 -22.122 .000
Available .001 (.000) .251 24.265 .000
Valuable .024(.002) .138 12.824 .000
Enjoyable .002 (.000) .157 15.740 .000
Constant .048 (.002) 20.736 .000
Adjusted R2 = .196
F = 528.638, p < .001 (df = 4, 8518)
Chapter Summary
This study measured the effects of the CRAVED model’s four measurable attributes –
Concealable, Available, Valuable and Enjoyable on product theft rate. All of the
CRAVED independent variables were significant predictors of theft rate. More
concealable, higher valued and more enjoyable products are stolen more often. Available
was the strongest predictor of theft in this model.

72
CHAPTER 6. ANALYZING THEFT RATES OF PRODUCTS WITH ROLES IN ILLICIT DRUG USE
Overview of the Study Design
Some FMCGs, namely over-the-counter (OTC) drugs, are intentionally misused by drug
users, abusers or even manufacturers of illegal drugs. This chapter seeks to understand
what relationship, if any, exists between products with functions in drug use and abuse
and their subsequent rates of theft. At the time of this study, a review of the literature
indicated that no other studies have attempted to understand what proportion of consumer
products are being stolen, or purchased for that matter, and being misused for drug abuse
purposes.
Research Questions and Null Hypotheses
Primary Research Question
12) Do the illicit, unintended drug functions of products have any effect on their
rate of theft compared to other products without such roles or functions? The null
hypothesis is there is no significant difference in theft rates of products that have illicit
roles in drug use than other products.
Secondary Research Questions
13) Are the ingredients to manufacture methamphetamine shoplifted at higher
than average rates? The null hypothesis is that ingredients used to manufacture
methamphetamine will not be stolen at higher rates than other products.

73
Identifying Frequently Misused and Abused Products
The drug abuse and medical literature, as well as significant government reports and
anecdotal evidence, provided the basis for identifying products with drug roles. Most
misused products were intended for human consumption as OTC drugs. However,
seemingly innocuous household products were also identified as having roles in drug
abuse. By identifying products and how they are abused, it was possible to classify
products into five distinct categories of drug abuse roles. Products were rated for these
roles using the coding scheme shown in Appendix 1. The 1) directly produces a “high”;
2) enhances the effects of a drug; 3) reduce the ill-effects of drug use; 4) ingredient to
manufacture an illegal drug; 5) paraphernalia used in the consumption of a drug. Each of
these categories and their descriptions are further developed upon below.
The 5 Roles of Products with Drug Abuse Functions
1. Directly Produces a “High”
Many products misused on their own will produce a “high,” or otherwise dissociative
effects desired by drug users and abusers. We identified the following products that,
when misused, produce a high: antihistamines, certain cold and cough drugs, and
products containing caffeine, diet pills and permanent markers.
Approximately 3.1 million persons aged 12-25 in the U.S. have misused OTC cold and
cough medicines at least once in their lifetime. Many cough and cold medicines (over
140 brands) contain the semisynthetic narcotic Dextromethorphan (DXM). While highly
effective when used as directed, DXM has been abused since it was first introduced to

74
consumers in the 1960s (Conca and Worthen, 2012). DXM is abused by taking excessive
dosages. When abused in excess doses, it acts as a dissociative hallucinogen, causing
changes in sensations, perception and thought. Many users describe the experience as
similar to effects of taking illicit drugs like PCP (phencyclidine) and Ecstasy (MDMA).
This ‘high’ is sought after by many types of individuals motivated to obtain these
dissociative effects, but adolescents tend to abuse it most (Walker and Yatham, 1993;
Boyer, 2004; Miller, 2005; Banken and Foster, 2008). DXM abuse occurs in varying
demographic areas and is growing in frequency (Boyer, 2004).
Antihistamine abuse is widespread; it is not only a problem of occasional or recreational
use (Conca and Worthen, 2012). Antihistamine abusers have been classified according to
Diagnostic and Statistical Manual of Mental Disorders (DSM-IV) criteria as exhibiting
features of substance dependence on a number of occasions. Antihistamines are
ingredients in motion sickness relievers, sleep aids, and cold or cough relievers. The
active ingredients Dimenhydrinate (e.g., Dramamine) and Diphenhydramine (e.g.,
Benadryl) are the most commonly abused (Conca and Worthen, 2012). When purposely
overdosed the effects include euphoria, detachment, and hallucinations (Malcolm and
Miller, 1972; Thomas et al., 2009).
There are several OTC drugs that act as central nervous system (CNS) stimulants when
abused on their own. These include caffeine, ephedrine, pseudoephedrine and
epinephrine. An addictive, psychoactive substance, caffeine is consumed daily by
approximately 80% of the world’s population and is generally regarded as the most
75
commonly ingested psychoactive substance (Conca and Worthen, 2012). Traditional
OTC products, as well as tablets, gum, beverages have been marketed and employed as
substitutes for other legal and illegal drugs such as cocaine, and have been intentionally
abused by overdose or by alternative routes of administration, such as snorting ground
tablets (Siegel, 1980; Conca and Worthen, 2012).
Decongestants containing ephedrine and pseudoephedrine, as well as bronchial inhalers
containing epinephrine are frequently abused. These substances are similar in structure
with the amphetamines and, in addition to their decongestant properties, act as CNS
stimulants, appetite suppressants and concentration aids.
Permanent markers are abused through the intentional inhalation of their vapors to
achieve intoxication. (Howard et al., 2011). These permanent markers contain toluene,
which are among the solvent most commonly abused by young people. Studies have
indicated that roughly one-third of juvenile delinquents abuse inhalants (Howard and
Jenson, 1999; Howard et al., 2008)
2. Enhances the Desired Effects of an Illicit Drug
The following products were identified as being utilized to enhance the effects of illegal
drugs: certain cold and cough medicines, products containing caffeine, antacids,
antihistamines, laxatives and weight loss products. The cold and cough medicines
identified were those having DXM or ephedrine as active ingredients. DXM has been
shown to be mixed with MDMA for increased effects (Cole et al., 2010). Ephedrine and

76
pseudoephedrine products, as well as products with caffeine, are often taken with
stronger CNS stimulants like amphetamine to potentiate the stronger drugs stimulant
effects. OTC caffeine tablets are frequently combined with heroin to vaporize it at a
lower temperature when smoked, which slightly increases its efficiency (Cole et al.,
2010). Antihistamines are known to potentiate the effects of opiate drugs (Malcolm and
Miller, 1972; Romanelli and Smith, 2009). Abusers of opioid pain medications (e.g.,
methadone) are reported to take antacids and laxatives in attempts to enhance the opiates’
effects.
3. Reduces the Negative, Ill-Effects of Drug Use and Abuse
Ill-effects were defined as negative side effects or withdrawal symptoms from taking
illegal drugs. Certain cold and cough medicines, mouth care products, products
containing caffeine, analgesics (pain relievers), antihistamines, antacids, eye drops,
laxatives, and baby formula were identified as products used for these purposes.
Many drugs produce unwanted side effects. Analgesics like Tylenol are marketed as
general pain relievers and many people take or abuse them after taking illicit drugs.
Smokers of drugs, most frequently marijuana, use eye drops to relieve redness and mask
drug use (DEA, drug fact sheet). Abusers of opiates often abuse antihistamines to reduce
the common side effects of itching and rhinitis (Conca and Worthen, 2012). People
addicted to amphetamines often turn to caffeine and ephedrine products in excess to get
through periods without amphetamines or to reduce the “crash” of discontinuing the drug.
Also, opioid abusers frequently suffer from digestive issues and frequently take laxatives
and antacids to reduce that side effect of drug abuse. Certain baby formulas are used to
77
replace lost fluids and minerals after heavy alcohol or drug binges (World Health
Organization, 2012).
4. Ingredients for Manufacturing Illegal Drugs
Recipes to make methamphetamine are easily obtained on the Internet and most
individuals are capable of producing it on their own. The ingredients necessary to
manufacture the drug are common household goods. Most of the ingredients are available
at supermarkets. Depending on the recipe, around 10 products (all legally available) are
used as ingredients to manufacture methamphetamine. 4 of these products were among
the “most-shoplifted” sample of products. These included: OTC pseudoephedrine tablets,
lithium batteries, iodine, and petrol/gasoline additives. By combining these ingredients
with others, the result chemical reactions produce methamphetamine. Several other
products were identified which have been known used as adulterants or bulking agents
for drugs like heroin. These included: baby formula, laxative powders, caffeine pills, and
several forms of pain relief tablets. Adulterants, also known as cutting or bulking agents,
are routinely found in illicit drugs. The evidence suggests that illicit drugs are more
commonly adulterated with benign substances—certainly household goods—to increase
the amount of product for more profit. However, a large number of adulterants are
substances that will facilitate the administration of the illicit drug (e.g., caffeine in
heroin).
Tablets containing caffeine are used as adulterants for heroin, cocaine, amphetamines and
ecstasy (Cole et al., 2010). Baby formula powders are used as bulking agents for drugs in
powder forms (Cole et al., 2010). General pain relievers (e.g., acetaminophen) are mixed

78
with heroin for its analgesic effects and bitter taste, which may disguise poor quality
heroin (Cole et al., 2010). It may also be used because it has a similar melting point to
heroin. DXM-based medicines can cause an individual to feel a similar “high” as ecstasy.
DXM is legal and cheaper to obtain than MDMA and is why it may be used as an
adulterant in ecstasy (Cole et al., 2010). Decongestant pills containing ephedrine have
been used as adulterants of amphetamine (Cole et al., 2010).
5. Illegal Drug Paraphernalia
Paraphernalia products were defined as items commonly used in the consumption or
delivery of a drug into the body. The following products in our data were identified as
common drug paraphernalia items: cigarette lighters, utility knife blades, plastic drink
straws, cigars and tweezers. Lighters are used by drug abusers to ingest their drug of
choice by smoking. Drugs like marijuana, crack cocaine, and methamphetamine are all
smoked. In addition to their use in smoking, lighters are also used in the process of
injecting drugs. For example, heroin users typically mix the drug with liquid on a spoon;
then the lighter’s flame is held underneath the spoon, “cooking” the drug solution. The
user subsequently injects this solution intravenously. Blades intended for use in utility
knives or box-cutters are frequently used to crush pills to powder form to ingest through
insufflation (i.e., snorting). The blades are also used by cocaine or other powder drug
users (e.g., cocaine, meth, heroin) to break any lumps or large pieces (i.e., cake) and
formed into ‘lines’ for snorting through the nose. Powder drugs are often abused through
‘snorting’—sniffing the powder into the nasal passages. Typically, a straw of some sort
(e.g., plastic drink straw) is used for snorting. Commonly insufflated substances include:

79
cocaine, heroin, amphetamines and some OTC drugs. Cigars are used to make ‘blunts’ –
hollowed-out cigars used to smoke marijuana and other drugs. Users will remove the
inner tobacco (i.e., ‘the guts’) and retain the cigar wrapper. The drug is spread inside the
open wrapper and ‘rolled’ up produce the blunt, which resembles a cigar. Marijuana
smokers, to hold the end of a joint to avoid burns or resin stains on their fingers, “roach
clips”, are used. These are sold legally at specialty stores, but people frequently use
cheaper products like tweezers instead because of their availability.
Analytic Strategy
Once again, the proxy measure for shoplifting – theft rate is used as dependent variable.
However, only one variable (dichotomous: product with drug role = 1) was
operationalized as an independent variable. First, each of the products in the sample of
8,522 products were coded for having or not having a known role in illicit drug use or
abuse (See the aforementioned paragraph on Identifying Frequently Misused and Abused
Products). Descriptive statistics were calculated and also a Pearson’s r coefficient was
calculated for bivariate results.
Below, products were coded for their roles, properties, or otherwise “hidden” functions in
elicit drug use. It is then attempted to ascertain if illicit drug functions or roles of some
products can cause higher rates of those products’ thefts, in comparison to other products.
80
Each of the products in the sample (N = 8,522) needed to be coded for having one or
more of the five possible roles in drug abuse. These roles were: 1) Directly produces a
“high,” 2) Enhances illegal drug “high,” 3) Reduces ill-effects of drug use or abuse, 4)
Illegal drug ingredient, and 5) Illegal drug paraphernalia. To accomplish this with a
degree of reliability, the technique used to code the products was validated through inter-
rater agreement. Besides this author, an expert on drug abuse12 was consulted and agreed
to rate all the products using a coding scheme (see Appendix 1). The outside coder
understood and agreed with the validity of coding scheme’s content. The resulting inter-
rater reliability analysis indicated that less than 1% of the products coded were not agreed
upon between coders. However, this author and the coder were able to communicate and
understand why these discrepancies existed. With the level of agreement amongst the
coders of nearly 100%, it was agreed upon that the coding and coding scheme appeared
to be a reasonable measure of products’ potential roles in illicit drug abuse. Below, Table
17 shows the coding scheme utilized by the author and second coder to categorize the
products by role in illicit drug use – if they in fact did have any role at all.
To summarize, if any of the products in the sample were coded as “1” in one or more of
the categories listed above in Table 17, they were also coded as 1 in the below model.
Table 17 displays how the independent variable (drug role) of products is
operationalized.
12 Drug Enforcement Administration (DEA) Special Agent from the Newark, New Jersey Field Office who is an expert on prescription, non-prescription drug and illegal drug abuse, in addition to clandestine methamphetamine labs and their manufacture. As a condition of performing the coding for this research, the Special Agent requested to have his/her name not mentioned here, citing national security interests.
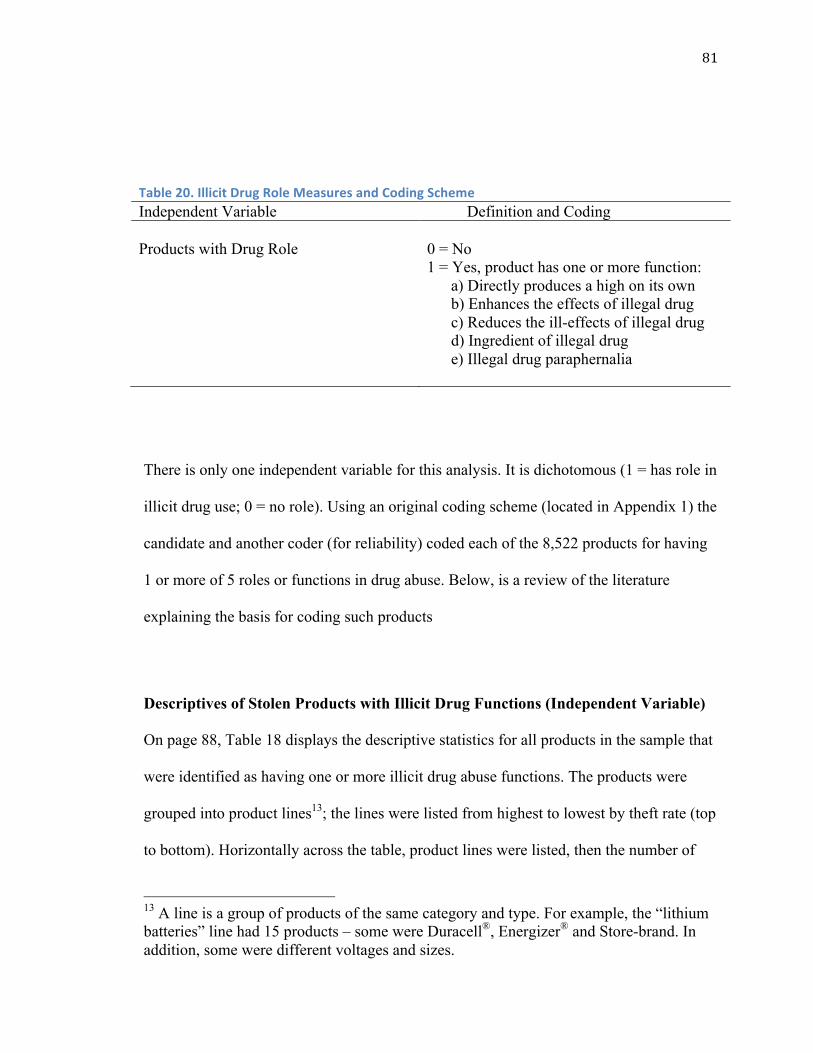
81
Table 20. Illicit Drug Role Measures and Coding Scheme Independent Variable Definition and Coding Products with Drug Role
0 = No 1 = Yes, product has one or more function: a) Directly produces a high on its own b) Enhances the effects of illegal drug c) Reduces the ill-effects of illegal drug d) Ingredient of illegal drug e) Illegal drug paraphernalia
There is only one independent variable for this analysis. It is dichotomous (1 = has role in
illicit drug use; 0 = no role). Using an original coding scheme (located in Appendix 1) the
candidate and another coder (for reliability) coded each of the 8,522 products for having
1 or more of 5 roles or functions in drug abuse. Below, is a review of the literature
explaining the basis for coding such products
Descriptives of Stolen Products with Illicit Drug Functions (Independent Variable)
On page 88, Table 18 displays the descriptive statistics for all products in the sample that
were identified as having one or more illicit drug abuse functions. The products were
grouped into product lines13; the lines were listed from highest to lowest by theft rate (top
to bottom). Horizontally across the table, product lines were listed, then the number of
13 A line is a group of products of the same category and type. For example, the “lithium batteries” line had 15 products – some were Duracell®, Energizer® and Store-brand. In addition, some were different voltages and sizes.

82
products within the line, theft rate, number stolen, mean sales price, and check boxes for
each of the five possible illicit drug functions. Of the sample’s 8,522 products, 635
products belonging to 32 lines were identified has having one or more illicit drug abuse
function. 13 lines of products produce a high on their own.18 lines of products enhance
another drug’s high when taken in conjunction. 23 of the product lines can be used to
reduce negative side effects of other drugs. 16 product lines serve as ingredients or
additives in the production of illegal drugs. 5 lines were identified as illegal drug
paraphernalia, meaning that they are associated with assisting the persons consume illegal
drugs. The mean theft rate for all of the drug-related products was .051 while all products
in the full sample had a mean theft rate of .032.
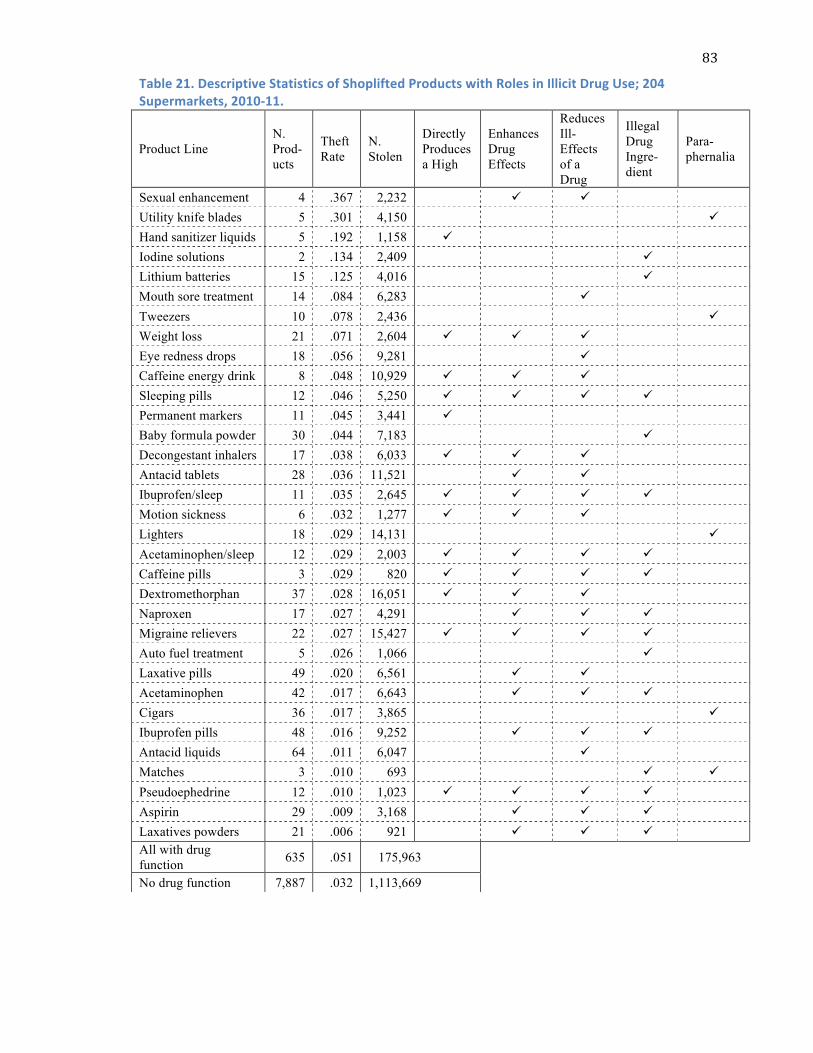
83
Table 21. Descriptive Statistics of Shoplifted Products with Roles in Illicit Drug Use; 204 Supermarkets, 2010-‐11.
Product Line N. Prod-ucts
Theft Rate
N. Stolen
Directly Produces a High
Enhances Drug Effects
Reduces Ill-Effects of a Drug
Illegal Drug Ingre- dient
Para- phernalia
Sexual enhancement 4 .367 2,232
ü ü
Utility knife blades 5 .301 4,150 ü
Hand sanitizer liquids 5 .192 1,158 ü
Iodine solutions 2 .134 2,409 ü
Lithium batteries 15 .125 4,016
ü
Mouth sore treatment 14 .084 6,283 ü
Tweezers 10 .078 2,436 ü
Weight loss 21 .071 2,604 ü ü ü
Eye redness drops 18 .056 9,281 ü
Caffeine energy drink 8 .048 10,929 ü ü ü
Sleeping pills 12 .046 5,250 ü ü ü ü
Permanent markers 11 .045 3,441 ü
Baby formula powder 30 .044 7,183 ü
Decongestant inhalers 17 .038 6,033 ü ü ü
Antacid tablets 28 .036 11,521 ü ü
Ibuprofen/sleep 11 .035 2,645 ü ü ü ü
Motion sickness 6 .032 1,277 ü ü ü
Lighters 18 .029 14,131 ü
Acetaminophen/sleep 12 .029 2,003 ü ü ü ü
Caffeine pills 3 .029 820 ü ü ü ü
Dextromethorphan 37 .028 16,051 ü ü ü
Naproxen 17 .027 4,291 ü ü ü
Migraine relievers 22 .027 15,427 ü ü ü ü
Auto fuel treatment 5 .026 1,066 ü
Laxative pills 49 .020 6,561 ü ü
Acetaminophen 42 .017 6,643 ü ü ü
Cigars 36 .017 3,865 ü
Ibuprofen pills 48 .016 9,252 ü ü ü
Antacid liquids 64 .011 6,047 ü
Matches 3 .010 693 ü ü
Pseudoephedrine 12 .010 1,023 ü ü ü ü
Aspirin 29 .009 3,168 ü ü ü
Laxatives powders 21 .006 921 ü ü ü All with drug function 635 .051 175,963
No drug function 7,887 .032 1,113,669

84
Bivariate Results
Table 19, below, displays the bivariate correlation between the independent and
dependent variables. According the Pearson’s r coefficient, there is a statistically
significant, albeit weak positive relationship between drug roles of products and theft rate
(r = .072, p < .001). However, the coefficient of .072 is relatively weak. Nevertheless, the
results indicate that products with illicit drug functions are more likely to have high theft
rates.
Table 22. Pearson’s r Coefficient for Drug Function (1) (2) Theft Rate (1) 1
Drug Role (2) .072** 1 **p < .001
Chapter Summary
This chapter provided a literature review of legally misused products and other products
that serve roles in drug (legal or illegal drug abuse). Five different categories of how
these products are misused were identified as well. This study revealed that many of the
shoplifted products with roles or functions in illicit drug use had high theft rates. The
results suggest that products with drug abuse value have a higher risk of being shoplifted.
Less than ten percent of all sampled products (N = 635) had roles in illicit drug abuse, but
their mean theft rate (.051) was higher than the overall mean theft rate of the remaining
products (N = 7,887) in the sample (.032). This is an exploratory study, which if
researched further, can prove important for stores protecting these products. Further,
possible governmental intervention in recognizing shoplifting of frequently abused OTC
drugs may prove helpful.

85
CHAPTER 7. CONCLUSIONS
This chapter provides a summary of the findings for the previous 3 chapters. Then, the
implications for theory and policy are discussed. Situational Crime Prevention is
discussed, along with specific responses to curb shoplifting. The chapter is ends with a
discussion on data limitations, then a final section on implications for the drug role study.
All four of the measurable AT CUT PRICES independent variables (concealable,
profitable, reputable, consumable) were significant predictors of shoplifting. Of these
measured AT CUT PRICES variables, Concealable was the strongest predictor of theft.
Thus, shoplifters considered how the size and shape of products as the most important
attribute prior attempting theft. This suggests that manufacturers, designing large product
packaging for smaller items, are a good strategy to preventing theft. How Profitable a
product was is the second strongest predictor of theft. Although many types of products
had store-brand alternatives, branded products were stolen more often. This suggests that
thieves want name-brand and easily recognizable products to sell at illicit markets
All four tested independent variables (Concealable, Available, Valuable, Enjoyable) were
significant predictor of theft at the p < .001 level for the CRAVED model. Availability
was the strongest predictor of theft in the model. Thus, the more types of product
available to steal, the more theft there will be. In other words, the more product lines per
product, the higher the theft rate of that line of product. Concealable is the second
strongest predictor of theft in the CRAVED model. Products with higher sales prices
were stolen at statistically significant rates than products or lesser cost. Enjoyable
products were stolen at statistically significant rates than products that were less

86
enjoyable and luxurious. The CRAVED model explains more of the variance in theft (R2
= .196) versus (R2 = .135) for AT CUT PRICES. The products coded for having illicit
drug abuse roles were stolen at almost twice the rate as the other products in the sample.
The ingredients to manufacture methamphetamine are shoplifted at higher rates than the
mean theft rate, all except ephedrine and pseudoephedrine tablets, which had lower than
average theft rates. This was expected, as these products must be controlled according to
federal law.
Theoretical Implications
This research intends to contribute to the theft preference literature by determining which
FMCG are most at risk for theft based on their attributes. By doing so, this study may
shed light on thieves’ decision-making processes when they shoplift products strictly for
the purpose of illicit resale or trade. Retailers can then choose from a multitude of
available security features for these products that best match their risk of theft. With this
information, retail loss prevention departments will be able to defend the products most at
risk of theft.
Understanding the theft preferences of shoplifters in conjunction with the expected
understanding of product selection for disposability will provide valuable information to
product manufacturers and sellers. Upon the completion of this research, the most
significant factors that affect products’ risks of theft should be more apparent. For
example, the results may indicate that one product attribute (e.g., untraceability) explains
more variation in shoplifting than other attributes. If 'untraceability' (i.e., the presence or
lack of unique identifying markers, such as serial numbers) is found to be the most

87
significant factor related to shoplifting, then changes in the design and manufacturing of
products may most effectively reduce shoplifting for resale purposes. Consequently, if
most products in grocery stores had unique serial numbers affixed to them, shoplifters
would be less inclined to shoplift and resell such products.
Retailers can also utilize Crime Prevention through Environmental Design (CPTED) to
identify safer locations for high-risk products. Perhaps by identifying the specific
locations of products in stores that generate criminal opportunities, store planners will
consider rearranging their products. Many stores currently place hot products near
guardians (e.g., the “front-end” of the store and near the cashiers). Furthermore, products
can be fitted with “benefit denial” devices, such as ink tags, to reduce the motivation to
steal. Finally, products can be placed in anti-shoplifting devices, which are only
unlocked by store staff at the point of a sale.
Researchers have found that potential offenders are attracted to products that are
expensive, transportable, disposable and difficult to identify (e.g., Kock et al., 1997; Van
Hofer and Tham, 2000). The results of this research will provide data indicating the
degree to which these factors explain the variance in shoplifting. Furthermore, this
research will likely confirm past researchers’ suggestions that the manufacturers of hot
products identify the products that are most at risk of being stolen and alter their designs
to reduce their desirability (e.g., Clarke, 1999, 2000; Clarke et al., 2001).
Although this research concentrates on identifying the products at risk of theft and
possible resale, the results will be applicable to a larger audience who wish to understand

88
thieves’ decision making and the general factors that affect theft. Not every sampled
product was shoplifted by professionals for resale purposes. Many products were
shoplifted by opportunistic and amateur shoplifters. The conceptual framework of this
study was designed to understand which products are vulnerable to theft (and potential
resale). Because the conceptual framework of AT CUT PRICES is based on CRAVED
and some of its attributes (e.g., concealable and enjoyable), the results of this research
can be applied to theft preferences in general.
The knowledge obtained from this research should further develop its guiding theories
(i.e., Rational Choice Theory and Routine Activity Theory). This research should serve as
another example of Rational Choice Theory being used as a general theory of crime to
identify hot products and theft preferences in different environments (i.e., from stolen
products in grocery stores to poached parrots in jungles14). A routine activities approach
will allow for the specific attractive properties of products to be identified. Doing so will
permit the guardians of high-risk products to make informed decisions regarding methods
by which to reduce opportunities for theft through target protection.
By utilizing Rational Choice Theory, the results of this research are expected to generate
measures that reduce opportunities for theft. These measures may take the form of loss
prevention personnel shifting the organization of product sales floors and changing
current product security measures. These measures are one element of the data needed to
adequately understand offenders’ theft preferences. More research is required to
understand offenders’ decision making when they are choosing products to shoplift and 14 Pires and Clarke (2011).
89
resell. One such study of burglars (Macintyre, 2004) could be replicated to understand
the decision cues of shoplifters, some of which are similar to the decision cues of
burglars.
Gilling (1997) argues that the intention of Rational Choice Theory “has always been to
build a bridge between the situation (crime) and disposition (criminality), thereby
bringing together what criminological politics has performed so much to keep apart”
(60). The findings of this research will assist this 'bridge-building' process and point to
the need to examine other dispositional attributes that influence shoplifter decision-
making. Qualitative interviews of professional shoplifters who steal for resale purposes
would be a useful complement to the present research. The subtle differences in the
choices made by offenders should be recorded and analyzed. Rational Choice Theory
does not assume that choices are completely reasonable. Rather, exploration is needed to
differentiate between better decision makers (i.e., those who make better life choices and
have more successful short- and long-term life outcomes) from those who are less skilled
at making good choices (Paternoster & Pogarsky, 2009).
Policy Implications
This dissertation will have policy implications for manufacturers of hot products. This
dissertation intends to identify such products that warrant extra protection from theft.
Retailers can then choose security features for these products that match their risk of
theft. There are also some theoretical implications based on this research. This
dissertation should add to the already existing body of evidence on the abilities and limits

90
of CRAVED. Finally, there are two other possible implications resulting from an
additional study of these data on the theft of over-the-counter (OTC) drugs: 1) Increased
FDA scrutiny of abused OTC drugs and 2) Better loss prevention measures for by stores
and manufacturers to reduce theft of identified and documented OTC drugs.
The product of this research will add to the shoplifting literature by reiterating the call for
groups of retailers, policymakers and police executives to convene and identify problems
at the local level. Using the principles of POP, the group could exchange information
and design appropriate responses to the problems. By doing so, the field of crime
prevention can take proactive steps and implement evidence-based strategies to address
criminal behavior (Tilley & Laycock, 2002; Sherman et al., 2002). Security executives
and personnel would benefit from crime prevention measures because of the ease of their
implementation and their ‘common sense’ nature. Because the principal roles of security
personnel consist of providing security and reducing opportunities to commit crimes, they
would benefit from extensive methodological expertise needed to evaluate and strengthen
their policies and practices (Gill, 2006). Thus, this research will provide retailers and
property owners a starting point for reducing opportunities to commit theft.
Opportunity and target reduction is a necessary first step for retailers and police aiming to
reduce shoplifting. However, Schneider (2005) warns,
“[Such] crime prevention efforts will not be successful if stores mount them in isolation, nor will they be successful if retailers are excluded from appropriate response by the police. Government officials must work in co-operation with the business and retail sector to devise effective strategies that deter thieves from stealing specific types of property. Qualitative data analyses stemming from police databases, prison

91
interviews and interviews with store victims can better inform retailers and the overall business sector on what property is at risk.” A long-term solution is for police authorities to work in conjunction with industry for the purpose of designing theft out of product and out of the store” (56).
Although Schneider’s proposal for police and retail collaboration is an ideal example of
Problem-Oriented Policing (POP), such focus groups are rare. Whereas shoplifting in
general has not captivated lawmakers’ attention, organized retail crime has gained
consideration. The U.S. Legislature recently responded by passing legislation for harsher
official sanctions against those involved with organized retail crime groups.
This research intends to contribute to the theft preference literature by determining which
FMCG are most at risk for theft based on their attributes. By doing so, this study may
shed light on thieves’ decision-making processes when they shoplift products strictly for
the purpose of illicit resale or trade. Retailers can then choose from a multitude of
available security features for these products that best match their risk of theft. With this
information, retail loss prevention departments will be able to defend the products most at
risk of theft.
Retailers need to avoid the “typical sequence” caused when new and desirable products
are introduced. Pease (1997) and Ekblom (1997) have described the sequence as: 1) the
new product is released for sale with little thought to its crime consequences; 2) the crime
consequences become evident; and 3) the product is then modified, but after it may have
yielded, what Clarke (1999) refers to as a “crime harvest” (27).
92
Clarke (1999) proposes that it is possible for stores to reduce shoplifting if they reduce
theft of the most desirable, “hot products” because they would be less tempted to target
those goods, thus making them less likely to target other, less risky products.
High rates of shoplifting by thieves targeting hot products may have a greater impact on
store profits since thieves can steal other items and cause law-abiding shoppers to be less
likelyt o shop when these most attractive hot products have been depleted by shoplifters
(DiLonardo, 1997; Hayes, 1997; Clarke, 1999). The repeated counting (i.e., inventory) of
hot products in warehouses in stores has also proven to be a useful endeavor in deterring
potential thieves from stealing these high risk goods (Masuda, 1992).
Situational Crime Prevention
Since this study was approached from situational-based methodologies, it is appropriate
to mention situational crime prevention (SCP) was an efficient method of reducing
opportunities for crimes to occur, thereby indirectly reducing crime. Focusing on the
situation (e.g., environment) instead of the offender, SCP has grown to included 25
techniques that have been proven to reduce many forms of crime, not only theft (Clarke
and Eck, 2005). Table 19 summarizes these 25 techniques. There are several techniques
that apply to shoplifting and these are detailed below.
Increase the Effort
Target-harden
a) Using tamper-proof packaging,
b) Large plastic cases for small items so concealment is more difficult
93
c) Locking hot products in cabinets, requiring customer to ask employee to unlock
cabinet, bring product to register to purchas
Control access to facilities
a) Certain expensive or controlled products kept behind pharmacy or customer
service counters
Screen exits
a) Electronic Article Surveillance (EAS) Tags – if not removed by store staff,
cause an alarm at the exit to sound
b) Posting security guards at exits
c) Having employees at exit to crosscheck number of products sold on receipt
with number leaving store
Increase the Risks
Extend guardianship
a) Place at-risk products near counter or registers where employees can view them
Utilize place managers
a) CCTV system which is visible to potential offenders
Strengthen formal surveillance
a) Having security guards or off-duty police as a visible deterrent
b) Having loss prevention plainclothes officers
Reduce the Rewards
Identify property
a) Using stickers or other property marking to let consumers know where the
product was intended to be sold may deter sales at illicit markets

94
Deny benefits
a) Using ink tags – without store machinery to remove tag, when removed any
other way will break tag and spill permanent ink on product. This tactic may
only be effective for clothing items
Reduce Provocations
Neutralize peer pressure
a) Maintain close surveillance to groups of juveniles in store; let them know they
are being watched.
Remove Excuses
Alert conscience
a) Signs noting that shoplifting is wrong, or “shoplifting is stealing”
Assist compliance
a) With newer self-checkout methods, employees should make their presence
known to customers and assist them with their checkout and verify all goods
are scanned and paid for.

95
23

96
Data Limitations
Unfortunately, because of data limitations, 6 of the 11 AT CUT PRICES model attributes
were not operationalized for this study. 4 of these (Transportable, Tradeable, Evaluable
and Shiftable) cannot be used in this study because of the lack of data. These are all
attributes which are not can only be answered by the black market buyer or shoplifter,
after the fact. More research in illicit markets is required to measure these concepts.
Further, only qualitative interviews with shoplifters, stealing for the purpose of resale,
would provide any sort of data for these four attributes. In addition to the four other
attributes, another 2 were not operationalized since both dichotomous variables
(Untraceable and Imperishable) were both found to contain more than 99% of the cases in
the sample. Unfortunately, with the data available, only 5 of the 11 AT CUT PRICES
attributes were operationalized.
The main limitation to these data is that they are not the exact number of thefts and still
must be considered estimates. Retail supermarkets sell billions of products each year –
the exact number of thefts is impossible to calculate since thefts are not always detected.
The theft counts from this source are probably the best estimate of shoplifting data
achieved to this date for “big box” stores. Rather than relying solely on traditional
shoplifting measures like shrinkage (i.e., total store loss), the database only includes
products believed to have been lost due to theft. This offers considerable more internal
validity to the theft count measure. In terms of the theft rate, another limitation is that the
variation in that rate could be caused by the denominator – Number of Sales.

97
Implications for Products with Illicit Drug Functions Study
There are three two possible implications which may result from the results of this study:
1) Increased FDA scrutiny of abused OTC drugs, and 2) Better loss prevention measures
for by stores and manufacturers to reduce theft of abused products. Certain drugs, namely
medicines containing DXM, are widely abused and have led to a number of deaths in
younger persons. Increased regulation of medicines with DXM by government agencies
like the Food and Drug Administration (FDA) may prove helpful to lower youth
mortality and drug abuse of DXM. This would not be the first time an OTC drug was
more strictly regulated. In 2005, the U.S. Congress passed the Combat Methamphetamine
Act. This law increased regulation of OTC decongestants containing ephedrine and
pseudoephedrine – the chemicals used to produce methamphetamine. The law made the
drug harder to obtain by: 1) restricting number of sales, 2) securing the drugs behind
pharmacy counters, and 3) only allowing sales to persons 18 and older with valid
identification. It seems likely that youthful drug abusers would find it more difficult to
obtain this substance. Perhaps similar legislation regulating DXM would be a step in the
right direction. The FDA states the following about OTC drugs: “their benefits outweigh
their risks, the potential for misuse and abuse is low, consumers can use them for self-
diagnosed conditions, they can be adequately labeled and health practitioners are not
needed for safe and effective use of the product.” It can be argued that many of these
shoplifted products are being misused and some of the products have a high potential for
abuse (e.g., DXM, antihistamines). Since the FDA regulates such products, it may be
helpful for them to be aware of their theft, which may indicate misuse and perhaps
reevaluate their potential for misuse and abuse.

98
Since many of the products at risk of being abused are also shoplifted most, stores may
already provide more security for those products. However, they would benefit knowing
which products are at risk of abuse. But some evidence exists that they may already
know. In a recent survey of retailers, Courser et al. (2009) found that retailers seemed
reasonably aware of how their products are able to be abused. Further, retailers were also
aware that it was relatively easy for individuals to purchase or shoplift legal products
used to get high (Courser et al., 2009). Manufacturers could help prevent theft of abused
products through better anti-theft designs of products’ packaging. For example, electronic
article surveillance (EAS) tags, making larger and more difficult to open packaging, as
well as unique product tracking numbers for products could all prove to reduce theft.
However, manufacturers have resisted changing risky products when they are not directly
harmed by the crime (Clarke and Newman, 2005). But manufacturers should consider
that they might be contributing to drug addiction by failing to protect their goods from
theft (Clarke, 2000). It seems plausible that both stores and manufacturers may be
enabling product misuse and abuse, albeit indirectly. If government intervened in this
growing problem of product abuse, perhaps stores and manufacturers would use more
resources to protect these products from theft and subsequent abuse.
There are two main limitations of this study that need to be addressed. First, the products
identified as being used for illicit drug use purposes may be shoplifted for their intended
uses, rather than their known misuses. It seems logical that many of these products are
stolen and abused, but certainly not all of them. Another limitation is that products with
99
drug abuse functions may or may not be shoplifted for the purpose of misuse. Clearly,
many of these products have value for their intended uses and are stolen strictly for that
value. For example, baby formula is a relatively expensive product and is a commodity
that is required by many families. Thus, baby formula may be stolen at high rates for its
intended rather than unintended uses. The second limitation is that the products in this
study, which are fast-moving consumer goods, are relatively inexpensive and can be
legally purchased and abused without considerable cost. It seems likely that many people
may simply purchase products legally for the purpose of abusing or otherwise using them
for an illicit drug function. Only qualitative interviews with persons who abuse products
for drug purposes would shed some light on the above limitations. Further inquiry into
this research should involve qualitative research. Interviews of thieves (as well as legal
purchasers) of persons illicitly using these products should provide possible
understanding of the two major limitations of the study listed above.

100
References
Adams, K., & Cutshall, C. R. (1987). Refusing to prosecute minor offenses: The relative
influence of legal and extralegal factors. Justice Quarterly, 4(4), 595-609.
Albanese, J. (1984). A systematic approach to the prevention of shoplifting and employee
theft. Journal of Security Administration, 7(1), 23-30.
American Psychiatric Association. 4th Diagnostic and statistical manual of mental
disorders. Washington, DC: American Psychiatric Association; 2000. Text
revision.
Anderson, C. E., & Loomis, G. A. (2003). Recognition and prevention of inhalant abuse.
American family physician, 68(5), 869.
Bailey, A.A. (2006). Retail employee theft: A theory of planned behavior perspective.
International Journal of Retail & Distribution Management, 34(11), 802-816
Baker, S. (2003). An analysis of timber trespass and theft issues in the Southern
Appalachian region (Doctoral dissertation, Virginia Polytechnic Institute and
State University).
Bamfield, J. and Hollinger, R.C. (1996). Managing losses in the retail store: A

101
comparison of loss prevention activity in the United States and Great Britain.
Security Journal, 7(1), 61-70.
Bamfield, J. (2004) Shrinkage, shoplifting and the cost of retail crime in Europe: a cross-
sectional analysis of major retailers in 16 European countries, International
Journal of Retail & Distribution Management, 32(5), 235-241.
Bamfield, J. (2012) The Global Retail Theft Barometer 2010. The Tenth Edition: Key
Findings from the Global Retail Theft Barometer 2010. Nottingham, UK: Centre
for Retail Research.
Banken, J. A., & Foster, H. (2008). Dextromethorphan. Annals of the New York Academy
of Sciences, 1139(1), 402-411.
Beck, A. (2004). Shrinkage in Europe: A Survey of Stock Loss in the Fast Moving
Consumer Goods Sector. Brussels: ECR Europe.
Bennett, T., Holloway, K., & Williams, T. (2001). Drug use and offending: summary
results from the first year of the NEW-ADAM research programme (p. 4).
London: Home Office.
Blanco, C., Grant, J. and Petry N.M. (2008) Prevalence and correlates of shoplifting in

102
the United States: Results from the national epidemiologic survey on alcohol and
related conditions (NESARC). American Journal of Psychiatry. 165, 905-913.
Boyer, E. W. (2004). Dextromethorphan abuse. Pediatric emergency care, 20(12), 858-
863.
Brantingham, Paul J. & Brantingham, Patricia L. (eds.). (1981). Environmental
Criminology. Waveland Press.
Brookson, C., Farrell, Mailley, J., Whitehead, S. and Zumerle, D. (2007). ICT Proofing
Against Crime. ETSI White Paper No. 5. Sophia Antipolis Cedex, France:
European Telecommunications Standards Institute.
Budden, M. (1999). Preventing shoplifting without being sued: Practical advice for retail
executives. Westport, CT: Quorum Books.
Burrows, J. (1988). Retail Crime: Prevention Through Crime Analysis. Crime
Prevention Unit, Paper 11. London: Home Office Crime Prevention Unit.
Cameron, M.O. (1964). The booster and the snitch: Department store shoplifting. New
Free Press.
Canton, L.G. (1987). Should shoplifters be prosecuted? Security Management, 31(5), 61-
64.

103
Carmel-Gilfilen, C. (2011). Advancing retail security design: uncovering shoplifter
perceptions of the physical environment. Journal of Interior Design 36(2), 21-38.
Casteel, C., Peek-Asa, C. and Howard, J. (2004). Effectiveness of crime prevention
through environmental design in reducing criminal activity in liquor stores: A
pilot study. Journal of Occupational and Environmental Medicine, 46(5), 450-
458.
Clarke, R. V. (1980): "Situational" Crime Prevention: Theory and Practice. In: British
Journal of Criminology, 20(2), 136-147.
Clarke, R. V. (1983). Situational Crime Prevention: Its Theoretical Basis and Practical
Scope. Crime and Justice, 4, 225-256.
Clarke, R. V. and M. Felson (Eds.) (1993). Routine Activity and Rational Choice.
Advances in Criminological Theory, Vol 5. New Brunswick, NJ: Transaction
Books.
Clarke, R. V. (1995). Situational Crime Prevention. Crime and Justice, 19, 91-150.
Clarke, R. V. (1999). Hot products: understanding, anticipating and reducing demand

104
for stolen goods (No. 112). Home Office, Policing and Reducing Crime Unit,
Research, Development and Statistics Directorate.
Clarke, R. V. (2000). Hot products: A new focus for crime prevention. Secure
foundations. Key issues in crime prevention, crime reduction and community
safety. London: Institute for Public Policy Research.
Clarke, R. V. (2003). Shoplifting. Problem-Oriented Guides for Series, No. 11.
Washington, DC: U.S. Department of Justice, Office of Community Oriented
Policing Police Services.
Clarke, R.V. and Cornish, D. (1985). Modeling offenders' decisions: a framework
for research and policy." In: M. Tonry and N. Morris (eds.), Crime and
Justice, Volume 6. Chicago: University of Chicago Press.
Clarke, R.V. and Harris, P. (1992). Auto theft and its prevention. Crime and Justice: A
Review of Research, 16, 1-54.
Clarke, R.V. and Eck, J. (2005). Become a Problem-solving Crime Analyst in 60 Small
Steps. Office of Community Oriented Policing Services. Washington, DC: US
Department of Justice
Clarke, R.V. and Newman, G. (2005). Designing out crime from products and systems.

105
Crime Prevention Studies, Volume 18. Criminal Justice Press: Monsey, NY.
Cohen, L. E., & Stark, R. (1974). Discriminatory Labeling and the Five-Finger Discount
An Empirical Analysis of Differential Shoplifting Dispositions. Journal of
Research in Crime and Delinquency, 11(1), 25-39.
Cohen, L. and Felson, M. (1979). Social change and crime rate trends: A routine activity
approach. American Sociological Review, 44, 488-608.
Cohn, E., & Farrington, D. (1999). Changes in the most cited scholars in twenty
criminology and criminal justice journals between 1990 and 1995. Journal of
Criminal Justice, 27, 345-359.
Cole, C., Jones, L., McVeigh, J., Kicman, A., Syed, Q., & Bellis, M. (2011). Adulterants
in illicit drugs: a review of empirical evidence. Drug testing and analysis, 3(2),
89-96.
Conca, A. J., & Worthen, D. R. (2012). Nonprescription Drug Abuse. Journal of
Pharmacy Practice, 25(1), 13-21.
Cornish, D.B. and Clarke, R.V. (1986). The Reasoning Criminal. New York: Springer-
Verlag.

106
Cornish. D.B. and R.V. Clarke (1987). Understanding crime displacement: an
application of rational choice theory." Criminology, 25, 933-947.
Courser, M. W., Holder, H. D., Collins, D., Johnson, K., & Ogilvie, K. A. (2009).
Evaluating Retailer Behavior in Preventing Youth Access to Harmful Legal
Products A Feasibility Test. Evaluation review, 33(5), 497-515.
Crouch, B. I., Caravati, E. M., & Booth, J. (2004). Trends in child and teen
nonprescription drug abuse reported to a regional poison control center. American
journal of health-system pharmacy, 61(12), 1252-1257.
Cullen, F. and Agnew, R. (2003). (Eds.) Criminological Theories. Los Angeles, Cal.:
Roxbury.
Dabney, D., Hollinger, R. and Dugan, L. (2004). Who actually steals? A study of covertly
observed shoplifters. Justice Quarterly, 21(4), 693-728.
Davis, M., Lundman, R. and Martinez Jr., R. (1991). Private corporate justice: Store
police, shoplifters, and civil recovery. Social Problems, 38(3), 395-411.
Department of Justice. Office of Justice Programs. Bureau of Justice Statistics. (2008-
2009), "National Crime Victimization Surveys (NCVS)."
107
DiLonardo, R.L. and Clarke, R.V. (1996). Reducing the rewards of shoplifting: An
evaluation of ink tags. Security Journal, 7(1), 11-14.
DiLonardo, R.L. (1997). Financial analysis of retail crime prevention. Business and
Crime Prevention, 249-261.
Drug Enforcement Administration Drug Fact Sheet Guide. (n.d.). Retrieved August 27,
2012 from DEA Official Web site:
http://www.justice.gov/dea/druginfo/factsheets.shtml
Eck, J. (2002). Preventing crime at places. Evidence-Based Crime Prevention, 241-294.
Egan, V. and Taylor, D. (2010). Shoplifting, unethical consumer behaviour, and
personality. Personality and Individual Differences, 48(8), 878-883.
Ekblom, P. (1986). The Prevention of Shop Theft: An Approach Through Crime
Analysis. Crime Prevention Unit, Paper 5. London: Home Office Crime
Prevention Unit.
Ekblom, P. (2005). Designing products against crime. In N. Tilley (Ed.), Handbook of
Crime Prevention and Community Safety. Cullompton, UK: Willan.
Farrington, D., S. Bowen, A. Buckle, T. Burns-Howell, J.Burrows and M. Speed (1993).

108
An experiment on the prevention of shoplifting. Crime Prevention Studies, Vol.
1. Monsey, N.Y.: Criminal Justice Press.
Farrington, D. (1999). Measuring, explaining and preventing shoplifting: a review of
British research. Security Journal 12(1), 9-27.
Fass, S. M., & Francis, J. (2004). Where have all the hot goods gone? The role of
pawnshops. Journal of Research in Crime and Delinquency, 41(2), 156-179.
Felson, M. (1986). Routine activities, social controls, rational decisions,
and criminal outcomes. In: D. Cornish and R.V.G. Clarke (Eds), The
Reasoning Criminal. New York, NY: Springer-Verlag.
Felson, M. (1995). Those who discourage crime. In Crime and place, edited by J.E. Eck
and D. Weisburd. Vol. 4 of Crime prevention studies. Monsey, New York:
Criminal Justice Press.
Felson, M. (1996) Preventing retail theft: An application of environmental criminology.
Security Journal, 7(1), 71-75.
Felson, M. (1998). Crime and Everyday Life. Thousand Oaks, CA: Pine Forge Press.
Felson, M. (2001). The routine activity approach: a very versatile theory of

109
crime. In R. Paternoster & R. Bachman (Eds.), Explaining Criminals and
Crime. Los Angeles: Roxbury Publishing Co
Felson, M. and Clarke, R.V. (1997). Business and Crime Prevention. Criminal Justice
Press: Monsey, NY.
Felson, M. and Clarke, R. V. (1998): Opportunity makes the Thief. Practical theory for
crime prevention. Police Research Paper 98. London: Home Office.
Ferreira, E. and Carvalho, H. (2009). Inhibiting factors in a hypothetical shoplifting
situation – A contribution to crime prevention. Issues of Business and Law, 1(1),
101-114.
Geason, S. and Wilson, P. (1992). Preventing Retail Crime.
Gelfand, R.L., Hartmann, D.P., Walder, P. and Page, B. (1973). Who reports shoplifters?
A field-experimental study. Journal of Personality and Social Psychology. 25,
276-285.
Gill, M., Howell, T., Hemming, M., Hart, J., Hayes, R., Wright, A. and Clarke, R.V.
(2004) The Illicit Market in Stolen Fast-Moving Consumer Goods: A Global
Impact Study. Perpetuity Research and Cosultancy International: Leicester, UK.

110
Gill, M. and Clarke, R.V. (2012). Differential theft risks of fast moving consumer goods.
In: Paul Ekblom (ed.) Crime Prevention and Product Design, Crime Prevention
Studies. Boulder, Co: Rienner.
Handford, M. (1994). Electronic tagging in action: a case study in retailing. In M. Gill
(Ed.), Crime at Work: Studies in Security and Crime Prevention, Vol. 1.
Leicester, UK: Perpetuity Press.
Handford, M. (2010). “National Retail Federation and eBay Join Forces to Thwart
Organized Retail Crime.” http://www.securitymanagement.com/news/national-
retail-federation-and-ebay-join-forces-thwart-organized-retail-crime-006881
Accessed January 4, 2011.
Hayes, R. (1993). Shoplifting Control. Prevention Press: Orlando, FL.
Hayes, R. (1999). Shop theft: an analysis of shoplifter perceptions and situational
factors. Security Journal, 12(2), 7-118.
Hayes, R. (2003). Loss prevention: Senior management views on current trends and
issues. Security Journal, 16(2), 7-20.
Hayes, R. (2005). Organized retail crime: product targeting. Loss Prevention: The
Magazine for LP Professionals, 4(3), 84-86.

111
Hollinger, R. and Davis, J. (2002). National Retail Security Survey: Final Report.
Gainesville, FL: Security Research Project, University of Florida.
Hopkins, M. (2002). Crimes against businesses: The way forward for future research. The
British Journal of Criminology, 42, 782-797.
Howard, M. O., Balster, R. L., Cottler, L. B., Wu, L. T., & Vaughn, M. G. (2008).
Inhalant use among incarcerated adolescents in the United States: Prevalence,
characteristics, and correlates of use. Drug and Alcohol Dependence, 93(3), 197-
209.
Howard, M. O., Bowen, S. E., Garland, E. L., Perron, B. E., & Vaughn, M. G. (2011).
Inhalant use and inhalant use disorders in the United States. Addiction Science &
Clinical Practice, 6(1), 18.
Howard, M. O., & Jenson, J. M. (1999). Inhalant use among antisocial youth:: prevalence
and correlates. Addictive Behaviors, 24(1), 59-74.
Johnson, B. and Carter, T. (2009). Combating the shoplifter: An examination of civil
recovery laws. Journal of Applied Security Research, 4(4), 445-461.
Johnston, L. D. (2010). Monitoring the future: National results on adolescent drug use:

112
Overview of key findings. DIANE Publishing.
Kimiecik, R. and Thomas, C. (2006) Loss prevention in the retail business. John Wiley:
Hoboken, NJ.
Klemke, L. (1992). The Sociology of Shoplifting: boosters and Snitches Today.
Westport, Conn.: Praeger Publishers.
Koch, R., Schuster E. and Lam, N. (2003) Prediction, Detection and Proof: An
Integrated Auto-ID Solution to Retail Theft. MIT White Paper, Cambridge, MA.
Krasnovsky, T. and Lane, R. (1998). Shoplifting: a review of the literature. Aggression
and Violent Behavior, 3, 219-235.
Kraut, R. (1975). Deterrent and definitional influences on shoplifting. Social Problems,
23(3), 358-369.
Langton, L. and Hollinger, R.C. (2005). Correlates of crime losses in the retail industry.
Security Journal, 18(3), 27-44.
Lessenger, J. E., & Feinberg, S. D. (2008). Abuse of prescription and over-the-counter

113
medications. The Journal of the American Board of Family Medicine, 21(1), 45-
54.
Lindblom, A., and Kajalo, S. (2011). The use and effectiveness of formal and informal
surveillance in reducing shoplifting: a survey in Sweden, Norway and Finland.
International Review of Retail, Distribution and Consumer Research, 21(2), 111-
128.
Majumdar, R. (2004). Product Management in India. Prentice Hall of India: New Delhi.
Masuda, B. (1992). Displacement vs. diffusion of benefits and the reduction
of inventory losses in a retail environment. Security Journal 3:131-136.
Miller, S. C. (2005). Coricidin® HBP cough and cold addiction. Journal of the American
Academy of Child and Adolescent Psychiatry, 44(6), 509-510.
Moore, R. H. (1984). Shoplifting in Middle America. International Journal of Offender
Therapy and Comparative Criminology, 28, 53-64.
Murphy, D.J.I. (1986). Customers and Thieves — An Ethnography of Shoplifting.
Avebury Pubishing Co.: Brookfield, VT.
National Retail Federation (2011). Organized Retail Crime Survey. Washington, DC.

114
Accessed from http://www.nrf.net on July 20, 2011.
Olson, D. T. (2007). Financing Terror. FBI Law Enforcement Bulletin, 76(2), 1-5.
Federal Bureau of Investigation, U.S. Department of Justice: Washington DC.
Parks, L. (2008). Uniting against ORC: LP exects work with each other, law enforcement
and legislatures to battle crime. Stores Magazine, 12 (May).
Patrick, P.A. and Gabbidon S.L. (2004). What's true about false arrests? Security
Management, 48, 48-56.
Patrick, X., Kovach, J. and Cheng, L. (2009). Experimental examination on the
effectiveness of loss prevention technology: A case study. International Journal
of Experimental Design and Process Optimisation, 1(2,3), 262-284.
Pires, S. F., & Clarke, R. V. (2011). Sequential foraging, itinerant fences and parrot
poaching in Bolivia. British Journal of Criminology, 51(2), 314-335.
Ray, J. and Briar, K.H. (1988). Economic motivators for shoplifting. Journal of
Sociology and Social Welfare, 15, 177-191.
Robin, G.D. (1969). Employees as offenders. Journal of Research in Crime and
Delinquency, 6(1), 17-33.

115
Romanelli, F., & Smith, K. M. (2009). Dextromethorphan abuse: clinical effects and
management. Pharmacy Today, 3, 48-55.
Schneider, J. (2003). Prolific burglars and the role of shoplifting, Security Journal, 16,
49-59.
Schneider, J. (2005). The link between shoplifting and burglary: the booster burglar.
British Journal of Criminology, 45, 395-401.
Sidebottom, A., Belur, J., Bowers, K., Tompson, L., & Johnson, S. D. (2011). Theft in
Price-volatile markets: on the relationship between copper price and copper theft.
Journal of Research in Crime and Delinquency, 48(3), 396-418.
Simon, H. (1955). A behavioral model of rational choice. Quarterly Journal of
Economics, 69, 99-118.
Simon, H. (1979). Rational decision making in business organizations. American
EconomicReview, 69(4), 493-513.
Simon, H. (1982). Models of bounded rationality. Cambridge, MA: MIT Press.
Smith, B. (2013). Assessing theft risks of products with roles in drug abuse. Unpublished

116
manuscript.
Smith, C., Bowers, K. J., & Johnson, S. D. (2006). Understanding bag theft within
licensed premises in Westminster: Identifying initial steps towards prevention.
Security Journal, 19(1), 3.
Soldz, S., Huyser, D. J., & Dorsey, E. (2003). The cigar as a drug delivery device: youth
use of blunts. Addiction, 98(10), 1379-1386.
Spriggs, A. and Gill, M. (2006). CCTV and the fight against retail crime: Lessons from a
national evaluation in the U.K. Security Journal, 19, 241-251.
Steffensmeier, D. and Terry, R. (1973). Deviance and respectability: An observational
study of reactions to shoplifting. Social Forces, 51(4), 417-426.
Stevenson R. and Forsythe, M. (1998). Stolen Goods Market in New South Wales: An
Interview Study With Imprisoned Burglars. New South Wales Bureau of Crime
Statistics and Research: Sydney, AUS.
Strang, J., Keaney, F., Butterworth, G., Noble, A., & Best, D. (2001). Different forms of
heroin and their relationship to cook-up techniques: data on, and explanation of,
use of lemon juice and other acids. Substance use & misuse, 36(5), 573-588.

117
Sutton, M. (2010). Stolen Goods Markets. US Department of Justice, Office of
Community Oriented Policing Services.
Sutton, M., Johnson, K. and Lockwood, H. (1998). Handling Stolen Goods & Theft: A
Market Reduction Approach. Research and Statistics Directorate, U.K. Home
Office, London, UK.
Talamo, J. (2007). Organized retail crime: executing the ORC strategy, Loss Prevention
Magazine 7(1): 58.
Thomas, A., Nallur, D. G., Jones, N., & Deslandes, P. N. (2009). Diphenhydramine abuse
and detoxification: a brief review and case report. Journal of
Psychopharmacology, 23(1), 101-105.
Tonglet, M. and Bamfield, J. (1997). Controlling shop crime in Britain: costs and trends.
International Journal of Retail & Distribution Management, 25(9), 293-300.
Tonglet, M. (2002). Consumer misbehaviour: An exploratory study of shoplifting.
Journal of Consumer Behaviour, 1(4), 336-354.
U.S. Congress. House of Representatives. Committee on the Judiciary. Subcommittee
118
on Crime, Terrorism, and Homeland Security (2005). Responding to Organized
Crimes Against Manufacturers and Retailers. Hearing, March 27, 2005. Serial
No. 109-36. Washington DC: U.S. Government Printing Office.
U.S. Congress. House of Representatives. Committee on the Judiciary. Subcommittee
on Crime, Terrorism, and Homeland Security (2008). Organized Retail Theft
Prevention: fostering a Comprehensive Public-Private Response. Hearing,
October 25, 2007. Serial No. 110-122. Washington DC: U.S. Government
Printing Office.
U.S. Congress. House of Representatives. Committee on the Judiciary. Subcommittee
on Crime, Terrorism, and Homeland Security (2010). Combating Organized
Retail Crime — The Role of Federal Law Enforcement. Hearing, November 5,
2009. Serial No. 111-96. Washington DC: U.S. Government Printing Office.
Walker, J., & Yatham, L. N. (1993). Benylin (dextromethorphan) abuse and mania.
British Medical Journal, 306 (6882), 896-896.
Walsh, D. (1978). Shoplifting: Controlling a Major Crime. London: Macmillan Press
Ltd.
Weaver, F. and Carroll, J. (1985). Crime perceptions in a natural setting by expert and
novice shoplifters. Social Psychology Quarterly, 48(8), 349-359.
119
Wiles, P. and Costello, A. (2000). The 'road to nowhere': The evidence for travelling
criminals, Home Office Research Study, no. 207, Research, Development and
Statistics Directorate, London.
World Health Organization (2012) Oral Rehydration. Retrieved September 2, 2012 from
Official WHO site:
http://www.who.int/medicines/publications/pharmacopoeia/ors/en/
Wyld, D. and Budden, M. (2009). Upping the ante: Using RFID as a competitive weapon
to fight shoplifting and improve business intelligence. The International Journal
of Managing Information Technology, 1(1), 1-10
Zalewski, T. (2007). Public and Private Policing in Retail?. Journal of Security
Education, 2(2), 27-46.
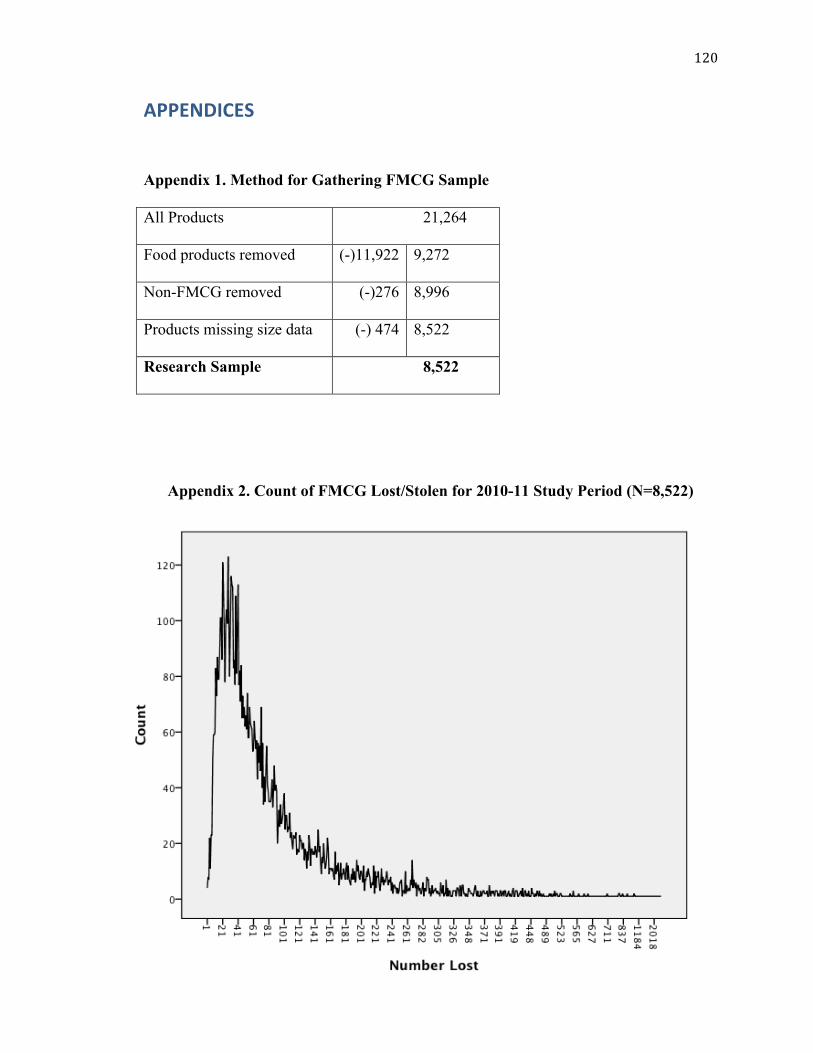
120
APPENDICES
Appendix 1. Method for Gathering FMCG Sample
All Products 21,264
Food products removed (-)11,922 9,272
Non-FMCG removed (-)276 8,996
Products missing size data (-) 474 8,522
Research Sample 8,522
Appendix 2. Count of FMCG Lost/Stolen for 2010-11 Study Period (N=8,522)

121
Appendix 3. Count of FMCG Stolen for 2010-11 Study Period (N=8,522)
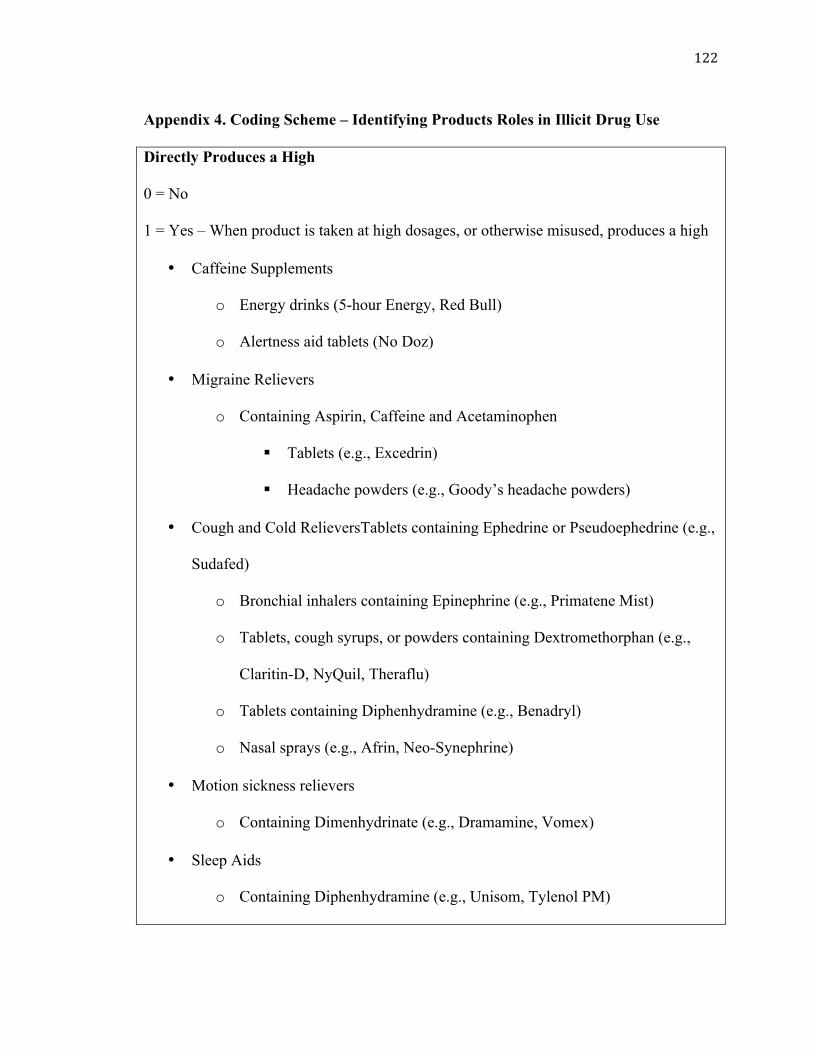
122
Appendix 4. Coding Scheme – Identifying Products Roles in Illicit Drug Use
Directly Produces a High
0 = No
1 = Yes – When product is taken at high dosages, or otherwise misused, produces a high
• Caffeine Supplements
o Energy drinks (5-hour Energy, Red Bull)
o Alertness aid tablets (No Doz)
• Migraine Relievers
o Containing Aspirin, Caffeine and Acetaminophen
§ Tablets (e.g., Excedrin)
§ Headache powders (e.g., Goody’s headache powders)
• Cough and Cold RelieversTablets containing Ephedrine or Pseudoephedrine (e.g.,
Sudafed)
o Bronchial inhalers containing Epinephrine (e.g., Primatene Mist)
o Tablets, cough syrups, or powders containing Dextromethorphan (e.g.,
Claritin-D, NyQuil, Theraflu)
o Tablets containing Diphenhydramine (e.g., Benadryl)
o Nasal sprays (e.g., Afrin, Neo-Synephrine)
• Motion sickness relievers
o Containing Dimenhydrinate (e.g., Dramamine, Vomex)
• Sleep Aids
o Containing Diphenhydramine (e.g., Unisom, Tylenol PM)

123
• Mouthwash
o Containing Ethyl Alcohol (e.g., Listerine, Scope)
• Permanent markers (e.g., Sharpie)
Enhances Illegal Drug High
0 = No
1 = Yes – Product is taken to enhance or prolong desired effects of other drug
• Caffeine Supplements
o Energy drinks (5-hour Energy, Red Bull)
o Alertness aid tablets (No Doz, Stay Awake)
• Antacids (e.g., Tums, Prevacid)
• Migraine Relievers
o Tablets (e.g., Excedrin)
o Headache powders (e.g., Goody’s headache powders)
• Cough and Cold Relievers
o Tablets containing Ephedrine or Pseudoephedrine (e.g., Sudafed)
o Bronchial inhalers containing Epinephrine (e.g., Primatene Mist)
o Tablets, cough syrups, or powders containing Dextromethorphan (e.g.,
Claritin-D, NyQuil, Theraflu)
o Tablets containing Diphenhydramine (e.g., Benadryl)
o Nasal sprays (e.g., Afrin, Neo-Synephrine)
• Motion sickness relievers
o Containing Dimenhydrinate (e.g., Dramamine, Vomex)

124
• Sleep Aids
o Containing Diphenhydramine (e.g., Unisom, Tylenol PM)
• Laxatives
o Any type of laxative in any form (e.g., Dulcolax, Metamucil)
• Weight loss pills
o Containing lipase inhibitors, such as Orlistat (e.g., Alli)
Reduces Ill-Effects of Drug Use
0 = No
1 = Yes – Product used to reduce drug side effects and/or withdrawal symptoms
• Oral care
o Cold and mouth sore remedies (e.g., Abreva, Orajel)
o Temporary tooth filling cement (e.g., Orafil, Dentemp)
o Mouthwash (e.g., Listerine, Scope)
• Pain relievers
o All general pain relievers (e.g., Tylenol, Advil, Bayer)
• Eye drops
o Redness relief drops (e.g., Visine, Clear Eyes)
• Caffeine Supplements
o Energy drinks (5-hour Energy, Red Bull)
o Alertness aid tablets (No Doz, Stay Awake)
• Antacids (e.g., Tums, Prevacid)
• Migraine Relievers

125
o Tablets (e.g., Excedrin)
o Headache powders (e.g., Goody’s headache powders)
• Cough and Cold Relievers
o Tablets containing Ephedrine or Pseudoephedrine (e.g., Sudafed)
o Bronchial inhalers containing Epinephrine (e.g., Primatene Mist)
o Tablets or cough syrups containing Dextromethorphan (e.g., Claritin-D,
NyQuil)
o Tablets containing Diphenhydramine (e.g., Benadryl)
o Nasal sprays (e.g., Afrin, Neo-Synephrine)
• Motion sickness relievers
o Containing Dimenhydrinate (e.g., Dramamine, Vomex)
• Sleep Aids
o Containing Diphenhydramine (e.g., Unisom, Tylenol PM)
• Laxatives
o Tablets or powders (e.g., Dulcolax, Metamucil)
Illegal Drug Ingredient
0 = No
1 = Yes – Product is used as an ingredient or additive to manufacture an illegal drug
• Baby formula
o In powder form
• Petrol/Gas products
o Fuel additives

126
o Camping fuel
• Laxatives
o In powder form and contain a sugar-based chemical (e.g., Miralax)
• Iodine
• Lithium batteries
• Migraine relievers
o In powder form (i.e., headache powders)
• Cough and cold medicines
o Tablets containing Ephedrine or Pseudoephedrine (e.g., Sudafed)
o In powder form (e.g., Alka Seltzer, Theraflu)
• Antacids
o In powder form (e.g., Alka Seltzer)
• Pain relievers
o Tablets containing acetaminophen (e.g., Tylenol, Advil)
• Caffeine tablets (e.g., No Doz)
Illegal Drug Paraphernalia
0 = No
1 = Yes – Product used in the consumption of illegal drugs:
• Cigarette lighters (e.g., Bic)
• Utility knife blades (e.g., Black and Decker)
• Cigars (e.g., Phillies, Black and Mild)
• Tweezers (e.g., store-brand)

127
• Plastic drink straws (e.g., store brand)

128
VITA Date and Place of Birth 28 July 1981 Wayne, New Jersey, U.S.A. Secondary School Attended North Warren Regional High School Blairstown, New Jersey High School Diploma (June, 1999) Universities Attended Rutgers University Newark, New Jersey Bachelor of Science – Criminal Justice – (May, 2004) Rutgers University Newark, New Jersey Master of Arts – Criminal Justice – (May, 2006) Rutgers University Newark, New Jersey Doctor of Philosophy – Criminal Justice – (May, 2013) Positions Held Adjunct Professor Rutgers School of Criminal Justice (2006-2010) Newark, New Jersey Adjunct Professor Sussex County Community College – Department of Criminal Justice Newton, New Jersey Dissertation Fellow Rutgers Graduate School (2010-2011) Newark, New Jersey Assistant Professor, Criminal Justice University of New Haven (2012-present) West Haven, Connecticut