dissolution of ilmenite in sulphuric aci unded r …
TRANSCRIPT
DISSOLUTION OF ILMENITE IN SULPHURIC ACID UNDER
REDUCING CONDITIONS WITH CONTROLLED ABRASION
by
AUTAR KRISHEN BHAN
A THESIS SUBMITTED IN PARTIAL FULFILMENT OF
THE REQUIREMENTS FOR THE DEGREE OF
MASTER OF APPLIED SCIENCE
i n the Department
of
METALLURGY
We accept t h i s t h e s i s as conforming t o the re q u i r e d standard
THE UNIVERSITY OF BRITISH COLUMBIA
August, I965.

In presenting this thesis in partial fulfilment of
the requirements for an advanced degree at the University of
British Columbia, I agree that the Library shall make i t freely
available for reference and study, I further agree that per
mission for extensive copying of this thesis for scholarly
purposes may be granted by the Head of my Department or by
his representatives. It is understood that.-'copying or publi
cation of this thesis for financial gain shall, not be allowed
without my written permission*
Department of Metallurgy
The University of British Columbia, Vancouver 8, Canada
Date April 29, 1966

T H E U N I V E R S I T Y O F B R I T I S H C O L U M B I A
VANCOUVER 8, CANADA DEPARTMENT OF METALLURGY May 10th, 1966.
COMMENTS ON THESIS
"Dissolution of Ilmenite in Sulphuric Acid under Reducing Conditions with Controlled Abrasion"
by Autar Krishen Bhan
There was considerable criticism expressed at the oral presentation, both with regard to the validity of the experimental procedures and the analysis of the leaching products. It was agreed that additional work should be done before the thesis would be considered acceptable.
The data in Appendix E was inserted to provide further evidence of reproducibility of technique and to support the claims made in the thesis with regard to the residue remaining in the autoclave after leaching.

ABSTRACT
The k i n e t i c s of d i s s o l u t i o n of i l m e n i t e , c o n t a i n i n g haematite ,
i n aqueous s o l u t i o n s of s u l p h u r i c a c i d have been st u d i e d . I r o n was found
to l e a c h from the mi n e r a l complex at a f a s t e r r a t e than t i t a n i u m . The
rat e s of s o l u t i o n of both i r o n and t i t a n i u m i n c r e a s e d , up t o c e r t a i n
l i m i t i n g v a l u e s , upon abrading the mi n e r a l during l e a c h i n g and were found
t o be r e l a t e d t o the hydrogen i o n a c t i v i t y of the l e a c h i n g s o l u t i o n by a
f i r s t order dependency. The r e s u l t s have been i n t e r p r e t e d i n terms of
p r e f e r e n t i a l and p o s s i b l y d i f f u s i o n — c o n t r o l l e d l e a c h i n g of the
haematite w i t h i l m e n i t e being removed both by slow l e a c h i n g and t e a r i n g out
from the specimen surface.

i i i
ACKNOWLEDGEMENT
. The author wishes to express his sincere thanks to
Dr. E. Peters and Dr. I. H. Warren for their inspiring guidance and
encouragement throughout the period of study.
He wishes t© thank the members of the Faculty and staff
of the Department of Metallurgy for their continued support and interest
in this work.
The author wishes to thank the National Research Council
of Canada for the f inancia l aid through N.R.C. Grant No. A-lk63. The
award of a Clayburn-Harbison Fellowship (1963-6k) is gratefully
acknowledged.

i v
TABLE OF CONTENTS
Page INTRODUCTION 1
1.1 Processing Techniques f o r Il m e n i t e 1
1.2 Abrasion Leaching of Ilmenite . .. h
SCOPE OF PRESENT INVESTIGATION 6
EXPERIMENTAL 7
3 .1 Apparatus . '. ^ 7 3.2 M a t e r i a l s and t h e i r P r e p a r a t i o n 15 3.3 Procedure 16 3 .h Analyses 17
RESULTS 19
k.l Massive I l m e n t i t e Samples 19 k.2 Sintered. Samples 19 4.3 The E f f e c t of Abrasion Rate ? 20 k.k The E f f e c t of Temperature 2h k.5 The E f f e c t of A c i d i t y 31
DISCUSSION OF RESULTS . hk
CONCLUSIONS ^8
RECOMMENDATIONS FOR FUTURE WORK ^9
REFERENCES 50
APPENDIX.A: Ilmenite-Haematite B i n a r y 52
APPENDIX B: E s t i m a t i o n of I r o n and Titanium 5^
APPENDIX C: E s t i m a t i o n of Hydrogen Ion A c t i v i t y i n Sulphate • •
Systera ' f&t 150°C %
APPENDIX D: Analyses of Leach S o l u t i o n s 59
APPENDIX E: Debye-Scherrer Powder P a t t e r n Readings 63
APPENDIX F: R e p r o d u c i b i l i t y of r e s u l t s using s i n t e r e d i l m e n i t e samples 67 "

LIST OF FIGURES
Sample holder
Abrader
S t a i n l e s s s t e e l autoclave w i t h copper l i n e r
V a r i a t i o n of r a t e of i r o n d i s s o l u t i o n w i t h r a t e of ab r a s i o n .
V a r i a t i o n of r a t e of t i t a n i u m d i s s o l u t i o n w i t h r a t e of
abrasion
P l o t of r a t e of i r o n d i s s o l u t i o n vs. abrasion r a t e . . .
V a r i a t i o n of rat e of i r o n d i s s o l u t i o n w i t h temperature
V a r i a t i o n of r a t e of t i t a n i u m d i s s o l u t i o n w i t h temperature
Arrhenius p l o t of r a t e of t i t a n i u m d i s s o l u t i o n . . . .
Arrhenius p l o t of r a t e of i r o n d i s s o l u t i o n V a r i a t i o n of r a t e of i r o n d i s s o l u t i o n from haematite
w i t h temperature
P l o t of r a t e of i r o n d i s s o l u t i o n from haematite vs.
inverse absolute temperature
E f f e c t of a c i d c o n c e n t r a t i o n on r a t e of i r o n d i s s o l u t i o n
E f f e c t of a c i d c oncentration on r a t e of t i t a n i u m d i s s o l u t i o n
Iron d i s s o l u t i o n from haematite f o r a c i d s e r i e s . . . . -d[Fe]
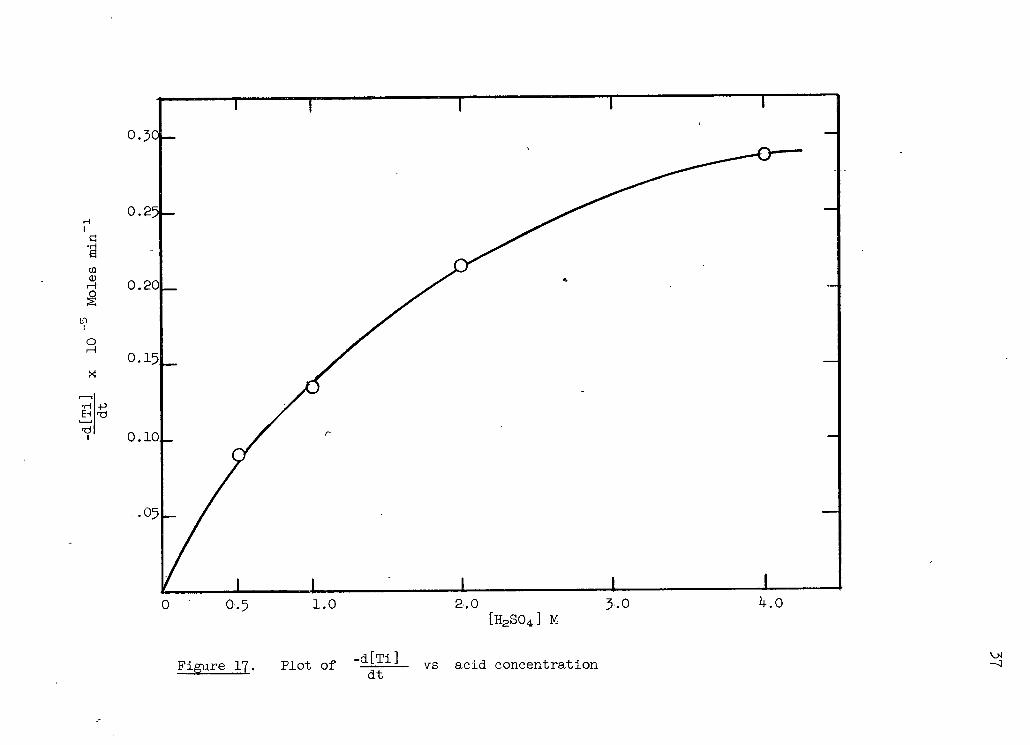
P l o t of — v s . a c i d c o n c e n t r a t i o n dt
P l o t of -dJ/T-LL vs. a c i d c o n c e n t r a t i o n dt
P l o t of r a t e of i r o n d i s s o l u t i o n from haematite with s u l p h u r i c a c i d c o n c e n t r a t i o n

v i
LIST OF FIGURES (Cont'd.)
No. Page
19. V a r i a t i o n of rat e of i r o n d i s s o l u t i o n w i t h a c t i v i t y of hydrogen ions 0̂
20. V a r i a t i o n of r a t e of t i t a n i u m d i s s o l u t i o n w i t h a c t i v i t y of hydrogen ions ^1
21. F i r s t order p l o t f o r r a t e of i r o n d i s s o l u t i o n vs. hydrogen i o n a c t i v i t y h2
22. - F i r s t order p l o t f o r rat e of t i t a n i u m d i s s o l u t i o n vs. hydrogen ion a c t i v i t y h^>
23. M i c r o - s t r u c t u r e of n a t u r a l i l m e n i t e ore sample k^>

v i i
LIST OF TABLES
No. Page
I D i f f r a c t o m e t r i c graph readings of ilmenite specimen . . 15
I I Rate of d i s s o l u t i o n of n a t u r a l i l m e n i t e samples . . . . 19
I I I E f f e c t of a b r a s i o n on the r a t e of d i s s o l u t i o n of s i n t e r e d
i l m e n i t e 20
IV E f f e c t of temperature on the r a t e of d i s s o l u t i o n . . . 2k
V E f f e c t of a c i d c o n c e n t r a t i o n on the r a t e of d i s s o l u t i o n 35
VI Analyses of l e a c h s o l u t i o n s ; - E f f e c t of a b r a s i o n . . . 60
V I I Analyses of l e a c h s o l u t i o n s ; E f f e c t of temperature . . . 6 l
V I I I Analyses of l e a c h s o l u t i o n s ; E f f e c t of a c i d c o n c e n t r a t i o n 62
IX Mean a c t i v i t y c o e f f i c i e n t s of s u l p h u r i c a c i d i n aqueous 'sol u t i o n from electromotive f o r c e measurements . . 58
X Debye-Scherrer powder p a t t e r n readings f o r residue i n the base of the autoclave / 64

INTRODUCTION
1.1 P r o c e s s i n g Techniques f o r Ilmenite
The t r a d i t i o n a l processes of hydrometallurgy i n v o l v i n g
d i s s o l u t i o n of oxide minerals i n a c i d s are w e l l known. For example z i n c
oxide i s d i s s o l v e d i n s u l p h u r i c a c i d t o produce s o l u t i o n s s u i t a b l e f o r recovery
of z i n c by e l e c t r o l y s i s . Many oxides, however, f o r unknown reasons do not
d i s s o l v e r a p i d l y i n a c i d s o l u t i o n s . - Some of these oxides are of considerable
economic i n t e r e s t , and an ex p l a n a t i o n of t h e i r slow r a t e s of d i s s o l u t i o n may
lead t o the development of techniques f o r l e a c h i n g them r a p i d l y from t h e i r
ores.
Among the l e s s e a s i l y d i s s o l v e d minerals i s i l m e n i t e , a complex
oxide of i r o n and t i t a n i u m . This m i n e r a l i s an important source of t i t a n i u m
i n the pro d u c t i o n of pigments and metal. Ilmenite i s present i n c o n s o l i d a t e d
rock deposits and as a component of some beach sands. In rock deposits of the
an o r t h o s i t e type, i t occurs intergrown w i t h haematite or magnetite i n massive 1
l e n s e s . Proportions of i r o n h i g her than the t h e o r e t i c a l may be due t o
admixed haematite or magnetite, w h i l e an excess o f t i t a n i u m i s due t o the
presence of r u t i l e ( T i 0 2 ) .
I l m e nite m i n e r a l 2 ' 3 i s attacked by hot concentrated s u l p h u r i c
a c i d . The most common commercial process f o r o b t a i n i n g t i t a n i u m of pigment
grade from i l m e n i t e c o n s i s t s , o f the f o l l o w i n g steps:
1. The f i n e l y ground ore i s t r e a t e d a t 150-250°C w i t h concentrated
s u l p h u r i c a c i d ; magnetic s e p a r a t i o n may precede t h i s o p e r ation i f too
much magnetite i s present i n the mi n e r a l .

2. • Water i s added t o d i s s o l v e the t i t a n i u m and i r o n sulphates.
I r o n scrap i s added t o reduce any f e r r i c i r o n present.
3. • S o l u t i o n s are c l a r i f i e d and pH and co n c e n t r a t i o n are adjusted.
I f composite pigments are r e q u i r e d , calcium or barium sulphate i s
added i n the' r e q u i r e d p r o p o r t i o n s .
k. The t i t a n i u m sulphate i s hydrolysed by b o i l i n g and i s p r e c i p i t a t e d
on barium or calcium c a r r i e r .
5. The hydrous t i t a n i u m oxide i s recovered by f i l t r a t i o n and washed
f r e e of i r o n s a l t s and a c i d s .
6. The washed m a t e r i a l i s fed i n t o a r o t a r y o i l - f i r e d - f u r n a c e where
i t i s d r i e d and c a l c i n e d t o convert the amorphous oxide t o a
c r y s t a l l i n e m o d i f i c a t i o n of r e f r a c t i v e index under 2.5-2.71-1
C a r e f u l h y d r o l y s i s , adjustment of i r o n content and proper c a l c i n a t i o n
are necessary f o r the best r e s u l t s . - C a l c i n a t i o n i s a c r i t i c a l
o p e r a tion and exe r t s a considerable i n f l u e n c e on the f i n a l c o l o u r ,
p a r t i c l e s i z e and t i n t i n g s t r e n g t h of the pigment.
This process consumes l a r g e q u a n t i t i e s of concentrated
s u l p h u r i c a c i d ; the average amount r e q u i r e d f o r pr o d u c t i o n of 1 ton of
T i 0 2 i s about 2 tons of 95$ s u l p h u r i c a c i d .
Another commercial process f o r the pr o d u c t i o n of "titanium
d i o x i d e pigments begins w i t h s m e l t i n g of i l m e n i t e ore w i t h carbon and
other f l u x i n g agents i n an e l e c t r i c f u r n a c e . 4 The r e s u l t i n g h i g h
t i t a n i u m s l a g can be t r e a t e d f o r recovery of t i t a n i u m by d i g e s t i o n i n
concentrated s u l p h u r i c a c i d .

The i r o n content of commercially a v a i l a b l e i l m e n i t e s i s
roughly. 5 0 $ . 1 Approximately h a l f of the a c i d consumed i n the conventional
pigment making process is- r e q u i r e d t o s o l u b i l i s e t h i s i r o n w i t h the
production of fer r o u s sulphate which i s wasted. In a d d i t i o n , strong a c i d s
(70-95$) have been found t o be e s s e n t i a l f o r the d i g e s t i o n o f i l m e n i t e
concentrates. . However, i l m e n i t e can r e a c t t o a l i m i t e d ' extent w i t h d i l u t e
s u l p h u r i c a c i d a t temperatures above 100°-120°C. The o v e r a l l r e a c t i o n
has been suggested as proceeding i n two s t a g e s ; 5
(1) FeT10 3 + 2H 2S0 4 FeS0 4 + TiO,S0 4 + 2H 20
' (2) TiO.S0 4' +• 2H 20 »- TiO (0H) 2 + H 2S0 4
Both i r o n and t i t a n i u m d i s s o l v e i n s u l p h u r i c a c i d t o give the
corresponding sulphates i n accordance w i t h r e a c t i o n ( 1 ) . According t o
r e a c t i o n (2) the t i t a n i u m sulphate i s hydrolysed and y i e l d s hydrous
t i t a n i u m oxide of v a r i a b l e water content. I f the e q u i l i b r i u m p o s i t i o n of
t h i s r e a c t i o n i s w e l l t o the r i g h t and a l s o i f the r a t e of attainment of
e q u i l i b r i u m i s s u f f i c i e n t l y r a p i d , then when i l m e n i t e i s leached w i t h d i l u t e
s u l p h u r i c a c i d the hydrous t i t a n i u m oxide may be p r e c i p i t a t e d on the surface
of the m i n e r a l . I n t h i s manner a complete c o a t i n g of t h e • i l m e n i t e w i t h
hydrous t i t a n i u m oxide might occur and f u r t h e r a t t a c k by the a c i d be
i n h i b i t e d .
. The h y d r o l y s i s of any. f e r r i c sulphate present, and coa t i n g of
the i l m e n i t e w i t h f e r r i c oxide may give r i s e t o a p o s s i b l e a d d i t i o n a l or
a l t e r n a t i v e source of i n h i b i t i o n 2 1 of the r a t e of d i s s o l u t i o n . However, a
s u f f i c i e n t l y reducing environment should be able t o maintain a l l the
d i s s o l v e d i r o n i n the fe r r o u s s t a t e .

4
H y d r o l y s i s of t i t a r r y 1 sulphate s o l u t i o n i s an important step i n
the manufacture of t i t a n i u m pigments. Various methods, such as b o i l i n g the
sulphate s o l u t i o n s , d i l u t i o n , • e t c , are commonly adopted. The chemical and
p h y s i c a l p r o p e r t i e s of the hydrous t i t a n i u m oxide produced by thermal
decomposition of sulphate s o l u t i o n s depend upon the c o n d i t i o n s under which
p r e c i p i t a t i o n i s c a r r i e d out. P a r r c i v a n o and C a g l i o t 7 showed th a t the
ra t e of h y d r o l y s i s can be increased by the a d d i t i o n of p r e c i p i t a t i n g n u c l e i
and t h a t the s t r u c t u r e of the p r e c i p i t a t e i s i n many cases dependent upon the
k i n d of n u c l e i added.
g
A l l e n and Bonsquet showed t h a t the recovery of t i t a n i u m oxide
from a s o l u t i o n c o n t a i n i n g as l i t t l e as 100 g / l i t r e was p o s s i b l e by the
a d d i t i o n of s t a b l e sulphates such as MgS04 e t c . which would not hydrolyse
w i t h the t i t a n i u m .
1.2 Abrasion Leaching o f . I l m e n i t e
A technique f o r l e a c h i n g i l m e n i t e ore i n d i l u t e s u l p h u r i c a c i d
has been described by M.H. T i k k a n e n 5 ' 6 . The i l m e n i t e concentrates of
— 100 mesh s i z e were" leached i n copper-lined h o r i z o n t a l - r o t a t i n g antoclaves,
i n which the speed could be v a r i e d between 11-42 rpm. The g r i n d i n g a c t i o n
on the min e r a l surface during l e a c h i n g was found t o increase the l e a c h i n g
e f f i c i e n c y * from 40$ t o 90-99$ w i t h 25-50$ s u l p h u r i c a c i d l e a c h i n g s o l u t i o n .
Higher e f f i c i e n c i e s were reported when us i n g copper b a l l s as g r i n d i n g media
i n place of quartz b a l l s ; t h i s was a t t r i b u t e d t o the higher s p e c i f i c
g r a v i t y of copper b a l l s .
100.($Ti0 g - 1.24 x $ Fe) $ T i 0 2
T o t a l T i 0 2 i n residue ]
[ Leaching e f f i c i e n c y =
$ T i 0 2 =

The f o l l o w i n g optimium c o n d i t i o n s f o r s e l e c t i v e l e a c h i n g of i r o n from
i l m e n i t e concentrates w i t h d i l u t e s u l p h u r i c a c i d (7-25$) were recommended:
i Leaching temperatures 120° -l40°C
i i Leaching time 2-3 hours
i i i Reducing c o n d i t i o n s
i v The l e a c h process t o he c a r r i e d - out w h i l e simultaneously
s u b j e c t i n g the t r e a t e d m a t e r i a l t o a rubbing or g r i n d i n g
a c t i o n by means of s p e c i a l l y added g r i n d i n g media.
Tikkanen a t t r i b u t e d the higher l e a c h i n g e f f i c i e n c y i n the
presence of g r i n d i n g media t o the removal o f a surface f i l m by abras i o n .
The t o t a l surface area of the mi n e r a l surface exposed t o a c i d by the
abrading a c t i o n of copper b a l l s was not reported i n t h i s work. Since very
f i n e concentrates were used, the a c t u a l surface area of the t o t a l charge
was probably d i f f i c u l t t o c a l c u l a t e .

6
SCOPE OF PRESENT INVESTIGATION
The object of the present i n v e s t i g a t i o n was t o examine the
k i n e t i c s of l e a c h i n g of i l m e n i t e w i t h d i l u t e s u l p h u r i c a c i d w h i l s t i t s
surface was being abraded. So th a t the geometric surface area of the i l m e n i t e
would remain s u b s t a n t i a l l y constant during each experiment, a massive r a t h e r
than a p a r t i c u l a t e sample was used.

7
EXPERIMENTAL
3-1 Apparatus:
General
Two methods of a g i t a t i n g s o l u t i o n s i n autoclaves have been
employed i n these l a b o r a t o r i e s i n k i n e t i c s t u d i e s . These are:
i . A g i t a t i o n of the l e a c h s o l u t i o n s by a motor-driven
p r o p e l l e r or t u r b i n e s t i r r e r .
i i . A g i t a t i o n by shaking miniature autoclaves i n a h o r i z o n t a l
plane.
Simple a g i t a t i o n by one of these two methods i s known t o be
i n e f f e c t i v e i n removing surface f i l m s formed on mi n e r a l p a r t i c l e s d u r ing
l e a c h i n g . In order t o e f f e c t removal of such f i l m s i t i s necessary t o
generate more severe p h y s i c a l a c t i o n on the surface of the p a r t i c l e s than
t h a t provided by the shearing a c t i o n of the aqueous le a c h s o l u t i o n . For
the p r e s e n t . i n v e s t i g a t i o n , t h e r e f o r e , the massive i l m e n i t e sample was
mounted (Figure 1) i n such a p o s i t i o n t h a t i t s surface could be c o n s t a n t l y
and u n i f o r m l y abraded by a r e v o l v i n g copper b l o c k (Figure 2 ) . -The min e r a l
specimen was maintained i n clos e contact w i t h the abrading b l o c k a t a l l times
by a spring-loaded mechanism. (The s p r i n g was made of 3$ beryllium-copper
a l l o y , annealed at 650°F f o r 2 hours).
A l l experiments were performed i n a copper-lined one l i t r e
autoclave (Figure 3)> "the body of which was constructed of 316 s t a i n l e s s
s t e e l . The s o l u t i o n sample e x i t tube as w e l l as the e x i t valve were made
of copper t o avoid any d i r e c t contact between the l e a c h i n g a c i d and the

Figure 1 Specimen and sample holder

9
- sleeve
" t e f l o n s e a l
i i i i copper b l o c k
Figure 2 Abrader

10
1. F i l t e r 2. Sample 3- Copper Block k. Thermocouple W e l l 5- Sample Holder 6. Autoclave Body-7- Copper L i n e r 8. Copper Gasket 9- Thrust Washer
10. .Cover Nut l l . Sampling Tube 12. Exhaust 13- S p r i n g 14. Thermoprobe'Well 15- S t i r r e r
F igure 3 - S t a i n l e s s S t e e l Autoclave w i t h Copper L i n e r

11
autoclave s t u f f i n g box. .Copper was a s u i t a b l e m a t e r i a l t o be i n contact
w i t h the l e a c h i n g a c i d i n these experiments since c o n d i t i o n s were
maintained reducing at a l l times.
The conventional p u l l e y - d r i v e n s t i r r e r s h a f t was replaced f o r
these experiments by a magnet-drive u n i t s u p p l i e d by Autoclave Engineers
U.S.A. The advantage of such a u n i t , i s t h a t i t e l i m i n a t e s the t e f l o n
packing s e a l s and thus the f r i c t i o n and s h a f t heating problems a s s o c i a t e d
w i t h the conventional equipment. Leakage of gases from the autoclave i s
completely e l i m i n a t e d w i t h the magnet-drive u n i t and long t r o u b l e - f r e e
operation of the s t i r r e r i s achieved'. Since t h i s i s the f i r s t i n s t a l l a t i o n
of such a u n i t i n t h i s l a b o r a t o r y i t s c o n s t r u c t i o n and operation i s f u l l y
d i scussed.
In the magnedrive s t i r r e d a u t o c l a v e s , h i g h or low speed
r o t a r y a g i t a t i o n i s e f f e c t e d by the r o t a t i o n of- e x t e r n a l magnets which
actuate i n t e r n a l magnets fastened t o the s h a f t .
The e x t e r n a l d r i v e magnet assembly c o n s i s t s of an outer s t e e l
housing c o n t a i n i n g f o u r rows of permanent magnets spaced at 9 0 ° i n t e r v a l s
and arranged w i t h f o u r a t t r a c t i n g poles on t h e i r i n ner f a c e s . This outer
magnet housing i s p l a c e d over a pressure sealed inner housing c o n t a i n i n g
c i r c u l a r permanent ceramic magnets mounted.on a square r o t o r s h a f t . The
strong magnetic f i e l d thereby created makes the inner pressure sealed r o t o r
s h a f t r o t a t e at the same rpm as the outer housing.
Gas may be introduced i n t o the autoclave v i a an i n l e t tube which
i s attached t o the top of the s t i r r e r s h a f t housing. By maintenance of a
s m a l l flow of gas i n t o t h i s tube, condensation of water vapour w i t h i n the
magnetic s t i r r e r - d r i v e u n i t may be prevented.

12
Speed C o n t r o l
The r a t e of abrasion was v a r i e d by changing the speed of
r o t a t i o n of the s t i r r e r s h a f t . This was e f f e c t e d by c o n t r o l l i n g the speed
of r o t a t i o n of the outer magnet d r i v e assembly w i t h a Zeromax mechanical
r e g u l a t o r . A V12 n-P- s i n g l e phase, 1725 rpm, motor was used t o d r i v e the
input s h a f t of the speed r e g u l a t o r . The r o t a t i o n a l speed of the s t i r r e r was
measured by a tachometer i n d i c a t o r ( b a t t e r y operated) s u p p l i e d by Autoclave
Engineers w i t h the magnet-drive u n i t .
Temperature and Heating C o n t r o l
temperature of the autoclave was regulated by a Yellow Spring thermistemp
temperature c o n t r o l l e r , w i t h a high temperature t h e r m i s t o r probe i n s e r t e d
i n the autoclave. A d d i t i o n a l temperature checks/were made by i n s e r t i n g an
iron-constantan thermocouple w i r e i n a second copper thermocouple w e l l .
Sampling Tube
end was used f o r sampling the contents of the autoclave. This tube was
connected t o a beryllium-copper v a l v e , which was cooled e x t e r n a l l y , so t h a t
there was no vapour l o s s when t a k i n g a sample.
Each time a sample was taken, the e x i t tube was f l u s h e d out w i t h
a measured amount of l i q u i d ; f o r which due c o r r e c t i o n s were made i n the .
c a l c u l a t i o n of r e s u l t s .
The autoclave was heated a t the bottom by a gas burner. The
A copper tube w i t h a fine-grained- Gooch f i l t e r attached to one

Pressure Gauge and Seals
The pressure gauge used was a standard Duragauge, 3l6ss Type,
A s h c r o f t , U.S A. The V2" bottom connector was attached to the autoclave
by 1 / 4 M s t a i n l e s s s t e e l t u b i n g , which was a l s o used f o r a l l other e x t e r n a l
connections of the autoclave.
An annealed copper gasket which was.replaced from time t o time,
was used t o s e a l the autoclave. The tube connections used had a l l
standard metal t o metal s e a l s .
3.2 , M a t e r i a l s and t h e i r P r e p a r a t i o n
(&) Attempted Synthesis of Ilmenite
The b i n a r y phase diagram between FeO a n d T i 0 2 shows the
formation of i l m e n i t e (Fe0.Ti0 2) at a composition of 47.4$ FeO and 52.6$
T i 0 2 . The me l t i n g p o i n t of the compound i s l470°C.
C a l c u l a t e d amounts 9 of i r o n powder, i r o n oxide ( F e 2 0 3 ) and
t i t a n i u m oxide ( T i 0 2 ) were thoroughly mixed, and the powder was pressed
i n t o p e l l e t s i n a h y d r a u l i c press. The p e l l e t s were f i r e d a t d i f f e r e n t
temperatures below the melting p o i n t o f i l m e n i t e . Molybdenum c r u c i b l e s
under an i n e r t atmosphere of argon,were found s u i t a b l e f o r h o l d i n g the
p e l l e t s . The p e l l e t s broke before reaching the s i n t e r i n g temperature, and
the r e a c t i o n was found to be incomplete by X-ray a n a l y s i s .
Since i r o n powder i s denser than the other c o n s t i t u e n t s of the
mixture, i t probably segregated a t one place and then the proper p r o p o r t i o n a
d i s t r i b u t i o n was not maintained. This was overcome by heating the mixture

11+
above the me l t i n g p o i n t of i l m e n i t e .
The s o l i d i f i e d - m a t e r i a l showed the i l m e n i t e s t r u c t u r e under
X-ray d i f f r a c t i o n a n a l y s i s . The removal of s o l i d i f i e d d i s c s from the
molybdenum containers was d i f f i c u l t because they completely wetted the
surface of the con t a i n e r . . The bottom of the c r u c i b l e had t o be sawed o f f
to take the p e l l e t out. This was found uneconomical t o produce enough
samples f o r t h i s i n v e s t i g a t i o n .
(b) Ilmenite Ore Samples
Ilmenite from Norway Ilmenite Ore,•obtained through the courtesy
of P r o f e s s o r R. M. Thompson of the Geology Department,•U.B.C., was used f o r
t h i s i n v e s t i g a t i o n , e i t h e r as planchets cut from the massive ore sample or
as s i n t e r e d d i s c s . The ore was crushed and ground t o -200 mesh s i z e and
s i n t e r e d under pressure of 3-4000 p s i a t about 1050°C i n a 3 / 4 " gra p h i t e
die maintained i n an i n e r t atmosphere. The samples then prepared had a
maximum p o r o s i t y of 1.6-1.8$. The d e n s i t y of samples was found' t o be of
the order of 4.3-4.5, which i s i n good agreement w i t h t h a t of the n a t u r a l
m i n e r a l . -Absence o f any carbon pick-up was a s c e r t a i n e d by f i r i n g the sample
at 850°F f o r three hours; no s i g n i f i c a n t weight l o s s was observed. -X-ray
a n a l y s i s showed th a t the mi n e r a l i d e n t i t y of the minerals was r e t a i n e d .
( T a b l e ' I ) .
The samples showed the f o l l o w i n g chemical analysis- of the
p r i n c i p a l c o n s t i t u e n t s :
Titanium oxide ( T i 0 2 ) = 37.83$
Iro n oxide (FeO) = 53-36$

TABLE I
D i f f r a c t o m e t r i c graph readings of i l m e n i t e specimen.
Peak No. R e l a t i v e Peak Height
26 d(A5
1
2
3
4
1
2
3
N a t u r a l i l m e n i t e specimen. 80
80
50
30
41.6
45.2
68.8
48.2
S i n t e r e d i l m e n i t e specimen 80
100
30
41.4
43.8
51.4
2.7259
2.5189
1.7133
2.3706
2.7385
2.5952
2.2321

16
Assuming s t o i c h i o m e t r i c composition (FeO.Ti0 2) of the i l m e n i t e ,
f o r each mole of Ti0 2 there i s an equivalent amount of FeO a s s o c i a t e d w i t h
i t . Thus i n a 100 gms. sample 3U.O5 gms of FeO are a s s o c i a t e d w i t h Ti0 2
to form i l m e n i t e , whereas the r e s t , 19<31 Sms °f FeO = 21.15 gms of
Fe 20 3, are present i n the form of haematite. The r a t i o of i l m e n i t e t o
haematite i s J.hQ:!. The s e m i - q u a n t i t a t i v e spectrographic a n a l y s i s f o r
the minor c o n s t i t u e n t s was:
A l Mg Mn S i V Ag Ca i 0.4 5.0 0.5 0.3 0.5 Traces 0.05
A l l chemicals were reagent grade and were used without f u r t h e r
p u r i f i c a t i o n .
S u l p h u r i c a c i d of 96.5$ concentration was s u p p l i e d by the
N i c h o l s Company L t d . of Baker and Adamson standard of q u a l i t y .
Hydrogen gas was of commercial grade and was s u p p l i e d by
Canadian L i q u i d A i r Company i n c y l i n d e r s and was used without f u r t h e r
p u r i f i c a t i o n s .
3.3 Experimental Procedure
The experimental procedure comprised the f o l l o w i n g steps:
(1) P l a c i n g of the m i n e r a l sample i n p o s i t i o n i n the autoclave i n
a s p r i n g loaded sample hol d e r , such that the copper block
attached t o the s t i r r e r r e s t e d g e n t l y on the f l a t surface of
the sample.
(2) F l u s h i n g of the gas space above the s o l u t i o n w i t h hydrogen
gas t o purge the r e s i d u a l a i r before s t a r t i n g the h e a t i n g of
the autoclave.
(3) Maintenance of a constant flow of hydrogen gas a t constant
p a r t i a l pressure w i t h i n the autoclave during the whole of the
experiment.
(k) P e r i o d i c sampling of the s o l u t i o n t o f o l l o w the r a t e of
d i s s o l u t i o n of i l m e n i t e .
(5) F i l t r a t i o n of the sample solutions' and a n a l y s i s for t h e i r
i r o n and t i t a n i u m contents s e p a r a t e l y .
Reducing c o n d i t i o n s during the l e a c h i n g experiments were
f u r t h e r ensured by the a d d i t i o n of a c a l c u l a t e d q u a n t i t y of sodium s u l p h i t e
t o the l e a c h s o l u t i o n . -Corrosion of the copper l i n e r was n e g l i g i b l e . The
same l i n e r was used f o r a l l experiments which t o t a l l e d over 150 runs. The
same i s true f o r the s t i r r e r and the sample holder.
3.4 A n a l y t i c Methods
The i r o n c o n c e n t r a t i o n i n the sample s o l u t i o n s was determined
by ortho-phenanthroline [Appendix B ] . Ferrous i r o n r e a c t s w i t h 1-10-
ortho-phenanthroline t o form an orange-red complex [ ( C 1 2 H e N 2 ) 3 F e ] . The
colour i n t e n s i t y i s independent of the a c i d i t y i n the pH range of 2-9, and
i s s t a b l e f o r long p e r i o d s . F e r r i c i r o n . was>' - reduced w i t h hydroxylamine
h y d r o c h l o r i d e .
Standard hydrogen peroxide was used f o r the t i t a n i u m a n a l y s i s
[Appendix B ] , Hydrogen peroxide produces a yellow colour w i t h an a c i d
s o l u t i o n of t i t a n i u m sulphate. The c o l o u r i s thought t o be due t o
p e r t i t a n i c a c i d . With s m a l l amounts of t i t a n i u m the i n t e n s i t y of the colour
i s p r o p o r t i o n a l t o the amount of the element present, and t h e r e f o r e forms
the b a s i s of a c o l o r i m e t r i c method f o r the determination of the element •

Comparison i s u s u a l l y made w i t h standard t i t a n i c sulphate s o l u t i o n s .
• A Beckman spectrophotometer model-B type, was used t o measure
the c o l o u r i n t e n s i t i e s of the prepared a n a l y t i c s o l u t i o n s at a wave len g t h
of 5^0 mp. f o r i r o n and 420-mu-for t i t a n i u m . The spectrophotometer reads
d i r e c t l y i n o p t i c a l d e n s i t y which i s l i n e a r w i t h c o n c e n t r a t i o n since Beer's
law was obeyed i n each case.

19
RESULTS
4 . 1 R e s u l t s w i t h massive i l m e n i t e
A s e r i e s of experiments was performed us i n g the massive
i l m e n i t e samples. The r e s u l t s t a b u l a t e d i n Table I I show d i f f e r e n t
d i s s o l u t i o n r a t e s f o r i r o n f o r d i f f e r e n t runs performed under the same
experimental c o n d i t i o n s of temperature, a c i d c o n c e n t r a t i o n , • p a r t i a l
pressure of hydrogen and abrasion r a t e .
• Table I I
Rate of d i s s o l u t i o n of n a t u r a l i l m e n i t e samples
Temperature 150°C, p a r t i a l pressure of hydrogen - 9 atmospheres, a c i d c o n c e n t r a t i o n IM H 2S0 4, sodium s u l p h i t e 3 gms, and surface area of sample - 4 sq_. cm, s o l u t i o n volume- 600ml,
40 rpm 40 rpm kO rpm
-d[Fe] Rate d t Rate d t
0.746 1.601 1.339
Moles/min. x 10 °
4 . 2 R e s u l t s w i t h S i n t e r e d 1 Sample
High r e p r o d u c i b i l i t y of r e s u l t s was achieved by usin g the
s i n t e r e d samples. The k i n e t i c experiments were conducted under various
c o n d i t i o n s of temperature, abrasion speed, and molar concentration of a c i d
ranging from 0.1M t o 4 . 0 M a c i d s t r e n g t h . T y p i c a l d i s s o l u t i o n curves f o r

20
i r o n and. t i t a n i u m are shown i n Figures k and 5- The analyses of i r o n and
t i t a n i u m under v a r i o u s c o n d i t i o n s are t a b u l a t e d i n Tables V I , V I I and V I I I .
4.3 E f f e c t of Abrasion Rate
A number of experiments were performed t o i n v e s t i g a t e the e f f e c t
of abrasion r a t e on the m i n e r a l dissolution. The r e s u l t s of t h i s s e r i e s i n c l u d i n g
the d i s s o l u t i o n r a t e curves f o r i r o n and t i t a n i u m w i t h no ab r a s i o n , are shown
p l o t t e d i n Figures k and 5-
I t i s evident from the p l o t s of r a t e of d i s s o l u t i o n of Fe and T i
vs. a b r a s i o n -speed (Figure 6) t h a t there i s no f u r t h e r e f f e c t on i n c r e a s i n g
rate a f t e r a c e r t a i n optimium abrading speed. The e f f e c t of abr a s i o n i s
maximised at about 80 rpm i n the present case.
The e f f e c t s of temperature and a c i d s t r e n g t h on the d i s s o l u t i o n s
k i n e t i c s of the i l m e n i t e m i n e r a l were studi e d at the optimium abrading speed
of 80 rpm.
Table I I I
E f f e c t of Abrasion
EXPERIMENTAL CONDITIONS:- Temperature - 150°C, p a r t i a l pressure of hydrogen - 9 atmospheres, a c i d c o n c e n t r a t i o n IM-H2SO4, sodium s u l p h i t e - 3 gms and geometric surface area of sample k sq. cm-s o l u t i o n volume- 600ml.
Abrasion Rate
Rate-'!£!!
Moles/min x 10
Rate d t •
Moles/min x 10^
N i l 1.0892 • 0173
ho rpm 2.I875 .0862
80 rpm 3.1696 .1294
120 rpm 3.171^ .1302

Figure k. V a r i a t i o n of r a t e of i r o n d i s s o l u t i o n w i t h r a t e of abrasion.

22
Figure 5. V a r i a t i o n of r a t e of t i t a n i u m d i s s o l u t i o n w i t h r a t e of abrasion.

23
Figure 6. P l o t of r a t e of i r o n d i s s o l u t i o n vs. a b r a s i o n r a t e .

24
k.k E f f e c t of Temperature
The experimental c o n d i t i o n s f o r studying the e f f e c t of
temperature were: 1M s u l p h u r i c a c i d , abrasion speed 80 rpm, p a r t i a l pressure
of hydrogen gas 9 atmospheres,- and 3 gms. of sodium s u l p h i t e .
The d i s s o l u t i o n of the mi n e r a l was stu d i e d over a temperature
range of 120°C t o 210°C. D i s s o l u t i o n curves are p l o t t e d i n Figures 7 and 8
f o r i r o n and t i t a n i u m r e s p e c t i v e l y . The increase i n r a t e - f o r i r o n d i s s o l u t i o n
w i t h increase i n temperature i s s i g n i f i c a n t and l i n e a r i t y of the d i s s o l u t i o n
curves i s maintained at a l l temperatures. - Increase i n r a t e f o r t i t a n i u m
d i s s o l u t i o n i s r e l a t i v e l y low.
Table IV
E f f e c t of Temperature
P a r t i a l pressure of hydrogen - 9 atmospheres, a c i d c o n c e n t r a t i o n 1MH 2S0 4, abrasion r a t e 80 rpm, sodium s u l p h i t e - 3 gms, and geometric surface area- of sample k sq. cmr s o l u t i o n volume- 600ml.
Temperature -d[Fe] Rate — — — dt
Moles/min x 10~5
Rate ,. dt
Moles/min X 10"5
„ -d[Fe] Rate d t
Moles/min x 10"s
120°C 2.621 O.II85 2.4964 150°C 3-169 0.1294 3.0285 180°C 5.517 0.1526 5.3553 210°C 7.892 0.1722 7.7107
I r o n d i s s o l u t i o n from haematite only - c a l c u l a t e d

Figure 7. V a r i a t i o n of rat e of i r o n d i s s o l u t i o n w i t h temperature.

Figure 8. V a r i a t i o n of ra t e of t i t a n i u m d i s s o l u t i o n w i t h temperature.

27

28

29
Figure 11. V a r i a t i o n of i r o n d i s s o l u t i o n from haematite w i t h temperature.

30
Figure 12. P l o t of r a t e of i r o n d i s s o l u t i o n from haematite vs. inverse absolute temperature.

31
A c t i v a t i o n Energy Determination
Graphs were p l o t t e d of l o g [rate) vs. inverse absolute
temperature (Figure 9 and 10). The slope of the l i n e i n the Arrhenius
p l o t corresponds t o an a c t i v a t i o n energy of 1.68 k.cal/mole f o r t i t a n i u m
and 4.85 k.calories/mole f o r i r o n .
The t o t a l amount of i r o n i n the s o l u t i o n , , i s the i r o n from
both i l m e n i t e and haematite. Knowing the amount of t i t a n i u m i n s o l u t i o n ,
the e q u i v a l e n t i r o n a s s o c i a t e d w i t h i t i n i l m e n i t e can be c a l c u l a t e d , and
thus by s u b t r a c t i o n , the amount of i r o n from haematite i s evaluated.
Figure 11 corresponds t o the d i s s o l u t i o n of i r o n from haematite.
Arrhenius p l o t f o r i r o n drs s o l u t i o n ~f roitr-haematite" - i s shown p l o t t e d i n
Figure 12. The slope corresponds t o an a c t i v a t i o n energy of 5-05 k c a l / m o l e .
4.5 E f f e c t of A c i d i t y
A number of experiments were performed, t o i n v e s t i g a t e the e f f e c t
of a c i d c o n c e n t r a t i o n on the rat e s of i l m e n i t e d i s s o l u t i o n . A l l experiments
were c a r r i e d out at 150°C, and a hydrogen p a r t i a l pressure of 9 atmospheres.
Further experimental d e t a i l s are l i s t e d i n Table V I I I .
The experimental r a t e curves obtained i n t h i s s e r i e s are
dep i c t e d i n Figures 13, lh and the d i s s o l u t i o n of i r o n from haematite as
c a l c u l a t e d i s shown i n Figure 15. P l o t s of r a t e vs. a c i d c oncentration
show th a t the rat e s increase i n i t i a l l y w i t h the i n c r e a s i n g a c i d c o n c e n t r a t i o n
but then s l o w l y l e v e l o f f . [Figures 16, 17 and 18.]

32
225
30 60 90 120 150 180 210
Time minutes
Figure 13. E f f e c t of a c i d c o n c e n t r a t i o n on r a t e of i r o n d i s s o l u t i o n .

33
Figure lh. E f f e c t of a c i d c o n c e n t r a t i o n on r a t e of t i t a n i u m d i s s o l u t i o n .

34

Table V
E f f e c t of A c i d Concentration
Temperature - 150°C, abra s i o n r a t e - 80 rpm, p a r t i a l pressure of hydrogen - 9 atmospheres, sodium s u l p h i t e - 3 gms and geometric surface area of sample - 4 sq_. cm> Sol. v o l . 600 ml.
Concentration H 2S0 4
•A „ . -d[Fe] Rate — T T — dt
Moles/min x 10" 5
T, + -d[Ti] Rate ,. dt
Moles/min x 10 " 5
-d[Fe] Rate ,, dt
Moles/min x 10 " 5
0.5M .054-9 2.046 0.0906 1.9517
1.0M .0878 3.169 0.1294 3.0285
2.0M 0.1518 4.828 0.2137 4.6035
4.0M 0.3077 5.826 0.2878 5.5571
C a l c u l a t e d - See Appendix C£ Ir o n d i s s o l u t i o n from haematite only - c a l c u l a t e d


o 0.5 l.o 2.0 3.0 h.o [H 2S0 4] M
Figure 18. P l o t of v a r i a t i o n o f r a t e of i r o n d i s s o l u t i o n from haematite w i t h s u l p h u r i c a c i d concentration.

39
The a c t i v i t y of hydrogen ions i n the d i f f e r e n t a c i d concentration
was c a l c u l a t e d from the data of Harned and Hamer 1 8' 1 9. Data were e x t r a p o l a t e d
t o 150°C and the a c t i v i t y of hydrogen ions c a l c u l a t e d (See Appendix C ] . The
v a r i a t i o n o f r a t e of i r o n and t i t a n i u m d i s s o l u t i o n w i t h hydrogen i o n a c t i v i t y
i s shown p l o t t e d i n Figures 19 and 20 r e s p e c t i v e l y . •Log-log p l o t s of a H + v s - r a / t e o r" i r o n and t i t a n i u m d i s s o l u t i o n are l i n e a r as shown i n Figure
21 and 22 r e s p e c t i v e l y . The slope i n each case i s approximately 1.0

Figure 19. V a r i a t i o n of r a t e of i r o n d i s s o l u t i o n w i t h a c t i v i t y of hydrogen ions.

Figure 20 V a r i a t i o n of r a t e of t i t a n i u m d i s s o l u t i o n w i t h a c t i v i t y of hydrogen ions.


kk
DISCUSSION OF RESULTS
The l a c k of r e p r o d u c i b i l i t y of r e s u l t s when cut specimens of the
i l m e n i t e ores were leached, can.be a t t r i b u t e d , almost c e r t a i n l y , t o the uneven
d i s t r i b u t i o n of i l m e n i t e and haematite w i t h i n the specimens. The micro-
s t r u c t u r e (Figure 23) of the sample s u r f a c e , i n which the l i g h t areas are
haematite, shows t h i s non-uniform d i s t r i b u t i o n of minerals. The good
r e p r o d u c i b i l i t y obtained, on the other hand, when usin g crushed and s i n t e r e d
specimens of the ore i s t o be a t t r i b u t e d t o the high degree of homogenisation
which has taken p l a c e during the p r e p a r a t i v e processes which from X-ray data
however, leave the c o n s t i t u e n t minerals w i t h t h e i r m i n e r a l o g i c a l i d e n t i t y .
The f a c t t h a t s u b s t a n t i a l l y l i n e a r l e a c h i n g r a t e s are obtained f o r
both i r o n and t i t a n i u m w i t h i n the l i m i t s of concentrations obtained s t r o n g l y
suggests that n e i t h e r element has a t t a i n e d s a t u r a t i o n i n the s o l u t i o n . I t seems
u n l i k e l y t h e r e f o r e , at l e a s t under the c o n d i t i o n s used f o r these experiments,
that i n s o l u b l e products w i l l have formed on e i t h e r of the m i n e r a l s u r f a c e s .
The r e s u l t s obtained under a l l c o n d i t i o n s of temperature and s t i r r i n g r a t e show
tha t i r o n i s d i s s o l v i n g f a s t e r from the specimen than i s t i t a n i u m . •Since there
i s more i r o n than t i t a n i u m i n the specimen t h i s might be expected. However,
the r a t i o of i r o n t o t i t a n i u m appearing i n s o l u t i o n i s higher than t h a t i n the
specimens, i n d i c a t i n g t h a t there i s a p r e f e r e n t i a l s o l u t i o n of i r o n from the
specimens, f o r example, i n Tables VI,-VII and V I I I , at any stage of l e a c h i n g ,
the r a t i o of i r o n t o t i t a n i u m i s higher than that, i n the specimen. The
continued l e a c h i n g of i r o n from a specimen could lead f i r s t t o a surface
comprised of i s l a n d s of i l m e n i t e surrounded by a.sea of p a r t i a l l y leached
haematite and u l t i m a t e l y perhaps t o a surface composed almost completely of

4 5
Figure 25 M i c r o - s t r u c t u r e of n a t u r a l i l m e n i t e ore sample

he
i l m e n i t e - i t being understood t h a t the i l m e n i t e i t s e l f may be at l e a s t
p a r t i a l l y leached. However, f o r i r o n t o l e a c h at an u n i n t e r r u p t e d and
constant r a t e , which i t appears t o do under any given set of c o n d i t i o n s , i t
must be supposed t h a t the i l m e n i t e at no stage impedes the l e a c h i n g . This
could be e x p l a i n e d by supposing that i l m e n i t e i s removed from the specimen
both by slow l e a c h i n g and by ".tearing out" of unleached or p a r t i a l l y leached
g r a i n s by the mechanical abrader. During t h i s process i l m e n i t e g r a i n s
would be d i s p e r s e d as a f i n e s l u r r y - a f a c t which i s confirmed by the
appearance of a b l a c k powdered residue i n the bottom of the autoclave at the
end of each experiment. .This residue showed the c h a r a c t e r i s t i c i l m e n i t e
X-ray p a t t e r n (Table X.].
The experimental a c t i v a t i o n energies f o r both i r o n and t i t a n i u m
d i s s o l u t i o n are s u f f i c i e n t l y low t h a t i t could be p o s t u l a t e d t h a t both
correspond t o d i f f u s i o n c o n t r o l w i t h i n the aqueous system. The dependence
of l e a c h i n g r a t e i n a f i r s t order manner on hydrogen i o n a c t i v i t y would be
i n accord w i t h hydrogen i o n being the d i f f u s i n g species. I t would appear
p o s s i b l e i n the case of the h a e m a t i t e , i f . t h e hypothesis of l e a c h i n g a l r e a d y
p o s t u l a t e d i s c o r r e c t , t h a t d i f f u s i o n of a c i d t o the haematite i s t a k i n g
place i n the pores between i l m e n i t e g r a i n s - A l t e r n a t i v e l y i t might be
advanced t h a t the d i s s o l u t i o n of haematite under reducing c o n d i t i o n s i s a
c h e m i c a l l y c o n t r o l l e d process w i t h a low a c t i v a t i o n energy (5-6 k.cal/mole)
as opposed t o the d i r e c t d i s s o l u t i o n i n a c i d which has been found t o be
c h e m i c a l l y c o n t r o l l e d w i t h an a c t i v a t i o n energy of 18 k.cal/moles. 1 4 The
a c t i v a t i o n energy f o r i l m e n i t e d i s s o l u t i o n i s so low as t o c e r t a i n l y i n d i c a t e
d i f f u s i o n c o n t r o l w i t h i n s o l u t i o n . The a c t u a l region wherein t h i s c o n t r o l i s
exerted i s not able t o be i n f e r r e d by the present experiments. However, i t
i s p o s s i b l e t h a t the type of a b r a s i o n - a g i t a t i o n used has a major i n f l u e n c e
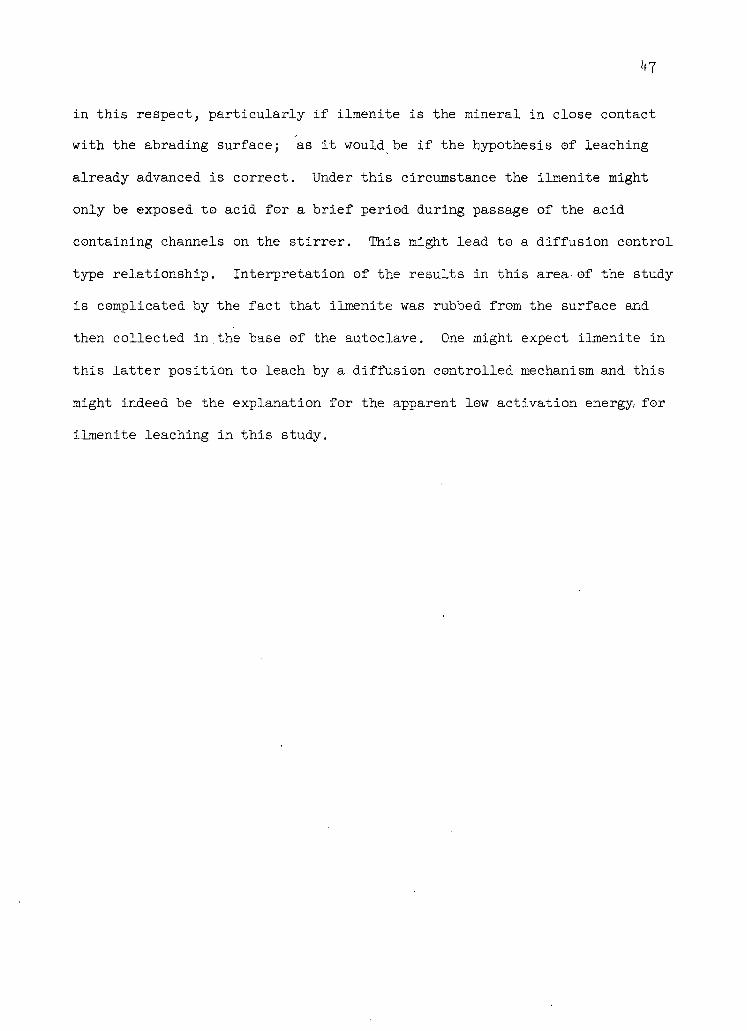
47
i n t h i s r e s p e c t , p a r t i c u l a r l y i f i l m e n i t e i s the m i n e r a l i n c l o s e contact
w i t h the abrading s u r f a c e ; as i t would be i f the hypothesis of l e a c h i n g
a l r e a d y advanced i s c o r r e c t . Under t h i s circumstance the i l m e n i t e might
only be exposed t o a c i d f o r a b r i e f p e r i o d during passage of the a c i d
c o n t a i n i n g channels on the s t i r r e r . This might lea d t o a d i f f u s i o n c o n t r o l
type r e l a t i o n s h i p . I n t e r p r e t a t i o n of the r e s u l t s i n t h i s area of the study
i s complicated by the f a c t that i l m e n i t e was rubbed from the surface and
then c o l l e c t e d i n the base of the autoclave. One might expect i l m e n i t e i n
t h i s l a t t e r p o s i t i o n t o l e a c h by a d i f f u s i o n c o n t r o l l e d mechanism and t h i s
might indeed be the e x p l a n a t i o n f o r the apparent low a c t i v a t i o n energy f o r
i l m e n i t e l e a c h i n g i n t h i s study.
. CONCLUSIONS
(1) The poor r e p r o d u c i b i l i t y of r e s u l t s observed when l e a c h i n g n a t u r a l
massive ore samples was a t t r i b u t e d t o the uneven d i s t r i b u t i o n of haematite
and i l m e n i t e w i t h i n the samples.
(2) D i s i n t e g r a t i o n and g r i n d i n g f o l l o w e d by hot p r e s s i n g y i e l d e d
homogeneous specimen c o n t a i n i n g the two min e r a l i d e n t i t i e s haematite and
i l m e n i t e .
(3) Abrasion of the surfaces of the specimens increased the r a t e s of
l e a c h i n j of both i r o n and- t i t a n i u m .
(k)- I r o n and t i t a n i u m were leached a t d i f f e r e n t i a l r a t e s from the specimens
w i t h a c t i v a t i o n energies of 5-05 k.cal/mole and 1.68 k.cal/mole r e s p e c t i v e l y .
(5) The r a t e s of s o l u t i o n of i r o n and t i t a n i u m were observed t o depend
i n a f i r s t order manner on the hydrogen i o n a c t i v i t y of the l e a c h i n g s o l u t i o n .

4 9
EEC OMMENDATIONS FOR FUTURE WORK
(1) The d i s i n t e g r a t i o n and s i n t e r i n g technique of p r e p a r a t i o n should be
extended and a separation of haematite and i l m e n i t e performed p r i o r t o
s i n t e r i n g . Magnetic methods might be used f o r the sepa r a t i o n .
(2) Experiments such as these conducted here should be repeated on the pure
s i n t e r e d i l m e n i t e specimens.
(3) The r o l e of s u l p h i t e i n the d i s s o l u t i o n of haematite should be
e s t a b l i s h e d .
(4) The mechanism of l e a c h i n g i n the presence of an a b r a d e r - s t i r r e r , such
as used i n these experiments, should be studi e d f o r other known systems, so
that i t s f u n c t i o n and behaviour be b e t t e r understood.

50
REFERENCES
* i 1. J . Bafksda.le, Titanium - O c c u r r e n c e C h e m i s t r y and Technology^ 1949.
Ronal'd Press Company,' N.Y.
2. Thomas G r i f f i n U.S. 2,982,613,1 May 2, I96I.
3. Helmut Espenschied U.S. 2,617,724, Nov. 11, 1952.
4. Toshi Noda, Trans. A.I.M.E. 17j. Jan.,25, 1965.
5. M.H. Tikkanen, T. Tyynela and E. V n o r i s t o , A.I.M.E..International Symposium on U n i t Processes i n Hydrometallurgy, Feb. 24 T28, I963, D a l l a s , Texas, :p.269.
6. M.H. Tikkanen, Can.-Patent, 582, 549, Sept. 1, 1959.
7. Pa r r c i v a n o and C a g l i o t , Ind. Eng. Chem. 29_, 213, 1-937.
8. -B. W. A l l a n and L.G. Bousquet U.S. 2,182,420, Dec. 5, I939 t o American
Zirconium Corp. Chem! Ab„ 1940,.34, 2193.
9. Phase Diagrams f o r ceramistSjAm. Ceramic Soc. Inc. F i g . 88 P162, 1964.
10. • A.B. Edwards, Texture o f the ore Minerals,Pub.Aust. Inst. Min. Met. 1947.
11. A.B. Edwards, Aust. I n s t . Min. Met. Proc. 110, 39-58 (I938).
12. T.L. Mackay and M.E. Wadsworth, Trans. A.I.M E. 212, 597, Oct. 1958.
13. -M.E. Wadsworth and D.R. Wadia, Trans. A.I,M.E.1,755 June I955.
14. -Kiyoshi Azuma and H i r o s h i Kametani, Trans. .A.I-.M.E. 230, 853, June 1964.
15. Tetsno Morimoto and Masashi Sakamoto, B u l l . Chem. Soc. of Japan 1369,36(10), Oct. 1963.
16. N. J Themelis and W.H. Gauvin, Can. Min. Met. B u l l . 5_5_, 444, J u l y , 1962.
17. W.M. Latimer/ O x i d a t i o n P o t e n t i a l s , P r e n t i c e H a l l , I n c., New York, 1952.
18. H.S. Harned and W.J. Hamer,JLAm. Chem. - Soc. 5_1, 27 (1935).
19. H.S. Harned and B.OwenThe P h y s i c a l Chemistry o f E l e c t r o l y t i c S o l u t i o n s . Reinhold P u b l i s h i n g Corp. New York, 1958.
20. J.A. 0'Conner, Chem. Eng. 58, 10, 136-9, 1951.

51
21. E. Posjnak and E.H. Merwin. Journal Am. Chem. Soc. kk, I965 (1922)
22. A.J. Gaskin and A.G. Ringwood, UiS. 2,95 ,̂278, Sept. 27, i960.
23. C a r l Wagner, Trans. A.I .M.E .k, 2lk, 1952.
2k. A.R. Burkin, A.I.M.E. Symposium on Unit processes i n Hydrometallurgy, Feb. I963, Dallas, Texas, p.80.
25. -Carl H. Binbaker J r . Journal Chem. Ed. 3_4, 326, July, 1957.
26. .C. Ligororio and L.T.-Work. Ind. Eng. Chem. 29_, 213, 1937•
27. L. ffimmel and M. Bir c h e n a l l , Trans. A.I.M.E.5_,827, 1953.

52
' APPENDIX A.
Ilmenite - Haematite Binary
Solid solutions are prevalent to a,more limited extent among
the opaque oxide minerals than in metals. Extensive solid solutions are
found t o occur e s p e c i a l l y at higher temperature, but owing presumably t o
the more complex nature of the c r y s t a l l a t t i c e s , such s o l i d s o l u t i o n s are
metastable and unmix t o some degree on c o o l i n g under the c o n d i t i o n s of
formation of ore d e p o s i t s .
The unmixing of a s o l i d s o l u t i o n takes place by the d i f f u s i o n
of the s o l u t e atoms or ions through the l a t t i c e of the s o l v e n t substances.
In s o l i d s o l u t i o n s of m i n e r a l oxides the process of d i f f u s i o n r e q u i r e s t h a t
the s o l u t e and solvent c a t i o n s s h a l l interchange p l a c e s , squeezing past each
other i n the l a t t i c e . If there are no empty spaces i n the c r y s t a l s t r u c t u r e ,
two atoms or c a t i o n s , one of the s o l u t e and one of the s o l v e n t , must be
loosened simultaneously before d i f f u s i o n can occur. The unmixing commonly
gives r i s e t o an o r i e n t e d intergrowth of the separate minerals. The
o r i e n t a t i o n o f these intergrowths v a r i e s w i t h the o r i e n t a t i o n of the host
( s o l v e n t ) c r y s t a l .
In the u n i t c e l l of haematite the oxygen atoms are arranged i n
approximate hexagonal cl o s e packing, i n such a way t h a t each Fe ° f a l l s between
6 oxygen atoms arranged o c t a h e d r a l l y . The i l m e n i t e s t r u c t u r e i s almost
i d e n t i c a l w i t h the haematite s t r u c t u r e , but w i t h t i t a n i u m atoms r e p l a c i n g h a l f
of the i r o n atoms i n a s t r i c t l y ordered sequence. The u n i t c e l l of haematite
has a = 5'4-2 and = 55° -Y\') the u n i t c e l l of i l m e n i t e has a = 5-4-0 and

53
Il m e n i t e - haematite form a continuous s o l i d s o l u t i o n s e r i e s at
temperatures somewhat above 600°C. I f r a p i d l y cooled, the s o l i d s o l u t i o n
i s preserved i n a metastable s t a t e , but w i t h moderately slow c o o l i n g i t separates
°ut i n t o two s o l i d s o l u t i o n s -r a f e r r i f e r r o u s i l m e n i t e , and a t i t a n i -
f e r r o u s haematite - t h a t continue t c separate out on f u r t h e r c o o l i n g .
In Figure 23-, the e x - s o l u t i o n bodies of t i t a n i h a e m a t i t e are
d i s t r i b u t e d i n a base of i l m e n i t e . The haematite bodies are a l l elongated
w i t h t h e i r long axes p a r a l l e l t o one another. The i r r e g u l a r shapes of the
haematite bodies i n d i c a t e t h a t they have grown i n s i t u by absorbing
e x - s o l v i n g haematite from the adjacent i l m e n i t e s o l i d s o l u t i o n . The i l m e n i t e
adjacent t o the l a r g e haematite bodies i s f r e e from even the minutest
p a r t i c l e s of haematite, i n d i c a t i n g t h a t i t has been drained by s o l i d
d i f f u s i o n of i t s content of ex-solvable haematite.

54
APPENDIX B.
E s t i m a t i o n of Iron and Titanium
The solutions for colormetric analysis were prepared as
follows:
I r o n Determination:-
A l i q u o t s of 0.5 t o 1 ml, depending on the expected i r o n c o n c e n t r a t i o n i n the sample s o l u t i o n s , were used.
1 ml of 10$ hydroxylamine hyd r o c h l o r i d e added t o reduce any
f e r r i c i o n s .
5-10 ml of 0.2 M ammonium acetate was added t o a c t as a b u f f e r
t o ensure the s o l u t i o n would f a l l w i t h i n the proper pH range f o r the
c o l o r i m e t r i c a n a l y s i s (pH.of 2 t o 9)•
2 ml of 0.4$ 1-10 ortho-phenanthroline was added t o give the
col o u r .
The s o l u t i o n s were made up t o 100 ml by u s i n g 100 ml volu m e t r i c
f l a s k s , i n which they were a l s o s t o r e d .
The s o l u t i o n s were poured i n t o the cuvettes of the c o l o r i m e t e r
a f t e r washing them s e v e r a l times w i t h the same s o l u t i o n . A standard c e l l
of b lank s o l u t i o n was used during each determination.
The i r o n s o l u t i o n s were compared w i t h a standard i r o n s o l u t i o n .
0.864 gm of A.R. f e r r i c ammonium s u l f a t e was d i s s o l v e d i n water.

55'
10 ml of concentrated HC.L was added (J6N).
The s o l u t i o n was d i l u t e d t o 1 l i t r e . 1 ml = 0.1 mg of Fe.
Titanium Determination:-
A l i q u o t s of ̂ -Bml, depending on the expected t i t a n i u m concen
t r a t i o n i n the sample s o l u t i o n s were used.
10 ml of 1:1 H2SO4 was added t o increase the a c i d i t y t o 1.5-3-5N,
and t o prevent h y d r o l y s i s t o a b a s i c sulphate a f t e r a d d i t i o n of peroxide,
and t o prevent formation of m e t a t i t a n i c a c i d .
10 ml of 3$ hydrogen peroxide was added t o give the yellow
c o l o u r .
5-10 ml of ortho-phosphoric a c i d was added t o e l i m i n a t e the
co l o u r due t o f e r r i c i r o n . Same amount of phosphoric a c i d was added t o the
standards.
Comparison was made w i t h standard t i t a n i u m sulphate s o l u t i o n
[ l m l = 1 mg T i 0 2 ] su p p l i e d by Canadian Laboratory S u p p l i e s L t d .

APPENDIX C.
E s t i m a t i o n of A c t i v i t y of Hydrogen Ions
The activity of an electrolyte which ionizes as follows;
+ -s» n + x + n-x
i s d e f i n e d i n terms of i o n i c a c t i v i t i e s as a = a + n + a_n
In case of H 2S0 4 which may-he assumed t o i o n i z e as
H 2S0 4 ^ '2H+ + SDl
a a2 a -
TI 2S0 4 - - H+ S 0 4
* rr
The mean i o n i c a c t i v i t y i s a = a - where n = n+ + n_
f o r H 2S0 4 a = a J
The mean m o l a l i t y i s ± n+ n- i
m = m(n + n_ ) i . e . m* f o r H 2S0 4 = m^g,-^ ( 2 2 l 1 ) ^ "
= " ^ S C V ^ 3
The mean a c t i v i t y c o e f f i c i e n t j . + +n -n 1
I f * - ^ = (if + . Y ) n
m-
f o r H 2S0 4 Y +~ = (1)
K ± ^ X m H 2 S 0 4

57
The activity of the S0 4 is not known. .However, i f i t can be assumed that
i t is related by stoichiometry to that of H+, then
a S 0 4 - 2 aH +
From.(l)1
thus a, 'H2S04 = ^
* r 3 \ x and a = / 1.3
+
0. H 2S0 4 " .71 kx/3. x/.m- H2SO4 (2)
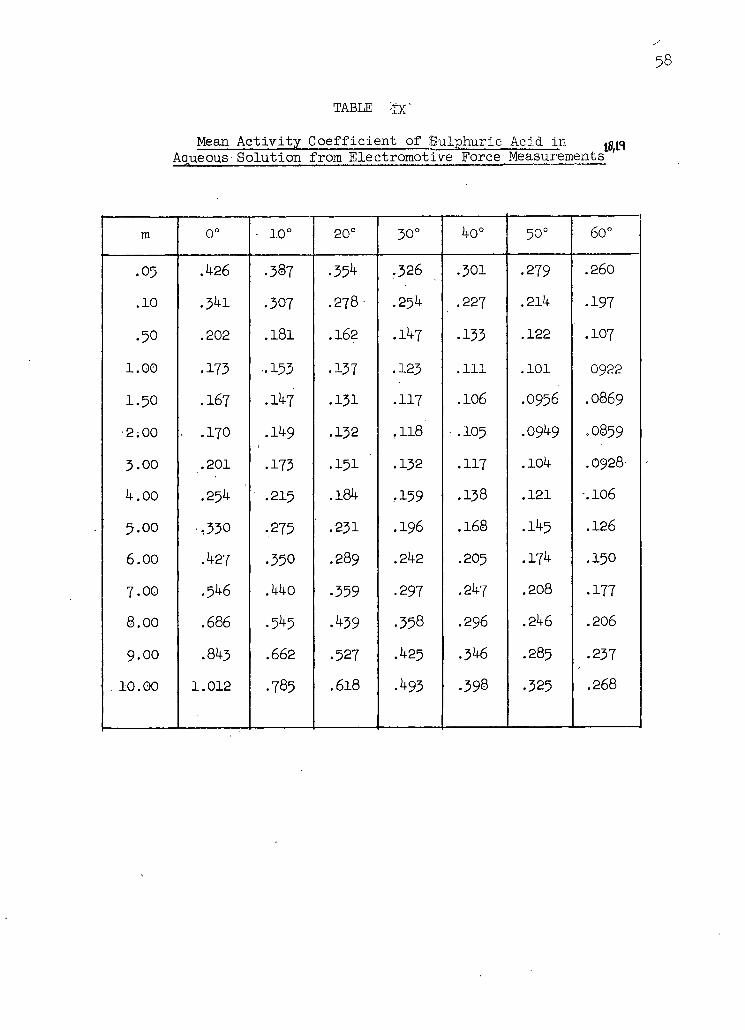
Knowing the mean activity coefficient of H2S04.over a range of
molality (Table IX!'18'19). can be calculated. The values thus
calculated at.150°C are shown in Table V.
58
TABLE 'ix"
Mean A c t i v i t y C o e f f i c i e n t of Sulphuric Acid i n Aqueous-Solution from Electromotive Force Measurements '
m 0° - 10° 20° 30° 40° 50° 6o°
.05 .426 .387 • 35^ .326 .301 .279 .260
.10 • 341 .307 .278 • .254 .227 .214 .197
• 50 .202 .181 .162 .147 .133 .122 .107
1.00 • 173 -.153 .137 .123 .111 .101 .0922
1.50 .167 .147 .131 .117 .106 .0956 ..0869
2;00 . .170 .149 .132 ,118' - .105 .0949 .0859
3.00 .201 .173 .151 ' .132 .117 .104 .0928'
4.00 .254 .215 .184 ,159 .138 .121 •.106
5.00 ,330 .275 .231 .196 .168 .145 .126
6.00 .427 •350 .289 .242 .205 .174 .150
7.00 .546 .440 • 359 • 297 .247 .208 • 177
8.00 .686 .545 .439 .358 .296 .246 .206
9.00 .843 .662 .527 .425 .346 .285 .237
. 10.00 1.012 .785 .618 .493 •398 .325 .268

APPENDIX D
Analyses of l e a c h s o l u t i o n s .

60
TABLE VI
Analyses.;pf leach; solutions; •. Effejct of rate of abrasion
Experimental Conditions;-
, H2SO4 concentration 1M, temperature 150°C, p a r t i a l pressure of hydrogen 9. atmospheres, sodium sulphite Jgms, sol.vol.-600ml.-'
Rate of Abrasion Time Time No abrasion 40 rpm 80. rpm 120 rpm
Iron mgms . 37-9 41.7 46.3 46.0
2 69.I 82.7 109.66 120.04
1 hr. . • 84.8 132.10 .172.20 140.71
l2.hrs 100.2 ' 167.2 224.7 225.99 2 hrs. . 103.6 223.5. 293.7 267.95
• 2s.hrs. . 129.872 . • 249.3 319.9 318 ..80
3 hrs. 152.23 282.8 383.2 367.55 3 2 hrs. 166.5 307.5 ' 419,5 • 412.20 •
*
Titanium mgms 1.89 1.B9 • 1,89 . I 1 8 9
2 h r - 2.67 3-57 4.98 5.34 1 hr. 3.52 5-14 6.73 6.90 l£ hrs. 3.64 6.31* 8.78 .9.21 2 hrs. 3.90 7-9̂ •'. 10.46 10.66 2^ hrs. 4.15 9.50 12.07 12.18 3 hrs. 4.4o 10.31 . 13.89 13.17 ' 3j hrs." 4.72 11.23 15.84 16.17-. •

TABLE VII
Analyses of l e a c h solutions 1;..' 'Effect., of temperature
•Experimental C o n d i t i o n s ; -
S u l p h u r i c a c i d - 1M, abrasion r a t e 80 rpm, p a r t i a l •pressure of H 2 - 9 atmospheres, Na 2S03 = 3 gms,. so l . v o l . - 6 0 0 ml.
Temperature 120 °C 150°C 180 °C 210°C
41.7
Eron mgms i.:>46.3 51.7 6I . 6 5
i h r . 2
85.IO 109.66 150.9 I 6 8 . 0 3
1 hr. 127.40 172.25 225.44 308.88
l g h r s . 180 30 224.8 308.31 449.20
2 h r s . 223.50 293.7 - 402.71 580.09
2X h r s . 2
270.5 319.97 494.9 681.24
3 h r s . . 3 0 0 . 4 382.27 593.61 833.34
3 j hrs., ,-. .,. - , 3 4 9 , 8 - •419.57 '
titanium mgms
700.60 . - 990.25 "
1.80 I . 8 9 1,90 I . 9 8
A- h r . 2
4.10 4 .98 5.40 6.23
1 hr. 6.20 6.73 7 .30 , 8 .50
l ^ h r s . 7.90 8.78 9.20 11.28
2 h r s . 10.00 10.46 11.33 12.93
2̂ - h r s . . 11 .25 12.07 13.35 14.64
3 h r s . 12.50 13.89 14.65 ' 16.37
3 \ h r s . 13.71 15.84 17.23 19.28

TABLE V I I I
Analyses-'of l e a c h solutions;! 1 E f f e c t of a c i d c o n c e n t r a t i o n
Experimental C o n d i t i o n s :
Temperature 150°C, abrasion rate 80 rpm, p a r t i a l pressure of hydrogen 9 atmospheres, Na 2S0 3 = 3 gms, s o l . v o l . 600 ml.
A c i d Strength ,Time ,Time
0.5M 1.0M 2.0M 4.0M Iron Analysis-mgms
31.5 46.3 63.90 84.50
^ hr. 2
82.52 109.66 158.14 217.82
1 hr. •122.94 172.20 218.60 285.09
l£ h r s . 149.54 224.70 313.66 372.50
2 h r s . 177.66 293.70 422 .36 471.05
2 i h r s . 213.41 319.90 469 04 566.96
3 h r s . 243.10 382.20 557.40 685.01 •
3^ h r s • 272.20 419.50 631.92 773.16
Titanium Analysis-mgms
1.17 1.89 2.29 4.59
i hr. 2
2.67 4.98 7-93 11.10
1 hr. 4.15 6.73 11.25 13.52
. 1-LhrS;-2
5-95 8.78 13.85 18.30
2 h r s . 7-. 12 10 46 15.51 21.71
2^ h r s . 7.87 12.07 18.06 26.35
3 h r s . 9.09 i3.89 20.77 30.08
31 h r s . 2
10.29 15.84 23.79 33.5^

APPENDIX E
Debye-Scherrer Powder P a t t e r n Readings

6k
TABLE XI
D i f f r a c t o m e t r i c graph readings of massive and s i n t e r e d i l m e n i t e .
Readings:
Massive Specimen S i n t e r e d Specimen
:ak Wo. R e l a t i v e 0 R e l a t i v e d (A) Peak Height D (A) Peak Height
1 3.67 60 3.66 55 2 2.73 '90 2.f0 100 3 2.53 80 2.50 85 k 2.22 50 2.20 50 5 l.Qk 60 1.81* 55 6 1.71 90 1.72 90 7 1.65 50 I.69 60 8 1.61 4-0 1.60 35 9 • I.50 50 1.50 ^5
10 I.47 45 1.45 ko l l 1.33 50 1.32 55 12 1.15 60 1.15 60

TABLE XII
Readings.from the Debye --Scherrer powder p a t t e r n of the residue at, the bottom of the autoclave.
o Line No. 2 9 d(A)
1 3 0 . 2 3 . 7 1 2 4 1 . 2 2 - 7 5
3 4 4 . 7 2 . 5 4
4 5 2 . 0 2 . 2 1
5 6 2 . 5 I . 8 7 6 6 9 . 6 1 . 7 0
7 8 0 . 3 1 . 5 0
8 8 2 . 8 1 .46 9 9 0 . 6 1 . 3 6
1 0 9 9 - 4 1 . 2 7
l l 1 1 0 . 2 1 . 1 8
1 2 1 1 4 . 6 1 . 1 5
1 3 1 1 9 - 6 1 . 1 2
1 4 1 2 7 . 0 1 . 0 8

3 - 0 7 8 jimim C O M t E C T I O H
d H m
2.T4 1.7! 2.M 3.73 F E T I O , FEO.TIO,
i/ii 3-om
100 100 85 SO IRON TITANATE ILUENITE
Rad. CoKa t 1.7903 Titer F E DU. 9 cu. Cutoff Cell I / I , VISUAL dcorr.abs.? YES Ret UNITED STEEL COMPANIES, SHEFFIELD
Sys. foOUBOHEDRAL1 8.G. Cfj RS A . 5.523 b. c. A C 0 5 4 . 5 1 ° a , Z D, 4.T9 Ref. UNITED STEEL COMPANIES, SHEFFIELD
2 V BML
n » 0 t y mp Color T.F. 215°0
Sign
NATURAL MINERAL "FOR HEXAGONAL AXESI AQ • 5.079! c 0 ° 14.135
TT" 3.73 2.74 2.5* 2.23 1.S6
1.72 1.63 1.50 1.47 1.34
1.27 1.20 1.16 1.15 1.12
I/I, hid d A VI, bid
50 102 1.07 70 2110 100 104 1.00 30 318 85 110 0.978 50 1014 70 113 .970 70 2013 85 204 324
.960 70 410
100 116 .921 85 3110 50 108 .913 70 2014 85 214 85 300 70 1010
60 220 30 312 60 2010 70 314 70 226
Ilmenite
6 - 0 5 0 2 4 2.69 2.51 1.69 3.68 0-FEjO,
vu 100 SO 80 70 ALPHA IRON (HI) OXIDE HEMATITE
RuLCoKa A DUL 19011 cut oa I/It VISUAL Ref. "toonsov, IN BRINDLEVI
Titer FE con
dcoT.ata.T 'X-RAT IDENTIFICATION
BJft. foOMBOHEDRAL OO. D n - FBe • ,5.43 b» 0, A C • 55 °17 ' 0 y I Bot I S I D .
Is n « » | , StfB XV D 5.26 mp Color Rot
dA I/I, bid 3.68 70 102 2.69 100 104 2.51 80 no 2.20 70 113 2.07 10 202
1.837 70 204 1.691 80 116 1.634 10 121 1.596 40 108 1.484 70 214 1.451 80 300 1.348 20 208 1.309 40 10,10
119 1.255 30 220
1.224 10 306 1.205 10 223 1.187 30 112.218 1.160 30 20,10 1.137 40 314
1.100 1.053 1.037 0.988
•ADDii OIVEN I BUR. M PA.
40 50 10" 10"
ONAL L l HOFER
NES.PlT T, KEN
221 21,10
CS u.s 8BUROH, FEKO.
TO
Haematite
A.S.T.M..STANDARD CARDS

67
APPENDIX F
R e p r o d u c i b i l i t y of r e s u l t s , u s i n g s i n t e r e d i l m e n i t e samples.

TABLE X I I I
Rate of d i s s o l u t i o n of s i n t e r e d samples
Temperature 150°C, p a r t i a l pressure of hydrogen -9 atmospheres, a c i d c o n c e n t r a t i o n - 1M H 2S0 4, sodium s u l p h i t e 3 g®-s
} geometric surface area of sample - k sq.. cm., and s o l u t i o n volume - 600 ml.
80 rpm kO rpm
3.29 2.28
Rate -d [Fe] dt 3.17 2.14
Moles/min x 10 3-00 2.19
3.20 2.00