distinctive words in academic writing: a comparison of ... · distinctive words in academic...
TRANSCRIPT
1
Distinctive words in academic writing: A comparison of three statistical tests for keyword extraction
Magali Paquot and Yves Bestgen Centre for English Corpus Linguistics F.N.R.S - Université catholique de Louvain [DRAFT VERSION]
Abstract Most studies that make use of keyword analysis rely on log-likelihood ratio or chi-square tests to extract words that are particularly characteristic of a corpus (e.g. Scott & Tribble 2006). These measures are computed on the basis of absolute frequencies and cannot account for the fact that “corpora are inherently variable internally” (Gries 2007). To overcome this limitation, measures of dispersion are sometimes used in combination with keyness values (e.g. Rayson 2003; Oakes & Farrow 2007). Some scholars have also suggested using other statistical measures (e.g. Wilcoxon-Mann-Whitney test) but these techniques have not gained corpus linguists’ favour (yet?). One possible explanation for this lack of enthusiasm is that statistical tests for keyword extraction have rarely been compared. In this article, we make use of the log-likelihood ratio, the t-test and the Wilcoxon-Mann-Whitney test in turn to compare the academic and the fiction sub-corpora of the British National Corpus and extract words that are typical of academic discourse. We compare the three lists of academic keywords on a number of criteria (e.g. number of keywords extracted by each measure, percentage of keywords that are shared in the three lists, frequency and distribution of academic keywords in the two corpora) and explore the specificities of the three statistical measures. We also assess the advantages and disadvantages of these measures for the extraction of general academic words. 1. Introduction One of the questions that have attracted most interest in corpus linguistics so far is: “Which words are particularly characteristic of a corpus?” (cf. Kilgarriff 2001). The simplest (and also most frequent) formulation of the problem has been to extract the keywords of a specific corpus, i.e. “items of unusual frequency in comparison with a reference corpus of some suitable kind” (Scott & Tribble 2006:55), by means of log-likelihood ratio (or less frequently chi-square) tests. This is the only procedure that is currently implemented in widely used corpus linguistic tools such as WordSmith Tools (Scott 2004) and Wmatrix (Rayson 2003). Frequency has thus often been the sole criterion for identifying distinctive words of a particular corpus. In the last few years, a number of studies have emphasized the need for taking corpus variability into account in corpus studies (cf. Gries 2006). In a study of vocabulary differences in English language corpora representing 7 different countries, Oakes & Farrow (2007: 91) write that “[i]n a
2
study of this nature, it is important to consider only those words which are relatively evenly spread throughout the corpus”. In these conditions, it is questionable whether log-likelihood ratio (or chi-square) tests are always the best statistical measures to identify words that are ‘particularly characteristic of a corpus’.1
The primary objective of this paper is to compare the number and type of keywords extracted from a corpus of academic writing by means of the log-likelihood ratio and two other statistical tests, viz. the t-test and the Wilcoxon-Mann-Whitney test. These two tests were selected as they take frequency distribution across corpus sections into account. A second objective is to assess whether one of these measures is better suited to identify English for General Academic Purposes (EGAP) words, i.e. a rather formal vocabulary common to a wide range of academic texts but not so common in non-academic texts. Academic words “most probably occur because they allow academic writers to do the things that academic writers do. That is, they allow writers to refer to others’ work (assume, establish, indicate, conclude, maintain); and they allow writers to work with data in academic ways (analyse, assess, concept, definition, establish, categories, seek)” (Nation 2001: 18). EGAP words also play an important part in discourse organisation and cohesion (cf. Halliday and Hasan 1976: 274-292; Partington 1998: 89-106; Nation 2001: 210-216). Put differently, these words “provide a semantic-pragmatic skeleton for the text. They determine the status of the (more or less technically phrased) propositions that are laid down in it, and the relations between them” (Meyer 1997:9). The paper is organised as follows. In section 2, we describe the most common procedure used in corpus linguistics to compare corpora and extract keywords. We highlight its major drawback, i.e. the fact that it does not take corpus variability into account, and briefly discuss other techniques proposed to overcome this limitation. Section 3 identifies the distinctive characteristics of the three statistical tests that we compare in this study. Section 4 describes the corpora and the methodology used to extract keywords from a corpus of academic texts. Section 5 provides a comparison of the keywords extracted by the three statistical tests and discusses the results. The article ends by identifying avenues for future research and revisiting the definition of ‘keyword’ in light of the results obtained in this study. 2. Keyword analysis Keyword analysis has been used in a variety of fields to extract distinctive words or keywords, e.g. business English words (Nelson 2000), words typically used by men and women with cancer in interviews and online cancer support groups (Seale et al. 2006) and terminological items typical of specific sub-disciplines of English for Information Science and Technology (Curado Fuentes 2001). As emphasized by Scott & Tribble, “keyness is a quality words may have in a given text or set of texts, suggesting that they are important, they reflect what the text is really about, avoiding trivia and insignificant detail. What the text ‘boils down to’
3
is its keyness, once we have steamed off the verbiage, the adornment, the blah blah blah” (2006: 55-56).
The procedure to identify keywords of a particular corpus involves five main stages (cf. Scott & Tribble 2006: 58-60):
1. Frequency-sorted wordlists are generated for a reference corpus and the research corpus.
2. A minimum frequency threshold is usually set at 2 or 3 occurrences in the research corpus. Thus, “for a word to be key, then it (a) must occur at least as frequently as the threshold level, and (b) be outstandingly frequent in terms of the reference corpus” (Scott & Tribble 2006:59).
3. The two lists of word types and their frequencies are compared by means of a statistical test, usually the log-likelihood ratio.
4. Words in the research corpus that do not occur at least as frequently as the threshold and statistically significantly more than the same type in the reference corpus are filtered out.
5. The wordlist for the research corpus is reordered in terms of the keyness of each word type. Software tools usually list positive keywords, i.e. words that are statistically prominent in the research corpus, as well as negative keywords, i.e. words that have strikingly low frequency in the research corpus in comparison with the reference corpus.
This method has been applied on different types of research corpus, from
the most homogeneous to the most heterogeneous in terms of text type and domain. Scott & Tribble (2006: 179-193) carries out a keyword analysis on a single text, viz. Samuel Beckett’s Texts for Nothing, 1. Tribble (1998) extracts keywords from a relatively homogeneous corpus of 14 project proposals concerned with the restructuring of social and financial institutions, thus representing one particular text type. Nelson (2000) identifies business English keywords from a heterogeneous corpus of business writing (emails, reports, faxes, etc.) and speech (meeting and negotiation transcripts and phone calls). The more heterogeneous a corpus, however, the less evident it is to identify exactly what a keyword reveals about the research corpus. Leech et al (2001) make use of the British National Corpus (BNC)2 and list the keywords of very broad categories such as writing vs. speech, imaginative vs. informative writing and conversational vs. task-oriented speech. They first show that words such as you, I, ’s, yeah, it, and got belong to the most distinctive keywords of the spoken part of the BNC compared to its written part (Leech et al. 2001: 218). However, a comparison of conversational vs. task-oriented speech (e.g. lectures, political speeches, legal proceedings, trade union talks and sports commentaries) later reveals that these words are not distinctive of any kind of speech but only of conversational speech (ibid: 242) (see also Lee 2001a).
The keyword extraction procedure described above relies on the conception of a corpus as one big text rather than as a collection of texts. Statistical measures such as the log-likelihood ratio are computed on the basis of
4
absolute frequencies and cannot account for the fact that “corpora are inherently variable internally” (Gries 2007). As a consequence, the procedure cannot distinguish between global vs. local keywords. Global keywords are dispersed more or less evenly through the corpus while local keywords appear repeatedly in some parts of the corpus only, a phenomenon to which Katz (1996) has referred as ‘burstiness’.3 For example, in a keyword analysis of gay male vs. lesbian erotic narratives, Baker shows that wuz (used as a non-standard spelling of was) appears to be a keyword of gay male erotic narratives when in fact its use is restricted to one single text, “which suggests that this word is key because of a single author’s use of a word in a specific case, rather than being something that indicates a general difference in language use” (Baker 2004: 350). Put differently, the keyword status of wuz is more a function of sampling decision to include one particular narrative than evidence of the distinctiveness of the word in gay male erotic narratives (see also Oakes & Farrow 2007: 91).
Three types of solution have been proposed in recent studies to overcome this serious limitation of keyword analysis. Some authors have built keyword databases. A keyword database reveals how many texts or sections in a research corpus a word appears in as key. A frequency-sorted wordlist is generated for each text/section in the research corpus and compared to a reference corpus wordlist. A list of keywords for each text/section is thus drawn. All these keyword lists are then compared to build a keyword database, with the requirement that to be included each keyword must appear in a minimum number of texts/sections (e.g. Tribble 2000; Mudraya 2006, Nelson 2000, Scott & Tribble 2006). As underlined by Scott (2004), “a ‘key keyword’ is one which is ‘key’ in more than one of a number of related texts. The more texts it is ‘key’ in, the more ‘key key’ it is. This will depend a lot on the topic homogeneity of the corpus being investigated. In a corpus of City news texts, items like bank, profit, companies are key key-words, while computer will not be, though computer might be a key word in a few City news stories about IBM or Microsoft share dealings.”
Other researchers have re-classified keywords according to a measure of dispersion (e.g. Oakes & Farrow 2007; Paquot 2007a). The simplest measure of this type is range, i.e. a measure of frequency in terms of the number of texts or sections of the research corpus a keyword appears in (cf. Rayson 2003: 93-04). This method is less restrictive than building a key keyword database as a word does not need to be a keyword in all the sections it appears in. A more sophisticated measure is Juilland’s D, i.e. “a statistical coefficient of how evenly distributed a word is across successive sectors of the corpus” (ibid).4 This measure takes into account “not only the presence of absence of a word in each subsection of the corpus, but the exact number of times it appears” (Oakes & Farrow 2007: 91).
These two approaches, however, also have their drawbacks. As illustrated in the following two quotes, they both rely on an additional arbitrary cut-off point:
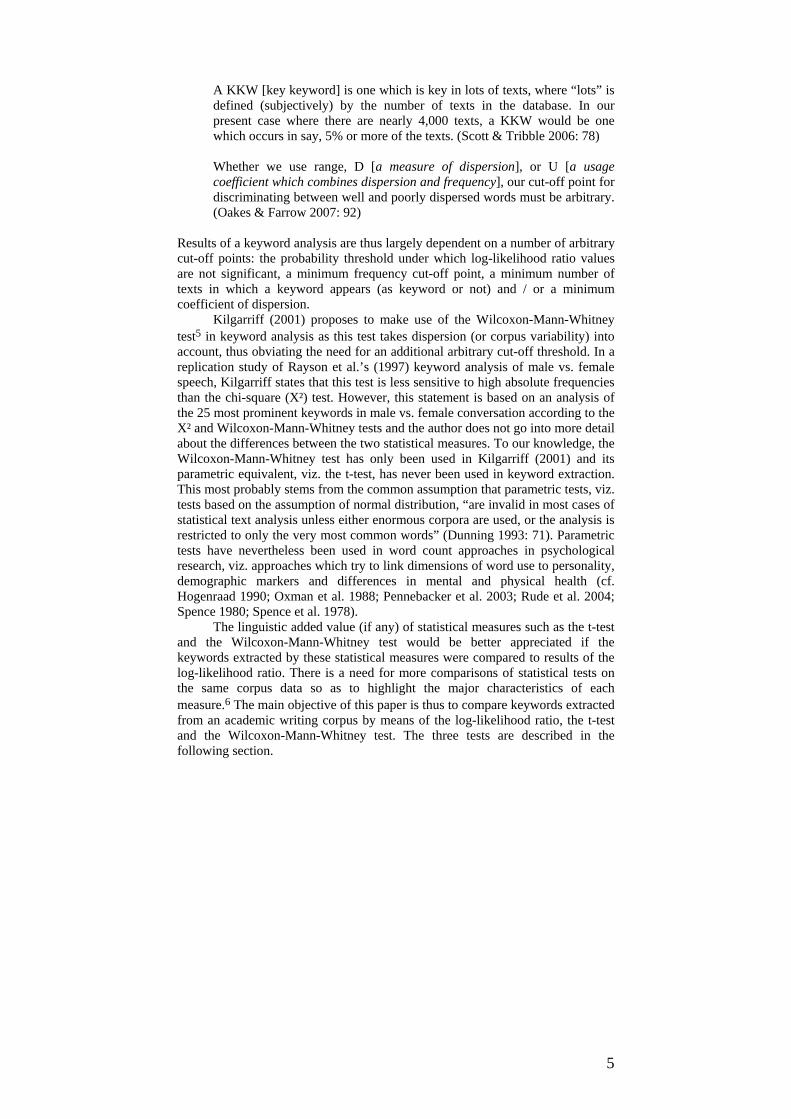
5
A KKW [key keyword] is one which is key in lots of texts, where “lots” is defined (subjectively) by the number of texts in the database. In our present case where there are nearly 4,000 texts, a KKW would be one which occurs in say, 5% or more of the texts. (Scott & Tribble 2006: 78) Whether we use range, D [a measure of dispersion], or U [a usage coefficient which combines dispersion and frequency], our cut-off point for discriminating between well and poorly dispersed words must be arbitrary. (Oakes & Farrow 2007: 92)
Results of a keyword analysis are thus largely dependent on a number of arbitrary cut-off points: the probability threshold under which log-likelihood ratio values are not significant, a minimum frequency cut-off point, a minimum number of texts in which a keyword appears (as keyword or not) and / or a minimum coefficient of dispersion.
Kilgarriff (2001) proposes to make use of the Wilcoxon-Mann-Whitney test5 in keyword analysis as this test takes dispersion (or corpus variability) into account, thus obviating the need for an additional arbitrary cut-off threshold. In a replication study of Rayson et al.’s (1997) keyword analysis of male vs. female speech, Kilgarriff states that this test is less sensitive to high absolute frequencies than the chi-square (X²) test. However, this statement is based on an analysis of the 25 most prominent keywords in male vs. female conversation according to the X² and Wilcoxon-Mann-Whitney tests and the author does not go into more detail about the differences between the two statistical measures. To our knowledge, the Wilcoxon-Mann-Whitney test has only been used in Kilgarriff (2001) and its parametric equivalent, viz. the t-test, has never been used in keyword extraction. This most probably stems from the common assumption that parametric tests, viz. tests based on the assumption of normal distribution, “are invalid in most cases of statistical text analysis unless either enormous corpora are used, or the analysis is restricted to only the very most common words” (Dunning 1993: 71). Parametric tests have nevertheless been used in word count approaches in psychological research, viz. approaches which try to link dimensions of word use to personality, demographic markers and differences in mental and physical health (cf. Hogenraad 1990; Oxman et al. 1988; Pennebacker et al. 2003; Rude et al. 2004; Spence 1980; Spence et al. 1978).
The linguistic added value (if any) of statistical measures such as the t-test and the Wilcoxon-Mann-Whitney test would be better appreciated if the keywords extracted by these statistical measures were compared to results of the log-likelihood ratio. There is a need for more comparisons of statistical tests on the same corpus data so as to highlight the major characteristics of each measure.6 The main objective of this paper is thus to compare keywords extracted from an academic writing corpus by means of the log-likelihood ratio, the t-test and the Wilcoxon-Mann-Whitney test. The three tests are described in the following section.
6
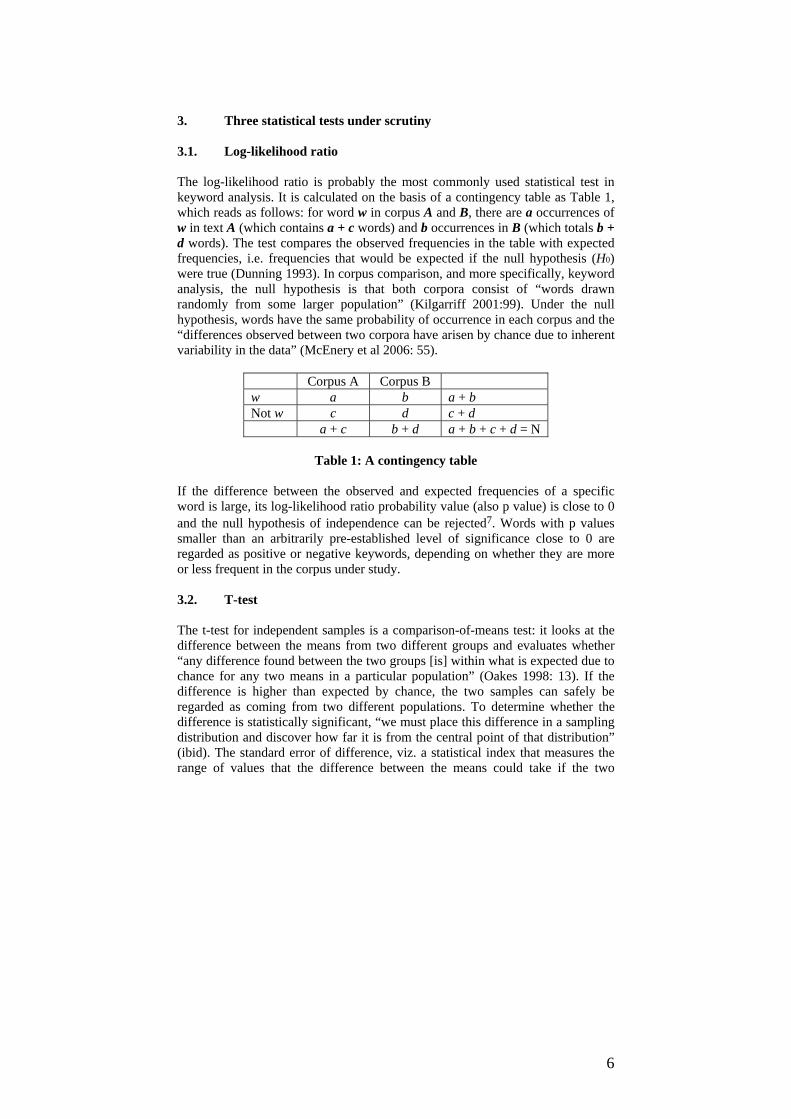
3. Three statistical tests under scrutiny 3.1. Log-likelihood ratio The log-likelihood ratio is probably the most commonly used statistical test in keyword analysis. It is calculated on the basis of a contingency table as Table 1, which reads as follows: for word w in corpus A and B, there are a occurrences of w in text A (which contains a + c words) and b occurrences in B (which totals b + d words). The test compares the observed frequencies in the table with expected frequencies, i.e. frequencies that would be expected if the null hypothesis (H0) were true (Dunning 1993). In corpus comparison, and more specifically, keyword analysis, the null hypothesis is that both corpora consist of “words drawn randomly from some larger population” (Kilgarriff 2001:99). Under the null hypothesis, words have the same probability of occurrence in each corpus and the “differences observed between two corpora have arisen by chance due to inherent variability in the data” (McEnery et al 2006: 55).
Corpus A Corpus B w a b a + b Not w c d c + d
a + c b + d a + b + c + d = N
Table 1: A contingency table If the difference between the observed and expected frequencies of a specific word is large, its log-likelihood ratio probability value (also p value) is close to 0 and the null hypothesis of independence can be rejected7. Words with p values smaller than an arbitrarily pre-established level of significance close to 0 are regarded as positive or negative keywords, depending on whether they are more or less frequent in the corpus under study. 3.2. T-test The t-test for independent samples is a comparison-of-means test: it looks at the difference between the means from two different groups and evaluates whether “any difference found between the two groups [is] within what is expected due to chance for any two means in a particular population” (Oakes 1998: 13). If the difference is higher than expected by chance, the two samples can safely be regarded as coming from two different populations. To determine whether the difference is statistically significant, “we must place this difference in a sampling distribution and discover how far it is from the central point of that distribution” (ibid). The standard error of difference, viz. a statistical index that measures the range of values that the difference between the means could take if the two
7
groups came from the same population, is used as a yardstick for that comparison. It is computed on the basis of the variance and size of each group sample. The Welch-Satterthwaite procedure may be used to solve the problem of heterogeneity of variance (Howell 2007: 202-203). To apply a t-test on corpus-derived frequencies, corpora are divided into sections or individual texts and word counts are computed for each section / text. When corpus sections differ in size, t-tests should preferably be computed on relative rather than absolute frequencies.
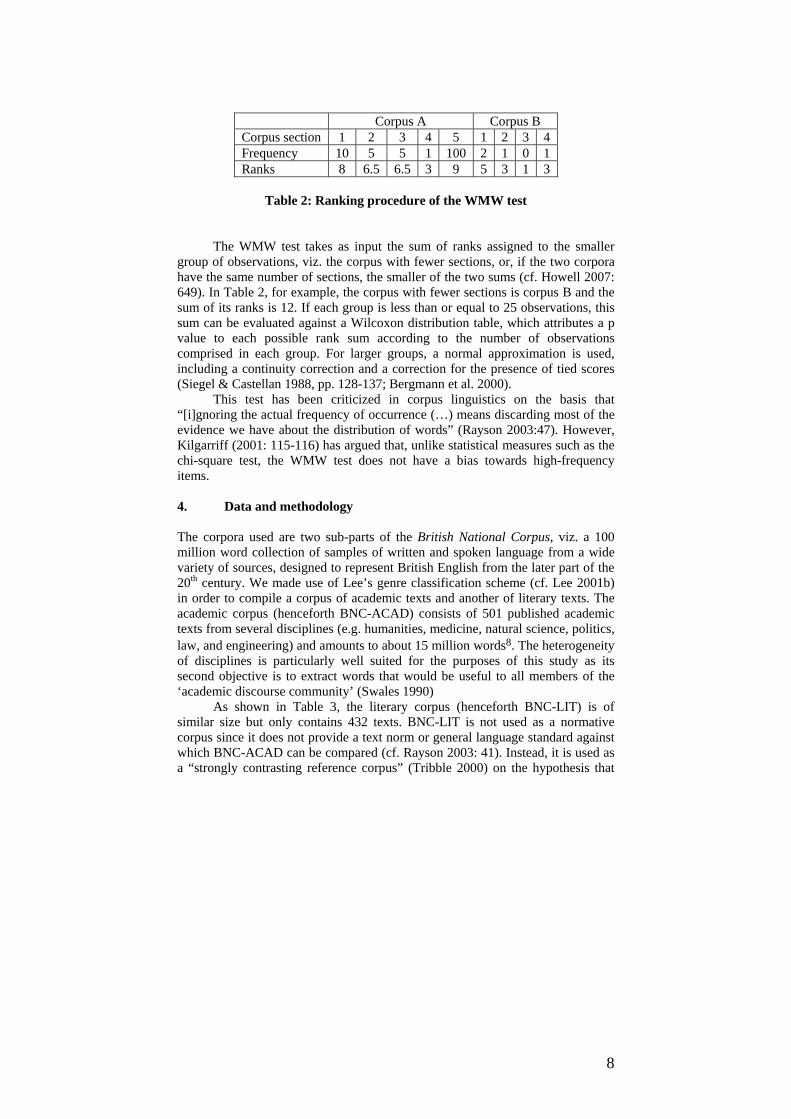
The choice of the t-test in keyword analysis could be criticized on the basis that it is “only valid where the data is normally distributed, which is not in general the case for word counts” (Kilgarriff 2001: 104). According to Howell (2007:637), however, those who argue in favor of using parametric tests comment that “the assumptions normally cited as being required of parametric tests are overly restrictive in practice and that the parametric tests are remarkably unaffected by violations of distribution assumptions” (see also Rietveld et al. 2004: 360). In addition, the assumption of normality of the sampling distribution does not apply to the distribution of raw scores (or word counts) in the two groups but to the distribution of their mean and the difference between them. The central limit theorem states that the sampling distribution of the means approaches normality as the number of observations increases. In practice, it is generally suggested that a number of observations of 25 to 30 is sufficiently large to produce a normal sampling distribution (Howell 2007: 177 and 203-204). Word counts, however, may be characterized by such a markedly skewed distribution that a larger sample size is often necessary. 3.3. Wilcoxon-Mann-Whitney test The Wilcoxon-Mann-Whitney (WMW) test is generally regarded as the non-parametric equivalent of the t-test for two independent samples. However, it tests a slightly different null hypothesis, i.e. the hypothesis that the two samples “were drawn at random from identical populations (not just populations with the same mean” (Howell 2007: 649). The WMW test is computed on ranked scores rather than word frequencies. Applied on corpus data, the WMW test first puts the frequencies of a given word w in each corpus section / text of the two corpora in rank order, from lowest to highest ranks. For example, Table 2 shows that the word w does not occur in section 3 of corpus B, which gets the lowest rank (rank 1). Sometimes frequencies across corpus sections are identical. The word w occurs once in one section of corpus A and in two sections of corpus B. This situation is described as tied scores. Tied scores are assigned mean ranks: these three sections are thus attributed the mean of ranks 2, 3 and 4 (rank 3). Similarly, sections 2 and 3 of corpus A are assigned the mean of ranks 6 and 7 (rank 6.5).
8
Corpus A Corpus B Corpus section 1 2 3 4 5 1 2 3 4 Frequency 10 5 5 1 100 2 1 0 1 Ranks 8 6.5 6.5 3 9 5 3 1 3
Table 2: Ranking procedure of the WMW test
The WMW test takes as input the sum of ranks assigned to the smaller group of observations, viz. the corpus with fewer sections, or, if the two corpora have the same number of sections, the smaller of the two sums (cf. Howell 2007: 649). In Table 2, for example, the corpus with fewer sections is corpus B and the sum of its ranks is 12. If each group is less than or equal to 25 observations, this sum can be evaluated against a Wilcoxon distribution table, which attributes a p value to each possible rank sum according to the number of observations comprised in each group. For larger groups, a normal approximation is used, including a continuity correction and a correction for the presence of tied scores (Siegel & Castellan 1988, pp. 128-137; Bergmann et al. 2000).
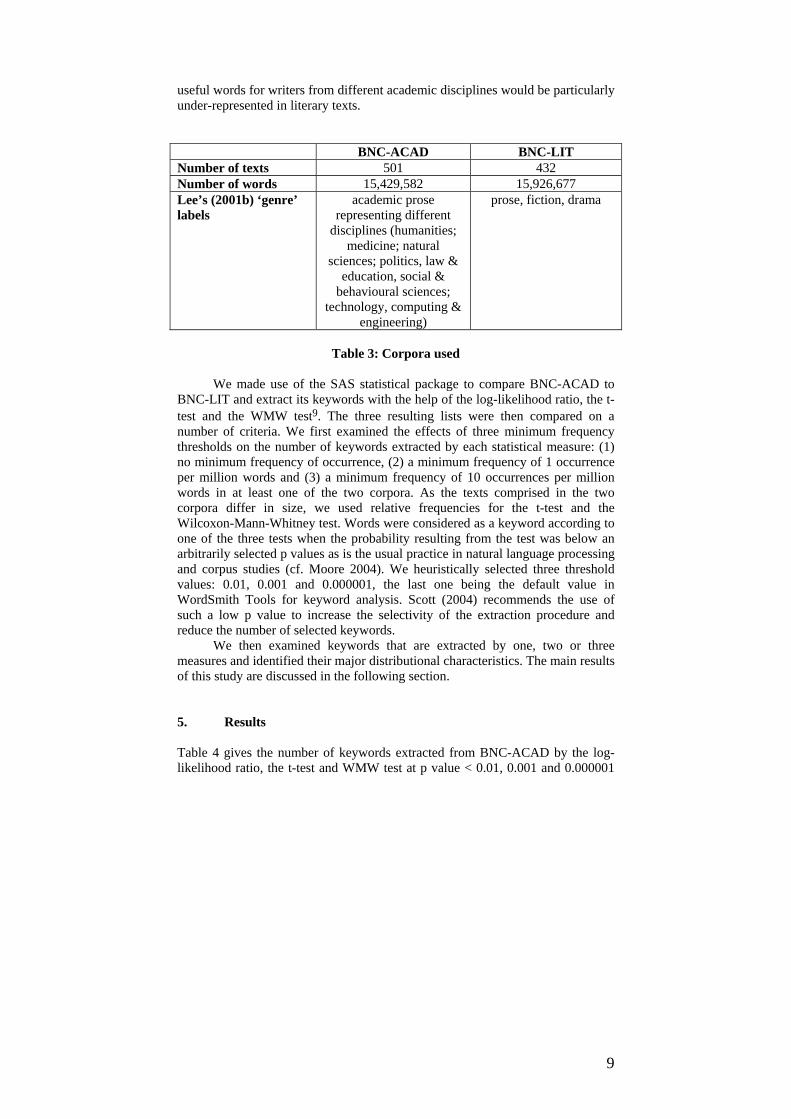
This test has been criticized in corpus linguistics on the basis that “[i]gnoring the actual frequency of occurrence (…) means discarding most of the evidence we have about the distribution of words” (Rayson 2003:47). However, Kilgarriff (2001: 115-116) has argued that, unlike statistical measures such as the chi-square test, the WMW test does not have a bias towards high-frequency items. 4. Data and methodology The corpora used are two sub-parts of the British National Corpus, viz. a 100 million word collection of samples of written and spoken language from a wide variety of sources, designed to represent British English from the later part of the 20th century. We made use of Lee’s genre classification scheme (cf. Lee 2001b) in order to compile a corpus of academic texts and another of literary texts. The academic corpus (henceforth BNC-ACAD) consists of 501 published academic texts from several disciplines (e.g. humanities, medicine, natural science, politics, law, and engineering) and amounts to about 15 million words8. The heterogeneity of disciplines is particularly well suited for the purposes of this study as its second objective is to extract words that would be useful to all members of the ‘academic discourse community’ (Swales 1990)
As shown in Table 3, the literary corpus (henceforth BNC-LIT) is of similar size but only contains 432 texts. BNC-LIT is not used as a normative corpus since it does not provide a text norm or general language standard against which BNC-ACAD can be compared (cf. Rayson 2003: 41). Instead, it is used as a “strongly contrasting reference corpus” (Tribble 2000) on the hypothesis that
9
useful words for writers from different academic disciplines would be particularly under-represented in literary texts. BNC-ACAD BNC-LIT Number of texts 501 432 Number of words 15,429,582 15,926,677 Lee’s (2001b) ‘genre’ labels
academic prose representing different
disciplines (humanities; medicine; natural
sciences; politics, law & education, social &
behavioural sciences; technology, computing &
engineering)
prose, fiction, drama
Table 3: Corpora used
We made use of the SAS statistical package to compare BNC-ACAD to
BNC-LIT and extract its keywords with the help of the log-likelihood ratio, the t-test and the WMW test9. The three resulting lists were then compared on a number of criteria. We first examined the effects of three minimum frequency thresholds on the number of keywords extracted by each statistical measure: (1) no minimum frequency of occurrence, (2) a minimum frequency of 1 occurrence per million words and (3) a minimum frequency of 10 occurrences per million words in at least one of the two corpora. As the texts comprised in the two corpora differ in size, we used relative frequencies for the t-test and the Wilcoxon-Mann-Whitney test. Words were considered as a keyword according to one of the three tests when the probability resulting from the test was below an arbitrarily selected p values as is the usual practice in natural language processing and corpus studies (cf. Moore 2004). We heuristically selected three threshold values: 0.01, 0.001 and 0.000001, the last one being the default value in WordSmith Tools for keyword analysis. Scott (2004) recommends the use of such a low p value to increase the selectivity of the extraction procedure and reduce the number of selected keywords.
We then examined keywords that are extracted by one, two or three measures and identified their major distributional characteristics. The main results of this study are discussed in the following section.
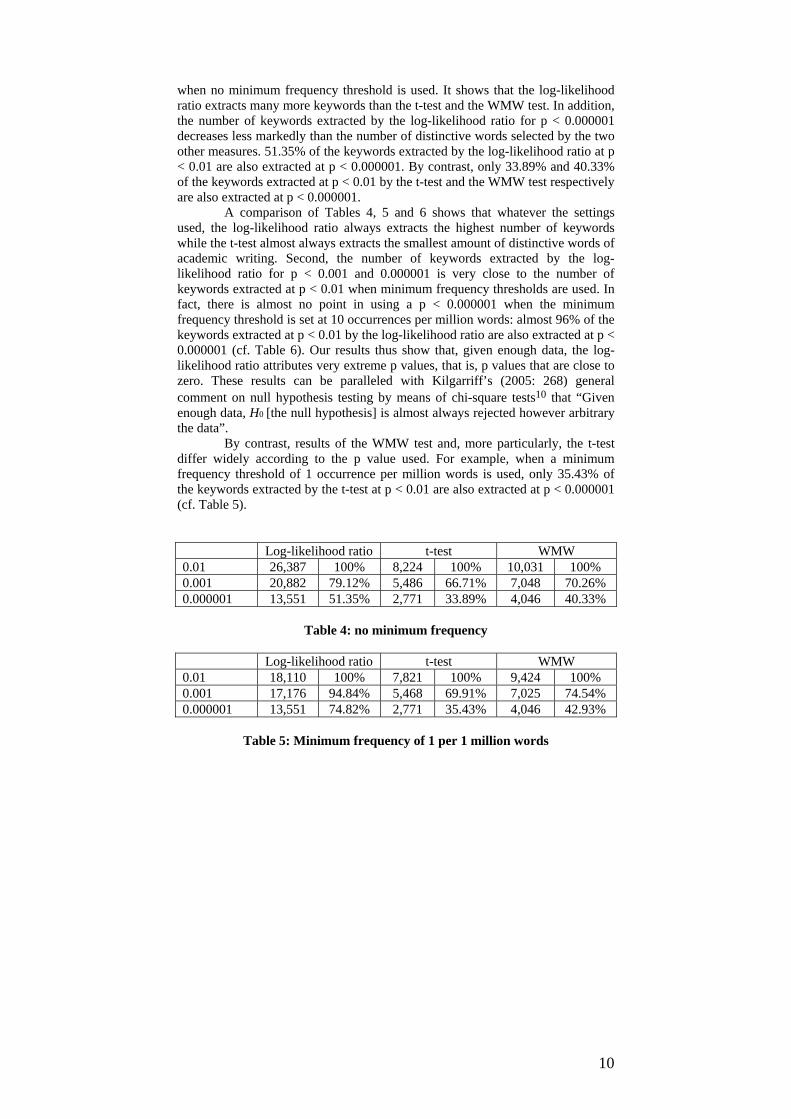
5. Results Table 4 gives the number of keywords extracted from BNC-ACAD by the log-likelihood ratio, the t-test and WMW test at p value < 0.01, 0.001 and 0.000001
10
when no minimum frequency threshold is used. It shows that the log-likelihood ratio extracts many more keywords than the t-test and the WMW test. In addition, the number of keywords extracted by the log-likelihood ratio for p < 0.000001 decreases less markedly than the number of distinctive words selected by the two other measures. 51.35% of the keywords extracted by the log-likelihood ratio at p < 0.01 are also extracted at p < 0.000001. By contrast, only 33.89% and 40.33% of the keywords extracted at p < 0.01 by the t-test and the WMW test respectively are also extracted at p < 0.000001. A comparison of Tables 4, 5 and 6 shows that whatever the settings used, the log-likelihood ratio always extracts the highest number of keywords while the t-test almost always extracts the smallest amount of distinctive words of academic writing. Second, the number of keywords extracted by the log-likelihood ratio for p < 0.001 and 0.000001 is very close to the number of keywords extracted at p < 0.01 when minimum frequency thresholds are used. In fact, there is almost no point in using a p < 0.000001 when the minimum frequency threshold is set at 10 occurrences per million words: almost 96% of the keywords extracted at p < 0.01 by the log-likelihood ratio are also extracted at p < 0.000001 (cf. Table 6). Our results thus show that, given enough data, the log-likelihood ratio attributes very extreme p values, that is, p values that are close to zero. These results can be paralleled with Kilgarriff’s (2005: 268) general comment on null hypothesis testing by means of chi-square tests10 that “Given enough data, H0 [the null hypothesis] is almost always rejected however arbitrary the data”. By contrast, results of the WMW test and, more particularly, the t-test differ widely according to the p value used. For example, when a minimum frequency threshold of 1 occurrence per million words is used, only 35.43% of the keywords extracted by the t-test at p < 0.01 are also extracted at p < 0.000001 (cf. Table 5). Log-likelihood ratio t-test WMW 0.01 26,387 100% 8,224 100% 10,031 100% 0.001 20,882 79.12% 5,486 66.71% 7,048 70.26% 0.000001 13,551 51.35% 2,771 33.89% 4,046 40.33%
Table 4: no minimum frequency
Log-likelihood ratio t-test WMW 0.01 18,110 100% 7,821 100% 9,424 100% 0.001 17,176 94.84% 5,468 69.91% 7,025 74.54% 0.000001 13,551 74.82% 2,771 35.43% 4,046 42.93%
Table 5: Minimum frequency of 1 per 1 million words
11
Log-likelihood ratio t-test WMW 0.01 5,551 100% 4,231 100% 4,155 100% 0.001 5,478 98.68% 3,615 85.44% 3,864 93% 0.000001 5,324 95.91% 2,419 57.17% 3,125 75.2%
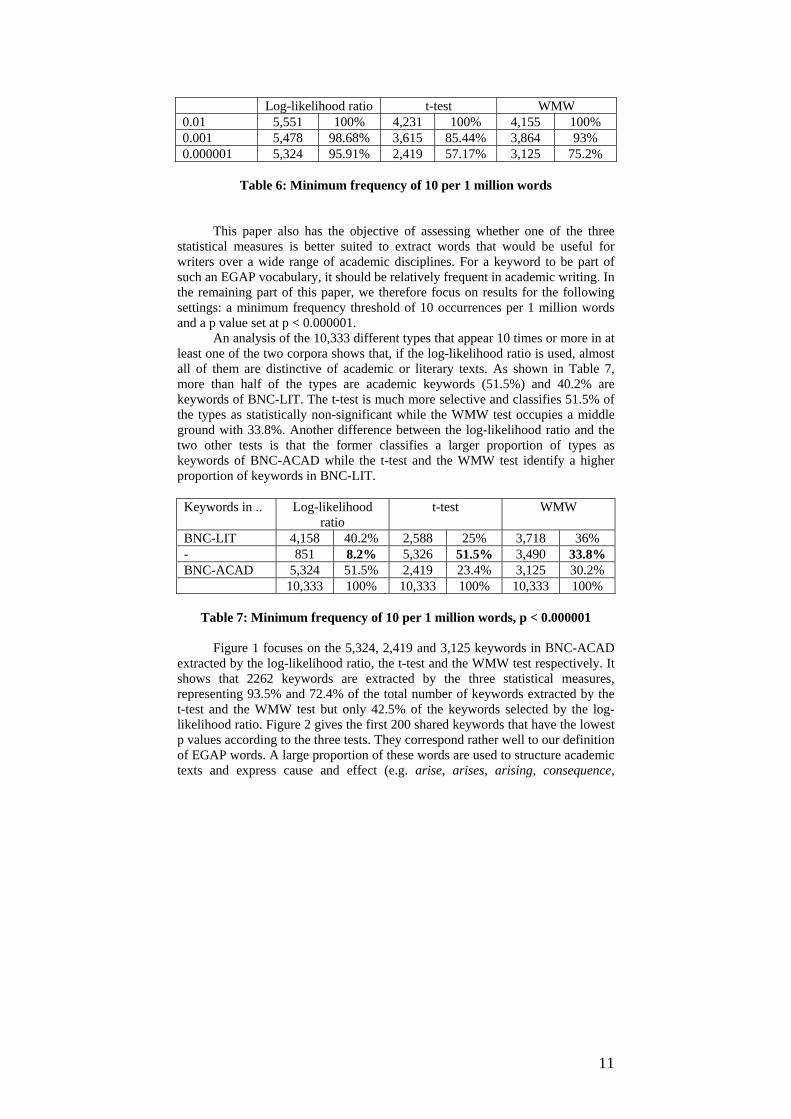
Table 6: Minimum frequency of 10 per 1 million words
This paper also has the objective of assessing whether one of the three statistical measures is better suited to extract words that would be useful for writers over a wide range of academic disciplines. For a keyword to be part of such an EGAP vocabulary, it should be relatively frequent in academic writing. In the remaining part of this paper, we therefore focus on results for the following settings: a minimum frequency threshold of 10 occurrences per 1 million words and a p value set at p < 0.000001.
An analysis of the 10,333 different types that appear 10 times or more in at least one of the two corpora shows that, if the log-likelihood ratio is used, almost all of them are distinctive of academic or literary texts. As shown in Table 7, more than half of the types are academic keywords (51.5%) and 40.2% are keywords of BNC-LIT. The t-test is much more selective and classifies 51.5% of the types as statistically non-significant while the WMW test occupies a middle ground with 33.8%. Another difference between the log-likelihood ratio and the two other tests is that the former classifies a larger proportion of types as keywords of BNC-ACAD while the t-test and the WMW test identify a higher proportion of keywords in BNC-LIT. Keywords in .. Log-likelihood
ratio t-test WMW
BNC-LIT 4,158 40.2% 2,588 25% 3,718 36% - 851 8.2% 5,326 51.5% 3,490 33.8% BNC-ACAD 5,324 51.5% 2,419 23.4% 3,125 30.2% 10,333 100% 10,333 100% 10,333 100%
Table 7: Minimum frequency of 10 per 1 million words, p < 0.000001
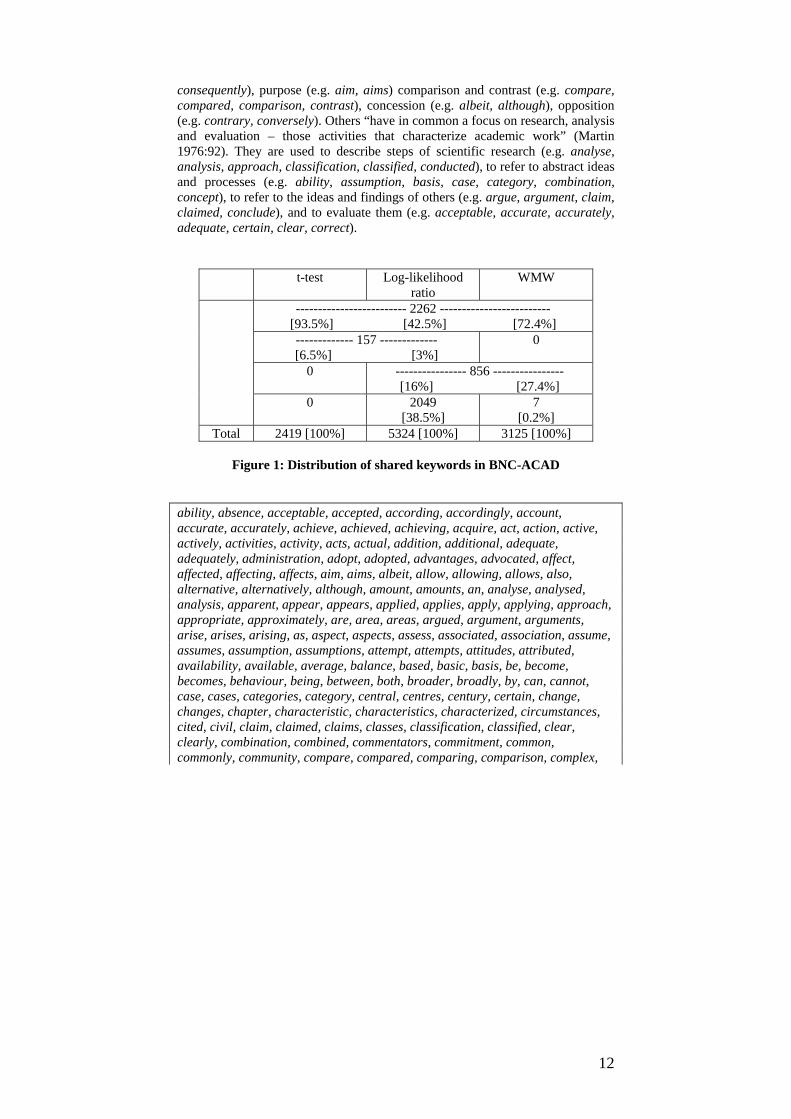
Figure 1 focuses on the 5,324, 2,419 and 3,125 keywords in BNC-ACAD
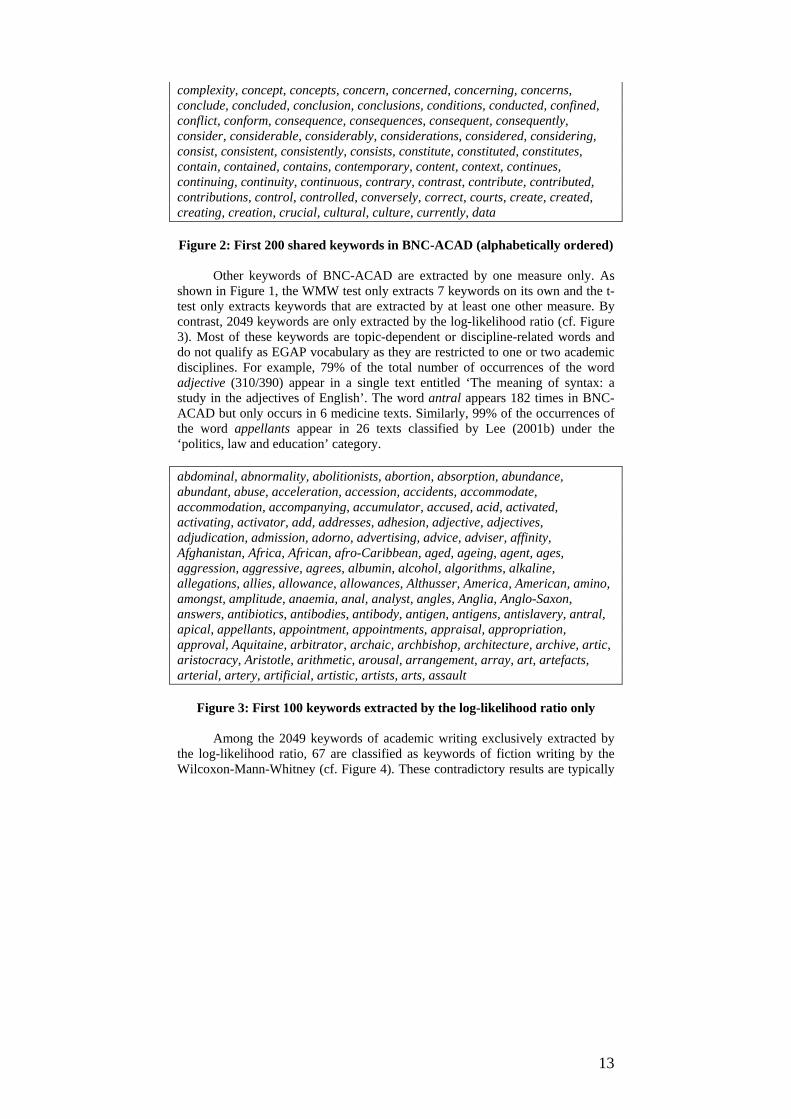
extracted by the log-likelihood ratio, the t-test and the WMW test respectively. It shows that 2262 keywords are extracted by the three statistical measures, representing 93.5% and 72.4% of the total number of keywords extracted by the t-test and the WMW test but only 42.5% of the keywords selected by the log-likelihood ratio. Figure 2 gives the first 200 shared keywords that have the lowest p values according to the three tests. They correspond rather well to our definition of EGAP words. A large proportion of these words are used to structure academic texts and express cause and effect (e.g. arise, arises, arising, consequence,
12
consequently), purpose (e.g. aim, aims) comparison and contrast (e.g. compare, compared, comparison, contrast), concession (e.g. albeit, although), opposition (e.g. contrary, conversely). Others “have in common a focus on research, analysis and evaluation – those activities that characterize academic work” (Martin 1976:92). They are used to describe steps of scientific research (e.g. analyse, analysis, approach, classification, classified, conducted), to refer to abstract ideas and processes (e.g. ability, assumption, basis, case, category, combination, concept), to refer to the ideas and findings of others (e.g. argue, argument, claim, claimed, conclude), and to evaluate them (e.g. acceptable, accurate, accurately, adequate, certain, clear, correct).
t-test Log-likelihood ratio
WMW
------------------------- 2262 ------------------------- [93.5%] [42.5%] [72.4%] ------------- 157 ------------- [6.5%] [3%]
0
0 ---------------- 856 ---------------- [16%] [27.4%]
0 2049 [38.5%]
7 [0.2%]
Total 2419 [100%] 5324 [100%] 3125 [100%]
Figure 1: Distribution of shared keywords in BNC-ACAD ability, absence, acceptable, accepted, according, accordingly, account, accurate, accurately, achieve, achieved, achieving, acquire, act, action, active, actively, activities, activity, acts, actual, addition, additional, adequate, adequately, administration, adopt, adopted, advantages, advocated, affect, affected, affecting, affects, aim, aims, albeit, allow, allowing, allows, also, alternative, alternatively, although, amount, amounts, an, analyse, analysed, analysis, apparent, appear, appears, applied, applies, apply, applying, approach, appropriate, approximately, are, area, areas, argued, argument, arguments, arise, arises, arising, as, aspect, aspects, assess, associated, association, assume, assumes, assumption, assumptions, attempt, attempts, attitudes, attributed, availability, available, average, balance, based, basic, basis, be, become, becomes, behaviour, being, between, both, broader, broadly, by, can, cannot, case, cases, categories, category, central, centres, century, certain, change, changes, chapter, characteristic, characteristics, characterized, circumstances, cited, civil, claim, claimed, claims, classes, classification, classified, clear, clearly, combination, combined, commentators, commitment, common, commonly, community, compare, compared, comparing, comparison, complex,
13
complexity, concept, concepts, concern, concerned, concerning, concerns, conclude, concluded, conclusion, conclusions, conditions, conducted, confined, conflict, conform, consequence, consequences, consequent, consequently, consider, considerable, considerably, considerations, considered, considering, consist, consistent, consistently, consists, constitute, constituted, constitutes, contain, contained, contains, contemporary, content, context, continues, continuing, continuity, continuous, contrary, contrast, contribute, contributed, contributions, control, controlled, conversely, correct, courts, create, created, creating, creation, crucial, cultural, culture, currently, data Figure 2: First 200 shared keywords in BNC-ACAD (alphabetically ordered)
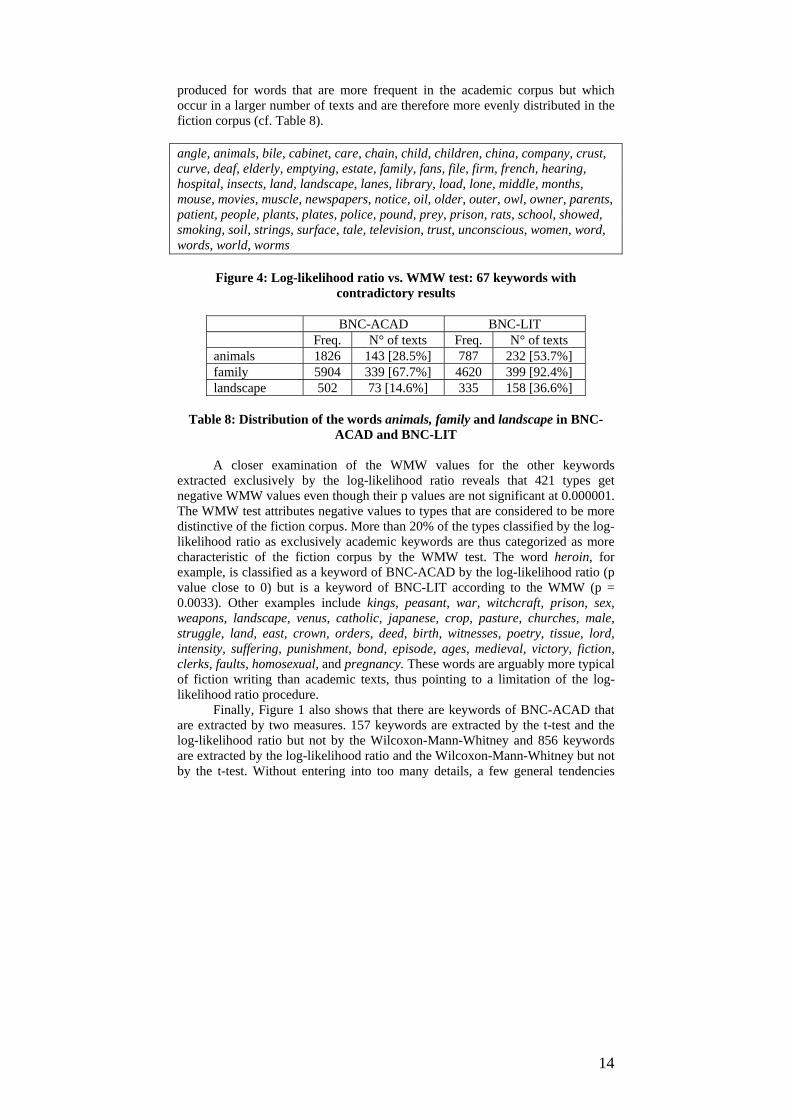
Other keywords of BNC-ACAD are extracted by one measure only. As shown in Figure 1, the WMW test only extracts 7 keywords on its own and the t-test only extracts keywords that are extracted by at least one other measure. By contrast, 2049 keywords are only extracted by the log-likelihood ratio (cf. Figure 3). Most of these keywords are topic-dependent or discipline-related words and do not qualify as EGAP vocabulary as they are restricted to one or two academic disciplines. For example, 79% of the total number of occurrences of the word adjective (310/390) appear in a single text entitled ‘The meaning of syntax: a study in the adjectives of English’. The word antral appears 182 times in BNC-ACAD but only occurs in 6 medicine texts. Similarly, 99% of the occurrences of the word appellants appear in 26 texts classified by Lee (2001b) under the ‘politics, law and education’ category. abdominal, abnormality, abolitionists, abortion, absorption, abundance, abundant, abuse, acceleration, accession, accidents, accommodate, accommodation, accompanying, accumulator, accused, acid, activated, activating, activator, add, addresses, adhesion, adjective, adjectives, adjudication, admission, adorno, advertising, advice, adviser, affinity, Afghanistan, Africa, African, afro-Caribbean, aged, ageing, agent, ages, aggression, aggressive, agrees, albumin, alcohol, algorithms, alkaline, allegations, allies, allowance, allowances, Althusser, America, American, amino, amongst, amplitude, anaemia, anal, analyst, angles, Anglia, Anglo-Saxon, answers, antibiotics, antibodies, antibody, antigen, antigens, antislavery, antral, apical, appellants, appointment, appointments, appraisal, appropriation, approval, Aquitaine, arbitrator, archaic, archbishop, architecture, archive, artic, aristocracy, Aristotle, arithmetic, arousal, arrangement, array, art, artefacts, arterial, artery, artificial, artistic, artists, arts, assault
Figure 3: First 100 keywords extracted by the log-likelihood ratio only
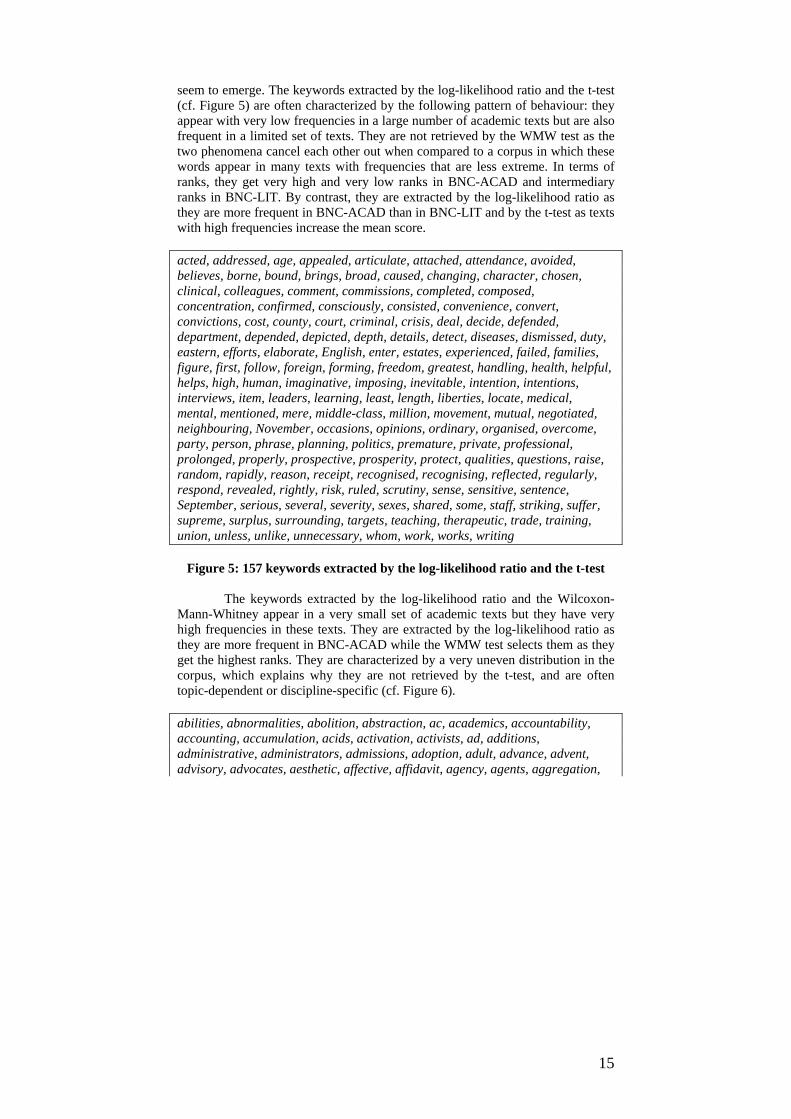
Among the 2049 keywords of academic writing exclusively extracted by the log-likelihood ratio, 67 are classified as keywords of fiction writing by the Wilcoxon-Mann-Whitney (cf. Figure 4). These contradictory results are typically
14
produced for words that are more frequent in the academic corpus but which occur in a larger number of texts and are therefore more evenly distributed in the fiction corpus (cf. Table 8). angle, animals, bile, cabinet, care, chain, child, children, china, company, crust, curve, deaf, elderly, emptying, estate, family, fans, file, firm, french, hearing, hospital, insects, land, landscape, lanes, library, load, lone, middle, months, mouse, movies, muscle, newspapers, notice, oil, older, outer, owl, owner, parents, patient, people, plants, plates, police, pound, prey, prison, rats, school, showed, smoking, soil, strings, surface, tale, television, trust, unconscious, women, word, words, world, worms
Figure 4: Log-likelihood ratio vs. WMW test: 67 keywords with
contradictory results
BNC-ACAD BNC-LIT Freq. N° of texts Freq. N° of texts animals 1826 143 [28.5%] 787 232 [53.7%] family 5904 339 [67.7%] 4620 399 [92.4%] landscape 502 73 [14.6%] 335 158 [36.6%]
Table 8: Distribution of the words animals, family and landscape in BNC-
ACAD and BNC-LIT
A closer examination of the WMW values for the other keywords extracted exclusively by the log-likelihood ratio reveals that 421 types get negative WMW values even though their p values are not significant at 0.000001. The WMW test attributes negative values to types that are considered to be more distinctive of the fiction corpus. More than 20% of the types classified by the log-likelihood ratio as exclusively academic keywords are thus categorized as more characteristic of the fiction corpus by the WMW test. The word heroin, for example, is classified as a keyword of BNC-ACAD by the log-likelihood ratio (p value close to 0) but is a keyword of BNC-LIT according to the WMW (p = 0.0033). Other examples include kings, peasant, war, witchcraft, prison, sex, weapons, landscape, venus, catholic, japanese, crop, pasture, churches, male, struggle, land, east, crown, orders, deed, birth, witnesses, poetry, tissue, lord, intensity, suffering, punishment, bond, episode, ages, medieval, victory, fiction, clerks, faults, homosexual, and pregnancy. These words are arguably more typical of fiction writing than academic texts, thus pointing to a limitation of the log-likelihood ratio procedure.
Finally, Figure 1 also shows that there are keywords of BNC-ACAD that are extracted by two measures. 157 keywords are extracted by the t-test and the log-likelihood ratio but not by the Wilcoxon-Mann-Whitney and 856 keywords are extracted by the log-likelihood ratio and the Wilcoxon-Mann-Whitney but not by the t-test. Without entering into too many details, a few general tendencies
15
seem to emerge. The keywords extracted by the log-likelihood ratio and the t-test (cf. Figure 5) are often characterized by the following pattern of behaviour: they appear with very low frequencies in a large number of academic texts but are also frequent in a limited set of texts. They are not retrieved by the WMW test as the two phenomena cancel each other out when compared to a corpus in which these words appear in many texts with frequencies that are less extreme. In terms of ranks, they get very high and very low ranks in BNC-ACAD and intermediary ranks in BNC-LIT. By contrast, they are extracted by the log-likelihood ratio as they are more frequent in BNC-ACAD than in BNC-LIT and by the t-test as texts with high frequencies increase the mean score.
acted, addressed, age, appealed, articulate, attached, attendance, avoided, believes, borne, bound, brings, broad, caused, changing, character, chosen, clinical, colleagues, comment, commissions, completed, composed, concentration, confirmed, consciously, consisted, convenience, convert, convictions, cost, county, court, criminal, crisis, deal, decide, defended, department, depended, depicted, depth, details, detect, diseases, dismissed, duty, eastern, efforts, elaborate, English, enter, estates, experienced, failed, families, figure, first, follow, foreign, forming, freedom, greatest, handling, health, helpful, helps, high, human, imaginative, imposing, inevitable, intention, intentions, interviews, item, leaders, learning, least, length, liberties, locate, medical, mental, mentioned, mere, middle-class, million, movement, mutual, negotiated, neighbouring, November, occasions, opinions, ordinary, organised, overcome, party, person, phrase, planning, politics, premature, private, professional, prolonged, properly, prospective, prosperity, protect, qualities, questions, raise, random, rapidly, reason, receipt, recognised, recognising, reflected, regularly, respond, revealed, rightly, risk, ruled, scrutiny, sense, sensitive, sentence, September, serious, several, severity, sexes, shared, some, staff, striking, suffer, supreme, surplus, surrounding, targets, teaching, therapeutic, trade, training, union, unless, unlike, unnecessary, whom, work, works, writing
Figure 5: 157 keywords extracted by the log-likelihood ratio and the t-test
The keywords extracted by the log-likelihood ratio and the Wilcoxon-
Mann-Whitney appear in a very small set of academic texts but they have very high frequencies in these texts. They are extracted by the log-likelihood ratio as they are more frequent in BNC-ACAD while the WMW test selects them as they get the highest ranks. They are characterized by a very uneven distribution in the corpus, which explains why they are not retrieved by the t-test, and are often topic-dependent or discipline-specific (cf. Figure 6). abilities, abnormalities, abolition, abstraction, ac, academics, accountability, accounting, accumulation, acids, activation, activists, ad, additions, administrative, administrators, admissions, adoption, adult, advance, advent, advisory, advocates, aesthetic, affective, affidavit, agency, agents, aggregation,
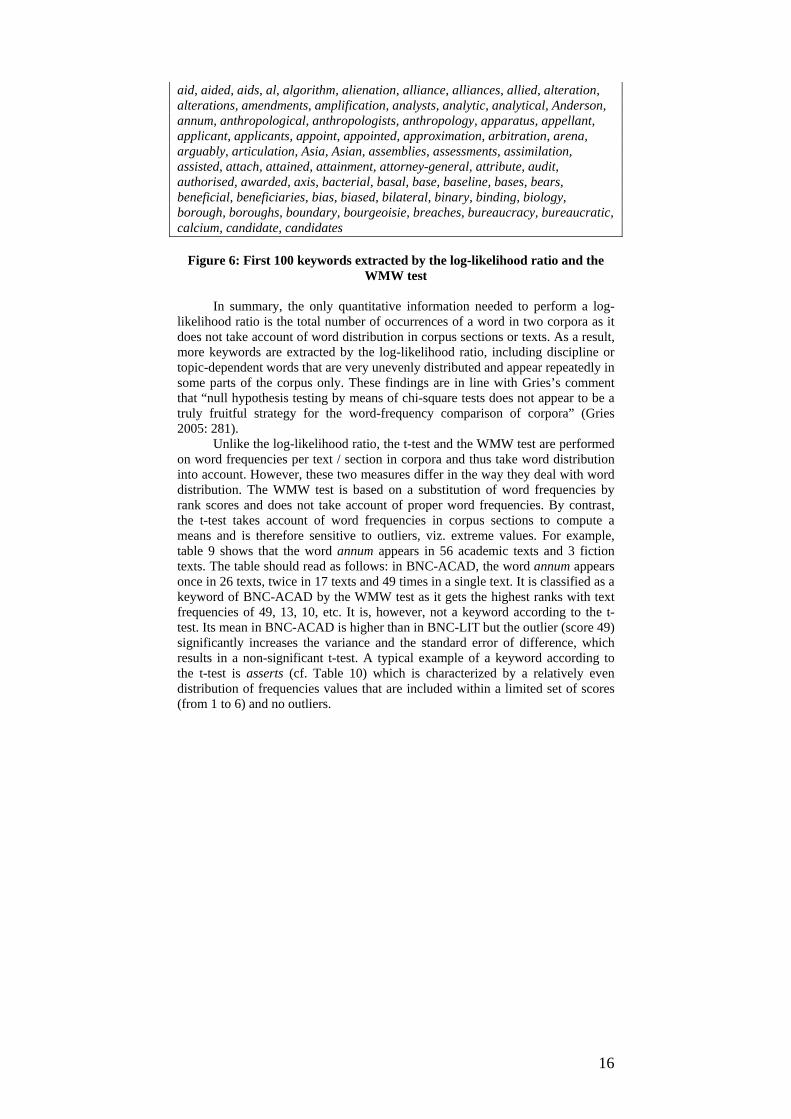
16
aid, aided, aids, al, algorithm, alienation, alliance, alliances, allied, alteration, alterations, amendments, amplification, analysts, analytic, analytical, Anderson, annum, anthropological, anthropologists, anthropology, apparatus, appellant, applicant, applicants, appoint, appointed, approximation, arbitration, arena, arguably, articulation, Asia, Asian, assemblies, assessments, assimilation, assisted, attach, attained, attainment, attorney-general, attribute, audit, authorised, awarded, axis, bacterial, basal, base, baseline, bases, bears, beneficial, beneficiaries, bias, biased, bilateral, binary, binding, biology, borough, boroughs, boundary, bourgeoisie, breaches, bureaucracy, bureaucratic, calcium, candidate, candidates
Figure 6: First 100 keywords extracted by the log-likelihood ratio and the
WMW test
In summary, the only quantitative information needed to perform a log-likelihood ratio is the total number of occurrences of a word in two corpora as it does not take account of word distribution in corpus sections or texts. As a result, more keywords are extracted by the log-likelihood ratio, including discipline or topic-dependent words that are very unevenly distributed and appear repeatedly in some parts of the corpus only. These findings are in line with Gries’s comment that “null hypothesis testing by means of chi-square tests does not appear to be a truly fruitful strategy for the word-frequency comparison of corpora” (Gries 2005: 281).
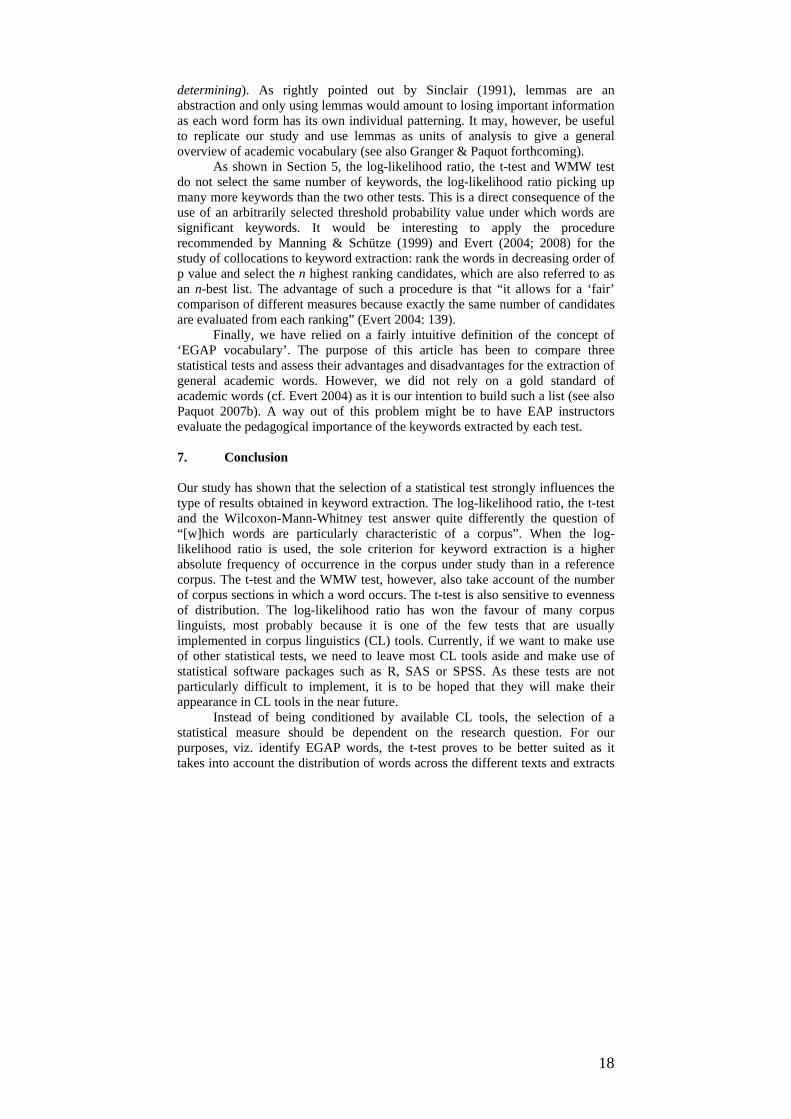
Unlike the log-likelihood ratio, the t-test and the WMW test are performed on word frequencies per text / section in corpora and thus take word distribution into account. However, these two measures differ in the way they deal with word distribution. The WMW test is based on a substitution of word frequencies by rank scores and does not take account of proper word frequencies. By contrast, the t-test takes account of word frequencies in corpus sections to compute a means and is therefore sensitive to outliers, viz. extreme values. For example, table 9 shows that the word annum appears in 56 academic texts and 3 fiction texts. The table should read as follows: in BNC-ACAD, the word annum appears once in 26 texts, twice in 17 texts and 49 times in a single text. It is classified as a keyword of BNC-ACAD by the WMW test as it gets the highest ranks with text frequencies of 49, 13, 10, etc. It is, however, not a keyword according to the t-test. Its mean in BNC-ACAD is higher than in BNC-LIT but the outlier (score 49) significantly increases the variance and the standard error of difference, which results in a non-significant t-test. A typical example of a keyword according to the t-test is asserts (cf. Table 10) which is characterized by a relatively even distribution of frequencies values that are included within a limited set of scores (from 1 to 6) and no outliers.
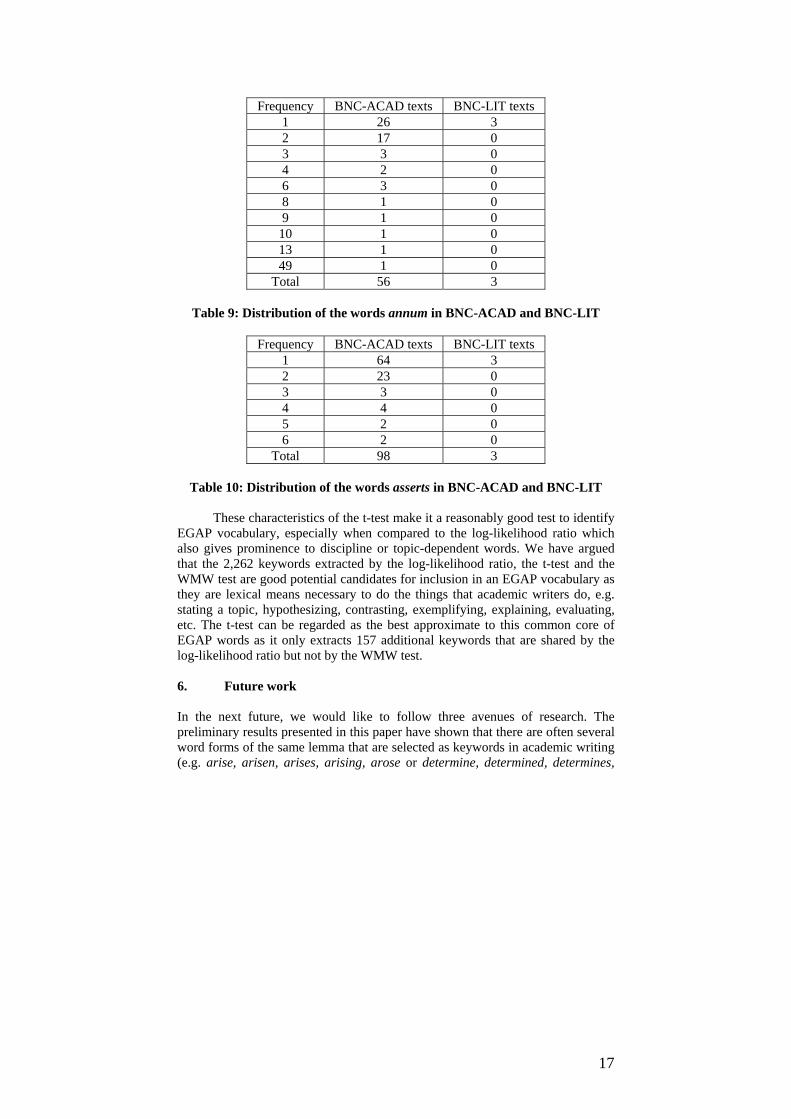
17
Table 9: Distribution of the words annum in BNC-ACAD and BNC-LIT
Table 10: Distribution of the words asserts in BNC-ACAD and BNC-LIT
These characteristics of the t-test make it a reasonably good test to identify
EGAP vocabulary, especially when compared to the log-likelihood ratio which also gives prominence to discipline or topic-dependent words. We have argued that the 2,262 keywords extracted by the log-likelihood ratio, the t-test and the WMW test are good potential candidates for inclusion in an EGAP vocabulary as they are lexical means necessary to do the things that academic writers do, e.g. stating a topic, hypothesizing, contrasting, exemplifying, explaining, evaluating, etc. The t-test can be regarded as the best approximate to this common core of EGAP words as it only extracts 157 additional keywords that are shared by the log-likelihood ratio but not by the WMW test.
6. Future work
In the next future, we would like to follow three avenues of research. The preliminary results presented in this paper have shown that there are often several word forms of the same lemma that are selected as keywords in academic writing (e.g. arise, arisen, arises, arising, arose or determine, determined, determines,
Frequency BNC-ACAD texts BNC-LIT texts 1 26 3 2 17 0 3 3 0 4 2 0 6 3 0 8 1 0 9 1 0
10 1 0 13 1 0 49 1 0
Total 56 3
Frequency BNC-ACAD texts BNC-LIT texts 1 64 3 2 23 0 3 3 0 4 4 0 5 2 0 6 2 0
Total 98 3
18
determining). As rightly pointed out by Sinclair (1991), lemmas are an abstraction and only using lemmas would amount to losing important information as each word form has its own individual patterning. It may, however, be useful to replicate our study and use lemmas as units of analysis to give a general overview of academic vocabulary (see also Granger & Paquot forthcoming).
As shown in Section 5, the log-likelihood ratio, the t-test and WMW test do not select the same number of keywords, the log-likelihood ratio picking up many more keywords than the two other tests. This is a direct consequence of the use of an arbitrarily selected threshold probability value under which words are significant keywords. It would be interesting to apply the procedure recommended by Manning & Schütze (1999) and Evert (2004; 2008) for the study of collocations to keyword extraction: rank the words in decreasing order of p value and select the n highest ranking candidates, which are also referred to as an n-best list. The advantage of such a procedure is that “it allows for a ‘fair’ comparison of different measures because exactly the same number of candidates are evaluated from each ranking” (Evert 2004: 139).
Finally, we have relied on a fairly intuitive definition of the concept of ‘EGAP vocabulary’. The purpose of this article has been to compare three statistical tests and assess their advantages and disadvantages for the extraction of general academic words. However, we did not rely on a gold standard of academic words (cf. Evert 2004) as it is our intention to build such a list (see also Paquot 2007b). A way out of this problem might be to have EAP instructors evaluate the pedagogical importance of the keywords extracted by each test.
7. Conclusion Our study has shown that the selection of a statistical test strongly influences the type of results obtained in keyword extraction. The log-likelihood ratio, the t-test and the Wilcoxon-Mann-Whitney test answer quite differently the question of “[w]hich words are particularly characteristic of a corpus”. When the log-likelihood ratio is used, the sole criterion for keyword extraction is a higher absolute frequency of occurrence in the corpus under study than in a reference corpus. The t-test and the WMW test, however, also take account of the number of corpus sections in which a word occurs. The t-test is also sensitive to evenness of distribution. The log-likelihood ratio has won the favour of many corpus linguists, most probably because it is one of the few tests that are usually implemented in corpus linguistics (CL) tools. Currently, if we want to make use of other statistical tests, we need to leave most CL tools aside and make use of statistical software packages such as R, SAS or SPSS. As these tests are not particularly difficult to implement, it is to be hoped that they will make their appearance in CL tools in the near future.
Instead of being conditioned by available CL tools, the selection of a statistical measure should be dependent on the research question. For our purposes, viz. identify EGAP words, the t-test proves to be better suited as it takes into account the distribution of words across the different texts and extracts
19
relatively few topic-dependent or discipline-specific words compared to the log-likelihood ratio and the Wilcoxon-Mann-Whitney. In fact, the t-test seems to satisfy Baker’s (2004: 351) demand for “a way that combines the strength of key keywords with those of keywords but is neither too general or exaggerates the importance of a word based on the eccentricities of individual files”.
Our study also points to the need of refining the concept of ‘keyword’. If one single text is analyzed, keywords are best defined as “items of unusual frequency in comparison with a reference corpus of some suitable kind” and the log-likelihood ratio is a good test to extract them. However, as soon as corpora are analyzed, the concept of keyword would be much more useful if it also relied on word distribution. If the keyword extraction procedure takes account of word distribution across corpus sections, it will be more selective and avoid topic-dependent or idiosyncrasies of individual texts. To conclude, we would therefore like to propose a modest amendment to the definition of ‘keyword’:
Keywords of a specific corpus are lexical items that are evenly distributed across its component parts (corpus sections or texts) and display a higher frequency and a wider range than in a reference corpus of some kind.
As shown in this study, a possible way of extracting keywords following this definition is to make use of the t-test. Notes 1 We gratefully acknowledge the financial support of the Belgian National
Fund for Scientific Research (F.N.R.S) and the Communauté française de Belgique. We also thank Professor Sylviane Granger for helpful comments on a previous version of this paper.
2 The British National Corpus (BNC) contains approximately 100 million words which reflect a wide variety of text types, genres and registers. The written component totals 90% of the corpus and includes samples of academic books, newspaper articles, popular fiction, letters, university essays and many other kinds of text. The spoken component represents 10% of the whole corpus and consists of monologues and dialogues in various contexts, e.g. business, leisure and education. For more information on the British National Corpus, see http://www.natcorp.ox.ac.uk.
3 Katz (1996: 19) distinguishes between ‘document-level burstiness’, i.e. “multiple occurrences of a content word or phrase in a single-text document, which is contrasted with the fact that most other documents contain no instances of this word or phrase at all; and ‘within-document burstiness’ or ‘burstiness proper’, i.e. “close proximity of all or some individual instances of a content word or phrase within a document exhibiting multiple occurrence”.
20
4 Measures of dispersion do not necessarily need to be used in addition to keyness values. Zhang et al. (2004), for example, have used a measure of dispersion to define a core lexicon on the basis that “if a word is commonly used in a language, it will appear in different parts of the corpus. And if the word is used commonly enough, it will be well-distributed”. The reader is referred to Oakes (1998: 189-192) and Gries (to appear) for more information on measures of dispersion.
5 Following Bergmann, Ludbrook & Spooren (2000), we use the term ‘Wilcoxon-Mann-Whitney test’ to refer to two equivalent tests that were developed independently, viz. the Wilcoxon rank sum test and the Mann-Whitney U test.
6. Chujo & Utiyama (2006) and Chujo et al. (2007) compare 9 statistical tests for keyword extraction but the selected tests are similar in that they are applied on absolute frequencies of occurrence. None of the tests under study takes corpus variability into account.
7 The log-likelihood ratio has a distribution similar to that of the chi-square. A statistical table for the distribution of the chi-square test can thus be used to find the log-likelihood ratio probability value.
8 The fact that some texts have been truncated in the British National Corpus is not ideal but the BNC academic sub-corpus is the largest corpus of academic texts from different disciplines that we could come across.
9 We made use of the normal approximation to determine p values of the WMW test.
10 When applied to large sample sizes, log-likelihood ratio tests and Pearson chi-square tests are equivalent tests (Dunning 1993; Howell 2007:152)
References Baker, P. (2004) Querying keywords: questions of difference, frequency and
sense in keyword analysis. Journal of English Linguistics 32(4): 346-359. Bergmann, R., J. Ludbrook and W. Spooren (2000), ‘Different Outcomes of the
Wilcoxon-Mann-Whitney Test from Different Statistics Packages’, The American Statistician, 54(1): 72-77.
Chujo, K. and M. Utiyama (2006), ‘Selecting level-specific specialized vocabulary using statistical measures’, System, 34: 255-269.
Chujo, K., M. Utiyama and T. Nakamura (2007), ‘Extracting level-specific science and technology vocabulary from the Corpus of Professional English (CPE)’, in: M. Davies, P. Rayson, S. Husnton and P. Danielsson (eds), Corpus Linguistics Proceedings 2007. Available online from < http://www.corpus.bham.ac.uk/corplingproceedings07/ >.
21
Curado Fuentes, A. (2001), ‘Lexical behaviour in academic and technical corpora: implications for ESP development’, Language Learning and Technology, 5(3): 106-129.
Dunning, T. (1993), ‘Accurate methods for the statistics of surprise and coincidence’, Computational Linguistics, 19(1): 61-74.
Evert, S. (2004), The Statistics of Word Cooccurrences: Word Pairs and Collocations. Ph.D. thesis, Institut für maschinelle Sprachverarbeitung, University of Stuttgart. Available from
<http://www.collocations.de/phd.html>. Evert, S. (2008), ‘Corpora and collocations’, in: A. Lüdeling and M. Kytö (eds),
Corpus Linguistics. An International Handbook. (Article 58). Berlin: Mouton de Gruyter.
Granger, S. and M. Paquot (to appear), ‘Lexical verbs in academic discourse: a corpus-driven study of learner use’, in: M. Charles, D. Pecorari and S. Hunston (eds), Academic Writing: At the interface of Corpus and Discourse. Continuum.
Gries, S. (2005), ‘Discussion Note: Null hypothesis significance testing of word frequencies: a follow-up on Kilgarriff’, Corpus Linguistics and Linguistic Theory, 1(2): 277-294.
Gries, S. (2006), ‘Exploring variability within and between corpora: some methodological considerations’, Corpora, 1(2): 109-151.
Gries, S. (to appear), ‘Dispersions and adjusted frequencies in corpora’, International Journal of Corpus Linguistics.
Halliday, M. and R. Hasan (1976), Cohesion in English. London: Longman. Howell, D. (2007), Statistical Methods for Psychology. Belmont: Thomson-
Wadsworth. Hogenraad, R. (1990), A Little Organon of Content Analysis: From the
Psychological Analysis of Discourse to the Analysis of Psychological Discourse. Thesis for Habilitation in Psychology. Université catholique de Louvain.
Katz, S. (1996), ‘Distribution of common words and phrases in text and language modelling’, Natural Language Engineering, 2(1): 15-59.
Kilgarriff, A. (2001), ‘Comparing corpora’, International Journal of Corpus Linguistics, 6(1): 1-37.
Kilgarriff, A. (2005), ‘Language is never, ever, ever random’, Corpus Linguistics and Linguistic Theory, 1(2): 263-275.
Lee, D. (2001a), ‘Defining core vocabulary and tracking its distribution across spoken and written genres: evidence of a gradience of variation from the British National Corpus’, Journal of English Linguistics, 29(3): 250-278.
Lee, D. (2001b), ‘Genres, registers, text types, domains and styles: clarifying the concepts and navigating a path through the BNC jungle’, Language Learning & Technology, 5(3): 37-72. Available online from: <http://llt.msu.edu/vol5num3/lee/default.html>
Leech, G., P. Rayson and A. Wilson (2001), Word Frequencies in Written and Spoken English: based on the British National Corpus. London: Longman.
22
Martin, A. (1976), ‘Teaching Academic Vocabulary to Foreign Graduate Students’, TESOL Quarterly, 10(1): 91-97.
Manning, C. and H. Schütze (1999), Foundations of statistical natural language processing. Cambridge and Massachusetts: MIT press.
McEnery, A., R. Xiao and Y. Tono (2006), Corpus-based language studies: an advanced resource book. London and New-York: Routledge.
Meyer, P.G. (1997), Coming to know: studies in the lexical semantics and pragmatics of academic English. Tübingen: Gunter Narr Verlag Tübingen.
Moore, R. C. (2004), ‘On Log-Likelihood Ratios and the Significance of Rare Events’, in: Proceedings of the 2004 Conference on Empirical Methods in Natural Language Processing, Barcelona, Spain. 333-340.
Mudraya, O. (2006), ‘Engineering English: A lexical frequency instructional model’, English for Specific Purposes, 25(2): 235-256.
Nation, P. (2001), Learning Vocabulary in another Language. Cambridge: Cambridge University Press.
Nelson, M. (2000), A Corpus-Based Study of Business English and Business English Teaching Materials. Unpublished PhD Thesis. Manchester: University of Manchester.
Oakes, M. (1998), Statistics for Corpus Linguistics. Edinburgh: Edinburgh University Press.
Oakes, M. and M. Farrow (2007), ‘Use of the Chi-Squared Test to examine vocabulary differences in English language corpora representing seven different countries’, Literary and Linguistic Computing, 22(1): 85-99.
Oxman, T.E., S.D. Rosenberg, P.P. Schnurr and G.J. Tucker (1988), ‘Diagnostic classification through content analysis of patients’ speech’, American Journal of Psychiatry, 145(4): 464–468.
Paquot, M. (2007a), EAP vocabulary in native English and EFL learner writing: From extraction to analysis. A phraseology-oriented approach. Unpublished PhD thesis. Louvain-la-Neuve: Université catholique de Louvain.
Paquot, M. (2007b), ‘Towards a productively-oriented academic word list’, in: J. Walinski, K. Kredens and S. Gozdz-Roszkowski (eds) Corpora and ICT in Language Studies. PALC 2005. Frankfurt am main: Peter Lang. 127-140.
Partington, A. (1998), Patterns and Meanings. Using Corpora for English Language Research and Teaching. Amsterdam and Philadelphia: Benjamins.
Pennebaker, J.W., M.R. Mehl and K.G. Niederhoffer (2003), ‘Psychological aspects of natural language use: Our words, our selves’, Annual Review of Psychology, 54: 547-577.
Rayson, P. (2003), Matrix: A statistical method and software tool for linguistic analysis through corpus comparison. Unpublished PhD thesis, Lancaster University.
Rayson, P., G. Leech and M. Hodges (1997), ‘Social differentiation in the use of English vocabulary: some analyses of the conversational component of the
23
British National Corpus’, International Journal of Corpus Linguistics, 2(1): 133 - 152.
Rietveld, T., R. Van Hout and M. Ernestus (2004), ‘Pitfalls in Corpus Research’, Computers and the Humanities, 38: 343-362.
Rude, S.S., E.M. Gortner and J.W. Pennebaker (2004), ‘Language use of depressed and depression-vulnerable college students’, Cognition and Emotion, 18: 1121-1133.
Scott, M (2004), WordSmith Tools 4. Oxford: Oxford University Press. Scott, M. and C. Tribble (2006), Textual patterns: Key words and corpus analysis
in language education. Amsterdam: Benjamins. Seale, C., S. Ziebland, and J. Charteris-Black (2006), ‘Gender, cancer experience
and internet use: a comparative keyword analysis of interviews and online cancer support groups’, Social Science and Medicine, 62: 2577-2590.
Siegel, S. and N.J. Castellan (1988), Nonparametric Statistics for the Behavioral Sciences (2nd ed.). New York: McGraw-Hill.
Sinclair, J. (1991), Corpus, Concordance, Collocation. Oxford: Oxford University Press.
Spence, D.P. (1980), ‘Lawfulness in Lexical Choice: A Natural Experiment’, Journal of the American Psychoanalytic Association, 28: 115-132.
Spence, D. P., H. S. Scarborough and E.H. Ginsberg (1978), ‘Lexical correlates of cervical cancer’, Social Science and Medicine, 12: 141-145.
Swales, J. (1990), Genre analysis: English in academic and research settings. Cambridge: Cambridge University Press.
Tribble, C. (1998), Writing Difficult Texts. Unpublished PhD thesis, Lancaster University. Available from <http://www.ctribble.co.uk/text/phd.htm>
Tribble, C. (2000), ‘Genres, keywords, teaching: towards a pedagogic account of the language of project proposals’, in: L. Burnard and T. McEnery (eds) Rethinking language pedagogy from a corpus perspective: papers from the third international conference on teaching and language corpora. Hamburg: Peter Lang.
Zhang, H., C. Huang and S. Yu (2004), ‘Distributional consistency as a general method for defining a core lexicon’, in: Proceedings of the Fourth International Conference on Language Resources and Evaluation, Lisbon, Portugal, 26-28 may 2004. Available online from: <http://data.cstr.ed.ac.uk/internal/library/proceedings/2004/lrec2004/>