distinguishing the forest from the trees university of texas november 11, 2009 richard derrig, phd,...
Post on 19-Dec-2015
215 views
TRANSCRIPT

Distinguishing the Forest from the Trees
University of TexasNovember 11, 2009
Richard Derrig, PhD, Opal Consulting
www.opalconsulting.comLouise Francis, FCAS, MAAA
Francis Analytics and Actuarial Data Mining, Inc.www.data-mines.com

Data Mining
Data Mining, also known as Knowledge-Discovery in Databases (KDD), is the process of automatically searching large volumes of data for patterns. In order to achieve this, data mining uses computational techniques from statistics, machine learning and pattern recognition.
• www.wikipedia.org

Why Predictive Modeling? Better use of data than
traditional methods
Advanced methods for dealing with messy data now available
Decision Trees a popular form of data mining

Desirable Features of a Data Mining Method:
Any nonlinear relationship can be approximated
A method that works when the form of the nonlinearity is unknown
The effect of interactions can be easily determined and incorporated into the model
The method generalizes well on out-of sample data

Nonlinear Example Data
Provider 2 Bill (Binned)
Avg Provider 2 Bill
Avg Total Paid Percent IME
Zero - 9,063 6%
1 – 250 154 8,761 8%
251 – 500 375 9,726 9%
501 – 1,000 731 11,469 10%
1,001 – 1,500 1,243 14,998 13%
1,501 – 2,500 1,915 17,289 14%
2,501 – 5,000 3,300 23,994 15%
5,001 – 10,000 6,720 47,728 15%
10,001 + 21,350 83,261 15%
All Claims 545 11,224 8%

An Insurance Nonlinear Function:Provider Bill vs. Probability of Independent Medical Exam
0 0 0 0 0 0 0 0 0 0 0 0 0 0 0 100
200
275
363
450
560
683
821
989
1195
1450
1805
2540
11368
Provider 2 Bill
0.30
0.40
0.50
0.60
0.70
0.80
0.90
Valu
e P
rob
IM
E

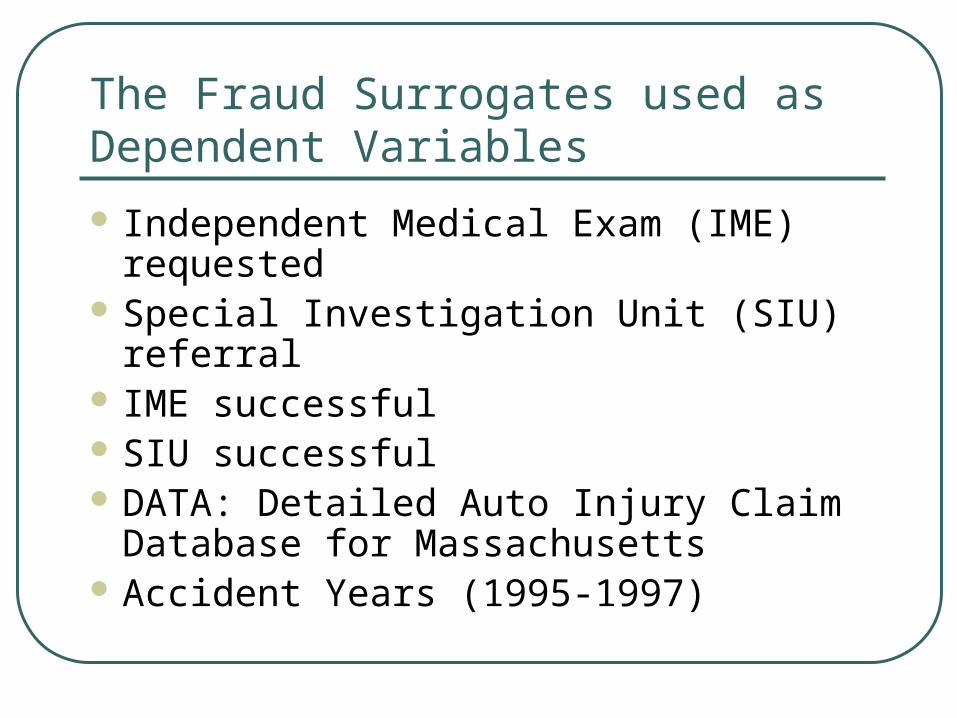
The Fraud Surrogates used as Dependent Variables
Independent Medical Exam (IME) requested; IME successful
Special Investigation Unit (SIU) referral; SIU successful
Data: Detailed Auto Injury Claim Database for Massachusetts
Accident Years (1995-1997)

Predictor Variables
Claim file variables• Provider bill, Provider type
• Injury
Derived from claim file variables• Attorneys per zip code
• Docs per zip code
Using external data• Average household income
• Households per zip

Predictor Variables
• Put the two tables here

Decision Trees
In decision theory (for example risk management), a decision tree is a graph of decisions and their possible consequences, (including resource costs and risks) used to create a plan to reach a goal. Decision trees are constructed in order to help with making decisions. A decision tree is a special form of tree structure.
• www.wikipedia.org

The Classic Reference on TreesBrieman, Friedman Olshen and Stone, 1993

CART Example of Parent and Children NodesTotal Paid as a Function of Provider 2 Bill
1st Split
All Data
Mean = 11,224
Bill < 5,021
Mean = 10,770
Bill>= 5,021
Mean = 59,250

Decision Trees Cont.
After splitting data on first node, then• Go to each child node
• Perform same process at each node, i.e.
• Examine variables one at a time for best split
• Select best variable to split on
• Can split on different variables at the different child nodes
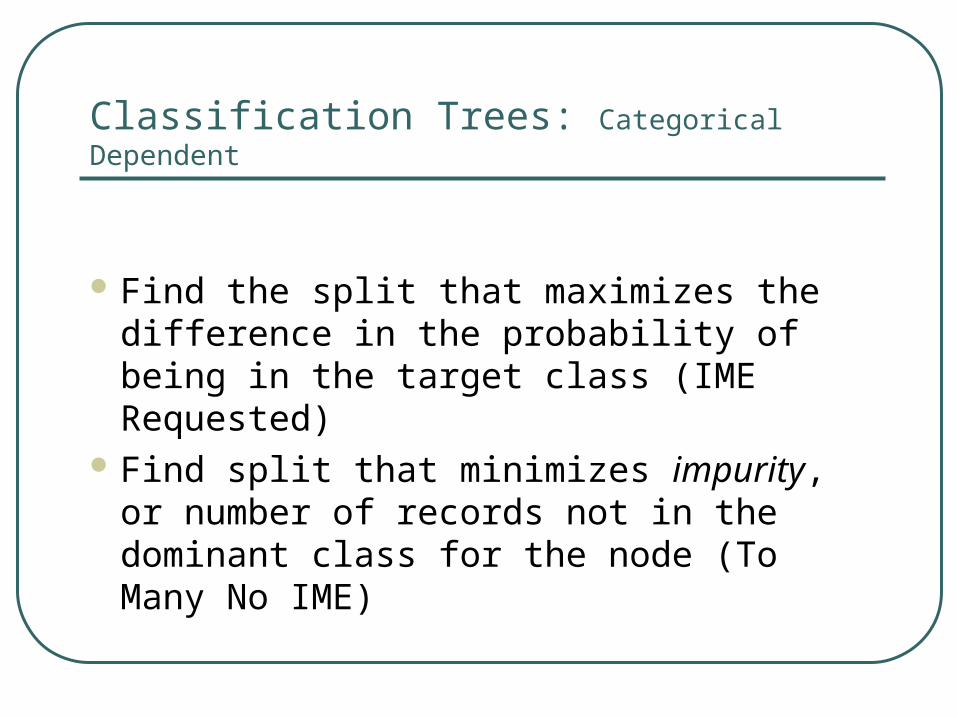
Classification Trees: Categorical Dependent
Find the split that maximizes the difference in the probability of being in the target class (IME Requested)
Find split that minimizes impurity, or number of records not in the dominant class for the node (To Many No IME)

Continue Splitting to get more homogenous groups at terminal nodes
|mp2.bill<3867
mp2.bill<1034.5
mp2.bill<2082.5
mp2.bill<1590.5
mp2.bill<1093.5
mp2.bill<1092.5
mp2.bill<39264.5
mp2.bill<5660 9583
14190 275100
15070
17590
20510 34870 60540
188100

CART Step Function Predictions with One Numeric PredictorTotal Paid as a Function of Provider 2 Bill
0 20000 500001000
030
000
5000
0
0 20000 50000
2000
040
000
6000
0

Recursive Partitioning: Categorical Variables

Different Kinds of Decision Trees
Single Trees (CART, CHAID) Ensemble Trees, a more recent development
(TREENET, RANDOM FOREST)• A composite or weighted average of many trees
(perhaps 100 or more)
• There are many methods to fit the trees and prevent overfitting
• Boosting: Iminer Ensemble and Treenet
• Bagging: Random Forest

The Methods and Software Evaluated
1) TREENET 5) Iminer Ensemble
2) Iminer Tree 6) Random Forest
3) SPLUS Tree 7) Naïve Bayes (Baseline)
4) CART 8) Logistic (Baseline)

Ensemble Prediction of Total Paid
0 0 0 0 0 0 0 0 0 0 0 0 0 0 81 19427236545757570586010401275156021353489
Provider 2 Bill
0.00
10000.00
20000.00
30000.00
40000.00
50000.00
60000.00V
alu
e T
ree
net
Pre
dic
ted

Ensemble Prediction of IME Requested
0 0 0 0 0 0 0 0 0 0 0 0 0 0 0 10
020
027
536
345
056
068
382
198
911
95
14
50
18
05
25
40
11
36
8
Provider 2 Bill
0.30
0.40
0.50
0.60
0.70
0.80
0.90
Va
lue
Pro
b IM
E
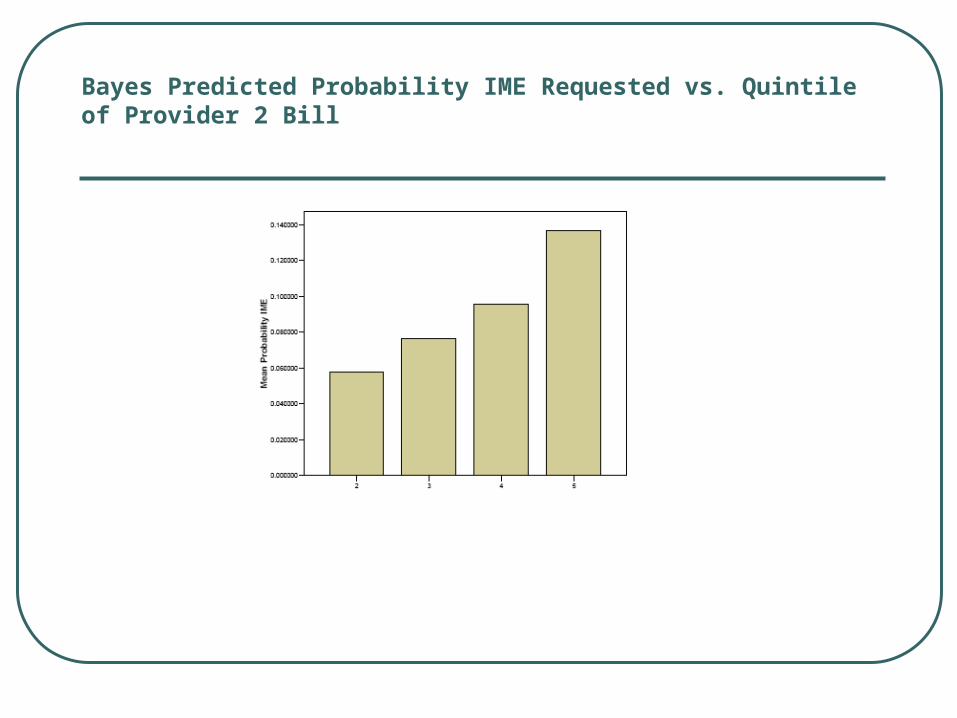
Bayes Predicted Probability IME Requested vs. Quintile of Provider 2 Bill

Naïve Bayes Predicted IME vs. Provider 2 Bill
0 97 18
12
65
34
94
33
51
76
01
68
57
69
85
39
39
10
25
11
10
11
99
12
85
13
71
14
65
15
54
16
49
17
45
18
38
19
45
20
50
21
49
22
60
23
80
25
12
26
37
27
60
28
95
30
42
31
96
33
91
35
88
38
05
40
60
43
35
47
05
52
00
59
44
71
26
92
88
13
76
7
Provider 2 Bill
0.060000
0.080000
0.100000
0.120000
0.140000
Me
an
Pro
ba
bil
ity
IM
E
The Fraud Surrogates used as Dependent Variables
Independent Medical Exam (IME) requested
Special Investigation Unit (SIU) referral IME successful SIU successful DATA: Detailed Auto Injury Claim
Database for Massachusetts Accident Years (1995-1997)

S-Plus Tree Distribution of Predicted Score

One Goodness of Fit Measure: Confusion Matrix

Specificity/Sensitivity
Sensitivity:• The proportion of true positives that are
identified by model.
Specificity:• The proportion of True negatives correctly
identified by the model
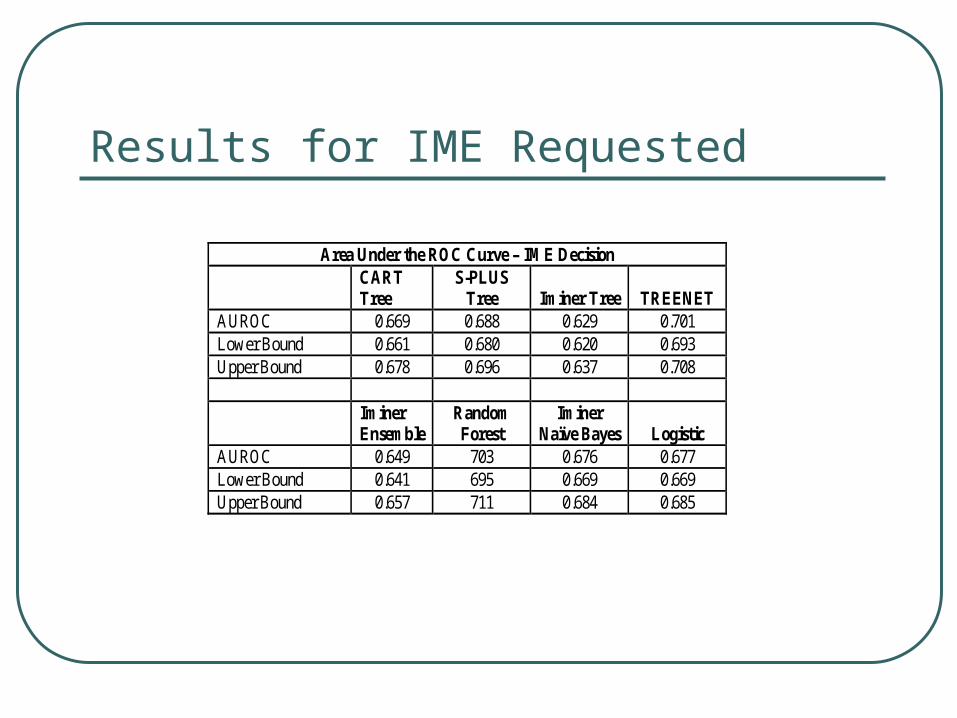
Results for IME Requested
Area Under the ROC Curve – IME Decision CART
Tree S-PLUS
Tree Iminer Tree TREENET AUROC 0.669 0.688 0.629 0.701 Lower Bound 0.661 0.680 0.620 0.693 Upper Bound 0.678 0.696 0.637 0.708 Iminer
Ensemble Random Forest
Iminer Naïve Bayes Logistic
AUROC 0.649 703 0.676 0.677 Lower Bound 0.641 695 0.669 0.669 Upper Bound 0.657 711 0.684 0.685

TREENET ROC Curve – IMEAUROC = 0.701
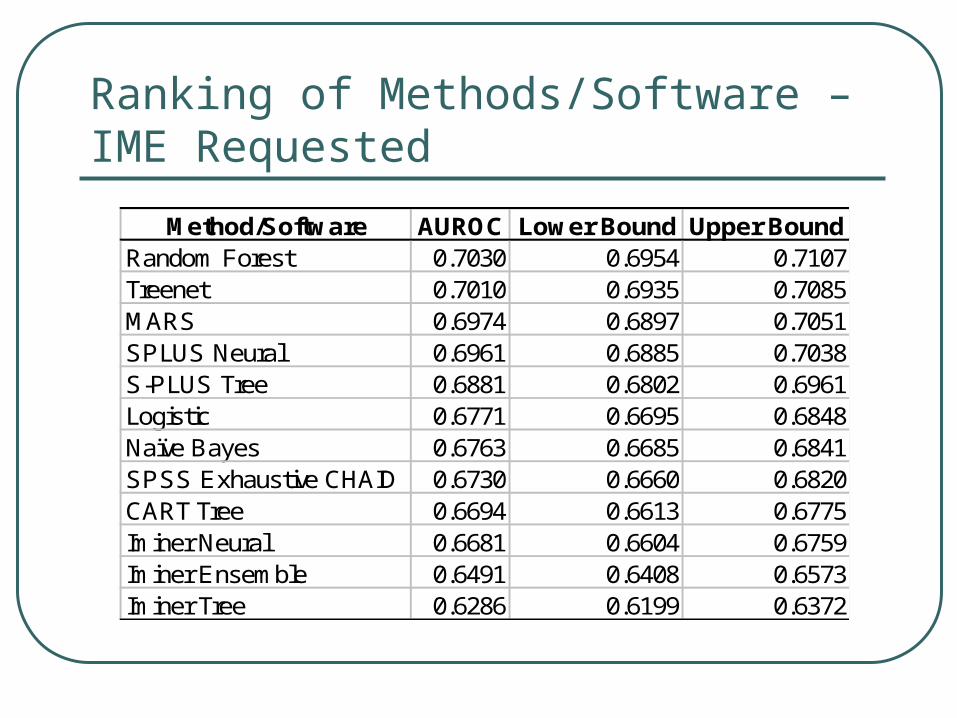
Ranking of Methods/Software – IME Requested
Method/Software AUROC Lower Bound Upper BoundRandom Forest 0.7030 0.6954 0.7107Treenet 0.7010 0.6935 0.7085MARS 0.6974 0.6897 0.7051SPLUS Neural 0.6961 0.6885 0.7038S-PLUS Tree 0.6881 0.6802 0.6961Logistic 0.6771 0.6695 0.6848Naïve Bayes 0.6763 0.6685 0.6841SPSS Exhaustive CHAID 0.6730 0.6660 0.6820CART Tree 0.6694 0.6613 0.6775Iminer Neural 0.6681 0.6604 0.6759Iminer Ensemble 0.6491 0.6408 0.6573Iminer Tree 0.6286 0.6199 0.6372

Ranking of Methods/Software – SIU Requested
Method/Software AUROC Lower Bound Upper BoundRandom Forest 0.6772 0.6681 0.6863Treenet 0.6428 0.6339 0.6518SPSS Exh CHAID 0.6360 0.6270 0.6460MARS 0.6280 0.6184 0.6375Iminer Neural 0.6230 0.6136 0.6325S-PLUS Tree 0.6163 0.6065 0.6261Iminer Naïve Bayes 0.6151 0.6054 0.6247Logistic 0.6121 0.6028 0.6213SPLUS Neural 0.6111 0.6011 0.6211CART Tree 0.6073 0.5980 0.6167Iminer Tree 0.5649 0.5552 0.5745Iminer Ensemble 0.5395 0.5305 0.5484

Ranking of Methods/Software – 1st Two Surrogates
Ranking of Methods By AUROC - Decision Method SIU AUROC SIU Rank IME Rank IME
AUROC Random Forest 0.645 1 1 0.703 TREENET 0.643 2 2 0.701 S-PLUS Tree 0.616 3 3 0.688 Iminer Naïve Bayes 0.615 4 5 0.676 Logistic 0.612 5 4 0.677 CART Tree 0.607 6 6 0.669 Iminer Tree 0.565 7 8 0.629 Iminer Ensemble 0.539 8 7 0.649

Ranking of Methods/Software – Last Two Surrogates
Ranking of Methods By AUROC - Favorable Method SIU AUROC SIU Rank IME Rank IME
AUROC TREENET 0.678 1 2 0.683 Random Forest 0.645 2 1 0.692 S-PLUS Tree 0.616 3 5 0.664 Logistic 0.610 4 3 0.677 Iminer Naïve Bayes 0.607 5 4 0.670 CART Tree 0.598 6 7 0.651 Iminer Ensemble 0.575 7 6 0.654 Iminer Tree 0.547 8 8 0.591

Plot of AUROC for SIU vs. IME Decision
0.50 0.55 0.60 0.65
AUROC.SIU
0.50
0.55
0.60
0.65
0.70
AU
RO
C.IM
E
CART
IM Ensemble
IM Tree
Logistic/Naive Bayes
Random Forest
S-PLUS Tree
Treenet

Plot of AUROC for SIU vs. IME Favorable
0.55 0.60 0.65
SIU.AUROC
0.55
0.60
0.65
0.70
IME
.AU
RO
C
IM Tree
IM Ensemble CART
NBayesLogistic Regression
S-PLUS Tree
RandomForestTreenet

Plot of AUROC for SIU vs. IME Decision

Plot of AUROC for SIU vs. IME Favorable – Tree Methods Only
0.55 0.60 0.65
SIU.AUROC
0.55
0.60
0.65
0.70
IME
.AU
RO
C
IM Tree
IM Ensemble CART
NBayesLogistic Regression
S-PLUS Tree
RandomForestTreenet

References
Francis and Derrig “Distinguishing the Forest From the Trees”, Variance, 2008
Francis, “Neural Networks Demystified”, CAS Forum, 2001
Francis, “Is MARS Better than Neural Networks?”, CAS Forum, 2003• All can be found at www.casact.org