distribute or post, copy, · interpret data. 2.4 describe reliability, validity, replication, and...
TRANSCRIPT

2 Research Methods
AJ PH
OTO
/BSIP / Corbis D
ocumentary / G
etty Images
Copyright ©2019 by SAGE Publications, Inc. This work may not be reproduced or distributed in any form or by any means without express written permission of the publisher.
Do not
copy
, pos
t, or d
istrib
ute

CHAPTER 2 REsEARCH METHods 27
Core Questions
1. What are the elements of the scientific method?
2. How do social psychologists design studies?
3. How do social psychologists analyze their results?
4. How can research be analyzed in terms of quality?
Learning Objectives
2.1 Describe how the scientific method creates knowledge.
2.2 Compare the logic behind preexperiments, true experiments, quasi-experiments, and correlational designs.
2.3 Summarize the most common ways to analyze and interpret data.
2.4 Describe reliability, validity, replication, and ethical standards for research in social psychology.
L ike all sciences, social psychology usually moves like snail: steady but slow. It is slow, in part, because what social psychologists study is usually invisible—and therefore
difficult to measure. For example, prejudice, persuasion, altruism, and romantic love are all scientific constructs, theoretical ideas that cannot be directly observed. Although the scientific process is slow, social psychology is growing fast. It is growing fast because so many students are attracted to Kurt Lewin’s vision of an applied science.
Perhaps social psychology’s popularity explains why so many passengers were carrying long plastic or cardboard tubes on a recent plane ride. The plane was full of people presenting at a conference sponsored by the Society for Personality and Social Psychology (SPSP), which happens at the end of every winter. The tubes contained rolled-up posters summarizing the most cutting-edge research in the field. This chapter describes how the professional scientists, graduate students, and even a few undergradu-ates created those studies—and it invites you to join us.
WHAT ARE THE ELEMENTS OF THE SCIENTIFIC METHOD?
LO 2.1: Describe how the scientific method creates knowledge.
Social psychologists tend to describe themselves as belonging to one of two groups. Basic researchers increase our understanding by creating and improving the theories that predict social behavior. Applied researchers translate those theories into social action. Applied research is where theory confronts reality—but with the understand-ing that reality always wins. If a theory does not describe reality, then the theory has to change. Basic research is important because, as social psychology’s pioneer Kurt Lewin famously said, “There is nothing so practical as a good theory” (Lewin, 1951, p. 169). Applied research has to have a theoretical foundation—and a “good” theory has to describe and explain the real world. How does this balance play out in actual scientific research?
The Cycle of Science: The Scientific MethodMost of the research stories on those conference posters followed the same, easy-to-follow formula. The scientific method is a systematic way of creating knowledge by observing, forming a hypothesis, testing a hypothesis, and interpreting the results. Your results lead you to generate a new hypothesis that starts the process all over again. As you can see in Figure 2.1, it cycles endlessly through the same steps (or phases) and demands
Basic researchers: Psychologists who increase our understanding of psychology by creating and improving the theories that predict social behavior.
Applied researchers: Psychologists who translate the findings of basic researchers into social action and apply psychological ideas to the real world.
Scientific method: A systematic way of creating knowledge by observing, forming a hypothesis, testing a hypothesis, and interpreting the results. The scientific method helps psychologists conduct experiments and formulate theories in a logical and objective manner.
Ask the Experts: Keon West on Research Methods in Psychology
©SAGE Publications
Copyright ©2019 by SAGE Publications, Inc. This work may not be reproduced or distributed in any form or by any means without express written permission of the publisher.
Do not
copy
, pos
t, or d
istrib
ute

SOCIAL PSYCHOLOGY28
a willingness to change your mind if the data surprise you. Even though properly following the scientific method is sometimes a chal-lenge, the rewards of exploring the fascinating topics within social psychology make it all worthwhile.
There are four phases in the scientific method:Phase 1: Observe a pattern of behavior. Imagine that you are in
a coffee shop quietly observing other customers. You notice that men frequently interrupt people during conversations—and that seems to be especially true when their conversation partner is a woman. Welcome aboard; you’ve started the scientific journey. Your simple observation got you started as your curiosity prompted you to ask, Is this a pattern? (By the way, this exact observation was tested in cof-fee shops and drug stores back in 1975 by Zimmerman and West.) Phase 1 of the scientific method occurs when we observe a reliable pattern of behavior.
Phase 2: Generate a hypothesis. After you identify what looks like a pattern, you move on to Phase 2 by generating a formal hypothesis, or a specific statement of what you believe will happen in an experiment that tests your observation. Perhaps your hypoth-esis is that men are more willing to interrupt others than women are, especially in cross-sex interactions. In other words, you expect that (1) men interrupt more than women in general, and (2) men interrupt women more than they interrupt other men. Hypotheses are never stated as questions (such as, “Who interrupts more, men
or women?”). As we discussed in Chapter 1, hypotheses are always falsifiable statements that can be proved wrong.
Consider the following hypotheses: (1) Every man on Earth has interrupted some-one else at least once, and (2) men have always been more likely to interrupt than women, in every culture throughout history. Neither of these hypotheses stands up to the “falsifiability” rule because they can’t be tested and proved wrong. The first hypoth-esis is untestable because it simply can’t be done. Even a crack team of well-funded researchers couldn’t locate every single man on the face of the planet and then observe him in an objective social setting. The second hypothesis also can’t be falsified because there is no archive of historical records that enables us to ask the question about every historical period for the past thousands of years.
Phase 3: Test the hypothesis. Now that we have a hypothesis, we set up a specific methodology or procedure to test it. For our current example, we might observe people in public places (like the coffee shop) in a more structured way, such as by making a spreadsheet of all the men and women and making tallies for each time someone interrupts. We might also ask people to come to a classroom or lab on a college campus and set them up in groups with a certain number of men and women and then observe who interrupts whom.
Either way, we can gather real, measurable data that will support our hypothesis, allowing us to modify it and move to the next step, or data that cause us to throw it out. We have to be careful, of course, not to ruin our own experiment by staring as we eaves-drop on some innocent couple drinking coffee (later we will discuss this issue in more depth, as well as ethics in research).
Phase 4: Interpret the results and refine your hypothesis. Notice that the final stage of interpreting results is not the end of the road. Once we have our data, we aren’t done with science—in fact, we’ve only just begun! The scientific method cycles back so that we can explore our topic in more complicated and refined ways. Perhaps we
FIGURE 2.1 In the scientific method, scientists observe the world and notice patterns, then formulate a hypothesis. Next, they create a procedure to scientifically test their hypothesis. After interpreting the results, the process begins again as the hypotheses become more refined or complicated or as they are applied to a wider variety of settings or people.
Observe apattern
Generate ahypothesis
Interpretresults, refine
hypothesis
Scientificallytest
hypothesis
Hypothesis: A specific statement made by a researcher before conducting a study about the expected outcome of the study based on prior observation. Hypotheses are falsifiable statements that researchers believe to be true (see falsification).
Copyright ©2019 by SAGE Publications, Inc. This work may not be reproduced or distributed in any form or by any means without express written permission of the publisher.
Do not
copy
, pos
t, or d
istrib
ute

CHAPTER 2 REsEARCH METHods 29
found support for the basic idea that, overall, men are indeed more likely than women to interrupt someone. However, this general pattern probably varies greatly based on the people involved and the circumstances. In other words, our results have become a new hypothesis that requires us to begin again. Consider the following possible new hypotheses as examples:
•• Women with more assertive personalities are more likely to interrupt others, compared to women with less assertive personalities.
•• Men are less likely to interrupt women they find physically attractive, compared to women they don’t find attractive.
•• Men interrupt others more in friendly or informal settings, compared to formal settings such as at work.
•• Men from cultures with more traditional gender roles are more likely to interrupt women than are men from more egalitarian cultures.
Can you see why the scientific approach is a constantly unfolding story? That story can only move forward if we remain as objective as possible when forming hypotheses and interpreting results. An individual research study, like the posters at a research conference, is a very small piece of a very big puzzle. But every step we take brings us a tiny bit closer to understanding the complicated world of social interaction.
Creating and Measuring ConstructsMany of the things social psychologists are interested in are abstract ideas or constructs, theoretical ideas that cannot be directly observed; examples are atti-tudes, personality, attraction, or how we think. Those measurement challenges—and the passion to conduct meaningful social research—are what has made social psychologists so creative in designing studies.
Because constructs are abstract and sometimes relatively broad ideas, the first step in using them in research is to operationalize your variables by specifying how they will be defined and measured. The process is called operationalizing because you must describe the specific operations you will per-form to measure each of the variables in your study. If a researcher wanted to investigate the construct of “love,” for example, she could operationalize it in a wide variety of ways such as (1) scores on a survey asking people to rate how much they love someone on a scale of 1 to 10; (2) how long they have maintained a committed, monogamous relationship; or even (3) how much their heart rate increases and their pupils dilate when the other person comes into the room.
Once we’ve operationalized the variables in our hypothesis, we have to decide how to proceed. Here are common methodologies that you’ll see in several of the studies featured in this book. It’s not a complete list of every possible study design, but it will give you a good idea of how social psychologists do business.
The myth of Sisyphus says that he’s constantly trying to roll a heavy boulder uphill. The scientific method can sometimes feel like an uphill battle—but progress requires constant small steps. The top of the scientific mountain may not even exist, but moving up remains satisfying.
Constructs: Theoretical ideas that cannot be directly observed, such as attitudes, personality, attraction, or how we think.
Operationalize: The process of specifying how a construct will be defined and measured.
Sisyphus by Titian, 1549
Copyright ©2019 by SAGE Publications, Inc. This work may not be reproduced or distributed in any form or by any means without express written permission of the publisher.
Do not
copy
, pos
t, or d
istrib
ute

SOCIAL PSYCHOLOGY30
Types of ResearchOnce you’ve noticed a pattern and generated a hypothesis, there are a lot of different ways you can set up a scientific methodology or procedure to test that hypothesis. This book isn’t about research methods, so we’ll just cover a few of your options here—these are the most popular methods you’ll see throughout the rest of the book and in the field of social psychology. Four options are (1) archival studies, (2) naturalistic observation, (3) surveys, and (4) experiments. We’ll cover the first three methods here, and experi-ments will be discussed in depth in the next section.
Archival Studies. One of the sources of information available to social psychologists requires (almost) no work because the data already exist. Archival data are stored informa-tion that was originally created for some other purpose not related to research. Newspapers, census data, Facebook posts, and even pop culture are all examples of archival data.
Archival data are being collected every day in every community, and it’s up to social scientists to think about hypotheses that might be tested. For example, researchers inter-ested in patterns within domestic violence can look at police records to test hypotheses about whether different types of people report this crime, whether couples who report once are more likely to report again, whether demographic variables such as socioeco-nomic status or certain neighborhoods have higher or lower rates of violence, and so on.
Naturalistic Observation. Another approach is naturalistic observation, or scien-tific surveillance of people in their natural environments. By “natural,” we don’t mean in a cornfield or a forest—we mean people doing the behavior of interest where it normally would occur. Observing people in a coffee shop is a good example. If we were interested in whether teachers are nicer to physically attractive children, then we might go to an ele-mentary school to observe classes. If we were interested in leadership styles, we might go to a large corporate office and observe how workers react to different types of managers. Either way, we’re simply observing behavior in its natural setting.
You might be thinking, “If some scientist came to my workplace and followed me around, writing down everything I do, then I probably wouldn’t react very naturally.” If that thought occurred to you, then congratulations—you are thinking like a good scientist. The presence of the researcher is one of the biggest challenges for naturalistic observations. When people change their behavior simply because they’re being observed, it’s called reactivity. But social psychologists are clever people. How do you think they get around this problem?
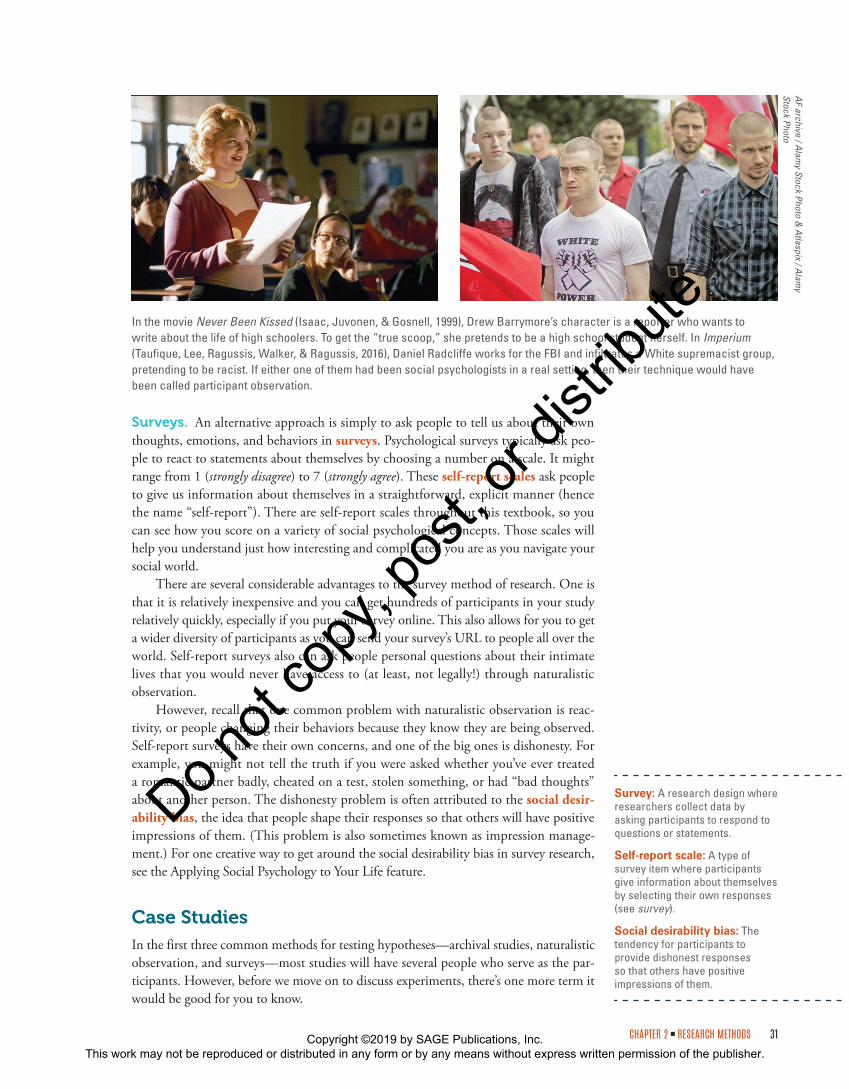
One creative solution is a technique called participant observation, in which scientists disguise themselves as people who belong in that environment. It’s kind of like going undercover. You pretend you’re not doing research at all and hope to fade into the background—and still find some discreet way to record your observations. For example, when observing schoolchildren, we might pretend to be substitute teachers. If we want to observe people at work, we might pretend to be interns at the company. One set of researchers wanted to photograph boys enjoying themselves at a summer camp (that was secretly run by psychologists). So, one of the camp counselors played the role of a “shutter bug”—someone who is taking pictures all the time. The boys quickly learned to ignore the shutter bug, and the researchers came away with some beautiful, authentic photographs (see the Sherif study described in Chapter 9).
Participant observation may create some ethical problems, so be careful. After all, you are deceiving people about why you are there. And it may be an ethical violation to observe people when they don’t know they are being observed. The advantage of this technique—or any form of naturalistic observation—is that hopefully, we get to observe authentic social behaviors.
Archival data: Stored information that was originally created for some other purpose not related to research that can later be used by psychologists, such as census data.
Naturalistic observation: A research design where scientists gather data by observing people in the environment within which the behavior naturally occurs (for instance, observing leadership styles in a corporate office).
Reactivity: When people change their behavior simply because they’re being observed (see social desirability bias and good subject bias).
Participant observation: A technique used during naturalistic observation where scientists covertly disguise themselves as people belonging in an environment in an effort to observe more authentic social behaviors.
Copyright ©2019 by SAGE Publications, Inc. This work may not be reproduced or distributed in any form or by any means without express written permission of the publisher.
Do not
copy
, pos
t, or d
istrib
ute
CHAPTER 2 REsEARCH METHods 31
Surveys. An alternative approach is simply to ask people to tell us about their own thoughts, emotions, and behaviors in surveys. Psychological surveys typically ask peo-ple to react to statements about themselves by choosing a number on a scale. It might range from 1 (strongly disagree) to 7 (strongly agree). These self-report scales ask people to give us information about themselves in a straightforward, explicit manner (hence the name “self-report”). There are self-report scales throughout this textbook, so you can see how you score on a variety of social psychological concepts. Those scales will help you understand just how interesting and complicated you are as you navigate your social world.
There are several considerable advantages to the survey method of research. One is that it is relatively inexpensive and you can get hundreds of participants in your study relatively quickly, especially if you put your survey online. This also allows for you to get a wider diversity of participants as you can send your survey’s URL to people all over the world. Self-report surveys also can ask people personal questions about their intimate lives that you would never have access to (at least, not legally!) through naturalistic observation.
However, recall that one common problem with naturalistic observation is reac-tivity, or people changing their behaviors because they know they are being observed. Self-report surveys have their own concerns, and one of the big ones is dishonesty. For example, you might not tell the truth if you were asked whether you’ve ever treated a romantic partner badly, cheated on a test, stolen something, or had “bad thoughts” about another person. The dishonesty problem is often attributed to the social desir-ability bias, the idea that people shape their responses so that others will have positive impressions of them. (This problem is also sometimes known as impression manage-ment.) For one creative way to get around the social desirability bias in survey research, see the Applying Social Psychology to Your Life feature.
Case StudiesIn the first three common methods for testing hypotheses—archival studies, naturalistic observation, and surveys—most studies will have several people who serve as the par-ticipants. However, before we move on to discuss experiments, there’s one more term it would be good for you to know.
Survey: A research design where researchers collect data by asking participants to respond to questions or statements.
Self-report scale: A type of survey item where participants give information about themselves by selecting their own responses (see survey).
Social desirability bias: The tendency for participants to provide dishonest responses so that others have positive impressions of them.
In the movie Never Been Kissed (Isaac, Juvonen, & Gosnell, 1999), Drew Barrymore’s character is a reporter who wants to write about the life of high schoolers. To get the “true scoop,” she pretends to be a high school student herself. In Imperium (Taufique, Lee, Ragussis, Walker, & Ragussis, 2016), Daniel Radcliffe works for the FBI and infiltrates a White supremacist group, pretending to be racist. If either one of them had been social psychologists in a real setting, then their technique would have been called participant observation.
AF archive / A
lamy Stock Photo &
Atlaspix / A
lamy
Stock Photo
Copyright ©2019 by SAGE Publications, Inc. This work may not be reproduced or distributed in any form or by any means without express written permission of the publisher.
Do not
copy
, pos
t, or d
istrib
ute

SOCIAL PSYCHOLOGY32
When a single example of an event or a single person is used to test a hypothesis or refine it further, it’s called a case study. A case study represents a single example of the phenomenon of interest. For example, one case study you’ll see later (in Chapter 11) describes the level of violence in The Great Train Robbery, a 1903 movie that was the first film to tell a story (Porter & Porter, 1903). The case study summarized the story in the film and computed the ratio of violence per minute to analyze how much violence was shown in the movie.
Note that this case study used archival data. The movie itself was preexisting infor-mation, sitting in YouTube and waiting to be analyzed. Case studies can be archival, but we might also use naturalistic observation to record behaviors in a particular person over time, or we might give one person a survey to complete—or we might even ask a single person to engage in an experiment (see the next section). So, case studies can be used in any of the forms of research we’ve covered here.
As we prepared to write this chapter, we became interested in whether case studies were being more or less accepted by modern psychologists. We hypothesized that the rate
Sometimes when people fill out self-report scales in
research studies (or on job interviews, or anywhere
else), they aren’t completely honest. Instead, they answer
in a way that they think makes them look good; this ten-
dency in people is called the social desirability bias. One
creative way that social psychologists test for this ten-
dency in people is to give them the scale shown here,
which is specifically designed to catch people in small
lies. Most people have done many of the bad behaviors
listed here—so if research participants don’t admit to
them, they are probably showing the social desirability
bias; they are changing their answers to look good.
Instructions: Listed below are a number of statements
concerning personal attitudes and traits.
Please read each item and decide whether the state-
ment is true or false as it pertains to you personally.
Circle “T” for true statements and “F” for false
statements.
T F 1. Before voting I thoroughly investigate the
qualifications of all the candidates.
T F 2. I never hesitate to go out of my way to help
someone in trouble.
T F 3. I sometimes feel resentful when I don’t get
my way.
T F 4. I am always careful about my manner of
dress.
T F 5. My table manners at home are as good as
when I eat out in a restaurant.
T F 6. I like to gossip at times.
T F 7. I can remember “playing sick” to get out of
something.
T F 8. There have been occasions when I took
advantage of someone.
T F 9. I’m always willing to admit it when I make a
mistake.
T F 10. There have been occasions when I felt like
smashing things.
T F 11. I am always courteous, even to people who
are disagreeable.
T F 12. At times I have really insisted on having
things my own way.
Scoring: Give yourself 1 point if you said TRUE for
Item 1, 2, 4, 5, 9, or 11. Then, give yourself 1 point if you
said FALSE for Item 3, 6, 7, 8, 10, or 12. The more points
you have, the more you are trying to manage your impres-
sion on others.
Source: Crowne and Marlowe (1960).
Applying Social Psychology to Your Life
MEASURING SOCIAL DESIRABILITY
Case study: A type of research where scientists conduct an in-depth study on a single example of an event or a single person to test a hypothesis.
Copyright ©2019 by SAGE Publications, Inc. This work may not be reproduced or distributed in any form or by any means without express written permission of the publisher.
Do not
copy
, pos
t, or d
istrib
ute

CHAPTER 2 REsEARCH METHods 33
of referencing case studies had been declining over time, as the use of online survey soft-ware has become more and more popular. To test our hypothesis, we used archival data that existed in the PsycINFO database. PsycINFO is the most comprehensive database of research books and journal articles across psychological subdisciplines. It’s like Google or any other search engine, except your search collects data from books, chapters, or jour-nal articles published by psychologists around the world. When we searched PsycINFO for publications that made use of case studies, would we see a decline over time?
Our hypothesis was not supported—in other words, we were wrong. Instead, we found a trend of increased referencing of case studies (Figure 2.2). Again, these were archival data, originally created for another purpose, waiting to be mined for insight. (Note: If you do this study again, you probably will get slightly higher numbers, espe-cially for the most recent years, as new articles are admitted into the PsycINFO database.)
The Main Ideas
• The scientific method, which is used by social psychologists who conduct research, includes (1) observing a pattern, (2) generating a hypothesis, (3) scientifically testing the hypothesis, and (4) interpreting results so that the hypothesis can be refined and tested again.
• Abstract ideas or variables are called constructs, and deciding how to define and measure constructs is called operationalization.
• Three ways to gather data are (1) using archival data, or sources originally gathered or created for a different purpose; (2) naturalistic observation, or watching behavior where it would have occurred anyway; and (3) surveys, or asking people directly to report their thoughts, emotions, or behaviors. Any of these methods can use multiple participants or a single participant; single-participant studies are called case studies.
PsycINFO database: The most comprehensive database of research books and journal articles across psychological subdisciplines.
FIGURE 2.2 The frequency and percentage of articles referring to case studies in PsycINFO.
1890
–189
9
1900
–190
9
1910
–191
9
1920
–192
9
1930
–193
9
1940
–194
9
1950
–195
9
1960
–196
9
1970
–197
9
1980
–198
9
1990
–199
9
2000
–200
9
2010
–201
9 (es
t.)
12.14%
88.67%
95.51%
249.63%
666.61%
8381.47%
13641.47%
29932.1%
69292.47%
137333.02%
224803.57%
514904.60%
848734.64%
SOURCE: Created using data from the American Psychological Association.
Copyright ©2019 by SAGE Publications, Inc. This work may not be reproduced or distributed in any form or by any means without express written permission of the publisher.
Do not
copy
, pos
t, or d
istrib
ute

SOCIAL PSYCHOLOGY34
CRITICAL THINKING CHALLENGE
•• Think about the classrooms you’ve been inside recently. Consider the physical aspects of the room (such as size, type of desks, color, art on the walls, and so on). Then consider how people choose to sit in the room during classes (such as whether they prefer the front or back row, how much they spread out, what kinds of people tend to sit together, and so on). Generate three hypotheses about how either the physical environment or the social environment shapes learning.
•• Imagine that you want to do a study on how companies support leadership within their organizations. First, describe how you might conduct the study using archival data; then, how you’d do it with naturalistic observation. Finally, describe how you would conduct the study differently if you decided to give people who work there a survey. What kinds of questions would you ask? How would you get people to fill it out honestly?
•• Identify three different ways you could operationalize each of the following variables: (1) prejudice, (2) high self-esteem, and (3) empathy toward other people.
HOW DO SOCIAL PSYCHOLOGISTS DESIGN STUDIES?
LO 2.2: Compare the logic behind preexperiments, true experiments, quasi-experiments, and correlational designs.
The working world is full of designers. We have fashion designers, graphic designers, architectural designers, cookware designers, landscape designers, and game designers. To become a clear-thinking social psychologist, you must become an experiment designer.
If the most famous book about experimental designs were going for a big audience in the self-help market, then it might be called How to Think Clearly. However, the original book by Donald Campbell and Julian Stanley (1966) had a less dramatic title: Experimental and Quasi-Experimental Designs for Research.
Its original target market was the unruly world of education research. Education research had been (and perhaps still is) like a pendulum clock hanging from a swinging rope, lurching back and forth between “a wave of enthusiasm for experimentation [that] gave way to apathy and rejection” (Campbell & Stanley, 1966, p. 2). Campbell and Stanley wanted to calm things down and remind researchers that experimentation takes time, replications, and multiple methods. They organized the world of research design into four categories that we’ll cover here: preexperimental designs, true experiments, quasi-experiments, and correlational designs.
Preexperimental DesignsThe most basic methodology is called a preexperiment, in which a single group of people is tested to see whether some kind of treatment has an effect.
One type of preexperimental design is the one-shot case study, which explores one event, person, or group in great detail. This design can be either archival (data originally created for some other reason) or a case study examined specifically for research purposes from the outset. For example, interviewing a particular world leader in depth about how he or she made leadership decisions might be a one-shot case study. In a classroom envi-ronment, one teacher who uses a particular new technique—such as playing music in
Preexperiment: A research design in which a single group of people is tested to see whether some kind of treatment has an effect, such as a one-shot case study or a one-group pretest-posttest.
One-shot case study: A type of preexperimental research design that explores an event, person, or group in great detail by identifying a particular case of something or trying a technique once, then observing the outcome.
Social Psychology in Action:Self-Deception Experiment
©SAGE Publications
Copyright ©2019 by SAGE Publications, Inc. This work may not be reproduced or distributed in any form or by any means without express written permission of the publisher.
Do not
copy
, pos
t, or d
istrib
ute

CHAPTER 2 REsEARCH METHods 35
the background of the classroom—and then measures how well the students do on a test is another example. You might try a particular approach to studying one time, and your test score will be the measurement of how well that technique worked.
The one-shot case study, then, involves just two elements: (1) identifying a partic-ular case of something or trying a technique once and (2) an observation or outcome.
Treatment ortechnique
Outcome ismeasured
PretestTreatment or
techniquePosttest
Another type of preexperimental design is the one-group pretest-posttest design, sometimes called a “before-after design.” Here, the expected outcome is measured both before and after the treatment so that the researchers can assess how much change occurred. The one-group pretest-posttest design is represented this way, with an ini-tial observation (pretest), the presentation of the treatment or technique, and a second observation (posttest):
Notice that neither type of preexperiment counts as a true experiment. The major problem with either type of preexperiment is that you can’t be sure that any outcome was really due to the treatment or technique. For example, imagine that a classroom teacher tries a new teaching technique and the students all do very badly. Can the teacher be sure this disappointing outcome was really due to the technique? No, because there are other possible explanations. Maybe the students all would have done badly regardless of how they were taught because the material was particularly difficult. Maybe it was the time of year, or the teacher was badly trained on the technique, or the teacher was sick that week, and so on.
Many studies attempt to establish cause-effect relationships, meaning the researchers want to say, “X caused Y to happen.” Preexperiments can’t make causal claims because of these alternate explanations (bad weather, someone was sick, etc.). Alternate explanations are called confounding variables, which are co-occurring influences that make it impossible to logically determine causality. Fortunately for science, this problem is solved by true experiments.
True ExperimentsThe “gold standard,” or best methodology, for most social psychological studies is an experiment, which compares groups that have been created by the researchers on some important outcome. A well-designed experiment extracts meaningful patterns from a chaotic world. (Pretty amazing, if you stop to think about that one!) The main goal of a true experiment is to be able to make claims about causes and effects. Establishing causality is a rich philosophical question. But to the experiment designer, that means ruling out alternative explanations by controlling confounding variables (the “enemy” of good research).
Imagine you wanted to know whether being sleep-deprived makes people anxious. So, you ask 10 people to take a nap and 10 people to not nap, and then you measure
One-group pretest-posttest design: A type of preexperimental research design in which the expected outcome is measured both before and after the treatment to assess change.
Confounding variables: Co-occurring influences that make it impossible to logically determine causality. Confounding variables, such as bad weather or the inability to concentrate on a survey due to illness, provide alternate explanations for the outcome of an experiment that make it impossible to know whether the results are due to the independent variable (see internal validity).
Experiment: A research design where scientists randomly assign participants to groups and systematically compare changes in behavior. Experiments allow scientists to control confounding variables and establish cause-effect relationships.
Copyright ©2019 by SAGE Publications, Inc. This work may not be reproduced or distributed in any form or by any means without express written permission of the publisher.
Do not
copy
, pos
t, or d
istrib
ute

SOCIAL PSYCHOLOGY36
their anxiety. If the freshly napped group is less anxious, can you be sure their relatively relaxed feelings are due to the nap? How do you know that those 10 people weren’t already more relaxed and happy-go-lucky than the other 10 people?
The best solution to the problem of confounding variables is random assignment to experimental condition, which occurs at the beginning of your study. Each person in the study has an equal chance of being put in the nap or no-nap group based on some determination of chance, such as the flip of a coin. With random assignment, it’s statistically likely that people who came into the study already high or low in anxiety will be equally distributed across the two experimental groups, which in essence makes the groups identical. If this is done, then any differences in the measurement at the end must be due to experimental treatment; it’s the most plausible explanation. Let’s talk about the details of how true experiments work.
Independent and Dependent Variables. All true experiments have two types of variables, called “independent” and “dependent.” Researchers use the independent variable to make the participant groups different from each other at the start of the experiment. For example, researchers might have some people in the study listen to classical music and have others listen to rock music. So, the independent variable is type of music—it’s what makes the groups different from each other from the very beginning of the study.
Of course, we also have to measure some kind of outcome, which is the depen-dent variable. Maybe while our two groups listen to either classical or rock music, everyone reads a passage from a textbook. Then, they take a memory test. If the experiment is trying to establish whether type of music causes better or worse mem-ory, then performance on the memory test at the end is the dependent variable. It’s called the “dependent” variable because we are hypothesizing that memory scores are “dependent” on whether participants heard classical or rock music. Does type of music cause people to do better or worse on a memory test? In experiments, the inde-pendent variable is the cause being tested (here, music) and the dependent variable is the effect or outcome (here, memory test scores).
The “studying while listening to different kinds of music” is a popular exper-iment among new researchers, so we hope that you noticed some other problems. For example, what kind of classical music was it? How well was each type of music performed? Were they played at equal volume? Again, if some of those problems occurred to you, then you are starting to think like a scientist. If any of these other differences by group occurred (such as the rock music was loud and fast but the classi-cal music was soft and slow), then both volume and tempo are confounding variables. Possible criticisms such as these are important in the scientific process, and they are one reason why so many studies need to be done to answer what may have seemed like a simple question at the beginning of the process. Each study helps us refine our hypothesis and begin again.
For several more examples of independent and dependent variables, see Table 2.1.
Types of True Experiment. Just like we saw with preexperiments, there are sev-eral different kinds of true experiment. One type of experimental design is called the pretest-posttest control group design. This is basically a before-after design because the outcome (or dependent variable) is tested both before and after the experimental manipulation or intervention occurs. For example, memory could be measured in all participants—then they listen to either rock or classical music—and then memory is measured again. The researchers can now measure how much each type of music affects change in memory from the pretest to the posttest. The key difference is that in a true
Random assignment to experimental condition: A solution to the problem of confounding variables by creating equivalent groups at the start of an experiment. Random assignment cancels out the influence of confounds by distributing them equally across groups.
Independent variable: A variable that is manipulated at the beginning of an experiment to determine its effect on the dependent variable.
Dependent variable: The measured outcome of an experiment that is affected by the independent variable.
Pretest-posttest control group design: A type of true experiment where the dependent variable is tested both before and after the experimental manipulation.
Copyright ©2019 by SAGE Publications, Inc. This work may not be reproduced or distributed in any form or by any means without express written permission of the publisher.
Do not
copy
, pos
t, or d
istrib
ute

CHAPTER 2 REsEARCH METHods 37
Pretest
Pretest
Group 1 (listento rock music)
Group 2 (listen toclassical music)
Posttest
Posttest
TABLE 2.1 Independent and Dependent Variables in Experiments
Study Basics Independent Variable Dependent Variable
Students listen to either classical or rock music while they study, to see if music affects their memory on a test later.
Musical style (classical or rock) Performance on the memory test
People write an essay about either death or puppies, then rate how much anger they feel.
Essay topic (death or puppies) Level of anger
Children watch a commercial with dolls or with trucks, then are rated on how aggressively they play with clay and crayons.
Commercial topic (dolls or trucks) Level of aggression
Sports fans see images of athletes wearing black jerseys or green jerseys and are asked to rate how well they expect each player to do that year.
Jersey color (black or green) Expectations of players’ performance
experiment, we now have two groups instead of one, and participants have been placed into one group or the other through random assignment. It looks like this:
You need both groups, made equivalent by random assignment, to control for con-founding variables. However, sometimes the different levels of the independent variable are compared to a “neutral” or baseline group. In our example about measuring whether memory scores change after listening to music, imagine that memory scores went up in both conditions. Maybe simply listening to any kind of music helps memory. To test this refined hypothesis, we need another group that doesn’t listen to music at all. A group that serves as a neutral or baseline group that receives no treatment at all is called a control group. That experimental design would look like this:
Pretest
Pretest
Pretest
Group 1 (listento rock music)
Group 2 (listen toclassical music)
Posttest
Posttest
PosttestControl Group
(listen to nomusic)
Finally, you will learn about many studies in this book that are close to the design described here, with one difference: They sometimes skip the pretest phase. When this happens, it’s called a posttest-only control group design. Everything else is the
Control group: A group of participants in a true experiment that serves as a neutral or baseline group that receives no treatment.
Posttest-only control group design: A type of true experiment where the dependent variable is measured for two or more groups, including a control group, only after the experimental manipulation.
Copyright ©2019 by SAGE Publications, Inc. This work may not be reproduced or distributed in any form or by any means without express written permission of the publisher.
Do not
copy
, pos
t, or d
istrib
ute

SOCIAL PSYCHOLOGY38
same—you have two or more groups, including a control group, and you measure out-comes for each group. You just don’t have the pretest, which means you compare how the groups are different from each other in only the posttests. This design is perfectly fine as long as you really did use random assignment to put each participant in the different groups. Again, this should logically mean that the groups started out on equal footing, so it’s okay to measure the influence of the independent variable by simply looking at how the groups differ on the dependent variable (posttest only).
Between-Participants Versus Within-Participants. The different designs described so far are considered by many to be ideal choices for research. However, some-times real studies have challenges. For example, there might be limitations to how many people you can get in your study or how you can create the different conditions of your independent variable. So far when we’ve considered designs with two or more groups, the assumption has been that each group is made up of different people. This approach in general is called a between-participants design, meaning that levels or conditions of the independent variable change between groups of different participants. Maybe 20
people listened to rock music, and 20 different people listened to classical music (and maybe 20 others listened to no music). This would require 60 different people!
However, imagine you are a teacher and you want to test your hypothesis, but there are only 20 students in your entire class. In addition, you need to teach all of them the material, but you have only one set of speakers in your classroom, so everyone will have to listen to the same music. With this kind of limitation, you can con-sider a within-participants design, which means that the same group of participants all experience each exper-imental condition. You put each person in every group, one group at a time.
For example, in Unit 1, the entire class listens to rock music; in Unit 2, the entire class listens to clas-sical music; and in Unit 3, there is no music. Ideally, different people would go through all of the groups in different orders (for example, someone might listen to classical music first, while someone else hears rock first; then they switch), but sometimes this just isn’t possi-ble. Just like we saw with archival research, naturalis-tic observation, and surveys, there are advantages and disadvantages to each different design option within true experiments. Within-participants designs have the advantage of needing fewer people (here, it’s 20 people
compared to 60). But a within-participants design comes with built-in disadvantages. One of them is the possibility of order effects that influence the outcome variable just because one condition of the independent variable happened to come first. Choosing the right design is an important step in the research process.
Quasi-Experimental DesignsAs we’ve already indicated, there are many situations in which true experimental designs are impossible, unethical, or impractical. In addition, sometimes the variables of interest aren’t things that can be randomly assigned. For example, you can’t randomly assign some people
The famous character Quasimodo from Victor Hugo’s (1831) novel The Hunchback of Notre Dame was known for being “half-formed.” Quasi-experiments could be considered “half-formed” versions of true experiments, because they compare groups but are missing the key element of random assignment of people to those groups.
Photo 12 / Alam
y Stock Photo
Copyright ©2019 by SAGE Publications, Inc. This work may not be reproduced or distributed in any form or by any means without express written permission of the publisher.
Do not
copy
, pos
t, or d
istrib
ute

CHAPTER 2 REsEARCH METHods 39
to experience a tornado. In these cases, quasi-experiments can help us reach reasonable but still tentative conclusions. Quasi is the Latin word for “almost” or “partially.” Thus, a quasi- experiment is almost like a true experiment.
Quasi-experiments compare outcomes across different groups, just like true experiments—but the key difference is that the groups have not been formed through random assignment. The groups in quasi-experiments formed on their own, naturally. For example, you may want to compare men to women in terms of who interrupts more. Here, the independent variable you’re testing is sex (men vs. women), and the dependent variable is frequency of interruptions. However, these variables aren’t “true” independent and dependent variables because they were not randomly assigned, and thus the experi-mental setup hasn’t really eliminated any possible confounding variables.
Even if we find that one group interrupts more, we still don’t really know why. Is it because of genetics? Hormones? How boys versus girls are raised? Because we are not able to eliminate all confounding variables, we can’t truly make causal inferences or statements with a quasi-experimental design. But, it’s impossible to randomly assign each participant to sex—you’d find it odd to show up to an experiment only to be told, “Today you’re going to be a woman.”
While participant sex is impossible to randomly assign, other variables may be simply very difficult or unethical to randomly assign. If you want to study the effect of going through a hurricane or being in a terrible car accident, you can’t randomly assign half of your participants to experience these traumas. You might also want to study variables such as religion or choice of career—and again, participants would probably protest if you ran-domly assigned them to either of these important variables. In short, quasi-experiments are needed to study several important variables within social psychology—but we need to be more cautious when interpreting results, especially in regards to any claims about causality.
Correlational DesignsYour head might be spinning with all of the different study designs we’ve gone through so far—preexperiments, true experiments, quasi-experiments—so we’ve saved the most simple design for last.
Correlational designs are relatively easy; they involve simply collecting or measur-ing two pieces of information from each participant in the study, then seeing if there is a pattern. For example, you can ask people (1) how many hours they study each week and (2) what their grade point average (GPA) is. Most people would quickly see the hypoth-esis being tested: More studying is associated with higher grades. (Note: We’ll talk more about how to specifically test for this pattern in the next section.)
Correlational designs thus look for patterns in which two variables have a relationship or association with each other. Height and shoe size are correlated; the general pattern is that taller people have larger feet. Income and size of someone’s house are correlated; richer people usually have bigger houses. It’s sometimes easy to think of correlations as patterns that indicate a causal relationship: Studying for more hours each week causes a student’s GPA to improve, or having more money causes someone to be able to buy a bigger house.
While it is possible that some correlations show causal relationships, in social psy-chology (and in all forms of science), it is very important not to assume that correlations indicate causal relationships. This word of caution is summarized in the popular motto, “Correlation does not imply causation.” Why not? First, it might be the case that both variables are actually caused by a third variable. In the case of a student who spends many hours studying and has a very good GPA, both of these outcomes might have been caused by the student’s (1) motivation to do well, (2) level of pressure from parents, or (3) amount of enjoyment of class subjects.
Between-participants design: An experimental research design where the levels or conditions of the independent variable are different for each group of participants; patterns are found by comparing the responses between groups.
Within-participants design: An experimental research design where the same group of participants all experience each experimental condition; patterns are found by comparing responses for each condition.
Order effects: Variations in participants’ responses due to the order in which materials or conditions are presented to them.
Quasi-experiment: A research design where outcomes are compared across different groups that have not been formed through random assignment but instead occur naturally.
Correlational design: A research design where scientists analyze two or more variables to determine their relationship or association with each other.
Copyright ©2019 by SAGE Publications, Inc. This work may not be reproduced or distributed in any form or by any means without express written permission of the publisher.
Do not
copy
, pos
t, or d
istrib
ute

SOCIAL PSYCHOLOGY40
Consider another example: There is usually a correlation between amount of ice cream sold per year and the number of people who drown that year. Is ice cream con-sumption causing drowning? Probably not. It’s more likely that a third variable explains the correlation: heat. Towns that have hotter temperatures (such as Miami, Florida, and Austin, Texas) sell more ice cream. In addition, more people swim in these towns due to the heat (which unfortunately sometimes leads to more drownings). So, while it might look like the two variables of ice cream and drownings are related, both are actually driven by something else.
It’s also important to realize that with a simple correlation, even if there is a causal relationship between the two variables, we don’t necessarily know which is the cause and which is the effect. Think about the controversial idea that watching violence on TV causes children to act more violently in real life. This hypothesis makes a lot of intuitive sense, and there are studies showing that amount of violence viewed on TV is related to how violent children are.
However, it’s also possible that the causal relationship goes the other way around. Maybe children who are already inclined to have violent personalities and behaviors are more likely to watch violent TV, because they find it interesting. Now, the cause is the violent personality and the effect is watching violence on TV. Simple correlations aren’t
Most people are familiar with the Harry Potter series
of books and movies, in which a young boy discov-
ers he’s a wizard and attends a boarding school to learn
spells. In the sixth book, Harry Potter and the Half-Blood
Prince (Rowling, 2005), Harry first gets the chance to learn
the magical power of “apparition,” or the ability to disap-
pear and reappear in a different location. Harry’s first
apparition lesson is an example of his awareness that
correlation does not imply causation.
Harry describes his apparition teacher’s appearance
and how that appearance might be linked to the ability to
disappear:
He was oddly colorless, with transparent eye-
lashes, wispy hair, and an insubstantial air, as
though a single gust of wind might blow him away.
Harry wondered whether constant disappearances
and reappearances had somehow diminished his
substance, or whether his frail build was ideal for
anyone wishing to vanish. (p. 382)
Harry doesn’t know whether having a wispy appear-
ance caused his teacher to have a greater apparition
ability—or whether his talent at apparition has caused
him to appear wispy. While Harry suspects there’s a cor-
relation or association between the two things, he knows
that without more information, he can’t know which is the
cause and which is the effect. It’s also possible that the
association is merely a coincidence or that both are caused
by something else. Without logical research designs, the
secrets of apparition may remain unknown to Muggles
(nonmagical folks) and wizards alike.
CORRELATION AND CAUSATION IN HARRY POTTER
Social Psychology in Popular Culture
United A
rchives Gm
bH / A
lamy Stock Photo
Copyright ©2019 by SAGE Publications, Inc. This work may not be reproduced or distributed in any form or by any means without express written permission of the publisher.
Do not
copy
, pos
t, or d
istrib
ute

CHAPTER 2 REsEARCH METHods 41
enough to assume anything about causation; we need more precise methodologies, like experiments, to know the details.
It’s fun to be a scientific problem solver, addressing important social issues. But it is much more than that. Research can be a satisfying, meaningful way to spend a life—words you may never thought you would hear in a discussion about research designs.
Cutting-Edge CombinationsClassic studies using naturalistic observation, archival data, surveys, and experiments have now established many foundational theories and concepts in social psychology, and all of these methods continue to provide new insights from research labs around the world. However, social psychology’s research methodology is also able to grow and evolve as technology advances. These advances result in new, cutting-edge procedures, many of which will be described in the rest of this book.
One exciting way that social psychology research is becoming more advanced is by joining forces with neuropsychologists to study how social interactions both influence and are influenced by neurons in the brain. For example, one study (Cyders, Dzemidzic, Eiler, & Kareken, 2016) used functional magnetic resonance imaging (fMRI) brain scans to show that men have more neural reaction to sexual images than to nonsexual images and that degree of neural reaction was positively correlated with the men’s survey responses on how much they engage in high-risk sexual behaviors. Several other exam-ples of how the brain is connected to social psychology are highlighted in later chapters.
Other researchers examine physiological responses during studies, such as blood pressure (e.g., Hill et al., 2017; Huntley & Goodfriend, 2012; Jennings, Pardini, & Matthews, 2017) or the release of stress hormones such as cortisol in blood or saliva (e.g., Simons, Cillessen, & de Weerth, 2017; Tarullo, St. John, & Meyer, 2017) as ways of measuring participants’ biological reactions, in addition to their psychological reactions. One interesting example is pupil dilation, which has been correlated with sexual interest or attraction to other people (see Lick, Cortland, & Johnson, 2016; Savin-Williams, Cash, McCormack, & Rieger, 2017).
Finally, computer software has been specifically designed or updated by researchers in social psychology labs both to create different independent variables and to measure dependent variables; often, this takes the form of video games that participants play in which various aspects of the game are manipulated, and how the participants play and respond serves as the outcome being measured. Again, several examples will be seen in future chapters. As technology advances, our ability to test hypotheses about social psy-chological phenomena will also advance in exciting new ways.
The Main Ideas
• A preexperiment is a method in which a single group of people is tested to see whether some kind of treatment has an effect.
• A true experiment compares outcomes on two or more groups that have been created by the experimenter through random assignment to condition. True experiments are the only methodology that can lead researchers to make claims about cause-effect relationships between variables.
• A quasi-experiment tests for the effect of a treatment in groups that have formed naturally, such as men versus women or people who prefer different kinds of music.
• Correlational designs look for associations between two variables that are measured in a single group. A correlation between two variables does not necessarily mean that one causes the other.
Copyright ©2019 by SAGE Publications, Inc. This work may not be reproduced or distributed in any form or by any means without express written permission of the publisher.
Do not
copy
, pos
t, or d
istrib
ute

SOCIAL PSYCHOLOGY42
CRITICAL THINKING CHALLENGE
•• Earlier, we discussed challenges to naturalistic observation (reactivity) and to surveys (social desirability bias). What are some challenges to experimental research designs? How could scientists overcome these challenges?
•• Imagine that you have a hypothesis that people who drink a lot of caffeine will experience heightened emotions over the course of a day. Explain three different ways you could design a study to test your hypothesis, using three different methods from this section of the chapter.
•• Think of a correlation you’ve observed in the world where it’s hard to tell if the relationship is causal because either of the two variables could be the cause or the effect. Which comes first and affects the other? Then, think of a correlation that appears to show a relationship, but both variables are actually being caused by a third variable that wasn’t directly measured.
HOW DO SOCIAL PSYCHOLOGISTS ANALYZE THEIR RESULTS?
LO 2.3: Summarize the most common ways to analyze and interpret data.
“I don’t like statistics,” one of our students declared before class was starting, and then asked his neighbor, “Do you know if the Pittsburgh Pirates won last night? They’re only two games out of the lead.” He couldn’t see the obvious: He already loves numbers, what they mean, and the stories they tell—but only when they are connected to something that he cares about (in this case, baseball). We hope that in this next section, which reviews some basic types of statistics used in social psychology, you can think about how each one might apply to something that you care about.
People who are serious about understanding social psychology need an understand-ing of statistics, or mathematical analyses that reveal patterns in data. They are import-ant, both on an individual level—the pleasure of thinking analytically is satisfying—and on a larger level. Understanding patterns in data and how to interpret them correctly is absolutely necessary for authentic understanding of how to create government policies, how to design effective education, how to plan for a stable financial future, how to respond to global climate change, and more. Critical, scientific, analytical thinking is needed for social psychology to be able to influence the world for the better.
Comparing GroupsLet’s think through the hypothetical results (in Figure 2.3) about the effects of differ-ent types of music on memory. The horizontal x-axis indicates memory scores; higher memory scores are shown to the right. The vertical y-axis indicates how many people got that score. The average memory score for people listening to classical music is higher than the average for people listening to rock music. These two averages provide the most important statistical information.
But you also may have noticed something else in Figure 2.3. The shape of the memory curve for people listening to rock music is a little flatter and wider. The flat-ter, wider distribution of scores means that there was more variability in the memory scores for people in that group (the highest score was further away from the lowest score, meaning a wider range). The amount of variability in a distribution is called the standard deviation.
Statistics: Mathematical analyses that reveal patterns in data, such as correlations, t tests, and analyses of variance.
Standard deviation: The amount of variability in a distribution. In other words, how widely dispersed the data are.
Copyright ©2019 by SAGE Publications, Inc. This work may not be reproduced or distributed in any form or by any means without express written permission of the publisher.
Do not
copy
, pos
t, or d
istrib
ute
CHAPTER 2 REsEARCH METHods 43
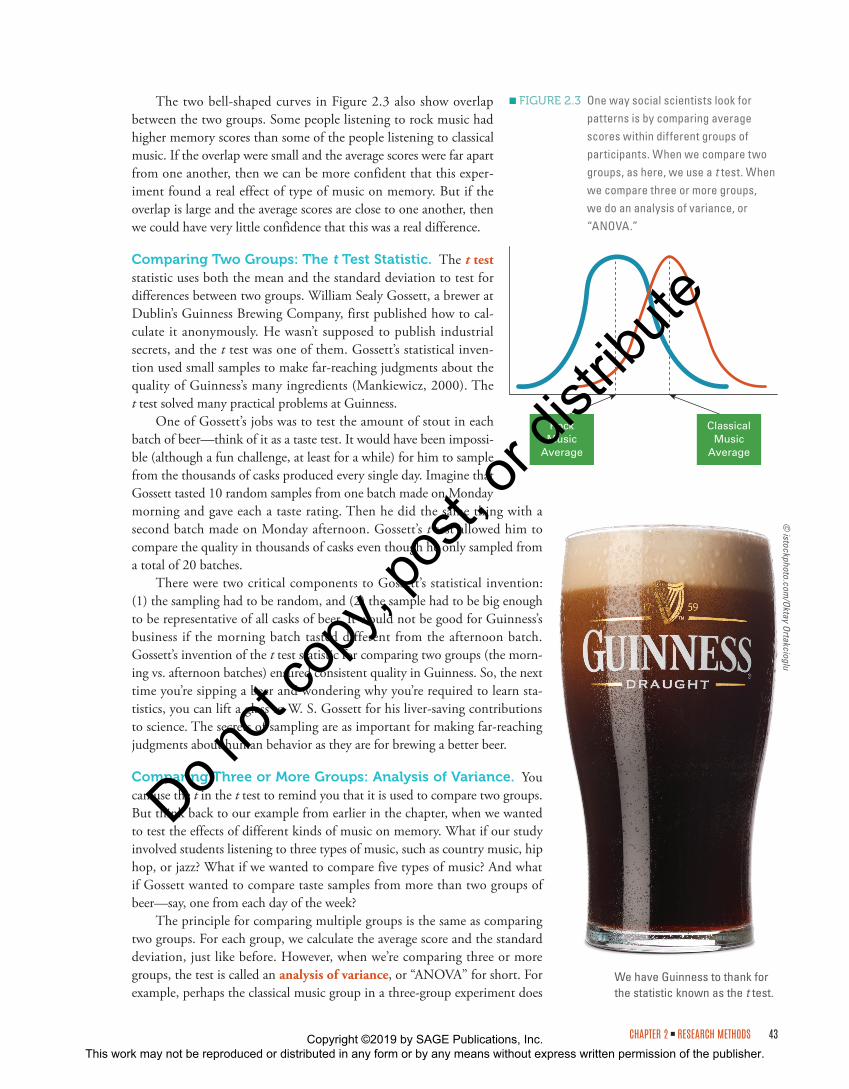
The two bell-shaped curves in Figure 2.3 also show overlap between the two groups. Some people listening to rock music had higher memory scores than some of the people listening to classical music. If the overlap were small and the average scores were far apart from one another, then we can be more confident that this exper-iment found a real effect of type of music on memory. But if the overlap is large and the average scores are close to one another, then we could have very little confidence that this was a real difference.
Comparing Two Groups: The t Test Statistic. The t test statistic uses both the mean and the standard deviation to test for differences between two groups. William Sealy Gossett, a brewer at Dublin’s Guinness Brewing Company, first published how to cal-culate it anonymously. He wasn’t supposed to publish industrial secrets, and the t test was one of them. Gossett’s statistical inven-tion used small samples to make far-reaching judgments about the quality of Guinness’s many ingredients (Mankiewicz, 2000). The t test solved many practical problems at Guinness.
One of Gossett’s jobs was to test the amount of stout in each batch of beer—think of it as a taste test. It would have been impossi-ble (although a fun challenge, at least for a while) for him to sample from the thousands of casks produced every single day. Imagine that Gossett tasted 10 random samples from one batch made on Monday morning and gave each a taste rating. Then he did the same thing with a second batch made on Monday afternoon. Gossett’s t test allowed him to compare the quality in thousands of casks even though he only sampled from a total of 20 batches.
There were two critical components to Gossett’s statistical invention: (1) the sampling had to be random, and (2) the sample had to be big enough to be representative of all casks of beer. It would not be good for Guinness’s business if the morning batch tasted different from the afternoon batch. Gossett’s invention of the t test statistic for comparing two groups (the morn-ing vs. afternoon batches) ensured consistent quality in Guinness. So, the next time you’re sipping a beer and wondering why you’re required to learn sta-tistics, you can lift a glass to W. S. Gossett for his liver-saving contributions to science. The secrets of sampling are as important for making far-reaching judgments about human behavior as they are for brewing a better beer.
Comparing Three or More Groups: Analysis of Variance. You can use the t in the t test to remind you that it is used to compare two groups. But think back to our example from earlier in the chapter, when we wanted to test the effects of different kinds of music on memory. What if our study involved students listening to three types of music, such as country music, hip hop, or jazz? What if we wanted to compare five types of music? And what if Gossett wanted to compare taste samples from more than two groups of beer—say, one from each day of the week?
The principle for comparing multiple groups is the same as comparing two groups. For each group, we calculate the average score and the standard deviation, just like before. However, when we’re comparing three or more groups, the test is called an analysis of variance, or “ANOVA” for short. For example, perhaps the classical music group in a three-group experiment does
FIGURE 2.3 One way social scientists look for patterns is by comparing average scores within different groups of participants. When we compare two groups, as here, we use a t test. When we compare three or more groups, we do an analysis of variance, or “ANOVA.”
ClassicalMusic
Average
RockMusic
Average
We have Guinness to thank for the statistic known as the t test.
© istockphoto.com
/Oktay O
rtakcioglu
Copyright ©2019 by SAGE Publications, Inc. This work may not be reproduced or distributed in any form or by any means without express written permission of the publisher.
Do not
copy
, pos
t, or d
istrib
ute

SOCIAL PSYCHOLOGY44
better than the rock group—and maybe they are both better than the control group with no music at all! ANOVA tests will tell you whether at least one of the groups is dif-ferent from the others. Different types of comparison groups require different statistical tests. However, they all rely on just two basic ingredients: the average and the standard deviation in each group.
Patterns in a Single Group: CorrelationsWhile t tests and ANOVAs compare patterns of results in different groups, correlations look for patterns of results in a single group. Specifically, as explained in the preceding section, correlations test whether two different variables are systematically associated with each other. Think about the following questions that all apply to the life of college students:
•• Does a student’s high school grade point average (GPA) predict his or her college GPA?
•• Does the distance between home and chosen college relate to how much homesickness a typical student feels?
•• Are the number of hours spent studying related to test scores?•• Are students with more individual interactions with professors going to be
more satisfied with their college experience?•• Do hours of sleep in an average week predict levels of stress in that same week?
All of these questions would be tested with correlations. Correlations begin with two variables of interest (for example, hours spent studying and GPA). To test for a pattern, scores on each variable are gathered from as many people as possible and are then charted on a graph called a scatterplot. One variable is on the (horizontal) x-axis, and the other is on the (vertical) y-axis, and each dot on the scatterplot represents one person. Take a look at Figure 2.4 for an example.
The pattern shown in Figure 2.4 indicates that, for most people, more hours studying each week is associated with better grades. As you would expect, as studying increases, so does GPA. Certainly, not everyone will fit the pattern—there might be bril-
liant people who can get a high GPA without studying and people who study for hours and hours and still struggle with grades. But, the general pattern is fairly stable. The line sum-marizes the story told in detail by the scatter-plot.
When a correlation is calculated, the number you get is called a correlation coef-ficient. It will always be a number between −1.00 and +1.00. How can you tell what the coefficient means? It’s basically like a two-part code you can crack to understand what the pattern looks like on a scatterplot. There are two parts to the code: (1) the sign or direction—positive or negative—and (2) the number. Let’s talk about each part.
First, the sign will always be either a pos-itive or a negative (unless the correlation is
FIGURE 2.4 In this scatterplot, each dot represents one person. For each person, study hours per week fall on the x-axis, and GPA falls on the y-axis. By looking at the general pattern, we can determine whether the two variables are correlated.
Study Hours per Week
5
2
2.5
3
3.5
4
GP
A
10 15 20
This person studies about25 hours per week and has a
GPA of about 3.80.
25
t test: A statistical test that uses both the mean and the standard deviation to compare the difference between two groups.
Analysis of variance (ANOVA): A statistical test that uses both the mean and the standard deviation to compare the differences between three or more groups.
Correlation: A type of statistical test that determines whether two or more variables are systematically associated with each other by identifying linear patterns in data.
Scatterplot: A graph that demonstrates the relationship between two quantitative variables by displaying plotted participant responses.
Correlation coefficient: A number that indicates the relationship or association between two quantitative variables. It ranges from –1.00 to +1.00.
Copyright ©2019 by SAGE Publications, Inc. This work may not be reproduced or distributed in any form or by any means without express written permission of the publisher.
Do not
copy
, pos
t, or d
istrib
ute

CHAPTER 2 REsEARCH METHods 45
exactly zero). A positive correlation (between +0.01 and +1.00) indicates that both vari-ables move in the same direction. In other words, if scores or values on one of the variables go up, values on the other variable will also go up. If one goes down, the other will go down. The example in Figure 2.4 shows a positive correlation: As a typical student spends more hours studying each week, grades will go up. Hours and grades are both moving up, in the same direction. Positive correlations are shown in scatterplots when the pattern or summary line moves from the bottom left-hand corner to the upper right-hand corner.
In contrast, a negative correlation (between −0.01 and −1.00) indicates that the variables move in opposite directions. As one variable goes up, the other goes down. Instead of hours spent studying, think about hours spent partying. The more hours a student parties, the lower his or her grade might be: Partying moves up, and grades move down. Negative correlations will be shown in scatterplots with a pattern that goes from the upper left-hand corner to the bottom right-hand corner.
The second part of a correlation coefficient is the number, which will always be between zero and 1 (either positive or negative). The number tells you how clear the pattern is on the scatterplot or how well the different dots (which represent people) fall along the summary line. Basically, this number tells you how much variability there is in the data, or whether some people don’t fit the pattern. In Figure 2.4, for example, you can see that there is one stu-dent who studies an average of about 20 hours per week but only has a GPA of about 2.75. If the dots all fall exactly on the line, meaning the pattern is perfect, the number you get will be 1.00. As the number gets closer to zero, it means the pattern becomes slightly less clear.
Note that coefficients of +1.00 and −1.00 are equally strong—both indicate per-fect patterns—it’s just that in one case, the variables move together (+1.00), and in one case, they move in opposite directions (−1.00). Figure 2.5 shows a summary of how to understand correlations, showing a range of patterns that move from perfect and posi-tive, through no correlation at all, to perfect and negative. A zero correlation coefficient means that the two variables have no relation to each other at all, such as GPA and
FIGURE 2.5 Correlations always range from –1.00 to +1.00. The sign (positive or negative) indicates whether the two variables move in the same direction or in opposite directions. The number (from 0.0 to 1.0) tells you how well each data point fits onto a general pattern. If a correlation is zero, it means there is no pattern or association between the two variables.
Positive correlation: A positive correlation occurs when the correlation coefficient is between +0.01 and +1.00. In this case, as one variable increases, the other also increases.
Negative correlation: A negative correlation occurs when the correlation coefficient is between –0.01 and –1.00. In this case, as one variable increases, the other decreases.
Copyright ©2019 by SAGE Publications, Inc. This work may not be reproduced or distributed in any form or by any means without express written permission of the publisher.
Do not
copy
, pos
t, or d
istrib
ute

SOCIAL PSYCHOLOGY46
someone’s height or love of chocolate. These variables are not associated with each other at all, so the scatterplot looks like a bunch of random dots.
Testing for Statistical Significance: p ValuesSo far, you’ve learned about t tests, ANOVA tests, and correlation tests. All of these statistics look for patterns of data. The last statistical concept is to know what it means—and what it does not mean—when your research results approach statistical significance. In this case, the word significance has nothing at all to do with importance. A finding that is statistically significant might be unimportant, very important, or just a trivial curiosity. Statistical significance only means that a pattern of data identified by any statistical test is strong enough that it probably wouldn’t have happened by chance. If it didn’t happen by chance, then it probably would happen again if you did the study again. So, you can think of statistical significance as the “happen again estimate.”
For example, consider once again the hypothesis that listening to different kinds of music will have an effect on memory. Imagine that the scores on the memory test could range from 0 to 100, and the average scores were 86 for the classical music group versus 85 for the rock music group. Is that difference of 1 point enough for you to be confident that classical music has a better effect on memory than rock music? Probably not.
However, you probably would be more confident if the difference were larger, such as comparing 86 to 46. In addition, it might matter how many people were in the study. If you found a difference between 86 and 46 but you had only a single participant in each group, you probably still wouldn’t be very confident—maybe the person who lis-tened to classical music would have done better anyway, due to confounding variables such as intelligence, interest in the material, and so on. And don’t forget that standard deviation will matter as well.
When a researcher reports that a result is “statistically significant,” that only means that the patterns of data found in t tests, ANOVAs, or correlations seems stable, that it is likely to happen again. To determine whether the results of any statistical test reach the level of “statistical significance,” a final calculation is usually done.
The last calculation is for a p value, which results in a number between zero and 1. The p value number indicates the probability or likelihood that the pattern of data would have been found by random chance, if the pattern doesn’t really exist. The p in p value stands for probability. Let’s go back to our example of music and memory. If music has no effect on memory, then we’d expect the groups we test to be equal in memory scores. The p value tells us how likely it is that the results we actually find would exist if the groups were equal. In other words, it tells us how confident we can be that the groups really are different from each other. We also calculate p values for ANOVAs and correlations, and the logic is the same; the number from the p value tells us whether the pattern would have been found by chance if the groups are the same (for an ANOVA) or if the two variables we’re testing in a correlation have nothing to do with each other.
For several decades, social psychologists (and other scientists) have generally agreed that to be really confident in conclusions based on statistics, we want to say that we’re 95% sure that the patterns we find aren’t the result of random chance. You will also hear the phrase “p < .05” to refer to stable patterns of results. You should know, however, that there are big changes coming to the traditional world of statistics. If you go to graduate school, then you probably will hear much more about “effect sizes,” “confidence inter-vals,” “power analyses,” “replications,” and “Bayesian statistics.” Many undergraduate textbooks on statistics are already teaching these new approaches.
Statistical significance: The likelihood that the results of an experiment are due to the independent variable, not chance (see p value).
p value: A number that indicates the probability or likelihood that a pattern of data would have been found by random chance. Commonly seen as a variation of “p < .05,” which, in this example, means there is a less than 5% probability the patterns are due to chance.
Copyright ©2019 by SAGE Publications, Inc. This work may not be reproduced or distributed in any form or by any means without express written permission of the publisher.
Do not
copy
, pos
t, or d
istrib
ute

CHAPTER 2 REsEARCH METHods 47
The Main Ideas
• Statistics are mathematical analyses that reveal patterns in data. Researchers use t tests to compare two groups and analysis of variance (ANOVA) tests to compare three or more groups. Correlations are used to see whether two variables within a single group have a consistent relationship with each other.
• Correlations can be positive (the variables move in the same direction) or negative (the variables move in opposite directions), and they can range from zero (no association between the variables) to a perfect score of 1.00 (all of the scores match the pattern exactly).
• All three of these statistical tests (t tests, ANOVAs, and correlations) can have their strength tested with a final test that calculates a p value. A statistical test’s p value indicates the probability that the pattern of data found would have happened by random chance, if the pattern isn’t really there. Most social psychologists want a p value of .05 or less, meaning a 5% or lower chance that the pattern occurred due to chance.
CRITICAL THINKING CHALLENGE
•• Scatterplots look for patterns in data within a single group. Experiments look for whether different groups of people have different outcomes. How many people do you think need to be included in either research design before we can be confident that the pattern would probably also apply to other people we haven’t tested? If we chart the study hours and GPAs of five students at your school, do you think it would be representative of every student? What about 20 students or 100? How do we explain people who don’t fit into the “typical” pattern?
•• Most social psychologists have decided that a p value of .05 or less is the cutoff for “statistical significance.” Do you think that a 5% chance of patterns being found by chance is a low enough number? Or, do you think it should be higher—would 10% be good enough for you to feel confident?
HOW CAN RESEARCH BE ANALYZED IN TERMS OF QUALITY?
LO 2.4: Describe reliability, validity, replication, and ethical standards for research in social psychology.
You now know quite a bit about how different studies are designed and even how results are analyzed. Perhaps it is time to start forming and testing your own hypotheses. It may be the best way to figure out how much you can trust the many studies you will read about in this (and every other) psychology textbook. If you were going to assign a grade to each study in this book, what criteria would you use to decide whether a study deserves an A+ or something a bit lower? In this section, we will consider reliability and validity, the importance of replication, and ethical considerations.
Reliability, Validity, and ReplicationImagine this: Your back hurts from lugging around heavy textbooks all day, so you become curious about just how much those suckers weigh. You pile them on top of the scale at your local gym and it gives you a result: 36.8 pounds. No wonder your back
Copyright ©2019 by SAGE Publications, Inc. This work may not be reproduced or distributed in any form or by any means without express written permission of the publisher.
Do not
copy
, pos
t, or d
istrib
ute

SOCIAL PSYCHOLOGY48
hurts! But then your friend tells you that the scale is often off by several pounds, which she knows because she sometimes compares what that scale tells her to the scale at her doctor’s office on the same day. So, you try again, and this time the scale tells you that the exact same pile of books weighs 33.2 pounds. Surprised, you take the books off and put them back on, and now it says 40.6 pounds! Clearly, you can’t trust this scale much because it is unreliable.
This simple example illustrates the first criterion for assessing the quality of a particular research study: reli-ability. Reliability is consistency of measurement, over time or over multiple testing occasions. If you took an intelligence test that said you were smarter than 95% of
people in the world but then tried the same test the following week and it said you’re only smarter than 52% of people in the world, you’d probably be disappointed—and you wouldn’t know what exactly to think about your intelligence. Reliability is import-ant because if measurements are not consistent, researchers won’t feel confident that the tests are particularly useful.
In addition to reliability, scientists also want their studies to be high in validity. Two of the most important types of validity are internal and external validity. Internal validity is the level of confidence you have that the results you got from a study really mean what you think they mean. In other words, internal validity refers to whether pat-terns of data are really due to what you’re testing, as opposed to flaws in how the study was designed. For example, if you tested the hypothesis about how listening to types of music affect memory but you forgot to use random assignment, you might not have eliminated other explanations (confounding variables). Random assignment of partic-ipants to different conditions or levels of your independent variable is one of the best ways to increase the internal validity of a study.
Good studies also want high levels of external validity, which is the extent to which results of any single study could apply to other people or settings. Lack of external validity is one of the most common concerns with single research studies. For example, many of the studies you’ll read about in this book used participants who were college students. That’s great for you in some ways, because it means that you can relate to the people who participated and that the results might apply to you. However, in other ways, it means that the results might be limited in their generalizability, or how much they apply to people “in general.” Some people have even used the acronym WEIRD to refer to this problem by saying that too many studies in psychology have “WEIRD” participants—meaning they are Western, Educated, and from Industrialized, Rich, Democratic cultures.
If a study only tested a hypothesis on college students from schools in the United States, we don’t know if the same results would be found among college students in other countries—or among anyone not in college (children, older people, etc.). The best way to increase generalizability of results—and thus also increase external validity—is to use a technique called random sampling. Random sampling means that instead of asking for volunteers to be in your study, you first identify what your “general” popu-lation of interest is, and then you randomly choose people from that larger group to participate in the study. Statistically, then, you’ll have a good chance of getting a wider variety of people who represent different aspects of the larger group. Consider this each time you think about whether a study has believable results—you can always ask, “Who was in the study? Do they represent everyone, or just one particular type of person?”
Reliability: Consistency of measurement, over time or multiple testing occasions. A study is said to be reliable if similar results are found when the study is repeated.
Internal validity: The level of confidence researchers have that patterns of data are due to what is being tested, as opposed to flaws in how the experiment was designed.
External validity: The extent to which results of any single study could apply to other people or settings (see generalizability).
Generalizability: How much the results of a single study can apply to the general population (see external validity).
Random sampling: A sampling technique used to increase a study’s generalizability and external validity wherein a researcher randomly chooses people to participate from a larger population of interest.
If you use a scale like this one to weigh yourself, how confident are you that the result is correct or that it wouldn’t change if you stepped off and back on?
© istockphoto.com
/Image Source
Copyright ©2019 by SAGE Publications, Inc. This work may not be reproduced or distributed in any form or by any means without express written permission of the publisher.
Do not
copy
, pos
t, or d
istrib
ute

CHAPTER 2 REsEARCH METHods 49
Like all the statistical tools we discussed in the previous section, all of the criteria for a good-quality study (reliability, internal validity, and external validity) can be strength-ened by replication, conducting the same experiment using the same procedures and the same materials. Replication is one of the easiest ways to get started in research, yet some students think that replication is a form of cheating. Replication is not cheat-ing. You can replicate someone else’s study by using their published procedures, scales, methodologies, and analyses. You can even e-mail the researchers and ask them to send you their materials, if needed. If you carefully replicate their study, then you should get pretty close to the same results, right? Replication solves all sorts of problems for psy-chological scientists, because it helps our confidence that our claims are backed up by a reliable pattern of results across different people in different settings.
Ethical ConsiderationsThere’s a certain level of trust that happens when anyone shows up to participate in a psychology study. As researchers, we want to remember that we have a solemn respon-sibility to treat people with respect. Even when we use unobtrusive methodologies like naturalistic observation or archival studies, all people involved in the study of human social behavior should be valued—otherwise, our research would be quite ironic.
Researchers across all the sciences provide ethical and legal guidance about what it means to treat study participants with respect through institutional review boards (IRBs), which are committees of people who consider the ethical implications of any study. Before any of us begin formal research that might affect participants and be pub-lished, we are obliged to submit our methods for review. Your local IRB committee is typically composed of representatives from different departments in a college, university, research institute, or corporation—and sometimes from a combination of such orga-nizations. The committees also often have a lawyer as a member, and sometimes they have a member with no background in research at all, to represent the “average person’s” perspective.
In psychology, the specific guidelines we follow come from both our local IRB committees and from the American Psychological Association (APA), an organization
Ethical violations in the Tuskegee Syphilis Study helped establish the need for IRBs to prevent future violations of trust. Participants in this study of syphilis were not (a) told the purpose of the study, (b) given a chance to leave the study, or (c) treated with penicillin that might have cured them.
Replication: The process of conducting the same experiment using the same procedures and the same materials multiple times to strengthen reliability, internal validity, and external validity.
Institutional review boards (IRBs): Committees of people who consider the ethical implications of any study before giving the researcher approval to begin formal research.
American Psychological Association (APA): A large organization of professional psychologists who provide those in the field with information in the form of scholarly publications, citation style guidelines, and ethical standards for research.
The National A
rchives at Atlanta
Copyright ©2019 by SAGE Publications, Inc. This work may not be reproduced or distributed in any form or by any means without express written permission of the publisher.
Do not
copy
, pos
t, or d
istrib
ute

SOCIAL PSYCHOLOGY50
of professionals in the field who have determined what the ethical standards of research should be. Note that the standards currently in effect from the APA, which are described here for you, were not always in place. Some of the studies you’ll read about in this book were done before APA standards and IRB committees were standard—and thus, some of those studies have been harshly criticized for being harmful to the people who were in them. Protecting and respecting participants should be the highest priority for anyone conducting research. What are the guidelines?
The American Psychological Association lists several “rights” that they say all par-ticipants should have. Again, consider each of these as you read about studies in this book and consider whether you think the study was ethical. In addition, if you have the chance to participate in any studies yourself, it’s important for you to know what your rights are—so that you can stop participating at any point if you are uncomfortable or feel like you don’t want to continue for any reason. Some of the participant rights iden-tified by the APA are as follows:
• Informed Consent: Participants should be told what they will be asked to do and whether there are any potential dangers or risks involved in the study before it begins.
Spotlight on Research Methods
QUESTIONS YOUR INSTITUTIONAL REVIEW BOARD MIGHT ASK
Institutional review boards (IRBs) are committees that
review ethical considerations for any new study; you
need to get IRB approval before you can move forward. To
know more about this process, consider the questions
below; they are the typical types of questions any researcher
will need to answer before starting the research process.
Researchers are required to type their answers and submit
them to the IRB committee for review, along with copies of
any materials such as surveys, videos, and so on.
•• What is the purpose of your study, and what
are the hypotheses?
•• What kinds of participants do you plan to use?
How many? How will you recruit them? Will
they be compensated for their participation
through something like money or extra credit?
•• Are the participants from any kind of legally
protected group, such as children, prisoners,
people with disabilities, and so on?
•• How will you get informed consent?
•• What are the specific questions you will ask or
experimental procedures you will use?
•• Will there be any deception? If so, what is the
justification for that deception?
•• How will debriefing occur?
•• What are the potential harms (physically,
emotionally, or mentally) that participants
might experience, short term or long term?
•• Will you provide any resources if participants
have questions or concerns?
•• Are there any potential benefits participants
might experience as a result of being in your
study?
•• How long will your study take? How will you
ensure that the data collected will remain
confidential and/or anonymous?
•• Do you plan to present your results to
the public, such as through a conference
presentation or publication? If so, will the
participants have access to these results
themselves if they are interested?
Hopefully, you can see that IRB committees take their
jobs very seriously—as they should.
Informed consent: Participants’ right to be told what they will be asked to do and whether there are any potential dangers or risks involved before a study begins.
Copyright ©2019 by SAGE Publications, Inc. This work may not be reproduced or distributed in any form or by any means without express written permission of the publisher.
Do not
copy
, pos
t, or d
istrib
ute

CHAPTER 2 REsEARCH METHods 51
• Deception: Participants should be told the truth about the purpose and nature of the study as much as possible. Deception, or hiding the true nature of the study, is only allowed when it is necessary because knowing the truth would change how the participants responded.
• Right to Withdraw: Participants have the right to stop being in the study at any time, for any reason, or to skip questions on a survey if they are not comfortable answering them.
• Debriefing: After completing the study, all participants should be given additional details about the hypotheses of the study, allowed the opportunity to ask questions, and even see the results if they wish. This debriefing after the study is complete should definitely include an explanation of any deception that was involved (if deception occurred) so that participants have the right to withdraw their data if they are upset about the deception.
If you want to design your own study, you should consider all of these criteria for the quality of good research. In addition, you’ll have to get approval from your school’s IRB committee as well before you begin. To learn more about the IRB approval pro-cess, see the Spotlight on Research Methods feature.
The Main Ideas
• Reliability, validity, and replication are all criteria regarding the quality of any given research study.
• Reliability is consistency of measurement. Internal validity is the extent to which results are interpreted in an accurate way. External validity is the extent to which results could apply to other people or settings. Replication means repeating a pattern of results over and over, with different people and in different settings.
• Internal validity is increased when participants are randomly assigned to experimental conditions. External validity is increased when participants are selected from a larger population of interest through random sampling, which means the results are more likely to be generalizable.
• Ethical considerations are also very important when evaluating research studies. The American Psychological Association lists several participant rights, such as informed consent and debriefing. In addition, any study must be approved by an IRB before it can be conducted.
CRITICAL THINKING CHALLENGE
•• Imagine a study was done in 1930, before the APA enacted ethical guidelines and before IRB committees were common. If that study were unethical but highly interesting in terms of the results, should textbooks still talk about the study and what we learned from it? Does continuing to talk about the study disrespect the participants, or does learning from it mean that at least we are attempting to get some good from the bad that already occurred?
•• Different IRB committees have different levels of strictness regarding ethical thresholds. For example, one committee might be fine with a study that causes participants to temporarily be angry, sad, or aggressive—while another committee might consider the same study unethical. If you were to serve on an IRB committee, how would you decide what the threshold of danger or harm should be? What’s the balance between possible risk of harm versus what could be learned from the study?
Deception: Hiding the true nature of an experiment from a participant to prevent a change in how the participant would respond.
Right to withdraw: The right participants have to stop being in a study at any time, for any reason, or to skip questions on a survey if they are not comfortable answering them.
Debriefing: Additional details given to participants after participation in an experiment, including information about the hypotheses, an opportunity to ask questions, an opportunity to see the results, and an explanation of any deception.
Copyright ©2019 by SAGE Publications, Inc. This work may not be reproduced or distributed in any form or by any means without express written permission of the publisher.
Do not
copy
, pos
t, or d
istrib
ute

SOCIAL PSYCHOLOGY52
CHAPTER SUMMARY
What are the elements of the scientific method?
Basic researchers advance theories, while applied researchers translate those theories into real-world settings or people. Both types of researchers use the scientific method, a systematic way of creat-ing knowledge by (1) observing patterns of behavior, (2) generating a hypothesis, (3) scientifically testing that hypothesis, and (4) inter-preting the results to form new, more refined hypotheses. In this way, the scientific method is a circular, never-ending process. Most psy-chological hypotheses include constructs, which are abstract ideas or concepts. One important step in research is operationalization of variables, in which researchers explicitly define those constructs and decide how to measure them.
There are four common types of research in social psychology. The first is archival research, when data are analyzed that were orig-inally created or gathered for a different purpose (such as newspa-pers or police records). The second is naturalistic observation, which is carefully watching people behave in their natural environments. A common problem with this method is reactivity, which occurs when the people being observed change their behavior because they are being watched. One specific technique within naturalistic observation is called “participant observation” and occurs when researchers pre-tend to be part of the natural environment they are observing. A third common method is surveys that include self-report scales, in which participants are explicitly asked to report their thoughts, emotions, and behaviors. While surveys have several advantages, one concern is the social desirability bias, which is when participants answer questions dishonestly to make themselves look better. The fourth type of research is an experimental design, which is described in the next section.
For all of these types of research, a study might have multiple participants or even a single participant. When a study only exam-ines one person or event, it’s called a case study. Simple archival data show that the number of case studies being reported in psychology is increasing over time.
How do social psychologists design studies?
In addition to archival data, naturalistic observation, and surveys, researchers can design studies based on experimental or correla-tional procedures. There are several types of experimental design. Preexperiments test for the effects of a treatment or technique with a single group of people. This can be done with pretests and posttests or with only posttests.
True experiments have more than one group of people who expe-rience different conditions. The different conditions are levels of the independent variable (such as some people who listen to classical music while others listen to rock music). The outcome being mea-sured at the end of the study is called the dependent variable (such as scores on a memory test). Ideally, people have been put into differ-ent experimental conditions based on random assignment, meaning everyone has an equal chance of being put in any of the conditions. Random assignment eliminates confounding variables (other explana-tions for the results). Sometimes control groups are included, which is a baseline or neutral group that receives no treatment at all (for exam-ple, a group that listens to no music). When experiments have different people in each condition, it’s called a between-participants design.
When the same people go through all of the different conditions, it’s called a within-participants design.
Quasi-experiments also compare groups, but the groups are not formed by random assignment. Instead, they are formed naturally. Examples are men versus women, or people who already prefer clas-sical music to rock music. Finally, correlational designs simply mea-sure two variables and then test to see if they seem to have a pattern of association (such as when one goes up, the other also goes up). Height and shoe size are correlated; taller people tend to have bigger feet. Again, it’s important to remember that just because two variables are correlated, it doesn’t mean that one causes the other.
How do social psychologists analyze and interpret research results?
To analyze the results of any study, researchers use statistics, which are mathematical tests that reveal patterns. When two groups are being compared, a t test will compare the groups’ averages and stan-dard deviations to see if they appear different from each other. The same logic is used when comparing three or more groups, but that test is called an analysis of variance (or ANOVA for short).
Correlations are the statistic used to detect patterns within a single group of people but between two variables of interest. For example, a correlation test could tell you if there’s a reliable pattern between hours spent studying each week and performance in school. Positive correla-tions mean the two variables move in the same direction, while negative correlations mean that the two variables move in opposite directions. Correlations also have a coefficient (or number) between zero and 1.00 (either +1.00 or −1.00). A number closer to 1 means a stronger or more reliable association between the two variables. A number closer to zero means that the two variables are weakly associated.
For any of these tests, a p value can tell researchers the prob-ability that the pattern detected in the results would have happened by random chance if the association isn’t really there. The p in p value stands for probability, and researchers want it to be as close to zero as possible, meaning the pattern they found wasn’t due to chance. Most researchers have agreed that to claim that a pattern of results is “statis-tically significant,” the p value should be between zero and .05, meaning a less than 5% chance of finding the pattern due to chance or luck.
How can research be analyzed in terms of quality?
Reliability, validity, and replication are all important things to consider when trying to evaluate the quality of a research study. Reliability is whether the measures used are consistent. There are several forms of validity, including internal and external validity. Internal validity is the extent to which results are interpreted in an accurate way. For example, causal claims should only be made after true experiments and even then should only be made if people were randomly assigned to the different experimental conditions. External validity is the extent to which results could apply to other people or settings. If a certain pattern of results can only be found within a specific group of people, then the results have low generalizability (they are not true in general for the larger group of interest). The best way to increase generaliz-ability (and thus external validity) is to choose participants randomly from the larger group of interest; this technique is called random sam-pling. Random sampling will hopefully result in a diverse variety of
Copyright ©2019 by SAGE Publications, Inc. This work may not be reproduced or distributed in any form or by any means without express written permission of the publisher.
Do not
copy
, pos
t, or d
istrib
ute

CHAPTER 2 REsEARCH METHods 53
different kinds of people in the study. Finally, we can only be confident with results if they are replicated (or repeatedly found) across several studies with different people and different settings.
It is also essential to consider the ethical implications of any study. The American Psychological Association has published a list of participant rights that should apply to any psychological study. In addition, local organizations such as universities will have an insti-tutional review board (IRB), a committee that reviews the ethics of
any study before it is carried out. Examples of ethical practices are that participants should have informed consent (be told the nature of the study in advance), have the ability to quit the study or skip parts that make them uncomfortable, and that deception (or deceiving the participants) should only be done when necessary. Finally, a debrief-ing session should occur at the end, which is when participants are given more details about the study and are given the opportunity to ask questions or express concerns.
CRITICAL THINKING, ANALYSIS, AND APPLICATION
• Which of the research methods described in this chapter seem the most appealing to you? Why is that method appealing, and what issues or concerns do you have with the other methods?
• Find a news report that makes a claim that one variable causes another (for example, “Drug X leads to bad behavior,” or “Access to birth control leads to risky sex,” etc.). Is the causal relationship being suggested one that seems valid? Why or why not? How could this causal claim be scientifically tested?
• How many times does a study have to be replicated in order for researchers—or the general public—to be confident in the results? Even if a study is never replicated, does that mean that
the data are useless? What other explanations could there be for results that seem to change (in other words, aren’t replicated)? Is it possible that researchers simply haven’t identified the exact rea-son why the pattern happened the first time, for example?
• Ideally, studies have generalizable samples of people who par-ticipate. But what if you want to generalize your findings to all of humanity? It’s clearly impossible to use random sampling across everyone in the world, so most people just use participants who are nearby volunteers. What’s the balance between convenience for the researcher and the need for a diverse, generalizable sam-ple of participants? Are any studies truly high in external validity if they don’t have true random sampling?
PERSONAL REFLECTION
Here’s the great and terrible thing about thinking like a scientist: It’s psychologically addicting. The track behind my house is a weird shape because it circles both the baseball field and the football field. Do runners perform better on this strange-shaped site? I could answer that question with the tools we described in this chapter. But I won’t because I don’t have time; there are other, even more inviting ques-tions that we can answer. Although it is perfectly safe, the runway for the long jump at another high school in our region is situated so that athletes feel as if they are almost jumping off a cliff. Apparently, my daughter was not alone in jumping her personal best at that site—by
almost 16 inches! But I don’t have the time for that one either. Right now, I want to know whether the principles that make a well-designed game psychologically addictive can help at-risk students complete college. We’re getting answers to that question, too, but every sin-gle answer prompts more questions. Research is fun, frustrating, and addictive—you always want more—and more leads to wanting even more. But it’s not just a healthy addiction—the scientific method is the engine of innovation across all the sciences. Social psychology, public health, medicine . . . we all are making slow, steady progress by using the scientific method. [TH]
Visit edge.sagepub.com/heinzen to help you accomplish your coursework goals in an easy-to-use learning environment.
• Visual Key Concepts
• Mobile-friendly eFlashcards
• Mobile-friendly practice quizzes
• Video and multimedia content
• EXCLUSIVE! Access to full-text SAGE journal articles
Copyright ©2019 by SAGE Publications, Inc. This work may not be reproduced or distributed in any form or by any means without express written permission of the publisher.
Do not
copy
, pos
t, or d
istrib
ute

Describe how the scientific method creates knowledge.
Compare the logic behind preexperiments, true experiments, quasi-experiments, and correlational designs.
LO2.1 LO2.2
accept, reject, or refine your
hypothesis
analyze the data and draw
conclusions
test yourhypothesis via
experimentation
form a hypothesis
ask aquestion
? do backgroundresearch
vs.
applied researchers 27
basic researchers 27 preexperiment 34
confounding variables 35
one-group pretest-posttest design 35
one-shot case study 34
scientific method 27
experiment 35
independent variable 36
dependent variable 36
control group 37
posttest-only control group design 37
between-participants design 39
within-participants design 39
quasi-experiment 39
order effects 39
correlational design 39
pretest-posttest control group design 36
random assignment to experimental condition 36
PsycINFO database 33
case study 32
social desirability bias 31
self-report scale 31
survey 31
participant observation 30
reactivity 30
naturalistic observation 30
archival data 30
operationalize 29
constructs 29
hypothesis 28
?
casual/independent
variabletype of liquid
dependent variable
heightcontrolledvariablessize of pot, type of soil, amount of liquid etc.
Copyright ©2019 by SAGE Publications, Inc. This work may not be reproduced or distributed in any form or by any means without express written permission of the publisher.
Do not
copy
, pos
t, or d
istrib
ute

Summarize the most common ways to analyze and interpret data.
LO2.3Describe reliability, validity, replication, and ethical standards for research in social psychology.
LO2.4
grades
am
ount
of
studyi
ng
lowlow high
high
grades
am
ount
of
tv w
atc
hin
g
lowlow high
high
statistics 42 reliability 48
internal validity 48
institutional review boards (IRBs) 49
external validity 48
American Psychological Association (APA) 49
generalizability 48
deception 51
random sampling 48
right to withdraw 51
replication 49
informed consent 50
debriefing 51
standard deviation 42
t test 44
analysis of variance (ANOVA) 44
correlation 44
scatterplot 44
correlation coefficient 44
positive correlation 45
negative correlation 45
statistical significance 46
p value 46
Get a tour of ALL Visual Key Concepts and their definitions at edge.sagepub.com/heinzen
reliablevalid
preciseaccurate
reliablenot validprecise
not accurate
not reliablevalid
not preciseaccurate
not reliablenot valid
not precisenot accurate
missesbullseye
missesbullseye
occasionallyhits bullseye
hitsbullseye
Copyright ©2019 by SAGE Publications, Inc. This work may not be reproduced or distributed in any form or by any means without express written permission of the publisher.
Do not
copy
, pos
t, or d
istrib
ute