distributed by: service u. s. department of … · ad-a023 606 a seakeeping comparison between...
TRANSCRIPT

AD-A023 606
A SEAKEEPING COMPARISON BETWEEN THREE MONOHULLS,TWO SWATHS, AND A COLUMN-STABILIZED CATAMARANDESIGNED FOR THE SAME MISSION
David W. Taylor Naval ShipResearch and Development CenterBethesda, Maryland
July 1975
DISTRIBUTED BY:
NaWOnal Technical isnutfi ServiceU. S. DEPARTMENT OF COMMERCE
Reproduced From
Best Available Copy

KEEP UP TO DATEBetween the time you ordered this report- search activities. And you'll get this impor-
which is only one of the hundreds of thou- tant information within two weeks of the timesands in the NTIS information collection avail- it's released by originating agencies.able to you--and thf! time you are readingthis message. several new reports relevant to WGA newsletters are computer producedyour interests probably have entered the col- and electronically photocomposed to slashlection. the time gap between the release of a report
and its availability. You can learn aboutSubscribe to the Weekly Govewnmeot technical innovations immediately-and use
Abtracts series that will bring you sum- them in the most meaningful and productivemaries of new reports as soon as they are ways possible for your organizatior. Pleasereceived by NTIS from the originators of the request NTIS-PR-205!PCW for more infor-research. The WGA's are an NTIS weekly mation.newsletter service covering the most recentresearch findings in 25 areas of industrial. The weekly newsletter series will keep youtechnological, and sociological interest- current. But learn what you have missed ininvaluable information for executives and the past by ordering a computer NTlSewchprofessionals who must keep up to date. of all the research i-eports in your area of
interest, dating as far back as 1964. if youThe executive arid professional informa- wish. Please request NTIS-PR-186/PCN for
tion service provided by NTIS in the Weeldy more information.Govewnmntn Abstracts newsletters will give WRITE: Managing Editoryou thorough and comprehensive coverage 5285 Port Royal Roadof government-conducted or sponsored re- Srngfield, VA 22161
Keep Up To Date With SRIMSRIM (Selected Research in Microfich'-,) microfiched report. Your SRIM service beginsprovides you with regular, automatic distri- as soon as your order is received and proc-bution of the complete texts of NTIS research essed and you will receive biweekly ship-reports only in the subject areas you select. ments thereafter. !f you wish, your serviceSRIM covers almost all Government re- will be backdated to furnish you microfichesearch reports by subject area and/or the of reports issued earlier.originating Federal or local governmentagency. You may subscribe by any category Because of contractual arrangements withor subcategory of our WGA (Weeldy Govern- several Special Technology Groups, not all"110t Abstracts) or Government Reports NTIS reports are distributed in the SRIMAnnoncements OWand Index categories, or to program. You will receive a notice in yourthe reports issued by a particular agency microfiche shipments identifying the excep-such as the Department of Defense, Federal tionally priced reports not available throughEnergy Admiliistration, or Environmental SRIM.Protection Agency. Other options that willgive you greater selectivity are available on A deposit account with NTIS is requiredrequest. before this service can be initiated. If you
have specific questions concerning this serv-The cost of SRIM service is only 450 ice, please call (703) 451-1558, or write NTIS,
domestic (60t foreign) for each complete attention SRIM Proouct Manager.
This information product distributed by
W 5 U.S. DEPARTMENT OF COMMERCENational Technical Information Service5285 Port Royal RoadSpringfield, Virginia 22161
S' NAMVAL SNIP RESEARCH AND DEVELOPNIENT CENTER •
20O0C113
A SEAKEEPING COMPARISON BETWEEN THREE MONOHULLS.TWO SWATHS, AND A COLUMN-STABILIZED CATAMARAN
DESIGNED FOR THE SAME MISSION
o by
I A. E. Beit4 W. G. Myms L_) ..
5 • D. A. Woolam-
"C.M. Lee ';.,K~~APR 26 I
=u LJ ' U '..3-L UI"z APPROVED FOR PUMLIC RELEASE: DISTRISUTlON UNLIMITED
z 44
z u
IISHIP PERFORMANCE DEPARTMENTRESEARCH AND DEVELOPMENT REPORT
U Ju SPAT1tAL TEO*DC2.S INFORMATION SSIVI'
Ui. S OFehEJ cýmE~g Jily 1975 Report PD4322-01

The Naval ShIP ROW00fe44 Wnd !eve,'&pent Cata:er is a U. S. Navy center for laboratory'P9ftf" directed at aChievuag imPlrled 9*..m air w*111~cI*6 It was tonsed to March 1967 by00caf te David Taylor Model Basin at Cardwrocit. Maryland with th Idenorw Emoumt- C1Lebbotfty at Aminspolit MarrJmm&
Nav'al SkIP Research and Developim~it Ceatw
7 ~Bed".Ids Md. 20W&4
MAJOR NSRDC ORGANIZATIONAL COMPONENTS
NSRDC
CIDMMANDER00*REPORT ORIGINATOR j EC,#ICAL, DIRECTOR
OFFICER.IN.OIARGE OFFICER.IN-04ARGE
03VEOC ANNAPOLIS
SYSTEMISDEVELOPMENTDEPARTMENT
ISMIP PERFORMANCE AVIATION ANI)DEPARTMENT SURFACE EFFECTS
13 DEPARTMENT 1
DEPARTMEN4T ANDS.:TRUMEATICNI,, DEPARTMENT 1
E. &~
SHIPN~t ACOUSTICS PROPLSIO ANDAUXILIAR SYSTEMS

A--Ao' 3606LINCLAUIIFIED
CICuffi?" CLASSOVtCATIOrn Of! TaIS PAGF IUbew Doe 4m*SAD INSTW~CTIONS
D EOT 18=51f UF GOVT AcCesSMI00 "a I MnECIPITw'S CATALOG uUUOE30
SPD -622 - 01I 4 T?ILC (god .aee) S TY- Of REPORT a PEMOO COVERED
A SLAKEEPING COMPARISON BETWE~EN THREE FinalMONOKULLS. TWO SWATHS. AND A COLUMN-STABILIZED CATAMARAN DES1CaNFD FOR THlE a .wmoroxamo DOG. 41P05T ou"96
T. AT"Otfo 8, out006565 domi~rt %LOJEC? ?*S
9L Pt*PffR@O1G OGANIZATION NAME AND AOONESS 10 A PROGRMCLAE1T Urn'?T TASK
Naval Ship Research arnd Development Center ProtAc 450 SOUNT N" GI
Ship Performance Departnent Code 1 568 wPrx Unit 450 h 4
Bethesda. Md. 20084 Wr ni11--8
It COWSOL.LING OFFICE "AMC £50 ADDRESS 12 MEftOom DATE
Naval Ship Rzwarch and Development Center J LII' 19";Systems Development Department Code 1 17 13 NUMSROFN 0WAGES
Bethsda.Md. 00846614 "olU00114orau AGErNCV NAME 6 AOOQCSS(# wibt f ftM Coft11Mt Offl., IS SEC UPPtY CLASS. (fMe* raa OWe
UNCLASSIFIED
-1. DSgTRIOaTO SAEuEW? Tc ro e Repor)
APPROVED FOR PUBLIC RELEASE: DISTRIBUTION UNLIMITFI)
10 -SUPPLcmanrARY NOTES
it. 9EY CyORD$ (Coakt an teo~ Odd It e...owy a i- UfUý IF' W.h wo* mbor)
Monohull and SWATH Seakeeping PerformanceCriteria for Seakeeping Performance ComparisonsSea Representation
Ship A represents the currently employed torpedo retriever boat, and Ship.- B and Crepresent larger versions of A with expanded capabilities. Two designs (Ships D and F)irepresent small waterplane vehicles which have the same mission capabilities as B and C.
(See rev--mc .0-
DO ~ ~ / , 43 £0102-105P646V 15 UOOE#INCLASSI Fl EDS~ 100401 I r-' SCCURIY CLAUPISCAYMN OF 11 tWS0442 R= DNO 6=0
UNCLASFIED_..LI.U441 CLASSFICATION OF THIS PAGAVUbM DsW
Block 20 (Continued)
Again. Ships D and E differ primarily in their speed capabilities. The remaining canaxiatcdesign repreomb a vehicle which has two distinct operating characteristics. In wctrtilig owudition. this ship is essentially an oceangoing catamaran and is denoted asShip . Once the working station is reached. this ship floods down and becomes a verysmall waterplane area vehicle. The submerged catamaran hulls are connected to the super-structure by four slender elliptical vertical stru's. In this configuration, the ship isdesignated as Ship G. Based on the weighed characteristics of all _hip candidates intransit as well as in the stationkeeping mode. it was established that Ship E (a 20-knot.small walerplim am twin hull-SWATH-design) is the most suitable for the definedmission of a Navy workboat. This conclusion is based entirely on the seakeeping responsesof the candidate designs without reference to construction or operating costs.
UNCLASSIFIEDS1CURITY CLASUUICATION OPF THIS PAME(MN DOlS ,1m0

TABLE OF CONTENTS
Page
ABSTRACT. ................. ............................. I
ADMINISTRATIVE INFORMATION .. ..................
INTi")DUCTION ............ .......................... . ...
PREDICTION PROCEDURE ........... .. .... . . . . . . . ...OVERVIEW ................ ............................SHIP AND PREDIC[ION PARTICULARS .... ............... .3..SEA REPRESENTATION .............. ......................SEA CONDITIONS IN OPERATING AREA ..............CALCULATION OF ROLL ................ ..................... 10CRITERIA FOR COMPARATIVE PERFORMANCI- ...... ........... I ICALCULATION OF RELATIVE BOW MOTIONS IN TIME OX)MAIN . . 12
PRESENTATION OF RESULTS ............ .................... 13RESPONSES PER UNIT SIGNIFICANT WAVE IfFIGHT ............ ... 14CRITICAL SIGNIFICANT WAVE HEIGHTS FOR SLAMMINGOR DECK WETNESS ................ ........................ 18TIMF DOMAIN RESULTS FOR SLAMMING AND DECK WETNESS . . . IINFLUENCE OF DAMPING DEVICES ON SWATHRESPONSES IN HEAD SEAS ................ .................... 20INFLUENCE OF BILGE KEELS ON SHIP RESPONSESIN BEAM SEAS ............. .......................... 21
CONCLUSIONS AND RECOMMENDATIONS ...... ............... .
ACKNOWLEDGMFNT ................... ........................ 23
APPENDIX A - DEFINITION OF RELATIVE BOW MOTION ..... ........ 24
APPENDIX B - WAVE-EXCITING FORCES AND MOMENTS FOR WORK-BOAT CANDIDATES AND FEA.SIBILITY OF ACTIVEFIN STABILIZERS ...... ..................... ... )
REFERENCES ................ ............................
LIST OF FIGURES
1 - Ship Particulars ........ ..................... .....2 - Comparison of Candidate Ship Types .......... ............... 363 - Computer Fit of Body Plans for Candidate Ship Types ........... ... 374 - Data Channels and Ship Locations for Which Responses
Were Calculated ............. ....................... ... 38
5 - Theoretical Wave Spectra Used to RepresentSea Conditions ................. ........................ 39
iii

Pare
S - Summary of Calculation Conditions ................ 40
7 - Relative Frequencies at Which Individual Wave Systems orCombined Systems Occur .................... 41
8 - Influence of Modal Sea Period on the Significant SingleAmplitude Pitch and Heave of Ship Candidates .... . 42
9 - Influence of Modal Sea Period on the Significant SingleAmplitude Relative Bow Motion and VerticalAccelerations of the Ship Candidates ................ 43
10- Influence of Ship Speed and Modal Sea Period on theSignificant Single Amplitude Relative Bow Motionand Comparable Absolute Vertical Motion of theCandidate Ships . . . . . . . . . . . . . . . . . . . . . . . . 45
II - Influence of Ship Speed and Modal Sea Period on SignificantWave Height Levels Critical for Various Ship Candidates ........... 46
12 - Influence of Ship Speed and Modal Sea Period on thrMission-Interrupting Events ....... .................... ... 48
A.- - Definition of Relative Bow Motion on Ship Centerline ..... ......... 27
A.2 - Summary of Relative Bow Motion Caiculations .... ............ ... 28
B. I - Wa'e-Exciting Forces and Moments for the ShipCandidates .............. ............................ 32
LIST OF TABLES
I - Definition of Sea States .......... ..................... 50
2 - Constant6 for Single-Amplitude Statistics and Equationfor Two-Parameter Bretschneider Specirum ......... ............. 51
3 - Yearly Average Statistics of Four Major Hawaiian Wave Systems . . .. 52
4 - RMS Responses of Ship A. 85-Foot Hardchine Munohull ........... ... 53
5 - RMS Responses of Ship B. ! 5-Knot Monohull ..... ............ ... 54
6 - RMS Responses of Ship C. 20-Knot Monohull .... ............ ... 55
7 - RMS Responses of Ship D. 15-Knot SWATH with and withoutBilge Keels. ........... .......................... .... 56
8 - PMS Responses of Ship E. 20-Knot SWATH ..... ............. ... 58
9 - RMS Responses of Ship F. Column Stabilized Up ...... ........... 59
10 - RMS Responses of Ship G. Column Stabilized Down ... ......... ... 60
11 - Beam Sea RMS Accelerations and Roll of Candidate Ships ......... ... 61
iv
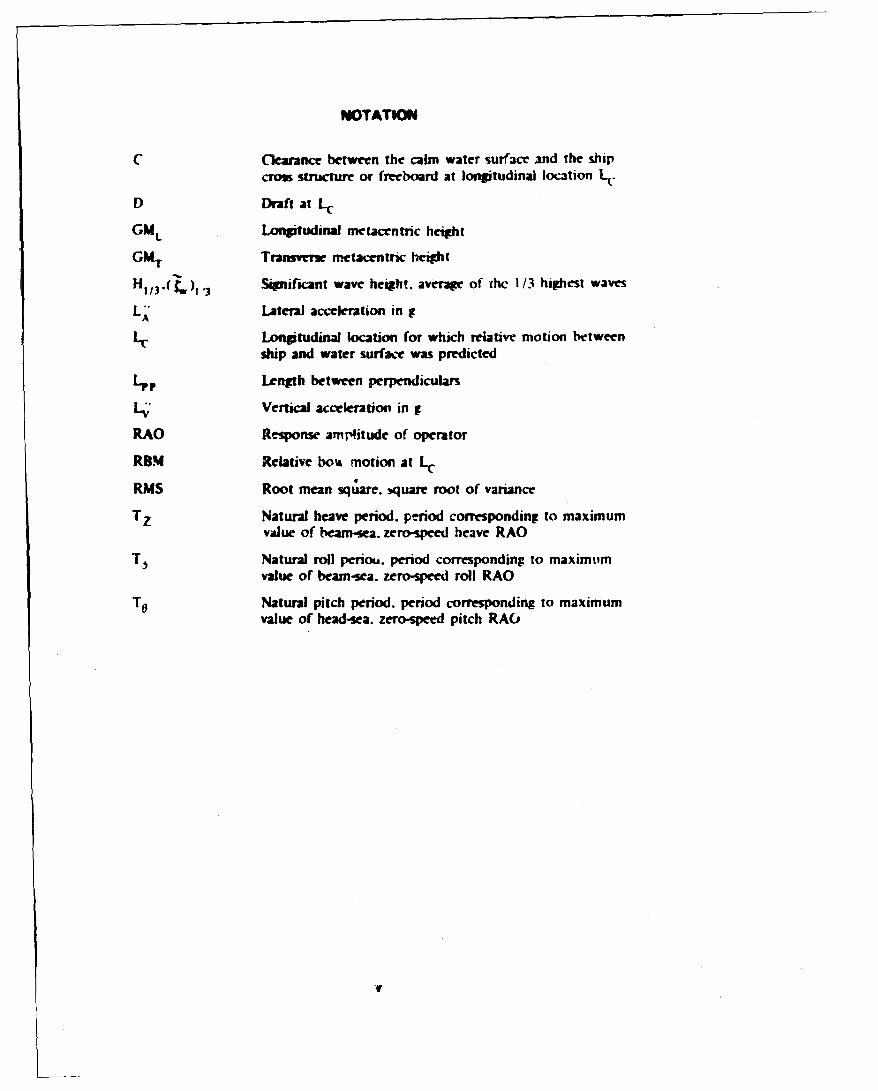
NOTATWON
C Clearance between the calm water surface and the shipcros structure or freeboard at longitudinal location L(.
D Draft at LC
GML Longitudinal metacentric height
GMT Transvene metacentric height
H " Significant wave height., average of (hc 113 highest waves
LA' Lateral acceleration in S
LC Longitudinal location for which relative motion betweenship and water surface was predicted
Length between perpendiculars
Vertical acceleration in g
RAO Response amplitude of operator
RBM Relative boAi motion at Lc
RMS Root mean square. 3quam root of variance
Tz Natural heave period, pe-nod corresponding to maximumvalue of beam-sea. zero-specd heave RAO
TJ Natural roll periou. period corresponding to maximumvalue or beam-sea, zero-speed roll RAO
To Natural pitch period. period corresponding to maximumvalue of head-sea, zero-speed pitch RAO

ABSTRACT
The scakeeping characteristic• of six basically different ship design- *,rerevaluated to determine their comparative effectivences am a U.S. Nav,workbnat. Three of the designs represent conventional monohulls withdifferent szz'. and speed capabilities. Ship A represents the currently employed :or-pexd. ;etriever boat. and Ships B and C represent larger -eruons of A with expandedcapabilities. Two designs (Ships D and E) reTpresent small waterplane vehicleswhich have the same mission capabilities as B and C. Again. Ships D and Fdiffer primarily ir, their peed capabilities. The reimining candidate d-sign.a column-stabilied catamaran, represents a vehicle which has two drtIinctoperating characteristics. In the transiting: condition. thLi ship is esentaall.an oceangoing catamaran and is denoted as Ship F. Once the working stationis reached, this ship floods down and become, a ver. ,unall waterplane areavehicle. The submerged citamaran hulls are connected to the superstnicturvby four slender elliptical vertical struts. In thti configuration. the ship isdesgated as Ship G.
Based on the weighed characteristics of all ship candidates in transt aswel! as in the station-keeping mode. it was established that Ship E la 20-knot.small waterplane area twin hull SWATH dewsgn is the most suitable ship forthe defined missiot, of a Nan workboat. This conclusion is based entirel. onthe weakeeping responses of the candidate designs without reterence to con-struction or operating costN.
ADMINISTRATIVE INFORMATION
This work was conducted at the Naval Ship Research and Development Center iNSRDC)
by Ship Performance Department ('ode I 5hS it the request of NSRDC's Systems Develop-
ment Department. The work reporied herein was funded under Work m'nit I-I 1 70-093.
INTROCOCTION
The U.S. Navy has been employing a small ..-- ,oot hartchinc boat in it-
Hawaiian operations. This boat has been found to be far from ideal as a workboa; in t.s prescnt
role because of its limited size and the associated Weakeeping characteristics. NSRI)C wasreque.tel to p.rform a feasiility design for a workloat that is more suitahlc for
present and projected tasks in the Hawaiian area. The seakeeping analysis undertaken for
this feasibidity design is the subject of the present report.
Ship motions, including accelerations, and the 'Vl2tive ship !o water motions were pre-
dicted in long-crested, irregular seas for a '4:.i of six ships of basically different design.

Five represent competing feahihit, designs for a workhoat to he used hv :h- %,v',
and tht other reprew-•nt the c-\,ting workhsai Since the file com•pe.ilg Iejlh!Jst)
'esamgn all have the %ame mision, motion predictions were made for a ,cn-es of realist•cally
related ships by uilng a vanet. of documented and undocumented %hip mo)tin co(Wmputer
proprms.
"Three aspects of thew. pr-diction pr•cedure% were Somewhat unusual for thli type of
motion investigation. The fir't was the u. (of four distinct wawV Spectra to repr"sent sea
conditions at a specilic sea State or wave height level. The Second was that ship responses
were t.evaluated for ship mission-onented conditions. i.e.. transiting in head %was to the work
site and stationkeeping at the work Site. The third aslect was that their •tTfectivene.s•, was
evaluated bh consadenng how well the various candidates meet s•vpefic ship response
criteria for the two operating conditions.
PRtDiCTION PROCEDURE
OVERVIEW
Four hasic computer programs or groups ol programs were used t, develop ship responses.
Two programs developed the responses in the frequenc' domain, and the other !wo developed
and reduced these responses in the time domain.
The first program developed the response amplitude operators I RAOsI and the second
program calculated the responses of the various ships for a series of four distinct sea ton-
ditions melected from the intended operating area of the workboat. The third program con-verted the results of the firs% program into the time domain, and the fourth program
computed the critical wave heights at which ship performance would he degraded by mission-
interrupting events such as slamming or deck wetness. It is pointed out that the results of
the second prog,,m were used primarily to check the time domain ship responses of the thi-..
computer program.
Three different computer programs were used to calculate the RAOs which charac¢erize
ship responses for particuiar load. speed. and heading conditions. Monohull RAOs were
obtained from the NSRD(C Ship Motion and Sea Load Program.' .2 Both head and beam sea
.. (. At .1.. "'*Ijr',ji .%RIX" Ship M54lmtin And esi L,,al C',mputcr Prmeraim.- NSRDX" kMsp.rt 33761 19," . A l:4'mplele ismtlne ,I rcfctney, 1% I*c•n 'n . ý3.
"Silvew .i. N t. ei al.. -Ship '4,,tin' .and Se.a 1.,adl." SN.AMi Tra +. Vill. 7X. pp. 250.-2117, (I•7ii.
RAOs were obtained for the monohulls from this program. RAOs from SWATH and column-
stabiized catamarans in head seas were obtained from an undocumentcd, modified version of
the Frank Close-Fit Ship Motion Computer Program. 3 '4 In turn, the beam sea PAOs for
these ships were calculated by using an undocumented computer program as %.%ell as roll
damping coefficients measured during SWATH model experiments.
The RAOs calculated by the vanous programs were converted to a single consistent
coordinate system prior to their use as input to the third or time domain conversion pro-
gram. The time domain conversion was performed by using the procedures of •everal investi-
eators.
The relative bow motions calculated in the fourth program were develo,-ed according to
the procedure given in Appendix A. Simple level crossing techniques were employed to
establish the number of critical events (slamming. deck wetness 3r cross-structure impacts)
that mould interrupt ship mission during 30 minutes of operation in the selected seaw!'ys. It
should be noted that all ships were subjected to exactly the same seaway time history at i
particular modal wave penod and speed condition. Thus the responses of the individual
candidate vehicles are directly comparable at the various conditions.
SHIP AND PREDICTION PARTICULARS
Figure I presents the particulars of the seven configurations for which response pre-
dictions were made. Ship A. a small 85-foot hardchine bout. was included because it
repres•uils a workboat whowe response characteristics as a Navy workboat are
already known. The objectionable characteristics of this boat when transiting, to the work
site Islammin,'. wetness) as well as during stationkeeping at the site (excessive roll) thus
represent response levels against which the new workboat candidatce, can be compared.
Both the cross sections of the candidate boats at a longitudinal location LC and the
location of LC on the calm-water waterplane area are shown in Figure 1. L. was the
3 1.rank. W'. and N. Saive-,n. -The Frank (C'h,-Fit Ship-Motion Computer Pr,'gram.' NSRI)C Report 3289 11970).4 Jones. ll.D.. "Catamaran Motion Prediction in Regular Waves." NSRDC Report 370(1 11972).
-Zarnick. F.t- and ).A. Diskin. 'Modeling Techniques for the |valualion of Anti-Roll Tank Devices." Third Ship Cont:r.Symlosumn. Rtath. Fn-J;,nd iSep 19721.
6 Withringion. J.K_ "'Aiuiytical Methods toy Verifying the Structural Intgrity of LNG Carriers." Third IntcrnationalConference on Liqufi'd Natural Gas. Washington. D.C. iSep 1972).
7 Utis. A.E. et al.. "I.NG Cargo Tanks: A Ship Motions Analysis of Internal Dynamic Loading.." GASTECH 74.International LNG and LP; Congrem%. Amsterdam (Nov 1974).
3
~~d()O., a! vi*!o~ mztitiimw btvtuen tlie hir and the water were computed for all
4Aap'b in !,,&J ak P~ltc I~~ ~'m Iht% chac of Ioia ..i are discussed later. Both Suz atid
arranfenvent of the A-atrrvWyesc aira (4f the :AtvidKlte boat-, irr %heiwi in order to demon-
stt-atC their. %iftnificnt Jtewm.Two ptmnt% should he noted ms this regard. First. the
waterplanc are'as ciewntial rerr-,r,* .% meaire of the static restoring force poten[ta of th.
different -.hi,,~ t.e.. the Iions rvi tfth &wumt-vuon. Thc three nonohiulls (Ships A. B. and C).
f(!! elampkc. rr4.vtwvelY nequur Z -' k~-' xLd :04Q tonrs to inc.rease draft by I inch- On
the othier hand. the ! 5- and i'Onot IMAM*l iSIps D) ad IA rmj-ctirb-ls require onIr '.78(
arid 3. ZO tons to incm-wae the draf, h% I sck+ Me# <vfamwi-tabahJcd ihip requires an in-
creave of ? 906 tons, ;Kr 1;;ch of draft in the %i1aLced 4.~dto Ship Fi cvcn though it has
:ssentially twics.' the displacement of the moncibull with oal" 1 5-knot design s. ,.'e rhwc-
the hulhs of its --nlumn-stabihized catanuaran ame submegedu 154"r G)I. o-h tA 1-.M t are required
to increasc draft by 1 inch. This, of course. is cven leu thao uiht %vn much unmaller Ship A
-ý.noufii t.-l~ast pumping would alleviate thss vcr% lou extra :a~a-itln aracw. The
key point to note is that monohulls air much less 'ensite to pai INW' wcre*, '%an ate
SWATlis Thius.. one of the significant differences between ithewe two *N ei is their YMutmtv~t
it, payload increases.. It i% important to recop.ite :his fundown.tnal in~~ew the psykiad
growth potentials of the two types.
The basic motion beavior in %eaways represents a second ii7.Ajot diflerer.. rtVTWVri the
ship tyvps. The snidi wsterplane ares SWATh- and the colunin-stabidued catamaran IN.th
have 't-rs, large natural motion periods, particularl%- for angular ~J~tp rrsporwis_ The natur-I
penod, shown in tabular form (Figure 1) were obtained fs,.at the rer)--'eed. vamv-wsa. rO
and heave RA~s ind the zero-speed. shcad-sea pitch RA(X, The mqlortamv of the Kmfle
raturJl periods is, that inotion resgP~nss duec to %ra' generated My local 1 d are thus. lovwe
for the SWATils thaii Cot the monolulls or the catamaran (Ship F).
The mnajor ship dimensions and particulars are given in Figures I and 2.Figure 3 wx%
prepared to demonstrate in detail the specific input to the various computer programs that
produced ship . .-on RAGO. Note that these programs cottlider only the below-the-
waterinme hull form. Forwaird sectons &nt hawn on the right-hand side and aft wections% on
the left-hand side of the rigure. The larg ditiefe-ce in the beam and drafts of the various
ship types is clearly demonstrated. %i4onohulls (Shipqt A. B. C) clearly have both the most
4hallow drafts and the largest waterplane areas whereas the SWAT~is (D an! 1.) 2nd Ship FPG
have the deepest drafts and th- preatest beamn a.%4 deck at%..
Ship re-nomeis were calcuhaed for 4wprating conditions which mrpreselit two M-Niric
elements of -ship 'mis~on. namely the in-transit and stationkeepingf operating modes.
Stationkeel' was coui!,Jered to conmst of head and beam vea -esponses at 0 and 5 knot-,
The in-transit operating iu,,e? Waw cain'dered to be represented by head sea re-sponses at
speeds up to the design speeds of the candidat. shipr, i.e.. 1 5 and 10 knots. It should be
noted that Ship G. the ct.4umn-statblired cpumaran in the subwerged condition, has a top
speed of 5 knots and thu. rc• new predicion were mavjc for 0 and 5 knot in head seaL
Figure 4 summarizes the individual repones predicted for the various craft in head and
beam seas. Head sea responses wcre developed fcr esientially four different locations on the
ships and beam sea responwes for only two loeation.-. It was considered that head sea or in-
transit .tPi respones could best be ,epresented by vertical accelerations at three lonititudinal
locations as we.l as by pitch and the relative motion at a critical longitudinal locat.xon L.
(Point 4). Points I and 3 represent the futhest practical forwaid and aft locations at
which ship mssaioc-relat-d work might be required during, the in-tranrit operating mco3c.
Point 2 represents the location of the center of gravity ((X,) at the main deck level.
Beam sea respo s wtelre calculated only to amplify the beae sea stationkceping responses
at 0 and 5 krots. Only roll. lateral, and vertical acceleration at the CCG (Point 1) were cal-
culated in beam seas at 0 knots. Thc vertkai and lteral acceleritins wer- calculated at the
aftmost. outboard location on the decks of the varfas ships, i.e.. Pmnt _' These
accekration predictions were made on the smsumption that Point -' wouid be the furt!Wst aft.
prvctical location at which such mis.K-,m-relaited work as launch and rctnev-J of .uoys coulJ
be made. The transverse distance from the centcrline is tabulatet' as b in Fiurc 1. The
furthest practical forward acceleration responw.% may be assumed to be esusatudly identical
to the Point 2 predictions.
Figuir 5 presents the range of theoretkial i.-avc qpectra used to represent the range of
irieular sea conditions which the workboats are expected to encounter tNinng operation-
Fipure 6 indicates the vzrius ship and .ea conditions for which ship respons pedictionm. are
made. The tea representation .s dem-ibed in peratc; detail in the following sc-tion.
SEA REPRESENTATION
Realistic seas are com,-osAd of a mixture of locally generatcd wind wawe ani -"weil from
distant storms. Swell differs from locally generated wave pvimaii.. in that waves due to
swell are very much loneer and vorewhat more regpular or periodic than short. chopp.b w-•_4-
.enerated waveo The mixture of .ich sceas can result ir wave whose spectra maw aw two
or more distinct modal periods or spectral peaks depending on the differe;.es ia Oie modal
periods of the local ,a and the swell as well as on their characterrtk heim hts Several

idsor have noted- 2 that the variaNlity of rabstc ma spectra cannot be adequately
accounted for by means -- a -a~epa- ueter Pimeuon- kowitz wve q utnun fonnuladn.t
At present. thfe amt two bmc schoots of thouit as to how the w-vurac) and realism
of the ma desmriptim can be improved for purpons of p•,dictn ship iespore. One"'1
favors ste type of idealized spectrUl family and the other""t favors use of a wcihted set
of real. measured spectra. Batis et al.7 ,a demointra,". the equivalence of these two
aqpi for dew Prpur .Simulatou techniques suc as thos recently employed by ahsm et al..* can bre employed
to IenaL any avtxtrazy set of realistic waves. Their recenit sea mnulatbon considered both
swell and wind-driven se toether with their relativ irectlimm ahd their respective character-
sic we" heiqhts. Hcwever. consideration of all posibe combinations ,,,. the mitv.nt weaway
Pwamete wo, d result in an •xuremely LiW data bac. at least as laIp •s that from all
pmenred wave spectra. implfaicon of such a c plet ma model ts c10B.illy
Fortunately. the natching of any parficular realistic wav spect$-.,* wft a edPspectrnm is ot litle imnrtwtnce in ship motion-related dc*p any pmld wave
spectuam is not like, to be •nwountevee by" a ship. 1 oa O we -- fg poanance. however,
to develop sea modees which will accurately di.ue ew mw o( ** ,nspoms that ate likely
to be produ&ld by the almost lIr..-, w of red wae cuI•omn (spectra) a ship may
encounthr. By defmniton. suich : # mocbde dA ponible responses that can occur due
to widely dulTew-nt. reaJ
%WIk JA Tan. SOIC11l -SG$Pi C sd MW1s" SNAME S Pif Sympomum. Web I dtuteOfNewd ANeCm"M, GleN Cow. N.Y. (Oct 1973).
9Idis. AX at a alý. i Accmttiom and Ship Motlom for LNG Cargo Tanks." Tenth Symposium on Naval
Np*mi =mks (J=a 1974).
lOcun W.E.. Nnicado. of Sedrephg Perfomanoc." 17th America Towirg Tank Conference State of the Art
RePort-Senesping (JOwn 174).1 1 Koffmm D, "Amlydl of Mmrd and Calculated Spvcta" International Sympoun on the Dynamics of Marine
Vdddd and Structures in Waves. Univity College. London (Apr 1974).
121H1om, D.. "Enuvouental Condition Repmstateoa, 17th American Towing Tank Conference State of the ArtRelpmt-Seslpimg (Jun 1974).
!3Pkrwa J.W. and L Moskowitt. "A Proposed Spectral Form for Fully Developed Wind Seas Basnd on the SimilarityTheory of S.S. KitaijorddW." J. Geophys. Res.. Vol. 69, No. 24 (1964).
Reported infornmaly by A.E. Baitis et aL., in NSRDC Evaluation Report 5634-H01 (May 1974)
6

Thu range of ihtr resýo-.tm * Obtained here by the usc of a series of two-parameter
waveL •'tera +•lpUrw~.u beoeht and modal period) of the form developed by
Bretu.hnetdr,, Talk I defimes sa conditions in terms of significant wave heights and
prrw-, the .utled modal wa-e periods of seas generated by purely local winds. Thus,
;ie tAe Own ementially the normally accepted definition of sea states in terms of wave
lt as well a the shortest modal period waves associated with a particular wave height. It
is to be noted, of course, that when the addition of swell is considered, longer modal wave
periods may occur as sea and swell mix.
Table 2 presents the statistical constants by which the RMS wave hz:;'t or ship
responses may be related to statistical levels such as the average, the average of the 1/3 highest
amplitudes. etc. It should be noted that this average of the 1/3 highest amplitudes is
generally referred to as the significant response or wave amplitude. Double amplitudes or
wave height statistics are obtained from the RMS values by multiplying the single-amplitude
constants by 2.
In the present investigation, the seas were represented by four different modal wave
period spectra. Modal periods of 6. 8. 10, and 14 seconds were chosen because they
represent the range of sea and s-acwd!1 conditions which typically occur (see Table 3) at the
anticipated work site. Typical characteristics of the seas in this locality, taken from recent
references, are discussed in somewhat more detail in the following section.
Figure 5 illustrates the Bretschneider wave spectra used to represent the range of local
sea conditions. These wave spectra are shown for a I-foot significant wave height. Table
presents the statistical constants as well as the equation for the Bretschneider spectra in
terms of the significant wave heights and modal periods which are related to the various sea
states defined in Table 1.
Two important results come about because of this choice of sea spectral representation.
The first is related to the linearity of the responses and the second to the physical in-
terpretation of the range of responses associated with the four distinct modal periods. Since
ship responses are linear for engineering purposes. responses can then be determined for any
wave height from the results of the unit or 1-foot significant wave height.
The physical interpretation of the range of responses varies somewhat with wave height.
The given modal period wave spectra represent different mixtures of sea and swell at the
various wave height levels. When considered for a significant wave height of 2 feet, the
14lretschneider. C.L. -Wave Variability and Wave Spectra for Wave Generated Gravity Waves." Department of the Army.Corps of Entpnee- Technical Memorandum 118 (1959).
7

4escomd period spectnua, for example, repl• nts a way gntle, local wlugmnssaled s witha minor swell at 8 seconds. For these same conditions but a igniftcant ww height of 4 feet,
both the wlad-.m sted local sea and the 8-second swell increase in sevlty, the letter some-what more than the local ma. As the signilIcant wave height is increased to about A feet, this
spectrun represents a fully developed wind-penerated sea without swell. If the sglafrcantwave height is assin increased to, say, 12 feet, the 8-second spectnun now represents thesteepest, partially developed, hurricane-generated sea commonly found in the open ocean.
Further increases in significant wave height at this modal period tend to produce very rare,steep seas which can occur only in land-locked bays or lakes. 15i 16 Certainly at steepa'neratios (significant wave height/wavelength corresponding to modal wave period) of greater
than 119 or 1/8, the wave spectrum becomes physically unrealizable.
The most important fact to note in the discussion of sea representation is that thisseries of different modal period wave spectra establishes the range of the motion responsesthat can be expected due to the variability of tde was.
SEA CONDITIONS IN OPERATING AREA
Sea conditions in the ocean area (Hawaiian islands) in which the workboat is tooperate were recently analyzed both for short-term and long-term characteristics.k Based
on measured and observed wave data, 15 ,!9 the analysis indicated that seas in the operatingarea can be grouped into four basic sets according to their independent generation mechanisms:
(I) waves generated by northeast trade winds, (2) waves generated by the local Kona storms,(3) swell originating in the North Pacific, and (4) southern swell. The Kona wind waves andthe trade wind waves are mutually exclusive; all other combinations of swell and wind wavesmay or may not occur simultaneously.
For each of the basic wave systems, the analysis"1 preswnts the frequency of occurrence,
the direction from which the waves originated, the avenge yearly significant wave heights,
"lors, NA. at aL. -Wave C-'llmalooy for the Grnt Lakes." Nat. Ovoar Atmoep. AdW. Techlal MemoraMdum N"STDL.40 (FeP: 1971).
%100s J., "Wame CUBW Study Gest Lakes Wd Gulf of St. Lawmm," SHIAME T & R blfllsti 2-17 (1971).
17SL Dssd, M., "The Wrids Cufmts, MWl WNM at tbe Site of the F10o8* CRtY Off WddbI,' UNI,. HewW Repoet 7
(Dec 1974).1 10o1mr, P.S. "CkaUtebdm of Desp Watu Wave in Od@1 Am form Tim Yew." Repot pepmid by Nadi
AdVb LJoNl, CaWforlA, for Board of ComaduOmeu. State of Ham&M "dr Coiotmet 5772 (1964).11oF.P. mad LA. Slmfta. "A Pmalaimy Study of Oý Wsv the d Hawaiia e," AMUv,. HamL • Ewl lint.
GeopyLm. Repoet H 16-69-16 (1969).
8

and the average significant wave periods. The significant wave periods may be regarded as
equivalent to the modal periods of the waves/wave spectra. The results, summarized inTable 3, demonstrate that the modal periods of the local sea conditions range from about 6
to 14 seconds, i.e., the range of periods for which ship motion predictions were made.
It is also of interest to know the relative frequencies at which individual wave systems
or combinations thereof occur. These frequency results were therefore prepared from the
data of Table 3 and are presented as Figure 7 in the form of a Venn diagram. The frequency
of occurrence of individual wave systems is represented by the total area within the circle
labeled by the name of the system. For example, northeast trade wind seas are represented
by a circle (75.3 percent) composed of four distinct areas of wave system combinations. In
turn, each area represents a different combination of wave systems. For example, northeast
trade wind seas and calm seas occur together only 9.2 percent of the time, northeast trade
wind seas and southern swell occur together only 10.4 percent of the time, the combination
of these two with North Pacific swell occurs 29.5 percent of the time, and the combination of
northeast trade wind seas and North Pacific swell occur 26.2 percent of the time.
Several important points are demonstrated by these frequency results:
I. The scarcity of single direction or single wave system seas, i.e., pure* wind-generated seas
(9:2 + 1.3 = 10.5 percent) and pure swell seas (5.0 + 2.0 = 7.0 percent).
2. The scarcity (5.7 percent) of pure** multidirectional swell in the absence of wind waves.
3. The large percentage (29.5 + 4.0 = 33.5 percent) of wind seas and two-component
swell seas of nearly the same period, i.e., about 13 to 14 seconds.
4. The predominance of a mixture of sea and swell (75.1 percent).
This fourth point emphasizes the importance of using a sea representation model of the type
selected here for an analysis of comparative seakeeping capability.
Thus the occurrence of pure wind-generated seas is expected to affect the response of
monohulls. especially the small one, more severely than the other ship types. Conversely. the
occurrence of pure swell seas consisting of either a single swell or two different swells of
nearly equal periods is expected to be of greater importance for the seakeeping of the
SWATH ships and the column-stabilized catamaran than for the monohulls.
Some comments on the relative importance of various combinations of wave systems
are relevant here. St. Denis, 17 calculated that the yearly average significant wave height due
to sea and swell from all directions was equal to 6.25 feet and that the average significant
"WiA no or Uam Ma. MOM ofCa mm ML
Nwt ttraM puie hePaM W iuI W- without huipMeu ml. aud. a fuIw y. 0b witihomt the Isuw of koaMd Vm W M udt.
9
wave period of thes sean was equal to 11.45 soonds. He also piesented the expected yearlymaximum valum of slnigflcant wae heights: about 5 feet for the southern swell, 12 feet for
the Kona storm waves, IS feet for the trade wind waves, and 19 feet for the North Pacificswell. It is clear from these data that southem swell is not likely to attain heights that willmake operation difficult when they aulment the heights of waves for other directions. Thussouthern swell is not likely to cause difficulties for workboat seakeeping. On the other hand,the combination of extreme [ona winds with North Pacific swell is likely to produceoccasional difficulties. Finally, the combination most likely to produce difficulties is theextreme northeast trade wind waves aik North Pacific swel.
Brned on the above results, It hu been concluded that a yearly average wave height of6.25 feet (due to all wave) will not often be exceeded. More specifically, the wave heightdue to all am will be greater than 7 feet only about 13 percent of the time and greater than10 feet only about 3 percent of the time. Therefore, it has been concluded on the basis of
thene local sea characteristics that the behavior of the candidate ships in waves up to 6 feethigh is of primary importance in stablishing their comparative seaway performance. Come-
quently their survival capabilities have not been examined to any significant extent in com-paring the feuibility of designs.
CALCULATION OF ROLL
As mentioned earlier, the monohuil responses were calculated in head and beam seas byusing the NSRDC Ship Motimi and Sea Load Program. The responses were calculated bothwith and without bilge keels in accoidance with standard procedures that are incorporated as
part of that program.The roll motions of the SWATH ships were calculated according to the procedures of
Lee and unpublished damping data from recent NSRDC model experiments. The simplifiedprogram (unpublished) developed by Lee was used te predict roll/heave motior&; of the
SWATHs in beam seas. This program esentially considers the ship as a constant cross-sectionbody with length and man equivalent to the actual ship. Experimental roll damping wasused to limit the predicted roll rempoe to realistic values.
The experimental roll damping was obtained from a model whose geometric proportions
were similar (but not Identical) to thaoe of Ships D, E. and F. Model motion decay experi-ments had been conducted both with the bare hull and with a variety of damping devices
such as fixed fins, blisters* near the waterline, and bilge keels; results have not yet beenpublished. Uilge keels resulted in the largest damping Increase above the baen hull.
S- e a imqe ajid"so ho hMi at).. the wado u to imemme the tus 8 bw/w fo(am that nmt
whn thu hall k imud below he wssem.
10

-- - --- ~~~~ - ..-- ~. ~ -- 0 6
The meaured peace.t U i.reae in hull damping due to bilge keels was then used to
increa the but hull SWATH hull damping. in determining the motions of a SWATH with
bilge keels, this approach considers that the meansred damping modifications ae applicable
to Ships D, E, and F despite differences in geometry. that is, measured damping increases
are considered to be physically realizable with reaonable. though unspecfied, bilge keels.
The predicted roi RAOs we considered to be inaccurate priarily in the frequencyrange where resonance occurs, Le., inaccuracies are asociated with the damping. However,
mnce the RAOs am intended for use in predicting roll in eas whose modal periods are far
removed from those of resonant roll, the predicted roll is considered adequate for establishing
a relative ranking of the various ship candidates.
A similar procedure wu employed to predict the effect of bilge keels on the SWATH
heave responses in beam seas and the SWATH pitch, heave, and acceleration responses in
head seas.
CRITERIA FOR COMPARATIVE PERFORMANCE
The asstimption was made that the consequences of excessive relative motions at section
LC would be exactly the samne for all ship types, namely, interruption of mission, and there-
fore that such motions constituted a criterion for comparative performance. More
specifically, it was assumed that when a particular statistical level* of relative motions ex-
ceeded the clearance or draft of the ship at L.c, the mission would be interrupted by keel
emergence or slamming and deck wetness in the case of monohulls and by crosarstructure
impacts in the case of SWATH.. Figure 2 was prepared to demonstrate the plausibility of
this assumption.
All response predictions were made, of course, by assuming linearity, i.e., a ]-foot wave
would yield one-third of the response of a 3-foot wave of identical period. The applicability
of the linearity assumption to predict the magnitudes of extremes of responses (e.g.,
occurrence of deck wetness, keel emergence, or slanming) is. of course, highly questionable.
However, it was considered that an accurate. relative ranking of the performance of the
candidate ships could be established in terms of such mission-interrupting events by extending
the relative motion responses linearily to the draft or clearance (freeboard).
The average of the I/10 highest single amplitudes of relative motion was selected as the
criterion for exceeding draft/clearance because this nmeasure ensures that within a practical
Avenge of the 1/10 WS.'WI die. ampktude of iibtiw motlom at LC.
II
. . .. . . . ..
time span of ship operation (e.&. 30 minutes) a motion cycle will be safflcieatly severe so
that either disruptive msinon.nternvpting slamming or deck wetness mult. The gaputer
prciSo attainable by specifying extreme tespome levels inherent in the use of such con-cepts a threshold velocities for damming or variations in the statistical motion level (e.g..the averae of the 1/3 highest or some other level) is not warranted. Neither the responsecharacteristics at these nonlinew ranges nor the specific consequences of exceeding particularrelative motions is known for the different ship types. Moreover, it is emphasized that
these specific in-transit *0p responwe criteria were selected in order to achieve a fair, accurate
ranking of the candidate ships during this fesibility dei stae. However, to resolve theaforementioned limitations of the predictions and to examine ship behavior under survival
conditions, it will be necesary to conduct model experiments for two candidates that our
predictions indicate are best suited as Navy worklboats.
CALCULATION OF RELATIVE DOW MOTIONS
IN TIME DOMAIN
The calculation of relative bow motion was based on the difference between the wave atthe longitudinal location LC and the absolute motion of the ship at that location. No
correction was included in the calculation for trim or sinkage due to forward speed; thesefactors have insufficient impact on the accuracy of the calculations to alter the relative rank-ing of the different ship candidates. A precise definition of the relative bow motion calcu-
lation is given in Appendix A.It should be noted that the prediction for relative bow motion is made in the time domain
developed from the spectral representation of the sea. Each relevant sea condition was con-
verted5.6 from the frequency domain into the time domain for every modal period wavespectrum by decomposing the wave spectrum into about 100 evenly spaced (in frequency)sine waves whose amplitudes are related to the ordinates of the modeled wave spectrum.Random phases were assigned by means of a random number generator to each of the 100component frequencies. The wave at !C was obtained from the wave at the origin by shift-ing the phase of each sine wave by the product of the wave number and the distance I .Figure A. I of Appendix A illustrates the relative locations of the waves and presents a simplesummary of how the various component time histories wert combined to yield the relative
bow motion.The pitch and heave RAOs were defined with an interpolation routine for exactly the
same frequencies as the components of the wave spectrum. The product of the sine wavecomponents of the wave, the response at the appropriate frequencies, and the appropriatephames were summed for all frequencies to yield the resultant time histories. The appropriate
12
Affi-
phae at each frequency was defined as the sum of the random phase and the phase
asmocinted with the particular response. This procedure of time-history pneration whichasociates the random phases with the wave time history thus made it pomibe to expose allcandidate ships to exactly the same wave time history.
After the component time histories of the absolute motion at LC, had been generated,the absolute motion time history at LC was obtained simply from the sum of the heave timehistory and the product of f times the pitch time history, see Figure A. I. Finally, therelative bow motion at Lc was obtained by subtracting the wave at L. from the abso-
lute motion at Lc. These arithmetic operations were performed for each instant in time.
PRESENTATION OF RESULTS
The various ship and sea conditions for which predictions are made have been summarized
in Figure 6.Tabulated results (Tables 4-1i) were utilized to prepare three basic groups of graphs
(Figures 8-12).The first group presents ship responses at various modal period seas for significant wave
heights of I foot (Figures 8 and 9) and 6 feet (Figure 10).The second group (Figures I Ia and 1 Ib) presents the significant wave height level at
which mission-interrupting events are expected from linear ship motion theory (see the dis-cussion of linearity given in the section on criteria for comparative performance). Thus thesefigures enable a simple ranking of the candidates in terms of the seas which limit their in-
transit operating mode. The higher the limiting sea state, the more capable the ship isto fulfill the defined mission.
The third group (Figures I2a and 12b) presents the results of the time domain repre-sentation of ship responses. The actual number of times that the relative motions are expectedto exceed either the draft at location L. or the freeboard or cross-structure clearance w&acalculated by a level crossing subroutine in the time-history-generating computer program. Itwas considered appropriate to perform these calculations at the average yearly significantwave height that typifies the intended work site area.t 7
The basic graphical format is identical for all three groups of figures and was developedto facilitate a visual comparison of the different ship types. Thus each figure consists of at
least three graphical frames, one for each basic ship type (monohull, SWATH, and column-stabilized catamaran). Response magnitudes of each ship are plotted as vertical lines at each
of the four modal wave periods. Thus variations in the response of each ship due to thevariations in the modal period, or-equivalently-the harmonic content of the sea, are pre-sented as a cluster of four vertical lines representing from left to right the response in the 6-,8-, 10-, and 14-second modal periods.
13

Althoush the tablesp ent the reults in RMS form in a ea with a 6-foot u isnrf-
cant wave he t, the fint group of figures presents the results in terms of significant single-
amplitude esponet These are equal to twice the RMS values and were selected for
press.ntation becaus thewe statistical response levels ar generally considered representative of
the responses experienced or noted by the crew of Ship A. It has been found that ship
operators generally quote angular motions as single amplitudes and translational responses.
such a heave. as double anplitudes. The statistical constants which r•eate the RMS responses
to ptricular statistical response levels such as the average, the average of 1,3 highest or Sit-
nificant, or the highest expected response in N amplitudes an *iven in Table 2.
REIPONE PER UNIT SIGNIFICANTWAVE HEIGHT
Figure 8a presents the sigtificant single-amplitude pitch and heave reWonses for the
various candidate ships operating in head seas at 0 knots. It is quite evident that Ship F (the
170-foot. 1032-ton, column stabilized catamaran) generally has the worst pitch motions of
any candidate for the new workboat. In fact. it% motions are expected to he nearly as
bad as those of the preendy employed Ship A. which is very much smaller (85-foot, 74-ton
hardchine torpedo retriever boat). However, once the column-stabilized catamaran has
ballasted down (Ship G) to become essentially transparent to the seas, it will have essentially
the lowest pitch responses. This clearly demonstrates the virtue of the dual-operation mode.
Pitch respones for the monohullh (Ships B and 0) will not have the undesirably sharp
increases in the vicinity of their pitch resonance exhibited by the small or low waterplane
candidates (Ships D, E. and G). Such behavior is one of the greatest potential shortcominps
of SWATH. However, its practical importance can be negligible provided this pitch resonance
condition can be avoided. For example, assuming that operational requirements during the
stationkeeping portion of the mission allow such action, the SWATH can avoid pitch
resonance by altering its encounter frequency through slight speed or heading changes. Note
that Ship E (I 7.4-second pitch resot-ance period) is clearly superior to Ship D (comparableperiod of 12.5 seconds) because it entirely avoids the problem of lawg responses in swell
during stationkeeping. Local sea data for the workboat operating site indicate that 17.4-
second swells do not occur with practical frequency. The difference in pitch response levels
for these two designs indicate the control that the feasibility ship designer can exert.
14
Salvesen 2 o has given a far more comlprehensive discusmion of the comparative seakeeping
quaities of monohulls and SWATHs; we Sections IVb and c of his paper for an explanation
of the differences.
(Bfc0au the undesirable nature of such sharply tunmd behavior has been amply demon-
strated by recent Navy experience with an oceangoino catamaran. the effectiveness of
pasive damping devices, such as bilge keels. for this mode of operation was included in the
present study. This aspect is covered in a later section of the report.)
Heave responses at zero speed are quite good for the various monohulls. only the sub-
merged column-stabilized catamaran (Ship G) can be expected to have lower heave responses.
The two SWATH candidates will have the hiahest heave responses.
At design speeds (Figure 8h). the SWATHs showed the lowest pitch of the candidates
and the column-stabilized catamaran (Ship F) the worst pitch. In fact, at design speed. Ship
F has the worst pitch and heave of all candidates. Thus if the comparison is strictly on the
basis of these motions rather than their consequen.es. Ship F is clearly the least attractive
- ' candidate in its present configuration even the small current workboat IShip AI has lower
ship responses. These particular points arm emphasized with reference to Ship F motion
responses because they illustrate the care that the feasibility designer must exercise to
ensure that the consequences of such motions do not result in unacceptable mission-limitingevents. Weight or displacement aflowances and ballast pumping capacity onust clearly be
tightly controlled in order to avoid a critical loss of clearance between the cross structure
and the water surface.
Significant differences in the motion response levels between the 15- and 20-knot
SWATHs were again evident at the design speed. These results demonstrate clearly that sub-
stantial differences in the responses of different SWATH ships are possible with relatively
ralinor basic alterations. Ship E (the 20-knot SWATH) is considered superior to Ship D (the
15-knot SWATH) so far as heave and pitch responses are concerned. both during the station-
keeping and in-transit operatin, nodes.
Other measures of seakeeping performance of the various candidates at zero speed
emphasize the consequences of large SWATH heave motions. As shown in Figure Qa. Ships
D and E definitely have the largest relative bow motions at section L. of all the candidates.
Monohulls have the lowest relative bow motions. and the snallest monohull (Ship A) has
the lowest of all. Thus. the monohulls are superior for such tasks as launching and retrieving
buoys and for similar work which requires low relative motions. Using the criterion of
relative motions at zero speed. the ranking in order of decreasing effectiveness is Ship A.B.
CE, and !J.
'0mm.ln N.. "A Note om the Seakem Chuacterkics of Smdll-Waterpha•-Are-Two4mil Shis," Advmce Maunm
Vddlc Meetla. AnmmxA. Maahiid; J. Hydromecdmk. VoL 7. No. I, pp. 3- 10 tha 1973).
15

When the vertical acceleratkin levels at three typical longitudinal positions on the docksat w vrkmships art considered 4 we Fipgsm 4 and 9m1. the mmonohtls aft very "dmla to
the SWATlHN except that Ship IFis notably better than the others The ranking is Ship E.C. D. D. A. and F. Vertical acceleratiwon amt generally lowe orer wider or larger deck
-ona than owe. fte longer but nirrow docks of moanoulls. However, none of the accelertionlevel appear to be obeectiofably h~h.
A similar acceleration comparion at design speedis (Figure 9b) however. demonstratesthe clear mapenonty of the SWATH&s over the monohuilb during the in-tramst operationmode. This as particularly noticeable (or the coumin-stabilited catamaran. Ship F. Rankingfor the sitips ismE. D. D. C. A. and finds F. The differences between the in-transit
acceleraiOn response levels of the SWATH&.. monohuuls. and the catamaran are on the orderof factors of 2 or greater and awe importan~t. Sigtnificant vertical accelerations which exceed
the 0.2- to 0.23-s level tend to becomne somewhat uncomfortable. Thus, in averag &-foot-high uam the SWATH acceleration levels would be below thewe levels. the momohullaccelerations would fall at the beginning of the uncomforable range. and the catamaranaccelerations would substantially exceed this uncomforable range. Should Ship F avoid theweuncomfortable accelerations by ballasting down to become Ship G. the rather low maximumspeed of 5 knots ovouldl strongly penalize this candidate.
The comparison of relitive motions during the in-transit operation mode indicates thatShip F ha die largst responses and that the SWATH and monohull candidates have lowerbut quite similar rebponses. On the basis of the combined results. it is concluded that in itspresent form, the column-stabilized catamaran is the least desirable or the three basic typesof ships under consideration.
To provide an additional seakeeping comparison between the different ship candidates.their absolute wan relative bow motions are presented tor averag 6-foot seas at speeds
ra frg om 0 to design speed (see Figure 10). The absolute bow motions are comparablefor the monohuibs repreented by Ships B andl C. It is noteworthy. however, that for these6-foot significant was. there is no noticeable reduction in how motion with increase inmonohull size. Thus, even the largest 741 -ton. 20-knot monohull experiences essentially thesame absolute bow motions as the presntly employed 74-ton. 210-knot hard..chine bout.
S~n~iwieowm im tof I~ pefffoeuc of tw0he m~eftmho misinum Q be sPinced Ifahep don"a Iof ad t type madld am the T-AGOR id fte ASK-21 aud -22 mote to be mrnb am *Ae prowui ShpF/G dadv. Thu. -qin of com be a due pndmit aad wthl hMm a d~mo&. but t~ hou maw t be tam
16
When comparing the absolute bow niotions of the monohulls and the SWATH candidates
at 0 and 5 knots, it becomes evident that the monohulls are equal to or better than theSWATIs at thee low speeds. The column-stabilized catamaran in tile submerged condition
(Ship G), however, has the lowest absolute bow motion, It is quite evident from these
remlts that the trends of the absolute how motions with forward speed are subktantially
different for the ship types. Bow motions of monohulls tend to increase very slightly with
increasing forward speed. those for the catamaran in the surfaced condition (Ship F) increasequite strongly with forward speed, and those of" the SWATI-s actually decrease with increasing
forward speed.
The different ship types also have different trends of relative motion with speed.Relative motions of monohulls are quite low at zero speed and increase somewhat more than
the absolute motions with increasing speed. Relative bow motions for the catamaran also
strongly increase with increasing speed, and those for SWATHs decrease very slightly with
forward speed. This behavior of the SWATIls is regarded as quite favorable from the sea-keeping point of view. The trend suggests that if a SWATII is satisfactory at zero speed.
then it will be Satisfactory during the in-transit condition.Thus a fundamental difference in the s.akeeping performance characteristics of SWATHs
(Ships D. E. (;) on the one hand and monohulls and catamarans (Ships A. B. C. F) on the
other hand is their basic response with speed. This trend was also noted by Salvesen. 2 () Toease ship responses in severe seas.i monohulls and catamarans must slow down but apparentlySWATHs mnust increase speed. fSevere seas are regarded here as seas which produce responses
that threaten ship survival.)
It should be noted that even though absolitle motions and accelerations are importantin determining the comfort level on board ship, once relativi' motions exceed specilfc values.
they produce mision-interrupting imipacts or dcck wetness. This consideration is equally
important especially during the in-transit operating mode.
If the mission of these ships is to include extended operations in the open ocean with-
out retreating to a nearby harbor, their survival characteristics must be examined, Thiswould require model experiments to investigate ship responses in severe seas at both zero
and design speeds.
If. on the other hand. the ships are to be deployed in the open ocean with the option
to retreat from extreme sea condi"'ns, then only zero speed model experiments between
the last two basic ship types are indicated.It is agaw concluded at this point that in its present configuration, the column-stabilized
ship is the worst of the three basic types investigated. It should --" noted, however, that
this ship apparently has the best survival capabilities of all. For comparative purposes, the
17
I• - I | i II~~~~ ~~~~I ..... . "... ... .... .. .

results for Ships F and G will continue to be presented, but this ship candidate is considered
as essentially eliminated from the competition.
The following section wi!l compare the candidate ships on the basis of their in-transit
performance limits.
CRITICAL SIGNIFICANT WAVE HEIGHTSFOR SLAMMING OR DECK WETNESS
The significant wave height at which mission is disrupted by slamming. deck wetness.
or cross-structure impacts is considered a fair measure of the seaway performance of the
different ship types. This critical wave height thus represents the limits of ship performance
in realistic seas. In waves much higher than those predicted by our linear theory, all
ships arc- expected to encounter such severe disruptions that alterations in ship course and/
or speed become mandatory. Inherent in our approach is the assumption of accuracy in
the relative ranking of ships by means of their critical wave heights. Model experiments in
extreme waves are recommended to verify this assumption for the best two candidate
ship types.
Figure 1 la presents the influence of speed and modal sea period on the actual wave
height that cancels operation because of bow emergence. i.e.. slamming. The higher this
wave height, the better the candidate ship is in both the in-transit and stationkeeping modes.
For the sake of convenience, sea states are indicated on the right-hand side of the
graphs. As in the earlier figures, the vertical lines represent the critical significant wave
heights. The dashed portion of the vertical lines represent wave height conditions at the
particular modal periods that are very steep; these are exceedingly rare and tend to occur
only in land-locked bodies of water. 14 .1 5
These results indicate that in average 6-foot seas, none of the candidate vehicles will
encounter mission-limiting keel emergence during stationkeeping. As expected from the
relative motion data of the previous figures. the monohulls (Ships B and C) are essentially
equal to the SWATHs (Ships D and E) so far as these seaway performance limits are con-
cerned. Tile small, presently used monohull (Ship A) is essentially the worst from this view-
point because if its performance in local-wind-generated. 6-second modal period seas.
At design speeds, the SWATH ships are superior to the monohull candidates so far as
mission-limiting keel emergence is concerned. The 20-knot SWATH (Ship E) appears to be
the best and the column-stabilized catamaran (Ship F) the worst of the candidates unless
the large speed loss inherent in its operation as Ship G is accepted without penalty.
18
This ranking alters somewhat when the ships are #umpared in terms of when their
7' ~relative bow motions will exceed freeboard or crossstructural clearance; see Figure I l b.During the stationkeeping and in-transit operating modes, the monohulls are substantiallysuperior to the other candidates. However, none of the ships is really unsatisfactory sinceall can operate in seas up to State 4, i.e., seas which occur the majority of the time. It mustbe noted that as far as the wave height indicated for Ship F is concerned, this is the height atwhich deck wetness of the lower catamaran hulls occurs at section L.C. This is not con-sidered to be a condition which limnits the operation of the ship. Ship re-sponses which resultin relative motions greater than this lower hull freeboard are inaccurate because the RRAOcomputer programs assume that the basic above-water hull form is wall-sided. Thus relativebow motions am inaccurate, that is, computer predictions are larger than would be expectedfrom model/full-scale experiments.
The ranking established by these perfonnance-limiting wave heights tends to favor themonohuils for most combinations of performance measures and operating mode. The SWATHships, however, have better in-transit performance both because they have lower in-transitaccelerations and higher in-transit sea state capabilities. In other words, they can operate inbigher seas for a given motion or acceleration response level. Based on the above con-siderations, Ship E is considered to be. the ship with the best seakeeping characteristics.
Before we proceed to the time domain results, it should be noted that the above rankingof the candidate ships was obtained by equally weighting the responses at each modal wave
period. This is not entirely realistic, of course, but ranking made on the basis of responsesIweighed by the frequency of occurrence of the particular modal period is beyond the scopeof this limited project. It is recommended that such ranking be performed once the candidateship type has been selected.
TIME DOMAIN RESULTS FOR SLAMMINGAND DECK WETNESS
The number of times that relative motions can be expected to exceed either the draft atlocation L,, (see Figures 1, 2) or the available freeboard cross-structure clearance was calcu-lated from the relative motion time histories for all ships. These head sea events were calcu-lated for the yearly average seas with 6-foot significant wave height (see Reference 17).
Figure 1 2a indicates the likelihood that draft will be exceeded or that slamming willoccur. The vertical lines represent the number of times that relative bow motions willexceed the draft at LC for the various ships. It is evident from these results that only thesmall, presently employed workboat should experience difficulties in transiting 6-foot seas tothe work site. Ship G, of course, also shows some keel emergences in these relatively mildseas.
19

Similar information on the likelihood of deck wetness is presented in Figure 12b. The
extent of such wetnes for the individual catamaran hulls is not considered to represent
operational difficulties for Ship F. The presently used workboat (Ship A) appears to havesome minor deck wetness at the transiting speeds. Again, all other ships are not likely toencounter deck wetness difficulties in these typical seas.
In the absence of reliable information on the levels of ship response that hinder work-
boat operation while in the stationkeeping mode, it is impossible to establish a comparison ofthe percentage and number of times that the individual ship candidates will exceed such
values. It is recommended that operators of the present Navy workboat be questioned (1) as
to what specific levels* of ship responses and (2) what particular ship responses most hinder
their work while on station. Once such values are given, the productivity of the different
workboat candidates can be readily established from the available stored time histories of
ship response.
INFLUENCE OF DAMPINQI3 DEVICES ONSWATH RESPONSES IN HEAD SEAS
The zero speed pitch response of the SWATHs, especially Ship D, was regarded as
potentially unsatisfactory because of the sharp increase in pitch as the modal sea period
approached the natural pitch period. This pitch behavior near resonance is of concern notonly because the zero speed behavior is potentially unsatisfactory but also because it
suggests large pitch responses in sea conditions which contain sufficient energy - low fre-
quencies near pitch resonance. Thus, the SWATH might incur very large pitch responses
both in quartering and following seas at speeds which result in low frequencies of encounter
as well as in swell. These large motions may unnecessarily limit the operational ship speed/heading.
Active fins would not be expected to provide sufficient pitch moment at zero speed toadequately reduce the potentially unsatisfactory pitch at resonance. At forward speed, of
course, active fins can successfully limit the near-resonance motion behavior of SWATHs, as
has been demonstrated with the U.S. Navy Semisubmerged Platform (SSP). The pitch androll excitation moments are presented in Appendix B together with the heave excitationforce per unit of wave height to enable estimates of comparative fin sizes.
Such n ± 5 degrM of roll, ± 5 feet of rla*e bow motion, etc.
20
l• • J . .. • i • • • • ... . . . • . .. A _
At any rate, active* fins are obviously a costly last resort and the addition of large bilge
keels was considered to be the most practical method of modifying the zerospeed, naresonance pitch. The effect of the additional damping on both pitch and heave wasdetermined by recalculating the zero-speed pitch and heave in head seas. This recalculation
was made by increasing the original bare ? ufl damping coefficients by the same percent(percentage based on bare hull values) obtained from the measured damping increase due tolarge bilge keels. The damping experiments are briefly outlined in the section on calculation
of roll.The results of the recalculation are indicated in Table 7 which presonts results for the
15-knot SWATH (Ship D) with and without bilge keels. In comparing the results with andwithout bilge keels, it must be recalled that these passive damping modifications are expected
to influence responses only in the vicinity of resonance, i.e., in the area where the dynamic
behavior of the SWATH is potentially unsatisfactory. A comparison of the pitch, heave, andvertical accelerations at the CG and-equally important-the relative bow motion at section
-' Lc indicates quite dearly that substantial motions occur near resonance, i.e., the 10- and 14-
second modal periods. More specifically, compared to base hull values, bilge keels provided a23-33 percent reduction in pitch, a 5-10 percent reduction in heave, a 12-percent reductionin vertical accelerations at the CG, and a 6-22 percent reduction in relative bow motions.Clearly, the addition of large bilge keels can be expected to substantially improve the near-
resonance motion (pitch) of SWATH Ship D. In fact, results suggest that the low-frequency,neaneonance motion responses may be satisfactorily controlled by means of passive damp-ilg devices.
Mg e OF SULGE KEELS ON SHIP
Since Ship A, the presently employed workboat, is known to have less than satisfactoryroll motion characteristics at low speeds, it was considered appropriate to evaluate the roll
responses of the different candidate ships in beam seas. The monohull candidates were
therefore evaluated with and without bilge keels. Howeer, responses of the SWATH shipsand the column-stabilized catamaran in the surfaced condition (i.e., as Ship F) were
"Automuticadly controlhd such as attl MIL
21
-! i ' I •I •' I i • • n i u • r •, i • a . •. i , . o. .. ... ........ .. ..WN
calculated only with bilbe keels; it was considered that the accuracy with which the effect of
bilge keels could be predicted was too low to be of value for these types. The proceduresemployed have been briefly discussed in the section on calculation of roil. Theme calculations
were not performed for Ship G because roll may be expected to be very small for this ship;
moreover, it seems unlikely that it can be considered as a serious candidate for the PMR
workboat.
Results of these zero-speed, beam-sea calculations are presented in Table II in terms of
RMS responses in waves with a 6-foot significant height. Both RMS acceleration and roil
values were calculated; these may be converted to significant values by multiplying them
by two.
It is emphasized that significant improvements in ship responses can be expected only
in seas whose modal periods approach resonance. It is evident that despite the improvement(16 to 17 percent) in monohull roil achieved near resonance, the SWATH roll is still less by
an order of magnitude. Their superior behavior in roll and their lower acceleration levels
should make the SWATHs better workboat candidates than are monohulls. This conclusion
is premised on the belief that the difference in payload growth potential between the SWATHsand monohulls is not very important. In other worc41, the SWATHs are likely to be betterworkboats if they are not forced to carry payloads significantly greater than allowed for in
the design.
On the basis of the foregoing seakeeping evaluations, the 20-knot SWATH is considlered
to be the best of the ship candidates. Economic factors, of course, did not enter into the
seakeeping evaluation.
CONCLUSIONS AND RECOMMENDATIONS
The behavior of the candidate ships in waves up to 6 feet high is of primary importancein establishing comparAtive seaway performance. Consequently, their survival capabilities werenot examined to any significant extent. The following conclusions are based on considerations
of the environment of the intended worksite area.
I. SWATHs are better workboat candidates than monohuils from the seakeeping point
of view.
2. In its present stage of development, the column-stabilized catamaran is the worst
workboat candidate even though its survival capability appears to be the best of all.
3. The 20-knot SWATH is substantially better than the IS-knot SWATH primarily be-
cause of its superior in-transit performance in various sea conditions and its superior roll
performance at low speed.
22
4. Monohulis have substantially better relative motions at low statonkeeplnt speeds
than do SWATHs and thus are better suited for launch/retieval of floating objects at mini-
mum roll headings.
The following specific recommendations me made:
I. If a pr'limidnay deign of the best two candidate workboats is intended, then either
Ships E and C or Ships D and E should be examined as the final two candidates.
2. The final two candidates should be evaluated in competitive r'odel experiments.
3. This experimental evaluation should include (a) comparison of the candidates at
zero speed in moderate head, bow, and beam no (stationkeeping); (b) establishment of
SWATH behavior in moderate quartering and following seas (low encounter periods); and
(c) the survival characteristics of the candidates should be determined if the workboat must
accomplish its mission in the open ocean without an option of returning to harbor in severe
wan.
4. The load-carrying capacity of the SWATH should be improved by incorporating some
of the pumping/ballasting features inherent in Ship F/G.
5. The use of large damping devices, such as bilge keels, is also recommended as an
integral initial part of the preliminary SWATH ship design.
ACKNOWLEDGMENT
The authors would like to acknowledge the contribution made by Mr. Richard M. Curphey
to this report for the computations of the transfer functions of the roll motion
and the wave-exciting roll moment.
23
APPENDIX A
DEFINITION OF RELATIVE DOW MOTION
Relative bow motion (RBM) is defined as the difference between the absolute motionVt and the wave rl at some point (L or X4 ) on the ship; see Figure A.I and Figure 2.
RBM1 is calculated on the centedine of the ship with no allowances for trim and sinkage.
Their neglect is not considered snificant because both are small (trim less than I foot andsinkage less than I degree) for the monohulls at the low, stationkeeping speeds considered.
Trim and sinkqe increase with increasing ship speed and are most severe for the monohulls,particularly Ship A, the smallest. Even though trim and sinkage may exceed their station-keeping values at design speeds, the values are still considered small enough so that the relativeranking of these ships is not affected. It may be assumed that at 0 and S knots, the SWATHswould operate at zero trim and sinkage and that at the higher speeds, the active or semiactivefins would maintain zero trim and only a slight sinkage or rise.
Figure A.1 presents a graphical definition of the relative bow motion and Figure A.2
summarizes the various motion components used to calculate the RBM. It may be seen thatRBM is constructed from the wave at the origin r0 . This value and those for heave and pitchmotion of the ship at the origin were obtained by summing 100 component sine waves ofamplitude rok and with phase 7 k' that is,
100ro(t) e !rkeiWEt + 7k)(i
where wEw 2 Vcosg
w = circular frequency of the wave
V =ship speedg = gravity
p - ship heading relative to wave
The amplitudes of the component waves are modeled in accordance with the
Bretschneider wave spectrum Sr(w) defined at 100 discrete frequencies, i.e., Wk'S. In otherwords, rOk is the mean square wave amplitude over the frequency interval AW. with a centerfrequency Wk given by
24

+ 1112Srok 12J=AA/ Si.(w) d~ (2)L k [A2S/2 M
and the wave spectrum S(w) is
Sr(w) AW- 5 e-i5/w4l (3)
where A -483.5 0
B - 1944.5/T4
= significant wave height
To a modal period of the Bretschneider wave spectrum S(w)
The random phb--" -& associated with each sine wave of frequency Wk is obtained by meansof a nndon. ,- ber generator.
In order ý.. ;lculate rg, the wave height at the location Lc or X4 (see Figures A.1 and 2),the phase of th% wave at the origin r0 is shifted by the product of the distance 2 from theorigin to X4 and wave number cw2 /g. that is,
~ ei('WEt + W2/8 M~ + 70k
r(t) =z rOk (4)k-1
The time history of the response q is obtained from
too
IJM(t) tljk e - (5)k
Here j 3 represents heave, j = 5 represents pitch, and iqjk, ejk represent the amplitude ofresponse j and the associated phase at wk taken from the RAOs calculated by the ir'st seriesof computer programs. The absolute motion at position Lc is
VO(t) = 73 (t) + II1 175(t) (6)
;.25/
l

Finally at Lc, relative bow motion RB5M becomes
RBMI(t) VR(t) - r(t) (7)
26
-' -- - . 'r
iiiI9-
" se : i i.r I o o -
III
NIn
I2
27/
WAVZ AT OlLZG13
VWAV AT1 34 LOCATION
fl aws AT aUG13n
ltje* YUICAL MOTZOS AT M
Vt - 0~ + Ittjea AUSOLU TE ICALI NM M O A T R W IL C A TI0
UNW- V - re 231ATMV 301 MI01
Figuz A.2 - Summikry of Rlative Bow Motion Caiculatom
i L8

- - -- - - - m
WAENOIX B
WAVE-EXCITING FORCES AND MOMENTS FOR WORKBOATCANDIDATES AND FEASIBILITY OF ACTIVE
FIN STABILIZERS
The wave-exciting forces and moments that act on the various workboat candidates arepresented in graphical form (Figure B. I) in order (I) to provide data from which the feasi-
bility of motion reduction by means of active fins can be established and (2) to illustrate
some of the reasons for the basic differences in the responses of the various ship types.
The results of Figure B. I are for excitation at zero speed in head (pitch and heave) and
beam (roil) seas. Since the effect of forward speed on the magnitude of the wave excitations
is smail, the zero-speed excitations are considered to represent the excitations at all speeds
insofar as fin feasibility and basic response characteristics are concerned.
Pitch and roll moments are given per unit of ship displacement times wave amplitude;
heave force is iven in the same units and then multiplied by ship length in feet. The waves
which correspond to the resonance periods of roll and pitch are denoted by vertical lines
labeled by ship type. Note that these resonance periods, or waves, correspond to the waves
which produce the maximum ship response per unit of wave height as determined from the
RAOs. i.e., roll in beam seas and pitch in head seas.
The basic reason for the differences in the responses of the low waterplane area ship
candidates and the monohulls/catamarans is demonstrated by the location (frequency) of the
maximum values of the wave excitations and the resonant ship response periods. Maximum
values of the monohull and catamaran wave excitation moments tend to occur near the maxi-
mum value of the ship roll and pitch responses, i.e., near the resonance values labeled in
Figure B. I . in contrast, wave excitations are quite small for the SWATH ship candidates in
the vicinity of the resonant roll and pitch motions.
Before discussing the feasibility of active fins for ship motion reduction, it should be
mentioned that ship responses depend on the magnitude of the wave excitations and their
frequencies. Thus wave excitations at frequencies near the angular ship response resonances
tend to produce large responses and those far removed from these motion resonances tend
to produce small responses. Essentially, wave excitations are a function only of ship geometry
and the waves. On the other hand, the location of motion resonances* (and thus the expected
response manitudes) depend on the load distribution (metacentric height (GM) and mass
moment of inertia) of the ship once displacement and LC'G have been fixed. Thus substantial
reductions in motion may be realized if the load distribution can be altered sufficiently to
*SWATH motm remoiom fnquflmw an also quite vmwiive to waterple awrea dlMbutimoe.
2q)
mov fthe rumant motiou period from the peak of the wave exdtation. For example. an
m in the roll period of Ship A from I to I.5 seconds would reduce roll.It is considered appropriate to develop tis which reduce ship motions that occur near
the ship respo-se -esonances. Thus Gins intended to reduce the heave and pitch of SWATHs
should be designed for periods of around 12.5 seconds for Ship D and for about 17.4 secondskf Ship E. The forces generated by the tins must approach the magnitude of the wave exci-
tations in order to reduce motion substantially. For purposes of this fin feasibility examina-
ton it may be assumed that the tim should provide a moment which exactly cancels the
ship motions, This anumption will, of course, result in relatively large fins at the fin design
condition Nevertheless. the fin sines that can be developed on the basis of this assumptionwill ;stablish the appropriate relative ranking for motion stabilizrs for the various workboat
candidates. It is evident from Figure B. I that the wave excitations for monohulls and cata-mamnas are very much larger than for SWATH..
The feasibility of motion btabilization is now demonstrated by considering the non-
dimensional roll and pitch wave excitations at resonance for Ships C. E. and F:
Ship C Ship E Ship F
Pitch Moment 4.2 0.13 2.25Roll Moment 0.19 0.06 0.S5
We convert these pitch moments into forcc-s (tons) by locating the fins, say. 0.4 L., from
the LCG. Similady. we convert the roll moments, into forces (tonsI by locating the finsrather arbitrarily at a certain distance from the centerline: 1.2 times the draft for Ships Cand E and 24 feet for Ship F. The following forces result:
Ship C Ship E Ship F
Pitch. tons 38.9) 2.1 34.2
Roll. tons 11.7 3.2 23.6
These are wave excitation forces per foot of wave amplitude that stabilWzrs must provide in
order to completely cancel the ship motions due to waves.Now assume a fin design speed of IS knots and select 0.040 lift curve slopes per degree
of fin angle. as obtained from some typical full-scale roll fin experiments.21 The resultingtotal sizes for fin travel-limited to t 28 degrees is given below for seas with a significant wave
height of 6 feet. (The limit of : 28-delpee tin angle was taken from the fin limits employed
on the Vosper tins installed on the U. S. Navy PG 100: see Reference 21.)
Ship C Ship E Ship F
Pitch, feet 2 363 20 319
Roll. feet 2 110 30 235
30

On the basis of these preliminary fin area results as well as the sizes of roll fins installedon monohulls, it is concluded that pitch stabilization is impractical for monohulls and cata-marans. In other words, pitch reduction to zero by means of fins in 6-foot significant seasis impractical though not impossible. On the other hand, pitch and roll reduction appears tobe quite practical for the SWATH ship, Finally, stabilization of the monohull io zero rollin b-foot beam seas is also somewhat impractical although much less so than is true for thecatamarans. It should be noted that for adequate conventional roll stabilization, fin sizefor Ship C can be reduced to about 60 square feet.
31
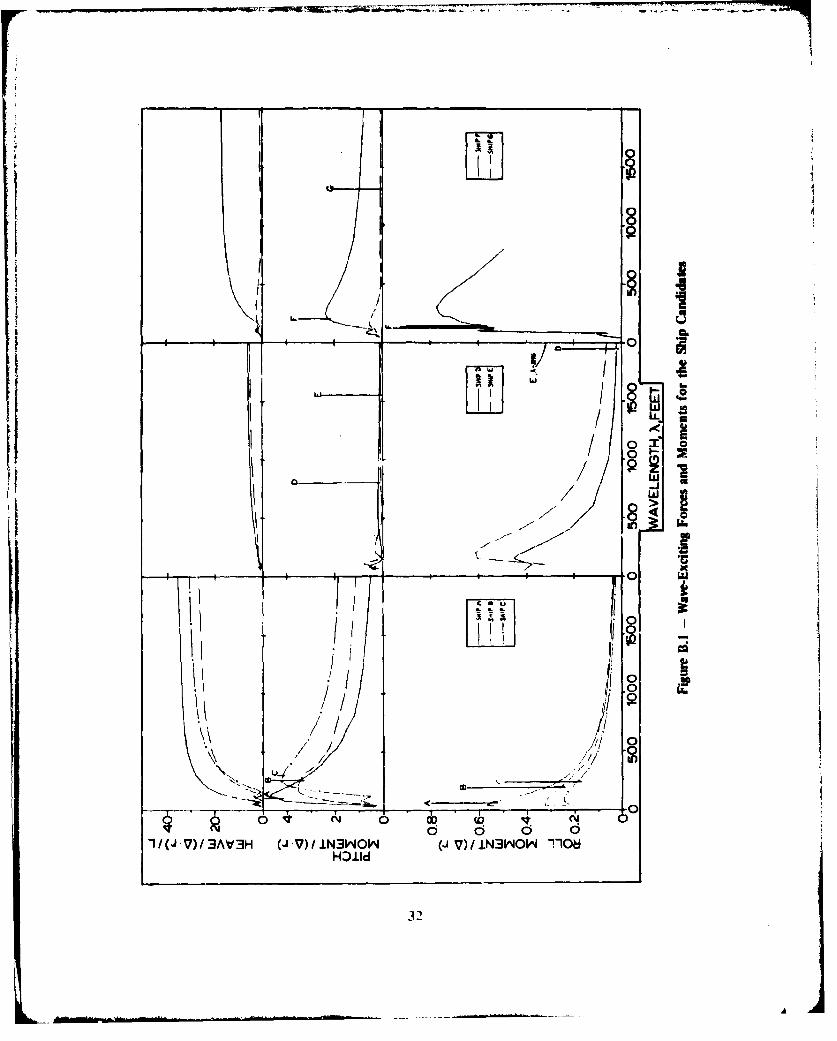
uj
co
d d 01/(JV)/3V3H (J ý) i3NOWV) I31NP4 -- 10
HD~ld32Ifi

REFERENCES
I. Meyers, W. G. et al., "Manual NSRDC Ship Motion and Sea Load ComputerProgram," NSRDC Report 3376 (Feb 1975)
2. Salvesen, N. et al., "Ship Motions and Sea Loads," Trans. SNAME, Vol. 78, pp.
250- 287 (1970).
3. Frank, W. and N. So'vesen, "The Frank Close-Fit Ship-Motion Computer Program,"NSRDC Report 3289 (1970).I 4. Jones, H. D., "Catamaran Motion Prediction in Regular Waves," NSRDC Report
3700 (1972).
5. Zarnick, E. E. and J. A. Diskin. "Modeling Techniques for the Evaluation of Anti-
Roll Tank Devices," Third Ship Control Symposium. Bath, England (Sep 1972).
6. Withrington, J. K., "Analytical Methods for Verifying the Structural Integrity of
LNG Carriers," Third International Conference on Liquified Natural Gas, Washington, D. C.
(Sep 1972).
7. Baitis, A. E. et al., "LNG Cargo Tanks: A Ship Motions Analysis of Internal
Dynamic Loadings." GASTECH 74, International LNG and LPG Congress, Amsterdam (Nov
1974).
8. Pierson, J. W. and L. Moskowitz, "A Proposed Spectral Form for Fully DevelopedWind Seas Based on the Similarity Theory of S. S. Kitaigordskii," J. Geophys. Res., Vol. 69,
No. 24 (1964).
9. Hadler, J. B. and T. H. Sarchin, "'Seakeeping Criteria and Specifications," SNAME
Seakeeping Symposium, Webb Inst Nay Arch, Glen Cove, N. Y. (Oct 1973).
10. Baitis, A. E. et al., "Design Acceleration and Ship Motions for LNG Cargo Tanks,"Tenth Symposium on Naval Hydrodynamics (Jun 1974).
11. Cummins. W. E., "Prediction of Seakeeping Performance," 17th American Towing
Tank Conference State of the Art Report- -Seakeeping, Pasadena, California (Jun 1974).
12. Hoffman, D., "'Analysis of Measured and Calculated Spectra," InternationalSymposium on the Dynamics of Marine Vehicles and Structures in Waves, University College,
London (Apr 1974).
13. Hoffman. D., "Environmental Condition Representation." 17th American Towing
Tank Conference State of the Art Report -Seakeeping, Pasadena, California (Jun 1974).
14. Bretschneider, C. L., "Wave Variability and Wave Spectra for Wave GeneratedGravity Waves." Department of the Army. Corps of Engineers Technical Memorandum 118
(1959).
33

15. Pore, N. A. et al., "Wave Climatology for the Great Lakes," Nat. Ocean Atmosp.
Adnin. Technical Memorandum NWS TDL-40 (Feb 1971).
16. Ploeg, J., "Wave Climate Study Great Lakes and Gulf of St. Lawrence," SNAME
T & R Bulletin 2-17 (1971).
17. St. Denis, M., "The Winds, Currents, and Waves at the Site of the Floating City
Off Waikiki," Univ. Hawaii Report 7 (Dec 1974).
18. Homer, P. S., "Characteristics of [peep Water Waves in Oahu Area for a TypicalYear" Report prepared by Marine Advisers, LaJolla, California, for Board of Commissioners,
State of Hawaii under Contract 5772 (1964).
19. Ho, F. P. and L. A. Sherretz. "A Preliminary Study of Ocean Waves in the
Hawaiian Area," Univ. Hawaii, Hawaii Inst. Geophys. Report H 16-69-16 (1969).
20. Salvesen, N., "A Note on the Seakeeping Characteristics of Small-Waterplane-Area-
Twin-Hull Ships," Paper Presented at Advance Marine Vehicles Meeting, Annapolis, Maryland;
J. Hydromech., Vol. 7, No. I, pp. 3-10 (Jan 1973).
21. Baitis, A. E. et al., "The Evaluation of Active Fin Roll-Stabilizers," Third Ship
Control Symposium, Bath, England (Sep 1972).
34

M~ pq P% .4.
C! n-! " C
.4 -m ,
44 1
a4 0 a 0 0 wo
WN 'a -a ~
allM
R~ F5m- I. ar JrI-
-.E.
-
-~ ~~3a
C..35
L- as'.- 16.9-41-
* SHIP B
20 mw w LLV 27'
140-4
Lc
*1 ____________02_ SHIP C
-200'
I.-L -~4
31.404aO~ SHIP D i T20 KNOT SWATH 30.'
200' Lc
___ 23160?E 211.7'I
SHIPS F 11a m 13 T
3 200'
5,'
16'L
_____0__- 15"- .64-
Figure 2 - Comparison of Candidate Ship Types
36

AFT
I X I 1Ol3I JACU 20 FM
SE!?l C
SHIPR
SRI
40 30 20 10 CL 20 30
Figure 3 - Computer Fit of Body Plans for Camdidate Ship Types
37
~t~l
ITiCAA
C4
P4 N
C,,.
oN
CIA
e4'
38
.20Wave spectra selected torepresent wind and wellcouditions Significant Wave Height
1 Foot
T 14 SECONDS 4 4.0 AM. " (Double Amplitude)
TO -10 SECONDS
T - 8 SECONDS
ave etra selected to
• 10 - repre5 t wind enrated seas
To 6 SECONDS
.05 T 0 3 SECONDS NOT USED IN PRESENT STUDY
0 --0 1.0 2.0 3.0 4.0
WAVE •IRB•W . , VADIMNS/SECOND
Figure 5 - Theoretical Wave Spectra Used to Represent Sea Conditions
39
U N
Ia
3 03
40a

N.P. Swell742
5.0471
Kona .5 9.20Z 75.3Z10.32 1.262
1.982 O 1038Z
S. SVeG1
532
Figure 7 - Relative Frequencies at Which Individual Wave Systemsor Combined Systens Occur
41

0O.OULLS SWATHS COUMV STABILIZE
Modal Wave Period
. Sec. -
1 Sec.
0.0
1.0
S0.5
0.0A I C D F
SHIPFRpm $a At 0 SMft
1.0 H0KOliLLS SWATHS COLI~M. STrAIILIMlD
godul rave Peilod
(16 Sec.
0.,-14 Sec.
1.0-
0.51
A a C D 9 F G
SHIPFJPW 8b _ At nmp Stmd
Figutre 8 - Influence of Modal Sea Period on the Significant Sing~leAmplitude Pitch and Heave of Ship Candidates
(in sm with I.1ool doefttd wm toeigt)
42
A
Ftpue 9 - bhmmm of MoM Sum Perioade Sig IN gml o*mAmp* g ttwsbdlve Dow MeIdm md Vi•-- Ac-,elerion of- the 3.-g-_Ca:-koe
dew Ship Cm-dole
MOOULLS SWATHS COIL.O4 SIABIL ZE•T
odal Wave Period
1-0.50 6 See.
14 Sec.1k1111
0.1
- 0.10-
0.05
B0.05 iSo.o5
0 oil 5
0.05.
A C C D E F,
SHIP
Fi:we g - At O Kmb
43

1.50 6
14 Sec.
ýO..
0.05" T•!. " "
S 8 O. 15- -
0.et
So.so ..... . .
0.15 I
0.0 - ¢ L
0. OSI
Fipwm •b - At no• Spos&
44

*11
,~ a
I I
n i ni
.• -" - ,..-.
• • - • .-,- ---- --zm•
45
ii
w
.01.
IDI
C ~ ,I~uI 46
In*
I _ _ I __ _ _ _ _ •,---.-"_ _ _' I..
I i i
47

1-4-
U)U
a-44
U048

9w
'0 Ej
N .4I
: 1DV33X 30NOI aII3m
49

- -. ..- �--'. - - - - - ���1TABLE I - DEFINITION OF SEA STATES
Rangesot Rang., ofSignificant Wave Modal Wave
Heights PeriodsState 'V 1
ft sec
1 0- 1.92 0- 3.06
2 1.92- 4.13 3.08- 4.52
3 4.13- 5.66 4.52- 5.29
4 5.66- 7.35 5.29- 6.03
5 7.35- 13.04 8.03- 9.03
6 13.04 - 20.80 8.03- 10.15
7 20.80-40.33 10.15- 14.13
8 40.33-61.58 14.13- 17.45
NOTE: 1. T0 pereods correspondIng to the stampeat. partially developedwindgswieratad m, ulion I etcf�. high wind, moving hurricane.Dreuchnelder Reference 14.
2. Steeper waves do occur, but they are rare and are generally aseoc-lated with land mocked bays or lalcas, References 15 end 16.
3. To - (I� I /0.2021- � 113 �
4. 10 /0.1271 1/2 Modal period of fully deveSoped wind
5. 1/40 P.ermon.Maskowgu m�e spectra. i.e.,
6. �/I�,) - Bretachneider. g.e, (3)
)10 !Waveength conespondino to period of spectrum peak. T0
7. - 1/10 Steepest ohaervsd, 14og.en utd Lumb
50
A

TABLE 2 - CONSTANTS FOR SINGLE-AMPLITUDE STATISTICS AND EQUATIONFOR TWO-PARAMETER BDRESCHNEIDER SPECTRUM
SINGLE AMPLITUDE STATISTICS BRETSCHNEIDER SPECTRUM SW(w)
Root mean square amplitude, rms 1.00o Sc.ca) = Ah- 5 exp I-B/w4J in ft 2 /secAverage amplitude 1.25a A = 483.5 ()w2i/C ft2 saC-4
Average bf highest 1/3 amplitudes, significant 2.00. B = 1944.S/T:4 sec-4
Highest expected amplitude in 10 succesive 2gamplitudes 2.15 1t-11/3 = Average of highest 1/3 wave heights
Average of highest 1/0 amplitudes 2.550 To = Modal period of spectrum, i.e.,period corresponding to peakHighest expected amplitude in 30 successive of spectrum
amplitudes 2.61o
Highest expected amplitude in 50 successiveamplitudes 2.80 .
Highest expected amplitude in 100 successiveamplitudes 3.03 a
Highest expected amplitude in 200 successiveamplitudes 3.25.
Highest expected amplitude in 1000 successiveamplitudes 3.72 u
DEFINITIONS
02 = Statistical variance of time history
N = Number of successive amplitudes
CONSTANT = .4 (Rn N)'12, where CONSTANT relates a to the highest expected amplitude in Nsuccessive amplitudes.
NOTES:
1. The highest expected amplitude in N amplitudes is the most probable extreme value in Namplitudes. This value may be exceeded 63 percent of the time.
2. To obtain wave height or double amplitude statistics from rms values, multiply singleamplitude constants by 2.0.
51
TABLE 3 - YEARLY AVERAGE STATISTICS OF FOUR MAJORHAWAIIAN WAVE SYSTEMS
(Fomý St. DmI7)
Direction Average AverageWave Group of Origin Significant Significant Frfglaen-y of
dog true Height Period Occurrnce
ft sem peraw t
NE trade wind-
generated waves 78 4.79 &63 75.3
North Pacific swell 320 4.79 13.89 74.0
Kona Storm waves 187 3.52 6.18 10.3
Southern swell 194 2.60 13.07 53.0
52
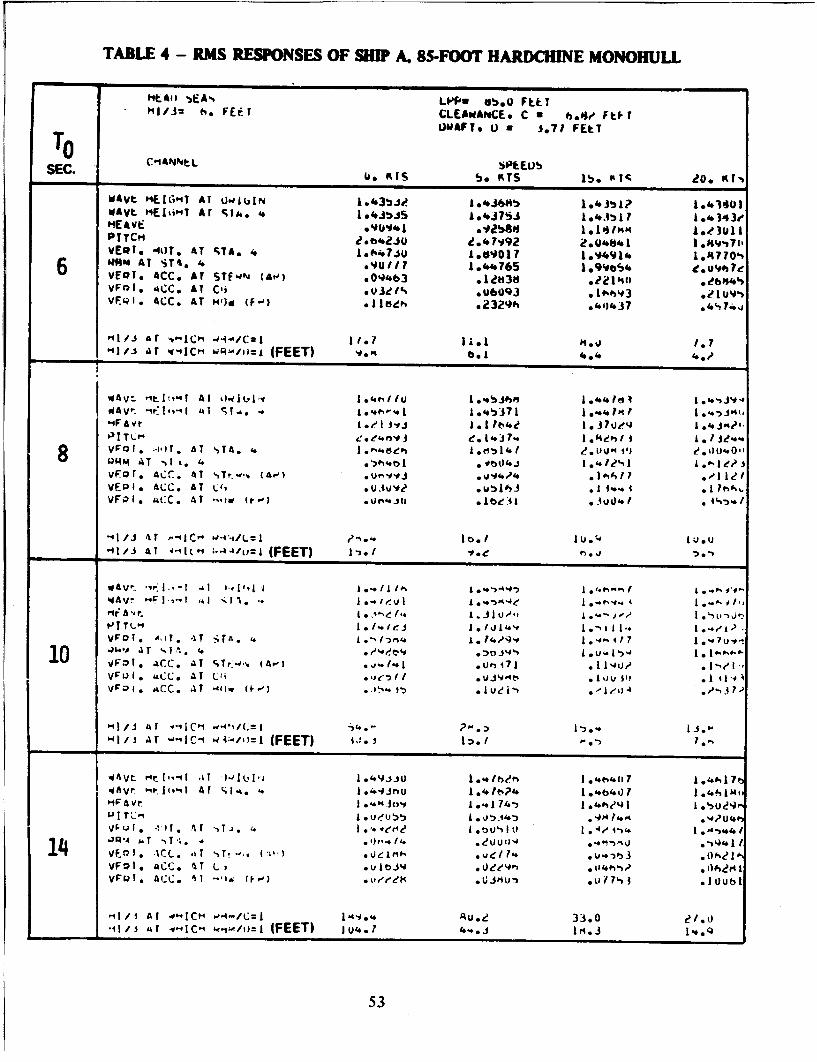
TABLE 4 - RMS RESPONSES OF SHIP A. 85-FOOT HARMCHNE MONOHULL
"- I/3= b. FEET' CLEAmANCE* C a h080", Ftl'I
TO U AFTs U) a 3.71 FE&t
SEC.im C*ARLis. be ~ RTS lb. 2T 0. Kft
W&Vt~ HEIG.IT AT frlbIN 1*43J~4 104.368b 104351? 1.43401WAVt. MElti'T Ar SlA, 4 1*43tJ5 1,,437S3 1.4.1317 104343e
PITCM ".t642ju e,47992 Z00484'1 1.144,041VEf -4t)To AT STA, '. 1.#%io7ju lo#9017 I o1#4914 1,61770%6 ON AT STI. 4. 690117 1.'.'765 109 4OS ei'hlVERT.AC. A SF#Nc*J 004463 . 160 021ln 3544%VFI0l. aCC. AT C'ij 4 1 *U6093 . looft3 eIu-VFQIo ACCo AT MvJw (F-1) .I I ee e2329A% *.61437 .S7-
Hi4/i 4l' -i~cP4 4.4-/cei 1 101 liel m.U) 1.7Hsjhs Ar w-'icm 'w4-/o (FEET) 's.0 mb.0 4,'. 4.?'
%dV- qlv-lA 14% IUI00h hs1 044 ei I I.4'.SQI
vFao f. +I.T. AT sTA. 4. I. def joe.2v116t I'. LUMII *114.8 4 MAT -wI:. 4 ~ .'041.1b4. 41'
VFP r. ACCO AT SJ. 4 A, .ufvo . *j 4,)4 .l01617VFP1. ia(:C. AT *siu 0I-) 1U~.~ b1e:4iL o 3U04 I
-41/3 AT "-'l1. -'-~4-/L-1i (FEET) 1-3. ele h.J 7).1
~Av*iCI,-T &l~ l..1 (4u L
VFOTI. A2T. -IT --,A. 4 f ,)M4 .- f1.'#-jkv A T 1.l1 A '. 4 ?,~- 0 ,10 vF;T* I . aC AT 1, (As-) jo - 7 .I 1 0 .tI
VFU I . "CC. AT LI;' *'joe"211 OuJ'O,4% *I o lip .1 4 1 -,
VFQ 1 ACC. AT -4)v ( u - .'pu, *ul3 7jd
041/3 AT 4.1c" Di~ ~3.
" I /I AT.1,4c-i FEET I53

TABLE S - RIBS RESPONSES OF Sill' B, I S-KNOT MONOHULL
-IEAtl %FA!3, LOOPS' lbU.U 9111l
"19/3v o. Lttl CLI.AwAmL.to C x 1i".uv Pe.tr
TO Ua1AFIS U a -4.ou Pttt
SEC. CHANW4IL NIS i ty% h
wAvt. sEIb'4T AT Uw(J.1-4 AS.XJeJ i*4.jbA4 14jiW&Ve. 04E.I"i. AT STA. 4. 1 .4 tJ:Ji 1 0aJ7 Iz 1.'Thi3
WVAVE .5isoi 'b66"3" 0%4 0
P!TC'4 1.e,1us7 IJUIde 103eVERT. 140To AT STA. 4 1.361VI Aobl~sb 1*.3eu4
6 ON AT StA. 4'.4D oabe22%6VERT* ACCo AT STERaN (Ao.' *OS466 *1006o 1,3?VEQT. ACC AT CG 001?98 905Q.004ifu7V73T. ACC. AT tsow (Fooi 007309 e33
041/3 AT WelICM ..4m/Ca 1 31.aZgb.to4l/J AT ollCm s~s-/0- I (FEET) 14..O 1U.I 8.5
wAvc. sqEL,4T AT SrA. 4 1 ... tewoem 1.5001 6 1
VERT* 4UT, AT STA. w-)-* i.~v,.' I e. Iv
8 R A STA. a. .5uIli 4. 1ui-P
vEDT. ACC. A7 STF.1; (A) *U i-'s I1'-
Vv~ro ACC. AT C'i V.jjtl~ *~ I t
VEQI. ACC. AT - - tý- *leu I)I'o'
"11/' 17 gs-tC1 *iIl(FEET) l.
wAvP. mE64E1.-T A? TA ..
vEipI. -40T. AT STA. i.tm/e9 * Anb ih.4 I d1 14j-
R AST.4 .Ete,,?u5 1.073-17 ftof Ac.I I10 VFDT. ACCT. uT - T yF -..~-,i I jajIu U10 I ý
VFOI. At-(. it L -' - vVfEO 1 0 cc. n7 - J- As- "?- 4
"41/i AT v-IiC~ -~*4 ~ *.jo'..
01 /1 AT v#1C' 4.*- (FEET) e-05 ,, i.
wPt 4f, 104T
P IT-l, .tC ga1 C0.S-
VERT. ACC. AT **iý fr-' evJ 17,6
-41 / 3 A T vW- ,' IC'L L4 ja/~ ( F E E T 4 14 ..u
54
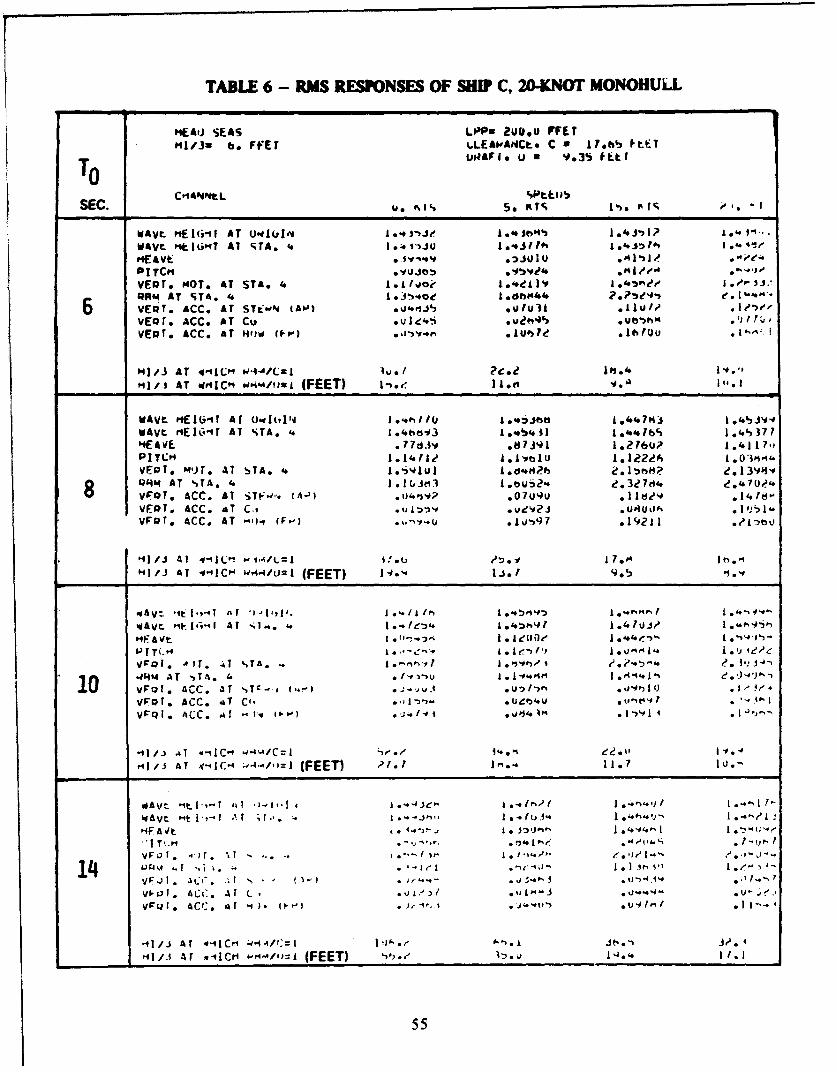
TABLE 6 - RMS RESPONSES OF SHIP C, 20-KNOT MONOHfULL
"MEAU) SEAS LOPs 2uO.u FFET"Nj/ia 6. FFET %.LEAk'ANCt. C 0 j7.hb PtE7
TO U,4AP1. U a Y.35 f~tl
SEC. So 1ii'. p. r1; oo ~ -I
WAVt mE16-el AT U.qL(y1. 1.43-:o~ 1.e' ? I I"-WAVt PitWejT AT RTA. 4. I..s~ft £.4s,,e
PITCP# evujfot Klem ./ý--VER., MO0T, AT STA. 4. I.tjjo? i.~oor' a.'.J."ROM AT STA. 4 13,J40e e.de -*P4'.
6 VERT. ACC. AT STjwN' tAl') fu.e4d'3 .gi u~ .Lu1 01/*3-'VEQT. ACC. AT Cv *ue4)~ .V"4)*Uwp1VERT* ACC. AT HOW~ Ito~ f L'7 1luu
HI/3 AT 4-11C" w-4-/C1= I.. Avg/'41,1 AT Wr91Cm .s"pim/i i (FEET) I -I .e C
wAvt 'Ieic-iy Ar tJ-d(vIlq I .fA1.1.:ju1447m3 *S4WAyt riEIC.-41 AT STA. 4. 1.4ebo43 1..0'>411 1.'.4647c 1.4%377
yvaro m-Ur. AT STA. '. 1.',iqju1 L.d'.$?b 2.113"82 e,13Y4,48 l4M AT STA. 4. 1.ouS2-o e.3e74e40VFQTO ACC. AT STF.-. (A-') .07#uu I I de, .14180VF:DT. ACC. 4T C., . ve2S * Usi$(hl#5hVFQt. ACC. AT -li- (F.-) . 1.,-, Ul-)97 *112 111 w
'41/3 AT -4-11L" w 4-s.i/t.= I t'D . jl 7p4n..11/i AT .4-l1CP' WfiU1= (FEET) 1."ll9.
WAVt.~1'' AT -;1... 4.I.~ 1.4ýft41 1.47uj?~
vroI. .4or 41 ',Ta. e. j.'-v1 *.,,'
* 14t4 AT -PTA. 4 tv -lu L...L.10I VFtQT. ACC. at STc-i e.- .u,/-VA
VF~r. ACC. .AT C(, .I -,l .Ijf3 4 Uutf
vrpl. ACC. A&T - 1-v I I.$)*...'. .. J#34 .
s/J AT 4,-IC- 1 (FEET) 1> ii.. 7 117.?.
vFc r . 4CC. aF1* ~*J*v~ 1~
0 01 . ArC A L-1 ,i ~4r~ I'.. #-ii )/
oil/3 AT x-ilCH ".4-'ip=1 (FEET) '1). 14.4 1/.1
55

TABLE 7 - RMS RESPONSES OF SHIP D, IS-KNOT SWATH WITH AND WITHOUT BILGE KEELSTAKLE 7A - WITIHOUT DILGE KEElS
"#F(AJ) SEAS LOPs 1%5.0 Fttl"I/3. 6. FEET CLEARANKL, C v 1?,0o rter
To U.AFI. U a lb.SU FEET
SEC. C4APoEL SPE.us-p KTS 5. KTS IS. RTS
WAvt NEIG.ST AT ORIGIN 1.43532 1,e.,a1#1 lormIiAvt• HEIGHT AT STA. 4 l,.43534 .. ,*377? 1.4JSi2NEAVE 16S7699 .-7668 ,•8J'0PITCH .1wd3S .20737 .2v1•VERT. MOT. AT STA. d 1.66b68 ,vs43v .3611;ROM AT STA. 4 2.?4b6O 1*60406 J,63bOft
VEQT. ACC. AT STE-IN (AP) .04d75 .03620 .03211VERT. ACC. AT CG .0u757 .033%5 .O1905volT. ACC. AT dOW (FP) oQ7bti ,UQj!)b 004300
Ni/J AT d4lC" RW/CaI 1•,6 1b.7 17.31/I3 AT 4-1C- RSM/J-I (FEET) 17.5 21.5 23.7
:AVt MEltT AT OQIGIN 1.46?70 1.'537u 1.44O0NAVE ME1o3p.' AT STA. 4 .106d3 1.*34 1.44793HEAVE 1.,8192 1.97080 1.4O09?PI TCH .426'.3 *2?781 .-.0994
8 VER.MOT. AT STA. 4 1,474OU e.021b7 1.51799ORM AT STA, 4 ?.4Lb34 zoeop5 2,3,,429
VFOr. ACC. AT STE4N (A01 .04493 .00651 .05119vF01. ACC. AT CG .0'440, 0056310 .0'M27VEoT. ACC. AT 9Ow (Ft) .0O5U00 .05744 OS-40
"1/J AT w-IC" w•m/C=i 11.7 llee 12.1-41/3 AT w-lIC- R"./u=l (FEET) 1".1 15.' 1.ob
WAVL HEIGCT AT OQlbl% 1.4711A 1.45405•i.4686luAvt HEIG.4T AT STA. 4 10.47,17 A...5v07 10.6934'HfvE 1.77bO3 e.12053 2.2760QPITCH i.6012Tbu .'.3b1 62-1VF1. MOT. AT STA. . eob1 o,311ne ?.437f9
lu
10 ORM AT qT4. 4 '.)b e.384.72 .3bfvE0r. ACC. AT S•T7 E • .0to . 0J?3m .0S16o7vFye. ACC. AT Co• U34O35 .U 33-bVEui. ACC. AT -4lo (F01 .U4436 .U53Sm .u711l
MI/J AT ."1C .- 'Q/C=I l1.0 IL.m 1U3.MI/3 AT . 1C' .- 141/=1I (FEET) 13.1 ri.1 14.2
wAvt "Elu'MT mT 00O1G114 1.44jeb 1.476:39 1.4%422iAvt. -.EI'i-' AT STA. '.1.4YibS 1.47b34. L.4b4'21
HEAVE 1.13,4b0 1.#37017 2.20473P ITC04 2. 7bl~u 1,033?22 6bvF*T. mOT. Ar STA. 43.34415 e.'.5te9 2,4324514 QRN AT STA. 4 ~ 2.56j~ 1,?9j03 o25vEar. ACC. A Tqio .0~'e.Ih *0J331 .0s111VER.* ACC. AT C6( . 1S0 . u35466 .05230SVE~R. ACC. AT eJOw (FP) .0 3b,.;9 .03,4S3 .05 t11
P4)/S AT '- RHMP/Cu1 1100 1511 13,9-41/3 AT . C QR~4/Eiu (FEET) 1591 ?1,7 19.2
56

TAKLE 73 - wnwh DE KEELS
HEAD SEAS* LPPw ISS*O FEET"41/3w 6. FEET CLED4AKIE9 C a 1?960 FEET
To ~URAFr 0 9 * 10.50 FEET
SEC. CHAPINEL SPEED0. ' IS
WAvt HEIC041 AT ORIIGIN4 191#31,32WAVE. HEIGHT AT STA. 4 1.435234HEAVE 1.41709PITCH .14039VERJ. NOiT, AT STAo 4. 10.40660MUM AT STA. 4 2,19186
6 VERY: ACC, AT CGER .V 04349
yEA!. ACCo AT 00W (FI'
MIiAT We4ICMRH/I 12.6'41/J AT WHICH I~ml~uu (FEET) 171?
WAyt. HEIGwT AT ;)11bjIe4 1.46770WAVt 'lEii,.4 AT STA. 4. 1.468"8HEAVE 1 .6e,197PI TCH .4.0017vEPI. HI)T* At STA.1.48
8 0484 AT STro 2Plsl
VEQI. ACC, AT CG.0463VEto. ACC. AT '40w (Fo~il0&tb
911/I AT WHICH Rolbm/Cal 1107"]1/I AT WHICH ItHM/tJ3 (FEET) 16.1
WAyt MEIGMY AT Ow'1"1% 1.4.7176WAVE 94E1'.,.T AT %TAo 4. 104.7217ME AVt I .bv633PITCH 101 6b5.2VERT* 14OTo AT STA. to 2.21sb15Q014 AT STA. . 203199010 VEDT. ACC. AT STEQNIi AP) .034.55VERI. ACCo AT C6, 003511VERT. ACC. AT iMOW FPPi o031016
MI/i AT wHICH 04mtCaI 12o2MI/i AT 0041CH R1M/DUI (FEET) 16,7
WAyt. "EIGHT At ORIGIN 1.49328WAvt. 0EIGm? AT STA. 4. 104936604EAVE 1.51675PITCH 1 .659saVEST. MOTe AT SIA. 4 '.5e
"104U AT STA. 2.00030914 VEST. ACC. AT STERN (AP) .01926vEST. ACC, AT C6, .021?6VERT* ACCe AT HUM IFI'3 003032
HI/i AT WHICH RMI41Ca1 14.1'41/i AT WHICH SR14tDu1 (FEET) 19.4
57

TABLE 8 - RMS RESPONSES, OF SHIPl E. 20KNOT SWATH
".kai SEAS LP-#)u P00.0 IFEET
".j.1z 6. FffýT CLEAwar4CLe C a le.LQ Ff~fT
C~a~tLSPEU I
SEC. P. TS%.ST I1, O"7; ZU. .
WAVL -th.9'I AT owlIN.' 193~ L1d.Jh3j I1.30)121
44VL *A1IAT iTA. 1 1 .Jj7Q 1.1-3441 uI ~ n
P1T- 4 I 71f ,ejo%,161. .1 514
vF:; I. duvT. AT riTA. *#b *.i(je 7 .*j 3s~.
6 Q AT ',FA* 1.Io/u3 1, 3#Q4. ok*4137ul'.
VE -aI . ACC. &T STEwdN IA-) *deodueii1 .02'.3 .()1"7vF 0 1. &CC. AT C- r.u 111 1 .u IeMb .0231r 021A
07 1 4CC. Al *it; fFP) we4?uie53 r449
/i -IT i-IC- ' -/C=i I,2 u.e 2ij.'kjv*
I-41~ .4, a-iIc. z)-4-/ =ij (FEET) ?S, 3J.1 33.3
1 "4 .. j*. i' - '"
~ Av--" ,- t 4 *.-Ah*, .-
,%4~A V-~A d '
~- * "-'"' *eu4
-1 ~ -
-~ . -- '*~WEET) I. '.
qav! I* * .
A . * . .'4A.-"I.- I* ' '
.-. j.. ,: 1 FEET) I4I.
14~-A Vo .. C 41 F e I 1' I-
10o I. bic(. at .1. -I .-. i -i vuekl.
-'I - ''. -A* FEET) *I. ?I*I ~ *
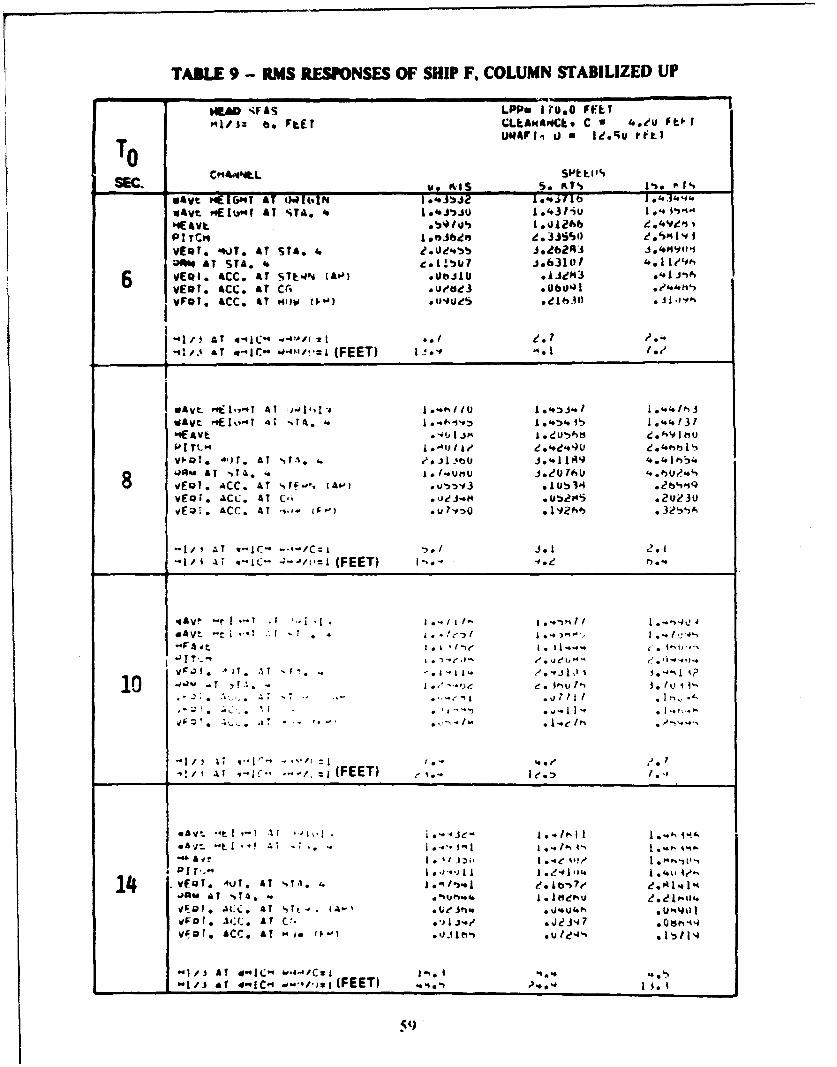
TABLE 9 - RMS RESPONSES OF SHIP F, COLUMN STABILIZED UP
W,"* ;F As LPPu i?v.O FVLT"W"J2s be Ftfr CLiAmAICko C 9 '..eu Ft~1
To uwArfim u a Ied.cu pfktl
SEC v PK81 So KTS %w~yt MIZGCA AT t0sflt-IPE I.'.,jzJ i...il1b1.3w~vt vsiEltjPf AT STA. '. 1.'.S3ju 1.4.3fiU Id -.
PITC" 100364" e . 3 ~issuS svEar. 4%)T. AT STA. 4 f .)1 JsbA ,M1104" AT STA. . se.1T!bu7 .s.63101 ol74
6 VEQI, ACC. AT s~tsoN (AO) ssUbJlb *ijdH#3 '1J
VEOT. &CC. AT CA, ou~eal .0601 .44h
vFaT. &CC. AT ,4ow cg') owoues .,e1hmij
-Ill /.4 AT a-.ic- -i.4P!l, (FEET) I 0ie0 lee,
9E AVE .~I JMK1e,6 ~ ~
Vf Q I. -40r. AT I~.¶ ýsb J.41189
W6AM AT *,TA. o. jssf.umU J*01eU
vEol. .1CC. AT I , i A'.) sWs131u5vFal. .1Cc. AT c" . U d.e J# .U524S .2tu?30E47. &CC. AT "'- to;-,) .lO.19206'
-1/ 1T sm- ic-. 4-41t-L (FEET) I Me - -Ose
-OAy, -r j I*I*.( I ~
I ist-- T ..1T ,"-ý
VCJI. ~ ~ ~ ~ ~ ~ ~ e lpv 1T* .T F* .- - e -. a' i..i il-
-1/ ~ y*'~ *s/Ito. -9se
-. t ~- .v. -I -al 4FET -. *.. oq.ý
14 vfa . qv.jy AT -%Tis f.1 I '4,e A141.JfW AT -%tA ,-9oUfte,.a 1.tfiefe 2.?.II M114Vkia. ACC. AT Sft-. iA.- .tiejma. .%j.6u46h . upia)IvjaF. .1CC. At C'. vua. 1 J41 .0 tt,-%v~af. &CC. AT - sa rF-j .u/e L t~,
141/ AT4-IL --- 4 / a 5 I
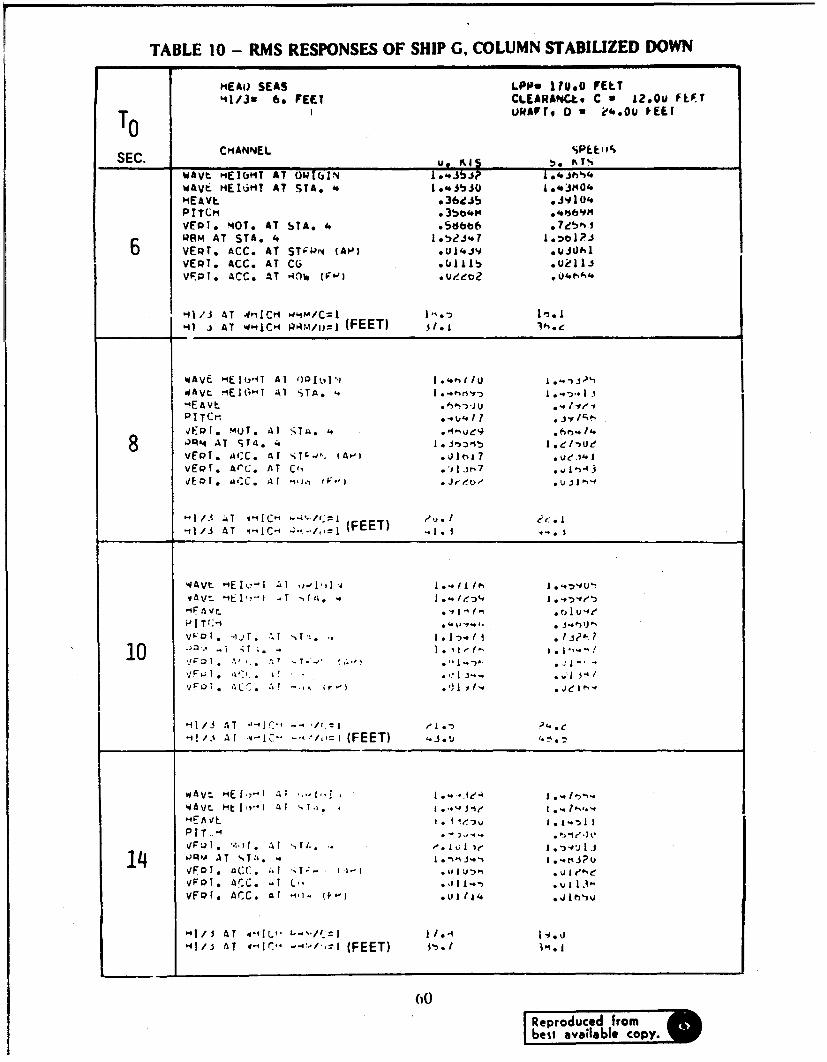
r TABLE 10 - RMS RESPONSES OF SHIP G. COLUMN STABILIZED DOWN
HEWl SEAS LFPP 110*0 FELT411/3s 6. FEET CLEARAt4Cts. C a 12*Ou FLFT
To UIEAFr, 0 a ?4.Ou PEET
SEC. CHIANNEL u P E.IPT
WAVt "EIGH9T AT OldcilN 1...Jbi? ,hSWAVt. HE1d64T AT STA. 4 .40 530 fj"0'IEAVL 936ieJ¶ *JY104PITCH .3b04144VER0T* MOT. AT STA. 4. .5sibt66SM AT STA. 4. 1.132J.076 VR.ACC. AT STPPN (Al"! *UI'.JY U~johVERT. ACC. AT CUi O1u11! oui~11JVFNPT. ACC. AT A3%) (VFl .ueet)2Uf6S
'41/3 AT 4'iICH g.Im/C=t [ . -o.,3'41 J AT W"IC"- P14M/9)=I (FEET) 31.
WAvE. H-EJt,4 A] 'l01,lj 1-qfi4AVr. '4EImT Al STA. ..- 'ri
-'EAvt .',o.,-3,j UPITCrl *..ij'..7 *aI I;e.,vjp[* %,T. Al STU. 4. *'n.14~
8 1:3 T T4 ite,Uei-
VERT. ArC. AT C(, ..o ,)-3
qF 0 1. MIXC. AT 'i.. (Pjef0-) I"
-13 T v.t1C" -4. =1 ieI-l3AT .-1-icH-.IZ (FEET) 5
*A: ACO.ý- AT fn. -)- v1 fl
v~,. i Ar -- iz> -,T/~ (FEET '.i6
10 . , I-; AT 4-' .I . A, IT T -
PIT-ij .- P,*.-
14 /JR' AT T!..
A-1sft -~IC- (FEET) 1. %
w~~~vbes avilbl copy. 1-, ~Jl

-r C C-4 0
In M N r C C N
W O CO In
U.1 ~ . N ' -t N R
Z S 0 00 C q en
v CN M C4) CO
Lim _ _ _ _ _ _l C
C c C LO ) _
n 07 ri s 0 qn Cyi Ocq
CCO N- CO P. SNO CO le
z( Sn en mD r4 CD "0C 0
P- Sn Cr 4 Nr 4 Irn N~ C6 U)
w N Ný -i N N - N
(0 N0 Sn 0l'I COR U OR- fi-m -4 m N n
Ga
4 CO P. t U ý Sn CO V4 . COS!
W Sný C)L n I": --
Ln 0n IT C4 Ln Sn 4 S Cm
U., .- N -
"t 0R q 'O LP -a.' '
- V C4 P. n C,4 -T w~ -I C4 -
Wr CO4 U C N On 04Sr.-0 - - (
0 2
0O X S.9 OO x S.0 03
2
-L -;
M C4
.e cc ' 00