distributed debugger for as/400 - inf.fu-berlin.de · chapter 1. the ibm distributed debugger for...
TRANSCRIPT

IBM VisualAge® for Java™, Version 3.5
Distributed Debugger for AS/400
���

Edition notice
This edition applies to Version 3.5 of IBM VisualAge for Java and to all subsequent releases and modifications untilotherwise indicated in new editions.
© Copyright International Business Machines Corporation 1997, 2000. All rights reserved.US Government Users Restricted Rights – Use, duplication or disclosure restricted by GSA ADP Schedule Contractwith IBM Corp.
Note!Before using this information and the product it supports, be sure to read the generalinformation under Notices.

Contents
Chapter 1. The IBM DistributedDebugger for AS/400 . . . . . . . . . 1Distributed Debugger: Overview . . . . . . . 1
Distributed Debugger: Panes . . . . . . . . 1Distributed Debugger: Monitors . . . . . . . 2
When to attach . . . . . . . . . . . . . 3Source views . . . . . . . . . . . . . . 4Secondary threads in the debugger . . . . . . . 4Optimized code debugging . . . . . . . . . 5Search order . . . . . . . . . . . . . . 5
Chapter 2. Preparing a program fordebugging. . . . . . . . . . . . . . 7When you start debugging . . . . . . . . . 7Writing a program for debugging . . . . . . . 8Compiling a program for debugging . . . . . . 8Starting or stopping the debug server . . . . . . 9
Starting the debug server . . . . . . . . . 9Ending the debug server . . . . . . . . . 9
Setting up a debug session . . . . . . . . . 9Preparing for debugging . . . . . . . . . 9Setting the debugger port. . . . . . . . . 10Specifying parameters when starting the hostprogram to debug . . . . . . . . . . . 10Specifying the name of the debug host . . . . 11Setting the library list and current library . . . 11
Chapter 3. Starting the debugger . . . 15Loading a program into the debugger withoutspecifying a job . . . . . . . . . . . . . 16
Loading a program without specifying a job froma command line . . . . . . . . . . . . 16Loading a program without specifying a job fromthe debugger user interface . . . . . . . . 17
Attaching to an existing job on an AS/400 . . . . 17Attaching to an existing AS/400 job from acommand line . . . . . . . . . . . . 17Attaching to an existing AS/400 job from thedebugger user interface . . . . . . . . . 18
Starting the Distributed Debugger user interfacedaemon . . . . . . . . . . . . . . . 19Starting the debugger for a threaded application . . 20Starting the debugger for a non-threaded ILE orOPM application . . . . . . . . . . . . 20idebug command . . . . . . . . . . . . 21
Chapter 4. Using the IBM DistributedDebugger for AS/400. . . . . . . . . 27Setting and working with environment variables . . 27Setting the Java CLASSPATH . . . . . . . . 28Working with programs . . . . . . . . . . 28
Adding a program to the Programs pane . . . 28Using the Programs pane . . . . . . . . . 29
Setting the display of program information . . . . 30
Changing views in the Source Pane . . . . . 30Viewing different source . . . . . . . . . 30
Locating source code . . . . . . . . . . . 31Locating source code written in C++ . . . . . 31Locating source code written in ILE/OPMlanguages . . . . . . . . . . . . . . 32Locating source code written in Java . . . . . 32Viewing the contents of the Call Stack . . . . 33Controlling program execution . . . . . . . 33Working with threads . . . . . . . . . . 36Inspecting variables . . . . . . . . . . 37Working with the debugger user interface . . . 43
Breakpoints . . . . . . . . . . . . . . 44Line breakpoints. . . . . . . . . . . . 45Watch breakpoints . . . . . . . . . . . 45Characteristics of watches . . . . . . . . 46Thread-specific and job-wide line breakpoints . . 47Setting Breakpoints . . . . . . . . . . . 47Viewing set breakpoints . . . . . . . . . 50Modifying line breakpoint properties . . . . . 51Enabling and disabling breakpoints . . . . . 52Deleting a breakpoint . . . . . . . . . . 53
Debugging servlets, EJB, and JSP . . . . . . . 54Debugging servlets, JSP, and EJB . . . . . . 54Setting up WebSphere Application Server V3.02for debugging servlets, EJB, and JSP . . . . . 55Setting up WebSphere Application Server V3.5for debugging servlets, EJB, and JSP . . . . . 56Setting up the client machine for WAS 3.02 andOLT for servlet, EJB, and JSP debugging. . . . 56Setting up the client machine for WAS 3.5 andOLT for servlet, EJB, and JSP debugging. . . . 61Preparing servlets, EJB, and JSP for debugging 66An EJB example . . . . . . . . . . . . 66A servlet example . . . . . . . . . . . 67A JavaServer Page example . . . . . . . . 68
Reference information . . . . . . . . . . . 73Debug data and RPG, C, Cobol, and CL compileroptions . . . . . . . . . . . . . . . 73ILE C++ compiler options . . . . . . . . 74Java compiler options . . . . . . . . . . 74Creating a Java program from a Java class . . . 75Debugger environment . . . . . . . . . 75Environment variables. . . . . . . . . . 76Stepping . . . . . . . . . . . . . . 77Program name specifications . . . . . . . 78Job name specifications and getting a job list . . 78Job types . . . . . . . . . . . . . . 79Authorities required for debugging . . . . . 80Debugger limits . . . . . . . . . . . . 80Debugger performance considerations . . . . 81Expressions qualified to thread number . . . . 82Problems getting a Source or Listing view . . . 82Values that are valid for the currentrepresentation . . . . . . . . . . . . 83Previous load program methods . . . . . . 83
© Copyright IBM Corp. 1997, 2000 iii

Notices . . . . . . . . . . . . . . 85
Programming interface information . . 87
Trademarks and service marks . . . . 89
iv AS/400 Debugging

Chapter 1. The IBM Distributed Debugger for AS/400
Distributed Debugger: OverviewThe IBM Distributed Debugger is a client/server application that enables you todetect and diagnose errors in code developed with AS/400 Integrated LanguageEnvironment (ILE) and Original Program Model (OPM) languages and Java. Thisclient/server design makes it possible to debug applications running on an AS/400machine while the debugger user interface is running on a Windows workstation.
The debug server runs on the same system as the program you want to debug.When you start the debugger, you have the option of loading a program withoutspecifying a job or attaching to an existing job on the AS/400. When you load aprogram without specifying a job, the debugger creates a job on the AS/400 foryou.
The Distributed Debugger client is a graphical user interface where you can issuecommands used by a debug engine to control program execution. For example,you can run your program, set breakpoints, step through program instructions,examine variables, and examine the call stack. The Distributed Debugger userinterface lets you debug multiple applications, which may be written in differentlanguages, from a single debugger window. Each program you debug is shown ona separate program page with a tab on each page displaying programidentification information such as the name of the program or a job beingdebugged.
Each program page is divided into sections, called panes. Each pane displaysdifferent information about your program. There are panes to display your sourcecode, breakpoints, the program’s call stack, and various monitors.
For more information on the panes and monitors available in the DistributedDebugger user interface, see the related topics below.
Distributed Debugger: PanesDistributed Debugger: MonitorsWhen to attach
Preparing for debugging
Distributed Debugger: PanesThe following panes are available in the Distributed Debugger user interface.
Stacks paneThe Stacks pane provides a view of the call stack for each thread in the programyou are debugging. Each thread in your program appears as a root node in a treestructure. Expand a node to display the names of the functions on the call stack forthat thread.
If the Stacks pane is not in view, select View from the menu bar. The Stacks paneis in view when the Control Panes option in the View menu is checked.
© Copyright IBM Corp. 1997, 2000 1

Breakpoints paneThe Breakpoints pane provides a view of all breakpoints that you have set for thedebug session. Line Breakpoints appears as a root node in a tree structure if yourprogram contains line breakpoints and Watch Breakpoints appears as a root nodeif your program contains watch breakpoints. Expanding a node will display a listof the breakpoints of the corresponding type.
Use the Breakpoints pane to view breakpoints that have been set in your programor delete them. You can also use the Breakpoints pane to modify the properties ofline breakpoints.
If the Breakpoints pane is not in view, select View from the menu bar. TheBreakpoints pane is in view when the Control Panes option in the View menu ischecked.
Programs paneThe Programs pane displays a list of Programs, Service Programs and Java classesunder debug in the current debug session. Each program appears as a root node ina tree structure. You can expand the program nodes to show modules, source filesand procedures or functions.
If the Programs pane is not in view, select View from the menu bar. The Programspane is in view when the Control Panes option in the View menu is checked.
Source paneThe Source pane provides various debug views of the program you are debugging.You have up to three choices for viewing your program, if it was compiled withthe appropriate debugging information: Source view, Listing view, or Statementview. To display a Source view, the source file must be available on the AS/400 orlocally.
For Java classes, the Source and Statement views may be available.
If the Source pane is not in view, select View from the menu bar. The Source paneis in view when the Source Pane option in the View menu is checked.
Distributed Debugger: MonitorsDistributed Debugger: OverviewSource views
Changing views in the Source paneViewing the contents of the Call Stack
Problems getting a Source or Listing view
Distributed Debugger: MonitorsThe Distributed Debugger provides you with two monitors to monitor variables ina program. You can select a monitor from the Distributed Debugger user interface.
Variables and Expressions (Monitors pane)The Monitors pane shows variables that you have added to it. You can add
2 AS/400 Debugging

variables to the Monitors pane by opening a dialog box or by selecting them fromthe Source pane. Use the Monitors pane to monitor global variables or variablesyou want to see at all times during your debugging session. From the Monitorspane you can also modify the content of variables or change the representation ofvalues.
If the Monitors pane is not in view, select View from the menu bar. The Monitorspane is in view when the Value Panes option in the View menu is checked.
Tip: Enabling Tool Tip Evaluation for variables provides a quick way to view thecontents of variables in the Source pane. When you point at a variable, a pop-upappears displaying the contents of that variable. If Tool Tip Evaluation is disabledand you want to enable it, see the related topic below.
Local Variables (Locals pane)The Locals pane helps you monitor all local variables in scope at the currentexecution point of your program. For multithreaded programs, each thread is listedand can be expanded to show the local variables in scope for that thread. TheLocals pane is updated after each Step or Run command to reflect which variablesare currently in scope and the contents of those variables. It can also be used tochange the content of variables.
If the Locals pane is not in view, select View from the menu bar. The Locals paneis in view when the Value Panes option in the View menu is checked.
Distributed Debugger: OverviewDistributed Debugger: Panes
Adding a variable or expression to the Monitors paneChanging the contents of a variable or expressionEnabling and using Tool Tip Evaluation for variables
When to attachYou may choose to attach to an existing AS/400 job if you are debugging anapplication in that specific job. In so doing, you can have complete control overthat job and the application in the job can be running or not running.
Another reason you may want to attach to an existing job is that you anticipate aproblem at a particular point in your program, and you do not want to stepthrough the program or set breakpoints. In this situation, you can run yourprogram, and at a program pause shortly before the anticipated failure (forexample, while the program is waiting for keyboard input), you attach thedebugger. You can then provide the input, and debug from that point on.
Finally, attach to an existing job if you are developing or maintaining a programthat stops responding sporadically, and you want to find out why it stopsresponding. In this situation, you can attach the debugger, and look for infiniteloops or other problems that might be causing your program to stop.
To attach to an existing AS/400 job, you need to supply the job number.
Chapter 1. The IBM Distributed Debugger for AS/400 3

Starting the debuggerAttaching to an existing AS/400 job from a command lineAttaching to an existing AS/400 job from the debugger user interface
Source viewsIf your program was compiled with the appropriate debugging information, youhave up to three choices about how to view it in the Source pane.
Source ViewSelect Source > Source View to switch to a Source view of the program beingdebugged. This view displays the source code for your program.
If the program was compiled with Source debug view, but the source file cannot belocated, a dialog box prompts you for the location of the source file on theworkstation. If you click Cancel in the dialog box, the debugger will look for theListing view. (A Listing view is available for OPM or ILE programs that have beencompiled with the corresponding compiler option.) If the Listing view isunavailable, the Statement view is displayed.
Note: Whether the Source view is available or not depends on the compiler optionsthat you used to create debug information.
Listing ViewSelect Source > Listing View to switch to a Listing view of the program beingdebugged. This view displays a compiler-generated listing of your program. TheListing view includes Copy files.
Note: Whether the Listing view is available or not depends on the compileroptions that were used to create debug information.
Statement ViewSelect Source > Statement to switch to a statement view of the program beingdebugged. This view displays the statement number for each executable statement,as well as the name of the procedure to which the statement belongs.
Changing views in the Source paneLocating source code
Problems getting a Source or Listing view
Secondary threads in the debuggerYou can load a multithreaded application into the debugger without specifying ajob or attach to it when it is in an existing job.
A threaded job consists of one job and one or more threads. The initial thread iscreated during the creation of the job. Other threads, called secondary threads, arecreated by the application using a thread create API.
On start-up, the debugger will stop in the initial thread at the first executablestatement if debug data is available.
4 AS/400 Debugging

The debugger will display the source for the initial thread and you will be able toset breakpoints in the initial thread or in functions or procedures that will run insecondary threads within this job.
When a thread is stopped because a step is completed, a breakpoint is hit, a watchcondition is satisfied, or an unmonitored exception is received, the debugger willhalt all other threads running in this job. The debugger displays the stoppedthread’s source and highlights the current line of execution for that thread.
Issuing a step or a run command will resume the program. The thread that isdisplayed in the Source pane will have the highest priority and its next step willbe signaled first.
Debugging multithreaded applicationsStarting the debugger for a threaded applicationUsing the Stacks pane
Optimized code debuggingGenerally, the higher the optimization level, the more efficiently your programruns. However, if the program you are debugging is optimized, the value ofdisplayed variables may not be current.
While debugging your code, set the optimization level to the minimum level. Thisallows you to accurately display and change variables. After you have completedyour debugging session, set the optimization level to the maximum level. Thisprovides the highest levels of performance for the procedures in the program. Seeyour compiler documentation for details on specifying optimization levels.
Note: Even at optimization level *NONE, some optimization may be done incertain cases that could affect the debugger’s ability to accurately display theprogram’s stopped location.
Writing a program for debuggingCompiling a program for debugging
Debug data and RPG, C, Cobol, and CL compiler optionsILE C++ compiler optionsJava compiler options
Search orderThe debugger searches for sources for a program to be debugged on the AS/400 inthe following locations, depending on the format you use to specify the programname in the Specify the name of the program to add to debug entry field of theLoad Program dialog box:
Library/program The debugger searches the specified libraryfor the program. If it does not find theprogram in the specified library, an errormessage is displayed.
Chapter 1. The IBM Distributed Debugger for AS/400 5
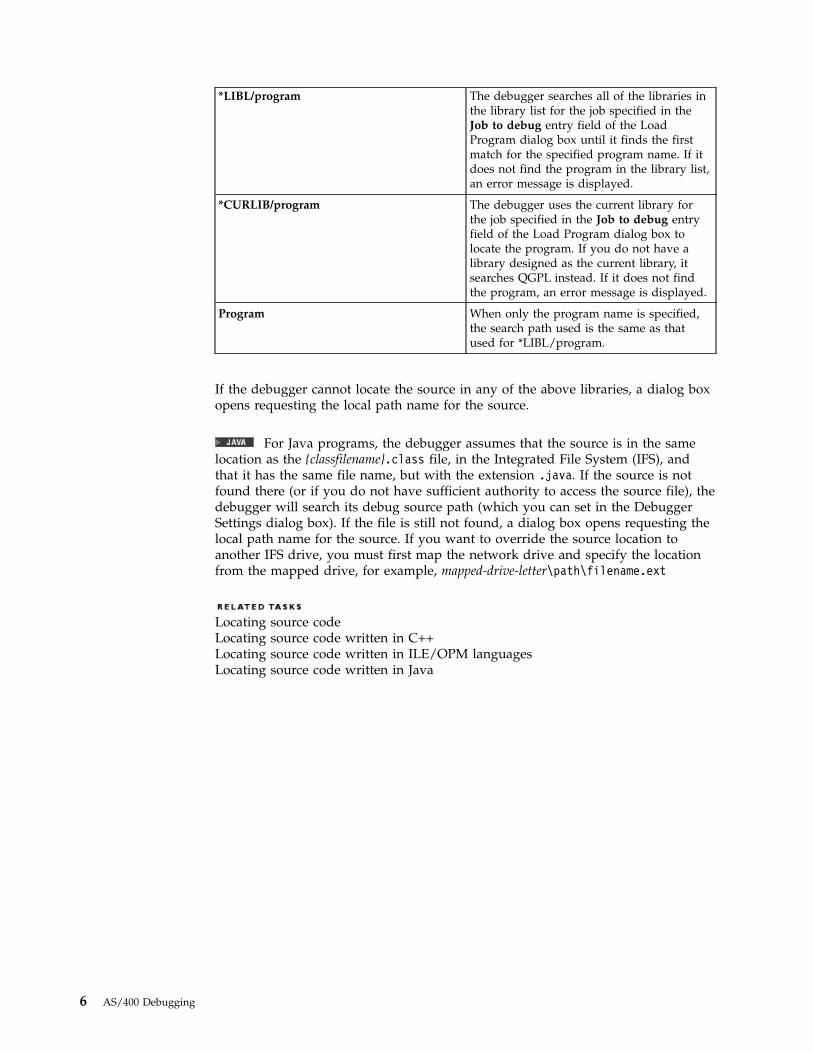
*LIBL/program The debugger searches all of the libraries inthe library list for the job specified in theJob to debug entry field of the LoadProgram dialog box until it finds the firstmatch for the specified program name. If itdoes not find the program in the library list,an error message is displayed.
*CURLIB/program The debugger uses the current library forthe job specified in the Job to debug entryfield of the Load Program dialog box tolocate the program. If you do not have alibrary designed as the current library, itsearches QGPL instead. If it does not findthe program, an error message is displayed.
Program When only the program name is specified,the search path used is the same as thatused for *LIBL/program.
If the debugger cannot locate the source in any of the above libraries, a dialog boxopens requesting the local path name for the source.
For Java programs, the debugger assumes that the source is in the samelocation as the {classfilename}.class file, in the Integrated File System (IFS), andthat it has the same file name, but with the extension .java. If the source is notfound there (or if you do not have sufficient authority to access the source file), thedebugger will search its debug source path (which you can set in the DebuggerSettings dialog box). If the file is still not found, a dialog box opens requesting thelocal path name for the source. If you want to override the source location toanother IFS drive, you must first map the network drive and specify the locationfrom the mapped drive, for example, mapped-drive-letter\path\filename.ext
Locating source codeLocating source code written in C++Locating source code written in ILE/OPM languagesLocating source code written in Java
6 AS/400 Debugging
Chapter 2. Preparing a program for debugging
When you start debuggingRestriction: When you select the File menu from the menu bar, only the LoadProgram option applies when debugging on the AS/400. In the File menu, ProcessList and Attach to JVM are not applicable when debugging on the AS/400.
The first time you start the debugger, the main debugger window opens alongwith the following, depending on how the debugger was invoked:v The Load Program dialog box opens if the idebug invocation command is used
without the parameters that are necessary for loading a program withoutspecifying a job or attaching to an existing AS/400 job. For information aboutloading a program into the debugger without specifying a job or attaching to ajob, please see the related topics below.
v If the Debugger AS/400 Logon dialog box opens, specify your AS/400 user ID,password, and TCP/IP address of the AS/400 host.
v If you are loading a program without specifying a job, the debugger starts theprogram for you and a Source pane appears for the program. Depending on thecompiler options used, the Source pane contains either a Source, Listing, orStatement view of the module that contains the entry procedure of yourprogram.
v When attaching to a job, if you select Step Into, you will be asked to start yourAS/400 application after clicking the Load push button. If you do not selectStep Into, you will be able to view the source, add new programs or classes fordebugging, and set breakpoints after clicking the Load push button. If you clickthe Run push button in the main debugger window, a message will prompt youto start your AS/400 application. At this point, you will need to invoke theapplication on the AS/400 if is not already running. Once the application isrunning, click the message dialog’s OK button. The application will stop at thefirst breakpoint in the code.
v
The AS/400 Java Console window, if you are loading a Java class into thedebugger without specifying a job.
When you start debugging a program for the first time, no breakpoints are set andno variables are in the Monitors pane. During the debug session, you may setbreakpoints, and add variables or expressions to a monitor. When you exit thedebugger, these breakpoints, variables and expressions are saved in the programprofile. The next time you start debugging the same program, these settings willapply if you select Use program profile in the Load Program dialog box.
Preparing for debuggingStarting the debuggerLoading a program without specifying a job from a command lineLoading a program without specifying a job from the debugger user interfaceAttaching to an existing AS/400 job from a command lineAttaching to an existing AS/400 job from the debugger user interface
idebug command parameters and options
© Copyright IBM Corp. 1997, 2000 7

Writing a program for debuggingTo make your programs easier to debug, follow these guidelines:v Avoid putting multiple statements on a single line. Some Distributed Debugger
features operate on a line basis. For example, you cannot step over or set linebreakpoints on more than one statement on the same line.
v Assign intermediate expression values to temporary variables so you can verifyintermediate results by monitoring the temporary variables.
v If you have a bug in a complex expression, you can debug the expression moreeasily by breaking it down into intermediate values and by assigning thosevalues to temporary variables. This allows you to verify each expression andvariable. For example, you will not be able to display the substrings of IStringobjects in the first C++ code fragment below, but you will in the second:
// Can't see the substrings in this oneif (StrA.subString(x,y)==StrB.subString(m,n)) dups++;// Can see the substrings hereIString SubA=StrA.subString(x,y);IString SubB=StrB.subString(m,n)if (SubA==SubB) dups++;
v To debug programs at the level of source code statements, you must specify thecompiler options that generate debug information. In some cases, you mustspecify additional options that enable the debug engine to work properly withyour code.
Optimized code debugging
Compiling a program for debugging
Debug data and RPG, C, Cobol, and CL compiler optionsILE C++ compiler optionsJava compiler options
Compiling a program for debuggingIn order to debug your program at the source code level, you must set certaincompiler options to generate symbolic information and debug hooks in the objectfile. For more information about compiling each language, see the relatedreferences below.
Language Compile using...
OPM COBOL or RPG either the *SRCDBG or *LSTDBG option.
OPM CL the *SRCDBG option.
ILE COBOL, CL, or RPG the *SOURCE, *LIST, *STMT, or *ALLoption. The default is *STMT (Statementview).
ILE C the *SOURCE, *LIST, *STMT, or *ALLoption. The default is *NONE (no debugdata).
See your compiler documentation for more details on these compiler options.
8 AS/400 Debugging
Optimized code debugging
Writing a program for debugging
Debug data and RPG, C, Cobol, and CL compiler optionsILE C++ compiler optionsJava compiler options
Starting or stopping the debug server
Starting the debug serverBefore you can use the debugger, the debug server must be started on the AS/400.Type the Start Debug Server (STRDBGSVR) command on an AS/400 command lineand press Enter.
Note: The debug server needs to be started only once, for the AS/400 system onwhich you are planning to debug your application. If the debug server has alreadybeen started previously, you will see the message “Debug server router functionalready active”, when you issue the STRDBGSVR command.
Preparing for debugging
Ending the debug serverTerminating a debug session
Ending the debug serverNormally, you do not end the debug server at the end of your debug session,because the debugger is active for the entire AS/400 system.
If necessary, end the debug server using the End Debug Server (ENDDBGSVR)command on an AS/400 command line.
This prevents any new debug sessions from starting.
Starting the debug serverTerminating a debug session
Setting up a debug session
Preparing for debuggingBefore you can start debugging an AS/400 application, you may need to performsome or all of the following tasks:v Compile a program with debug data.v Start the debug server.v Start a debug session.
Chapter 2. Preparing a program for debugging 9

v Set the debugger port.v Change the debugger settings.v Ensure that your AS/400 user profile has the appropriate authorities.
For information about these tasks, see the related information below.
Distributed Debugger: Overview
Compiling a program for debuggingStarting the debug serverSetting the debugger port
Authorities required for debuggingDebugger environment settings
Setting the debugger portBy default, the debug server is set up to listen for connection requests on TCP/IPport 3001. If port 3001 is being used by another application, you can designateanother port:1. Use the Work Server Table Entry (WRKSRVTBLE) command on the AS/400
debug host and change the port called QDBGSVR to the new value. Note:Before changing the port, end the debug server by using the End Debug Server(ENDDBGSVR) command. Then change the port and start the debug serveragain.
2. To sign on to the AS/400 debug host for the first time, specify the new port inthe Host Name entry field of the Debugger AS/400 Logon dialog box ashostname:portnumber, where hostname is the name of the AS/400 system onwhich you want to run the application to be debugged, and portnumber is thenew value of the QDBGSVR port.
3. When the Load Program dialog box appears, press the Advanced push button.4. Change the Port Number setting in the Session Settings group of the
Debugger Settings dialog box to match the port specified on the AS/400WRKSRVTBLE command.
Starting the debuggerLoading a program without specifying a job from the debugger user interfaceAttaching to an existing AS/400 job from the debugger user interfaceSpecifying the name of the debug hostTerminating a debug session
idebug command parameters and options
Specifying parameters when starting the host program todebug
When you load a program without specifying a job name, the debuggerautomatically creates a job and invokes the program in that job. You need tosupply all parameters required to invoke the program, in the Enter any programparameters field of the Load Program dialog box.
10 AS/400 Debugging

When you attach the debugger to an existing AS/400 job, specify programparameters from the AS/400 command line when you start the program on theAS/400. To pass parameters to your program from an AS/400 command line, usethe PARM option of the CL CALL command. The syntax for this command is:CALL PGM(program-name) PARM(program-parameters)
where program-name is the name of the program that you want to debug, andprogram-parameters are the arguments or parameters you want to pass to yourprogram.
You can also type the parameters without specifying any keywords:CALL library/program-name (program-parameters)
Preparing for debuggingStarting the debugger
Specifying the name of the debug hostYou can specify the name of the debug host to which you want to connect in oneof the following ways:v Through the debugger invocation parameter -e<hostname:port>, where
specifying port is optional.v In the Session Settings group of the Debugger Settings dialog box.v In the Debugger AS/400 Logon dialog box.
Note the following precedence rules:v If you invoke the debugger with the idebug -qengine=400 -e<hostname:port>
command, hostname:port is used to connect to the debug host.v If you invoke the debugger from the debugger icon or from the command line
without the -e<hostname:port> parameter, the hostname saved in the DebuggerSettings dialog box will be used. If you have not saved a hostname, you mustspecify the name of the debug host in the Host Name entry field of theDebugger AS/400 Logon dialog box.
Starting the debuggerLoading a program without specifying a job from the debugger user interfaceAttaching to an existing AS/400 job from the debugger user interfaceSetting the debugger portTerminating a debug session
idebug command parameters and options
Setting the library list and current librarySet the library list and current library to specify the libraries the debugger shouldsearch to locate programs on the AS/400 when called from a Java application or abatch immediate (BCI) job. The current library is the first library to be used whendebugging. Library settings are made in the Debugger Settings dialog box.
The Debugger Settings dialog box will not close if you specify incorrect values in itand click the OK push button. For example, the dialog box will not close if youenter a library name that is longer than 10 characters or contains blanks. All fields
Chapter 2. Preparing a program for debugging 11

which contain an error will be marked in red. Tool Tip Evaluation will give detailswhen you position the cursor over the field containing the entry.
When debugging Java, the JNI library list and current library are set whenspecifying JVM creation settings. The JNI library list and current library are usefulwhen debugging Java applications that make JNI calls.
Setting the library listTo view the library list, do the following:1. Select File > Load Program from the menu bar to invoke the Load Program
dialog box.2. In the Load Program dialog box, click the Advanced push button to invoke the
Debugger Settings dialog box.3. In the Debugger Settings dialog box, do one of the following:
v If you are debugging a Java application, select JVM Creation Settings > JNILibrary List.
v If you are debugging a batch immediate (BCI) job, select Batch Job CreationSettings > Library List.
4. The Library List in the Debugger Settings dialog box will contain the first 20AS/400 libraries that were specified the last time you debugged an application.If no libraries were specified, the list will contain no libraries by default.
Entries in the Library List in the Debugger Settings dialog box can be added,modified, or deleted as follows:v To add a first library in the library list, click on the first Library List cell field
and make the appropriate entries. To add additional libraries, press the keyboardInsert key to create rows for as many libraries as you wish to add and make theappropriate entries.
v To edit library names, click on the appropriate table cell if it is highlighted ordouble-click on the appropriate cell if it is not highlighted, and change the cellcontents.
v To delete a library from the library list, select the appropriate row, and press thekeyboard Delete key.
Entries in the library list table can be reordered by dragging and dropping rows.
When the Library List has been set as desired, click OK to set the list and dismissthe Debugger Settings dialog box.
Setting the current libraryTo set the current library, do the following:1. Select File > Load Program from the menu bar to invoke the Load Program
dialog box.2. In the Load Program dialog box, click the Advanced push button to invoke the
Debugger Settings dialog box.3. In the Debugger Settings dialog box, do one of the following:
v If you are debugging a Java application, select JVM Creation Settings > JNILibrary List.
v If you are debugging a batch immediate (BCI) job, select Batch Job CreationSettings > Library List.
4. In the Current Library entry field, enter the name of the library.5. Click OK to set the current library and dismiss the Debugger Settings dialog
box.
12 AS/400 Debugging
Search order
Starting the debuggerLocating source codeSetting and working with environment variables
Chapter 2. Preparing a program for debugging 13

14 AS/400 Debugging
Chapter 3. Starting the debugger
You can invoke the debugger from a command line, from VisualAge for JavaEnterprise Edition, from the CODE Editor, from the CODE Project Organizer, or byclicking the debugger icon.
Starting the debugger from a command lineTo start the debugger from a workstation command line, use the idebug invocationcommand. Depending on options and parameters used with this command, youcan load a program for debugging without specifying a job or attach to an existingjob on an AS/400. For information about loading a program for debugging from acommand line or attaching to an existing AS/400 job from a command line, see therelated tasks below. For information about idebug options and parameters, see therelated reference below.
If you do not specify idebug options or parameters that are necessary to attach to ajob or load a program without specifying a job, you will be required to make thenecessary entries in the Load Program dialog box, once the debugger user interfaceis running.
You can also debug other programs using the same debugger session by selectingFile > Load Program from the debugger user interface menu bar.
Starting the debugger from VisualAge for Java Enterprise EditionWhen you wish to debug Java programs other than servlets, JavaServer Pages(JSP), and enterprise beans (EJB), start the debugger from VisualAge for JavaEnterprise Edition by doing the following:1. Ensure that the debug server is running on the AS/400.2. From the VisualAge for Java Workbench, select the project, package, or class
that you wish to debug.3. Right click and select Tools then ET/400 then Properties.4. In the AS/400 Properties dialog box, specify options to Export, Compile, and
Run if they are not already set. In Export Options, ensure that bothDebuggable Classes and Both Java and Class Files are selected. Click OK toclose the AS/400 Properties dialog box.
5. Right click and select Tools then ET/400 then Export to export the class andsource files to an AS/400 IFS directory, if the Java application you want todebug is not already on the AS/400 .
6. Right click and select Tools then ET/400 then Debug to start the debugger.
7. The AS/400 Java Console window and a Source view window open.8. You can now start debugging your program.
Using VisualAge for Java Enterprise Edition for servlet, JavaServer Page, andenterprise bean debuggingTo debug servlets, JavaServer Pages (JSP), and enterprise beans (EJB), please referto the related concept below. One step involved in debugging these web artifacts isstarting Object Level Trace (OLT) Viewer. You can start OLT Viewer by doing thefollowing in the Workbench:1. Ensure that you are using JDK 1.2.2.2. Ensure that the IBM Distributed Debugger for AS/400 has been installed and
that, upon its installation, Object Level Trace was installed.
© Copyright IBM Corp. 1997, 2000 15

3. In the VisualAge for Java Workbench, right click and select Tools > ET/400 >Start OLT viewer from the pop-up menu.
Distributed Debugger: OverviewDebugging servlets, JSP, and EJB
Loading a program without specifying a job from a command lineLoading a program without specifying a job from the debugger user interfaceAttaching to an existing AS/400 job from a command lineAttaching to an existing AS/400 job from the debugger user interfaceSpecifying the name of the debug hostTerminating a debug session
idebug command parameters and options
Loading a program into the debugger without specifying a job
Loading a program without specifying a job from a commandline
To start the debugger from a workstation command line and load a program fordebugging without specifying a job, do the following:1. Ensure that the debug server is running on the AS/400.2. Enter the debugger invocation command and parameters
idebug -qengine=400 program_name
3. To use additional options and parameters with this command, type:idebug -qengine=400 program_name xwhere x represents any number of optional debugger invocation parameters.
If the above parameters are not specified, the debugger will prompt you for therequired information in the Load Program dialog box. For information aboutloading a program without specifying a job from the debugger user interface, seethe related task below.
The presence of a dominant language is also mandatory when loading a program,however, if the -qlang=<dominant_language> parameter is not specified, thedominant language last used by the debugger will be assumed for the currentsession.
For information about optional debugger invocation parameters, please see therelated reference below.
Distributed Debugger: Overview
Starting the debuggerAttaching to an existing AS/400 job from a command lineSpecifying the name of the debug hostTerminating a debug session
16 AS/400 Debugging
idebug command parameters and options
Loading a program without specifying a job from thedebugger user interface
You can load a program for debugging without specifying a job during startup.
To load a program from the debugger user interface without specifying a job, dothe following:1. Select File > Load Program from the menu bar. The Load Program dialog box
appears.2. In the Load Program dialog box, enter the name of the program you want to
start for the debug session in the Specify the name of the program to add todebug entry field.
3. Enter optional debugger invocation parameters in the Enter any programparameters entry field. For more information on optional debugger invocationparameters, please see the related reference below.
4. If the dominant language to debug was not specified as a parameter wheninvoking the debugger, enter the language in the program language field, orchoose it from the list of language options in the field’s pull-down list.
5. Enter optional debugger session settings, JVM creation settings, or batch jobcreation settings in the Debugger Settings dialog box. The Debugger Settingsdialog box appears when you click on the Advanced push button in the LoadProgram dialog box.
6. Select the Load push button to load the specified program.
Starting the debuggerLoading a program without specifying a job from a command line
idebug command parameters and optionsDebugger environment settingsProgram name specificationsPrevious load program methods
Attaching to an existing job on an AS/400
Attaching to an existing AS/400 job from a command lineTo start the debugger from a workstation command line and attach to a job thatexists on an AS/400, do the following:1. Ensure that the debug server and job that you are attaching to are running on
the AS/400.2. Enter the debugger invocation command and parameters
idebug -qengine=400 -ajob_name3. To use additional options and parameters with this command, type:
idebug -qengine=400 -ajob_name xwhere x represents any number of optional debugger invocation parameters.
Chapter 3. Starting the debugger 17
If the above parameters are not specified, the debugger will prompt you for therequired information in the Load Program dialog box. For more information aboutattaching to an existing AS/400 job from the debugger user interface, see therelated task below.
The presence of a dominant language is also mandatory when attaching to anexisting job, however, if the -qlang=<dominant_language> parameter is notspecified, the dominant language last used by the debugger will be assumed forthe current session.
For information about optional debugger invocation parameters, please see therelated reference below.
Distributed Debugger: Overview
Starting the debuggerAttaching to an existing AS/400 job from the debugger user interfaceLoading a program without specifying a job from a command lineSpecifying the name of the debug hostTerminating a debug session
idebug command parameters and options
Attaching to an existing AS/400 job from the debugger userinterface
If you are attaching to a program that was writtenin C/C++, Cobol, CL, or RPG, then you are attaching to a job.
If you are attaching to a process that was written in Java, then you areattaching to a running Java Virtual Machine (JVM).
When you start the debugger, you can attach it to a process or JVM that exists onan AS/400 by specifying the job name associated with the process.
To attach to an existing AS/400 job from the debugger user interface, do thefollowing:1. Select File > Load Program from the menu bar. The Load Program dialog box
appears.2. In the Job to debug field, enter the job name that is associated with the process
that you wish to attach to. Alternatively, click the Job List push button toinvoke the Job List dialog box from which you can select the appropriate jobwhich is associated with the process you wish to attach to.
3. Entering the name of the program to debug in the program entry field isoptional.v If the program name is specified in this field, the program will be added as
an entry to the Programs pane. If the Step Into box is also checked, thedebugger will stop at the first debuggable statement which runs in the jobyou specified.
18 AS/400 Debugging

v If the program name is specified, running the program to termination willresult in debug session termination and invocation of the Load Programdialog box for a subsequent debug session.
v If the program name is not specified, running the program to terminationwill leave the debugger client waiting for a response from the server. In thiscase, the debugger must be manually terminated or restarted for additionaldebug sessions.
4. Enter optional debugger invocation parameters in the program parametersentry field. For more information on optional debugger invocation parameters,please see the related reference below.
5. If the dominant language to debug was not specified as a parameter wheninvoking the debugger, enter the language in the program language field, orchoose it from the list of language options in the field’s pull-down list.
6. Enter optional debugger session settings, JVM creation settings, or batch jobcreation settings in the Debugger Settings dialog box. The Debugger Settingsdialog box appears when you click on the Advanced push button in the LoadProgram dialog box.
7. If Step Into in the Select startup behavior control group is selected, you will beasked to start your AS/400 application after clicking the Load push button. If itis not selected, you will be asked to start your application only whenattempting to run the program in the debugger.
8. Select the Load push button to attach to the specified job.
When to attach
Starting the debuggerAttaching to an existing AS/400 job from a command lineRunning a program
idebug command parameters and optionsDebugger environment settingsJob typesJob name specifications and getting a job listProgram name specifications
Starting the Distributed Debugger user interface daemonStart the Distributed Debugger user interface in daemon mode if you want theDistributed Debugger user interface to appear only after you have started a debugengine.
To start the Distributed Debugger user interface daemon, issue the followingcommand at a command line prompt:
idebug -qdaemon -quiport=<port>
where <port> is the port number where you want the Distributed Debugger userinterface daemon to listen for a debug engine.
Starting the debugger
Chapter 3. Starting the debugger 19

idebug command parameters and options
Starting the debugger for a threaded applicationNote: A thread is an independent unit of execution within an AS/400 job. A job isthread-enabled if it is spawned as an immediate batch job, with support for nativethreads.
To debug a threaded application, in the Load Program dialog box specify the nameof a threaded application in the Specify the name of the program to add to debugentry field. Since no job name is specified, the debugger will spawn a job and startthe program in that job.
Secondary threads in the debugger
Starting the debugger
Starting the debugger for a non-threaded ILE or OPM applicationTo debug a non-threaded ILE or OPM program, proceed as follows:1. Specify the name of the non-threaded ILE or OPM program in the program
name entry field of the Load Program dialog box.2. Type the name of your interactive AS/400 job in the Job to debug entry field.
For a list of jobs, select the Job List push button and select a job from the JobList dialog box.
3. Select the Advanced push button in the Load Program dialog box to access theDebugger Settings dialog box.
4. In the Debugger Settings dialog box, specify any environment variables to beprocessed for the application.
5. Exit the Debugger Settings dialog box.6. Press the OK push button in the Load Program dialog box. A debugger
message appears that asks you to start the program to be debugged on anAS/400.
7. Start the program on the AS/400 debug host.Note: Program parameters for ILE and OPM programs are specified on theAS/400 command.
8. Press the OK button in the debugger message window to continue. A Sourcepane opens, displaying one of the debugging views.
You can now start debugging your program.
Starting the debuggerStarting the debugger for a threaded application
20 AS/400 Debugging
idebug commandThe idebug command connects the Distributed Debugger user interface to theapplication to be debugged on an AS/400. The idebug command has the followingsyntax:
idebug [idebug_options] [ui_daemon_parameters]
The idebug_options are zero or more of the following:
Option Purpose
-a <job_name> Attach to the existing AS/400 job_name,where job_name is a string that specifies anAS/400 job. The job_name string followsstandard job name format,Name/User/Number.
This option does not have a default value.
-h or -? Display help for the idebug command.
-i Step into the program, but do not run tomain. This option has the same function asthe Step into check box in the LoadProgram dialog box.
Chapter 3. Starting the debugger 21

Option Purpose
-p+ Use program profile information to keepprofiles for initial programs only. Thedebugger will restore the following for yourprogram from the last time you debugged it:
v window sizes, positions, fonts, andbreakpoints for your program.
v all job breakpoints.
v all watch breakpoints will be restored, butdisabled.
v for single thread programs, variables inthe monitor are restored.
v for multithreaded programs, variables inthe monitor for the initial thread arerestored.
The debugger will not restore the followingfor your program from the last time youdebugged it:
v thread-specific breakpoints.
v thread-specific variables.
If you are debugging a program for the firsttime, the debugger starts with the defaultappearance, no breakpoints are set, and novariables are monitored.
Any changes you make to the windows andbreakpoints are saved.
Note: If you add or delete lines in yoursource file, recompile it, and then debug theprogram again with a saved programprofile, line breakpoints may no longermatch the code they were initially set forbecause line breakpoint information is savedby line number, not by the content of theline.
If the debugger has saved a profilecontaining information on window,breakpoint, and monitor settings from aprevious debug session for this program, theprofile is used to restore those settings.
This is the default setting for the debugger.
-p- Do not use program profile information. Thedebugger ignores any program profileinformation, and the debugger windowsstart up with their default appearance, andno breakpoints are initially set.
-s Prevents the debugger from stopping in thefirst debuggable statement in the program.Program execution only stops when the firstset breakpoint is encountered.
22 AS/400 Debugging
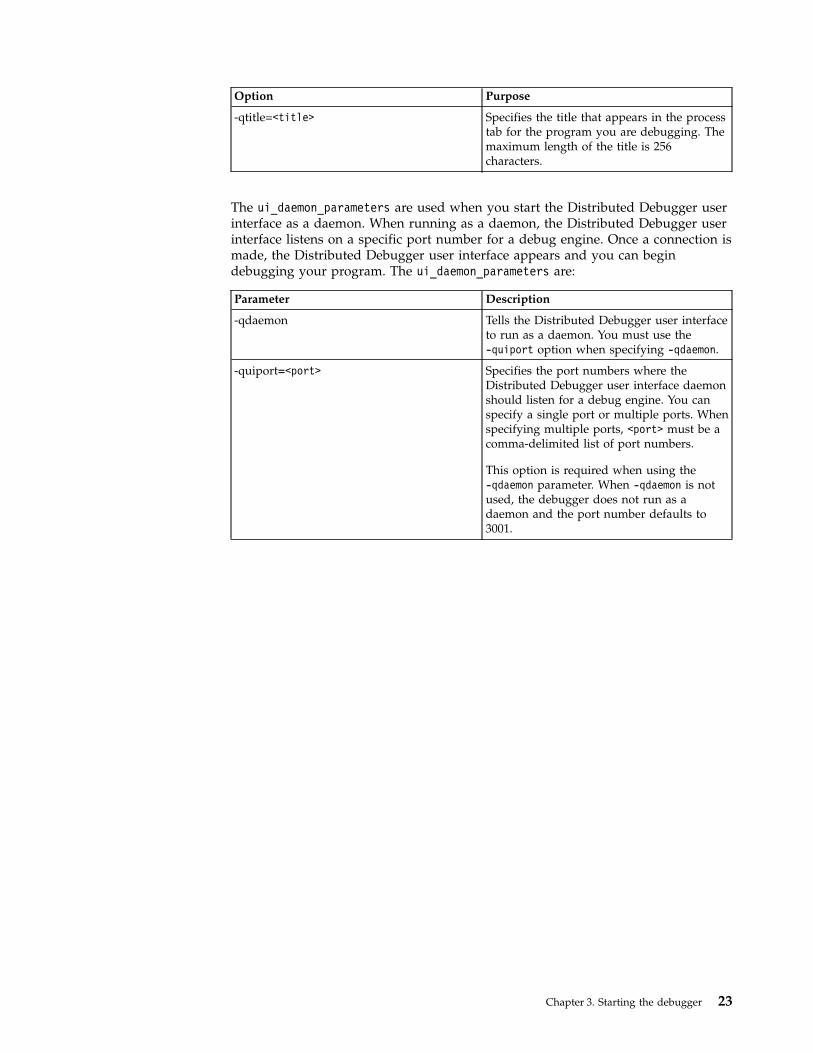
Option Purpose
-qtitle=<title> Specifies the title that appears in the processtab for the program you are debugging. Themaximum length of the title is 256characters.
The ui_daemon_parameters are used when you start the Distributed Debugger userinterface as a daemon. When running as a daemon, the Distributed Debugger userinterface listens on a specific port number for a debug engine. Once a connection ismade, the Distributed Debugger user interface appears and you can begindebugging your program. The ui_daemon_parameters are:
Parameter Description
-qdaemon Tells the Distributed Debugger user interfaceto run as a daemon. You must use the-quiport option when specifying -qdaemon.
-quiport=<port> Specifies the port numbers where theDistributed Debugger user interface daemonshould listen for a debug engine. You canspecify a single port or multiple ports. Whenspecifying multiple ports, <port> must be acomma-delimited list of port numbers.
This option is required when using the-qdaemon parameter. When -qdaemon is notused, the debugger does not run as adaemon and the port number defaults to3001.
Chapter 3. Starting the debugger 23

Parameter Description
-qlang=<dominant_language>
Specifies the dominant language to use fordebugging. If this parameter is not specified,the dominant language last used by thedebugger will be assumed for the currentsession.
Issuing the idebug -qengine=400 commandwithout this parameter will cause invocationof the Load Program dialog box. Issuing theidebug -qengine=400 command with thisparameter, and with the program_name or-ajob_name, will cause bypass of the LoadProgram dialog box.
The initial default value of this parameter isRPG. Thereafter, when a new dominantlanguage is set, it becomes default forsubsequent invocations of the DistributedDebugger.
These are the valid values for<dominant_language>:
v Use the rpg value when you aredebugging RPG programs.
v Use the cobol value when you aredebugging Cobol programs.
v Use the cl value when you aredebugging CL programs.
v Use the c value when you are debuggingC programs.
v Use the cpp value when you aredebugging C++ programs.
v Use the java value when you aredebugging Java programs.
-qengine=<engine> Specifies the type of engine to connect to. Tostart the Distributed Debugger, -qengine=400is a required parameter.
-e<hostname:port> Specifies the name of the AS/400 host andoptional server port number that you wantto connect to for your debugging session,where specifying the port is optional.
This parameter has no default value.
-qprompt Forces the Load Program dialog box even ifall required parameters have been specified.
When you are attaching to an existing AS/400 job by issuing the idebug command,specifying -ajob_name and -qengine=<engine> are mandatory. When you load aprogram without specifying a job with the idebug command, specifying-qengine=<engine> and program_name are mandatory. The presence of a dominantlanguage is also mandatory when attaching to a job or loading a program,however, if -qlang=<dominant_language> is not specified, the dominant languagelast used by the debugger will be assumed for the current session.
24 AS/400 Debugging

Whether you are attaching to a job or loading a program without specifying a job,if the mandatory options or parameters are not specified, the debugger willprompt you for the required information in the Load Program dialog box.
Starting the debuggerLoading a program without specifying a job from a command lineLoading a program without specifying a job from the debugger user interfaceAttaching to an existing AS/400 job from a command lineAttaching to an existing AS/400 job from the debugger user interfaceStarting the Distributed Debugger user interface daemonStarting the debugger for a threaded applicationStarting the debugger for a non-threaded ILE or OPM application
Chapter 3. Starting the debugger 25

26 AS/400 Debugging

Chapter 4. Using the IBM Distributed Debugger for AS/400
Setting and working with environment variablesThe Distributed Debugger user interface running on the workstation uses certainenvironment variables to determine the dominant language, the host files wherethe source files are found, and so on.
The dominant language to be used by the Distributed Debugger is selected in theLoad Program dialog box. To set additional environment variables, select theAdvanced push button in the Load Program dialog box. This invokes theDebugger Settings dialog box, where you can set session settings and environmentvariables such as host name, source path, and debugger port, or add JVM or batchjob creation settings.
The Debugger Settings dialog box will not close if you specify incorrect values in itand click the OK push button. For example, the dialog box will not close if youenter an environment variable name that contains blanks. All fields which containan error will be marked in red. Tool Tip Evaluation will give details when youposition the cursor over the field containing the entry.
To set or alter environment variables other than Java CLASSPATH in the DebuggerSettings dialog box, do the following:1. Do one of the following:
v Select JVM Creation Settings > Environment Variables if you are debugginga job in a Java Virtual Machine.
v Select Batch Job Creation Settings > Environment Variables if you aredebugging a batch immediate (BCI) job.
2. To add an environment variable, click on the Variable and Value cell fields ofthe initial highlighted row and make the appropriate entries. To add additionalvariables, press the keyboard Insert key to create rows for as many variables asyou wish to add.
3. To edit variable names or values, click on the appropriate table cell and changethe cell contents.
4. To delete a variable and its value, select the appropriate row, and press thekeyboard Delete key.
Entries in the environment variables table can be reordered by dragging anddropping rows.
Notes:
v AS/400 environment variable names and values may not contain blanks. Theenvironment variable value may not be an empty string.
v Multiple JVM creation environment variable entries of the same name arepermitted. The last one in the list is used.
v Multiple JVM creation property entries of the same name are permitted. The firstone in the list is used.
© Copyright IBM Corp. 1997, 2000 27
CLASSPATH environment variableDebugger environment settingsDebugger environment default settings
Setting the Java CLASSPATHSet the CLASSPATH environment variable to point at all classes and packages youwill need to debug.
To set the Java CLASSPATH, do the following:1. Select File > Load Program from the menu bar to invoke the Load Program
dialog box.2. In the Load Program dialog box, click the Advanced push button to invoke the
Debugger Settings dialog box.3. In the Debugger Settings dialog box, select JVM Creation Settings.4. Enter the Java CLASSPATH in the Classpath entry field.5. Click on the OK button to set the CLASSPATH.
Note: Text in the Classpath field wraps for extra convenience. Do not press Enterwhile in this field.
CLASSPATH environment variableDebugger environment settingsDebugger environment default settings
Working with programs
Adding a program to the Programs paneYou can add programs, service programs or java classes to the list in the Programspane of programs under debug mode. Programs under debug mode must includeat least one module that has been compiled with debug data. Java classes must becompiled with debug data.
To add a program to the Programs pane from the Programs menu:1. Click on the Programs pane to bring it into focus.2. Select Programs > Add Program from the menu bar to invoke the Add
Program dialog box.3. Enter the name of the program, service program, or Java class that you want to
add in the Program Name field. Valid formats are:v For programs or service programs:
– Library/program– *LIBL/program– *CURLIB/program– Program (same as *LIBL/program)
v For Java classes:– Full path/Java class– Partial path/Java class (if the partial path is in the CLASSPATH as defined
in the Debugger Settings dialog box)
28 AS/400 Debugging

– Java class (if the class is in the CLASSPATH as defined in the DebuggerSettings dialog box).
4. Specify the type of program that you want to add by selecting one of the typesin the Program Type group.
5. Click OK to add the program to the Programs pane and dismiss the dialog box.
Note: Adding a program that has multiple modules with the same name is notsupported and will result in an error message.
Distributed Debugger: Panes
Using the Programs pane
Using the Programs paneUse the Programs pane to view and navigate compilation units such as programsand service programs. Each program or service program display tree can beexpanded to display the names of its debuggable modules. Non-debuggablemodules are also shown if Show All Components in the Programs pull-downmenu is selected. Each debuggable module can be expanded to display the namesof all debuggable entries, such as procedures or functions.
When debugging Java, the Programs pane is used to view and navigate Javaclasses. Each class (or compilation unit) can then be expanded to display names ofall debuggable methods that constitute the class.
The Programs pane contains compilation units that are being debugged. Anycompilation unit where execution stops automatically gets added to the Programspane. You can use the Add Program dialog box to add these compilation units todebug. Initially, compilation unit display trees are shown for only thosecomponents containing debug information. To display all program componentsused by the program being debugged, check the Show All Components selectionin the Programs pull-down menu.
When a module or Java class is selected, its appropriate view is displayed in theSource pane. When a procedure, function or method is selected, its source isdisplayed in the Source pane. For more information about viewing different sourcethat is associated with program or class components, see the related topic below.
Compilation unit, module, procedure, and method properties are available bypop-up menu in the Programs pane.
Distributed Debugger: Panes
Adding a program to the Programs paneViewing different source
Chapter 4. Using the IBM Distributed Debugger for AS/400 29

Setting the display of program information
Changing views in the Source PaneDepending on source code language and compile options, the Source Panesupports up to three views for programs compiled with debug information:
View Purpose
Source to see the source code for your program
Listing to see a compiler-generated listing of yourprogram
Statement to see the procedure name of eachexecutable source statement
You can go directly to a particular view by selecting that view from the Sourcepull-down menu. For example, to switch to a Listing view, select Source > ListingView.
Source views
Compiling a program for debugging
Problems getting a Source or Listing viewDebug data and RPG, C, Cobol, and CL compiler optionsILE C++ compiler optionsJava compiler options
Viewing different sourceWhen you start the debugger, a single Source pane appears. Depending on howyour program was compiled, the Source pane displays either a Source, Listing, orStatement view.
To open different source from the Source menu, do the following:1. Select Source > Open New Module from the menu bar.2. Enter the name and path of the module of the new source to be opened. This
source code must be a part of the application that you are currently debugging.3. Click OK. A Source pane for the new code opens, if the debugger is able to
locate the source.
To open different source from the Programs pane, do the following:1. Click on the Programs pane to bring it in focus.2. If necessary, add the program for the source that you wish to view to the
Programs pane. For information about adding a program to the Programs pane,see the related topic below.
3. In the Programs pane, expand the entry that contains the program componentthat you want to view. Alternatively, check the Show All Components selectionin the Programs pull-down menu.
30 AS/400 Debugging

4. If necessary, scroll the Programs pane to ensure that the entry you want to viewis visible. Scroll by using the scroll bar, the PageUp and PageDown keys, orcursor keys to locate the line.
5. Left-click on the entry you want to view.6. The source for the selected entry in the Programs pane is displayed in the
Source pane.
Viewing different source is useful when you want to set breakpoints in the sourceof a different program component. When execution switches from the previoussource to this one, the program component will stop before running to completion.
Problems getting a Source or Listing view
Adding a program to the Programs paneUsing the Programs pane
Locating source codeIf the debugger cannot locate the source file of the program you are debugging,you may not be able to open a Source view for the module, even if it wascompiled with the appropriate debug options.
When you start debugging such a module, or when execution stops in a part of theprogram that was compiled with the appropriate debug information, but thedebugger cannot locate the source file, the Source Filename dialog box allows youto specify the location of the source file.
In this dialog box, you can enter the location and name of the source file. If youchoose Cancel when this dialog box appears, the Listing view will open if it isavailable. If the Listing view is unavailable, a Statement view will open.
Locating source code written in C++Locating source code written in ILE/OPM languagesLocating source code written in Java
Locating source code written in C++When you compile C++ source code with the /Ti+ or the /Tis+ option, thecompiler stores the name of the source file and its directory path in the moduleobject.
When you ask to display the source file, the debugger tries to find the file, usingthe directory path and filename that was captured when the program wascompiled. The debugger searches for the file in this order:1. In the directory path that was stored when the module was compiled.2. In the directory where the last file, if any, was found.3. In the directories defined in the Source Path environment setting.
If the file is not found in any of these directories, you will be prompted for thename of the file in the Source Filename dialog box. If the source file is notavailable, click on the Cancel push button on the file prompt and a different viewwill be used.
Chapter 4. Using the IBM Distributed Debugger for AS/400 31

Locating source codeLocating source code written in ILE/OPM languagesLocating source code written in Java
Locating source code written in ILE/OPM languagesRestriction: The following applies to local source code written in AS/400languages other than C++ or Java.
When you compile ILE (C, CL, COBOL, and RPG) modules, or OPM (CL, COBOL,RPG) programs, the name of the AS/400 source member is stored in the module orprogram object. When you ask to display the source for a module or program, thedebugger attempts to read the information from the AS/400 source member usedto create the module or program.
If the source member is not found, the debugger builds a name using the modulename or program name and a file extension based on the language. The fileextensions used are as follows:
File Extension Used for...
C ILE C language modules.
CBL ILE COBOL language modules.
CL ILE CL language modules.
RPG ILE RPG language modules
The debugger searches for the file in this order:1. In the directory where the last file, if any, was found.2. In the directories listed in the Source Path environment setting.
If the file is not found, you are prompted to enter the name of the file in theSource Filename dialog box. If you do not have the source available, click on theCancel push button on the file prompt and a different view will be used.
Locating source codeLocating source code written in C++Locating source code written in Java
Locating source code written in JavaWhen you ask to display the source for a Java class, the debugger tries to locatethe source as follows:1. It searches for a file that has the same IFS location and filename as the class
file, but with the extension .java.2. It searches the path (remote or local) specified in the Source Path environment
setting.3. It prompts you for the name of the file in the Source Filename dialog box.
If you want to override the source location to another IFS drive, you must firstmap the network drive to your PC, and specify the location from the view of thePC, for example:
mapped-drive-letter:/path/filename.ext
32 AS/400 Debugging

If the source file is not available, press the Cancel push button on the file promptand a statement view will be displayed.
Locating source codeLocating source code written in C++Locating source code written in ILE/OPM languages
Viewing the contents of the Call StackYou can view information for the active programs, modules, procedures, orfunctions on a thread’s call stack.
To view stack information, click on the Stacks pane to bring it in focus and expandthe appropriate thread entry. Right-click on the call stack entry that you want toview and select Properties from the pop-up menu for detailed information aboutthat call stack entry.
Using the Stacks pane
Controlling program execution
Running a programYou can have a program run until one of the following occurs:v end of program is reachedv an active breakpoint is hitv a specific line number is reachedv an exception occurs.
If you run a program, the program will run to completion or until an activebreakpoint is hit or until an unmonitored exception occurs.
To run a program, do one of the following:
v Click the run button ( ).v Select Debug > Run from the menu bar.v Press F5.
When a program runs to completion, the manner in which the debuggerterminates changes depending on whether you loaded the program into thedebugger without specifying a job or attached the debugger to an existing AS/400job. If the program was loaded into the debugger without specifying a job, runningit to completion will cause termination of the debugger. If the debugger wasattached to a job, the debugger must be terminated manually, unless the job underdebug finishes. For information about terminating the debugger, see the relatedtopic below.
If you attached the debugger to an existing AS/400 job and specified a programname with the Load Program dialog box Step Into control deselected, you will beasked to start your AS/400 application when you run the program.
Breakpoints
Chapter 4. Using the IBM Distributed Debugger for AS/400 33
Attaching to an existing AS/400 job from the debugger user interfaceStepping through a programRunning to a locationTerminating a debug session
Running to a locationIf you run to a location in a program, the program will run to the statementselected unless an active breakpoint is hit, an exception occurs or the end of theprogram is reached. The program will run to the statement before executing it orany of its procedure calls.
Only executable lines (those that are colored blue) can be run to with Run ToLocation.
To run a program to a specific line number:1. Make sure the line to run to is visible in the Source pane by using the scroll bar
or cursor keys to locate the line.2. Run the program to the line by doing one of the following:
v Right-click on the line to invoke the pop-up menu, then select Run ToLocation.
v Click on the line to select it, then select Debug > Run To Location from themenu bar.
v Click on the line to select it, then select Selected > Run To Location from themenu bar.
Breakpoints
Stepping through a programRunning a program
Stepping through a programYou can use step commands to step through your program a single statement at atime. For an explanation of the step commands, see the related topic below.
To execute a Step Over command, do one of the following:
v Click the step over button ( ) on the toolbar.v Select Debug > Step Over from the menu bar.v Press F10.
To execute a Step Debug command, do one of the following:
v Click the step debug button ( ) on the toolbar.v Select Debug > Step Debug from the menu barv Press F7.
When debugging your Java program, stepping behavior may be irregularwhen stepping into constructors, or when stepping into or over SystemLoad libraryfunctions.
34 AS/400 Debugging
Running a programRunning to a location
Step commandsStepping and procedures
Restarting a programTo start debugging your program from the beginning if your program is stopped,
click on in the toolbar, select Debug > Restart from the menu bar, or pressCtrl+Shift+F5.
Depending on the debug session start-up mode or language under debug mode,restarting a program will cause the following:v If you attached the debugger to a job when you started the debug session, a
message will prompt you to call the program again in your AS/400 job beforethe debug session restarts.
v If you attached the debugger to a job without specifying a program name andthen ran the program to termination, you can restart the debugger for additionaldebug sessions.
v If you loaded the program into the debugger without specifying a job when youstarted the debug session, the program will restart automatically when you clickRestart.
v For non-threaded ILE or OPM programs, a message prompts you to call theprogram in your AS/400 job before the debug session restarts.
Note: If you restart an interactive program that produces 5250 screen output, thedebugger will run the program to termination before restarting it. You will thenhave less time than is necessary to dismiss the 5250 screen before the programrestarts, and dismissing the 5250 screen will cause termination of the restartedprogram. When debugging such a program, running to the last statement in theprogram before restarting will allow for better restart behavior.
Attaching to an existing AS/400 job from the debugger user interfaceRunning a programRunning to a location
Terminating a debug sessionTo terminate a debug session and exit the debugger, do one of the following:v Select File > Exit from the Distributed Debugger window.v In the debugger window, use your windowing system’s technique for closing
that window. For example, double-click on the upper left corner of the windowor press Alt+F4. You can also single click the upper right corner.
You may want to end the debugger session for one of the following situations:v In the Load Program dialog box, you did not specify a program name. If a
program name is specified, the debug session will terminate automatically whenthe program has run to completion. If the program name is not specified, thedebug session must be terminated manually
v If you have passed the point in the program where you intended to debug.v In the Load Program dialog box, you specified the name of a job that is an
active AS/400 job, but it is not the job that you wanted to use.
Chapter 4. Using the IBM Distributed Debugger for AS/400 35

v You specified the name of a program in the Load Program dialog box, but theprogram fails when you call it (for example, an unmonitored message occurswhen you call the program).
v The debugger is attached to an existing AS/400 job, but the program youwanted to debug has terminated.
Starting the debuggerLoading a program without specifying a job from a command lineLoading a program without specifying a job from the debugger user interfaceAttaching to an existing AS/400 job from a command lineAttaching to an existing AS/400 job from the debugger user interfaceRestarting a programRunning a program
Working with threads
Debugging multithreaded applicationsTo debug secondary threads effectively, in the Source pane bring to focus thesource of the code that executes in the secondary threads and set a line breakpointat the first debuggable statement. Running the program will now stop at thebeginning of the thread, which will allow you to set breakpoints for this threadand perform all other debugging functions on it.
When stepping through the thread creation code, additional threads may show inthe Stacks pane. To guarantee a view of these threads in the Stacks pane, set abreakpoint in the code which runs in the thread that you want to view. Ifnecessary, add the program which contains the thread you want to view to thePrograms pane.
To display the current line of execution in a displayed thread, select Source >Scroll To Thread Execution Point from the menu bar. To display the current lineof execution of the thread that has caused the debugger to stop (for example, thethread where a breakpoint was hit), select Source > Show Stopping ThreadLocation from the menu bar.
Secondary threads in the debugger
Starting the debugger for a threaded applicationUsing the Stacks paneStepping through a programAdding a program to the Programs pane
Step commands
Using the Stacks paneThe Stacks pane contains a list of call stacks for every thread of execution. You canexpand each Call Stack for individual threads to get a complete list of all call stackentries. Once you highlight a particular call stack entry (regardless of its thread ofexecution), its source is displayed in the Source pane.
To view the source for an entry in the Stacks pane:
36 AS/400 Debugging

1. Click on the Stacks tab to bring the Stacks pane to the foreground.2. In the Stacks pane, expand the thread that contains the entry that you want to
view. Alternatively, you can select Stacks > Expand All so that all entries arevisible in the Stacks pane, however, stepping through a program with all stacksexpanded will impact performance.
3. If necessary, scroll the Stacks pane to ensure that the entry you want to view isvisible. Scroll by using the scroll bar, the PageUp and PageDown keys, orcursor keys to locate the line.
4. Left-click on the entry you want to view.5. The source for the selected entry in the Stacks pane is displayed in the Source
pane. If this entry is the current entry, the current line is highlighted.Otherwise, the line that called the next innermost entry on the call stack ishighlighted.
To display the current line of execution in a displayed thread, select Source >Scroll To Thread Execution Point from the menu bar. To display the current lineof execution of the thread that has caused the debugger to stop (for example, thethread where a breakpoint was hit), select Source > Show Stopping ThreadLocation from the menu bar. The Scroll To Thread Execution Point and ShowStopping Thread Location actions apply when you are debugging the only threadin a single- threaded program or a thread in a multithreaded program. Forsingle-threaded programs, both actions accomplish the same task.
Distributed Debugger: Panes
Debugging multithreaded applicationsViewing the contents of the Call Stack
Viewing the contents of the Call StackYou can view information for the active programs, modules, procedures, orfunctions on a thread’s call stack.
To view stack information, click on the Stacks pane to bring it in focus and expandthe appropriate thread entry. Right-click on the call stack entry that you want toview and select Properties from the pop-up menu for detailed information aboutthat call stack entry.
Using the Stacks pane
Inspecting variables
Adding a variable or expression to the Monitors paneFrom the Source pane or the Monitors menu, you can add variables andexpressions to the Monitors pane, so that you can keep track of how their contentschange during program execution. You can add multiple variables and expressionsto the Monitors pane from the Monitors menu.
Each thread has local variables which can also be monitored in the Locals pane. Bydefault, all local variables in scope are added to the Locals pane. When a thread isterminated, its local variables no longer appear in the Locals pane.
To add a variable or expression to the Monitors pane from the Source pane:
Chapter 4. Using the IBM Distributed Debugger for AS/400 37
1. In the Source pane, select or double-click the variable or expression you wantto monitor.
2. Right-click on the highlighted variable, and select Add to Program Monitorfrom the pop-up menu.
To add a variable or expression to the Monitors pane from the Monitors menu:1. In the Source pane, selecting or double-clicking the variable or expression you
want to monitor is optional. If this step is completed, the variable or expressionwill appear in the Enter expression to be evaluated field of the MonitorExpression dialog box and making an entry in this field will not be required.
2. Select Monitors > Monitor Expression from the menu bar to invoke theMonitor Expression dialog box.
3. If you did not complete step 1, enter the variable or expression you want tomonitor in the Enter expression to be evaluated field.
4. The Program monitor radio button will default to and remain selected.5. Click OK to add the variable or expression to the monitor and dismiss the
dialog box.
To add multiple variables or expressions to the Monitors pane from the Monitorsmenu:1. Select Monitors > Monitor Expression from the menu bar.2. In the dialog box, enter the variable or expression you want to monitor.3. Click Monitor to add the variable to the monitor.4. Repeat steps 2 and 3 until you have added all the variables or expressions you
want to monitor.5. Click Cancel to dismiss the dialog box.
Note: If you wish to monitor a a specific array or element, you can use theMonitor Expression dialog from the Monitors menu.
Distributed Debugger: PanesDistributed Debugger: Monitors
Viewing the contents of a variable or expressionChanging the contents of a variable or expressionEnabling and disabling a monitored variableChanging the representation of monitor contentsDeleting a monitored variableDereferencing pointers
Viewing the contents of a variable or expressionYou can view the contents of a variable or expression in the Locals pane or theMonitors pane, if you have added the variable there. By default, all local variablesin scope are added to the Locals pane.
To view the contents of a variable or expression in the Locals pane:1. Click on the Locals tab to bring the Locals pane into focus.2. Expand the thread in the Locals pane where the local variable you want to
view appears. Alternatively, select Locals > Expand All so that all variables arevisible in the Locals pane.
38 AS/400 Debugging

3. If necessary, scroll the Locals pane to ensure that the variable you want to viewis visible in the pane. Do this by using the scroll bar, the PageUp andPageDown keys, or cursor keys to locate the variable.
4. If your variable is a class, structure, or array, it can be expanded to show itsindividual elements.
5. If desired, change the representation of the variable: right-click on the variableand select Representation from the pop-up menu and then select arepresentation from the Monitor Representation dialog box.
To view the contents of a variable or expression you have already added to theMonitors pane:1. Click on the Monitors tab to bring the Monitors pane into focus.2. If necessary, scroll the Monitors pane to ensure that the variable you want to
view is visible. Do this by using the scroll bar, the PageUp and PageDownkeys, or cursor keys to locate the variable.
3. If your variable is a class, structure, or array, it can be expanded to show itsindividual elements.
4. If desired, change the representation of the variable: right-click on the variableand select Representation from the pop-up menu and then select arepresentation from the Monitor Representation dialog box.
If a variable or expression is not in scope, a message displays in the Monitors paneinstead of a value.
Note: For ILE RPG and ILE COBOL, local variables cannot be displayed inthe Locals pane. However, they can be displayed in the Monitors pane.
Important: After exiting a program block, variables out of scope may stillbe shown in the Monitors pane.
You can also view the contents of variables in the Source pane with Tool TipEvaluation. To enable Tool Tip Evaluation, see the related topic below.
Adding a variable or expression to the Monitors paneEnabling and using Tool Tip Evaluation for variablesExpanding and contracting lists
Changing the contents of a variable or expressionTo change the contents of a variable in the Locals pane or Monitors pane:1. Click on the pane’s tab to bring the pane to the foreground.2. In the pane, expand the thread where the variable you want to change appears.
Alternatively, select Monitors > Expand All or Locals > Expand All, dependingon the pane that you are in, so that all variables are visible in the pane.
3. If the variable that you want to change is a class, structure, or array, expand itto show its individual elements.
4. If necessary, scroll the pane to ensure that the variable you want to change isvisible. Do this by using the scroll bar, the PageUp and PageDown keys, orcursor keys to locate the variable.
5. Do one of the following:v Double-click on the variable or variable element.v Right-click on the variable and select Edit from the pop-up menu.
Chapter 4. Using the IBM Distributed Debugger for AS/400 39
6. Enter a value that is valid for the current representation of that variable orvariable element. The debugger checks for a valid value.
7. Press Enter to submit the change.
If the same variable is displayed in more than one monitor, the changes you makeare reflected in all monitors. However, if two variables with the same name qualifyto different programs or threads, they are considered to be two different variables.Therefore, a change to variable a in program 1 or thread 1 does not affect the valueof variable a in program 2 or thread 2.
You cannot change the contents of String objects in Java.
Adding a variable or expression to the Monitors paneViewing the contents of a variable or expression
Enabling and disabling a monitored variableYou can enable or disable the monitoring of a variable from the Monitors pane,Locals pane, or Selected menu. The advantage of disabling a monitored variableinstead of deleting it is that it is easier to enable a monitored variable than torecreate it.
Enabled variables are indicated with a red diamond ( ). Disabled variables are
indicated with a gray diamond ( ).
To enable or disable a monitored variable from the Monitors or Locals pane, do thefollowing:1. Click on the pane’s tab to bring the pane to the foreground.2. In the pane, expand the thread where the variable you want to enable or
disable appears. Alternatively, select Monitors > Expand All or Locals >Expand All, depending on the pane that you are in, so that all variables arevisible in the pane.
3. If necessary, scroll the pane to ensure that the variable you want to enable ordisable is visible. Do this by using the scroll bar, the PageUp and PageDownkeys, or cursor keys to locate the variable.
4. Right-click on the variable you want to enable or disable.5. Select Enable or Disable from the pop-up menu.
To enable or disable a monitored variable from the Selected menu, do thefollowing:1. In the Monitors pane or Locals pane, select the monitor you want to enable or
disable.2. Select Selected > Enable or Selected > Disable from the menu bar.
To enable or disable multiple monitored variables, do the following:1. In the Monitors pane or Locals pane, select the monitors you want to enable or
disable. To select more than one monitor at a time, press the Ctrl key on thekeyboard while making all selections.
2. Do one of the following:v Select Selected > Enable or Selected > Disable from the menu bar.v Press the Shift key and right-click on the selected variables and select Enable
or Disable from the pop-up menu.
40 AS/400 Debugging
Monitors
Adding a variable or expression to the Monitors paneViewing the contents of a variable or expressionChanging the contents of a variable or expressionChanging the representation of monitor contents
Changing the representation of monitor contentsYou can change the representation of existing entries in the Monitors pane orLocals pane. You can change the default representation for future entries in theApplication Preferences window.
To change the representation of a variable or expression in the Monitors pane orLocals pane:1. Click on the pane’s tab to bring the pane to the foreground.2. Right-click on the variable or expression you want to change the representation
of.3. Select Representation from the pop-up menu. The Monitor Representation
dialog box appears.4. Select the representation you want from the list of available representations.5. Click OK to change the representation and dismiss the Monitor Representation
dialog box.
To change the default representation of variables or expressions:1. Select File > Preferences from the main menu bar. The Application Preferences
window appears.2. In the left-hand pane of the Application Preferences window, go to Debug >
program > Default Monitor Representation, where program is the name of aprogram loaded in the Distributed Debugger you want to change the defaultrepresentation for.
3. Change the representations for variable types by clicking on the representationassociated with a variable type and selecting a representation from the list.
4. If you want these representations to become the default for the DistributedDebugger to use when no program profile is available, click DebuggerDefaults.
5. Click OK to change the default representations and dismiss the ApplicationPreferences window.
The default representations of variables and expressions in programs you havepreviously debugged will not be affected by these changes.
Adding a variable or expression to the Monitors pane
Deleting a monitored variableYou can delete a monitored variable from the Monitors pane, Locals pane, orSelected menu.
To delete a monitored variable from the Monitors or Locals pane, do the following:1. Click on the pane’s tab to bring the pane to the foreground.
Chapter 4. Using the IBM Distributed Debugger for AS/400 41
2. In the pane, expand the thread where the variable you want to enable ordisable appears. Alternatively, select Monitors > Expand All or Locals >Expand All, depending on the pane that you are in, so that all variables arevisible in the pane.
3. If necessary, scroll the pane to ensure that the variable you want to delete isvisible. Do this by using the scroll bar, the PageUp and PageDown keys, orcursor keys to locate the variable.
4. Right-click on the variable you want to delete.5. Select Delete from the pop-up menu.
To delete a monitored variable from the Selected menu, do the following:1. In the Monitors pane, select the variable you want to delete.2. Select Selected > Delete from the menu bar.
To delete multiple monitored variables, do the following:1. In the Monitors pane, select the variables you want to delete. To select more
than one monitor at a time, press the Ctrl key on the keyboard while makingall selections.
2. Do one of the following:v Select Selected > Delete from the menu bar.v Press the Shift key and right-click on the selected variables and select Delete
from the pop-up menu.
Monitors
Adding a variable or expression to the Monitors paneViewing the contents of a variable or expressionChanging the contents of a variable or expressionEnabling and disabling a monitored variableChanging the representation of monitor contents
Dereferencing pointersYou can dereference pointers in the Locals pane or pointers that have been addedto the Monitors pane.
Pointers are indicated with a green arrow ( ).
To dereference a pointer from the Monitors or Locals pane, do the following:1. Click on the pane’s tab to bring the pane to the foreground.2. In the pane, expand the thread where the pointer you want to dereference
appears. Alternatively, select Monitors > Expand All or Locals > Expand All,depending on the pane that you are in, so that all entries are visible in thepane.
3. If necessary, scroll the pane to ensure that the pointer you want to dereferenceis visible. Do this by using the scroll bar, the PageUp and PageDown keys, orcursor keys to locate the pointer.
4. Right-click on the pointer you want to dereference.5. Select De-reference from the pop-up menu.
To dereference a pointer from the Selected menu, do the following:1. In the Monitors pane or Locals pane, select the pointer you want to
dereference.
42 AS/400 Debugging
2. Select Selected > De-reference from the menu bar.
To dereference multiple pointers, do the following:1. In the Monitors pane or Locals pane, select the pointers you want to
dereference. To select more than one pointer at a time, press the Ctrl key on thekeyboard while making all selections.
2. Do one of the following:v Select Selected > De-reference from the menu bar.v Press the Shift key and right-click on the selected pointers and select
De-reference from the pop-up menu.
Monitors
Adding a variable or expression to the Monitors paneViewing the contents of a variable or expressionChanging the contents of a variable or expressionChanging the representation of monitor contents
Working with the debugger user interface
Enabling and using Tool Tip Evaluation for variablesTool Tip Evaluation for variables provides you with a quick way to view thecontents of variables in the Source pane. Tool Tip Evaluation also displaysexpression context, or the thread number that a variable is qualified to. When youpoint at a variable in the Source pane, a pop-up appears displaying the contents ofthat variable. This feature is enabled by default when you first start the debugger.
To enable or disable Tool Tip Evaluation, select or deselect Source > Allow ToolTip Evaluation from the menu bar. A check mark will appear next to the AllowTool Tip Evaluation menu item to indicate it is enabled. When the feature isdisabled, the menu item has no check mark next to it.
To enable or disable Tool Tip Evaluation as the default:1. Select File > Preferences from the main menu to invoke the Application
Preferences window.2. Select Debug from the list of preferences to set.3. Select or deselect Allow Tool Tip Evaluation from the Debugger Defaults
section.4. Click OK to enable or disable the tool tip monitor and dismiss the window.
Distributed Debugger: MonitorsDistributed Debugger: Panes
Viewing the contents of a variable or expression
Expressions qualified to thread number
Chapter 4. Using the IBM Distributed Debugger for AS/400 43

Expanding and contracting listsMuch of the information presented in the Distributed Debugger is in the form ofexpandable lists. These lists appear in panes such as the Stacks pane and theBreakpoints pane. They also appear in dialog boxes such as the Debugger Settingsdialog box. In most cases, you can expand and contract these lists one level at atime or expand or contract all levels of the list at once.
These lists have nodes that will expand or contract one level of the list when youclick on them. The appearance of the nodes depends on the Platform setting youselected in the Appearances part of the Application Preferences window.
If your selected platform is Windows:
v Expand one level of a list by clicking on the plus icon ( ).
v Contract one level of a list by clicking on the minus icon ( ).
If your selected platform is CDE/Motif:v Expand one level of a list by clicking on the plus icon.v Contract one level of a list by clicking on the minus icon.
If your selected platform is Metal:v Expand one level of a list by clicking on the white circle.v Contract one level of a list by clicking on the dark circle.
To expand all levels of a list in a pane, select Expand All from the menu for thatpane. For example, to see all set breakpoints, select Breakpoints > Expand All.
To collapse all levels of a list in a pane, select Collapse All from the menu for thatpane. For example, to hide the list of all set breakpoints, select Breakpoints >Collapse All.
BreakpointsBreakpoints are temporary markers you place in your program to tell the debuggerto stop your program whenever execution reaches that point. For example, if aparticular statement in your program is causing problems, you could set abreakpoint on the line containing the statement, then run your program. Executionstops at the breakpoint before the statement is executed. You can then check thecontents of variables and the call stack, and step over (execute) the statement tosee how the problem arises.
The Distributed Debugger supports the following types of breakpoints:v Line breakpoints are triggered before the code at a particular line in a program
is executed.v Watch breakpoints compare the content of a storage location (for example, the
content of a program variable) after the execution of each statement. Theytriggered when the contents of the storage location of a variable changes.
You can set conditions on line and watch breakpoints. For line breakpoints whenyou run the program, execution stops at the breakpoint before the statement isexecuted if the breakpoint condition is met. For watch breakpoints when you runthe program, execution stops at the breakpoint after the statement is executed ifthe breakpoint condition is met.
44 AS/400 Debugging
Setting a line breakpointSetting a watch breakpointSetting a conditional breakpoint
Characteristics of watches
Line breakpointsBy setting line breakpoints, you can stop your program at the line number youselect. You can only set breakpoints on lines containing executable statements. Ifthere is more than one executable statement on a line, the program will only stoponce before executing the first statement.
In CL, setting breakpoints on consecutive lines will not always stop theprogram multiple times, because some statements are mapped to the same linenumber, such as statements that span multiple lines or DO ENDDO combinations.
Setting a line breakpoint
Watch breakpointsUse this type of breakpoint when you want to see where and how a variable isbeing changed in your program. A watch breakpoint can be deleted, but notmodified.
By setting watch breakpoints, you can stop your program when the values ofvariables change. The watch is triggered when the content of the storage locationof a variable changes.
When the content of the watched storage location changes, the program stops atthe first executable statement following the change, and this line is highlighted inthe Source pane. If the program that caused this variable to be changed has notbeen added to the debugger, it is automatically added if the program containsdebug data, and you have sufficient authorization to the program.
Watch breakpoints are always set job-wide but qualified to a specific thread.
Notes:
v You may encounter a watch breakpoint within a program that you do not havesufficient authority to debug or that does not contain debug data. In this case,you would receive a message that specifies the program and location where thewatch condition was encountered. Program execution resumes when you clickthe message’s OK button.
v Watching variables may slow your program, because the value of the variablemust be checked on each statement.
Watch Breakpoints in multithreaded applicationsWhen debugging a multithreaded application, you need to consider the following:v Watch breakpoints are set based on the currently stopped position within a
selected or specified thread. In this case, the debugger uses the selected orspecified thread to qualify the watched variable.
Chapter 4. Using the IBM Distributed Debugger for AS/400 45

v Watch breakpoints may be hit in any thread, no matter what thread they are setfor.
v Watch breakpoints remain set even if the thread in which they were originallyset terminates.
Setting a watch breakpoint
Characteristics of watches
Characteristics of watchesConsider the following characteristics of watches:
Watch breakpoints cannot be modifiedA watch breakpoint can be deleted, but not modified.
Maximum number of watchesWatches are set on a system-wide basis, with a maximum number of 256 watchesthat can be active simultaneously. This number includes watches set by the system.If a variable crosses a page boundary, two watches are used internally to watch thestorage locations. The maximum number of variables that can be watchedsimultaneously on a system-wide basis ranges from 128 to 256.
Depending on overall system use, you may be limited in the number of watchconditions you can set at a given time. If you try to set a watch condition whilethe maximum number of active watches across the system is exceeded, you willreceive an error message and the watch condition is not set.
Scope of watched variablesWatch conditions can only be set when a program is stopped under debug mode,and the variable to be watched is in scope. If this is not the case, an error messageis issued when a watch is requested.
Once the watch condition is set, the address of a storage location watched does notchange. If a watch is set on a temporary location, such as the automatic storage ofan ILE C or C++ procedure, which can be reused after the procedure ends, it mayresult in invalid watch-condition notifications.
A watch condition may be registered although the watched variable is no longer inscope. You must not assume that a variable is in scope just because a watchcondition is reported. Overlapping watch locations Two watch locations in thesame job must not overlay in any way. Two watch locations in different jobs mustnot start at the same storage address; otherwise, overlap is allowed. If theserestrictions are violated, an error message is issued. Watch breakpoints After thecommand is successfully run, your application is stopped if a program in yoursession changes the contents of the watched storage location.
If the program has debug data, and a Source view is available, it is shown. Thesource line of the statement that is about to be run when the content change at thestorage location is detected is highlighted. A message indicates which watchcondition is satisfied.
46 AS/400 Debugging

If the program cannot be debugged, the text area of the display remains blank.Programs added to a debug session Eligible programs are automatically added tothe debug session if they cause the watch stop.
Watch breakpoints
Setting a watch breakpoint
Thread-specific and job-wide line breakpointsYou can set line breakpoints for a specific thread or job-wide for all threads. Youcannot set a thread-specific line breakpoint and a job-wide line breakpoint at thesame statement. This limitation may lead to unexpected behavior when you try toset, enable, or modify a breakpoint for which another breakpoint of the oppositetype is already active.
The following rules apply when setting or enabling line breakpoints:v If you try to set or enable a breakpoint for a line for which another breakpoint
of the opposite type is enabled, the job-wide breakpoint will take precedenceover the thread-specific breakpoint.
v If you try to set or enable a breakpoint for a line for which another breakpointof the opposite type is disabled, the new breakpoint will be set, and thebreakpoint of the opposite type will remain disabled.
The following rules apply when modifying line breakpoints to the opposite type(for example, changing a thread-specific breakpoint to a job-wide breakpoint):v If you try to modify a breakpoint to the opposite type, for a line for which
another breakpoint of the opposite type is enabled, the job-wide breakpoint willtake precedence over the thread-specific breakpoint.
v If you try to modify a breakpoint to the opposite type, for a line for whichanother breakpoint is disabled, the new breakpoint will be set. The disabledbreakpoint will remain disabled if it is of the opposite type. It will be deleted ifit is of the same type.
Breakpoints
Enabling and disabling breakpointsModifying line breakpoint propertiesSetting a line breakpoint
Setting Breakpoints
Setting a line breakpointYou can set line breakpoints from the Source pane, the Source menu, the Selectedmenu, and the Breakpoints menu.
To set a line breakpoint in the Source pane:1. Make sure the appropriate line is visible in the Source pane by using the scroll
bar, the PageUp and PageDown keys, or cursor keys to locate the line.2. Do one of the following:
v Double-click on the line number in the prefix area of the line.
Chapter 4. Using the IBM Distributed Debugger for AS/400 47
v Right-click on the line you want to set a breakpoint on, and select SetBreakpoint from the pop-up menu.
v Select the line you want to set a breakpoint on, and press F9.
To set a line breakpoint from the Source menu, select the line you want to set abreakpoint on, and select Source > Set Breakpoint from the menu bar, or:1. Select Source > Set Line Breakpoint from the menu bar to invoke the Line
Breakpoint dialog box.2. Enter the name of the module in which you want to set a breakpoint in the
Program entry field of the dialog box. If this module is loaded, you can select itfrom the pull-down list in the Program entry field.
3. Choose or enter the object, class or source file that is associated with themodule or routine specified in the Program entry field and contains the linewhere the breakpoint is to be set from the Source pull-down list.
4. Choose the source file containing the code for the object or class file from theSource (optional) pull-down list. (This step is optional.)
5. Enter the line number within the source file where you want to place abreakpoint in the Line entry field.
6. Set any optional parameters that you want for the breakpoint.7. Click OK to set the breakpoint and dismiss the Line Breakpoint dialog box.
Alternatively, use the Set button to set the breakpoint without dismissing theLine Breakpoint dialog box.
To set a line breakpoint from the Selected menu:1. Make sure the appropriate line is visible in the Source pane by using the scroll
bar, the PageUp and PageDown keys, or cursor keys to locate the line.2. Select the line you want to set a breakpoint on, and select Selected > Set
Breakpoint from the menu bar.
To set a line breakpoint from the Breakpoints menu:1. Click on the Breakpoints pane to bring the Breakpoints menu in focus.2. Select Breakpoints > Set Line from the menu bar.3. Enter the name of the module or routine in which you want to set a breakpoint
in the Program entry field in the Line Breakpoint dialog box. If this module orroutine is loaded, you can select it from the pull-down list in the Program entryfield.
4. Choose or enter the object, class or source file that is associated with themodule or routine specified in the Program entry field and contains the linewhere the breakpoint is to be set from the Source pull-down list.
5. Choose the source file containing the code for the object or class file from theSource (optional) pull-down list. (This step is optional.)
6. Enter the line number within the source file where you want to place abreakpoint in the Line entry field
7. Set any optional parameters that you want for the breakpoint.8. Click OK to set the breakpoint and dismiss the Line Breakpoint dialog box.
Alternatively, use the Set button to set the breakpoint without dismissing theLine Breakpoint dialog box.
Breakpoints
Setting multiple breakpoints
48 AS/400 Debugging
Setting a conditional breakpointModifying line breakpoint propertiesEnabling and disabling breakpointsDeleting a breakpointViewing set breakpoints
Setting a watch breakpointNote:Watch breakpoints are not supported for Java classes.
You can set watch breakpoints from the Breakpoints menu by doing the following:1. Select Breakpoints > Set Watch from the menu bar to invoke the Watch
Breakpoint dialog box.2. Enter the variable you want to watch in the Expression entry field of the dialog
box, and enter a value in the Bytes to Monitor entry field. To watch a variablein its defined length, enter 0 in the Bytes to Monitor entry field.
3. Set any optional parameters that you want for the watch.4. Click OK to set the watch and dismiss the Watch Breakpoint dialog box.
Alternatively, use the Set button to set the watch without dismissing the WatchBreakpoint dialog box.
Breakpoints
Characteristics of watches
Setting a conditional breakpointWhen you set a breakpoint, you can specify the parameters or conditions for thatbreakpoint.
To set a conditional breakpoint:1. Select the type of breakpoints you want to set from the Breakpoints menu or,
for setting multiple line breakpoints only, from the Source menu.2. From the resulting breakpoint dialog box, complete any or all optional
parameters (in the Optional Parameters section) that you want as conditionsfor your breakpoint.
3. Click OK to set the conditional breakpoint and dismiss the dialog box.
Breakpoints
Setting multiple breakpointsModifying line breakpoint propertiesEnabling and disabling breakpointsDeleting a breakpointViewing set breakpoints
Setting multiple breakpointsYou can set several breakpoints with the same optional parameters from either ofthe breakpoint dialog boxes.
To set multiple occurrences of either type of breakpoint from the same dialog box:
Chapter 4. Using the IBM Distributed Debugger for AS/400 49

1. Select the type of breakpoints you want to set from the Breakpoints menu or,for setting multiple line breakpoints only, from the Source menu.
2. From the resulting breakpoint dialog box, enter the required information for thefirst breakpoint. Change any fields in the Optional Parameters section of thedialog box, as desired.
3. Click on Set. The settings are saved for the current breakpoint.4. For each additional breakpoint, change the information for the new breakpoint
(for example, new line number or expression) and click on Set.5. After you have set the last breakpoint, click on Cancel to dismiss the dialog
box.
Note: You cannot set multiple breakpoints on the same line.
Breakpoints
Modifying line breakpoint propertiesEnabling and disabling breakpointsSetting a conditional breakpointDeleting a breakpointViewing set breakpoints
Viewing set breakpointsA list of breakpoints you have set is kept in the Breakpoints pane for the job youare debugging. This list is originally collapsed and can be expanded to show yourset breakpoints. The expanded list of breakpoints is divided into the types ofbreakpoints you may have set. Expanding each type of breakpoint will provideyou with a list of breakpoints for that type.
To view the list of breakpoints:1. In the Breakpoints pane, expand the list of breakpoints until you see the
breakpoint you want to view. Alternatively, select Breakpoints > Expand All sothat all breakpoints are visible in the Breakpoints pane.
2. If necessary, scroll the Breakpoints pane to ensure that the breakpoint you wantto view is visible. Do this by using the scroll bar, the PageUp and PageDownkeys, or cursor keys to locate the breakpoint.
To view the properties of a breakpoint, right-click on the desired breakpoint andselect Breakpoint Properties from the pop-up menu.
Note: A set breakpoint (enabled or disabled) may appear on a different linenumber in the Source pane, depending on which view you are in. If a breakpointis set on a line, its location in the Source pane will change if you change the Sourcepane view. When viewing the properties of a breakpoint in the Breakpoints pane,the line number will be associated with the view in which the breakpoint was set.
Breakpoints
Setting multiple breakpoints
50 AS/400 Debugging

Modifying line breakpoint propertiesEnabling and disabling breakpointsDeleting a breakpoint
Modifying line breakpoint propertiesYou can change the following properties of a line breakpoint:v Which threads the breakpoint applies to.v How often the debugger should skip the breakpoint (the frequency).v Whether to stop at a breakpoint only when a given expression is true.
You can also change the Required parameters fields for a breakpoint. Changingthese fields results in the existing breakpoint being deleted and a new breakpointbeing set.
To change a line breakpoint’s properties in the Breakpoints pane:1. Click on the Breakpoints tab to bring the Breakpoints pane to the foreground.2. In the Breakpoints pane, expand the list of line breakpoints until you see the
breakpoint you want to modify. Alternatively, select Breakpoints > Expand Allso that all breakpoints are visible in the Breakpoints pane.
3. If necessary, scroll the Breakpoints pane to ensure that the breakpoint you wantto modify is visible. Do this by using the scroll bar, the PageUp and PageDownkeys, or cursor keys to locate the breakpoint.
4. Right-click on the breakpoint you want to modify.5. Select Modify Breakpoint from the pop-up menu. A breakpoint dialog box
corresponding to the breakpoint type appears displaying the current settingsfor the breakpoint.
6. Change the breakpoint’s properties in the breakpoint dialog box.7. Click OK to set the breakpoint with modified properties and dismiss the
breakpoint dialog box. Alternatively, use the Set button to set the breakpointwith modified properties and then dismiss the breakpoint dialog box byclicking Cancel.
To change a line breakpoint’s properties from the Selected menu:1. Click on the Breakpoints tab to bring the Breakpoints pane to the foreground.2. In the Breakpoints pane, expand the list of line breakpoints until you see the
breakpoint you want to modify.3. Click on the breakpoint you want to modify.4. Select Selected > Modify Breakpoint from the menu bar. A breakpoint dialog
box corresponding to the breakpoint type appears displaying the currentsettings for the breakpoint.
5. Change the breakpoint’s properties in the breakpoint dialog box.6. Click OK to set the breakpoint with modified properties and dismiss the
breakpoint dialog box. Alternatively, use the Set button to set the breakpointwith modified properties and then dismiss the breakpoint dialog box byclicking Cancel.
Breakpoints
Setting multiple breakpoints
Chapter 4. Using the IBM Distributed Debugger for AS/400 51

Enabling and disabling breakpointsDeleting a breakpointViewing set breakpoints
Enabling and disabling breakpointsYou can disable a breakpoint so that it does not stop execution, and then enable itagain later. Information about the breakpoint (such as type, location, condition, andfrequency) is saved by the Distributed Debugger when the breakpoint is disabled.Since this is not true when the breakpoint is deleted, the advantage of disabling abreakpoint instead of deleting it is that it is easier to enable a breakpoint than to
recreate it. Enabled breakpoints are indicated with a red dot ( ). Disabled
breakpoints are indicated with a gray dot ( ).
You can enable or disable a single breakpoint from the Breakpoints pane, Sourcepane, Source menu, or Selected menu. You can also enable or disable allbreakpoints from the Breakpoints menu.
To enable or disable a single breakpoint from the Breakpoints pane:1. Click on the Breakpoints tab to bring the Breakpoints pane to the foreground.2. In the Breakpoints pane, expand the list of breakpoints until you see the
breakpoint you want to enable or disable. Alternatively, select Breakpoints >Expand All so that all breakpoints are visible in the Breakpoints pane.
3. If necessary, scroll the Breakpoints pane to ensure that the breakpoint you wantto enable or disable is visible. Do this by using the scroll bar, the PageUp andPageDown keys, or cursor keys to locate the breakpoint.
4. Do one of the following:v Right-click on the breakpoint you want to enable or disable and select
Enable Breakpoint or Disable Breakpoint from the pop-up menu.v Select the breakpoint and press Ctrl+F9 to enable or disable the breakpoint,
depending on its current state.
To enable or disable a breakpoint from the Source pane:1. Scroll to the line which contains the breakpoint you want to enable or disable.2. Do one of the following:
v Right-click on the breakpoint you want to enable or disable and selectEnable Breakpoint or Disable Breakpoint from the pop-up menu.
v Select the breakpoint and press Ctrl+F9 to enable or disable the breakpoint,depending on its current state.
To enable or disable a breakpoint from the Source menu:1. Do one of the following:
v In the Source pane, scroll to and select the line which contains the breakpointyou want to enable or disable.
v In the Breakpoints pane, select the breakpoint you want to enable or disable.2. Select Source > Enable Breakpoint or Source > Disable Breakpoint from the
menu bar.
To enable or disable a breakpoint from the Selected menu:1. Do one of the following:
v In the Source pane, scroll to and select the line which contains the breakpointyou want to enable or disable.
v In the Breakpoints pane, select the breakpoint you want to enable or disable.
52 AS/400 Debugging

2. Select Selected > Enable Breakpoint or Selected > Disable Breakpoint fromthe menu bar.
To enable all breakpoints, click on the Breakpoints tab to enable the Breakpointspull-down menu and select Breakpoints > Enable All Breakpoints from the menubar.
To disable all breakpoints, click on the Breakpoints tab to enable the Breakpointspull-down menu and select Breakpoints > Disable All Breakpoints from themenu bar.
Breakpoints
Deleting a breakpoint
Deleting a breakpointYou can delete single breakpoints from the Breakpoints pane, Source pane, Sourcemenu, or Selected menu. You can also delete all breakpoints from the Breakpointsmenu. If you delete a breakpoint, all information on it is lost. If you do not wantto lose your breakpoint information, but do not want the breakpoint to stopprogram execution, disable the breakpoint instead. For information on disablingbreakpoints, see the related topic below.
To delete a single breakpoint from the Breakpoints pane:1. Click on the Breakpoints tab to bring the Breakpoints pane to the foreground.2. In the Breakpoints pane, expand the list of breakpoints until you see the
breakpoint you want to delete. Alternatively, select Breakpoints > Expand Allso that all breakpoints are visible in the Breakpoints pane.
3. If necessary, scroll the Breakpoints pane to ensure that the breakpoint you wantto delete is visible. Do this by using the scroll bar, the PageUp and PageDownkeys, or cursor keys to locate the breakpoint.
4. Do one of the following:v Right-click on the breakpoint you want to delete and select Delete Breakpoint
from the pop-up menu.v Select the breakpoint and press F9.
To delete a breakpoint from the Source pane:1. Scroll to the line which contains the breakpoint you want to delete.2. Do one of the following:
v Right-click on the breakpoint you want to delete and select Delete Breakpointfrom the pop-up menu.
v Select the breakpoint and press F9.v For line breakpoints only, double-click on the line number in the prefix area
of the line containing the breakpoint.
To delete a breakpoint from the Source menu:1. Do one of the following:
v In the Source pane, scroll to and select the line which contains the breakpointyou want to delete.
v In the Breakpoints pane, select the breakpoint you want to delete.2. Select Source > Delete Breakpoint from the menu bar.
Chapter 4. Using the IBM Distributed Debugger for AS/400 53

To delete a breakpoint from the Selected menu:1. Do one of the following:
v In the Source pane, scroll to and select the line which contains the breakpointyou want to delete.
v In the Breakpoints pane, select the breakpoint you want to delete.2. Select Selected > Delete Breakpoint from the menu bar.
To delete all breakpoints, click on the Breakpoints tab to enable the Breakpointspull-down menu and select Breakpoints > Delete All Breakpoints from the menubar.
Breakpoints
Enabling and disabling breakpoints
Debugging servlets, EJB, and JSP
Debugging servlets, JSP, and EJBDebugging web artifacts, such as servlets, Enterprise Java Beans (EJB), orJavaServer Pages (JSP), requires that the following be installed and used duringdebug preparation.
On the client machine:
v IBM Distributed Debugger for AS/400v Object Level Tracev WebSphere Application Server, Version 3.02 or 3.5 Administrator’s Console
On the AS/400 server:
v WebSphere Application Server, Version 3.02 or 3.5
For more information about setting up web artifact debugging, please see therelated topics below.
Setting up WebSphere Application Server V3.02 for debugging servlets, EJB, andJSPSetting up WebSphere Application Server V3.5 for debugging servlets, EJB, and JSPSetting up the client machine for WAS 3.02 and OLT for servlet, EJB, and JSPdebuggingSetting up the client machine for WAS 3.5 and OLT for servlet, EJB, and JSPdebugging
Preparing servlets, EJB, and JSP for debuggingAn EJB exampleA servlet exampleA JavaServer Page example
54 AS/400 Debugging
Setting up WebSphere Application Server V3.02 for debuggingservlets, EJB, and JSP
For debugging web artifacts, such as servlets, Enterprise Java Beans (EJB), orJavaServer Pages (JSP), that are being serviced by WebSphere Application ServerV3.02, set up the application server by editing the file dertr11j.properties, whichcan be found in the following IFS location on your AS/400 server:
/qibm/userdata/webasadv/myuserid/properties
where myuserid is ’default’, unless you are using an additional administrativeserver. For more information about administrative server creation, please see theWebSphere Application Server for AS/400 V3.02 documentation.
In dertr11j.properties, the following values must be updated to set up ObjectLevel Trace (OLT):1. Edit data.ctrlhost to specify the IP address or machine name of the
workstation on which your OLT client user interface is running.2. Edit data.ctrlport to specify the port number on your workstation on which
your OLT client user interface is running. This step is not required if the portnumber in data.ctrlport matches the default OLT port number (2102).
3. Edit data.dbghost to specify the IP address or machine name of theworkstation on which your OLT client user interface is running, exactly as theentry was specified for data.ctrlhost.
4. Ensure that the data.dbgport port number is set to 8001.5. Edit data.trchost to specify the IP address or machine name of the work
station on which your OLT client user interface is running, exactly as the entrywas specified for both data.ctrlhost and data.dbghost.
6. Edit data.trcport to specify the port number on your workstation on whichyour OLT client user interface is running. This step is not required if the portnumber in data.trcport matches the default OLT port number (2102).
7. Ensure that the data.dbgoption is set to 3.
Debugging servlets, JSP, and EJB
Setting up WebSphere Application Server V3.5 for debugging servlets, EJB, and JSPSetting up the client machine for WAS 3.02 and OLT for servlet, EJB, and JSPdebuggingSetting up the client machine for WAS 3.5 and OLT for servlet, EJB, and JSPdebugging
Preparing servlets, EJB, and JSP for debuggingAn EJB exampleA servlet exampleA JavaServer Page example
Chapter 4. Using the IBM Distributed Debugger for AS/400 55

Setting up WebSphere Application Server V3.5 for debuggingservlets, EJB, and JSP
For debugging web artifacts, such as servlets, Enterprise Java Beans (EJB), orJavaServer Pages (JSP), that are being serviced by WebSphere Application ServerV3.5, ensure that the application server has been installed.
Debugging servlets, JSP, and EJB
Setting up WebSphere Application Server V3.02 for debugging servlets, EJB, andJSPSetting up the client machine for WAS 3.02 and OLT for servlet, EJB, and JSPdebuggingSetting up the client machine for WAS 3.5 and OLT for servlet, EJB, and JSPdebugging
Preparing servlets, EJB, and JSP for debuggingAn EJB exampleA servlet exampleA JavaServer Page example
Setting up the client machine for WAS 3.02 and OLT forservlet, EJB, and JSP debugging
When preparing to debug a web artifact, such as a servlet, Enterprise Java Bean(EJB), or JavaServer Page (JSP), begin by compiling the object with the appropriateJava compiler options. For more information on preparing these web artifacts,please see the related topics below.
Once the web artifact is compiled with the appropriate options, you must put theweb artifact’s location in the application server CLASSPATH, start the Object LevelTrace (OLT) viewer, ensure that Step-by-step Debugging Mode is set, then startthe application server, and invoke the web artifact. After you complete these steps,you will be prompted to step into the appropriate method. After selecting thismethod, clicking OK will launch the debugger which will open at the firstexecutable line in the method.
Note: To avoid holding up other AS/400 jobs with the job that is created fordebugging, it is recommended that you create a separate application serverinstance for the debug session and deploy your servlet, JSP, or Enterprise JavaBean into it. This way, you do not impact the execution of other servlets, JSP files,or Enterprise Java Beans. This is accomplished by using a different port numberfor the debugging session.
To set the CLASSPATH and SOURCEPATH in the WebSphere Application Serverfor AS/400, do the following:1. Start the WebSphere Administrative Console through one of the following
methods:v Select Programs > IBM WebSphere > Application Server Vxx >
Administrator’s Console, where xx is the application server version number,from the Windows Start menu.
56 AS/400 Debugging
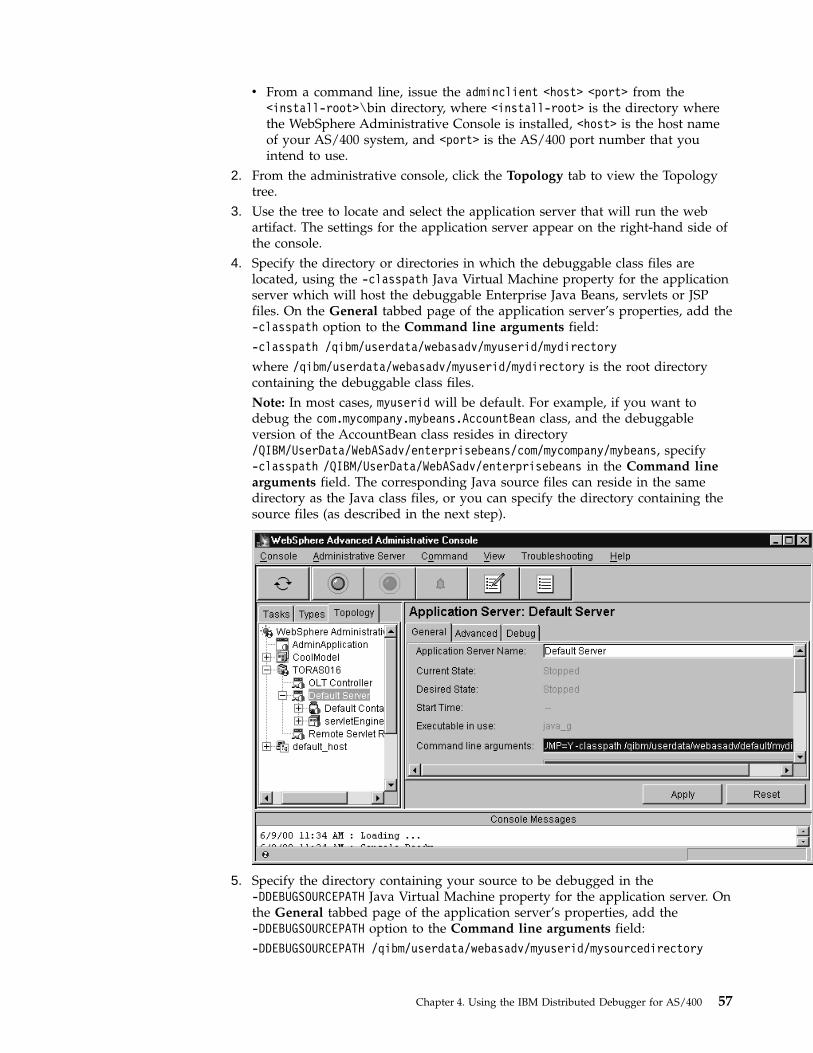
v From a command line, issue the adminclient <host> <port> from the<install-root>\bin directory, where <install-root> is the directory wherethe WebSphere Administrative Console is installed, <host> is the host nameof your AS/400 system, and <port> is the AS/400 port number that youintend to use.
2. From the administrative console, click the Topology tab to view the Topologytree.
3. Use the tree to locate and select the application server that will run the webartifact. The settings for the application server appear on the right-hand side ofthe console.
4. Specify the directory or directories in which the debuggable class files arelocated, using the -classpath Java Virtual Machine property for the applicationserver which will host the debuggable Enterprise Java Beans, servlets or JSPfiles. On the General tabbed page of the application server’s properties, add the-classpath option to the Command line arguments field:-classpath /qibm/userdata/webasadv/myuserid/mydirectory
where /qibm/userdata/webasadv/myuserid/mydirectory is the root directorycontaining the debuggable class files.Note: In most cases, myuserid will be default. For example, if you want todebug the com.mycompany.mybeans.AccountBean class, and the debuggableversion of the AccountBean class resides in directory/QIBM/UserData/WebASadv/enterprisebeans/com/mycompany/mybeans, specify-classpath /QIBM/UserData/WebASadv/enterprisebeans in the Command linearguments field. The corresponding Java source files can reside in the samedirectory as the Java class files, or you can specify the directory containing thesource files (as described in the next step).
5. Specify the directory containing your source to be debugged in the-DDEBUGSOURCEPATH Java Virtual Machine property for the application server. Onthe General tabbed page of the application server’s properties, add the-DDEBUGSOURCEPATH option to the Command line arguments field:-DDEBUGSOURCEPATH /qibm/userdata/webasadv/myuserid/mysourcedirectory
Chapter 4. Using the IBM Distributed Debugger for AS/400 57

where /qibm/userdata/webasadv/myuserid/mysourcedirectory is the directorythat contains the Java source files.
6. Click the Apply pushbutton.7. Select the Debug tab and ensure that Debug enabled and Object Level Tracing
enabled are selected.8. Click the Apply pushbutton.
For more information on using the WebSphere administrative console, please seethe WebSphere Application Server for AS/400 V3.02 documentation.
Setting the OLT viewer monitoring modeTo monitor the execution flow of your web artifact using OLT, do the following:1. In order to set up the appropriate ’Monitoring Mode’ for OLT, ensure that you
are using JDK 1.2.2 and enter the following at a command line:oltcc
This will invoke the Object Level Trace Client Controller window.2. Expand the OLT Client Controller Settings node and select Monitoring Mode
in the left part of the window.3. Select the Trace and debug with prompt radio button in the right part of the
window.4. Click Apply and then Exit.
Starting the OLT viewer
1. Start OLT by doing one of the following:v Type OLT at a command line, ensuring that you are using JDK 1.2.2.v From VisualAge for Java Enterprise Edition, Version 3.5 or later, select Tools
> Enterprise Toolkit for AS/400 > Start OLT viewer.2.
Select Online Mode in the OLT viewer window Options pull-down menu.
58 AS/400 Debugging

This invokes the OLT Trace page.3.
Ensure that Step-by-step Debugging Mode is enabled.
For more information, please see the OLT documentation.
Starting the WebSphere Application Server and invoking the web artifact
1. Start the application server by clicking the Start icon ( ) in theWebSphere Administrative Console. Once you are notified that the applicationserver has started successfully, click OK. At this point, you will see graphs inthe OLT viewer, for example:
Chapter 4. Using the IBM Distributed Debugger for AS/400 59
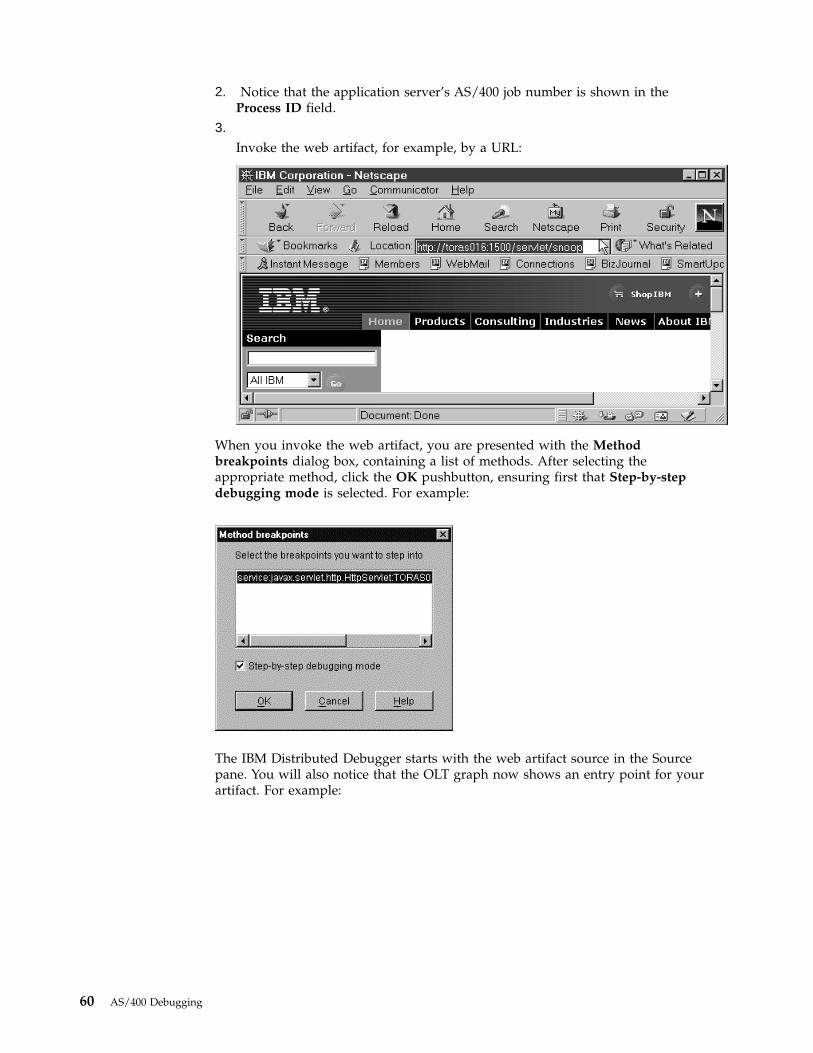
2. Notice that the application server’s AS/400 job number is shown in theProcess ID field.
3.
Invoke the web artifact, for example, by a URL:
When you invoke the web artifact, you are presented with the Methodbreakpoints dialog box, containing a list of methods. After selecting theappropriate method, click the OK pushbutton, ensuring first that Step-by-stepdebugging mode is selected. For example:
The IBM Distributed Debugger starts with the web artifact source in the Sourcepane. You will also notice that the OLT graph now shows an entry point for yourartifact. For example:
60 AS/400 Debugging

After you exit from the debugger, you need to exit manually from OLT and theapplication server.
Debugging servlets, JSP, and EJB
Setting up WebSphere Application Server V3.02 for debugging servlets, EJB, andJSPSetting up WebSphere Application Server V3.5 for debugging servlets, EJB, and JSPSetting up the client machine for WAS 3.5 and OLT for servlet, EJB, and JSPdebugging
Preparing servlets, EJB, and JSP for debuggingAn EJB exampleA servlet exampleA JavaServer Page example
Setting up the client machine for WAS 3.5 and OLT for servlet,EJB, and JSP debugging
When preparing to debug a web artifact, such as a servlet, Enterprise Java Bean(EJB), or JavaServer Page (JSP), begin by compiling the object with the appropriateJava compiler options. For more information on preparing these web artifacts,please see the related topics below.
Once the web artifact is compiled with the appropriate options, you must put theweb artifact’s location in the application server CLASSPATH, start the Object LevelTrace (OLT) viewer, ensure that Step-by-step Debugging Mode is set, then startthe application server, and invoke the web artifact. After you complete these steps,you will be prompted to step into the appropriate method. After selecting thismethod, clicking OK will launch the debugger which will open at the firstexecutable line in the method.
Chapter 4. Using the IBM Distributed Debugger for AS/400 61

Note: To avoid holding up other AS/400 jobs with the job that is created fordebugging, it is recommended that you create a separate application serverinstance for the debug session and deploy your servlet, JSP, or Enterprise JavaBean into it. This way, you do not impact the execution of other servlets, JSP files,or Enterprise Java Beans. This is accomplished by using a different port numberfor the debugging session.
To set the CLASSPATH and SOURCEPATH in the WebSphere Application Serverfor AS/400, do the following:1. Start the WebSphere Administrative Console through one of the following
methods:v Select Programs > IBM WebSphere > Application Server Vxx >
Administrator’s Console, where xx is the application server version number,from the Windows Start menu.
v From a command line, issue the adminclient <host> <port> from the<install-root>\bin directory, where <install-root> is the directory wherethe WebSphere Administrative Console is installed, <host> is the host nameof your AS/400 system, and <port> is the AS/400 port number that youintend to use.
2. Use the tree to locate and select the application server that will service the webartifact. The settings for the application server appear on the right-hand side ofthe console.
3. Specify the directory or directories in which the debuggable class files arelocated, using the -classpath Java Virtual Machine property for the applicationserver which will host the debuggable Enterprise Java Beans, servlets or JSPfiles. On the General tabbed page of the application server’s properties, add the-classpath option to the Command line arguments field:-classpath /qibm/userdata/webasadv/myuserid/mydirectory
where /qibm/userdata/webasadv/myuserid/mydirectory is the root directorycontaining the debuggable class files.Note: In most cases, myuserid will be default. For example, if you want todebug the com.mycompany.mybeans.AccountBean class, and the debuggableversion of the AccountBean class resides in directory/QIBM/UserData/WebASadv/enterprisebeans/com/mycompany/mybeans, specify-classpath /QIBM/UserData/WebASadv/enterprisebeans in the Command linearguments field.
62 AS/400 Debugging

4. Click the Apply pushbutton.5. Select the Debug tab and ensure that Debug enabled and Object Level Tracing
enabled are selected.6. Enter the name of your client or workstation in the OLT Server Host field and
leave the value that defaults in the OLT Server Port as is.7. Enter the SOURCEPATH in the corresponding entry field.8. Click the Apply pushbutton.
For more information on using the WebSphere administrative console, please seethe WebSphere Application Server for AS/400 V3.02 documentation.
Starting the OLT viewerTo monitor the web artifact with the OLT viewer, do the following:1. Start OLT by doing one of the following:
v Type OLT at a command line, ensuring that you are using JDK 1.2.2.v From VisualAge for Java Enterprise Edition, Version 3.5 or later, select Tools
> Enterprise Toolkit for AS/400 > Start OLT viewer.
Chapter 4. Using the IBM Distributed Debugger for AS/400 63
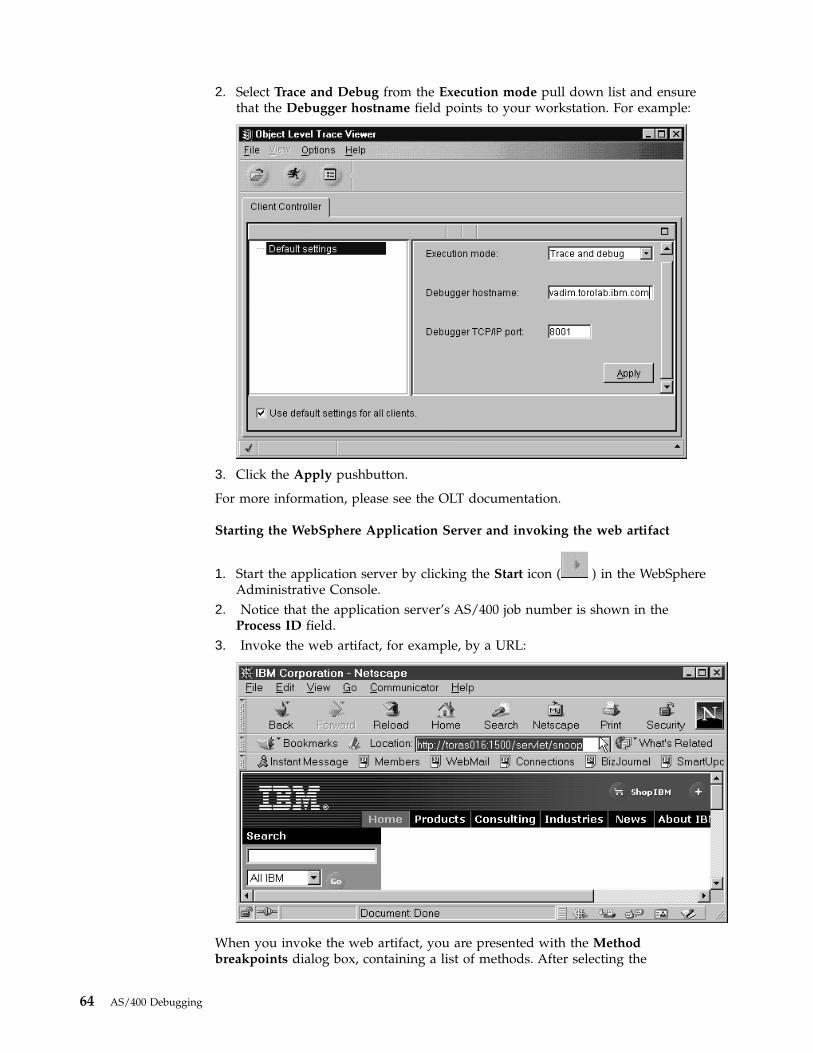
2. Select Trace and Debug from the Execution mode pull down list and ensurethat the Debugger hostname field points to your workstation. For example:
3. Click the Apply pushbutton.
For more information, please see the OLT documentation.
Starting the WebSphere Application Server and invoking the web artifact
1. Start the application server by clicking the Start icon ( ) in the WebSphereAdministrative Console.
2. Notice that the application server’s AS/400 job number is shown in theProcess ID field.
3. Invoke the web artifact, for example, by a URL:
When you invoke the web artifact, you are presented with the Methodbreakpoints dialog box, containing a list of methods. After selecting the
64 AS/400 Debugging

appropriate method, click the OK pushbutton, ensuring first that Step-by-stepdebugging mode is selected. For example:
The IBM Distributed Debugger starts with the web artifact source in the Sourcepane. You will also notice that the OLT viewer now shows the OLT Trace page andthat the OLT graph now shows an entry point for your artifact. For example:
After you exit from the debugger, you need to exit manually from OLT and theapplication server.
Debugging servlets, JSP, and EJB
Setting up WebSphere Application Server V3.02 for debugging servlets, EJB, andJSPSetting up WebSphere Application Server V3.5 for debugging servlets, EJB, and JSPSetting up the client machine for WAS 3.02 and OLT for servlet, EJB, and JSPdebugging
Chapter 4. Using the IBM Distributed Debugger for AS/400 65

Preparing servlets, EJB, and JSP for debuggingAn EJB exampleA servlet exampleA JavaServer Page example
Preparing servlets, EJB, and JSP for debuggingFollow these steps to enable your web artifacts, such as servlets, Enterprise JavaBeans (EJB), or JavaServer Pages (JSP), and application server for debugging:1. Compile the servlet, EJB, or JSP file with the -g option, for example:
javac -g mycompany.myproduct.MyServlet.java
2. From the AS/400 command line, run the Create Java Program (CRTJVAPGM)command and specify 10 for the optimization level. For example, enter thefollowing command (as one line, with no space between “myservlets/” and“Myservlet.class”):CRTJVAPGMCLSF(’/QIBM/UserData/WebASAdv/myclasses/com/mycompany/myservlets/MyServlet.class’)OPTIMIZE(10)
3. Deploy your servlet, JSP file, or Enterprise Java Bean in an application server ifyou have not already done so.
Debugging servlets, JSP, and EJB
Setting up WebSphere Application Server V3.02 for debugging servlets, EJB, andJSPSetting up WebSphere Application Server V3.5 for debugging servlets, EJB, and JSPSetting up the client machine for WAS 3.02 and OLT for servlet, EJB, and JSPdebuggingSetting up the client machine for WAS 3.5 and OLT for servlet, EJB, and JSPdebugging
An EJB exampleA servlet exampleA JavaServer Page example
An EJB exampleThe following scenario describes the steps that you can take to prepare anEnterprise Java Bean running in a WebSphere Application Server on the AS/400 fortracing and debugging.
Assumptions:
v You have an Enterprise Java Bean, AccountBean (part of thecom.yourcompany.yourbeans package), which you want to debug.
v The source for the bean is located in the/QIBM/UserData/WebAsAdv/yourbeans/com/yourcompany/yourbeans directory.
v You have created an application server, DebugServer, through the AdministrativeConsole.
v You have created your Enterprise Java Bean within the DebugServer applicationserver.
66 AS/400 Debugging

Preparation steps
1. Compile the Java code for debugging. If you use VisualAge for Java to developyour Enterprise Java Beans, specify that debugging attributes be included in theclass files when you export the beans. Once you have exported the JAR file,extract the Java source files and the debuggable class files to a directory on theAS/400. For the purposes of this documentation, that directory is/QIBM/UserData/WebAsAdv/yourbeans.If you are not using Visual Age for Java to develop your beans, use the -goption of the javac command when you compile your source. The Java sourceand debuggable class files can be placed in the same directory or you can placethe Java source files in a different directory and specify the location of thesource files to the debugger. For example, to compile the AccountBeanEnterprise Java Bean, run the following command:javac -g AccountBean.java
For the purposes of this scenario, put the Java source file and debuggable classfile in the /QIBM/UserData/WebAsAdv/yourbeans/com/yourcompany/yourbeansdirectory on the AS/400 server.
2. Use the CRTJVAPGM command to set the optimization level to 10 for thedebuggable class file. For this scenario, enter the following command from anAS/400 command line:CRTJVAPGM CLSF(’/QIBM/UserData/WebAsAdv/yourbeans/com/yourcompany/yourbeans/AccountBean.class’) OPTIMIZE(10)
Note: This command has been wrapped for display purposes. Enter thecommand as one line, with no space between yourcompany/ and yourbeans.
3. Your EJB is now ready for tracing and debugging.
Debugging servlets, JSP, and EJB
Setting up WebSphere Application Server V3.02 for debugging servlets, EJB, andJSPSetting up WebSphere Application Server V3.5 for debugging servlets, EJB, and JSPSetting up the client machine for WAS 3.02 and OLT for servlet, EJB, and JSPdebuggingSetting up the client machine for WAS 3.5 and OLT for servlet, EJB, and JSPdebugging
Preparing servlets, EJB, and JSP for debuggingA servlet exampleA JavaServer Page example
A servlet exampleThe following scenario describes the steps that you can take to prepare a servletrunning in a WebSphere Application Server on AS/400 for tracing and debugging.
Assumptions:
v You have a servlet, AccountServlet, which is part of thecom.yourcompany.yourservlets package that you want to debug. The source forthe servlet is located in/QIBM/UserData/WebAsAdv/yourservlets/com/yourcompany/yourservlets.
Chapter 4. Using the IBM Distributed Debugger for AS/400 67

v You have created an application server, DebugServer, using the WebSphereAdministrative Console.
v You have deployed your servlet within the DebugServer application server.
Preparation steps
1. Compile the Java code for debugging. If you use VisualAge for Java to developyour servlets, specify that debugging attributes be included in the class fileswhen you export the servlet. If you use the javac command to compile yourservlet, use the -g option when compiling your source. The Java source anddebuggable class files can be placed in the same directory or you can place theJava source files in a different directory and specify the location of the sourcefiles to the debugger.The Java source and debuggable class files must be placed in the directory onthe AS/400 which you specify in the CLASSPATH of the application server. Forexample, to compile the Account Servlet specify the following command:javac -g AccountServlet.java
For the purposes of this documentation, put the Java source file anddebuggable class file in the/QIBM/UserData/WebAsAdv/yourservlets/com/yourcompany/yourservletsdirectory on AS/400.Note: If you are using VisualAge for Java to develop your servlet, be sure toexport the Java source file for the servlet as well as the class file.
2. Use the CRTJVAPGM command to set the optimization level to 10 for thedebuggable class file. For this scenario, run the following command:CRTJVAPGM CLSF(’/QIBM/UserData/WebAsAdv/yourservlets/com/yourcompany/yourservlets/AccountServlet.class’) OPTIMIZE(10)
Note: This command has been wrapped for display purposes. Enter thecommand as one line, with no space between yourcompany/ and yourservlets.
3. Your servlet is now ready for tracing and debugging.
Debugging servlets, JSP, and EJB
Setting up WebSphere Application Server V3.02 for debugging servlets, EJB, andJSPSetting up WebSphere Application Server V3.5 for debugging servlets, EJB, and JSPSetting up the client machine for WAS 3.02 and OLT for servlet, EJB, and JSPdebuggingSetting up the client machine for WAS 3.5 and OLT for servlet, EJB, and JSPdebugging
Preparing servlets, EJB, and JSP for debuggingAn EJB exampleA JavaServer Page example
A JavaServer Page exampleThe following scenarios describe the steps you can take to prepare the servlet codegenerated for a JSP running in the WebSphere Application Server environment fordebugging. Two scenarios are described - one for debugging a JSP compiled for theJSP 0.91 specification and one for debugging a JSP compiled for the JSP 1.0
68 AS/400 Debugging
specification. The purpose of these scenarios is to provide simple examples ofdebugging JSP files which you can extrapolate to your own situation.
Assumptions
v You have the default administrative server running which has the sampleconfiguration installed.
v The sample configuration is installed by default when you first start yourWebSphere Application Server environment.
Debugging stepsThe steps for debugging a JavaServer Page compiled for the JSP 0.91 specificationare somewhat different than the steps for debugging a JSP compiled for the JSP 1.0specification.
Debugging a JavaServer Pages 0.91 fileThis scenario describes debugging simple.jsp which is installed under theexamples Web application when the Sample Configuration has been installed:1. To cause the code to be generated for the simple.jsp file, invoke the JSP from a
browser as follows:http://yourAS400:yourPort/webapp/examples/simple.jsp
where yourAS400 is the AS/400 host name, and yourPort is the port number.Note: The default WebSphere Application Server environment must be runningwith the Default Server application server and your HTTP server instancestarted as well.WebSphere Application Server generates Java code from the JSP file andcompiles it dynamically. Once the code has been generated, you can compile itwith debug. The generated servlets (both source and class files) for JSP files arelocated in the pagecompile directory, in the host and web applicationsubdirectories of the temp directory for the administrative server, where webapplication is the name of the web application in which the JSP is deployedand host is the name of the virtual host with which the web application isassociated. For example:For this example, using the default administrative server directory(admin.instance.root=/QIBM/UserData/WebASAdv/default), the servlet forsimple.jsp in Web application examples under virtual host default_host isgenerated in the following directory:/QIBM/UserData/WebASAdv/default/temp/default_host/examples/pagecompile
If the workingDir initial parameter is set for the JSP enabler for your Webapplication, the pagecompile directory and its subdirectories are created underthe directory specified for this parameter.Note: The user profile under which the application server is running must haveauthority to the directory specified by the workingDir parameter. By default, theapplication server runs under the QEJBSVR user profile.The naming convention for the generated files is _jspFileName_xjsp. (If yourJSP file name contains an underscore, the generated file name contains twounderscores in place of each single underscore.) For this example, the JSP filesimple.jsp results in the generation of _simple_xjsp.java and_simple_xjsp.class.Note: The generated servlet class is created as part of the pagecompile package.In other words, the Java source code contains the following package statement:package pagecompile;
Chapter 4. Using the IBM Distributed Debugger for AS/400 69

2. Compile the generated Java code for debug by using the javac -g command.To compile the generated Java code for simple.jsp, you need to have thefollowing items in your class path:v /QIBM/UserData/WebASAdv/default/temp/default_host/examples
This directory contains any helper classes generated as a result of thecontents of the JSP file.
v /QIBM/ProdData/WebASAdv/lib/servlet.jarThis jar contains the servlet API classes.
v /QIBM/ProdData/WebASAdv/lib/server/ibmwebas.jarThis jar contains the necessary JSP compiler classes.
3. Use the CRTJVAPGM command to set the optimization level to 10 for thedebuggable class file. For this example, you should issue the following CLcommand from the AS/400 command line:CRTJVAPGMCLSF(’/QIBM/UserData/WebASAdv/default/temp/default_host/examples/pagecompile/_simple_xjsp.class’) OPTIMIZE(10)
Note: This command has been wrapped for display purposes. Enter thecommand as one line, with no space between examples/ and pagecompile.
4. Your JSP 0.91 is now ready for tracing and debugging.Note: If you modify the JSP file, you need to be sure to stop and restart theapplication server after performing the steps described above to create thedebuggable version in the proper location. Restarting the application servercauses the newly generated servlet code to be loaded.
Debugging a JavaServer Pages 1.0 fileThis scenario describes debugging very_simple.jsp which is installed under thedefault_app Web application when the Sample Configuration has been installed.This scenario involves creating your own Web application and copying thevery_simple.jsp file to the document root of your Web application.1. For this example, create your own Web application as follows:
a. From the Tasks page of the Administrative Console, expand theConfiguration tree item.
b. Select Configure a Web Application and click the Start icon.c. Specify JSPDbgTest for the WebAppName, and ensure that the Enable JSP
1.0 option is selected.d. Click Next.e. Click Next.f. Click Finished.
2. To debug the generated servlet code for the JSP file, configure the JSP 1.0Processor to keep the generated source file:a. From the Topology page of the Administrative Console, expand the
JSPDbgTest Web application tree item (found under Default Server >servletEngine).
b. Select the JSP 1.0 Processor tree item.c. The property page for the JSP 1.0 Processor is displayed on the right side
of the console. Click the Advanced tab of the property page.d. In the Init Parameters field, add the parameter keepgenerated. Specify true
for the Init Parm Value.e. Click Apply.
3. Create the appropriate directories for the Web application created above. Thedirectories are created as subdirectories of the hosts/default_host directory in
70 AS/400 Debugging

the root directory for the administrative server (the root directory for theadministrative server is specified by the admin.instance.root property in theadmin.properties file). For this example, the instance root of the administrativeserver is /QIBM/UserData/WebASAdv/ default. Create the following directoriesunder /QIBM/UserData/WebASAdv/default/hosts/default_host:JSPDbgTest JSPDbgTest/web JSPDbgTest/servlets
4. Copy JSP file very_simple.jsp from/QIBM/ProdData/WebASAdv/hosts/default_host/default_app/web to/QIBM/UserData/WebASAdv/default/hosts/default_host/JSPDebugTest/web. Youare placing the JSP file in the document root of your new Web application sothat the JSP file can be invoked from a browser.
5. Start the Default Server application server. From the Topology page of theAdministrative Console, right-click the Default Server tree item and click Start.If the Default Server is already started, right-click on the JSPDbgTest Webapplication, and select Restart Web App.
6. To cause the code to be generated for the very_simple.jsp file, invoke the JSPfrom a browser as follows:http://yourAS400:yourPort/webapp/JSPDbgTest/very_simple.jsp
Note: The default WebSphere Application Server environment must be runningwith the Default Server application server and your HTTP server instancestarted as well.As a result of the JSP file invocation, the following directory structure iscreated:<admin.instance.root>/temp/default_host/JSPDbgTest/<packageName>
where <admin.instance.root> is the instance root directory for theadministrative server, and <packageName> is a directory structure determined bysubstituting the ’.’ separator in the package name of the generated Java classwith ’/’ file separator. The package to which the generated Java class belongs isa pseudo mangling of the directory structure and can be determined bydisplaying the generated .java file and looking at the package statement. Seethe following information for where the generated .java file can be found. Forthis example, the following directory structure is created:/QIBM/UserData/WebASAdv/default/temp/default_host/JSPDbgTest/QIBM/UserData/WebASAdv/d_00025fault/hosts/_00025efault_0005fhost/JSPDbgTest/web
Note: The above path name has been wrapped for display purposes. Thedirectory path does not contain a space between the second UserData/ and thesecond WebASAdv.Three files are generated as a result of invoking a JSP using the JSP 1.0Processor:v JspFileName.class
v JspFileName_jsp_n.java
v packagenameJspFileName.dat
where JspFileName is the name of the JSP file invoked, n is an integer startingat 1 which is incremented each time the JSP file is invoked after a modificationhas been made to the JSP file, and packagenameJspFileName is the string formedby prepending the package to which the generated Java class belongs to the JSPfile name. The package to which the generated Java class belongs is a pseudomangling of the directory structure and can be determined by displaying thegenerated .java file and looking at the package statement.
The files are created in the following directory structure format:
Chapter 4. Using the IBM Distributed Debugger for AS/400 71
For this example, the following files are generated in the/QIBM/UserData/WebASAdv/default/temp/default_host/JSPDbgTest directory:
very_simple.class very_simple_jsp_1.javaQIBM.UserData.WebASAdv.d_00025fault.hosts._00025efault_0005fhost.JSPDbgTest.webvery_sim
The package statement in the generated .java file for this example is packageQIBM.UserData.WebASAdv.d_00025fault.hosts._00025efault_0005fhost.JSPDbgTest.web;
7. Copy the packageName directory structure created when you invoked the JSP tothe servlets directory for the Web application so that the following directorystructure is created:<admin.instance.root>/hosts/default_host/JSPDbgTest/servlets/<packageName>
where <admin.instance.root> is the instance root for the administrative serverand <packageName> is the package name as a directory structure. For thisexample, the resulting directory structure is (this includes the full path to theservlets directory for the Web application):/QIBM/UserData/WebASAdv/default/hosts/default_host/JSPDbgTest/servlets/QIBM/UserData/WebASAdv/d_00025fault/hosts/_00025efault_0005fhost/JSPDbgTest/web
Note: This path has been wrapped for display purposes. The directory pathdoes not actually have a space between the second QIBM/ and the secondUserData.
8. Copy the generated .java file to the directory created in the previous step. Forthis example, copy the very_simple_jsp_1.jsp file from the/QIBM/UserData/WebASAdv/default/temp/default_host/JSPDbgTest directory tothe following directory:/QIBM/UserData/WebASAdv/default/hosts/default_host/JSPDbgTest/servlets/QIBM/UserData/WebASAdv/QIBM/UserData/WebASAdv/d_00025fault/hosts/_00025efault_0005fhost/JSPDbgTest/web
Note: This path has been wrapped for display purposes. The directory pathdoes not actually have a space between the second servlets/ and the secondQIBM or between the second hosts/ and _0002efault_005fhost.By default, servlets for the JSPDbgTest Web application are looked for in theservlets directory and its subdirectories.To debug the JSP file, you must debug the generated servlet. For JSP fileswhich use the JSP 1.0 Processor, you need to invoke the generated servlet fromyour browser, instead of the JSP file as you are able to do when debugging aJSP 0.91 file.
9. Compile the generated Java code for debug by using the javac -g command.To compile very_simple_jsp_1.java, you need to have the following items inyour class path:v /QIBM/UserData/WebASAdv/default/temp/default_host/JSPDbgTest
This directory contains any helper classes generated as a result of thecontents of the JSP file.
v /QIBM/ProdData/WebASAdv/lib/servlet.jarThis jar contains the servlet API classes.
v /QIBM/ProdData/WebASAdv/lib/server/ibmwebas.jarThis jar contains the necessary JSP compiler classes.
v /QIBM/ProdData/WebASAdv/lib/server/jsp10.jarThis jar contains the IBM JSP 1.0 extensions. It is possible that you will notneed this jar. For more information about the IBM extensions to the JSP 1.0API, see JSP 1.0 programming reference.
72 AS/400 Debugging

10. Use the CRTJVAPGM command to set the optimization level to 10 for thedebuggable class file. For this example, run the following CL command fromthe AS/400 command line:CRTJVAPGMCLSF(’/QIBM/UserData/WebASAdv/default/hosts/default_host/JSPDbgTest/servlets/QIBM/UserData/WebASAdv/d_00025fault/hosts/_00025efault_0005fhost/JSPDbgTest/web/very_simple_jsp_1.class’) OPTIMIZE(10)
Note: This command has been wrapped for display purposes. Enter thecommand as one line, with no space between JSPDbgTest/ and servlets orbetween _00025efault_0005fhost/ and the second JSPDbgTest.
11. Your JSP 1.0 is now ready for tracing and debugging.Note: If you modify the JSP file, you must stop and restart the applicationserver after you perform the steps described above to create the debuggableversion in the proper location. Restarting the application server causes thenewly generated servlet code to be loaded.
Debugging servlets, JSP, and EJB
Setting up WebSphere Application Server V3.02 for debugging servlets, EJB, andJSPSetting up WebSphere Application Server V3.5 for debugging servlets, EJB, and JSPSetting up the client machine for WAS 3.02 and OLT for servlet, EJB, and JSPdebuggingSetting up the client machine for WAS 3.5 and OLT for servlet, EJB, and JSPdebugging
Preparing servlets, EJB, and JSP for debuggingAn EJB exampleA servlet example
Reference information
Debug data and RPG, C, Cobol, and CL compiler optionsDebug data is the symbolic and line number information contained in the programobject that is used by the debugger.
If you want to debug your application, you must first compile your modules orprograms to include debug data.
Language Compile using...
OPM COBOL or RPG either the *SRCDBG or *LSTDBG option.
OPM CL the *SRCDBG option.
ILE COBOL, CL, or RPG the *SOURCE, *LIST, *STMT, or *ALLoption. The default is *STMT (Statementview).
ILE C the *SOURCE, *LIST, *STMT, or *ALLoption. The default is *NONE (no debugdata).
Chapter 4. Using the IBM Distributed Debugger for AS/400 73
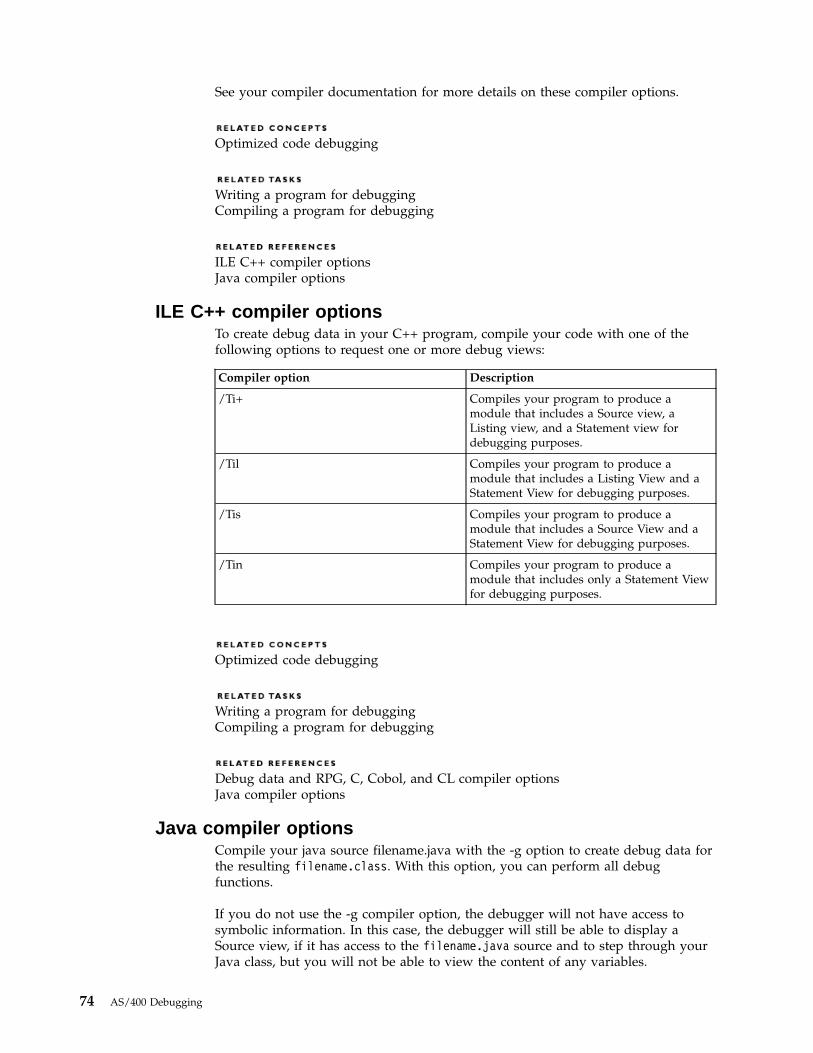
See your compiler documentation for more details on these compiler options.
Optimized code debugging
Writing a program for debuggingCompiling a program for debugging
ILE C++ compiler optionsJava compiler options
ILE C++ compiler optionsTo create debug data in your C++ program, compile your code with one of thefollowing options to request one or more debug views:
Compiler option Description
/Ti+ Compiles your program to produce amodule that includes a Source view, aListing view, and a Statement view fordebugging purposes.
/Til Compiles your program to produce amodule that includes a Listing View and aStatement View for debugging purposes.
/Tis Compiles your program to produce amodule that includes a Source View and aStatement View for debugging purposes.
/Tin Compiles your program to produce amodule that includes only a Statement Viewfor debugging purposes.
Optimized code debugging
Writing a program for debuggingCompiling a program for debugging
Debug data and RPG, C, Cobol, and CL compiler optionsJava compiler options
Java compiler optionsCompile your java source filename.java with the -g option to create debug data forthe resulting filename.class. With this option, you can perform all debugfunctions.
If you do not use the -g compiler option, the debugger will not have access tosymbolic information. In this case, the debugger will still be able to display aSource view, if it has access to the filename.java source and to step through yourJava class, but you will not be able to view the content of any variables.
74 AS/400 Debugging
Note: Java programs that are compiled with the -O option cannot be debugged.
Optimized code debugging
Writing a program for debuggingCompiling a program for debugging
Debug data and RPG, C, Cobol, and CL compiler optionsILE C++ compiler optionsCreating a Java program from Java class
Creating a Java program from a Java classUse the CRTJVAPGM command to create an AS/400 Java program from a Javaclass file. Specify CRTJVAPGM CLSF(xxxxxx) OPTIMIZE(10), where xxxxxx is theclass file. The resulting Java program contains machine-instruction sequences thatare run when the Java program is invoked. The Java program is created atoptimization level 10 to allow debugging.
If, at startup, the debugger does not find a Java program associated with the Javaclass file, it directs the Java Virtual Machine (JVM) to create it.
Compiling a program for debugging
Java compiler options
Debugger environment
Debugger environment settingsThe debugger uses the following environment settings:v Session Settings
– Host Name– Source Path– Port Number– Update Production Files
v JVM Creation Settings– Environment Variables– JNI Library List– Properties
v Batch Job Creation Settings– Environment Variables– Library List
You can change these settings through the Debugger Settings dialog box whichopens when you click on Advanced in the Load Program dialog box. For moreinformation about adding, changing or deleting debugger environment settings,see the related tasks below.
Chapter 4. Using the IBM Distributed Debugger for AS/400 75
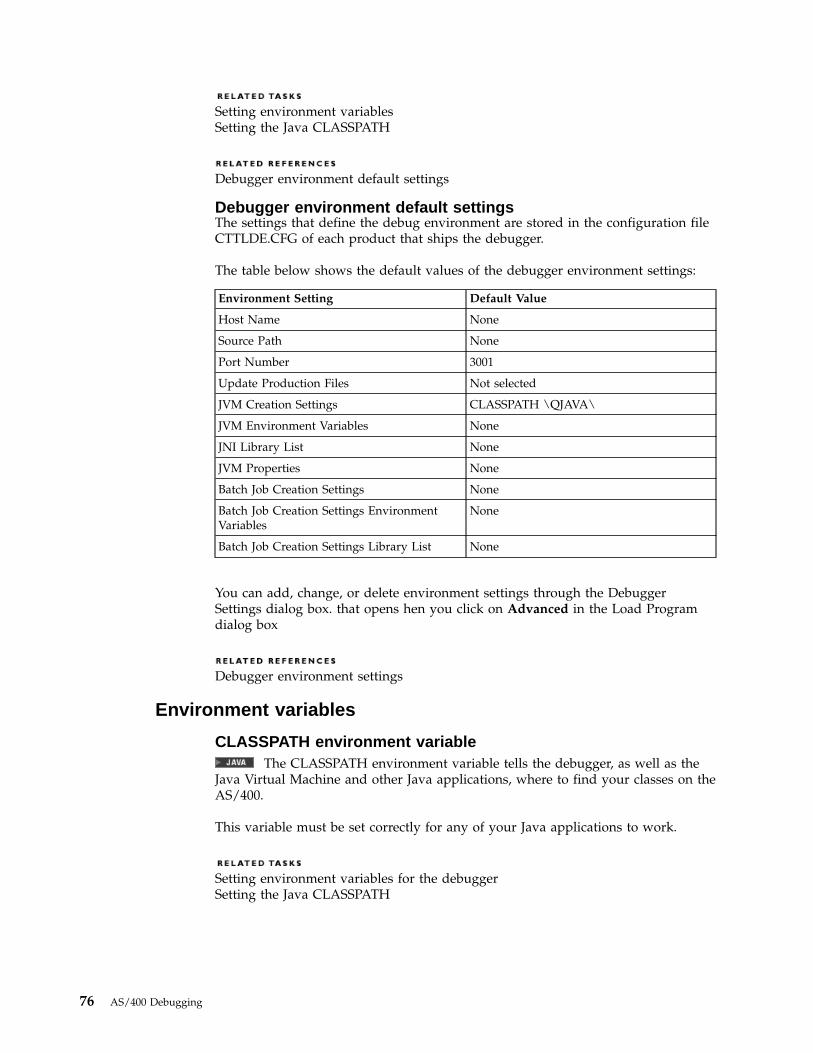
Setting environment variablesSetting the Java CLASSPATH
Debugger environment default settings
Debugger environment default settingsThe settings that define the debug environment are stored in the configuration fileCTTLDE.CFG of each product that ships the debugger.
The table below shows the default values of the debugger environment settings:
Environment Setting Default Value
Host Name None
Source Path None
Port Number 3001
Update Production Files Not selected
JVM Creation Settings CLASSPATH \QJAVA\
JVM Environment Variables None
JNI Library List None
JVM Properties None
Batch Job Creation Settings None
Batch Job Creation Settings EnvironmentVariables
None
Batch Job Creation Settings Library List None
You can add, change, or delete environment settings through the DebuggerSettings dialog box. that opens hen you click on Advanced in the Load Programdialog box
Debugger environment settings
Environment variables
CLASSPATH environment variableThe CLASSPATH environment variable tells the debugger, as well as the
Java Virtual Machine and other Java applications, where to find your classes on theAS/400.
This variable must be set correctly for any of your Java applications to work.
Setting environment variables for the debuggerSetting the Java CLASSPATH
76 AS/400 Debugging

Stepping
Step commandsYou can use step commands in the Source pane to step through your program asingle statement at a time.
The following types of step commands are available:
Step Command Button Shortcut Description
Step Over
F10
Executes the currentstatement, withoutstopping in anyprogram orprocedure calledwithin the statement.
Step Debug
F7
Executes the currentstatement. Executionstops at the nextstatementencountered forwhich debuginformation isavailable. This couldbe in the currentprocedure, in thecalled procedure, orin a procedure calledwithin the calledprocedure.
Program execution may stop earlier than indicated in the step commanddescriptions, if the Distributed Debugger encounters a breakpoint or an exceptionoccurs.
If you issue a step command while debugging a multithreaded application,execution may stop in a different thread.
Stepping through a program
Stepping and procedures
Stepping and proceduresIn a source code line that contains multiple procedure calls, you can choose to stepover all the calls, step through the calls individually, or run to a location in theprogram. Given a complex C++ call such as func1( func2(), func3() );, you cando the following:v Step over the entire line with a single Step Over command.v Step into each called procedure for which debug information is available, with a
series of Step Debug commands. Each time you use Step Debug to step intosuch a procedure, you can then step through the procedure. The debugger stepsover any procedure for which debug data is not available, such as library andsystem functions.
Chapter 4. Using the IBM Distributed Debugger for AS/400 77
v Run to a specific source code line number in the call. When running to alocation, the program will run to a selected statement unless an activebreakpoint is hit, an exception occurs or the end of the program is reached. Theprogram will run to the statement before executing it or any of its procedurecalls. For more information on running to a location in a program, see therelated topic below.
Running to a locationStepping through a program
Step commands
Program name specificationsWhen attaching to an existing AS/400 job, you can enter the program name usingone of the following formats:v Library/program — The debugger searches the specified library for the
program. If the program is not found in the specified library, an error dialog isdisplayed.
v *LIBL/program — All of the libraries in the library list for the job specified inthe Job to debug entry field of the Load Program dialog box are searched untilthe first match for the specified program name is found. If the program is notfound in the library list, an error dialog is displayed.
v *CURLIB/program — The current library for the job specified in the Job todebug entry field is used to locate the program. If you do not have a librarydesigned as the current library, QGPL is searched instead. If the program is notfound, an error dialog is displayed.
v Program — When only the program name is specified, the search path used isthe same as that used for *LIBL/program.
v Class name.
When you load a program without specifying a job, you can enter the programname using one of the following formats:v Library/program — The debugger searches the specified library for the
program. If the program is not found in the specified library, an error dialog isdisplayed.
v Class name.
Starting the debuggerLoading a program without specifying a job from a command lineLoading a program without specifying a job from the debugger user interfaceAttaching to an existing AS/400 job from a command lineAttaching to an existing AS/400 job from the debugger user interface
Job name specifications and getting a job listWhen specifying a job for debugging, a fully qualified AS/400 job name has theformat job/user/number, where:v job is the name of the job as identified to the system, for example,
QPADEV0017.v user is the user profile under which the job is running, for example, MYUSER.v number is the system-assigned job number, for example, 001234.
78 AS/400 Debugging

If the system-assigned job number is known, then specifying it in the format//number will specify a unique job and specification of job and user will not benecessary.
In the Load Program dialog box, you can use one of the following methods toretrieve a subset list of the jobs available on the AS/400 system. Make thefollowing entries in the Job to debug field and click the Job List push button toinvoke the Job List dialog box.v Entering QPADEV0017// gives you a list of jobs with job name QPADEV0017.v Entering /MYUSER/ gives you a list of jobs with user profile MYUSER.v Entering //001234 gives you the job assigned this job number.
You can also specify an abbreviated job name. The following formats aresupported:
Format Description
*, *ALL, blank All occurrences are found.
abc* All occurrences starting with the characterstring abc are found.
abc Only exact matches of the character stringabc are found.
The following examples illustrate how to use these formats:v Entering QPADEV0017/*ALL/ gives you a list of all the jobs in QPADEV0017.v Entering // or leaving the Job to debug field blank gives you a list of all the
jobs on the system.v Entering /G*/ gives you a list of all the jobs that are owned by user IDs that
start with a G.v Entering G*/*/* gives you a list of all the jobs owned by anyone in a job that
starts with a G.
If a wild card indicates a user ID that owns a single job, then specifying the wildcard in this field will cause that job to be used. However, using wild cards toindicate multiple jobs is useful only to filter the list of jobs when the Job List pushbutton is selected. When you select the Load push button, exactly one job must beindicated or an error dialog is displayed.
Starting the debuggerAttaching to an existing AS/400 job from the debugger user interface
Job typesJobs that are running on the AS/400 can be one of the following:v Interactive jobs, which are enabled to run an application with screen
input/output.v Batch jobs.v Batch immediate (BCI) jobs, which are enabled to run a threaded application.
Applications with screen input/output should not be run in a BCI job.
All types of jobs can be attached to by the debugger. When you load a non-Javaapplication without specifying a job, a BCI job is automatically created on theAS/400. When you load a Java class without specifying a job, a Java VirtualMachine (JVM) is created on the AS/400.
Chapter 4. Using the IBM Distributed Debugger for AS/400 79

Starting the debuggerAttaching to an existing AS/400 job from the debugger user interface
Authorities required for debuggingThe user profile that you use to sign on to an AS/400 system in the debuggerLogon dialog must have the following authorities:v *USE authority to the Start Debug (STRDBG) commandv *USE authority to the End Debug (ENDDBG) commandv *USE authority to the Start Service Job (STRSRVJOB) commandv *USE authority to the End Service Job (ENDSRVJOB) commandv Either *CHANGE authority to the program or Java class being debugged, or
*USE authority to the program being debugged and *SERVICE special authority.
If the job that you are debugging is running under a different user profile than theuser profile you use to sign on to the AS/400 system from the debugger, the userprofile that you use to sign on to the AS/400 system from the debugger must havethe following authorities:v *USE authority to the user profile that the job you are debugging is running
under.v *JOBCTL special authority if you do not explicitly use fully qualified program
names (library/program). In other words, if you use *CURLIB or *LIBL or youdo not specify a library name, you need to have *JOBCTL special authority.
The group profile QPGMR gives you the correct authority to the STRDBG,ENDDBG, STRSRVJOB, and ENDSRVJOB commands and *JOBCTL specialauthority.
Preparing for debuggingStarting the debug server
Debugger limitsThe following limits apply when debugging your application:v The largest string that can be displayed is 4080 characters.v The largest number of elements displayed in a COBOL array or an RPG array is
500.v The largest number of fields displayed in a COBOL record or an RPG structure
is 500.v Only 128 characters per line are displayed for the source views retrieved from
the AS/400. Files residing on the PC will have the entire line displayedregardless of the line length.
v Source physical files that have a record size greater than 240 characters cause amessage to be written to the job log for each record read. (The job log that themessages are written to is the job log of the debug server job that is servingyour debug session.) This behavior slows down processing and may cause yourdebug session to end if the job log grows too large.
v Local variables for ILE RPG and COBOL cannot be displayed in the Locals pane.
Debugger performance considerations
80 AS/400 Debugging
Debugger performance considerationsTo get optimal performance from the debugger, consider the following points:
Expression Evaluations
v Complex expressions take longer to evaluate than simple expressions.Performance is only an issue when you are monitoring an expression, since theexpression must be evaluated each time the debugger stops.
v The settings of the Default Monitor Representations affect the performance ofexpression evaluation:– Representing character pointers, arrays, and character arrays as hexadecimal
pointers gives the best performance.– Representing structures using System Defaults performs better than using
User Defaults.– Representing a character array as a string is faster than representing it as an
array.v Evaluating all of the elements of a large array takes longer than evaluating
single elements. Use the Monitors pane to evaluate a single element.
Step PerformanceStep performance is affected by the number of enabled variables or expressions inthe monitors and the complexity of the expression. Step performance can beimproved by:v Disabling or deleting expressions that no longer need to be monitoredv Displaying only single elements of an array.v After following a chain of pointers to a variable, disabling the pointers used and
leaving only the variable active in the monitor.v Completely collapsing the threads in the Locals pane.
Avoid expanding the procedures within a moduleThis function requires a lot of interaction with the AS/400. If a large number ofmethods or procedures are in a module, searching for the method or procedurename by using the Find Method or Find Procedure choice on the Source menu isfaster.
Using PC files instead of AS/400 source membersFor non-C++ or Java programs, performance can be improved by copying the filesto the PC and using the Change text file choice from the Source menu to specifythe path name of the PC file. This technique is especially useful when debuggingfrom remote sites.
Searching for a string in Source view or Listing viewString searches can be speeded up by the following:v Keeping the source file on the workstation.v Using the Find Method or Find Procedure choice to search for methods or
procedures.v Searching the Listing view instead of a Source view that is on the AS/400.
Using the Optional Parameters entry fields on line breakpointsValues specified for these options will significantly slow down your program,because the debugger must stop for the breakpoint and evaluate theFrom/To/Every clause each time. Even though you do not see the program stop, itis in fact stopping so that the debugger can evaluate the stop conditions.
Chapter 4. Using the IBM Distributed Debugger for AS/400 81

If possible, an alternative is to set a conditional breakpoint by specifying anexpression.
Avoid setting a large number of watchesWhen a watch is set, the system checks after each instruction whether the value ofthe watched variable or expression has changed. Setting many watches may lead toslower performance.
Changing the representation of monitor contentsSetting a line breakpointStepping through a program
Debugger limits
Expressions qualified to thread numberWithin a program, every expression is qualified to a specific thread.
If you enable Tool Tip Evaluation for variables, the thread number that a variableis qualified to is displayed in the pop-up. For information on enabling Tool TipEvaluation, see the related topic below.
Note: A variable with the same name (but belonging to different scopes) may havedifferent values on the same thread.
Enabling and using Tool Tip Evaluation for variablesViewing the contents of a variable or expression
Problems getting a Source or Listing viewIf you are in the Statement view of a section of code, you may find that you cannotobtain a Source or Listing view of your code. There are several likely reasons forsuch problems:v The code you are debugging was not compiled with the debug options to
generate a Source or a Listing view.v The debugger is finding a different version of the program than the one you
compiled with the appropriate options.v The code you are debugging was compiled with the appropriate debug
information, but the debugger cannot locate the source code. If you try to switchto a Source or Listing view in this situation, the Source Filename dialog boxopens so that you can enter the path of the source file. If you select Cancel, theview remains a Statement view.
v The code you are debugging was not compiled with the appropriate compileroptions to generate a Source or Listing view, because it is not code you wrote,but code in a service program or other program that your program uses.
Source views
Changing views in the Source paneLocating source code
82 AS/400 Debugging

Values that are valid for the current representationWhen you are entering a value in an entry field in one of the monitors, such as thecontents of a variable, the debugger checks that the value you enter is valid for thecurrent representation of that entry field.
A value is valid for the current representation if it contains only the charactersused for that representation, and does not exceed the length of the variableinvolved. For example, if you want to change the contents of a character string andthe current representation is as a text string, you must enter a new string in doublequotes, and the length of the string must not exceed the declared string size.
Changing the contents of a variable or expression
Previous load program methodsStartup controls and control functionality in previous versions of the AS/400debugger that have changed to those in the Distributed Debugger Load Programdialog box as follows:
Previous debugger version startup control... Is now...
Invocation Mode
Three invocation modes available, including:
v Default, for debugging RPG, COBOL, CL,and regular C and C++ programs.
v Java, for debugging Java AS/400 classes.
v Non-Java Threaded, for debugging C andC++ threaded applications.
Specify the dominant language thedebugger will use
Invocation modes are mapped ontodominant language/job name combinations.The dominant languages supported are RPG,COBOL, CL, Java, C, and C++.
The dominant language determines theterminology used by the debugger.
Program
Specifies the name of the initial program orJava class for the debug session. This field ismandatory.
Specify the name of the program to add todebug
Specifies the name of the initial program orJava class for the debug session. This field isno longer mandatory.
Options
Invokes the Debugger Environment Optionsnotebook.
Advanced
Invokes the Debugger Settings dialog box.
Starting the debuggerLoading a program without specifying a job from the debugger user interface
Chapter 4. Using the IBM Distributed Debugger for AS/400 83

84 AS/400 Debugging

Notices
Note to U.S. Government Users Restricted Rights — Use, duplication or disclosurerestricted by GSA ADP Schedule Contract with IBM Corp.
This information was developed for products and services offered in the U.S.A.IBM may not offer the products, services, or features discussed in this document inother countries. Consult your local IBM representative for information on theproducts and services currently available in your area. Any reference to an IBMproduct, program, or service is not intended to state or imply that only that IBMproduct, program, or service may be used. Any functionally equivalent product,program, or service that does not infringe any IBM intellectual property right maybe used instead. However, it is the user’s responsibility to evaluate and verify theoperation of any non-IBM product, program, or service.IBM may have patents or pending patent applications covering subject matterdescribed in this document. The furnishing of this document does not give youany license to these patents. You can send license inquiries, in writing, to:
IBM Director of LicensingIBM CorporationNorth Castle DriveArmonk, NY 10504-1785U.S.A.
For license inquiries regarding double-byte (DBCS) information, contact the IBMIntellectual Property Department in your country or send inquiries, in writing, to:IBM World Trade Asia CorporationLicensing2-31 Roppongi 3-chome, Minato-kuTokyo 106, Japan
The following paragraph does not apply to the United Kingdom or any othercountry where such provisions are inconsistent with local law:INTERNATIONAL BUSINESS MACHINES CORPORATION PROVIDES THISPUBLICATION “AS IS” WITHOUT WARRANTY OF ANY KIND, EITHEREXPRESS OR IMPLIED, INCLUDING, BUT NOT LIMITED TO, THE IMPLIEDWARRANTIES OR CONDITIONS OF NON-INFRINGEMENT,MERCHANTABILITY OR FITNESS FOR A PARTICULAR PURPOSE. Some statesdo not allow disclaimer of express or implied warranties in certain transactions,therefore, this statement may not apply to you.This information could include technical inaccuracies or typographical errors.Changes are periodically made to the information herein; these changes will beincorporated in new editions of the publication. IBM may make improvementsand/or changes in the product(s) and/or the program(s) described in thispublication at any time without notice.
Any references in this information to non-IBM Web sites are provided forconvenience only and do not in any manner serve as an endorsement of those Websites. The materials at those Web sites are not part of the materials for this IBMproduct and use of those Web sites is at your own risk.
IBM may use or distribute any of the information you supply in any way itbelieves appropriate without incurring any obligation to you.
© Copyright IBM Corp. 1997, 2000 85
Licensees of this program who wish to have information about it for the purposeof enabling: (i) the exchange of information between independently createdprograms and other programs (including this one) and (ii) the mutual use of theinformation which has been exchanged, should contact:
Lab DirectorIBM Canada Ltd.1150 Eglinton Avenue EastToronto, Ontario M3C 1H7Canada
Such information may be available, subject to appropriate terms and conditions,including in some cases, payment of a fee.The licensed program described in this document and all licensed materialavailable for it are provided by IBM under terms of the IBM Customer Agreement,IBM International Program License Agreement or any equivalent agreementbetween us.
Information concerning non-IBM products was obtained from the suppliers ofthose products, their published announcements or other publicly available sources.IBM has not tested those products and cannot confirm the accuracy ofperformance, compatibility or any other claims related to non-IBM products.Questions on the capabilities of non-IBM products should be addressed to thesuppliers of those products.
This information contains examples of data and reports used in daily businessoperations. To illustrate them as completely as possible, the examples may includethe names of individuals, companies, brands, and products. All of these names arefictitious and any similarity to the names and addresses used by an actual businessenterprise is entirely coincidental.
COPYRIGHT LICENSE:This information contains sample application programs in source language, whichillustrates programming techniques on various operating platforms. You may copy,modify, and distribute these sample programs in any form without payment toIBM, for the purposes of developing, using, marketing or distributing applicationprograms conforming to the application programming interface for the operatingplatform for which the sample programs are written. These examples have notbeen thoroughly tested under all conditions. IBM, therefore, cannot guarantee orimply reliability, serviceability, or function of these programs. You may copy,modify, and distribute these sample programs in any form without payment toIBM for the purposes of developing, using, marketing, or distributing applicationprograms conforming to IBM’s application programming interfaces.
Each copy or any portion of these sample programs or any derivative work, mustinclude a copyright notice as follows:© (your company name) (year). Portions of this code are derived from IBM Corp.Sample Programs. © Copyright IBM Corp. 1997, 2000. All rights reserved.
86 AS/400 Debugging

Programming interface information
Programming interface information is intended to help you create applicationsoftware using this program.
General-use programming interfaces allow the customer to write applicationsoftware that obtain the services of this program’s tools.
However, this information may also contain diagnosis, modification, and tuninginformation. Diagnosis, modification and tuning information is provided to helpyou debug your application software.
Warning: Do not use this diagnosis, modification, and tuning information as aprogramming interface because it is subject to change.
© Copyright IBM Corp. 1997, 2000 87

88 AS/400 Debugging

Trademarks and service marks
The following terms are trademarks of International Business MachinesCorporation in the United States, or other countries, or both:v AIXv AS/400v DB2v CICSv CICS/ESAv IBMv IMSv Language Environmentv MQSeriesv Network Stationv OS/2v OS/390v OS/400v RS/6000v S/390v VisualAgev VTAMv WebSphere
Lotus, Lotus Notes and Domino are trademarks or registered trademarks of LotusDevelopment Corporation in the United States, or other countries, or both.
Tivoli Enterprise Console and Tivoli Module Designer are trademarks of TivoliSystems Inc. in the United States, or other countries, or both.
Encina and DCE Encina Lightweight Client are trademarks of Transarc Corporationin the United States, or other countries, or both.
Java and all Java-based trademarks and logos are trademarks or registeredtrademarks of Sun Microsystems, Inc. in the United States and other countries.
ActiveX, Microsoft, SourceSafe, Visual C++, Visual SourceSafe, Windows, WindowsNT, Win32, Win32s and the Windows logo are trademarks or registered trademarksof Microsoft Corporation in the United States, or other countries, or both.
UNIX is a registered trademark in the United States and other countries licensedexclusively through X/Open Company Limited.
Intel and Pentium are trademarks of Intel Corporation in the United States, orother countries, or both.
Other company, product, and service names, which may be denoted by a doubleasterisk(**), may be trademarks or service marks of others.
© Copyright IBM Corp. 1997, 2000 89