distributed generation and combined heat & power · pdf filecombined heat & power...
TRANSCRIPT

Distributed Generation and Combined Heat & Power System Characteristics and Costs in the Buildings Sector
April 2017
Independent Statistics & Analysis
www.eia.gov
U.S. Department of Energy
Washington, DC 20585

U.S. Energy Information Administration | Distributed Generation System and CHP Characteristics and Costs in the Buildings Sector i
This report was prepared for the U.S. Energy Information Administration (EIA), the statistical and analytical agency within the U.S. Department of Energy. By law, EIA’s data, analyses, and forecasts are independent of approval by any other officer or employee of the United States Government. The views in this report therefore should not be construed as representing those of the U.S. Department of Energy or other federal agencies.

April 2017
U.S. Energy Information Administration | Distributed Generation System and CHP Characteristics and Costs in the Buildings Sector 1
Distributed Generation System Characteristics and Costs in the Buildings Sector Distributed generation in the residential and commercial buildings sectors refers to the on-site generation of energy, which is often electricity from renewable energy systems such as solar photovoltaics (PV) and small wind turbines. Many factors influence the market for distributed generation, including government policies at the local, state, and federal levels, and project costs, which vary significantly depending on time, location, size, and application.
As relatively new technologies on the globalized production market, PV and small wind are experiencing significant cost changes through technological progress and economies of scale. The current and future equipment costs of renewable distributed generation are subject to uncertainty. As part of its Annual Energy Outlook (AEO), the U.S. Energy Information Administration (EIA) updates projections to reflect the most current, publicly available historical cost data and uses multiple third-party estimates of future costs in the near and long terms. Performance data are likewise based on currently available technology and expert projections of future technologies.
Before the AEO2017 reporting cycle, EIA contracted with an external consultant to develop cost and performance characterizations of PV, small wind, fuel cells, and combined heat and power (CHP) installations in the building sector.1 Rather than develop two separate paths for residential and commercial, the consultant provided cost and performance data for systems of various sizes at five-year increments beginning in 2015 and ending in 2040. Two levels of future technology optimism were offered: a Reference case and an Advanced case that included lower equipment costs, higher efficiency, or both.
From this information, EIA used national-level average annual costs for a typical system size in each sector. Abbreviated tables of these system sizes and costs are presented in the residential and commercial chapters of the Assumptions to the Annual Energy Outlook. Additional information in the contracted report, such as equipment degradation rates, system life, annual maintenance costs, inverter costs, and conversion efficiency, was adapted for input in the Distributed Generation Submodules of the residential and commercial building sector modules of the National Energy Modeling System.
As described in the assumptions reports, other information not included in the report-such as resource availability, avoided electricity cost, interconnection limitations, incentive amounts, installed capacity-based cost reductions, and other factors-ultimately affect the capacity of distributed generation and CHP added within a given sector, year, and Census division.
For AEO2017, certain assumptions (mainly system costs) have been updated based on reports from Lawrence Berkeley National Laboratory and the National Renewable Energy Laboratory. Table 1 shows the cost and efficiency assumptions for residential and commercial solar photovoltaic and small wind systems used in AEO2013 and AEO2017, with AEO2017 data updated from this report.
1 Distributed generation systems often cost more per unit of capacity than utility-scale systems. A separate analysis involves assumptions for electric power generation plant costs for various technologies, including utility-scale photovoltaics and both onshore and offshore wind turbines used in the Electricity Market Module.

April 2017
U.S. Energy Information Administration | Distributed Generation System and CHP Characteristics and Costs in the Buildings Sector 2
The report, Review of Distributed Generation and Combined Heat and Power Technology Performance and Cost Estimates and Analytic Assumptions for the National Energy Modeling System, is available in Appendix A. When referencing the report, cite it as a report by Leidos, Inc., prepared for the U.S. Energy Information Administration.
Table 1: Efficiency and Capital Cost Assumptions for Selected Years
AEO2013 AEO2017
Year
Representative System
Size (kW) Electrical Efficiency
Installed Capital Cost
($2015/kWDC) Electrical Efficiency
Installed Capital Cost
($2015/kWDC)
Solar Photovoltaic
Residential
2010 3.5 0.150 $7,956.12
2015 4.0 0.175 $5,486.40 0.170 $3,000
2020 5.0 0.192 $4,298.51 0.201 $2,891
2025 5.0 0.197 $4,048.78 0.232 $2,749
2030 5.0 0.200 $3,876.40 0.260 $2,733
2035 5.0 0.200 $3,825.57 0.279 $2,807
Commercial
2010 32.0 0.150 $7,083.15
2015 35.0 0.175 $4,944.95 0.170 $2,750
2020 40.0 0.192 $3,931.65 0.201 $2,669
2025 40.0 0.197 $3,690.75 0.232 $2,558
2030 45.0 0.200 $3,530.53 0.260 $2,555
2035 45.0 0.200 $3,481.91 0.279 $2,625
Small Wind
Residential
2010 2.0 0.130 $8,621.33
2015 3.0 0.130 $7,716.33 0.130 $8,400
2020 3.0 0.130 $7,297.53 0.130 $9,253
2025 3.0 0.130 $6,888.67 0.130 $9,826
2030 4.0 0.130 $6,686.45 0.130 $10,631
2035 4.0 0.130 $6,522.91 0.130 $11,503
Commercial
2010 32.0 0.130 $5,793.60
2015 35.0 0.130 $5,210.15 0.130 $5,900
2020 40.0 0.130 $4,737.20 0.130 $6,463
2025 40.0 0.130 $4,390.23 0.130 $6,826
2030 50.0 0.130 $4,107.34 0.130 $7,345
2035 50.0 0.130 $4,007.89 0.130 $7,903 Note: kWDC = kilowatts of direct current

April 2017
U.S. Energy Information Administration | Distributed Generation System and CHP Characteristics and Costs in the Buildings Sector 3
APPENDIX A

EOP III Task 7965, Subtask 11 Review of Distributed Generation and Combined Heat and Power Technology Performance and Cost Estimates and Analytic Assumptions for the National Energy Modeling System U.S. Energy Information Administration Office of Energy Analysis Office of Energy Consumption and Efficiency Analysis
May 27, 2016


EOP III Task 7965, Subtask 11 Review of Distributed Generation and Combined Heat and Power Technology Performance and Cost Estimates and Analytic Assumptions for National Energy Modeling System U.S. Energy Information Administration Office of Energy Analysis Office of Energy Consumption and Efficiency Analysis
May 2016

This report has been prepared for the use of the client for the specific purposes identified in the report. The conclusions, observations and recommendations contained herein attributed to Leidos constitute the opinions of Leidos. To the extent that statements, information and opinions provided by the client or others have been used in the preparation of this report, Leidos has relied upon the same to be accurate, and for which no assurances are intended and no representations or warranties are made. Leidos makes no certification and gives no assurances except as explicitly set forth in this report.
© 2016 Leidos, Inc. All rights reserved.

File: EIA | 209089
Review of Distributed Generation and Combined Heat and Power Technology
U.S. Energy Information Administration
Table of Contents
Table of Contents List of Tables List of Figures
Section 1 INTRODUCTION .................................................................................... 1-1 1.1 Technologies Assessed ............................................................................ 1-2
Section 2 GENERAL BASIS FOR TECHNOLOGY EVALUATION BASIS ....................................................................................................................... 2-23
2.1 Leidos Background ................................................................................ 2-23 2.2 Base Fuel Characteristics ....................................................................... 2-23 2.3 Base Technology Descriptions .............................................................. 2-24
2.3.1 Photovoltaic ............................................................................... 2-24 2.3.2 Wind ........................................................................................... 2-27 2.3.3 Fuel Cell ..................................................................................... 2-29 2.3.4 Reciprocating Engine ................................................................. 2-32 2.3.5 Natural Gas Micro-turbine ......................................................... 2-35 2.3.6 Natural Gas Turbine ................................................................... 2-36 2.3.7 Combined Cycle......................................................................... 2-38
2.4 Cost Estimation Methodology ............................................................... 2-39 2.4.1 Capital Cost ................................................................................ 2-39 2.4.2 Operation and Maintenance (O&M) Expenses .......................... 2-40
Section 3 RESIDENTIAL ......................................................................................... 3-1 3.1 Residential - Small Solar Photovoltaic (RSS) ......................................... 3-1
3.1.1 Equipment and Systems ............................................................... 3-1 3.1.2 Technology Specifications ........................................................... 3-1 3.1.3 Capital Cost Estimate ................................................................... 3-2 3.1.4 O&M Estimate ............................................................................. 3-2 3.1.5 Reference Technologies Projections ............................................ 3-3 3.1.6 Advanced Technologies Projections ............................................ 3-4
3.2 Residential – Wind System (RWS).......................................................... 3-5 3.2.1 Equipment and Systems ............................................................... 3-5 3.2.2 Technology Specifications ........................................................... 3-5 3.2.3 Capital Cost Estimate ................................................................... 3-5 3.2.4 O&M Estimate ............................................................................. 3-6 3.2.5 Reference Technologies Projections ............................................ 3-6

Table of Contents
ii Leidos, Inc. File: EIA | 209089
3.2.6 Advanced Technologies Projections ............................................ 3-7 3.3 Residential – Fuel Cell System (RFC)..................................................... 3-9
3.3.1 Equipment and Systems ............................................................... 3-9 3.3.2 Technology Specifications ........................................................... 3-9 3.3.3 Capital Cost Estimate .................................................................. 3-9 3.3.4 O&M Estimate ........................................................................... 3-10 3.3.5 Reference Technologies Projections .......................................... 3-11 3.3.6 Advanced Technologies Projections .......................................... 3-12
Section 4 COMMERCIAL ....................................................................................... 4-1 4.1 Commercial – Small Solar Photovoltaic System (CSS) .......................... 4-1
4.1.1 Equipment and Systems ............................................................... 4-1 4.1.2 Technology Specifications ........................................................... 4-1 4.1.3 Capital Cost Estimate .................................................................. 4-2 4.1.4 O&M Estimate ............................................................................. 4-2 4.1.5 Reference Technologies Projections ............................................ 4-3 4.1.6 Advanced Technologies Projections ............................................ 4-5
4.2 Commercial – Large Solar Photovoltaic System (CLS) .......................... 4-5 4.2.1 Equipment and Systems ............................................................... 4-6 4.2.2 Technology Specifications ........................................................... 4-6 4.2.3 Capital Cost Estimate .................................................................. 4-6 4.2.4 O&M Estimate ............................................................................. 4-7 4.2.5 Reference Technologies Projections ............................................ 4-7 4.2.6 Advanced Technologies Projections ............................................ 4-9
4.3 Commercial – Wind System (CWS)...................................................... 4-10 4.3.1 Equipment and Systems ............................................................. 4-10 4.3.2 Technology Specifications ......................................................... 4-10 4.3.3 Capital Cost Estimate ................................................................ 4-10 4.3.4 O&M Estimate ........................................................................... 4-11 4.3.5 Reference Technologies Projections .......................................... 4-11 4.3.6 Advanced Technologies Projections .......................................... 4-12
4.4 Commercial - Fuel Cell (CFC) .............................................................. 4-15 4.4.1 Equipment and Systems ............................................................. 4-15 4.4.2 Technology Specifications ......................................................... 4-16 4.4.3 Capital Cost Estimate ................................................................ 4-16 4.4.4 O&M Estimate ........................................................................... 4-17 4.4.5 Reference Technologies Projections .......................................... 4-17 4.4.6 Advanced Technologies Projections .......................................... 4-18
4.5 Commercial – Natural Gas Reciprocating Engine (CNE) ..................... 4-21 4.5.1 Equipment and Systems ............................................................. 4-21 4.5.2 Technology Specifications ......................................................... 4-21 4.5.3 Capital Cost Estimate ................................................................ 4-22 4.5.4 O&M Estimate ........................................................................... 4-22 4.5.5 Reference Technologies Projections .......................................... 4-23 4.5.6 Advanced Technologies Projections .......................................... 4-24
4.6 Commercial – Oil Reciprocating Engine (COE) ................................... 4-26 4.6.1 Equipment and Systems ............................................................. 4-26

Table of Contents
File: EIA | 209089 Leidos, Inc. iii
4.6.2 Technology Specifications ......................................................... 4-26 4.6.3 Capital Cost Estimate ................................................................. 4-26 4.6.4 O&M Estimate ........................................................................... 4-27 4.6.5 Reference Technologies Projections .......................................... 4-28 4.6.6 Advanced Technologies Projections .......................................... 4-29
4.7 Commercial – Natural Gas Turbine (CNT) ........................................... 4-30 4.7.1 Equipment and Systems ............................................................. 4-30 4.7.2 Technology Specifications ......................................................... 4-30 4.7.3 Capital Cost Estimate ................................................................. 4-30 4.7.4 O&M Estimate ........................................................................... 4-31 4.7.5 Reference Technologies Projections .......................................... 4-32 4.7.6 Advanced Technologies Projections .......................................... 4-33
4.8 Commercial – Natural Gas Micro-turbine (CNM) ................................ 4-35 4.8.1 Equipment and Systems ............................................................. 4-35 4.8.2 Technology Specifications ......................................................... 4-35 4.8.3 Capital Cost Estimate ................................................................. 4-36 4.8.4 O&M Estimate ........................................................................... 4-36 4.8.5 Reference Technologies Projections .......................................... 4-37 4.8.6 Advanced Technologies Projections .......................................... 4-38
Section 5 INDUSTRIAL ........................................................................................... 5-1 5.1 Industrial – Natural Gas Reciprocating Engine-1,000 kW (IRE1) .......... 5-1
5.1.1 Equipment and Systems ............................................................... 5-1 5.1.2 Technology Specifications ........................................................... 5-1 5.1.3 Capital Cost Estimate ................................................................... 5-1 5.1.4 O&M Estimate ............................................................................. 5-2 5.1.5 Reference Technologies Projections ............................................ 5-3 5.1.6 Advanced Technologies Projections ............................................ 5-4
5.2 Industrial – Natural Gas Reciprocating Engine – 3,000 kW (IRE3).................................................................................................................. 5-6 5.2.1 Equipment and Systems ............................................................... 5-6 5.2.2 Technology Specifications ........................................................... 5-6 5.2.3 Capital Cost Estimate ................................................................... 5-6 5.2.4 O&M Estimate ............................................................................. 5-7 5.2.5 Reference Technologies Projections ............................................ 5-8 5.2.6 Advanced Technologies Projections ............................................ 5-9
5.3 Industrial – Natural Gas Turbine (IGT5) ............................................... 5-10 5.3.1 Equipment and Systems ............................................................. 5-10 5.3.2 Technology Specifications ......................................................... 5-10 5.3.3 Capital Cost Estimate ................................................................. 5-11 5.3.4 O&M Estimate ........................................................................... 5-12 5.3.5 Reference Technologies Projections .......................................... 5-13 5.3.6 Advanced Technologies Projections .......................................... 5-15
5.4 Industrial – Natural Gas Turbine – 10,000 kW (IGT10) ....................... 5-15 5.4.1 Equipment and Systems ............................................................. 5-15 5.4.2 Technology Specifications ......................................................... 5-16 5.4.3 Capital Cost Estimate ................................................................. 5-17

Table of Contents
iv Leidos, Inc. File: EIA | 209089
5.4.4 O&M Estimate ........................................................................... 5-18 5.4.5 Reference Technologies Projections .......................................... 5-19 5.4.6 Advanced Technologies Projections .......................................... 5-20
5.5 Industrial – Natural Gas Turbine – 25,000 kW (IGT25) ....................... 5-21 5.5.1 Equipment and Systems ............................................................. 5-21 5.5.2 Technology Specifications ......................................................... 5-21 5.5.3 Capital Cost Estimate ................................................................ 5-22 5.5.4 O&M Estimate ........................................................................... 5-23 5.5.5 Reference Technologies Projections .......................................... 5-24 5.5.6 Advanced Technologies Projections .......................................... 5-25
5.6 Industrial – Natural Gas Turbine – 40,000 kW (IGT40) ....................... 5-26 5.6.1 Equipment and Systems ............................................................. 5-26 5.6.2 Technology Specifications ......................................................... 5-27 5.6.3 Capital Cost Estimate ................................................................ 5-27 5.6.4 O&M Estimate ........................................................................... 5-28 5.6.5 Reference Technologies Projections .......................................... 5-29 5.6.6 Advanced Technologies Projections .......................................... 5-30
5.7 Industrial – Combined Cycle – 100,000 kW (ICC) ............................... 5-31 5.7.1 Equipment and Systems ............................................................. 5-31 5.7.2 Technology Specifications ......................................................... 5-32 5.7.3 Capital Cost Estimate ................................................................ 5-32 5.7.4 O&M Estimate ........................................................................... 5-33 5.7.5 Reference Technologies Projections .......................................... 5-34 5.7.6 Advanced Technologies Projections .......................................... 5-35
List of Appendices A Acronyms B References C Technology Definitions and Calculations

Table of Contents
File: EIA | 209089 Leidos, Inc. v
List of Tables Table 1-1 List of Technologies ................................................................................... 1-3 Table 2-1 Natural Gas Specification ......................................................................... 2-23 Table 2-2 Fuel Oil Specification ............................................................................... 2-24 Table 2-3 Technology Performance Specifications .................................................. 2-42 Table 3-1 Base Plant Site Capital Cost Estimate for RSS .......................................... 3-2 Table 3-2 O&M Expenses for RSS (5 kW) ................................................................ 3-3 Table 3-3 Residential O&M - Small PV – Reference New Equipment (1) .................. 3-3 Table 3-4 Residential O&M - Small PV – 2015 Degraded Equipment ...................... 3-3 Table 3-5 Residential Capital Costs - Small PV – Reference New Equipment .......... 3-4 Table 3-6 Residential O&M - Small PV – Advanced New Equipment ...................... 3-4 Table 3-7 Residential Capital Costs - Small PV – Advanced New Equipment ......... 3-5 Table 3-8 Base Plant Site Capital Cost Estimate for RWS ......................................... 3-6 Table 3-9 O&M Expenses for RWS (10 kW) ............................................................. 3-6 Table 3-10 Residential O&M - Wind – Reference New Equipment .......................... 3-6 Table 3-11 Residential O&M - Wind – 2015 Degraded Equipment .......................... 3-7 Table 3-12 Residential Capital Costs - Wind – Reference New Equipment .............. 3-7 Table 3-13 Residential O&M - Wind – Advanced New Equipment .......................... 3-9 Table 3-14 Residential Capital Costs - Wind – Advanced New Equipment .............. 3-9 Table 3-15 Base Plant Site Capital Cost Estimate for RFC ...................................... 3-10 Table 3-16 O&M Expenses for RFC ........................................................................ 3-10 Table 3-17 Residential O&M - Fuel Cell – Reference New Equipment .................. 3-11 Table 3-18 Residential O&M - Fuel Cell – 2015 Degraded Equipment................... 3-11 Table 3-19 Residential Capital Costs - Fuel Cell – Reference New Equipment
........................................................................................................................ 3-12 Table 3-20 Residential O&M - Fuel Cell – Advanced New Equipment .................. 3-14 Table 3-21 Residential Capital Costs - Fuel Cell – Advanced New Equipment
........................................................................................................................ 3-14 Table 4-1 Base Plant Site Capital Cost Estimate for CSS .......................................... 4-2 Table 4-2 O&M Expenses for CSS ............................................................................. 4-3 Table 4-3 Commercial O&M - Small PV – Reference New Equipment (1) ................ 4-3 Table 4-4 Commercial O&M - Small PV - 2015 Degraded Equipment ..................... 4-4 Table 4-5 Commercial Capital Costs - Small PV - Reference New Equipment ......... 4-4 Table 4-6 Commercial O&M - Small PV - Advanced New Equipment..................... 4-5 Table 4-7 Commercial Capital Costs - Small PV - Advanced New Equipment
.......................................................................................................................... 4-5 Table 4-8 Base Plant Site Capital Cost Estimate for CLS Cost .................................. 4-7 Table 4-9 O&M Expenses for CLS system ................................................................ 4-7 Table 4-10 Commercial O&M - Large PV – Reference New Equipment (1) .............. 4-8 Table 4-11 Commercial O&M - Large PV – 2015 Degraded Equipment .................. 4-8 Table 4-12 Commercial Capital Costs - Large PV – Reference New Equipment
.......................................................................................................................... 4-9 Table 4-13 Commercial O&M- Large PV – Advanced New Equipment ................... 4-9 Table 4-14 Commercial Capital Costs - Large PV – Advanced New Equipment
........................................................................................................................ 4-10
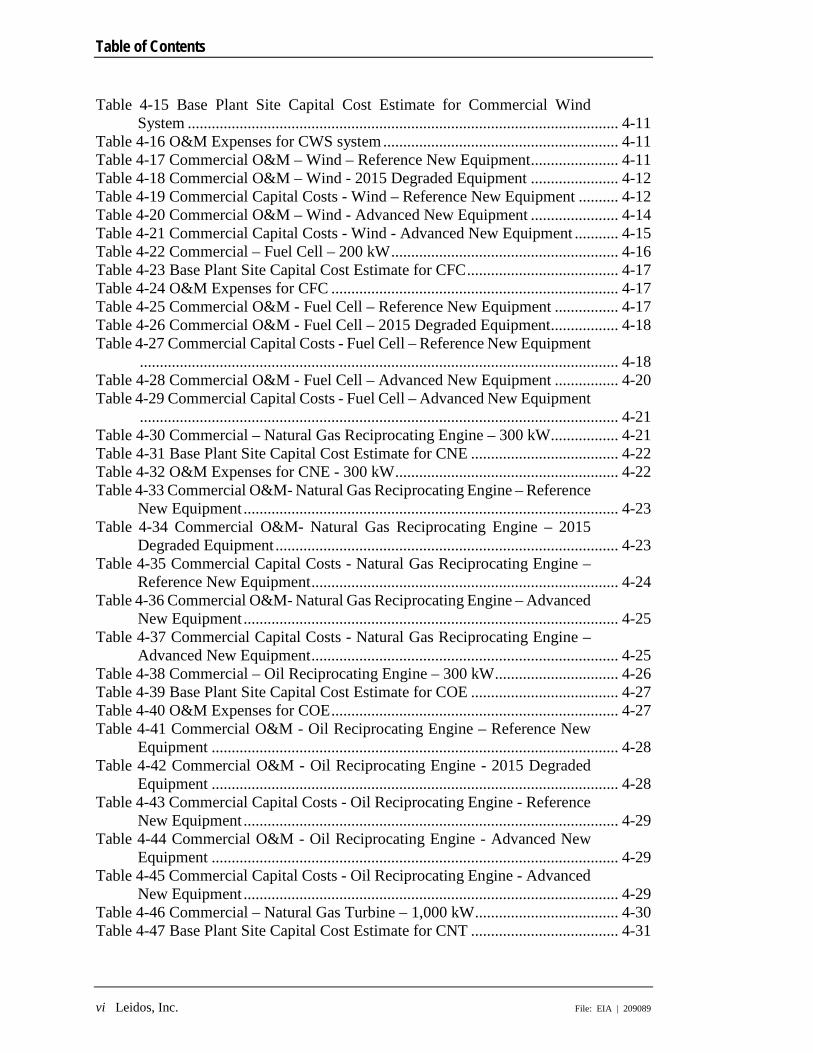
Table of Contents
vi Leidos, Inc. File: EIA | 209089
Table 4-15 Base Plant Site Capital Cost Estimate for Commercial Wind System ............................................................................................................ 4-11
Table 4-16 O&M Expenses for CWS system ........................................................... 4-11 Table 4-17 Commercial O&M – Wind – Reference New Equipment ...................... 4-11 Table 4-18 Commercial O&M – Wind - 2015 Degraded Equipment ...................... 4-12 Table 4-19 Commercial Capital Costs - Wind – Reference New Equipment .......... 4-12 Table 4-20 Commercial O&M – Wind - Advanced New Equipment ...................... 4-14 Table 4-21 Commercial Capital Costs - Wind - Advanced New Equipment ........... 4-15 Table 4-22 Commercial – Fuel Cell – 200 kW ......................................................... 4-16 Table 4-23 Base Plant Site Capital Cost Estimate for CFC ...................................... 4-17 Table 4-24 O&M Expenses for CFC ........................................................................ 4-17 Table 4-25 Commercial O&M - Fuel Cell – Reference New Equipment ................ 4-17 Table 4-26 Commercial O&M - Fuel Cell – 2015 Degraded Equipment................. 4-18 Table 4-27 Commercial Capital Costs - Fuel Cell – Reference New Equipment
........................................................................................................................ 4-18 Table 4-28 Commercial O&M - Fuel Cell – Advanced New Equipment ................ 4-20 Table 4-29 Commercial Capital Costs - Fuel Cell – Advanced New Equipment
........................................................................................................................ 4-21 Table 4-30 Commercial – Natural Gas Reciprocating Engine – 300 kW ................. 4-21 Table 4-31 Base Plant Site Capital Cost Estimate for CNE ..................................... 4-22 Table 4-32 O&M Expenses for CNE - 300 kW ........................................................ 4-22 Table 4-33 Commercial O&M- Natural Gas Reciprocating Engine – Reference
New Equipment .............................................................................................. 4-23 Table 4-34 Commercial O&M- Natural Gas Reciprocating Engine – 2015
Degraded Equipment ...................................................................................... 4-23 Table 4-35 Commercial Capital Costs - Natural Gas Reciprocating Engine –
Reference New Equipment ............................................................................. 4-24 Table 4-36 Commercial O&M- Natural Gas Reciprocating Engine – Advanced
New Equipment .............................................................................................. 4-25 Table 4-37 Commercial Capital Costs - Natural Gas Reciprocating Engine –
Advanced New Equipment ............................................................................. 4-25 Table 4-38 Commercial – Oil Reciprocating Engine – 300 kW ............................... 4-26 Table 4-39 Base Plant Site Capital Cost Estimate for COE ..................................... 4-27 Table 4-40 O&M Expenses for COE ........................................................................ 4-27 Table 4-41 Commercial O&M - Oil Reciprocating Engine – Reference New
Equipment ...................................................................................................... 4-28 Table 4-42 Commercial O&M - Oil Reciprocating Engine - 2015 Degraded
Equipment ...................................................................................................... 4-28 Table 4-43 Commercial Capital Costs - Oil Reciprocating Engine - Reference
New Equipment .............................................................................................. 4-29 Table 4-44 Commercial O&M - Oil Reciprocating Engine - Advanced New
Equipment ...................................................................................................... 4-29 Table 4-45 Commercial Capital Costs - Oil Reciprocating Engine - Advanced
New Equipment .............................................................................................. 4-29 Table 4-46 Commercial – Natural Gas Turbine – 1,000 kW .................................... 4-30 Table 4-47 Base Plant Site Capital Cost Estimate for CNT ..................................... 4-31

Table of Contents
File: EIA | 209089 Leidos, Inc. vii
Table 4-48 O&M Expenses for CNT 1,000 kW ....................................................... 4-31 Table 4-49 Commercial O&M - Natural Gas Turbine – Reference New
Equipment ....................................................................................................... 4-32 Table 4-50 Commercial O&M - Natural Gas Turbine – 2015 Degraded
Equipment ....................................................................................................... 4-32 Table 4-51 Commercial Capital Costs- Natural Gas Turbine – Reference New
Equipment ....................................................................................................... 4-33 Table 4-52 Commercial O&M - Natural Gas Turbine – Advanced New
Equipment ....................................................................................................... 4-34 Table 4-53 Commercial Capital Costs- Natural Gas Turbine – Advanced New
Equipment ....................................................................................................... 4-35 Table 4-54 Commercial – Natural Gas Micro-turbine – 250 kW ............................. 4-35 Table 4-55 Base Plant Site Capital Cost Estimate for CNM .................................... 4-36 Table 4-56 O&M Expenses for CNM ....................................................................... 4-37 Table 4-57 Commercial O&M- Natural Gas Micro-turbine – Reference New
Equipment ....................................................................................................... 4-37 Table 4-58 Commercial O&M- Natural Gas Micro-turbine - 2015 Degraded
Equipment ....................................................................................................... 4-38 Table 4-59 Commercial Capital Costs- Natural Gas Micro-turbine - Reference
New Equipment .............................................................................................. 4-38 Table 4-60 Commercial O&M- Natural Gas Micro-turbine - Advanced New
Equipment ....................................................................................................... 4-39 Table 4-61 Commercial Capital Costs- Natural Gas Micro-turbine - Advanced
New Equipment .............................................................................................. 4-40 Table 5-1 Industrial – Natural Gas Reciprocating Engine – 1,000 kW ...................... 5-1 Table 5-2 Base Plant site Capital Cost Estimate for IRE1 .......................................... 5-2 Table 5-3 O&M Expenses for IRE1 ........................................................................... 5-2 Table 5-4 Industrial O&M – Natural Gas Reciprocating Engine – Reference
New Equipment ................................................................................................ 5-3 Table 5-5 Industrial O&M – Natural Gas Reciprocating Engine – 2015
Degraded Equipment ........................................................................................ 5-3 Table 5-6 Industrial Capital Costs – Natural Gas Reciprocating Engine –
Reference New Equipment ............................................................................... 5-4 Table 5-7 Industrial O&M – Natural Gas Reciprocating Engine – Advanced
New Equipment ................................................................................................ 5-5 Table 5-8 Industrial Capital Costs – Natural Gas Reciprocating Engine –
Advanced New Equipment ............................................................................... 5-5 Table 5-9 Industrial – Natural Gas Reciprocating Engine – 3,000 kW ...................... 5-6 Table 5-10 Base Plant Site Capital Cost Estimate for IRE3 ....................................... 5-7 Table 5-11 O&M Expenses for IRE3.......................................................................... 5-7 Table 5-12 Industrial O&M – Natural Gas Reciprocating Engine – Reference
New Equipment ................................................................................................ 5-8 Table 5-13 Industrial O&M – Natural Gas Reciprocating Engine – 2015
Degraded Equipment ........................................................................................ 5-8 Table 5-14 Industrial Capital Costs – Natural Gas Reciprocating Engine –
Reference New Equipment ............................................................................... 5-9

Table of Contents
viii Leidos, Inc. File: EIA | 209089
Table 5-15 Industrial O&M – Natural Gas Reciprocating Engine – Advanced New Equipment ................................................................................................ 5-9
Table 5-16 Industrial Capital Costs – Natural Gas Reciprocating Engine – Advanced New Equipment ............................................................................... 5-9
Table 5-17 Industrial – Natural Gas Turbine – 5,000 kW ........................................ 5-11 Table 5-18 Base Plant Site Capital Cost Estimate for IGT5 ..................................... 5-12 Table 5-19 O&M Expenses for IGT5 ....................................................................... 5-12 Table 5-20 Industrial O&M - Natural Gas Turbine – Reference New
Equipment ...................................................................................................... 5-13 Table 5-21 Industrial O&M - Natural Gas Turbine – 2015 Degraded
Equipment ...................................................................................................... 5-14 Table 5-22 Industrial Capital Costs - Natural Gas Turbine – Reference New
Equipment ...................................................................................................... 5-14 Table 5-23 Industrial O&M - Natural Gas Turbine – Advanced New
Equipment ...................................................................................................... 5-15 Table 5-24 Industrial Capital Costs - Natural Gas Turbine – Advanced New
Equipment ...................................................................................................... 5-15 Table 5-25 Industrial – Natural Gas Turbine – 10,000 kW ...................................... 5-17 Table 5-26 Base Plant Site Capital Cost Estimate for IGT10 ................................... 5-18 Table 5-27 O&M Expenses for IGT10 ..................................................................... 5-18 Table 5-28 Industrial O&M - Natural Gas Turbine – Reference New
Equipment ...................................................................................................... 5-19 Table 5-29 Industrial O&M - Natural Gas Turbine – 2015 Degraded
Equipment ...................................................................................................... 5-19 Table 5-30 Industrial Capital Costs - Natural Gas Turbine – Reference New
Equipment ...................................................................................................... 5-20 Table 5-31 Industrial O&M - Natural Gas Turbine – Advanced New
Equipment ...................................................................................................... 5-20 Table 5-32 Industrial Capital Costs - Natural Gas Turbine – Advanced New
Equipment ...................................................................................................... 5-21 Table 5-33 Industrial Natural Gas Turbine – 25,000 kW ......................................... 5-22 Table 5-34 Base Plant Site Capital Cost Estimate for IGT25 ................................... 5-23 Table 5-35 O&M Expenses for IGT25 ..................................................................... 5-23 Table 5-36 Industrial O&M - Natural Gas Turbine – Reference New
Equipment ...................................................................................................... 5-24 Table 5-37 Industrial O&M - Natural Gas Turbine – 2015 Degraded
Equipment ...................................................................................................... 5-24 Table 5-38 Industrial Capital Costs - Natural Gas Turbine – Reference New
Equipment ...................................................................................................... 5-25 Table 5-39 Industrial O&M - Natural Gas Turbine – Advanced New
Equipment ...................................................................................................... 5-25 Table 5-40 Industrial Capital Costs - Natural Gas Turbine – Advanced New
Equipment ...................................................................................................... 5-26 Table 5-41 Industrial – Natural Gas Turbine – 40,000 kW ...................................... 5-27 Table 5-42 Base Plant Site Capital Cost Estimate for IGT40 ................................... 5-28 Table 5-43 O&M Expenses for IGT40 ..................................................................... 5-28

Table of Contents
File: EIA | 209089 Leidos, Inc. ix
Table 5-44 Industrial O&M - Natural Gas Turbine – Reference New Equipment ....................................................................................................... 5-29
Table 5-45 Industrial O&M - Natural Gas Turbine – 2015 Degraded Equipment ....................................................................................................... 5-29
Table 5-46 Industrial Capital Costs - Natural Gas Turbine – Reference New Equipment ....................................................................................................... 5-30
Table 5-47 Industrial O&M - Natural Gas Turbine – Advanced New Equipment ....................................................................................................... 5-30
Table 5-48 Industrial Capital Costs - Natural Gas Turbine – Advanced New Equipment ....................................................................................................... 5-30
Table 5-49 Industrial – Combine Cycle – 100,000 kW ........................................... 5-32 Table 5-50 Base Plant Site Capital Cost Estimate for ICC ....................................... 5-33 Table 5-51 O&M Expenses for ICC ......................................................................... 5-33 Table 5-52 Industrial O&M - Combined Cycle – Reference New Equipment ......... 5-34 Table 5-53 Industrial O&M - Combined Cycle – 2015 Degraded Equipment ......... 5-34 Table 5-54 Industrial Capital Costs - Combined Cycle – Reference New
Equipment ....................................................................................................... 5-35 Table 5-55 Industrial O&M - Combined Cycle – Advanced New Equipment ......... 5-37 Table 5-56 Industrial Capital Costs - Combined Cycle – Advanced New
Equipment ....................................................................................................... 5-37

Table of Contents
x Leidos, Inc. File: EIA | 209089
List of Figures Figure 2.1: Basic Parts of a Small Wind Electrical System ..................................... 2-28 Figure 2.2: Alkali Fuel Cell ..................................................................................... 2-30 Figure 2.3: Solid Oxide Fuel Cell ............................................................................ 2-30 Figure 2.4: PAFC and PEM Fuel Cells ................................................................... 2-31 Figure 2.5: Molten Carbonate Fuel Cell .................................................................. 2-32 Figure 2.6: Gas Engine Basic Components ............................................................. 2-34 Figure 5.1: GT Design Configuration ...................................................................... 5-10 Figure 5.2: GT Design Configuration ...................................................................... 5-16 Figure 5.3: GT Design Configuration ...................................................................... 5-21 Figure 5.4: Industrial Natural Gas Turbine Configuration ...................................... 5-26 Figure 5.5: Industrial Combined Cycle Design Configuration ................................ 5-31

File: EIA | 209089
Section 1 INTRODUCTION
This report (Report) presents the Leidos Engineering, LLC (Leidos) technology performance and cost assessment of distributed generation (DG) and combined heat and power (CHP) systems for residential and commercial building applications and industrial installations for various technologies. The technologies selected within the residential, commercial, and industrial sectors were specified by the Office of Energy Analysis within the U.S. Energy Information Administration (EIA) based upon the existing technologies represented in the National Energy Modeling System (NEMS). The assessment for each of the technologies considered includes the following: The reference, or first year of operation, is assumed to commence January 2015. Forward-looking assumptions are projected through 2040, in intervals of 5-year
periods. The “Reference New Equipment” tables assume new equipment is installed every
five years starting in 2015 through year 2040. This allows for a comparison of new equipment performance and cost estimates across the projection period. Differences consistently account for functional efficiency improvements, equipment and installation cost reductions due to improvement, and equipment and installation cost escalation.
The degraded equipment tables assume new equipment is installed in 2015 and that equipment continues to operate and degrade in performance through 2040, with the exception of inverter life expectancies as noted in the individual tables.
The work presented represents reference year and projected years’ technology characterizations for DG and CHP equipment performance.
The cost estimates includes site preparation, structures, equipment, electrical, distributable cost, engineering and design and subcontractor fee and budget contingency. All costs are based on prices and wages for the Gulf Coast Region of the U.S. with no unusual location impacts (e.g., urban construction constraints) or infrastructure needs (e.g., a project-dedicated interconnection upgrade cost). Regional cost factors can be used to adjustment costs for each EMM region (see Table 2-4 in Section 2).
Performance parameters include electric heat rate based on the higher heating value1 of the fuel, electric generating efficiency, total CHP efficiency, and fuel input rate.
Other reported design and financial parameters include overnight construction costs, first year of residential/commercial/industrial application, typical unit size, contingencies, fixed and variable operating costs,..
1 The higher heating value of a fuel is defined as the amount of heat released by a specified quantity once it is combusted and the products have returned to a temperature of 25ºC, which takes into account the latent heat of vaporization of water in the combustion products.
Section 1
1-2 Leidos, Inc. File: EIA | 209089
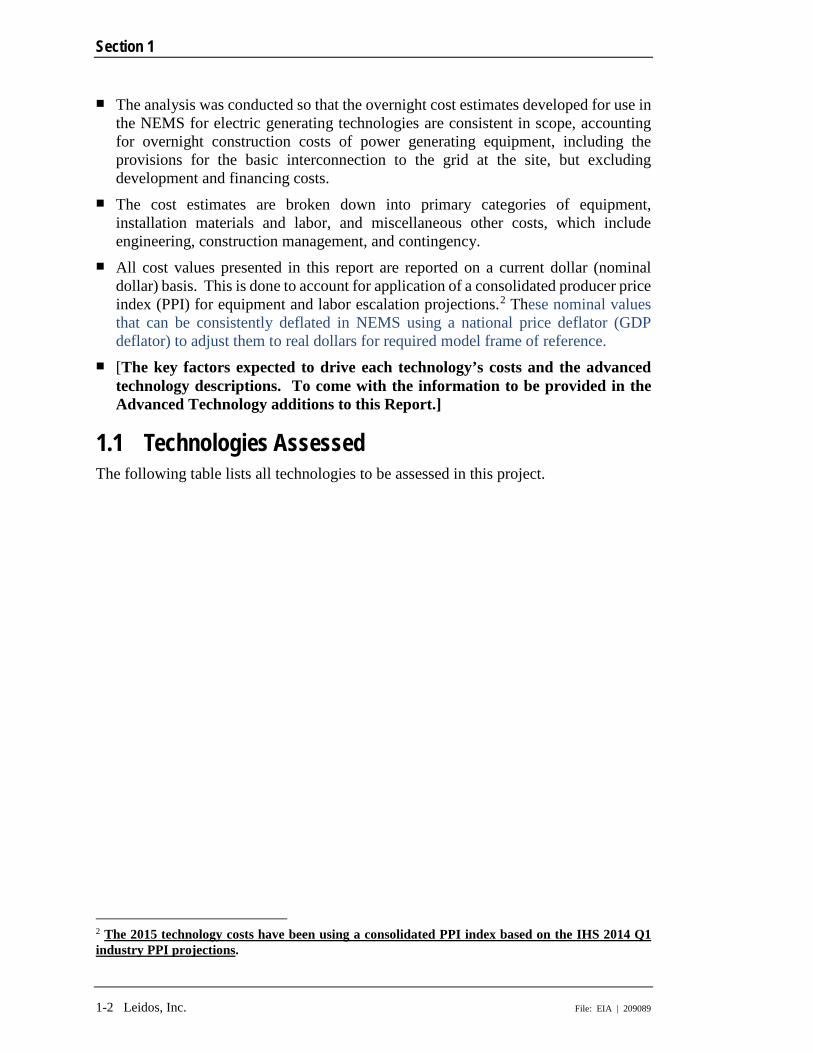
The analysis was conducted so that the overnight cost estimates developed for use in the NEMS for electric generating technologies are consistent in scope, accounting for overnight construction costs of power generating equipment, including the provisions for the basic interconnection to the grid at the site, but excluding development and financing costs.
The cost estimates are broken down into primary categories of equipment, installation materials and labor, and miscellaneous other costs, which include engineering, construction management, and contingency.
All cost values presented in this report are reported on a current dollar (nominal dollar) basis. This is done to account for application of a consolidated producer price index (PPI) for equipment and labor escalation projections.2 These nominal values that can be consistently deflated in NEMS using a national price deflator (GDP deflator) to adjust them to real dollars for required model frame of reference.
[The key factors expected to drive each technology’s costs and the advanced technology descriptions. To come with the information to be provided in the Advanced Technology additions to this Report.]
1.1 Technologies Assessed The following table lists all technologies to be assessed in this project.
2 The 2015 technology costs have been using a consolidated PPI index based on the IHS 2014 Q1 industry PPI projections.

INTRODUCTION
File: 000000/99-99999-99999-9999 Leidos, Inc. 1-3
Table 1-1. List of Technologies and Nominal System Capacity TECHNOLOGY NOMINAL SYSTEM CAPACITY
RESIDENTIAL Residential – Small Solar Photovoltaic (<10 kW (1)) 5 kW Residential – Wind 10 kW Residential – Fuel Cell 10 kW COMMERCIAL Commercial – Small Solar Photovoltaic (<100 kW) 40 kW Commercial – Large Solar Photovoltaic (100-1,000 kW) 500 kW Commercial – Wind 100 kW Commercial – Fuel Cell 200 kW Commercial – Natural Gas Engine 300 kW Commercial – Oil-fired Engine 300 kW Commercial – Natural Gas Turbine 1,000 kW Commercial – Natural Gas Micro-turbine 250 kW INDUSTRIAL Industrial – Reciprocating Engine 1,000 kW Industrial – Reciprocating Engine 3,000 kW Industrial – Natural Gas Turbine 5,000 kW Industrial – Natural Gas Turbine 10,000 kW Industrial – Natural Gas Turbine 25,000 kW Industrial – Natural Gas Turbine 40,000 kW Industrial – Combined Cycle (2) 100,000 kW
(1) Kilowatt-alternating current (kW) (2) Combined Cycle configuration is (2) 40 megawatt (MW) natural gas combustion turbines and
(1) 20 MW steam turbine.


GENERAL BASIS FOR TECHNOLOGY EVALUATION BASIS
File: EIA | 209089 Leidos, Inc. 2-23
Section 2 GENERAL BASIS FOR TECHNOLOGY EVALUATION BASIS
This Section specifies the general evaluation basis used for all technologies reviewed herein.
2.1 Leidos Background Leidos is a science and technology solutions leader working to address some of the world’s toughest challenges in national security, health and engineering. The company’s 20,000 employees support vital missions for our government and the commercial sector, develop innovative solutions to drive better outcomes and defend our Nation’s digital and physical infrastructure from ‘new world’ threats. Our engineering business makes ‘What If’ possible for utility; manufacturing and industrial; lender and developer; oil, gas, and chemical; and government clients. Particularly, Leidos has supported the purchase, sale, financing, and owner’s advisory consulting for tens-of-billions of dollars of power plants across the world in all commercial power generating technologies, as well as many emerging technologies. This background has supported Leidos’ acumen with respect to construction costs, operating costs, technology development and evolution, as well as trends in environmental regulation and compliance.
2.2 Base Fuel Characteristics This Section provides a general fuel basis for each of the fuel types utilized by the technologies considered in this Report and listed in Table 1-1. Each of the technologies that combust a fuel has the ability to operate over a range of fuels; thus, Table 2-1 and Table 2-2 show a typical fuel specification for natural gas and fuel oil, respectively. For equipment that might engage in fuel oil operations, the fuel oil specifications imposed by the original equipment manufacturer typically follow those recommendations provided for in American Standards for Testing and Materials D396 - Standard Specification for Fuel Oils, Grades No. 1, 2, 4, and 4 (Light).
Table 2-1. Natural Gas Specification
Component Volume Percentage Methane CH4 93.9 Ethane C2H6 3.2 Propane C3H8 0.7 n-Butane C4H10 0.4 Carbon Dioxide CO2 1.0 Nitrogen N2 0.8 Total 100.0

2-24 Leidos, Inc. File: EIA | 209089
Table 2-1. Natural Gas Specification
Component Volume Percentage LHV (1) HHV (2)
kJ/kg (3) MJ/scm (4)
47.764 35
52,970 39
Btu/lb (5) Btu/scf (6)
20,552 939
22,792 1,040
(1) Lower Heat Value (LHV). (2) Higher Heat Value (HHV). (3) Kilo joules per kilogram (kJ/kg). (4) Mega joules per standard cubic meter (MJ/scm). (5) British thermal units per pound (Btu/lb). (6) Btu/standard cubic feet (Btu/scf).
Table 2-2. Fuel Oil Specification
Component Volume Percentage General Hydrocarbon CxHy (1)4 100
LHV HHV kJ/kg 32,000-45,000 35,520-49,950
Btu/lb 13,757-19,347 15,271-21,475
(1) CxHy with “x” being greater than 6.
2.3 Base Technology Descriptions This Section provides the descriptions of the base technologies analyzed.
2.3.1 Photovoltaic Large, utility scale photovoltaic (PV) projects require extensive resources to design, develop and finance. DG PV has certain advantages in residential and commercial markets, where smaller PV facilities at multiple sites can address energy needs, as opposed to a single large generating facility. DG has an advantage in that the energy is used where it is generated, eliminating the need for transmission and related losses and expenses from transmission.
DG is the domain of individual residential and commercial customers who install PV modules on rooftops to serve part or all of their own electrical energy needs.
A PV array produces direct current (DC) electricity from sunlight absorbed by PV modules. Multiple PV modules are connected together to create a PV array, and thereby increasing the amount of DC electricity produced. However, alternating current (AC) electricity is used in homes and buildings, which requires the use of a DC-to-AC

File: 000000/99-99999-99999-9999 Leidos, Inc. 2-25
inverter, where the DC electricity is converted to AC electricity. The AC electricity is then connected to the electrical infrastructure of the host’s site and can either be consumed by the host or sold back to the utility.
Residential and commercial PV arrays are typically installed on rooftops, but can also be mounted on shade structures, carports, or on ground-mounted racking. The size of a residential PV array depends on the available rooftop area with adequate solar resource, most often south facing roofs free of shading obstructions. The size of commercial PV installations also varies depending on the available roof space; a small stand-alone commercial building, such as a small retail store, will have a smaller PV capacity compared to a large retail store, industrial warehouse, or distribution center.
One of the main advantages of DG PV is that there are no transmission requirements and the generation can be electrically connected to the host’s existing electric service. Electrical transformers, which increase the voltage of the generated electricity up to transmission voltage, are not necessary. PV systems for residential and commercial applications are typically connected to the grid, allowing for delivery of surplus electricity generation back to the utility. Grid connection is required to meet the host’s electrical needs when the PV array is not generating power, such as during night time and on low-irradiance days.
A DG PV installation generally consists of PV modules, electrical wiring and conduit, DC-to-AC inverters, racking hardware, protection, disconnection and metering equipment. PV modules are generally the same size and shape, whether installed in residential, commercial, or utility-scale facilities.
PV systems are generally designed with a higher DC versus AC capacity to optimize the amount of electrical generation per installed DC capacity. A typically designed DC:AC ratio is 1.3:1, yet it can vary depending on each specific design anywhere from 1:1 to 1.4:1.
Residential systems can use string inverters, micro-inverters, or a combination of DC power optimizers and string inverters. The use of string inverters requires that individual modules be wired in series prior to being connected to the inverter. These series-wired configurations of solar modules are referred to as strings; hence, the terminology “string inverter.” In residential installations, string inverters are typically mounted on an external wall or near the existing electrical box in the garage or basement.
A micro-inverter is a module-level inverter, where the DC power of each individual module is directly converted to AC power. Micro-inverters allow the output of each module to be controlled individually, which can be an advantage in residential installations where shading may impact the modules.
A DC optimizer is a module-level DC-to-DC convertor that controls the DC output of each module, thereby minimizing mismatch losses between the modules in a string. In the case of a DC optimizer, the modules are still connected in strings, which are in turn connected to a string inverter.
Large commercial installations typically use string inverters or central inverters. In the former case, multiple string inverters may be mounted on a commercial rooftop. In the

2-26 Leidos, Inc. File: EIA | 209089
latter case, one or more large central inverters may be located externally on the ground-level (such as in a parking lot area) or inside the building’s electrical room. Smaller retail buildings do not typically have the space for larger central inverters, and are more likely to use either string inverters or micro-inverters.
In addition to power losses from the inverter during the conversion of DC electricity to AC electricity, other power losses are inherent in PV installations. These losses include system-level degradation, shading, soiling, snow, and wiring losses. Generally, Leidos considers a system-level degradation of approximately 0.75 percent per year as standard for a system utilizing standard, high quality crystalline silicon PV modules. (Most module manufacturers do not have 25-years of module performance data, and typically only warrant ~0.7% annual module degradation beyond the first year of operation.) Shading losses depend on the specific site conditions, such as nearby trees, roof structures, and adjacent buildings. Soiling losses are caused by dirt and other organic build-up on the modules. In regions with appreciable snowfall, there will be losses associated with snow cover on the panels during the winter months. The orientation angle of the PV modules with respect to the sun impacts the production of the modules. The ideal orientation is for the PV modules to be as near as possible to direct 90 degree (°) alignment with the sun at all times. To accomplish this, some installations utilize single-axis tracking equipment, which tilt the modules to follow the sun throughout the day, albeit along a single axis. Single-axis trackers are most common in utility-scale installations in high irradiance areas, such as the southwest United States (U.S.). Tracking equipment is not typically used in DG installations, as it requires additional equipment, design, and cost; the space and load constraints of rooftop installations rule out the use of such tracking systems. Dual axis tracking systems are more commonly used in concentrating PV systems, and are not typically used with conventional PV panels.
PV installations without tracking capabilities are known as fixed-tilt systems. Most residential PV arrays are mounted at the prevailing angle of the existing roof. For commercial and industrial roofs, which are typically low-slope or flat, there are options to install modules flat or build racking systems to tilt the modules at an angle. The factors that need to be considered include space constraints, allowable roof loads, wind exposure, maintenance, and shading from roofing structures or adjacent buildings.
The optimum tilt angle is close to the latitude of the installation. However, larger tilt angles (such as those used in ground-mount installations) would cause large up-lift forces on rooftop-mounted modules due to wind loads. Thus, most commercial rooftop systems utilize ballasted racking with the modules tilted at a slight angle, typically no more than 10° from horizontal.
Crystalline silicon and thin film are two major PV module technologies used in residential, commercial, and utility-scale installations. Crystalline silicon PV modules are the most common PV technology for residential and commercial installations, while thin film sees the majority of its use in utility-scale installations.
There are two types of thin film PV that have reached an appreciable installed base in the PV market: cadmium telluride (CdTe) PV modules and copper indium gallium diselenide (CIGS) PV modules. CdTe is used in the form of mono-crystalline thin films,

File: 000000/99-99999-99999-9999 Leidos, Inc. 2-27
whereas CIGS is mainly used in the form of polycrystalline thin films. While, the differences between these two types are fairly significant, module construction differences of mono versus poly are not that significant, and for the purposes of this report, a discussion of mono versus poly does not add much to the discourse. First Solar is the leading manufacturer of CdTe PV modules and Solar Frontier is the leading manufacturer of CIGS PV modules. Both of these thin film manufacturers utilize rigid glass modules, which are similar in mechanical construction to crystalline silicon modules. Certain types of thin film PV technology is well-suited for flexible substrates, and several companies have worked on developing flexible modules for building-integrated or building-applied PV applications (i.e., as shingles or laminates to be directly adhered to a roof). However, none of these technologies have reached an appreciable installed base in the marketplace.
DG PV installations are growing rapidly. In the first quarter of 2014, a total of 1,330 MW-DC of PV generating capacity was added in the U.S., of which 232 MW DC was residential and 225 MW-DC was commercial. Additionally, the first quarter of 2014 was the first time since 2002 that residential PV installation capacity exceeded commercial installations within the U.S. per “Solar Market Insight Report 2014 Q1,” GTM Research and the Solar Energy Industries Association Solar Energy Industries Association First Quarter Study.” The residential installations in the first quarter of 2014 are a 38 percent increase over the capacity installed in the first quarter of 2013.
The scope of this Report includes the review of distributed solar technology at the 5-kW size for residential applications, and 40-kW and 500-kW sizes for commercial applications. For all of these cases, the use of crystalline silicon modules has been assumed.
2.3.2 Wind Distributed wind, as defined by the U.S. Department of Energy, Energy Efficiency and Renewable Energy Wind and Water Power Technologies, is based on a wind project’s location to the end user and power distribution infrastructure and not on the size of technology or project. Distributed wind energy systems are connected either on the customer side of the meter or directly to the local grid, in comparison to the utility wholesale power generated from large wind farms that is sent via a transmission line to substations for distribution. Distributed wind energy systems are commonly installed on residential, agricultural, commercial, institutional, and industrial sites. Distributed wind systems can vary in size from a 1 kW or smaller wind turbine, which is off the grid, to a 10 kW turbine at a home site to several multi-MW turbines at a manufacturing site or university campus.
Wind energy systems typically include a rotor, a tail, a tower, a generator, wiring, and balance of plant components such as inverters, controllers and potentially batteries. The wind passes through the blades of the rotor causing the mechanical rotary motion to drive the generator. The generator produces AC electricity.
Small wind turbines are considered in two groups, either horizontal axis or vertical axis. The most common are the horizontal axis turbines, which typically have two or three blades that are made of a composite material like fiberglass. The rotor diameter defines the swept area, that is the quantity of wind intercepted by the wind turbine. The rotor

2-28 Leidos, Inc. File: EIA | 209089
assembly, generator, and tail assembly are all attached to the top of a tower. The tower can be two types – either a free-standing, self-supporting tower or a guy-wired tower (guyed towers). Guyed towers could be comprised of lattice sections, pipe or tubing with guy wires and a foundation. The radius for guy wires on guyed towers are typically one-half to three-quarters of the tower height resulting in a space issue. Tilt down towers can be lowered to the ground to allow for maintenance but are typically for wind turbines that are 5 kW or smaller.
Source: U.S. Department of Energy, Energy Efficiency and Renewable Energy
Figure 2-1. Basic Parts of a Small Wind Electrical System During the 11-year period between 2003 and 2013, approximately 842 MW of distributed wind turbine capacity was installed in the U.S., representing approximately 72,000 turbines. The 842 MW of distributed wind turbine capacity at the end of 2013 compares to 812 MW of capacity at the end of 2012, or approximately 3.7 percent higher. In 2013, approximately 30.4 MW (2,700 turbines) of new distributed wind capacity was installed in the U.S., compared to approximately 175 MW (3,800 turbines) of new distributed wind capacity installed during 2012. Of the 30.4 MW installed during 2013, 24.8 MW was represented by 18 turbines, with sizes over 100 kW, on nine projects. The remaining 5.6 MW installed in 2013 was represented by the remaining approximately 2,682 turbines with sizes below 100 kW. Of the 175 MW installed during 2012, 138 MW was for turbines sized greater than 1 MW, 19 MW was for turbines sized between 100 kW and 1 MW, and the remaining 18.4 MW was for turbines sized below 100 kW.
The reasons for the reduction of installed capacity from 2012 to 2013 of approximately 83 percent include phased out incentives, such as the U.S. Treasury cash grant in-lieu of a 30-percent investment tax credit program along with other state and federal programs; reduced funding through the U.S. Department of Agriculture Rural Energy for America Program, which funded 25 wind projects in 2013 with $1.2 million in grants as compared to funding 57 wind projects in 2012 with $2.6 million in grants; competitive photovoltaic and natural gas prices; and lack of consumer confidence in turbine reliability.

File: 000000/99-99999-99999-9999 Leidos, Inc. 2-29
The scope of this Report includes the review of distributed wind technology of up to the 10-kW level for residential applications and from 10 kW to 100 kW for commercial applications. Midsize turbines that range in size between 101 kW and 1 MW and utility turbines greater than 1 MW were not included in the review.
2.3.3 Fuel Cell A fuel cell is a device that generates electricity through a chemical reaction. Every fuel cell has one positive electrode and one negative electrode. The electrodes are where the reactions take place that produce electricity. Every fuel cell has an electrolyte, which carries electrically charged ions from one electrode to the other and a catalyst, which increases the speed of the reactions at the electrodes.
Fuel cells work by hydrogen atoms entering at the anode where a chemical reaction strips electrons and the hydrogen atoms are ionized – carrying a positive electrical charge. The negatively charged electrons provide current to produce electricity. If AC is required, the DC output from the fuel cell is routed to an inverter for conversion from DC to AC. Oxygen enters the fuel cell at the cathode where it either combines with the electrons returning from the electrical circuit and the hydrogen ions that have traveled through the electrolyte from the anode or the oxygen picks up electrons and then travels through the electrolyte to the anode and there it combines with the hydrogen ions. Some fuel cells require pure hydrogen and, therefore, require equipment such as a reformer to purify the fuel to the fuel cell.
Since each fuel cell develops a relatively low voltage, the cells are stacked to produce a higher, more useful voltage. Depending on the type of fuel cell, high temperature waste heat from the process may be available for cogeneration applications.
There are five main types of fuel cells: alkali, solid oxide fuel cell (SOFC), phosphoric acid fuel cell (PAFC), proton exchange membrane (PEM), and molten carbonate fuel cells (MCFC). Alkali, MCFC, and PAFC all use liquid electrolytes, whereas, PEM and SOFC use solid electrolytes. All five types of fuel cells are discussed in detail below.
Alkali Fuel Cell Alkali fuel cells operate on compressed hydrogen and oxygen. They typically use a solution of potassium hydroxide in water as the electrolyte. Alkali fuel cells have an efficiency of about 70 percent with operating temperatures between 150 to 200 degrees Celsius (°C) (about 300 to 400 degrees Fahrenheit (°F)). The output from alkali fuel cells can vary between 300 watts to 5 kW.

2-30 Leidos, Inc. File: EIA | 209089
Source: Fuel Cell Basics
Figure 2-2. Alkali Fuel Cell
Solid Oxide Fuel Cell (SOFC) SOFCs use a ceramic compound such as calcium oxide or zirconium oxide as the electrolyte. Efficiency of SOFC is about 60 percent with operating temperatures of about 1,000 °C (1,800 °F). SOFC cells can output up to 100 kW. The waste heat, due to the high operating temperatures, can be recycled to make additional electricity.
Source: Fuel Cell Basics
Figure 2-3. Solid Oxide Fuel Cell

File: 000000/99-99999-99999-9999 Leidos, Inc. 2-31
Phosphoric Acid Fuel Cell (PAFC) PAFCs use phosphoric acid as the electrolyte. The efficiency for PAFC ranges between 40 and 80 percent with operating temperatures between 150 to 200 °C (about 300 to 400 °F). PAFC have outputs of up to 200 kW and units as large as 11 MW have been tested.
Source: Fuel Cell Basics
Figure 2-4. PAFC and PEM Fuel Cells
Proton Exchange Membrane (PEM) PEM fuel cells work with a polymer electrolyte in the form of a thin, permeable sheet. The efficiency of PEM fuel cells is about 40 to 50 percent with operating temperatures of about 80 °C (175 °F). The output from PEM fuel cells is typically in the range of 50 to 250 kW. Because these fuel cells operate at low temperatures, they can be used for homes and automobiles.
Molten Carbonate Fuel Cell (MCFC) MCFC use high temperature compounds of salt carbonates such as sodium or magnesium for the electrolyte. MCFC efficiencies are in the typically in the range of 60 to 80 percent with operating temperatures of about 650 °C (1,200 °F). The MCFC have been built with output of up to 2 MW and designs of up to 100 MW.

2-32 Leidos, Inc. File: EIA | 209089
Source: Fuel Cell Basics
Figure 2-5. Molten Carbonate Fuel Cell The use of fuel cells in DG installations has increased greatly over the last few years. Based on the ICF International CHP installation database, the number of fuel cell units installed has increased from 57 units in 2008 to 154 units as of July 2013. In terms of capacity, in 2008, there were 18.7 MWs and as of July 2013 the capacity 68.13 MWs, which is an increase of 49.3 MWs. Additionally, this data also shows that the capacity per installation has increased since 2008 from 0.33 MWs to 0.44 MWs. As of July 2013, 82 percent of the installed fuel cell units in the U.S. are located in three states with incentive programs: California (78 units), New York (26 units), and Connecticut (22 units).
The scope of this report includes the review of distributed fuel cell technology at the 50 kW size for residential applications, and 200 kW size for commercial applications using proton exchange membrane technology.
2.3.4 Reciprocating Engine Reciprocating engines have been used across multiple industries and are a mature and well-known technology. A reciprocating engine is an internal combustion engine, which utilizes fuel gas or fuel oil as its fuel supply. Also known as a piston engine, a reciprocating engine mixes fuel with air compressed by a piston in a cylinder, which is ignited, causing controlled combustion producing additional pressure used to drive a piston. The energy released by sequential combustion in multiple cylinders is converted from reciprocating motion of pistons into rotational motion using connecting rods attached to a crankshaft. The rotating crankshaft drives an electric generator. Heat released by combustion can be recovered to produce hot water and/ or steam. Reciprocating engines can be either 4-stroke cycle or 2-stroke cycle, the former being more prevalent and is the type considered in this Report. There are also other configurations, including multiple crankshafts, which are untypical. Reciprocating engines may be either naturally aspirated, using the suction from the piston to entrain the combustion air, turbocharged, using an exhaust-driven turbine-compressor to pressurize the combustion air supply, or to a lesser degree, equipped with

File: 000000/99-99999-99999-9999 Leidos, Inc. 2-33
mechanically-driven combustion air blowers. Turbocharged and blower-equipped units produce a higher power output for a given engine displacement, whereas, naturally aspirated units have lower output but also lower initial costs and require less maintenance. Natural gas-fueled engines are typically the engine of choice due to emission requirements in the U.S.; however, diesel, heavy fuel oil, landfill gas, and biofuels can also be used to power reciprocating engines.
Reciprocating engines require fresh air, fuel, and a combustion source for each power stroke. There are two methods used to initiate combustion in the cylinders of reciprocating engines, spark ignition and compression ignition. Oil-based fuels such as diesel, heavy fuel oil, and biofuels, will auto-ignite in compression ignition engines without the need of a spark; however, gas fuels, such as natural gas or landfill gas, must use either spark ignition or pilot oil (dual fuel) to initiate combustion because these fuels do not ignite spontaneously upon compression (auto-ignite) at the operating pressures of these engines. The use of dual-fuel engines has more recently fallen out of favor due to the higher emissions that result from using pilot oil ignition.
Electric generation efficiencies of reciprocating engines range from 30 percent to 40 percent LHV for small naturally aspirated engines, and near 50 percent for larger turbocharged engines. Commercially available reciprocating engines for power generation range from 0.5 kW to over 14 MW. Reciprocating engines can be used in a variety of ways due to their relatively large power output to unit size (power density), well-developed technology, attractive lead times, and recoverable thermal output. Applications for reciprocating engines include continuous or prime power generation, peak shaving, backup power, remote power, stand-by power, and CHP. Reciprocating engines are also used extensively as direct mechanical drives in applications such as water pumping, air and gas compression, chilling/refrigeration, and vehicle and ship propulsion.
There are four sources of useable waste heat from a reciprocating engine: exhaust gas, engine jacket, lube oil, and turbocharger. Recovered heat is in the form of hot water or low pressure steam (<30 pounds per square inch gauge (psig)). Some industrial CHP applications use the engine exhaust gas heat directly for process drying. Generally, the hot water and low pressure steam produced by reciprocating engine CHP systems is appropriate for low to moderate temperature process needs, space heating, potable water heating, and chilled water production, air conditioning, and/or refrigeration (via absorption chillers). Commercial and industrial uses of engine-produced CHP where hot water or low pressure steam is required include hospitals, universities, water treatment facilities, factories, steel mills, and food processing plants.
Reciprocating engines can operate at air-to-fuel ratios from 16:1 to more than 50:1, and compression ratios typically ranging between 14:1 and 23:1. Emissions control equipment is often required due to the composition of the exhausting combustion gases. The primary pollutants from reciprocating engines are nitrogen oxides (NOX), carbon monoxide (CO), and volatile organic compounds.
Reciprocating engine technology has improved dramatically over the past three decades, primarily driven by economic and environmental pressures for power density improvements, increased fuel efficiency and reduced emissions. The emissions

2-34 Leidos, Inc. File: EIA | 209089
signature of natural gas spark ignition engines in particular has improved significantly in the last decade through better design and control of the combustion process and through the use of exhaust catalysts. Low NOX level emissions are available with advanced lean burn natural gas engines. Manufacturers often supply emissions equipment that can be added to the diesel fired engines in order to comply with U.S. Environmental Protection Agency (EPA) Tier-4 emissions levels. In addition, there are third-party providers who offer the same emissions-related options.
Source: Clarke-Energy
Figure 2-6. Gas Engine Basic Components
Oil Fired Reciprocating Engine Reciprocating engines of the commercial size considered for this study (300 kW) are typically packaged as a generator set designed for standby, peaking, or rental duty, which is typically in the range of 500-2,000 hours per year.
The scope of this Report includes the review of distributed oil-fired reciprocating engine technology at the 300-kW level for commercial applications, which operate at 1,800 revolutions per minute (RPM), have 6 cylinders, and have compression ignition, but are re-rated at a lower output for continuous duty. The scope of this Report does

File: 000000/99-99999-99999-9999 Leidos, Inc. 2-35
not include larger oil-fired engines, because of the emissions limitations placed upon stationary electric generating service in the U.S.
Gas-Fired Reciprocating Engine Compared to the commercial oil-fired reciprocating engines, all engines in these categories are spark-ignited. The scope of this Report includes the review of distributed natural gas-fired reciprocating engine technology at the 300-kW level for commercial applications, which are rated for continuous duty, operate at 1,200 RPM, and have 8 cylinders.
The scope of this Report includes the review of distributed reciprocating engine technology at the 1,000-kW and 3,000-kW level for industrial applications, which are rated for continuous duty, operate at 1,800 RPM and 900 RPM, respectively, and have 16 cylinders and 12 cylinders, respectively.
2.3.5 Natural Gas Micro-turbine Micro-turbines are small electricity generators that most commonly burn natural gas, although alternative fuels such as gasoline, kerosene, and diesel fuel/distillate heating oil can also be used. Much in the way conventional gas turbines burn natural gas, micro-turbines use the fuel to create high-speed rotation utilizing the Brayton Cycle, which in turn rotates an electrical generator, which produces electricity. Micro-turbines are typically configured with one or two shafts. Micro-turbines often have operating speeds in the 60,000 to 120,000 RPM range depending on the manufacturer.
In some cases, Micro-turbines can be utilized in CHP operation and widely used in distributed generation applications. In the CHP application, the exhaust heat from the Micro-turbine passes, if equipped, through a recuperator, which further heats the outlet air from the compressor prior to combustion resulting in higher gas turbine efficiencies. The exhaust gas from the turbine pass through the recuperator then through a heat exchanger, which transfers the heat to a fluid (usually water), which can then be utilized for secondary purposes such as central heating, domestic hot water production, chilled water, and ice storage systems. In current applications, exhaust temperatures from Micro-turbines might range from 500 °F to upwards of 750 °F, depending on the manufacturer.
Field testing on microturbines began in 1997.3 In 2005 the microturbine technologies were rapidly evolving, and a 2005 report to the World Bank cited the leading manufacturers as promising a 50% reduction in capital costs over twenty years.4
Commercially available, cost effective Micro-turbine technology has been in the marketplace since about 2000. Some of the advantages realized by utilizing 3 Kalam, A., A. King, E. Moret, and U. Weerasinghe. “Combined heat and power systems: economic and policy barriers to growth.” Chemistry Central Journal. 2012, 6(Suppl 1)S3. http://journal.chemistrycentral.com/content/6/S1/S3. 4 Chubu Electric Power Co. et al. Technical and Economic Assessment: Off Grid, Mini-Grid and Grid Electrification Technologies: Summary Report. 2005 Prepared for Energy Unit, Energy and Water Department, The World Bank. Last accessed from https://cdm.unfccc.int/filestorage/3/F/V/3FV3HUZOKY7DRMRLUZHDSP4KI4MLLK/Enclosure%202.pdf?t=OGt8bm1yMHJwfDAQmZH_kyA7opTJrE4fHilP on April 13, 2015.

2-36 Leidos, Inc. File: EIA | 209089
Micro-turbine technology include a high power-to-weight ratio, lower emissions as compared to other technologies, fewer moving parts, and advanced foil-air bearings along with air cooling, which result in fewer maintenance intervals. Another advantage of Micro-turbines is the use of advanced electronic power switching technology, which in some cases, may result in the elimination of the generator having to be synchronized with the power system to which it is connected.
Micro-turbines are usually manufactured with all of the previously mentioned sub-components in a single, skid-mounted unit about the size of an industrial sized air compression unit. The use of an integrated unit makes field installation and interconnection to the required utilities relatively simple for the end user. Today’s marketplace typically offers size ranges between 10 kW to 250 kW in size.
To date, the stationary microturbine market has made strides in applications where CHP and combined cooling, heating and power are important (e.g., UPS Data Center). It has also reached markets where fuel gas quality is more variable (e.g., landfill gases, anaerobic digester gases, and waste gases in oil fields) without fuel conditioning. For example, the FlexEnergy MT250 unit allows operating gas concentrations to range from 30 to 100%.5
Despite the various applications, the microturbine industry has not resulted in significant mass production compared to other technologies in this report. Capstone Turbine Corporation is the world’s largest manufacturer of microturbines with most of the market share, but has only produced approximately 8,000 units worldwide since 1998.6 However, with less expensive natural gas projected for the future, some sources estimate that upwards of 19 to 57 MW of capacity due to Micro-turbines could be installed over the next five years.
The scope of this Report includes the review of distributed Micro-turbine technology at the 250-kW level, which is a common size for commercial applications.
2.3.6 Natural Gas Turbine Industrial gas turbines typically range from capacities of 1 to 225 MW. Gas turbines are used to power industrial or processing plants, building complexes, aircraft, trains, ships, and electrical generators.
Gas turbines are a type of internal combustion engine that operate using the Brayton cycle. They have an upstream rotating compressor coupled to a downstream turbine, with a combustion chamber located between the compressor and the turbine sections. The gas turbine uses air, which flows through a compressor section that pressurizes the air to high pressure. Energy is then added by spraying fuel into the air and igniting it so the combustion generates a high temperature flow. The high temperature pressurized gas expands through the turbine section. The work produced by the turbine is used to drive the compressor and in most cases also powers an electric generator. The energy 5 FlexEnergy, 2011. Presentation to Federal Utility Partnership Working Group on October 25, 2011. Last accessed from http://energy.gov/eere/femp/downloads/flexenergy on April 15, 2015. 6 Capstone Turbine Corporation. Press Releases: “Capstone Flattens Organizational Structure to Lower Cost, Increase Adaptability as well as Foster Innovation and Creativity.” April 10, 2015. Last accessed from http://www.capstoneturbine.com/news/story.asp?id=760 on April 15, 2015.

File: 000000/99-99999-99999-9999 Leidos, Inc. 2-37
not used for shaft work remains in the exhaust gases, so these have either a high temperature or a high velocity.
Gas turbines undergo three thermodynamic processes: isentropic compression, isobaric combustion, and isentropic expansion. Together, these make up the Brayton cycle. In a gas turbine, mechanical energy is irreversibly transformed into heat when gases are compressed due to internal friction and turbulence. Passage through the combustion chamber, where heat is added and the specific volume of the gases increase is accompanied by a slight loss in pressure. During expansion amidst the stator and rotor blades of the turbine irreversible energy transformation once again occurs. If the device has been designed to power a shaft, as with an industrial generator, the exit pressure will be as close to the entry pressure as possible. It is necessary that some pressure remain at the outlet in order to fully expel the exhaust gases. In the case of a jet engine, only enough pressure and energy is extracted from the flow to drive the compressor and other components. The remaining high pressure gases are accelerated to provide a pressure stream that can be used to propel an aircraft.
Blade tip speed determines the maximum pressure ratios that can be obtained by the turbine and the compressor. This limits the maximum power and efficiency that can be obtained by the engine.
Mechanically, gas turbines can be less complex than internal combustion piston engines. However, the required precision manufacturing for components and temperature resistant alloys necessary for high efficiency often makes the construction of a simple turbine more complicated than piston engines. More sophisticated turbines may have multiple shafts, hundreds of turbine blades, movable stator blades, and a vast system of complex piping, combustors, and heat exchangers. Thrust bearings and journal bearings are a critical part of gas turbine design. Traditionally, gas turbines have been supplied with hydrodynamic oil bearings or oil cooled ball bearings, but may be equipped with roller type bearings as well. These types of bearings are being surpassed by foil bearings, which have been successfully used in micro-turbines and auxiliary power units.
Industrial gas turbines are closely integrated with the devices they power, often an electric generator and the secondary energy equipment that is used to recover residual energy, which is largely heat. Gas turbines range in sizes. Industrial gas turbines used solely for mechanical drive or used in collaboration with a recovery steam generator differ from power generating sets in that they are often smaller and feature a dual shaft design as opposed to single shaft. The power range varies from 1 MW up to 225 MW. These engines can be connected directly to either a pump or a compressor assembly for use in pipeline applications. The majority of these types of installations are used within the oil and gas industries. Oil and gas platforms require these engines to drive compressors to inject gas into the wells to force oil up another bore, gas and oil separation or to compress gases or liquids for transportation. Gas turbines are often used to provide power for the host platform. These platforms do not need to use the engine in collaboration with a CHP system due to getting the gas at an extremely reduced cost. The same types of companies who use gas turbines for oil or liquid compression may use pump sets to drive the fluids to land and across pipelines in various intervals. Other uses for gas turbines are powering chemical and pharmaceutical

2-38 Leidos, Inc. File: EIA | 209089
plants, food and beverage plants, automotive plants, mining, pulp and paper, and textiles. Gas turbines can also power hospitals, universities, and other building complexes.
The scope of this Report includes the review of distributed natural gas turbine technology at the 1,000-kW size for commercial applications, and 5,000-kW, 10,000-kW, 25,000-kW and 40,000-kW sizes for industrial applications.
2.3.7 Combined Cycle A combined cycle (CC) power plant utilizes both a natural gas combustion turbine generator (CTG) and captures the waste combustion heat to create steam, which can be used to generate electricity. This combination of two power generation cycles enhances the efficiency of the plant. While the electrical efficiency of a simple cycle plant power plant without waste heat utilization typically ranges between 25 percent and 40 percent, a CC can achieve electrical efficiencies of 60 percent or more. Supplementary firing in the boiler further enhances the overall power output but can lower efficiency. The high fuel utilization factor of this type of plant configuration contributes to low lifecycle costs.
The major equipment components of a CC facility include a combustion turbine and generator, a heat recovery steam generator boiler (HRSG) and a steam turbine and generator (STG). CC facilities can be set up with dual, and even triple, sets of CTGs and HRSGs in order to increase the amount of steam created and sent to the STG. Associated equipment needed in a CC facility include generator step-up transformers, auxiliary transformers, control systems, a dedicated substation and numerous pumps, motors and other auxiliary equipment. The CTG is subject to variation in output depending on the density of the air, as affected by temperature and humidity. Output will decrease in warm weather and increase in cold weather as the density changes affect mass flow through the gas turbine.
In the CC arrangement, fuel is fired in the CTG, which utilizes the Brayton power cycle. In this type of cycle, the hot combustion gases are expanded through a turbine, which drives an electric generator. Hot exhaust gas from the combustion turbine is passed through a HRSG, which is incorporated into a traditional steam Rankine cycle wherein water is vaporized in the HRSG to produce superheated steam, which is then supplied to the STG. The HRSGs typically produce steam at three pressure levels and can be provided with supplemental firing to augment the steam production, which acts to increase STG electric output. The exhaust steam from the STG is condensed to liquid in the condenser, non-condensable gases are removed and are then collected in the condenser hot well. Makeup water from the demineralized water system is deaerated and supplied to the condenser hot well. Condensate pumps discharge the condensate water from the condenser hot well to the deaerator often via a condensate preheater section in the HRSG. Feedwater pumps discharge feedwater from the deaerator to the low pressure, intermediate and high-pressure economizer sections of the HRSG, which preheat the feedwater prior to discharge to the steam drums. In steam drums, the feedwater is heated to steam conditions, directed through moisture reducing separators and then superheated to complete the cycle.

File: 000000/99-99999-99999-9999 Leidos, Inc. 2-39
The scope of this Report includes the review of distributed CC natural gas technology at the 100,000-kW level for industrial applications.
2.4 Cost Estimation Methodology The approach taken in the cost analysis of capital and operating estimates is defined below. All costs in this Report are nominal or current costs associated with the year specified. Conversion to real or constant dollar basis will require the use of an appropriate price deflator index that is consistent with that currently used in NEMS.
2.4.1 Capital Cost A summary base capital cost estimate (Cost Estimate) was developed for each system technology, based on a generic facility of a certain size (capacity) and configuration, and assuming a non-specific U.S. location with no unusual location impacts (e.g., urban construction constraints) or infrastructure needs (e.g., a project-dedicated interconnection upgrade cost).
Each Cost Estimate was developed assuming costs in first quarter 2015 dollars on an “overnight” capital cost basis. In each Cost Estimate, the total project engineering, procurement, and construction (EPC) cost was organized into the following categories: Equipment supply Installation – labor and materials Project engineering, construction management, and contingency (including project
indirect costs)
In addition to the base Cost Estimate provided for the given technology, projected cost estimates for the installed system costs were made in 5-year increments from the base year of 2015 to 2020, 2025, 2030, 2035, and 2040.
Costing Scope The equipment supply includes major equipment, including but not limited to, boilers, selective catalytic reduction (SCR), cooling tower, STG, PV modules, combustion turbine (CT), as well as auxiliary equipment such as pumps, condensers, electrical transformers, switchgear, motor control centers distributed control systems (DCS), and balance of plant (BOP) equipment such as fire protection, as applicable to a given technology.
The installation labor and materials include bulk materials and commodities, such as pipe, fasteners, instrumentation, wire, cable tray, and lighting.
The estimated line item for engineering, construction management, and contingency include engineering, distributable labor and materials, craft labor overtime and incentives, scaffolding costs, construction management, and start-up and commissioning. The fees and contingency include contractor overhead costs, fees and profit, and construction contingency. Contingency in this category is considered “contractor” contingency, which would be held by a given contractor to mitigate its risk in the construction of a project.

2-40 Leidos, Inc. File: EIA | 209089
The owner’s costs, which are not addressed in the scope of this report, typically include development costs, preliminary feasibility and engineering studies, environmental studies and permitting, legal fees, project management (including third-party management), insurance costs, infrastructure interconnection costs (e.g., gas, electricity), Owner’s Contingency, and property taxes during construction. The electrical interconnection cost includes an allowance for the plant switchyard and a subsequent interconnection to an “adjacent” (e.g., within a mile) of the plant, but does not include significant transmission system upgrades.
2.4.2 Operation and Maintenance (O&M) Expenses O&M expenses consist of non-fuel O&M costs, owner’s expenses, and fuel-related expenses. In evaluating the non-fuel O&M expenses for use in the Electricity Market Module of NEMS, this Report focuses on the non-fuel O&M costs associated with the direct operation of the given power plant technology, referred to here as the “Production Related Non-Fuel O&M Expenses,” which allows for comparison of O&M costs on the same basis across the various technologies.
Production Related Non-Fuel O&M Expenses include the following categories: Fixed O&M (FOM) Variable O&M (VOM) Major Maintenance
Presented below is a brief summary of the expense categories included within the categories of Fixed O&M, Variable O&M, and Major Maintenance. Further, Sections 3 through 5 provide more specific information related to Production-Related Non-Fuel O&M Expenses for each technology as related to the residential, commercial and industrial segments.
Owner’s expenses, which are not addressed in this Report, include expenses paid by plant owners that are plant specific and can vary significantly between two virtually identical plants in the same geographic region. Examples of owner’s expenses might include, depending on the project, property taxes, asset management fees, energy marketing fees, and insurance.
Fixed O&M (FOM) FOM expenses are those expenses incurred at a power plant that do not vary significantly with generation and generally include the following categories: Staffing and monthly fees under pertinent operating agreements Typical bonuses paid to the given plant operator Plant support equipment which consists of equipment rentals and temporary labor Plant-related general and administrative expenses (postage, telephone, etc.) Routine preventive and predictive maintenance performed during operations Maintenance of structures and grounds

File: 000000/99-99999-99999-9999 Leidos, Inc. 2-41
Other fees required for a project to participate in the relevant National Electric Reliability Council region and be in good standing with the regulatory bodies
Routine preventive and predictive maintenance expenses do not require an extended plant shutdown and include the following categories: Maintenance of equipment such as water circuits, feed pumps, main steam piping,
and demineralizer systems Maintenance of electric plant equipment, which includes service water, DCS,
condensate system, air filters, and plant electrical Maintenance of miscellaneous plant equipment such as communication equipment,
instrument and service air, and water supply system Plant support equipment which consists of tools, shop supplies and equipment rental,
and safety supplies
Variable O&M (VOM) VOM expenses are production-related costs, which vary with electrical generation and are generally included in the following categories, as applicable to the given power plant technology: Raw water Waste and wastewater disposal expenses Purchased power (which is incurred inversely to operating hours), demand charges
and related utilities Chemicals, catalysts, and gases Ammonia (NH3) for SCR, as applicable Lubricants Consumable materials and supplies
Major Maintenance Major maintenance expenses generally require an extended outage, are typically undertaken no more than once per year; and are assumed to vary with electrical generation or the number of plant starts based on the given technology and specific original equipment manufacturer recommendations and requirements. These major maintenance expenses include the following expense categories: Scheduled major overhaul expenses for maintaining the prime mover equipment at
a power plant and/or costs associated with long-term service agreements associated with the prime movers
Major maintenance labor Major maintenance spares parts costs

2-42 Leidos, Inc. File: EIA | 209089
BOP major maintenance, which is categorized as major maintenance on the equipment at the given plant that cannot be accomplished as part of routine maintenance or while the unit is in commercial operation.
2.4.3 Regional Cost Factors Table 2-4 makes use of specified regional cost factors to adjust the original technology capital costs, which used the Gulf Coast as the basis for the reference facility cost estimate. These factors generally account for major location differences (e.g., average temperatures, remote locations), labor and wage productivity differences, owner cost differences, and overhead cost differences.
Table 2-3. Technology Performance Specifications - 2015
Technology Fuel
Nominal Capacity (kW) (1)
Nominal Heat Rate
(Btu/kWh) (2) Capital Cost
($/kW) (3) Fixed O&M ($/kW-yr) (4)
Variable O&M
($/kWh) (5) Residential – Small Solar Photovoltaic Solar 5 AC N/A 3,000 16.27 N/A Residential – Wind Wind 10 N/A 8,400 N/A 0.0023 Residential – Fuel Cell Gas 10 8,533 11,989 332.00 0.065 Commercial – Small Solar Photovoltaic Solar 40 AC N/A 2,750 19.75 N/A Commercial – Large Solar Photovoltaic Solar 500 AC N/A 2,505 21.00 N/A Commercial – Wind Wind 100 N/A 5,900 N/A 0.0023 Commercial – Fuel Cell Gas 200 9,481 5,458 332.00 0.045 Commercial – Natural Gas Engine Gas 373 10,405 2,176 20.00 0.011 Commercial – Oil-Fired Engine Oil 340 10,348 2,016 24.00 0.020 Commercial- Natural Gas Turbine Gas 1,210 14,045 2,224 41.80 0.0102 Commercial – Natural Gas Micro-turbine Gas 250 13,200 3,404 18.22 0.0138 Industrial – Reciprocating Engine – NG Gas 1312 9,614 1,899 18.00 0.011 Industrial – Reciprocating Engine – NG Gas 3,000 7,810 1,742 8.00 0.009 Industrial – Natural Gas Turbine Gas 5,300 12,688 1,509 79.02 0.010 Industrial – Natural Gas Turbine Gas 9,950 12,037 1,281 79.02 0.0042 Industrial – Natural Gas Turbine Gas 25,210 10,189 999 18.43 0.006 Industrial – Natural Gas Turbine Gas 39,986 9,305 822 17.88 0.005 Industrial – Combined Cycle Gas 103,128 8,353 1,594 19.88 0.0064 Notes to Table 2-3: (1) Capacity is net of auxiliary loads. (2) Heat Rate is on a HHV basis for British thermal units per kW-hour (Btu/kWh). (3) Capital Cost excludes financing-related costs (e.g., fees, interest during construction). Dollars per kW (4) FOM expenses exclude owner’s costs (e.g., insurance, property taxes, and asset management fees). (5) VOM expenses include major maintenance. (6) Million Btu (MMBtu).

GENERAL BASIS FOR TECHNOLOGY EVALUATION BASIS
File: EIA | 209089 Leidos, Inc. 2-23
Table 2-4. Regional Cost Multiplication Factors
Region Number REGION NAME Factor for Region
1 ERCT 0.94 2 FRCC 1.00 3 MORE 1.21 4 MROW 1.00 5 NEWE 1.05 6 NYCW 1.38 7 NYLI 1.32 8 NYUP 1.05 9 RFCE 1.06 10 MICHIGAN 1.00 11 RFCW 0.95 12 SRDA 0.97 13 SRGW 1.05 14 SOUTHERN 0.98 15 TVA 0.95 16 SRVC 0.92 17 SPNO 1.00 18 SPSO 0.80 19 DSW 1.03 20 NP15 1.12 21 NWPP 1.05 22 ROCKIES 1.00


File: EIA | 209089
Section 3 RESIDENTIAL
3.1 Residential – Small Solar Photovoltaic (RSS) 3.1.1 Equipment and Systems This section describes the Residential – Small Solar Photovoltaic system (RSS), for which we have assumed an installed PV module capacity of 5.5 kW-direct current (“DC”) and an installed inverter capacity of 5.0 kW. The assumed system has a DC to AC capacity of 1.1, which is typical for residential installations. Unless otherwise noted, “kW-DC” refers to DC capacity and “kW” refers to AC capacity.
3.1.2 Technology Specifications For the purposes of the reference technologies projection, we considered a standard rooftop-mounted, fixed-tilt PV array utilizing standard, commercially available crystalline silicon modules. The array is assumed to be equipped with string inverters and a remote monitoring system purposed to provide real-time and historical production data of the facility along with alarm functionality in the event system or equipment anomalies occur. A facility of this type is typically unmanned, and monitoring and alarm functionality is assumed to be remote in nature.
Standard PV modules have a ten-year materials and workmanship warranty, and a 25 year linear power warranty. String inverters typically have a ten-year warranty, with extensions to cover 20 years total. With these warranty terms in mind, we have assumed 25 years as the lifetime for the PV modules and 15 years as the lifetime for the string inverters. Certain micro-inverters and DC optimizers are available with 25-year warranties.
For cost projections, we have considered module efficiency as the main driver of cost reductions over time. In the reference technologies case, our projection assumes the use of p-type crystalline silicon, with a switch to n-type crystalline silicon in 2025. The switch to n-type silicon allows for higher efficiencies and a lower degradation rate in the first year of operation from the elimination of light induced degradation. PV modules utilizing n-type silicon are available today, but are not widely adopted in the market. With time and scale, this technology may see wider adoption.
The advanced technologies case assumes a 5-year acceleration in module efficiency improvements from the reference technologies case, with a new, higher efficiency PV module technology introduced in 2030. Generally, to be adopted, the new technology should have both higher efficiency and lower manufacturing costs. Heterojunction and multi-junction cells show higher efficiencies relative to standard devices; however, the manufacturing costs for these technologies are also higher. Over time, technological or manufacturing innovations may drive the costs down far enough to enable wider adoption in the marketplace.

Section 3
3-2 Leidos, Inc. File: EIA | 209089
3.1.3 Capital Cost Estimate The base Cost Estimate for the Residential – Small Solar Photovoltaic system (RSS) with a nominal capacity of 5 kW is $3,000/kW-AC (2015 dollars). The cost estimate for the RSS assumes being installed on residential roofs, homes that can lend the roof orientation to satisfy maximum efficiency of solar irradiancy, usually having a footprint of the structure roof surface area. The cost estimate is based on actual quotations for work already installed. Peripheral electrical equipment necessary to complement the intermittent power plant needs has been added to the estimate. The cost estimate includes site preparation, structures, equipment, electrical, distributable cost, engineering and design and subcontractor fee and budget contingency. All numbers in these estimates are based on prices and wages for the Gulf Coast Region of the U.S. Costs for other EMM regions can be estimated based on the regional multiplication factors listed in Table 2-4.
Table 3-1 summarizes the Cost Estimate categories for the RSS system.
Table 3-1. Base Plant Site Capital Cost Estimate for RSS
Technology: RSS Nominal Capacity (ISO) (1): 5 kW-AC
Nominal Heat Rate (ISO): N/A
Capital Cost Category ($/kW-AC)
(January 1, 2015 $)
PV Modules 935 (2) Racks 225 Inverters 225 Equipment Supply Subtotal 1,385 Installation Materials and Labor 1,288 Engineering/Construction Management/Contingency (3) 327 Total Project EPC ($/kW-AC) 3,000 (1) International Standards Organization (ISO). (2) The module capital cost in this table assumes 5.5 kW-DC of PV module capacity at a cost of $850/kW-DC, as
referenced to the 5 kW AC capacity assumed for the RSS system. (3) Includes engineering, distributable costs, scaffolding, construction management, and start-up.
3.1.4 O&M Estimate Table 3-2 presents the O&M expenses for the RSS. Fixed O&M expenses for an RSS might typically include those expenses associated with scheduled and unscheduled maintenance, washings and costs associated with remote monitoring. There are typically no variable O&M costs associated with a PV system, as the expenses do not typically vary with capacity factor (CF).

RESIDENTIAL
File: EIA | 209089 Leidos, Inc. 3-3
Table 3-2. O&M Expenses for RSS (5 kW-AC)
Technology: RSS
Fixed O&M Expense $16.27/kW-year Variable O&M Expense N/A
3.1.5 Reference Technologies Projections The following tables present the performance characteristics and cost projections for RSS.
Table 3-3. Residential O&M - Small PV – Reference New Equipment (1)
Year 2015 2020 2025 2030 2035 2040 Module Capacity (kW-DC) 5.5 5.5 5.5 5.5 5.5 5.5 Inverter Capacity (kW-AC) 5.0 5.0 5.0 5.0 5.0 5.0 Capacity Factor (%) 17.0 17.0 17.0 17.0 17.0 17.0 Hours of Operation (hrs) 1,489 1,489 1,489 1,489 1,489 1,489 Module Efficiency (%) 17.0 20.1 23.2 26.0 27.9 28.1 First Year Degradation (%)(2) 3.0 3.0 1.0 1.0 1.0 1.0 Module Life (years) 25 25 25 25 25 25 Inverter Life (years) (3) 15 20 25 25 25 25
Variable O&M Costs ($/kWh)(4) N/A
N/A
N/A
N/A
N/A
N/A Fixed O&M Costs ($/kW-year)(5) 16.27 18.34 20.75 23.47 26.54 30.02 (1) Assumes new system installed every five years. (2) Assumes switch to n-type silicon wafers in 2025 (higher efficiency and a lower first year degradation). (3) String inverters generally come with a standard 10-year warranty, with warranty extensions available to 20-years.
An inverter lifetime of 15-years has been assumed in 2015, improving to 25-years in 2025. (4) There will be minimal O&M costs for residential inverters; the units are replaced if defective. (5) Fixed O&M costs represented in current dollars.
Table 3-4. Residential O&M - Small PV – 2015 Degraded Equipment (1) Year 2015 2020 2025 2030 2035 2040
Inverter Capacity (kW-AC) 5.0 4.9 4.7 4.5 4.3 4.1 Capacity Factor (%) 17.0 17.0 17.0 17.0 17.0 17.0 Hours of Operation (hrs) 1,489 1,489 1,489 1,489 1,489 1,489 Module Efficiency (%) 17.0 16.0 15.3 14.7 14.1 13.4 System Level Degradation (%) (2) 3.0 6.0 9.8 13.5 17.3 21.0 Module Life (years) 25 20 15 10 5 0 Inverter Life (years) (3) 15 10 5 10 5 0 Variable O&M Costs ($/kWh) (4) N/A N/A N/A N/A N/A N/A Fixed O&M Costs ($/kW-year)(5) 16.27 18.71 22.07 26.08 30.86 36.61 (1) Assumes system installation in 2015, with O&M performed to maintain system over its 25-year lifetime. (2) System level degradation, as referenced to the initial installed DC capacity of 5.5 kW-DC. Assumes 3 percent
degradation in the first year of operation and 0.75 percent annually thereafter. (3) Assumes a lifetime of 15 years for the string inverters.

Section 3
3-4 Leidos, Inc. File: EIA | 209089
(4) There will be minimal O&M costs for residential inverters; the units are replaced if defective. (5) Fixed O&M costs represented in current dollars. (6) Includes cost of new inverter
Table 3-5. Residential Capital Costs - Small PV – Reference New Equipment (1,4)
Year 2015 2020 2025 2030 2035 2040 PV Modules ($/kW-DC) 850 798 740 720 731 791 PV Modules for RSS Reference Case ($/kW-AC)(2) 935 878 814 791 804 870 Racks ($/kW-AC) 225 211 196 190 193 209 Inverters ($/kW-AC) 225 230 230 237 241 261 Equipment ($/kW-AC) 1,385 1,319 1,240 1,219 1,238 1,340
Installation Labor and Materials ($/kW-AC) 1,288
1209
1121 1090
1107
1199
Engineering/Construction Management/Contingency(3) 327 363 388 423 461 503 Total Installed Cost ($/kW-AC) 3,000 2,891 2,749 2,733 2,807 3,042 (1) Capital cost of a new system installed every 5 years. (2) Cost for 5.5 kW-DC of modules, referenced to the RSS inverter capacity of 5 kW. (3) Includes engineering, distributable costs, scaffolding, construction management, and start-up. (4) Costs are presented as current dollars.
3.1.6 Advanced Technologies Projection The following tables present the performance characteristics and cost projections for advanced RSS. Module efficiency is assumed to increase at a faster rate compared to the reference case.
Table 3-6. . Residential O&M - Small PV – Advanced New Equipment(1,2)
Year 2015 2020 2025 2030 2035 2040
Module Capacity (kW-DC) 5.5 5.5 5.5 5.5 5.5 5.5 Inverter Capacity (kW) 5.0 5.0 5.0 5.0 5.0 5.0 Module Efficiency (%) (3) 17.0 23.2 27.8 30.9 32.5 33.1 First Year Degradation (%)(3) 3.0 1.0 1.0 1.0 1.0 1.0 Module Life (Years) 25 25 25 25 25 25 Inverter Life (Years) (4) 15 20 25 25 25 25 Variable O&M Costs ($/kWh)(5) N/A N/A N/A N/A N/A N/A Fixed O&M Costs ($/kW-year) (6) 16.27 18.34 20.75 23.47 26.54 30.02 (1) For the advanced technologies reference case, module efficiency is assumed to increase at a faster rate compared to
the reference case. (2) Assumes new system installed every five years. (3) Assumes switch to n-type silicon wafers in 2025 (these will have lower first year degradation). (4) String inverters generally come with a standard 10-year warranty, with warranty extensions available to 20-years. An
inverter lifetime of 15-years has been assumed in 2015, improving to 25-years in 2025. (5) There will be minimal O&M costs for residential inverters; the units are replaced if defective. (6) Fixed O&M costs represented in current dollars.

RESIDENTIAL
File: EIA | 209089 Leidos, Inc. 3-5
Table 3-7. Residential Capital Costs - Small PV – Advanced New Equipment(1,4)
Year 2015 2020 2025 2030 2035 2040 PV Modules ($/kW-DC) 850 691 617 605 628 671
Module Cost - Advanced RSS ($/kW-AC)(2) 935 760 679 666 691 739 Racks ($/kW-AC) 225 183 163 160 166 178 Inverters ($/kW-AC) 225 216 213 220 228 245 Equipment ($/kW-AC) 1,385 1,160 1,055 1,046 1,086 1,161
Installation Labor and Materials ($/kW-AC) 1,288 1048 935 917 952 1017 Engineering/Construction Management/ Contingency(3) ($/kW-AC)
327 363 388 423 461 503
Total Installed Cost ($/kW-AC) 3,000 2,571 2,379 2,387 2,499 2,681 (1) Capital cost of a new system installed every 5 years. (2) Cost for 5.5 kW-DC of modules, referenced to the RSS inverter capacity of 5 kW. (3) Includes engineering, distributable costs, scaffolding, construction management, and start-up. (4) Costs are presented as current dollars.
3.2 Residential – Wind System (RWS) 3.2.1 Equipment and Systems The system configuration for the residential wind system (RWS) is evaluated in this section of the report.
3.2.2 Technology Specifications For the purposes of the analysis, a typical 10-kW residential wind turbine readily available in the commercial marketplace was considered. The turbine is assumed to be equipped with a locally mounted inverter (if required), a remote monitoring system whose purpose is to provide real time and historical production data of the facility along with alarm functionality in the event system or equipment anomalies occur. The RWS is also assumed to be equipped with remote starting and stopping capabilities along with automatic furling functionality in the event that high wind speed events occur. A facility of this type is typically unmanned, and monitoring and alarm functionality is assumed to be remote in nature.
3.2.3 Capital Cost Estimate The base Cost Estimate for the RWS Facility, with a nominal capacity of 10 kW, is $8,400/kW. The cost estimate for the RWS 10 kW, assumes having a small site adjacent to the end use (rural area). For the RWS, a residential back yard site is needed to accept underground utilities such as electric and communications controls. The RWS equipment price was obtained from a quotation by a small wind turbine generator manufacturer, and was stated by the manufacturer to be used for budgetary purposes only. Peripheral electrical equipment necessary to complement the residential power generation has been added to the cost estimate. The cost estimate includes site preparation, foundation structure, equipment, electrical, distributable cost, engineering and design and subcontractor fee and budget contingency. All estimated costs are expressed in $/kW. All numbers in these estimates are based on prices and wages for the Gulf Coast Region of the U.S. Costs for other EMM regions can be estimated based on the regional multiplication factors listed in Table 2-4.

Section 3
3-6 Leidos, Inc. File: EIA | 209089
The capital cost estimate was based on Table 3-8, which summarizes the Cost Estimate categories for the RWS facility.
Table 3-8. Base Plant Site Capital Cost Estimate for RWS Technology: RWS
Nominal Capacity (ISO)(1): 10 kW Nominal Heat Rate (ISO): N/A
Capital Cost Category ($/kW)
(January 1, 2015 $)
Equipment Supply 3,200 Installation – Labor and Materials 5,200 Engineering/Construction Management/Contingency(2) Total Project EPC 8,400 (1) International Standards Organization (ISO) (2) Includes engineering, distributable costs, scaffolding, construction management, and start-up.
3.2.4 O&M Estimate Table 3-9 presents the variable O&M expenses associated with a typical RWS facility. Fixed O&M expenses for an RSS might typically include those expenses associated with scheduled and unscheduled maintenance, washings and costs associated with remote monitoring. There are typically no variable O&M costs associated with an RWS system as the O&M costs are typically fixed O&M costs for insurance, property taxes, site maintenance, legal fees, turbine warranty, and the remainder is tied to maintenance labor rates, royalties, remote monitoring, and other costs.
Table 3-9. O&M Expenses for RWS (10 kW)
Technology: RWS
Fixed O&M Expense $0.0023/kWh Variable O&M Expense N/A
3.2.5 Reference Technologies Projections The following tables present the performance characteristics and cost projections for RWS.
Table 3-10. Residential O&M - Wind – Reference New Equipment(1)
Year 2015 2020 2025 2030 2035 2040
Output Capacity (kW) 10.00 10.00 10.00 10.00 10.00 10.00 Capacity Factor (%) 27.0 27.0 27.0 27.0 27.0 27.0 Hours of Operation (hrs) 2,365 2,365 2,365 2,365 2,365 2,365 Variable O&M Costs ($/kWh) N/A N/A N/A N/A N/A N/A Fixed O&M Costs ($/kW-year)(2)
0.0023 0.0026 0.0029 0.0033 0.0038 0.0043
(1) Assumes new system installed every five years. (2) Fixed O&M costs represented in current dollars.

RESIDENTIAL
File: EIA | 209089 Leidos, Inc. 3-7
Table 3-11. Residential O&M - Wind – 2015 Degraded Equipment(1)
Year 2015 2020 2025 2030 2035 2040
Output Capacity (kW) 10.00 9.97 9.93 9.90 9.87 9.84 Capacity Factor (%) 27.0 27.0 27.0 27.0 27.0 27.0 Hours of Operation (hrs) 2,365 2,365 2,365 2,365 2,365 2,365 Variable O&M Costs ($/kWh) N/A N/A N/A N/A N/A N/A Fixed O&M Costs ($/kW-year)(2)
0.0023 0.0026 0.0029 0.0033 0.0039 0.0044
(1) Assumes system installation in 2015, with O&M performed to maintain system over its 25-year lifetime. (2) Fixed O&M costs represented in current dollars.
Table 3-12. Residential Capital Costs - Wind – Reference New Equipment(2)
Year 2015 2020 2025 2030 2035 2040
Equipment ($/kW) 3,200 3481 3650 3899 4165 4449 Installation Labor and Materials ($/kW) 5,200 5,772 6,176 6,732 7,338 7,998 Engineering/Construction Management/Contingency (1) - - - - - -
Total Installed Cost ($/kW) 8,400 9,253 9,826 10,631 11,503 12,447 (1) Includes engineering, distributable costs, scaffolding, construction management, and start-up. Included in installation costs. (2) Costs presented are in current dollars.
3.2.6 Advanced Technologies Projections The manufacturing of wind turbines is generally considered a mature field. However, the DOE Energy Efficiency & Renewable Energy (ERRE) Program7 expects that future cost reductions for onshore wind power technologies (ranging from residential to utility level) will be based on:
• Plant-level design and management aimed at optimizing production • Advanced control systems • Improved numerical methods to understand wind resources • Blade innovations • More reliable drivetrain technologies • Better scaling to low-wind speed sites
Based on historical data and model projections from multiple recent references, the onshore wind turbine capital costs are compared in Figure 3-1with the capital costs in the reference year. Five of these more recent studies agreed well for the first twenty-five years beyond the study baseline.
7 Wiser, Ryan. “Wind Energy Cost, Performance and Pricing Trends: Past & Future.” Part of the State-Federal RPS Collaborative Webinar on December 17, 2013. Sponsored by CleanEnergy States Alliance and last accessed from http://www.cesa.org/assets/Uploads/RPS-Webinar-Presentation-Cost-and-Technology-Projections-for-Solar-and-Wind.pdf on April 9, 2015.

Section 3
3-8 Leidos, Inc. File: EIA | 209089
Figure 3-1. Literature Descriptions of Wind Turbine Capital Cost Reductions Over Time
The average fractional capital costs from those five studies were determined at five-year increments, and average factors are shown in Figure 3-1 with error bars depicting one standard deviation in the numbers among those five studies. The tops of the error bars were considered to represent the Reference Technology Case (factors of 0.99 in five years, 0.96 in ten years, 0.94 in fifteen years, 0.92 in twenty years, and 0.91 in twenty-five years). The bottoms of the error bars were assumed to represent the more aggressive Advanced Technology Case (factors of 0.98 in five years, 0.95 in ten years, 0.92 in fifteen years, 0.90 in twenty years, and 0.89 in twenty-five years). Because the technology is already mature, the Advanced Technology Case only offers one or two percent savings over the Reference Technology Case. The resultant Advanced Technology capital cost (constant 2015 dollars) is shown below in Figure 3-2.
Figure 3-2. Residential Capital Costs – Wind Turbines – Advanced New Equipment (Constant 2015 $)
Year 2015 2020 2025 2030 2035 2040 Wind Turbine Equipment Cost 3,200 3,366 3,302 3,273 3,330 3,501 Total Installed Cost ($/kW) 8,400 8,232 7,980 7,728 7,560 7,476
Table 3-13 presents the variable O&M costs for wind turbines in the future years, maintaining the 10 kW output capacity.

RESIDENTIAL
File: EIA | 209089 Leidos, Inc. 3-9
Table 3-13. Residential O&M - Wind – Advanced New Equipment
Year 2015 2020 2025 2030 2035 2040
Output Capacity (kW) 10.00 10.00 10.00 10.00 10.00 10.00 Capacity Factor (%) 27.0 27.0 27.0 27.0 27.0 27.0 Hours of Operation (hrs) 2,365 2,365 2,365 2,365 2,365 2,365
Variable O&M Costs ($/kWh) N/A N/A N/A N/A N/A N/A Fixed O&M Costs ($/kW-year) 0.0023 0.0026 0.0029 0.0033 0.0038 0.0043
Table 3-14 presents Advanced Technology capital costs based on the above discussion and reference case allocation of capital costs.
Table 3-14. Residential Capital Costs - Wind – Advanced New Equipment(2) Year 2015 2020 2025 2030 2035 2040
Equipment ($/kW) 3,200 3,366 3,302 3,273 3,330 3,501 Installation Labor and Materials ($/kW) 5,200 5,772 6,176 6,732 7,338 7,998 Engineering/Construction Management/Contingency (1) - - - - - -
Total Installed Cost ($/kW) 8,400 9,138 9,478 10,005 10,668 11,499 (1) Includes engineering, distributable costs, scaffolding, construction management, and start-up. Included in installation costs (2) Costs presented are in current dollars.
3.3 Residential – Fuel Cell System (RFC) 3.3.1 Equipment and Systems The Residential Fuel Cell System (RFC) is evaluated in this section of the report.
3.3.2 Technology Specifications For the purposes of the analysis, a typical 10-kW RFC, readily available in the commercial marketplace and utilizing proton exchange membrane (PEM) technology, was considered. PEMFC is currently the technology of choice for small scale residential applications with 40,000+ installations in Japan.8 The RFC is assumed to be equipped with a remote monitoring system whose purpose is to provide real time and historical production data of the facility along with alarm functionality in the event system or equipment anomalies occur. The RFC is also assumed to be equipped with remote starting and stopping capabilities along with on-board automatic control functionality, which allow for continuous unmanned operations.
3.3.3 Capital Cost Estimate The base Cost Estimate for the RFC Facility with a nominal capacity of 10 kW is $11,989/kW (2015 dollars).
The cost estimate for the RFC 10 kW assumes having a small site adjacent to the end use. The RFC requires a residential back yard site to accept underground utilities such 8 Fuel Cells for Stationary Applications, ETSAP, January 2013. http://ieaetsap.org/web/Highlights%20PDF/E13_STFuel%20Cells_%20AH_Jan2013_Final_GSOK%201.pdf

Section 3
3-10 Leidos, Inc. File: EIA | 209089
as water, gas, electric, sewage, drainage, etc. The RFC equipment price was obtained from in-house information gathered from a manufacturer, and to be used for budgetary purposes only. Peripheral electrical equipment necessary to complement the residential power plant needs has been added to the estimate. The cost estimate includes site preparation, gas line tapping costs, structures, equipment, electrical, distributable cost, engineering and design and subcontractor fee and budget contingency. All numbers in these estimates are based on prices and wages for the Gulf Coast Region of the U.S. Costs for other EMM regions can be estimated based on the regional multiplication factors listed in Table 2-4.
Table 3-15 summarizes the Cost Estimate categories for the RFC facility.
Table 3-15. Base Plant Site Capital Cost Estimate for RFC
Technology: RFC Nominal Capacity (ISO): 10 kW
Nominal Heat Rate (ISO): 7,491 Btu/kWh-HHV
Capital Cost Category ($/kW)
(January 1, 2015 $)
Equipment Supply 7,045 Installation – Labor and Materials 3,705 Engineering, Construction Management, and Contingency(1) 1,239 Total Project EPC 11,989 (1) Includes engineering, distributable costs, scaffolding, construction management, and start-up.
3.3.4 O&M Estimate The major maintenance expenses are included with the VOM expense for this technology and are given on an average basis across the kW-hours (kWh) incurred. Typically, significant overhauls on a RFC facility occur no less frequently than 16,000 operating hour intervals and the expenses associated with such intervals are primarily related to restacking fees. Normal course of business expenses (fixed and variable) would be associated with routine scheduled and unscheduled maintenance, and those costs associated with remote monitoring. Table 3-16 presents the O&M expenses for the RFC facility.
Table 3-16. O&M Expenses for RFC Technology: Conventional RFC
Fixed O&M Expense $332.00/kW-year
Variable O&M Expense $0.065/kWh

RESIDENTIAL
File: EIA | 209089 Leidos, Inc. 3-11
3.3.5 Reference Technologies Projections The following tables present the performance characteristics and cost projections for RFC.
Table 3-17. Residential O&M - Fuel Cell – Reference New Equipment(1) Year 2015 2020 2025 2030 2035 2040
Output Capacity (kW) 10 10 10 10 10 10 Capacity Factor (%) 93 93 93 93 93 93 Hours of Operation (hrs) 8,147 8,147 8,147 8,147 8,147 8,147 Electric Heat Rate, HHV (Btu/kWh)(2) 8,533 8,448 8,363 8,280 8,197 8,115 Electric Efficiency, HHV (%) 40.0 40.4 40.8 41.2 41.6 42.1 Fuel Input (MMBtu/hr) 0.085 0.084 0.084 0.083 0.082 0.081 Thermal Output (MMBtu/hr) 0.035 0.035 0.034 0.034 0.034 0.033 Total CHP Efficiency (%) 81.0 81.4 81.8 82.2 82.7 83.1 Power to Thermal Output Ratio 0.98 0.98 0.99 1.00 1.02 1.03 Net Heat Rate (Btu/kWh) 6,201 6,228 6,167 6,106 6,045 5,985
Variable O&M Costs ($/kWh)(3) 0.065 0.074 0.083 0.094 0.107 0.121 Fixed O&M Costs ($/kW-year) (3) 332 375.63 424.99 480.83 544.02 615.51 (1) Assumes new system installed every five years. (2) Heat rate improvement projected to be 1% per 5 years (3) Variable and Fixed O&M costs represented in current dollars. Assumed to increase 2.5%/year.
Table 3-18. Residential O&M - Fuel Cell – 2015 Degraded Equipment(1)
Year 2015 2020 2025 2030 2035 2040
Output Capacity (kW) 10 9.5 9.4 8.9 8.8 8.4 Capacity Factor (%) 93 93 93 93 93 93 Hours of Operation (hrs) 8,147 8,147 8,147 8,147 8,147 8,147 Electric Heat Rate, HHV (Btu/kWh) 8,533 8,982 9,072 9,550 9,646 10,154 Electric Efficiency, HHV (%) 40.00 38.00 37.62 35.74 35.38 33.61 Fuel Input (MMBtu/hr) 0.085 0.085 0.085 0.085 0.085 0.085 Thermal Output (MMBtu/hr) 0.035 0.037 0.037 0.039 0.040 0.042 Total CHP Efficiency (%) 81 79 78.6 76.7 76.4 74.6 Power to Thermal Output Ratio 0.98 0.93 0.92 0.87 0.86 0.82 Net Heat Rate (Btu/kWh) 6,201 6,622 6,689 7,041 7,112 7,486
Variable O&M Costs ($/kWh)(2) 0.065 0.077 0.089 0.106 0.121 0.143 Fixed O&M Costs ($/kW-year) (2) 332.00 395.40 452.11 540.26 618.21 732.75
(1) Assumes system installation in 2015, with O&M performed to maintain system over its 25-year lifetime. (2) Variable and Fixed O&M costs represented in current dollars.
Assumptions used in the preparation of Table 3-18 would include an assumed CF of 93 percent, a standard commercially available fuel supply with typical heating values associated with those of pipeline quality natural gas and standard overhaul cycles inclusive of those expenses related to restacking which would typically occur on a 7-year cycle given the assumed CF.

Section 3
3-12 Leidos, Inc. File: EIA | 209089
Table 3-19. Residential Capital Costs - Fuel Cell – Reference New Equipment(1)
Year 2015 2020 2025 2030 2035 2040
Equipment ($/kW)(2) 7,045 6,256 5,690 5,582 5,780 5,985 Installation Labor and Materials ($/kW)(3) 3,705 3,907 3,971 4,112 4,258 4,410 Engineering/Construction Management/ Contingency(4,5)
1,239 1,238 1,192 1,169 1,147 1,125
Total Installed Cost ($/kW) 11,989 11,401 10,853 10,863 11,185 11,520 (1) Costs presented are in current dollars. (2) Real cost reduction assumed to be 4 %/year through 2020, 3%/yr through 2025, 2%/yr through 2030, 1 %/yr through 2035,
1 %/yr through 2040 (3) Real cost reduction assumed to be 1%/year (4) Real cost reduction assumed to be 2 %/ yr (5) Includes engineering, distributable costs, scaffolding, construction management, and start-up.
3.3.6 Advanced Technologies Projections Advance fuel cell equipment cost reductions accompany growth in production rates and will generally reflect “learning by doing.” Less mature technologies experience more substantial cost reductions than more mature technologies. The manufacturing of residential and commercial PEMFC systems has been a less mature technology in the U.S., but Japanese installations have resulted in hundreds of thousands of installations over the last ten years.9 Cost reductions have accompanied the increased production and translated to other parts of Asia and Europe. Future cost reductions for all sizes of PEMFC10 are expected based on:
• Designs that reduce the system complexity • Elimination of fuel processing stages • Reduction in catalyst content • Increases in power density • Standardization of minor components among manufacturers • Mass production techniques • Mass production economies-of-scale
Fuel cell efficiency projections are based on DOE Fuel Cell Technologies Office Multi-Year Research, Development, and Demonstration Plan, updated as of November 201411 covering 1–10 kWe residential combined heat and power and distributed generation fuel cell systems operating on natural gas. The following performance targets were specified:
• 2015: 42.5% efficiency (LHV basis) or 38.6% (HHV basis) o CHP Efficiency 87.5%; Operating lifetime 40,000 hrs
• 2020: > 45% efficiency (LHV basis) or > 40.6% (HHV basis)
9 Staffell and Green, 2013 10 Dodds et al., 2015 11 http://energy.gov/eere/fuelcells/downloads/fuel-cell-technologies-office-multi-year-research-development-and-22

RESIDENTIAL
File: EIA | 209089 Leidos, Inc. 3-13
o CHP Efficiency 90.0%; Operating lifetime 60,000 hrs
The efficiency projection assumptions for the remaining years in the projection are:
• 2025: 2.5% reduction from 2020 value • 2030: 3% reduction from 2025 value • 2035: 3.5% reduction from 2030 value • 2040: 4% reduction from 2035 value
Based on historical data and model projections from multiple recent references, the total equipment prices of PEMFC systems are compared in Figure 3-4 with their full equipment system prices in the reference year.12 Differences between the data points may be attributed to geography, time periods, differences in market growth assumptions, and other factors.
Figure 3-3. Literature Descriptions of PEMFC Price Reductions over Time
The best logarithmic fit to those data points is also shown in Figure 3-5. This investigation used the best logarithmic fit to determine the costs in future years relative to the costs in 2015 (factors of 0.44 in 2020, 0.31 in 2025, 0.22 in 2030, 0.15 in 2035, and 0.10 in 2040). The resultant Advanced Technology costs are shown in Figure 3-5.
Figure 3-4. Residential Capital Costs – Fuel Cell – Advanced New Equipment Year 2015 2020 2025 2030 2035 2040
Total System Equipment Cost ($/kW) 7,045 3,100 2,184 1,550 1,057 705 Expressed in constant 2015 dollars
As discussed previously, the major maintenance expenses are included with the VOM expense for this technology and are given on an average basis across the MW-hours (MWh) incurred. Typically, significant overhauls on a RFC facility are assumed to
12 Reference years range from 2003 to 2013. Historical values are shown as points and modeled values
as line segments.

Section 3
3-14 Leidos, Inc. File: EIA | 209089
occur no less frequently than 16,000 operating hour intervals in 2015 and the expenses associated with such intervals are primarily related to restacking fees. These overhauls are projected to occur less frequently as follows:
• 2020: 20,000 hours • 2025: 24,000 hours • 2030: 28,000 hours • 2035: 30,000 hours • 2040: 32,000 hours
Normal course of business expenses (fixed and variable) would be associated with routine scheduled and unscheduled maintenance, and those costs associated with remote monitoring.
Table 3-20. Residential O&M - Fuel Cell – Advanced New Equipment
Year 2015 2020 2025 2030 2035 2040
Output Capacity (kW)(1) 10 10 10 10 10 10 Electric Heat Rate, HHV (Btu/kWh) 8,533 8,362 8,153 7,909 7,632 7,327 Electric Efficiency, HHV (%)(2) 40.0 40.8 41.9 43.2 44.7 46.6 Fuel Input (MMBtu/hr) 0.090 0.084 0.082 0.079 0.076 0.073 Thermal Output (MMBtu/hr) 0.035 0.034 0.033 0.032 0.031 0.030 Total CHP Efficiency (%) 81 81.83 82.88 84.17 85.74 87.60 Power to Thermal Output Ratio 0.98 1.00 1.02 1.05 1.09 1.14 Net Heat Rate (Btu/kWh) 6,200 5,618 5,478 5,314 5,128 4,922
Variable O&M Costs ($/kWh) 0.065 0.068 0.075 0.083 0.090 0.098 Fixed O&M Costs ($/kW-year) 332 317.74 370.67 428.34 516.59 586.43
(1) Output capacity maintained constant (2) See description on page 3-13
Table 3-21. Residential Capital Costs - Fuel Cell – Advanced New Equipment(1)
Year 2015 2020 2025 2030 2035 2040
Equipment ($/kW)(2) 7,045 3,441 2,594 2,006 1,491 1,084 Installation Labor and Materials ($/kW)(3) 3,705 3,701 3,564 3,497 3,430 3,365 Engineering/Construction Management/ Contingency(4,5)
1,239 1,238 1,192 1,169 1,147 1,125
Total Installed Cost ($/kW) 11,989 8,380 7,350 6,672 6,068 5,574 (1) Costs presented are in current dollars. (2) See Figure 3-5 for real cost reduction factors relative to baseline cost (3) Real cost reduction assumed to be 2%/year (4) Real cost reduction assumed to be 2 %/ yr (5) Includes engineering, distributable costs, scaffolding, construction management, and start-up..

File: EIA | 209089
Section 4 COMMERCIAL
4.1 Commercial – Small Solar Photovoltaic System (CSS) 4.1.1 Equipment and Systems This section describes the Commercial – Small Solar Photovoltaic system (CSS), for which we have assumed an installed PV module capacity of 52 kW-DC and an installed inverter capacity of 40 kW. The assumed system has a DC to AC capacity of 1.3, which within the range typically seem for commercial rooftop installations. Unless otherwise noted, “kW-DC” refers to DC capacity and “kW” refers to AC capacity.
4.1.2 Technology Specifications For the purposes of the analysis, a standard ballasted, rooftop mounted, fixed tilt photovoltaic array utilizing polycrystalline panels readily available in the commercial marketplace was considered. The array is assumed to be equipped with string level inverters and a remote monitoring system whose purpose is to provide real time and historical production data of the facility along with alarm functionality in the event system or equipment anomalies occur. A facility of this type is typically unmanned, and monitoring and alarm functionality is assumed to be remote in nature.
Standard PV modules have a ten-year materials and workmanship warranty, and a 25 year linear power warranty. String inverters typically have a ten-year warranty, with extensions to cover 20 years total. With these warranty terms in mind, we have assumed 25 years as the lifetime for the PV modules and 15 years as the lifetime for the string inverters. Certain micro-inverters and DC optimizers are available with 25-year warranties.
For cost projections, we have considered module efficiency as the main driver of cost reductions over time. In the reference technologies case, our projection assumes the use of p-type crystalline silicon, with a switch to n-type crystalline silicon in 2025. The switch to n-type silicon allows for higher efficiencies and a lower degradation rate in the first year of operation from the elimination of light induced degradation. PV modules utilizing n-type silicon are available today, but are not widely adopted in the market. With time and scale, this technology may see wider adoption.
The advanced technologies case assumes a 5-year acceleration in module efficiency improvements from the reference technologies case, with a new, higher efficiency PV module technology introduced in 2030. Generally, to be adopted, the new technology should have both higher efficiency and lower manufacturing costs. Heterojunction and multi-junction cells show higher efficiencies relative to standard devices; however, the manufacturing costs for these technologies are also higher. Over time, technological or manufacturing innovations may drive the costs down far enough to enable wider adoption in the marketplace.

Section 4
4-2 Leidos, Inc. File: EIA | 209089
4.1.3 Capital Cost Estimate The base Cost Estimate for the Commercial – Small Solar Photovoltaic system (CSS) with a nominal capacity of 40 kW-AC is $2,750/kW-AC (2015 dollars).
The cost estimate for the CSS, Roof Top, 40 kW, 52 kW-DC, assumes being installed on commercial building roofs, that can lend the roof orientation to satisfy maximum efficiency of solar irradiancy, usually having a footprint of the structure roof surface area. The cost estimate is based on in-house numbers from actual quotations for work already installed. Peripheral electrical equipment necessary to complement the intermittent power plant needs has been added to the estimate. The cost estimate includes site preparation, structures, equipment, electrical, distributable cost, engineering and design and subcontractor fee and budget contingency. All numbers in these estimates are based on prices and wages for the Gulf Coast Region of the U.S. Costs for other EMM regions can be estimated based on the regional multiplication factors listed in Table 2-4.
Table 4-1 summarizes the Cost Estimate categories for the CSS facility.
Table 4-1 Base Plant Site Capital Cost Estimate for CSS
Technology: CSS Nominal Capacity (ISO)(1): 40 kW-AC Nominal Heat Rate (ISO): N/A
Capital Cost Category ($/kW-AC)
(January 1, 2015 $)
PV Modules (2) 1,040 Racks 200 Inverters 200 Equipment Supply 1,440 Installation – Labor and Materials 1,000 Engineering/ Construction Management / Contingency (3) 310 Total Project EPC 2,750 (1) International Standards Organization (ISO). (2) Capital cost assumes 52 kW-DC PV module capacity at a cost of $800/kW-DC, referenced to the 40 kW inverter capacity
assumed for the CSS system. (3) Includes engineering, distributable costs, scaffolding, construction management, and start-up.
4.1.4 O&M Estimate Table 4-2 presents the O&M expenses for the CSS facility. Fixed O&M expenses for a CSS will typically include those expenses associated with scheduled and unscheduled maintenance, washings and costs associated with remote monitoring. In some cases, major maintenance reserve funding (MMRF) is included, on a levelized basis, in the fixed costs for a CSS. For the purposes of our analysis, we have assumed $1.25/kW-yr as the amount utilized for the MMRF mechanism. There are typically no variable O&M

COMMERCIAL
File: EIA | 209089 Leidos, Inc. 4-3
costs associated with a PV solar system, as the expenses do not typically vary with capacity factor.
Table 4-2
O&M Expenses for CSS
Technology: CSS
Fixed O&M Expense $19.75/kW-year Variable O&M Expense N/A
4.1.5 Reference Technologies Projections The following tables present the reference performance characteristics and cost projections for CSS.
Table 4-3 Commercial O&M - Small PV – Reference New Equipment (1,4)
Year 2015 2020 2025 2030 2035 2040
Module Capacity (kW-DC) 52 52 52 52 52 52 Inverter Capacity (kW-AC) 40 40 40 40 40 40 Capacity Factor (%) 17.0 17.0 17.0 17.0 17.0 17.0 Hours of Operation (hrs) 1,489 1,489 1,489 1,489 1,489 1,489 Module Efficiency (%) (2) 17.0 20.1 23.2 26.0 27.9 28.1 First Year Degradation (%) (2) 3.0 3.0 1.0 1.0 1.0 1.0 Module Life (years) 25 25 25 25 25 25 Inverter Life (years) (3) 15 20 25 25 25 25 Variable O&M Costs ($/kWh)(4) N/A N/A N/A N/A N/A N/A Fixed O&M Costs ($/kW-year)(5) 19.75 22.34 25.26 28.57 32.32 36.55 (1) Assumes new system installed every five years. (2) Assumes switch to n-type silicon wafers in 2025 (these will have lower first year degradation). (3) String inverters generally come with a standard 10-year warranty, with warranty extensions available to 20-years. An inverter
lifetime of 15-years has been assumed in 2015, improving to 25-years in 2025. (4) There will be minimal O&M costs for residential inverters; the units are replaced if defective. (5) Fixed O&M costs represented in current dollars.

Section 4
4-4 Leidos, Inc. File: EIA | 209089
Table 4-4 Commercial O&M - Small PV - 2015 Degraded Equipment (1)
Year 2015 2020 2025 2030 2035 2040
Module Capacity (kW-DC) 52.0 48.9 46.9 45.0 43.0 41.1 Inverter Capacity (kW) 40 37.6 36.1 34.6 33.1 31.6 Capacity Factor (%) 17.0 17.0 17.0 17.0 17.0 17.0 Hours of Operation (hrs) 1,489 1,489 1,489 1,489 1,489 1,489 Module Efficiency (%) 17 16.5 15.8 15.1 14.4 13.7 System Level Degradation (%) (2) 3.00 6.00 9.75 13.50 17.25 21.00 Module Life (years) 25 20 15 10 5 0 Inverter Life (years) (3) 15 10 5 15 10 5 Variable O&M Costs ($/kWh)(4) N/A N/A N/A N/A N/A N/A Fixed O&M Costs ($/kW-year)(5) 19.75 23.77 27.99 33.03 248.06(6) 46.27 (1) Assumes system installation in 2015, with O&M performed to maintain system over its 25-year lifetime. (2) Cumulative system level degradation, as referenced to the initial installed DC capacity of 52 kW-DC. Assumes 3 percent
degradation in the first year of operation and 0.75 percent annually thereafter. (3) Assumes the use of three-phase string inverters with a 20-year lifetime. (4) There will be minimal O&M costs for commercial inverters; the units are replaced if defective. (5) Fixed O&M costs represented in current dollars. (6) Includes cost of new inverter
Table 4-5 Commercial Capital Costs - Small PV - Reference New Equipment(1,4)
Year 2015 2020 2025 2030 2035 2040
PV Modules ($/kW-DC) 800 751 696 677 688 744
PV Modules for CSS Reference Case ($/kW)(2) 1040 976 905 880 894 968 Racks 200 205 207 214 217 236 Inverters 200 205 207 214 217 236 Equipment ($/kW) 1,440 1,386 1,319 1,307 1,328 1,440
Installation Labor and Materials ($/kW) 1,000 939 870 846 860 931 Engineering/Construction Management/Contingency(3) 310 344 368 401 437 477 Total Installed Cost ($/kW) 2,750 2,669 2,558 2,555 2,625 2,848 (1) Capital cost of a new system installed every 5 years. (2) PV module cost for CSS case assumes 52 kW-DC of PV module capacity at a cost of $800/kW-DC, referenced to a 40 kW
inverter capacity system. (3) Includes engineering, distributable costs, scaffolding, construction management, and start-up. (4) Costs are presented as current dollars.

COMMERCIAL
File: EIA | 209089 Leidos, Inc. 4-5
4.1.6 Advanced Technologies Projections The following tables present the performance characteristics and cost projections for advanced CSS. Module efficiency is assumed to increase at a faster rate compared to the reference case.
Table 4-6 Commercial O&M – Small PV – Advanced New Equipment(1,2)
Year 2015 2020 2025 2030 2035 2040
Module Capacity (kW-DC) 52.0 52.0 52.0 52.0 52.0 52.0 Inverter Capacity (kW) 40.0 40.0 40.0 40.0 40.0 40.0 Module Efficiency (%)(3) 17.0 23.2 27.8 30.9 32.5 33.1 First Year Degradation (%)(3) 3.0 1.0 1.0 0.5 0.5 0.5 Module Life (years) 25 25 25 25 25 25 Inverter Life (years)(4) 15 20 25 25 25 25 Variable O&M Costs ($/kWh)(5) N/A N/A N/A N/A N/A N/A Fixed O&M Costs ($/kW-year)(6) 19.75 22.34 25.26 28.57 32.32 36.55
(1) For the advanced technologies reference case, module efficiency is assumed to increase at a faster rate compared to the reference case.
(2) Assumes new system installed every five years. (3) Assumes switch to n-type silicon wafers in 2025 (these will have lower first year degradation). (4) String inverters generally come with a standard 10-year warranty, with warranty extensions available to 20-years. An inverter
lifetime of 15-years has been assumed in 2015, improving to 25-years in 2025. (5) There will be minimal O&M costs for residential inverters; the units are replaced if defective. (6) Fixed O&M costs represented in current dollars.
Table 4-7 Commercial Capital Costs – Small PV – Advanced New Equipment(1,4)
Year 2015 2020 2025 2030 2035 2040
PV Modules ($/kW-DC) 800 651 510 407 325 260
PV Modules for Advanced CSS Case ($/kW)(2) 1040 846 663 530 423 338 Racks 200 205 205 211 217 237 Inverters 200 205 205 211 217 237 Equipment ($/kW) 1,440 1,255 1,073 952 858 812
Installation Labor and Materials ($/kW) 1,000 813 726 712 739 790 Engineering/Construction Management/Contingency(3) 310 344 368 401 437 477 Total Installed Cost ($/kW) 2,750 2,413 2,167 2,065 2,035 2,078
(1) Capital cost of a new system installed every 5 years. (2) Cost for 52 kW-DC of modules, referenced to the CSS inverter capacity of 40 kW. (3) Includes engineering, distributable costs, scaffolding, construction management, and start-up. (4) Costs are presented as current dollars.
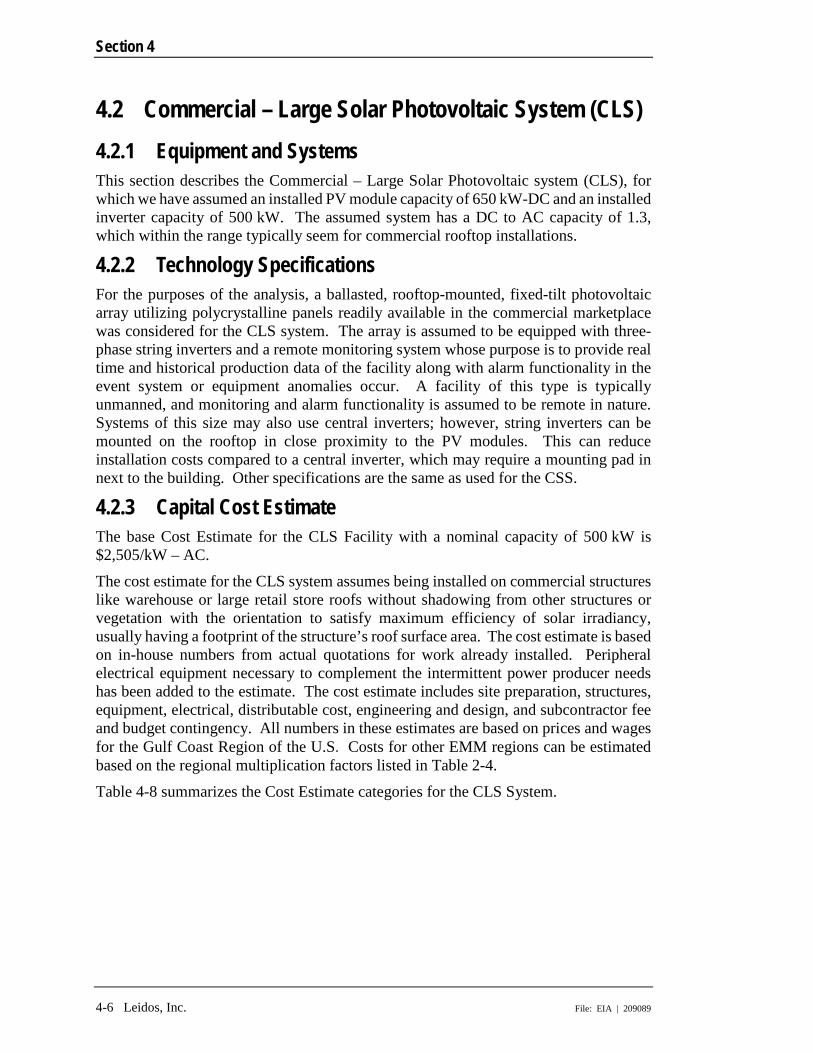
Section 4
4-6 Leidos, Inc. File: EIA | 209089
4.2 Commercial – Large Solar Photovoltaic System (CLS) 4.2.1 Equipment and Systems This section describes the Commercial – Large Solar Photovoltaic system (CLS), for which we have assumed an installed PV module capacity of 650 kW-DC and an installed inverter capacity of 500 kW. The assumed system has a DC to AC capacity of 1.3, which within the range typically seem for commercial rooftop installations.
4.2.2 Technology Specifications For the purposes of the analysis, a ballasted, rooftop-mounted, fixed-tilt photovoltaic array utilizing polycrystalline panels readily available in the commercial marketplace was considered for the CLS system. The array is assumed to be equipped with three-phase string inverters and a remote monitoring system whose purpose is to provide real time and historical production data of the facility along with alarm functionality in the event system or equipment anomalies occur. A facility of this type is typically unmanned, and monitoring and alarm functionality is assumed to be remote in nature. Systems of this size may also use central inverters; however, string inverters can be mounted on the rooftop in close proximity to the PV modules. This can reduce installation costs compared to a central inverter, which may require a mounting pad in next to the building. Other specifications are the same as used for the CSS.
4.2.3 Capital Cost Estimate The base Cost Estimate for the CLS Facility with a nominal capacity of 500 kW is $2,505/kW – AC.
The cost estimate for the CLS system assumes being installed on commercial structures like warehouse or large retail store roofs without shadowing from other structures or vegetation with the orientation to satisfy maximum efficiency of solar irradiancy, usually having a footprint of the structure’s roof surface area. The cost estimate is based on in-house numbers from actual quotations for work already installed. Peripheral electrical equipment necessary to complement the intermittent power producer needs has been added to the estimate. The cost estimate includes site preparation, structures, equipment, electrical, distributable cost, engineering and design, and subcontractor fee and budget contingency. All numbers in these estimates are based on prices and wages for the Gulf Coast Region of the U.S. Costs for other EMM regions can be estimated based on the regional multiplication factors listed in Table 2-4.
Table 4-8 summarizes the Cost Estimate categories for the CLS System.
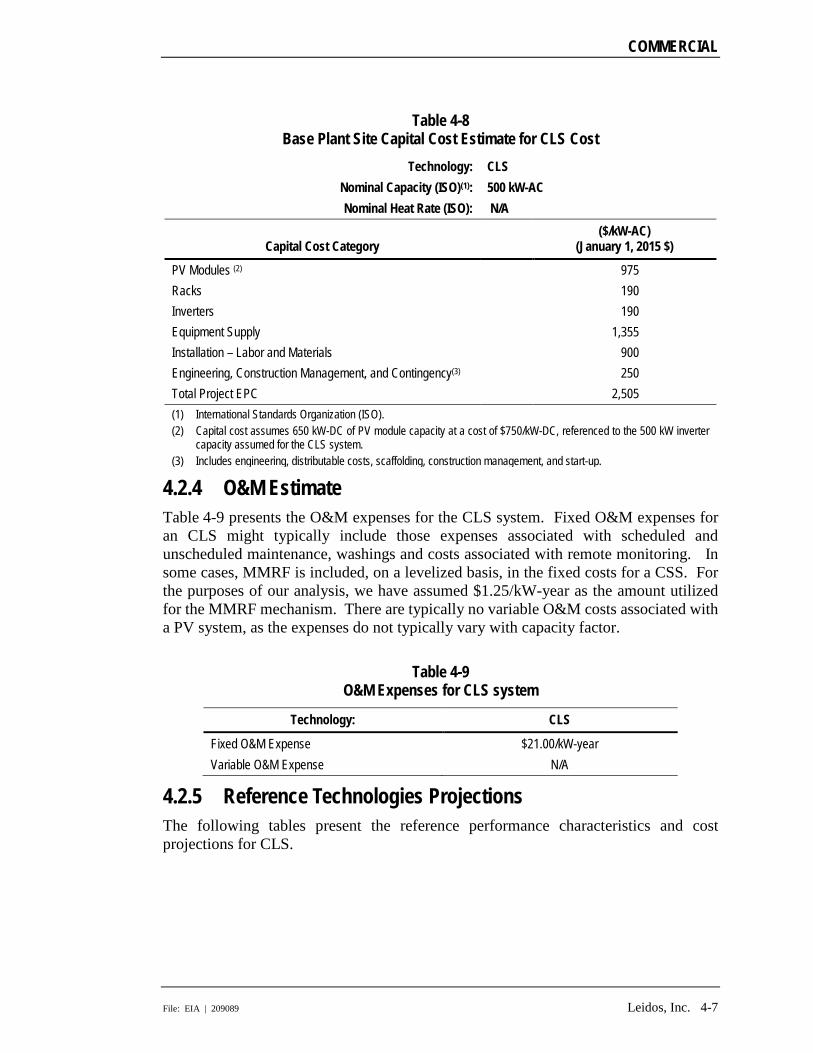
COMMERCIAL
File: EIA | 209089 Leidos, Inc. 4-7
Table 4-8 Base Plant Site Capital Cost Estimate for CLS Cost
Technology: CLS Nominal Capacity (ISO)(1): 500 kW-AC Nominal Heat Rate (ISO): N/A
Capital Cost Category ($/kW-AC)
(January 1, 2015 $)
PV Modules (2) 975 Racks 190 Inverters 190 Equipment Supply 1,355 Installation – Labor and Materials 900 Engineering, Construction Management, and Contingency(3) 250 Total Project EPC 2,505 (1) International Standards Organization (ISO). (2) Capital cost assumes 650 kW-DC of PV module capacity at a cost of $750/kW-DC, referenced to the 500 kW inverter
capacity assumed for the CLS system. (3) Includes engineering, distributable costs, scaffolding, construction management, and start-up.
4.2.4 O&M Estimate Table 4-9 presents the O&M expenses for the CLS system. Fixed O&M expenses for an CLS might typically include those expenses associated with scheduled and unscheduled maintenance, washings and costs associated with remote monitoring. In some cases, MMRF is included, on a levelized basis, in the fixed costs for a CSS. For the purposes of our analysis, we have assumed $1.25/kW-year as the amount utilized for the MMRF mechanism. There are typically no variable O&M costs associated with a PV system, as the expenses do not typically vary with capacity factor.
Table 4-9
O&M Expenses for CLS system
Technology: CLS
Fixed O&M Expense $21.00/kW-year Variable O&M Expense N/A
4.2.5 Reference Technologies Projections The following tables present the reference performance characteristics and cost projections for CLS.

Section 4
4-8 Leidos, Inc. File: EIA | 209089
Table 4-10
Commercial O&M - Large PV – Reference New Equipment (1,4)
Year 2015 2020 2025 2030 2035 2040
Module Capacity (kW-DC) 650 650 650 650 650 650 Inverter Capacity (kW-AC) 500 500 500 500 500 500 Capacity Factor (%) 17.0 17.0 17.0 17.0 17.0 17.0 Hours of Operation (hrs) 1,489 1,489 1,489 1,489 1,489 1,489 Module Efficiency, (%)(2) 17.0 20.1 23.2 26.0 27.9 28.1 First Year Degradation (%) (2) 3.0 3.0 1.0 1.0 1.0 1.0 Module Life (years) 25 25 25 25 25 25 Inverter Life (years) (3) 15 20 25 25 25 25 Variable O&M Costs ($/kWh)(4) N/A N/A N/A N/A N/A N/A Fixed O&M Costs ($/kW-year)(5) 21.00 23.75 26.86 30.38 34.36 38.86 (1) Assumes new system installed every five years. (2) Assumes switch to n-type silicon wafers in 2025 (these will have lower first year degradation). (3) String inverters generally come with a standard 10-year warranty, with warranty extensions available to 20-years. An
inverter lifetime of 15-years has been assumed in 2015, improving to 25-years in 2025. (4) There will be minimal O&M costs for residential inverters; the units are replaced if defective. (5) Fixed O&M costs represented in current dollars.
Table 4-11 Commercial O&M - Large PV – 2015 Degraded Equipment(1)
Year 2015 2020 2025 2030 2035 2040
Module Capacity (kW-DC) 650 611 587 562 538 514 Inverter Capacity (kW) 500 500 500 500 500 500 Capacity Factor (%) 17.0 17.0 17.0 17.0 17.0 17.0 Hours of Operation (hrs) 1,489 1,489 1,489 1,489 1,489 1,489 Module Efficiency, (%) 17.0 16.0 15.3 14.7 14.1 13.4 System Level Degradation (%)(2) 3.0 6.0 9.8 13.5 17.3 21.0 Module Life (years) 25 20 15 10 5 0 Inverter Life (years) (3) 20 15 10 5 20 15 Variable O&M Costs ($/kWh)(4) N/A N/A N/A N/A N/A N/A Fixed O&M Costs ($/kW-year)(5) 21.00 25.27 29.76 35.12 248.03(6) 49.19 (1) Assumes system installation in 2015, with O&M performed to maintain system over its 25-year lifetime. (2) Cumulative system level degradation, as referenced to the initial installed DC capacity of 650 kW-DC. Assumes 3 percent
degradation in the first year of operation and 0.75 percent annually thereafter. (3) Assumes the use of three-phase string inverters with a 20-year lifetime. (4) There will be minimal O&M costs for commercial inverters; the units are replaced if defective. (5) Fixed O&M costs represented in current dollars (6) Includes the cost of a new inverter

COMMERCIAL
File: EIA | 209089 Leidos, Inc. 4-9
Table 4-12 Commercial Capital Costs - Large PV – Reference New Equipment(1,4)
Year 2015 2020 2025 2030 2035 2040 PV Modules ($/kW-DC) 750 704 653 635 645 698
PV Module Cost for CLS Reference Case ($/kW)(2) 975 915 849 825 838 907 Racks 190 194 194 200 207 225 Inverters 190 194 194 200 207 225 Equipment ($/kW) 1,355 1,304 1,237 1,226 1,251 1,357 Installation Labor and Materials ($/kW) 900 845 783 762 774 837 Engineering/Construction Management/Contingency(3) 250 278 297 324 353 385 Total Installed Cost ($/kW) 2,505 2,427 2,318 2,311 2,378 2,579
(1) Capital cost of a new system installed every 5 years. (2) PV module cost for CSS case assumes 650 kW-DC of PV module capacity at a cost of $750/kW-DC, referenced to a 500
kW inverter capacity system. (3) Includes engineering, distributable costs, scaffolding, construction management, and start-up. (4) Costs are presented as current dollars.
4.2.6 Advanced Technologies Projections The following tables present the performance characteristics and cost projections for advanced CSS. Module efficiency is assumed to increase at a faster rate compared to the reference case.
Table 4-13 Commercial O&M- Large PV – Advanced New Equipment(1,2)
Year 2015 2020 2025 2030 2035 2040
Module Capacity (kW-DC) 650 650 650 650 650 650 Inverter Capacity (kW) 500 500 500 500 500 500 Module Efficiency (%)(3) 17.0 23.2 27.8 30.9 32.5 33.1 Module Life (years) 25 25 25 25 25 25 First Year Degradation (%)(3) 3.0 1.0 1.0 0.5 0.5 0.5 Inverter Life (years)(4) 15 20 25 25 25 25 Variable O&M Costs ($/kWh)(5) N/A N/A N/A N/A N/A N/A Fixed O&M Costs ($/kW-year)(6) 21.00 23.75 26.86 30.38 34.36 38.86 (1) For the advanced technologies reference case, module efficiency is assumed to increase at a faster rate compared to
the reference case. (2) Assumes new system installed every five years. (3) Assumes switch to n-type silicon wafers in 2025 (these will have lower first year degradation). (4) String inverters generally come with a standard 10-year warranty, with warranty extensions available to 20-years. An
inverter lifetime of 15-years has been assumed in 2015, improving to 25-years in 2025. (5) There will be minimal O&M costs for residential inverters; the units are replaced if defective. (6) Fixed O&M costs represented in current dollars.

Section 4
4-10 Leidos, Inc. File: EIA | 209089
Table 4-14 Commercial Capital Costs - Large PV – Advanced New Equipment(1,4)
Year 2015 2020 2025 2030 2035 2040
PV Modules ($/kW-DC) 750 610 545 529 554 592
PV Module Cost for Advanced CLS Case ($/kW)(2) 975 793 708 688 721 770 Racks 190 194 194 200 207 225 Inverters 190 194 194 200 207 225 Equipment ($/kW) 1,355 1,182 1,097 1,088 1,134 1,220 Installation Labor and Materials ($/kW) 900 732 654 635 665 711 Engineering/Construction Management/Contingency(3) 250 278 297 324 353 385 Total Installed Cost ($/kW) 2,505 2,192 2,048 2,047 2,152 2,316
(1) Capital cost of a new system installed every 5 years. (2) Cost for 650 kW-DC of modules, referenced to the CSS inverter capacity of 500 kW. (3) Includes engineering, distributable costs, scaffolding, construction management, and start-up. (4) Costs are presented as current dollars.
4.3 Commercial – Wind System (CWS) 4.3.1 Equipment and Systems The Commercial Wind System (CWS) produces 100 kW of electricity using a single wind turbine.
4.3.2 Technology Specifications For the purposes of the analysis, a typical 100-kW commercial-type wind turbine readily available in the commercial marketplace was considered. The turbine is assumed to be equipped with a locally mounted inverter (if applicable), a remote monitoring system whose purpose is to provide real time and historical production data of the facility along with alarm functionality in the event system or equipment anomalies occur. The CWS is also assumed to be equipped with remote starting and stopping capabilities along with automatic furling functionality in the event that high wind speed events occur. A facility of this type is typically unmanned, and monitoring and alarm functionality is assumed to be remote in nature.
4.3.3 Capital Cost Estimate The base Cost Estimate for the CWS with a nominal capacity of 100 kW is $5,900/kW.
The cost estimate for the CWS 100 kW assumes having a small site adjacent to the end use (rural area). The cost estimate requires a site able to accept underground utilities such as electric and communications controls. The CWS equipment price was obtained from a quotation by a small wind turbine generator manufacturer, and to be used for budgetary purposes only. Peripheral electrical equipment necessary to complement the commercial wind turbine power generation needs has been added to the estimate. The cost estimate includes site preparation, foundation structure, equipment, electrical, distributable cost, engineering and design, and subcontractor fee and budget

COMMERCIAL
File: EIA | 209089 Leidos, Inc. 4-11
contingency. All estimated costs are expressed in $/kW. All numbers in these estimates are based on prices and wages for the Gulf Coast Region of the U.S.
Table 4-15 summarizes the Cost Estimate categories for the CWS facility.
4.3.4 O&M Estimate Table 4-16 presents the O&M expenses for the CWS system. For the purposes of our analysis we have taken into consideration those fixed expenses typically associated with a CWS system. There are typically no variable O&M costs associated with an RWS system as the O&M costs are typically fixed O&M costs for insurance, property taxes, site maintenance, legal fees, turbine warranty, and the remainder is tied to maintenance labor rates, royalties, remote monitoring, and other costs.
Table 4-16
O&M Expenses for CWS system
Technology: CWS
Fixed O&M Expense $0.0023/kW-year Variable O&M Expense N/A
4.3.5 Reference Technologies Projections The following tables present the performance characteristics and cost projections for CWS.
Table 4-17 Commercial O&M – Wind – Reference New Equipment(1)
Year 2015 2020 2025 2030 2035 2040
Output Capacity (kW) 100.0 100.0 100.0 100.0 100.0 100.0
Table 4-15 Base Plant Site Capital Cost Estimate for Commercial Wind System
Technology: CWS Nominal Capacity (ISO)(1): 100 kW Nominal Heat Rate (ISO): N/A
Capital Cost Category ($/kW)
(January 1, 2015 $)
Equipment Supply 3,853 Installation – Labor and Materials 2,047 Engineering, Construction Management, and Contingency (1) - Total Project EPC 5,900 (1) International Standards Organization (ISO) (2) Includes engineering, distributable costs, scaffolding, construction management, and start-up. (Costs included in
Installation – Labor and Materials above.)

Section 4
4-12 Leidos, Inc. File: EIA | 209089
Capacity Factor (%) 27.0 27.0 27.0 27.0 27.0 27.0 Hours of Operation (hrs) 2,365 2,365 2,365 2,365 2,365 2,365
Variable O&M Costs ($/kWh) N/A N/A N/A N/A N/A N/A Fixed O&M Costs ($/kW-year)(2) 0.0023 0.0026 0.0029 0.0033 0.0038 0.0043
(1) Assumes new system installed every five years. (2) Fixed O&M costs represented in current dollars.
Table 4-18 Commercial O&M – Wind - 2015 Degraded Equipment(1)
Year 2015 2020 2025 2030 2035 2040
Output Capacity (kW) 100.0 99.7 99.3 99.0 98.7 98.4 Capacity Factor (%) 27.0 27.0 27.0 27.0 27.0 27.0 Hours of Operation (hrs) 2,365 2,365 2,365 2,365 2,365 2,365
Variable O&M Costs ($/kWh) N/A N/A N/A N/A N/A N/A Fixed O&M Costs ($/kW-year)(2) 0.0023
0.0026 0.0029 0.0033 0.0039 0.0044
(1) Assumes system installation in 2015, with O&M performed to maintain system over its 25-year lifetime. (2) Fixed O&M costs represented in current dollars.
Table 4-19 Commercial Capital Costs - Wind – Reference New Equipment(2)
Year 2015 2020 2025 2030 2035 2040
Equipment ($/kW) 3,853 4,191 4,395 4,695 5,015 5,357 Installation Labor and Materials ($/kW) 2,047 2,272 2,431 2,650 2,889 3,149 Engineering/Construction Management/Contingency (1) - - - - - -
Total Installed Cost ($/kW) 5,900 6,463 6,826 7,345 7,903 8,505 (1) Includes engineering, distributable costs, scaffolding, construction management, and start-up. Included in installation costs. (2) Costs presented are in current dollars.
4.3.6 Advanced Technologies Projections The manufacturing of wind turbines is generally considered a mature field. However, the DOE Energy Efficiency & Renewable Energy (ERRE) Program13
13 Wiser, Ryan. “Wind Energy Cost, Performance and Pricing Trends: Past & Future.” Part of the State-Federal RPS Collaborative Webinar on December 17, 2013. Sponsored by CleanEnergy States Alliance and last accessed from http://www.cesa.org/assets/Uploads/RPS-Webinar-Presentation-Cost-and-Technology-Projections-for-Solar-and-Wind.pdf on April 9, 2015.

COMMERCIAL
File: EIA | 209089 Leidos, Inc. 4-13
expects that future cost reductions for onshore wind power technologies (ranging from residential to utility level) will be based on:
• Plant-level design and management aimed at optimizing production • Advanced control systems • Improved numerical methods to understand wind resources • Blade innovations • More reliable drivetrain technologies • Better scaling to low-wind speed sites
Based on historical data and model projections from multiple recent references, the onshore wind turbine capital costs are compared in Figure 3-1with the capital costs in the reference year. Five of these more recent studies agreed well for the first twenty-five years beyond the study baseline.
Figure 4-1. Literature Descriptions of Wind Turbine Capital Cost Reductions Over Time
The average fractional capital costs from those five studies were determined at five-year increments, and average factors are shown in Figure 3-1 with error bars depicting one standard deviation in the numbers among those five studies. The tops of the error bars were considered to represent the Reference Technology Case (factors of 0.99 in five years, 0.96 in ten years, 0.94 in fifteen years, 0.92 in twenty years, and 0.91 in twenty-five years). The bottoms of the error bars were assumed to represent the more aggressive Advanced Technology Case (factors of 0.98 in five years, 0.95 in ten years, 0.92 in fifteen years, 0.90 in twenty years, and 0.89 in twenty-five years). Because the technology is already mature, the Advanced Technology Case only offers one or two percent savings over the Reference Technology Case. The resultant Advanced Technology capital cost (constant 2015 dollars) is shown below in Figure 4-2. Figure 4-2. Commercial Capital Costs – Wind Turbines – Advanced New
Equipment Year 2015 2020 2025 2030 2035 2040

Section 4
4-14 Leidos, Inc. File: EIA | 209089
Total Installed Cost ($/kW) 5,900 5,758 5,611 5,449 5,333 5,228
A 2008 DOE NREL report14 cites that fixed O&M costs are for insurance, property taxes, site maintenance, and legal fees, so these are expected to remain constant. Fifty percent of the variable O&M costs are for the turbine warranty, and the remainder is tied to labor rates, royalties, and other costs. As turbine reliability improves and the scale of wind turbines increases, the warranty costs (and associated variable O&M costs) are expected to drop. Three studies reported decreasing variable O&M costs in future years Figure 3-3.
Figure 4-3. Studies Reporting Variable O&M Cost Reductions – Wind Turbines
Study Fraction of 2015 Variable O&M Costs
2015 2020 2025 2030 2035 2040 MiniCAM 2008 1.00 0.85 0.83 0.81 0.79 0.77 Logan et al., 2008 1.00 0.93 0.90 0.87 0.87 0.87 Mai et al., 2012 1.00 0.91 0.84 0.82 0.80 0.80
Logan’s numbers were the most conservative, so they were considered to represent the Reference Technologies Case. MiniCAM’s numbers were the most aggressive and thus associated with the Advanced Technologies Case. Table 3-13 presents the variable O&M costs for wind turbines in the future years, maintaining the 10 kW output capacity.
Table 4-20 Commercial O&M – Wind - Advanced New Equipment
Year 2015 2020 2025 2030 2035 2040
Output Capacity (kW) 100.0 100 100 100 100 100 Capacity Factor (%) 27.0 27.0 27.0 27.0 27.0 27.0 Hours of Operation (hrs) 2,365 2,365 2,365 2,365 2,365 2,365 Variable O&M Costs ($/kWh) N/A N/A N/A N/A N/A N/A Fixed O&M Costs ($/kW-year) 0.0023 0.0023 0.0024 0.0027 0.0030 0.0034
Table 4-21 presents Advanced Technology capital costs based on the above discussion and reference case allocation of capital costs.
14 DOE National Renewable Energy Laboratory, 20% Wind Energy by 2030: Increasing Wind Energy’s Contribution to U.S. Electricity Supply. July 2008. DOE/GO-102008-2567. Last accessed from http://www.nrel.gov/docs/fy08osti/41869.pdf on April 9, 2015.

COMMERCIAL
File: EIA | 209089 Leidos, Inc. 4-15
Table 4-21 Commercial Capital Costs - Wind - Advanced New Equipment(2)
Year 2015 2020 2025 2030 2035 2040
Equipment ($/kW) 3,853 4,119 4,233 4,404 4,637 4,893 Installation Labor and Materials ($/kW) 2,047 2,272 2,431 2,650 2,889 3,149 Engineering/Construction Management/Contingency (1)
Total Installed Cost ($/kW) 5,900 6,391 6,664 7,054 7,525 8,041 (1) Includes engineering, distributable costs, scaffolding, construction management, and start-up. (2) Costs presented are in current dollars.
4.4 Commercial - Fuel Cell (CFC) The Commercial Fuel Cell System (CFC) is evaluated in this section of the report.
4.4.1 Equipment and Systems The Commercial Fuel Cell (CFC) facility utilizes one proton membrane type fuel cell unit, with a nominal power output of 200 kW. The fuel cells convert chemical energy directly into electricity from natural gas and air vapor and produce heat and water vapor as byproducts. The fuel (the reactant) is introduced continuously to the anode side of the unit cell while air (the oxidant) is introduced continuously into the cathode side via a blower. In a fuel cell, electricity is produced by ionic transfer across an electrolyte that separates the fuel from the air. A high temperature fuel cell produces electricity by splitting a molecule of the oxidant into its ionic components at the cathode, passing ions through the electrolyte (e.g., in the case of the CFC facility, a phosphoric acid ion) and then reacting the ions with the fuel at the anode to produce heat to allow the reaction to occur. During this ionic transfer process, two electrons are stripped from each ion to which develops a voltage and current. Since each fuel cell develops a relatively low voltage, the cells are stacked to produce a higher, more useful voltage. Depending on the type of fuel cell, high temperature waste heat from the process may be available for CHP applications.
Current examples of commercial-scale stationary fuel cells are8:
Manufacturer Product Name Type Output
Ballard Power Systems (Canada)
ClearGen PEM Multi-500 kW power banks
Bloom Energy (U.S.) ES-5400 SOFC 100 kW ES-5700 SOFC 200 kW UPM-570 SOFC 160 kW
ClearEdge Power (U.S.) PureCell System Model 400 PAFC 400 kW FuelCell Energy (U.S.) DFC 300 MCFC 300 kW
DFC 300 MCFC
DFC 300 M
Fuji Electric (Japan) FP-100i PAFC 100 kW

Section 4
4-16 Leidos, Inc. File: EIA | 209089
4.4.2 Technology Specifications For the purposes of the analysis, a typical 200 kW CFC unit readily available in the commercial marketplace and utilizing proton exchange membrane technology was considered. The CFC is assumed to be equipped with a remote monitoring system whose purpose is to provide real time and historical production data of the facility along with alarm functionality in the event system or equipment anomalies occur. The CFC is also assumed to be equipped with remote starting and stopping capabilities along with on-board automatic control functionality, which allow for continuous unmanned operations. A unit of this type is typically unmanned, and monitoring and alarm functionality is assumed to be remote in nature.
The technology specifications for the CFC are presented in Table 4-22:
Table 4-22 Commercial – Fuel Cell – 200 kW
Life Cycle 2015
Output Capacity (kW) 200.0 Electric Heat Rate, HHV (Btu/kWh) 9,481 Electric Efficiency, HHV (%) 36.0 Fuel Input (MMBtu/hr) 1.90 Thermal Output (MMBtu/hr) 0.79 Total CHP Efficiency (%) 77.7 Power to Thermal Output Ratio 0.86 Net Heat Rate (Btu/kWh) 6,913
Variable O&M Costs ($/kWh) 0.045 Fixed O&M Costs ($/kW-year) 332.00
4.4.3 Capital Cost Estimate The base Cost Estimate for the Commercial Fuel Cell facility with a nominal capacity of 200 kW is $5,458/kW (2015 dollars). The cost estimate for the CFC 200 kW assumes having a small site adjacent to the end use. A one-acre site is needed to be able to accept underground utilities such as water, gas, electric, sewage, drainage, etc. The CFC equipment price was obtained from in-house information gathered from a manufacturer, and to be used for budgetary purposes only. Peripheral electrical equipment necessary to complement the commercial power plant needs has been added to the estimate. The cost estimate includes site preparation, gas line tapping costs, structures, equipment, electrical, distributable cost, engineering and design, and subcontractor fee and budget contingency. All estimated costs are expressed in $/kW. All numbers in these estimates are based on prices and wages for the Gulf Coast Region of the U.S. Costs for other EMM regions can be estimated based on the regional multiplication factors listed in Table 2-4.
Table 4-23 summarizes the Cost Estimate categories for the CFC facility.

COMMERCIAL
File: EIA | 209089 Leidos, Inc. 4-17
Table 4-23 Base Plant Site Capital Cost Estimate for CFC
Technology: CFC Nominal Capacity (ISO): 200 kW
Nominal Heat Rate (ISO): 10,405 Btu/kWh-HHV
Capital Cost Category ($/kW)
(January 1, 2015 $) Equipment Supply 4,781 Installation – Labor and Materials 238 Engineering, Construction Management, and Contingency (1) 439 Total Project EPC 5,458 (1) Includes engineering, distributable costs, scaffolding, construction management, and start-up.
4.4.4 O&M Estimate Table 4-24 presents the O&M expenses for the CFC system. Assumptions used in the preparation of Table 4-24 would include an assumed CF of 93 percent, a standard commercially available fuel supply with typical heating values associated with those of pipeline quality natural gas and standard overhaul cycles inclusive of those expenses related to restacking, which would typically occur on a 7-year cycle given the assumed CF.
Table 4-24 O&M Expenses for CFC
Technology: CFC Fixed O&M Expense $332.00/kW-year Variable O&M Expense $0.045/kWh
4.4.5 Reference Technologies Projections Table 4-25
Commercial O&M - Fuel Cell – Reference New Equipment(1)
Year 2015 2020 2025 2030 2035 2040
Output Capacity (kW) 200 200 200 200 200 200 Capacity Factor (%) 93 93 93 93 93 93 Hours of Operation (hrs) 8,147 8,147 8,147 8,147 8,147 8,147 Electric Heat Rate, HHV (Btu/kWh)(2) 9,481 9,386 9,292 9,199 9,107 9,016 Electric Efficiency, HHV (%) 36.0 36.4 36.7 37.1 37.5 37.9 Fuel Input (MMBtu/hr) 1.90 1.88 1.86 1.84 1.82 1.80 Thermal Output (MMBtu/hr) 0.79 0.78 0.77 0.77 0.76 0.75 Total CHP Efficiency (%) 77.7 78.02 78.39 78.76 79.14 79.52 Power to Thermal Output Ratio 0.86 0.87 0.88 0.89 0.9 0.91 Net Heat Rate (Btu/kWh) 7,200 6,845 6,777 6,710 6,643 6,578
Variable O&M Costs ($/kWh)3 0.045 0.051 0.058 0.065 0.074 0.083 Fixed O&M Costs ($/kW-year)3 332.00 375.63 424.99 480.83 544.02 615.51
(1) Assumes new system installed every five years. (2) Heat rate improvement projected to be 1% per 5 years (3) Variable and Fixed O&M costs represented in current dollars. Costs escalated at 2.5%/year.

Section 4
4-18 Leidos, Inc. File: EIA | 209089
Table 4-26 Commercial O&M - Fuel Cell – 2015 Degraded Equipment
Year 2015 2020 2025 2030 2035 2040
Output Capacity (kW) 200 190 188 179 177 168 Capacity Factor (%) 93 93 93 93 93 93 Hours of Operation (hrs) 8,147 8,147 8,147 8,147 8,147 8,147 Electric Heat Rate, HHV (Btu/kWh) 9,481 9,980 10,080 10,611 10,718 11,282 Electric Efficiency, HHV (%) 36 34.2 33.9 32.2 31.8 30.3 Fuel Input (MMBtu/hr) 1.9 1.9 1.9 1.9 1.9 1.9 Thermal Output (MMBtu/hr) 0.79 0.79 0.79 0.79 0.79 0.79 Total CHP Efficiency (%) 77.7 75.9 75.5 73.8 73.5 71.9 Power to Thermal Output Ratio 0.86 0.82 0.81 0.77 0.76 0.73 Net Heat Rate (Btu/kWh) 6,913 7,277 7,351 7,737 7,816 8,227
Variable O&M Costs ($/kWh) 0.045 0.054 0.062 0.073 0.084 0.099 Fixed O&M Costs ($/kW-year) 332 395.40 452.11 537.25 614.71 732.75
Table 4-27 Commercial Capital Costs - Fuel Cell – Reference New Equipment(1)
Year 2015 2020 2025 2030 2035 2040
Equipment ($/kW)(2) 4,781 4,192 3,768 3,656 3,745 3,838 Installation Labor and Materials ($/kW)(3)
238 251 255 264 274 283
Engineering/Construction Management/ Contingency(4,5) 439 439 422 414 406 399
Total Installed Cost ($/kW) 5,458 4,882 4,446 4,334 4,425 4,520 (1) Costs presented are in current 2015 dollars. (2) Real cost reduction assumed to be 4 %/year through 2020, 3%/yr through 2025, 2%/yr through 2030, 1 %/yr through
2035, 1 %/yr through 2040 (3) Real cost reduction assumed to be 1%/year (4) Real cost reduction assumed to be 2 %/ yr (5) Includes engineering, distributable costs, scaffolding, construction management, and start-up.
4.4.6 Advanced Technologies Projections Advance fuel cell equipment cost reductions accompany growth in production rates and will generally reflect “learning by doing.” Less mature technologies experience more substantial cost reductions than more mature technologies. The manufacturing of residential and commercial fuel cell systems has been a less mature technology, but Japanese installations have resulted in hundreds of thousands of installations over the last ten years. Cost reductions have accompanied the increased production and translated to other parts of Asia and Europe. Future cost reductions for all sizes of PEMFC are expected based on:

COMMERCIAL
File: EIA | 209089 Leidos, Inc. 4-19
• Designs that reduce the system complexity • Elimination of fuel processing stages • Reduction in catalyst content • Increases in power density • Standardization of minor components among manufacturers • Mass production techniques • Mass production economies-of-scale
Fuel cell efficiency projections are based on DOE Fuel Cell Technologies Office Multi-Year Research, Development, and Demonstration Plan, updated as of November 201415 covering 100 kWe – 3 MWe commercial combined heat and power and distributed generation fuel cell systems operating on natural gas. The following performance targets were specified:
• 2015: 45% efficiency (LHV basis) or 40.9% (HHV basis) o CHP Efficiency 87.5%; Operating lifetime 50,000 hrs
• 2020: > 50% efficiency (LHV basis) or > 45.1% (HHV basis) o CHP Efficiency 90.0%; Operating lifetime 80,000 hrs
Since the commercial fuel cell efficiency for year 2015 was determined to be less than the DOE goal, the assumed 2020 improvement is assumed to be 4 percentage points higher in value. The efficiency projection assumptions for the remaining years in the projection are:
• 2025: 2.5% reduction from 2020 value • 2030: 3% reduction from 2025 value • 2035: 3.5% reduction from 2030 value • 2040: 4% reduction from 2035 value
Based on historical data and model projections from multiple recent references, the total equipment prices of PEMFC systems are compared in Figure 4-4 with their full equipment system prices in the reference year.16 Differences between the data points may be attributed to geography, time periods, differences in market growth assumptions, and other factors.
The best logarithmic fit to those data points is also shown in Figure 4-5. This investigation used the best logarithmic fit to determine the costs in future years relative to the costs in 2015 (factors of 0.44 in 2020, 0.31 in 2025, 0.22 in 2030, 0.15 in 2035, and 0.10 in 2040). The resultant Advanced Technology costs are shown in Figure 3-5.
15 http://energy.gov/eere/fuelcells/downloads/fuel-cell-technologies-office-multi-year-research-development-and-22 16 Reference years range from 2003 to 2013. Historical values are shown as points and modeled values
as line segments.

Section 4
4-20 Leidos, Inc. File: EIA | 209089
Figure 4-4. Literature Descriptions of PEMFC Price Reductions over Time
Figure 4-5. Residential Capital Costs – Fuel Cell – Advanced New Equipment Year 2015 2020 2025 2030 2035 2040
Total System Equipment Cost ($/kW) 5,458 3,011 2,412 1,691 1,344 1,350 Expressed in 2015 dollars
Table 4-28 Commercial O&M - Fuel Cell – Advanced New Equipment
Year 2015 2020 2025 2030 2035 2040
Output Capacity (kW) 200 200 200 200 200 200 Electric Heat Rate, HHV (Btu/kWh) 9,481 8,533 8,319 8,070 7,787 7,476 Electric Efficiency, HHV (%) 36.0 40.0 41.0 42.3 43.8 45.7 Fuel Input (MMBtu/hr) 1.90 1.71 1.66 1.61 1.56 1.50 Thermal Output (MMBtu/hr) 0.79 0.711 0.693 0.672 0.649 0.623 Total CHP Efficiency (%) 77.70 81.66 82.69 83.96 85.49 87.32 Power to Thermal Output Ratio 0.86 0.96 0.98 1.02 1.05 1.10 Net Heat Rate (Btu/kWh) 6,913 5,689 5,546 5,380 5,192 4,984
Variable O&M Costs ($/kWh) 0.045 0.046 0.051 0.055 0.061 0.066 Fixed O&M Costs ($/kW-year) 332 317.74 370.67 428.34 516.59 586.43

COMMERCIAL
File: EIA | 209089 Leidos, Inc. 4-21
Table 4-29 Commercial Capital Costs - Fuel Cell – Advanced New Equipment
Year 2015 2020 2025 2030 2035 2040
Equipment ($/kW) 4781 2,335 1,760 1,052 717 735 Installation Labor and Materials ($/kW) 238 238 229 225 220 216 Engineering/Construction Management/Contingency (1) 439.0 438.6 422.3 414.3 406.4 398.7
Total Installed Cost ($/kW) 5,458 3,011 2,412 1,691 1,344 1,350 (1) Costs presented are in current dollars. (2) See Figure 4-5 for real cost reduction factors relative to baseline cost (3) Real cost reduction assumed to be 2%/year (4) Real cost reduction assumed to be 2 %/ yr (5) Includes engineering, distributable costs, scaffolding, construction management, and start-up..
4.5 Commercial – Natural Gas Reciprocating Engine (CNE)
4.5.1 Equipment and Systems The following describes the Commercial Natural Gas Reciprocating Engine (CNE), which is a nominal 300 kW net power output.
4.5.2 Technology Specifications The technology specifications for the CNE are presented in Table 4-30:
Table 4-30 Commercial – Natural Gas Reciprocating Engine – 300 kW
Life Cycle 2015
Output Capacity (kW) 373.0 Electric Heat Rate, HHV (Btu/kWh) 10,405 Electric Efficiency, HHV (%) 32.8 Fuel Input (MMBtu/hr) 3,881 Thermal Output (MMBtu/hr) 1.809 Total CHP Efficiency (%) 79.4 Power to Thermal Output Ratio 0.704 Net Heat Rate (Btu/kWh) 4,343
Variable O&M Costs ($/kWh) 0.011 Fixed O&M Costs ($/kW-year) 20.00

Section 4
4-22 Leidos, Inc. File: EIA | 209089
4.5.3 Capital Cost Estimate The base Cost Estimate for the CNE with a nominal capacity of 300 kW is $2,176/kW.
The cost estimate for the CNE 300 assumes having a small site adjacent to the end use. A one-acre site is required to be cleared, leveled and conditioned to accept underground utilities such as water, gas, electric, sewage, drainage, just as what is found at any large facility. The CNE price was obtained as a budgetary quotation for estimating purposes only from a local diesel generator supplier. Peripheral electrical equipment necessary to complement the commercial power plant needs has been added to the estimate. The cost estimate includes site preparation, gas tapping costs, structures, equipment, electrical, distributable cost, engineering and design, and subcontractor fee and budget contingency. All estimated costs are expressed in $/kW. All numbers in these estimates are based on prices and wages for the Gulf Coast region of the U.S.
Table 4-31 summarizes the Cost Estimate categories for the CNE facility.
Table 4-31
Base Plant Site Capital Cost Estimate for CNE Technology: CNE
Nominal Capacity (ISO): 300 kW Nominal Heat Rate (ISO): 10,405 Btu/kWh-HHV
Capital Cost Category ($/kW)
(January 1, 2015$)
Equipment Supply 938 Installation – Labor and Materials 662 Engineering, Construction Management, and Contingency (1) 576 Total Project EPC 2,176 (1) Includes engineering, distributable costs, scaffolding, construction management, and start-up.
4.5.4 O&M Estimate Table 4-32 presents the O&M expenses for the CNE facility.
Table 4-32
O&M Expenses for CNE - 300 kW
Technology: CNE
Fixed O&M Expense $20.00/kW-year Variable O&M Expense $0.011/kWh

COMMERCIAL
File: EIA | 209089 Leidos, Inc. 4-23
4.5.5 Reference Technologies Projections
Table 4-33 Commercial O&M- Natural Gas Reciprocating Engine – Reference New Equipment
Year 2015 2020 2025 2030 2035 2040
Output Capacity (kW) 373 373 373 373 373 373 Capacity Factor (%) 93 93 93 93 93 93 Hours of Operation (hrs) 8,147 8,147 8,147 8,147 8,147 8,147 Electric Heat Rate, HHV (Btu/kWh)
10,405 10,380 10,354 10,328 10,302 10,276
Electric Efficiency, HHV (%) 32.8 32.9 33.0 33.0 33.1 33.2 Fuel Input (MMBtu/hr) 3.881 3.872 3.862 3.852 3.843 3.833 Thermal Output (MMBtu/hr) 1.809 1.80 1.80 1.80 1.79 1.79 Total CHP Efficiency (%) 79.4 79.49 79.6 79.7 79.7 79.8 Power to Thermal Output Ratio 0.704 0.705 0.707 0.709 0.711 0.713 Net Heat Rate (Btu/kWh) 4,343 4,332 4,321 4,311 4,300 4,289
Variable O&M Costs ($/kWh)(1) 0.011 0.0124 0.0141 0.0159 0.0180 0.0204 Fixed O&M Costs ($/kW-year)(1) 20.00 22.63 25.60 28.97 32.77 37.08
(1) Costs presented are in current 2015 dollars. Costs escalated at 2.5% per year.
Table 4-34
Commercial O&M- Natural Gas Reciprocating Engine – 2015 Degraded Equipment
Year 2015 2020 2025 2030 2035 2040
Output Capacity (kW) 373 370 367 365 362 359 Capacity Factor (%) 93 93 93 93 93 93 Hours of Operation (hrs) 8,147 8,147 8,147 8,147 8,147 8,147 Electric Heat Rate, HHV(Btu/kWh) 10,405 10,458 10,510 10,563 10,616 10,670 Electric Efficiency, HHV (%) 32.8 32.6 32.5 32.3 32.1 32.0 Fuel Input (MMBtu/hr) 3.881 3.872 3.862 3.852 3.843 3.833 Thermal Output (MMBtu/hr) 1.809 1.809 1.809 1.809 1.809 1.809 Total CHP Efficiency (%) 79.4 79.4 79.3 79.3 79.2 79.2 Power to Thermal Output Ratio 0.704 0.698 0.693 0.688 0.683 0.678 Net Heat Rate (Btu/kWh) 4,343 4,350 4,356 4,363 4,369 4,375
Variable O&M Costs ($/kWh) 0.011 0.013 0.014 0.016 0.019 0.021 Fixed O&M Costs ($/kW-year) 20 22.80 25.99 29.63 33.77 38.50

Section 4
4-24 Leidos, Inc. File: EIA | 209089
Table 4-35 Commercial Capital Costs - Natural Gas Reciprocating Engine –
Reference New Equipment(1)
Year 2015 2020 2025 2030 2035 2040
Equipment ($/kW)(2) 938 1,039 1,109 1,205 1,311 1,425 Installation Labor and Materials ($/kW)(3) 662 735 786 857 934 1,018 Engineering/Construction Management/Contingency (4,5)
576 639 684 746 813 886
Total Installed Cost ($/kW) 2,176 2,413 2,579 2,808 3,057 3,329 (1) Costs presented are in current 2015 dollars (2) Real cost reduction assumed to be 0% due to the mature nature of the technology. (3) Real cost reduction assumed to be 0%/year (4) Real cost reduction assumed to be 0 %/ yr (5) Includes engineering, distributable costs, scaffolding, construction management, and start-up.
4.5.6 Advanced Technologies Projections Compared to most other technologies discussed in this report, the reciprocating engine technology is considered very mature technology. Some advances continue to be made on these power generators (e.g., laser ignition which has been shown to increase efficiency). However, reducing installation costs is not the primary focus area. The DOE Advanced Reciprocating Engine System (ARES) program17 aims to achieve 50% brake thermal efficiency (80+% with CHP), a maximum of 0.1 g/bhp-hr NOx emissions, maintenance cost below $0.01/EkW-hr, and a continued cost competitiveness. Two of the three industry partners (Caterpillar and GE Dresser Waukesha) withdrew from the ARES program based on business considerations with regard to distributed energy technologies.
Cost reductions historically accompany the deployment of a technology from one sales volume to a relatively higher sales volume, but millions of reciprocating engines have already been produced over the last century. The reciprocating engines also compete with the renewable technologies, NGCCs, and other electricity generators in the electricity market, but do not appear to grow in significant numbers in modeling results because of their costs relative to other technologies. In five simulations for EPRI in 2013, the unit capital costs ($/kW) did not drop from 2015 levels until the year 2045.18
Advances in other electricity-generating technologies may also improve the efficiency of reciprocating engines. For example, fifty research projects at DOE NETL address hydrogen turbines. Natural gas turbines and reciprocating engines operating in CHP systems, which meet regulatory emission requirements, could also benefit from the
17 DOE EERE, 2015. “Advanced Reciprocating Engine System (ARES).” Last accessed at http://www.energy.gov/eere/amo/downloads/advanced-reciprocating-engine-system-ares on April 22, 2015. 18 Azevedo, I. P. Jaramillo, E. Rubin, and S. Yeh. Modeling Technology Learning for Electricity Supply Technologies. Phase II Report to Electric Power Research Institute. June 2013. Last accessed from http://www.cmu.edu/epp/iecm/rubin/PDF%20files/2013/FINAL%20PHASE%20II%20REPORT%20TO%20EPRI_June%2030.pdf on April 22, 2015.

COMMERCIAL
File: EIA | 209089 Leidos, Inc. 4-25
improvements in combined cycle units. However, their current deployment is more often for peaking or emergency conditions (because of the short startup times), thus extending the expected payback periods for these units.
Because of the uncertainties associated with a competitive marketplace environment and the general acknowledgement that these technologies are very mature, the advanced technology cases for natural gas turbines and reciprocating engines were not assumed to have lower unit costs ($/kW) than those in the reference cases. Modest efficiency improvements of 2% lower than the reference case value are assumed to account for general improvements.
Table 4-36 Commercial O&M- Natural Gas Reciprocating Engine – Advanced New Equipment
Year 2015 2020 2025 2030 2035 2040
Output Capacity (kW) 373 373 373 373 373 373 Electric Heat Rate, HHV (Btu/kWh) 10,405 10,172 10,147 10,121 10,096 10,070 Electric Efficiency, HHV (%) 32.8 33.6 33.6 33.7 33.8 33.9 Fuel Input (MMBtu/hr) 3.881 3.794 3.785 3.775 3.766 3.756 Thermal Output (MMBtu/hr) 1.809 1.77 1.76 1.76 1.76 1.75 Total CHP Efficiency (%) 79.4 80.2 80.2 80.3 80.4 80.5 Power to Thermal Output Ratio 0.704 0.720 0.722 0.723 0.725 0.727 Net Heat Rate (Btu/kWh) 4,343 4,246 4,235 4,225 4,214 4,203
Variable O&M Costs ($/kWh) 0.011 0.012 0.014 0.016 0.018 0.020 Fixed O&M Costs ($/kW-year) 20 22.63 25.60 28.97 32.77 37.08
(1) Costs presented are in current 2015 dollars
Table 4-37 Commercial Capital Costs - Natural Gas Reciprocating Engine –
Advanced New Equipment(1)
Year 2015 2020 2025 2030 2035 2040
Equipment ($/kW)(2) 938 1,039 1,109 1,205 1,311 1,425 Installation Labor and Materials ($/kW)(3) 662 735 786 857 934 1,018 Engineering/Construction Management/Contingency (4,5) 576 639 684 746 813 886
Total Installed Cost ($/kW) 2,176 2,413 2,579 2,808 3,057 3,329 (1) Costs presented are in current 2015 dollars (2) Real cost reduction assumed to be 0% due to the mature nature of the technology. (3) Real cost reduction assumed to be 0%/year (4) Real cost reduction assumed to be 0 %/ yr (5) Includes engineering, distributable costs, scaffolding, construction management, and start-up.

Section 4
4-26 Leidos, Inc. File: EIA | 209089
4.6 Commercial – Oil Reciprocating Engine (COE) 4.6.1 Equipment and Systems The plant configuration for the Oil Reciprocating Engine (COE) system case produces 300 kW of net power.
4.6.2 Technology Specifications The technology specifications for the COE are presented in Table 4-38:
Table 4-38 Commercial – Oil Reciprocating Engine – 300 kW
Life Cycle 2015
Output Capacity (kW) 340.0 Electric Heat Rate, HHV (Btu/kWh) 10,348 Electric Efficiency, HHV (%) 33.0 Fuel Input (MMBtu/hr) 3.518 Thermal Output (MMBtu/hr) 1.554 Total CHP Efficiency (%) 77.2 Power to Thermal Output Ratio 0.747 Net Heat Rate (Btu/kWh) 4,635
Variable O&M Costs ($/kWh) 0.020 Fixed O&M Costs ($/kW-year) 24.00
4.6.3 Capital Cost Estimate The base Cost Estimate for the COE system with a nominal capacity of 300 kW is $2,016/kW.
The cost estimate for the COE 300 kW assumes having a small site adjacent to the end use. A one-acre site is required to be cleared, leveled and conditioned to accept underground utilities such as water, gas, electric, sewage, drainage, just as what is found at any large facility. The COE price was obtained as a budgetary quotation for estimating purposes only from a local diesel generator supplier. Peripheral electrical equipment necessary to complement the commercial power plant needs has been added to the estimate.
Included in the estimate are site preparation, Diesel fuel tank, structures, equipment, electrical, distributable cost, engineering and design and subcontractor fee and budget contingency. All estimated costs are expressed in $/kW. All numbers in these estimates are based on prices and wages for the Gulf Coast Region of the U.S.
Table 4-39 summarizes the Cost Estimate categories for the COE system.

COMMERCIAL
File: EIA | 209089 Leidos, Inc. 4-27
Table 4-39 Base Plant Site Capital Cost Estimate for COE
Technology: COE Nominal Capacity (ISO): 300 kW
Nominal Heat Rate (ISO): Btu/kWh-HHV
Capital Cost Category ($/kW)
(January 1, 2015 $)
Equipment Supply 780 Installation – Labor and Materials 660 Engineering, Construction Management, and Contingency (1) 576 Total Project EPC 2,016 (1) Includes engineering, distributable costs, scaffolding, construction management, and start-up.
4.6.4 O&M Estimate Table 4-40 presents the O&M expenses for the COE system.
Table 4-40 O&M Expenses for COE
Technology: COE
Fixed O&M Expense $24.00/kW-year Variable O&M Expense $0.020/kWh

Section 4
4-28 Leidos, Inc. File: EIA | 209089
4.6.5 Reference Technologies Projections
Table 4-41 Commercial O&M - Oil Reciprocating Engine – Reference New Equipment
Year 2015 2020 2025 2030 2035 2040
Output Capacity (kW) 340.0 340.0 340.0 340.0 340.0 340.0 Capacity Factor (%) 93.0 93.0 93.0 93.0 93.0 93.0 Hours of Operation (hrs) 8,147 8,147 8,147 8,147 8,147 8,147 Electric Heat Rate, HHV (Btu/kWh)
10,348 10,311 10,296 10,280 10,249 10,219
Electric Efficiency, HHV (%) 33 33.1 33.15 33.2 33.3 33.4 Fuel Input (MMBtu/hr) 3.518 3.506 3.501 3.495 3.485 3.474 Thermal Output (MMBtu/hr) 1.554 1.548 1.546 1.544 1.539 1.535 Total CHP Efficiency (%) 77.2 77.27 77.3 77.4 77.5 77.6 Power to Thermal Output Ratio 0.747 0.749 0.751 0.752 0.754 0.756 Net Heat Rate (Btu/kWh) 4,635 4,618 4,611 4,604 4,591 4,577
Variable O&M Costs ($/kWh) 0.020 0.023 0.026 0.029 0.033 0.037 Fixed O&M Costs ($/kW-year) 24.00 27.15 30.72 34.76 39.33 44.49
Table 4-42 Commercial O&M - Oil Reciprocating Engine - 2015 Degraded Equipment
Year 2015 2020 2025 2030 2035 2040
Output Capacity (kW) 340 337 335 333 330 328 Capacity Factor (%) 93 93 93 93 93 93 Hours of Operation (hrs) 8,147 8,147 8,147 8,147 8,147 8,147 Electric Heat Rate, HHV (Btu/kWh) 10,348 10,405 10,437 10,502 10,567 10,599 Electric Efficiency, HHV (%) 33 32.8 32.7 32.5 32.3 32.2 Fuel Input (MMBtu/hr) 3.518 3.506 3.501 3.495 3.485 3.474 Thermal Output (MMBtu/hr) 1.554 1.554 1.554 1.554 1.554 1.554 Total CHP Efficiency (%) 77.2 77.13 77.1 77.0 76.9 76.9 Power to Thermal Output Ratio 0.747 0.740 0.737 0.731 0.724 0.720 Net Heat Rate (Btu/kWh) 4,635 4,640 4,645 4,665 4,676 4,673
Variable O&M Costs ($/kWh) 0.02 0.023 0.026 0.030 0.034 0.038 Fixed O&M Costs ($/kW-year) 24 27.40 31.14 35.51 40.54 46.15

COMMERCIAL
File: EIA | 209089 Leidos, Inc. 4-29
Table 4-43 Commercial Capital Costs - Oil Reciprocating Engine - Reference New Equipment(1)
Year 2015 2020 2025 2030 2035 2040
Equipment ($/kW)(2) 780 863 922 1,003 1,090 1,185 Installation Labor and Materials ($/kW)(3)
660 733 784 854 931 1,015
Engineering/Construction Management/Contingency (4,5)
576 639 684 746 813 886
Total Installed Cost ($/kW) 2,016 2,235 2,390 2,603 2,834 3,086 (1) Costs presented are in current 2015 dollars (2) Real cost reduction assumed to be 0% due to the mature nature of the technology. (3) Real cost reduction assumed to be 0%/year (4) Real cost reduction assumed to be 0 %/ yr (5) Includes engineering, distributable costs, scaffolding, construction management, and start-up.
4.6.6 Advanced Technologies Projections See section 4.5.6 – similar assumptions for the advanced technology.
Table 4-44
Commercial O&M - Oil Reciprocating Engine - Advanced New Equipment
Year 2015 2020 2025 2030 2035 2040
Output Capacity (kW) 340 340 340 340 340 340 Electric Heat Rate, HHV (Btu/kWh) 10,348 10,105 10,090 10,075 10,044 10,014 Electric Efficiency, HHV (%) 33 33.8 33.8 33.9 34.0 34.1 Fuel Input (MMBtu/hr) 3.518 3.436 3.431 3.425 3.415 3.405 Thermal Output (MMBtu/hr) 1.554 1.518 1.515 1.513 1.508 1.504 Total CHP Efficiency (%) 77.2 77.9 78.0 78.0 78.1 78.3 Power to Thermal Output Ratio 0.747 0.765 0.766 0.767 0.769 0.772 Net Heat Rate (Btu/kWh) 4,634 4,526 4,519 4,512 4,499 4,485
Variable O&M Costs ($/kWh) 0.02 0.023 0.025 0.028 0.032 0.036 Fixed O&M Costs ($/kW-year) 24 27.15 30.72 34.76 39.33 44.49
Table 4-45 Commercial Capital Costs - Oil Reciprocating Engine - Advanced New Equipment
Year 2015 2020 2025 2030 2035 2040
Equipment ($/kW) 780 780 863 922 1,003 1,090 Installation Labor and Materials ($/kW) 660 660 733 784 854 931 Engineering/Construction Management/Contingency (1) 576 576 639 684 746 813
Total Installed Cost ($/kW) 2,016 2,235 2,390 2,603 2,834 3,086 (1) Costs presented are in current 2015 dollars (2) Real cost reduction assumed to be 0% due to the mature nature of the technology. (3) Real cost reduction assumed to be 0%/year (4) Real cost reduction assumed to be 0 %/ yr

Section 4
4-30 Leidos, Inc. File: EIA | 209089
(5) Includes engineering, distributable costs, scaffolding, construction management, and start-up.
4.7 Commercial – Natural Gas Turbine (CNT) 4.7.1 Equipment and Systems The Commercial – Natural Gas Turbine (CNT) system consists of a natural gas turbine producing 1,000 kW.
4.7.2 Technology Specifications For the purposes of the analysis, a typical 1,000 kW packaged gas turbine readily available in the commercial marketplace and fueled by pipeline quality natural gas was considered. The CNT is assumed to be equipped with a remote monitoring system whose purpose is to provide real time and historical production data of the facility along with alarm functionality in the event system or equipment anomalies occur. The CNT is also assumed to be equipped with remote starting and stopping capabilities along with on-board automatic control functionality, which allow for continuous unmanned operations with periodic inspections to be conducted by O&M personnel and/or subcontracted labor.
The technology specifications for the CNT are presented in Table 4-46:
Table 4-46 Commercial – Natural Gas Turbine – 1,000 kW
Life Cycle 2015
Output Capacity (kW) 1,210 Electric Heat Rate, HHV (Btu/kWh) 14,045 Electric Efficiency, HHV (%) 24.3 Fuel Input (MMBtu/hr) 17.0 Thermal Output (MMBtu/hr) 7.072 Total CHP Efficiency (%) 65.9 Power to Thermal Output Ratio 0.58 Net Heat Rate (Btu/kWh) 6,739
Variable O&M Costs ($/kWh) 0.01 Fixed O&M Costs ($/kW-year) 41.77
4.7.3 Capital Cost Estimate The base Cost Estimate for the CNT system with a nominal capacity of 1,000 kW is $2,224/kW.
Table 4-47 summarizes the Cost Estimate categories for the CNT facility.

COMMERCIAL
File: EIA | 209089 Leidos, Inc. 4-31
Table 4-47 Base Plant Site Capital Cost Estimate for CNT
Technology: CNT Nominal Capacity (ISO): 1,000 kW
Nominal Heat Rate (ISO): 14,025 Btu/kWh-HHV
Capital Cost Category ($/kW)
(January 1, 2015 $)
Equipment Supply 1,007 Installation – Labor and Materials 618 Engineering, Construction Management, and Contingency (1) 599 Total Project EPC 2,224 (1) Includes engineering, distributable costs, scaffolding, construction management, and start-up.
4.7.4 O&M Estimate In addition to the general items discussed in the Section of this Report entitled O&M Estimate, the CNT facility includes provisions for major maintenance on the electric generators, BOP systems, and other auxiliary systems. Table 4-48 presents the O&M expenses for the CNT facility. O&M cost assumptions include labor, provisions for the completion of scheduled and unscheduled maintenance as well as major maintenance intervals. For the analysis, a CF of 93 percent was assumed.
Table 4-48 O&M Expenses for CNT 1,000 kW
Technology: CNT
Fixed O&M Expense $41.77/kW-year Variable O&M Expense $0.01/kWh

Section 4
4-32 Leidos, Inc. File: EIA | 209089
4.7.5 Reference Technologies Projections
Table 4-49 Commercial O&M - Natural Gas Turbine – Reference New Equipment(1)
Year 2015 2020 2025 2030 2035 2040
Output Capacity (kW) 1,210 1,210 1,210 1,210 1,210 1,210 Capacity Factor (%) 93 93 93 93 93 93 Hours of Operation (hrs) 8,147 8,147 8,147 8,147 8,147 8,147 Electric Heat Rate, HHV (Btu/kWh)(2) 14,045 13,906 13,769 13,632 13,497 13,364 Electric Efficiency, HHV (%) 24.3 24.5 24.8 25.0 25.3 25.5 Fuel Input (MMBtu/hr) 17.0 16.8 16.7 16.5 16.3 16.2 Thermal Output (MMBtu/hr) 7.072 7.00 6.93 6.86 6.80 6.73 Total CHP Efficiency (%) 65.9 66.2 66.4 66.7 66.9 67.2 Power to Thermal Output Ratio 0.58 0.59 0.60 0.60 0.61 0.61 Net Heat Rate (Btu/kWh) 6,739 6,673 6,607 6,541 6,476 6,412
Variable O&M Costs ($/kWh) 0.0102 0.0115 0.0130 0.0148 0.0167 0.0189 Fixed O&M Costs ($/kW-year) 41.77 47.26 53.47 60.50 68.45 77.44 (1) Assumes new system installed every five years. (2) Heat rate improvement projection (3) Variable and Fixed O&M costs represented in current dollars. Assumed to increase 2.5%/year.
Table 4-50 Commercial O&M - Natural Gas Turbine – 2015 Degraded Equipment
Year 2015 2020 2025 2030 2035 2040
Output Capacity (kW) 1,210 1,185 1,160 1,135 1,110 1,085 Capacity Factor (%) 93 93 93 93 93 93 Hours of Operation (hrs) 8,147 8,147 8,147 8,147 8,147 8,147 Electric Heat Rate, HHV (Btu/kWh) 14,045 14,340 14,648 14,969 15,305 15,656 Electric Efficiency, HHV (%) 24.3 23.8 23.3 22.8 22.3 21.8 Fuel Input (MMBtu/hr) 17.0 17.0 17.0 17.0 17.0 17.0 Thermal Output (MMBtu/hr) 7.072 7.072 7.072 7.072 7.072 7.072 Total CHP Efficiency (%) 65.9 65.4 64.9 64.4 63.9 63.4 Power to Thermal Output Ratio 0.58 0.57 0.56 0.55 0.54 0.52 Net Heat Rate (Btu/kWh) 6,739 6,881 7,029 7,183 7,344 7,512
Variable O&M Costs ($/kWh) 0.0102 0.0118 0.0136 0.0157 0.0182 0.0211 Fixed O&M Costs ($/kW-year) 41.77 48.25 55.77 64.48 74.58 86.32

COMMERCIAL
File: EIA | 209089 Leidos, Inc. 4-33
Table 4-51 Commercial Capital Costs- Natural Gas Turbine – Reference New Equipment
Year 2015 2020 2025 2030 2035 2040
Equipment ($/kW) 1,007 1,104 1,172 1,263 1,365 1,471 Installation Labor and Materials ($/kW) 618 686 734 800 872 951 Engineering/Construction Management/Contingency (1) 599 665 711 775 845 921
Total Installed Cost ($/kW) 2,224 2,455 2,617 2,838 3,082 3,343
(1) Includes engineering, distributable costs, scaffolding, construction management, and start-up.
4.7.6 Advanced Technologies Projections Natural gas single cycle turbine technologies were significantly developed from the 1950s through the 1990s when new systems were being widely deployed. These developments paved the route for more cost-effective next-generation techniques, such as natural gas combined cycle (NGCC) systems. As a reference, Lazard cites the levelized cost of energy (LCOE) from NGCCs to range from $61 to $87 per MWh, but the gas peaking units have LCOEs of $179 to $230 per MWh.19 NGCC systems carry the benefit of low emissions for oxides of nitrogen and for carbon dioxide.
Compared to most other technologies discussed in this report, the gas turbine technologies are considered very mature technologies. Cost reductions historically accompany the deployment of a technology from one sales volume to a relatively higher sales volume, but gas turbines have already been produced in high volumes over decades of deployment. The gas turbines also compete with the renewable technologies, NGCCs, and other electricity generators in the electricity market but do not appear to grow in significant numbers in modeling results because of their costs relative to other technologies. In five simulations for EPRI in 2013, the unit capital costs ($/kW) for gas turbines did not drop from 2015 levels until the year 2045.20
However, significant advances on these technologies continue to be made in the transportation sector. For example, Federal contract awards have led to the development of new turbine engines for aircraft that use ceramic membrane composites to achieve turbine operation at higher temperatures than previously possible. These efforts lead to turbines that can operate both in high power and in low fuel usage modes.21
19 Lazard, 2014. “Lazard’s Levelized Cost of Energy Analysis—Version 8.0.” September 2014. Last accessed from http://www.lazard.com/PDF/Levelized%20Cost%20of%20Energy%20-%20Version%208.0.pdf on April 23, 2015. 20 Azevedo, I. P. Jaramillo, E. Rubin, and S. Yeh. Modeling Technology Learning for Electricity Supply Technologies. Phase II Report to Electric Power Research Institute. June 2013. http://www.cmu.edu/epp/iecm/rubin/PDF%20files/2013/FINAL%20PHASE%20II%20REPORT%20TO%20EPRI_June%2030.pdf. 21 GE Aviation, 2015. “GE Successfully Tests World’s First Rotating Ceramic Matrix Composite Material for Next-Gen Combat Engine.” Press Center. February 10, 2015. http://www.geaviation.com/press/military/military_20150210.html.

Section 4
4-34 Leidos, Inc. File: EIA | 209089
Advances in other electricity-generating technologies may also improve the efficiency of gas turbines. For example, fifty research projects at DOE NETL address hydrogen turbines. Natural gas turbines operating in CHP systems that meet regulatory emission requirements could also benefit from the improvements in combined cycle units. However, the current deployment of natural gas turbines and reciprocating engines is more often for peaking or emergency conditions (because of the short startup times), thus extending the expected payback periods for these units.
Lazard (2014)19 cites fuel costs as representing 18 to 26% of the costs for gas peaking units, so future efficiency improvements (e.g., laser ignition) would result in lower fuel costs. However, natural gas fuel costs are not considered directly in this report. Itron (2011) compared cost historical cost trends and worldwide production of small gas turbines in 2006-2009 on a MW basis to develop projected costs through 2020. The installed cost ($/kW) for small gas turbines (under 2 MW) dropped 6 percent from 2015 to 2020, and the installed cost ($/kW) for large gas turbines (2-5 MW) dropped 7 percent from 2015 to 2020. However, a curve propagated so heavily from 2008-2009 data may not be representative of long-term trends (growth rates were negative from 2008 to 2009).
Because of the uncertainties mentioned in the preceding paragraphs in a competitive environment and the general acknowledgement that these technologies are mature, the advanced technology cases for natural gas turbines were not assumed to have lower unit costs ($/kW) than those in the reference cases.
Table 4-52 Commercial O&M - Natural Gas Turbine – Advanced New Equipment
Year 2015 2020 2025 2030 2035 2040
Output Capacity (kW) 1,210 1,210 1,210 1,210 1,210 1,210 Electric Heat Rate, HHV (Btu/kWh) 14,045 13,628 13,494 13,359 13,227 13,097 Electric Efficiency, HHV (%) 24.3 25.0 25.3 25.5 25.8 26.1 Fuel Input (MMBtu/hr) 17.0 16.5 16.3 16.2 16.0 15.8 Thermal Output (MMBtu/hr) 7.072 6.86 6.79 6.73 6.66 6.59 Total CHP Efficiency (%) 65.9 66.7 66.9 67.2 67.4 67.7 Power to Thermal Output Ratio 0.58 0.60 0.61 0.61 0.62 0.63 Net Heat Rate (Btu/kWh) 6,739 6,539 6,475 6,410 6,347 6,284
Variable O&M Costs ($/kWh) 0.0102 0.0115 0.013 0.0148 0.0167 0.0189 Fixed O&M Costs ($/kW-year) 41.77 47.26 53.47 60.50 68.45 77.44

COMMERCIAL
File: EIA | 209089 Leidos, Inc. 4-35
Table 4-53 Commercial Capital Costs- Natural Gas Turbine – Advanced New Equipment
Year 2015 2020 2025 2030 2035 2040
Equipment ($/kW) 1,007 1,104 1,172 1,263 1,365 1,471 Installation Labor and Materials ($/kW) 618 686 734 800 872 951 Engineering/Construction Management/Contingency (1) 599 665 711 775 845 921
Total Installed Cost ($/kW) 2,224 2,455 2,617 2,838 3,082 3,343
(1) Includes engineering, distributable costs, scaffolding, construction management, and start-up.
4.8 Commercial – Natural Gas Micro-turbine (CNM) 4.8.1 Equipment and Systems The Commercial – Natural Gas Micro-turbine (CNM) is sized at 250 kW.
4.8.2 Technology Specifications For the purposes of the analysis, a typical 250 kW packaged gas fired micro-turbine readily available in the commercial marketplace and fueled by pipeline quality natural gas was considered. The CNM is assumed to be equipped with a remote monitoring system whose purpose is to provide real time and historical production data of the facility along with alarm functionality in the event system or equipment anomalies occur. The CNM is also assumed to be equipped with remote starting and stopping capabilities along with on-board automatic control functionality, which allow for continuous unmanned operations with periodic inspections to be conducted by O&M personnel and/or subcontracted labor.
The technology specifications for the CNM are presented in Table 4-54:
Table 4-54 Commercial – Natural Gas Micro-turbine – 250 kW
Life Cycle 2015
Output Capacity (kW) 250.0 Electric Heat Rate, HHV (Btu/kWh) 13,200 Electric Efficiency, HHV (%) 25.9 Fuel Input (MMBtu/hr) 3.3 Thermal Output (MMBtu/hr) 1.33 Total CHP Efficiency (%) 66.3 Power to Thermal Output Ratio 0.64 Net Heat Rate (Btu/kWh) 6,533 Variable O&M Costs ($/kWh) 0.0138 Fixed O&M Costs ($/kW-year) 18.22

Section 4
4-36 Leidos, Inc. File: EIA | 209089
4.8.3 Capital Cost Estimate The base Cost Estimate for the CNM facility with a nominal capacity of 250 kW is $3,404/kW.
The cost estimate for the CNM 250 kW assumes having a small site adjacent to the end use. A one-acre site is required to be cleared, leveled and conditioned to accept underground utilities such as water, gas, electric, sewage, drainage, just as what is found at any large facility. The CNM price was obtained from Gas Turbine World 2013 TW Handbook Volume 30. The equipment cost for the 250 kW machine was obtained from pricing of a 200 kW and factored for size using the six-tenths estimating rule, plus freight delivery to the site. Peripheral electrical equipment necessary to complement the Peaking power plant needs has been added to the estimate. The cost estimate includes site preparation, gas tapping costs, structures, equipment, electrical, distributable cost, engineering and design and subcontractor fee and budget contingency. All estimated costs are expressed in $/kW. All numbers in these estimates are based on prices and wages for the Gulf Coast Region of the U.S.
Table 4-55 summarizes the Cost Estimate categories for the CNM facility.
Table 4-55 Base Plant Site Capital Cost Estimate for CNM
Technology: CNM Nominal Capacity (ISO): 250 kW
Nominal Heat Rate (ISO): 13,080 Btu/kWh-HHV
Capital Cost Category ($/kW)
(January 1, 2015 $)
Equipment Supply 1,455 Installation – Labor and Materials 1,069 Engineering, Construction Management, and Contingency (1) 880 Total Project EPC 3,404 (1) Includes engineering, distributable costs, scaffolding, construction management, and start-up.
4.8.4 O&M Estimate In addition to the general items discussed in the Section of this Report entitled O&M Estimate, the CNM facility include the major maintenance for the CT, as well as the BOP, including the associated electric generator, and emissions reduction catalysts. These major maintenance expenses are included with the VOM expense for this technology and are given on an average basis with an assumed CF of 93 percent. Table 4-56 presents the O&M expenses for the CNM Facility.

COMMERCIAL
File: EIA | 209089 Leidos, Inc. 4-37
Table 4-56 O&M Expenses for CNM
Technology: CNM
Fixed O&M Expense $18.22/kW-year Variable O&M Expense $0.0138/kWh
4.8.5 Reference Technologies Projections The following tables present the reference performance characteristics and cost projections for CNM.
Table 4-57 Commercial O&M- Natural Gas Micro-turbine – Reference New Equipment
Year 2015 2020 2025 2030 2035 2040
Output Capacity (kW)(1) 250 250 250 250 250 250 Capacity Factor (%) 93 93 93 93 93 93 Hours of Operation (hrs) 8,147 8,147 8,147 8,147 8,147 8,147 Electric Heat Rate, HHV (Btu/kWh)2
13,200 13,069 12,940 12,812 12,685 12,559
Electric Efficiency, HHV (%) 25.86 26.12 26.38 26.64 26.91 27.18 Fuel Input (MMBtu/hr) 3.30 3.27 3.24 3.20 3.17 3.14 Thermal Output (MMBtu/hr) 1.33 1.32 1.31 1.29 1.28 1.27 Total CHP Efficiency (%) 66.26 66.52 66.78 67.04 67.31 67.58 Power to Thermal Output Ratio 0.64 0.65 0.65 0.66 0.67 0.67 Net Heat Rate (Btu/kWh) 6,533 6,468 6,405 6,341 6,278 6,216
Variable O&M Costs ($/kWh)3 0.0138 0.0153 0.0164 0.0179 0.0195 0.0212 Fixed O&M Costs ($/kW-year)3 18.22 20.22 21.63 23.59 25.71 28.02 (1) Leidos has assumed a constant turbine output capacity across the projection period and new system installed every five
years. (2) Heat rate improvement projected to be 0.06% for 5 years and 1% per 5 years after 2020. (3) Fixed and variable O&M costs represented in current 2015 dollars.

Section 4
4-38 Leidos, Inc. File: EIA | 209089
Table 4-58 Commercial O&M- Natural Gas Micro-turbine - 2015 Degraded Equipment
Year 2015 2020 2025 2030 2035 2040
Output Capacity (kW) 250 244 238 238 223 214 Capacity Factor (%) 93 93 93 93 93 93 Hours of Operation (hrs) 8,147 8,147 8,147 8,147 8,147 8,147 Electric Heat Rate, HHV (Btu/kWh) 13,200 13,538 13,886 13,886 14,812 15,406 Electric Efficiency, HHV (%) 26.1 25.2 24.6 24.6 23 22.2 Fuel Input (MMBtu/hr) 3.30 3.30 3.30 3.30 3.30 3.30 Thermal Output (MMBtu/hr) 1.33 1.33 1.33 1.33 1.33 1.33 Total CHP Efficiency (%) 66.26 65.57 64.92 64.92 63.41 62.60 Power to Thermal Output Ratio 0.64 0.62 0.61 0.61 0.57 0.55 Net Heat Rate (Btu/kWh) 7,200 7,385 7,574 7,574 8,080 8,403
Variable O&M Costs ($/kWh) 0.0138 0.0157 0.0172 0.0188 0.0218 0.0248 Fixed O&M Costs ($/kW-year) 18.22 20.72 22.73 24.78 28.82 32.74
Table 4-59 Commercial Capital Costs- Natural Gas Micro-turbine - Reference New Equipment
Year 2015 2020 2025 2030 2035 2040
Equipment ($/kW) 1,455 1,599 1,694 1,828 1,973 2,129 Installation Labor and Materials ($/kW) 1,069 1,187 1,270 1,384 1,508 1,644
Engineering/Construction Management/Contingency (1) 880
977
1,045
1,139
1,242
1,354
Total Installed Cost ($/kW) 3,404 3,762 4,009 4,351 4,723 5,127 (1) Capital cost of a new system installed every 5 years. (2) Includes engineering, distributable costs, scaffolding, construction management, and start-up. (3) Costs are presented as current dollars.
4.8.6 Advanced Technologies Projections Partnered with Capstone, the ORNL is developing microturbines with greater electrical efficiencies. In demonstration trials, a low pressure spool microturbine achieved 35% LHV electrical efficiency (32% HHV) at 70°F to deliver 278 kW. The second phase of the current project (2013-2015) aims to develop a higher temperature combustion system to achieve a 42% LHV electrical efficiency using advanced materials at the higher temperatures.
Because a major DOE research focus for microturbines has been on improved electrical efficiency and because the electrical efficiencies of current products on the market are higher than the reference case, this study used electrical efficiency as the basis for

COMMERCIAL
File: EIA | 209089 Leidos, Inc. 4-39
predicting future costs (on a per kW basis) for the advanced technology case. Table X-1 below shows the efficiencies discussed in the preceding paragraphs and assigns them to particular future years.
Table 4-59a Assignment of Electrical Efficiencies to New Microturbine Units for Current and
Future Years in Advanced Technology Case Year HHV Electrical
Efficiency Basis
2015 26.1% Reference case from Table 4-57 2020 30% Current manufacturer’s rating on Capstone microturbines with ratings
of 200 kW, 600 kW, 800 kW, and 1000 kW 2025 32% Low pressure spool rating already achieved by ORNL with existing
materials and meeting CARB emission standards 2040 38% Goal for ORNL R&D units by the end of 2015; 25-year horizon allows
time to develop cost-competitive high-temperature materials
Table 4-60 Commercial O&M- Natural Gas Micro-turbine - Advanced New Equipment
Year 2015 2020 2025 2030 2035 2040
Output Capacity (kW)(1) 250 250 250 250 250 250 Electric Heat Rate, HHV (Btu/kWh)(2) 13,200 11,377 10,666 10,038 9,481 8,982 Electric Efficiency, HHV (%) 26.1 30 32 34 36 38 Fuel Input (MMBtu/hr)(3) 3.3 2.84 2.67 2.51 2.37 2.25 Thermal Output (MMBtu/hr)(4) 1.33 1.15 1.08 1.01 0.96 0.91 Total CHP Efficiency (%) 62.2 70.40 72.40 74.40 76.40 78.40 Power to Thermal Output Ratio 0.72 0.74 0.79 0.84 0.89 0.94 Net Heat Rate (Btu/kWh) 6,533 5,631 5,279 4,968 4,692 4,445
Variable O&M Costs ($/kWh)(5) 0.0138 0.0142 0.0155 0.0185 0.0184 0.0202 Fixed O&M Costs ($/kW-year)(6) 18.22 20.22 21.64 23.59 25.71 28.02
1) Output capacity maintained at 250 kW 2) Heat rates estimated based on ORNL R&D goals 3) Fuel input based on unit capacity and heat rate values 4) Thermal output adjusted based on heat input values 5) VOM adjusted based on incremental efficiency improvement; represented in current dollars 6) FOM reference values remain unchanged; represented in current dollars

Section 4
4-40 Leidos, Inc. File: EIA | 209089
Table 4-61 Commercial Capital Costs- Natural Gas Micro-turbine - Advanced New Equipment
Year 2015 2020 2025 2030 2035 2040
Equipment ($/kW)(1) 1,455 1,411 1,451 1,504 1,586 1,684 Installation Labor and Materials ($/kW) (2) 1,069 1,187 1,270 1,384 1,508 1,644 Engineering/Construction Management/Contingency (3) 880 977 1,045 1,139 1,242 1,354
Total Installed Cost ($/kW) 3,404 3,575 3,766 4,027 4,336 4,682 1) Equipment cost of reference case adjusted based on the ratio of heat rate for advanced case to reference
case, using a scaling exponent of 0.9 for year 2020, 0.85 for 2025, 0.8 for 2030, 0.75 for 2035, and 0.7 for 2040. Scaling exponent values represent increasing challenges of manufacturing for higher efficiencies.
2) Assumes no change in values from reference values. 3) Includes engineering, distributable costs, scaffolding, construction management, and start-up.
Assumes no change in values from reference values.

File: EIA | 209089
Section 5 INDUSTRIAL
5.1 Industrial – Natural Gas Reciprocating Engine-1,000 kW (IRE1)
5.1.1 Equipment and Systems The Industrial Natural Gas Reciprocating Engine Facility with 1,000 kW capacity (IRE1) is discussed below .
5.1.2 Technology Specifications
Table 5-1 Industrial – Natural Gas Reciprocating Engine – 1,000 kW
Life Cycle 2015
Output Capacity (kW) 1,312 Electric Heat Rate, HHV (Btu/kWh) 9,614 Electric Efficiency, HHV (%) 35.5 Fuel Input (MMBtu/hr) 12.614 Thermal Output (MMBtu/hr) 5.42 Total CHP Efficiency (%) 78.50 Power to Thermal Output Ratio 0.826 Net Heat Rate (Btu/kWh) 4,446
Variable O&M Costs ($/kWh) 0.011 Fixed O&M Costs ($/kW-year) 18.00
The IRE1 facility is controlled using a DCS. The DCS provides centralized control of the facility by integrating the control systems provided with the reciprocating engineer and associated electric generator and the control of BOP systems and equipment.
5.1.3 Capital Cost Estimate The base Cost Estimate for the IRE1 Facility with a nominal capacity of 1,000 kW is $1,899/kW.
The cost estimate for the IRE1 - 1000 kW assumes having a small site adjacent to the end use or transmission line. A two-acre site is assumed to be required to be cleared, leveled and conditioned to accept underground utilities such as water, gas, electric, sewage, drainage, just as what is found at any large facility. The IRE1 engine price was obtained from a local dealer. Peripheral electrical equipment necessary to complement the industrial power plant needs has been added to the estimate, also included is a diesel
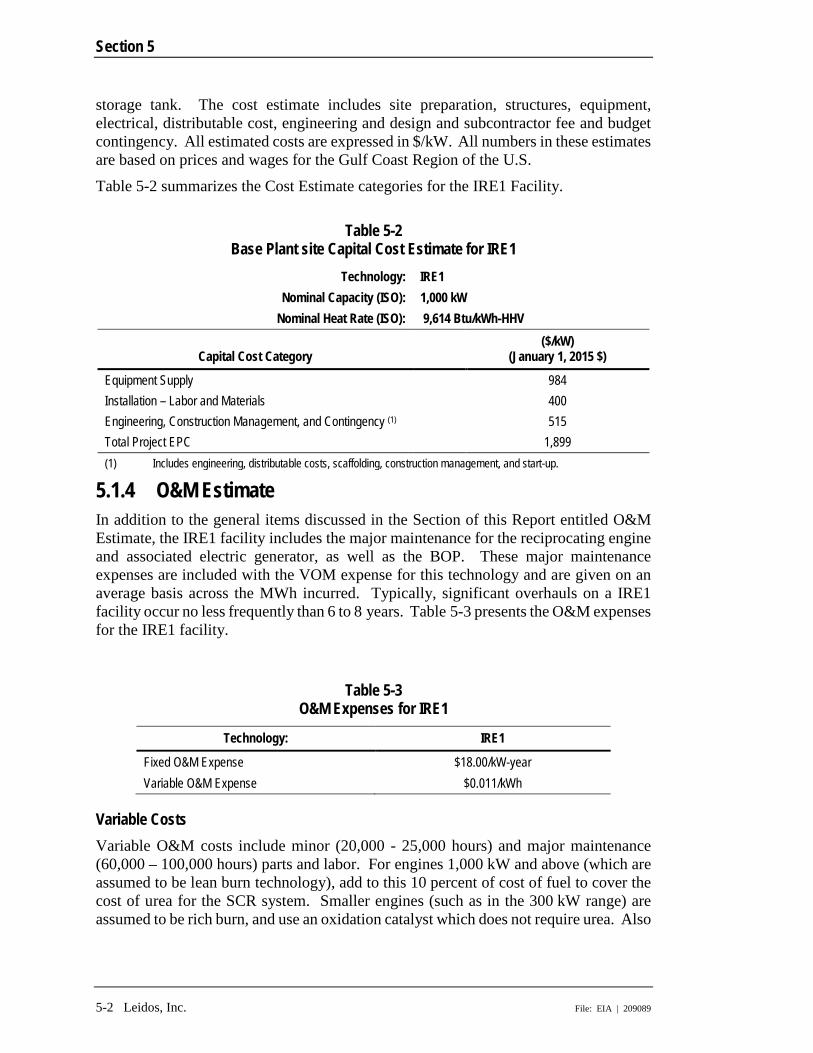
Section 5
5-2 Leidos, Inc. File: EIA | 209089
storage tank. The cost estimate includes site preparation, structures, equipment, electrical, distributable cost, engineering and design and subcontractor fee and budget contingency. All estimated costs are expressed in $/kW. All numbers in these estimates are based on prices and wages for the Gulf Coast Region of the U.S.
Table 5-2 summarizes the Cost Estimate categories for the IRE1 Facility.
Table 5-2
Base Plant site Capital Cost Estimate for IRE1 Technology: IRE1
Nominal Capacity (ISO): 1,000 kW Nominal Heat Rate (ISO): 9,614 Btu/kWh-HHV
Capital Cost Category ($/kW)
(January 1, 2015 $)
Equipment Supply 984 Installation – Labor and Materials 400 Engineering, Construction Management, and Contingency (1) 515 Total Project EPC 1,899 (1) Includes engineering, distributable costs, scaffolding, construction management, and start-up.
5.1.4 O&M Estimate In addition to the general items discussed in the Section of this Report entitled O&M Estimate, the IRE1 facility includes the major maintenance for the reciprocating engine and associated electric generator, as well as the BOP. These major maintenance expenses are included with the VOM expense for this technology and are given on an average basis across the MWh incurred. Typically, significant overhauls on a IRE1 facility occur no less frequently than 6 to 8 years. Table 5-3 presents the O&M expenses for the IRE1 facility.
Table 5-3 O&M Expenses for IRE1
Technology: IRE1
Fixed O&M Expense $18.00/kW-year Variable O&M Expense $0.011/kWh
Variable Costs Variable O&M costs include minor (20,000 - 25,000 hours) and major maintenance (60,000 – 100,000 hours) parts and labor. For engines 1,000 kW and above (which are assumed to be lean burn technology), add to this 10 percent of cost of fuel to cover the cost of urea for the SCR system. Smaller engines (such as in the 300 kW range) are assumed to be rich burn, and use an oxidation catalyst which does not require urea. Also

INDUSTRIAL
File: EIA | 209089 Leidos, Inc. 5-3
included in variable O&M costs are routine maintenance consumables such as lubricating oil and filters.
Fixed Costs There are likely to be minimal or no direct fixed costs attributable to the operating of small engines, because it is assumed to be unlikely that a dedicated facility would be constructed and maintained to support a small engine. More likely, a small engine would be installed in a larger facility such a central heating plant, which would already have a staff for maintaining the overall facility, and there would be no additional fixed costs attributable directly to the small engine. While this could also be the case with a larger engine (such as 1,000 kW and above), as such an engine could be installed as a stand-alone installation which would require its own operating staff, and could, therefore, depending on the situation of the installation, fixed costs could be attributable such an installation.
5.1.5 Reference Technologies Projections
Table 5-4 Industrial O&M – Natural Gas Reciprocating Engine – Reference New Equipment
Year 2015 2020 2025 2030 2035 2040
Output Capacity (kW) 1,312 1,312 1,312 1,312 1,312 1,312 Capacity Factor (%) 93 93 93 93 93 93 Hours of Operation (hrs) 8,147 8,147 8,147 8,147 8,147 8,147 Electric Heat Rate, HHV (Btu/kWh) 9,614 9,590 9,566 9,542 9,519 9,495 Electric Efficiency, HHV (%) 35.50 35.59 35.68 35.77 35.85 35.95 Fuel Input (MMBtu/hr) 12.61 12.58 12.55 12.52 12.49 12.46 Thermal Output (MMBtu/hr) 5.42 5.41 5.40 5.38 5.37 5.36 Total CHP Efficiency (%) 78.50 78.59 78.68 78.77 78.85 78.95 Power to Thermal Output Ratio 0.826 0.828 0.830 0.832 0.834 0.836 Net Heat Rate (Btu/kWh) 4,446 4,435 4,424 4,413 4,403 4,391
Variable O&M Costs ($/kWh) 0.011 0.012 0.014 0.016 0.018 0.020 Fixed O&M Costs ($/kW-year) 18.00 20.37 23.04 26.07 29.50 33.37
Table 5-5
Industrial O&M – Natural Gas Reciprocating Engine – 2015 Degraded Equipment
Year 2015 2020 2025 2030 2035 2040
Output Capacity (kW) 1,312 1,305 1,299 1,292 1,286 1,280 Capacity Factor (%) 93 93 93 93 93 93 Hours of Operation (hrs) 8,147 8,147 8,147 8,147 8,147 8,147

Section 5
5-4 Leidos, Inc. File: EIA | 209089
Electric Heat Rate, HHV (Btu/kWh)
9,614 9,662 9,711 9,760 9,809 9,858
Electric Efficiency, HHV (%) 35.50 35.32 35.15 34.97 34.79 34.62 Fuel Input (MMBtu/hr) 12.61 12.61 12.61 12.61 12.61 12.62 Thermal Output (MMBtu/hr) 5.42 5.42 5.42 5.42 5.42 5.43 Total CHP Efficiency (%) 78.50 78.32 78.15 77.97 77.79 77.62 Power to Thermal Output Ratio 0.83 0.82 0.82 0.81 0.81 0.81 Net Heat Rate (Btu/kWh) 4,446 4,469 4,491 4,514 4,537 4,559
Variable O&M Costs ($/kWh) 0.011 0.013 0.014 0.016 0.018 0.021 Fixed O&M Costs ($/kW-year) 18.00 20.47 23.27 26.47 30.09 34.21
(1) Costs presented are in current 2015 dollars
Table 5-6 Industrial Capital Costs – Natural Gas Reciprocating Engine – Reference New
Equipment
Year 2015 2020 2025 2030 2035 2040
Equipment ($/kW) 984 1,090 1,163 1,264 1,375 1,495 Installation Labor and Materials ($/kW) 400 444 475 518 564 615 Engineering/Construction Management/Contingency (1) 515 572 612 667 727 792
Total Installed Cost ($/kW) 1,899 2,105 2,250 2,449 2,666 2,902 (1) Costs presented are in current 2015 dollars (2) Real cost reduction assumed to be 0% due to the mature nature of the technology. (3) Real cost reduction assumed to be 0%/year (4) Real cost reduction assumed to be 0 %/ yr (5) Includes engineering, distributable costs, scaffolding, construction management, and start-up.
5.1.6 Advanced Technologies Projections Compared to most other technologies discussed in this report, the reciprocating engine technology is considered very mature technology. Some advances continue to be made on these power generators (e.g., laser ignition which has been shown to increase efficiency). However, reducing installation costs is not the primary focus area. The DOE Advanced Reciprocating Engine System (ARES) program aims to achieve 50% brake thermal efficiency (80+% with CHP), a maximum of 0.1 g/bhp-hr NOx emissions, maintenance cost below $0.01/EkW-hr, and a continued cost competitiveness. Two of the three industry partners (Caterpillar and GE Dresser Waukesha) withdrew from the ARES program based on business considerations with regard to distributed energy technologies.
Cost reductions historically accompany the deployment of a technology from one sales volume to a relatively higher sales volume, but millions of reciprocating engines have already been produced over the last century. The reciprocating engines also compete with the renewable technologies, NGCCs, and other electricity generators in the

INDUSTRIAL
File: EIA | 209089 Leidos, Inc. 5-5
electricity market, but do not appear to grow in significant numbers in modeling results because of their costs relative to other technologies. In five simulations for EPRI in 2013, the unit capital costs ($/kW) did not drop from 2015 levels until the year 2045.
Advances in other electricity-generating technologies may also improve the efficiency of reciprocating engines. For example, fifty research projects at DOE NETL address hydrogen turbines. Natural gas turbines and reciprocating engines operating in CHP systems, which meet regulatory emission requirements, could also benefit from the improvements in combined cycle units. However, their current deployment is more often for peaking or emergency conditions (because of the short startup times), thus extending the expected payback periods for these units.
Because of the uncertainties associated with a competitive marketplace environment and the general acknowledgement that these technologies are very mature, the advanced technology cases for natural gas turbines and reciprocating engines were not assumed to have lower unit costs ($/kW) than those in the reference cases. Modest efficiency improvements of 2% lower than the reference case value are assumed to account for general improvements.
Table 5-7 Industrial O&M – Natural Gas Reciprocating Engine – Advanced New Equipment
Year 2015 2020 2025 2030 2035 2040
Output Capacity (kW) 1,312 1,312 1,312 1,312 1,312 1,312
Electric Heat Rate, HHV (Btu/kWh) 9,614 9,398 9,375 9,351 9,329 9,305
Electric Efficiency, HHV (%) 35.5 36.32 36.41 36.50 36.59 36.68
Fuel Input (MMBtu/hr) 12.61 12.33 12.30 12.27 12.24 12.21
Thermal Output (MMBtu/hr) 5.42 5.30 5.29 5.28 5.26 5.25
Total CHP Efficiency (%) 78.50 79.32 79.41 79.50 79.59 79.68
Power to Thermal Output Ratio 0.826 0.845 0.847 0.849 0.851 0.853
Net Heat Rate (Btu/kWh) 4,446 4,347 4,336 4,325 4,314 4,304
Variable O&M Costs ($/kWh) 0.011 0.0124 0.0141 0.0159 0.0180 0.0204
Fixed O&M Costs ($/kW-year) 18 20.37 23.04 26.07 29.50 33.37
(1) Costs presented are in current 2015 dollars
Table 5-8
Industrial Capital Costs – Natural Gas Reciprocating Engine – Advanced New Equipment
Year 2015 2020 2025 2030 2035 2040
Equipment ($/kW) 984 1,090 1,163 1,264 1,375 1,495 Installation Labor and Materials ($/kW) 400 444 475 518 564 615 Engineering/Construction Management/Contingency (1) 515 572 612 667 727 792
Total Installed Cost ($/kW) 1,899 2,105 2,250 2,449 2,666 2,902 (1) Costs presented are in current 2015 dollars (2) Real cost reduction assumed to be 0% due to the mature nature of the technology.

Section 5
5-6 Leidos, Inc. File: EIA | 209089
(3) Real cost reduction assumed to be 0%/year (4) Real cost reduction assumed to be 0 %/ yr (5) Includes engineering, distributable costs, scaffolding, construction management, and start-up.
5.2 Industrial – Natural Gas Reciprocating Engine – 3,000 kW (IRE3)
5.2.1 Equipment and Systems The Industrial Natural Gas Reciprocating Engine Facility produces a nominal 3,000 kW capacity (IRE3).
5.2.2 Technology Specifications The technology specifications for the IRE3 are presented in Table 5-9:
Table 5-9 Industrial – Natural Gas Reciprocating Engine – 3,000 kW
Life Cycle 2015
Output Capacity (kW) 3,000 Electric Heat Rate, HHV (Btu/kWh) 7,810 Electric Efficiency, HHV (%) 43.7 Fuel Input (MMBtu/hr) 23.43 Thermal Output (MMBtu/hr) 9.864 Total CHP Efficiency (%) 85.80 Power to Thermal Output Ratio 1.038 Net Heat Rate (Btu/kWh) 3,700
Variable O&M Costs ($/kWh) 0.009 Fixed O&M Costs ($/kW-year) 8.00
5.2.3 Capital Cost Estimate The base Cost Estimate for the IRE3 facility with a nominal capacity of 3 MW is $1,742/kW.
The cost estimate for the IRE3 3,000 kW assumes having a small site adjacent to the end use or transmission line. A two-acre site is assumed to be required to be cleared, leveled and conditioned to accept underground utilities such as water, gas, electric, sewage, drainage, just as what is found at any large facility. The IRE3 engine price was obtained from a local dealer. Peripheral electrical equipment necessary to complement the Industrial power plant needs has been added to the estimate, also included is a diesel storage tank. The cost estimate includes site preparation, structures, equipment, electrical, distributable cost, engineering and design and subcontractor fee and budget contingency. All estimated costs are expressed in $/kW. All numbers in these estimates are based on prices and wages for the Gulf Coast Region of the U.S.
Table 5-10 summarizes the Cost Estimate categories for the IRE3 facility.

INDUSTRIAL
File: EIA | 209089 Leidos, Inc. 5-7
Table 5-10 Base Plant Site Capital Cost Estimate for IRE3
Technology: IRE3 Nominal Capacity (ISO): 3,000 kW
Nominal Heat Rate (ISO): 7,810 Btu/kWh-HHV
Capital Cost Category ($/kW)
(January 1, 2015 $)
Equipment Supply 991 Installation – Labor and Materials 377 Engineering, Construction Management, and Contingency (1) 374 Total Project EPC 1,742
(1) Includes engineering, distributable costs, scaffolding, construction management, and start-up.
5.2.4 O&M Estimate Table 5-11 presents the O&M expenses for the IRE3 facility.
Table 5-11 O&M Expenses for IRE3
Technology: IRE3
Fixed O&M Expense $8.00/kW-year Variable O&M Expense $0.009/kWh

Section 5
5-8 Leidos, Inc. File: EIA | 209089
5.2.5 Reference Technologies Projections
Table 5-12 Industrial O&M – Natural Gas Reciprocating Engine – Reference New Equipment
Year 2015 2020 2025 2030 2035 2040
Output Capacity (kW) 3,000 3,000 3,000 3,000 3,000 3,000 Capacity Factor (%) 93 93 93 93 93 93 Hours of Operation (hrs) 8,147 8,147 8,147 8,147 8,147 8,147 Electric Heat Rate, HHV (Btu/kWh) 7,810 7,791 7,771 7,752 7,732 7,713 Electric Efficiency, HHV (%) 43.70 43.81 43.92 44.03 44.14 44.25 Fuel Input (MMBtu/hr) 23.43 23.37 23.31 23.26 23.20 23.14 Thermal Output (MMBtu/hr) 9.86 9.84 9.81 9.79 9.77 9.74 Total CHP Efficiency (%) 85.80 85.91 86.02 86.13 86.24 86.35 Power to Thermal Output Ratio 1.038 1.041 1.043 1.046 1.048 1.051 Net Heat Rate (Btu/kWh) 3,700 3,691 3,682 3,673 3,663 3,654
Variable O&M Costs ($/kWh) 0.009 0.010 0.012 0.013 0.015 0.017 Fixed O&M Costs ($/kW-year) 8.00 9.05 10.24 11.59 13.11 14.83
(1) Costs presented are in current 2015 dollars
Table 5-13 Industrial O&M – Natural Gas Reciprocating Engine – 2015 Degraded Equipment
Year 2015 2020 2025 2030 2035 2040
Output Capacity (kW) 3,000 2,985 2,970 2,955 2,940 2,926 Capacity Factor (%) 93 93 93 93 93 93 Hours of Operation (hrs) 8,147 8,147 8,147 8,147 8,147 8,147 Electric Heat Rate, HHV (Btu/kWh) 7,810 7,849 7,889 7,928 7,968 8,008 Electric Efficiency, HHV (%) 43.70 43.48 43.26 43.05 42.83 42.62 Fuel Input (MMBtu/hr) 23.43 23.43 23.43 23.43 23.43 23.43 Thermal Output (MMBtu/hr) 9.864 9.913 9.964 10.013 10.064 10.114 Total CHP Efficiency (%) 85.80 85.79 85.79 85.79 85.79 85.78 Power to Thermal Output Ratio 1.038 1.028 1.017 1.007 0.997 0.987 Net Heat Rate (Btu/kWh) 3,700 3,698 3,695 3,692 3,689 3,687
Variable O&M Costs ($/kWh) 0.009 0.010 0.012 0.013 0.015 0.017 Fixed O&M Costs ($/kW-year) 8 9.10 10.34 11.77 13.38 15.21
(1) Costs presented are in current 2015 dollars

INDUSTRIAL
File: EIA | 209089 Leidos, Inc. 5-9
Table 5-14 Industrial Capital Costs Natural Gas Reciprocating Engine – Reference New
Equipment(1)
Year 2015 2020 2025 2030 2035 2040
Equipment ($/kW)(2) 991 1,097 1,171 1,273 1,384 1,505 Installation Labor and Materials ($/kW)(3)
377 418 448 488 532 580
Engineering/Construction Management/Contingency (4,5)
374 415 444 484 528 575
Total Installed Cost ($/kW) 1,742 1,931 2,063 2,246 2,444 2,660 (1) Costs presented are in current 2015 dollars (2) Real cost reduction assumed to be 0% due to the mature nature of the technology. (3) Real cost reduction assumed to be 0%/year (4) Real cost reduction assumed to be 0 %/ yr (5) Includes engineering, distributable costs, scaffolding, construction management, and start-up.
5.2.6 Advanced Technologies Projections See section 5.2.5 discussion.
Table 5-15 Industrial O&M – Natural Gas Reciprocating Engine – Advanced New Equipment
Year 2015 2020 2025 2030 2035 2040
Output Capacity (kW) 3,000 3,000 3,000 3,000 3,000 3,000 Electric Heat Rate, HHV (Btu/kWh) 7,810 7,635 7,616 7,597 7,577 7,559 Electric Efficiency, HHV (%) 43.7 44.70 44.82 44.93 45.04 45.15 Fuel Input (MMBtu/hr) 23.43 22.91 22.85 22.79 22.73 22.68 Thermal Output (MMBtu/hr) 9.864 9.86 9.84 9.81 9.79 9.77 Total CHP Efficiency (%) 85.8 87.76 87.88 87.99 88.11 88.22 Power to Thermal Output Ratio 1.038 1.038 1.041 1.043 1.046 1.049 Net Heat Rate (Btu/kWh) 3,700 3,525 3,516 3,508 3,498 3,490
Variable O&M Costs ($/kWh) 0.009 0.01 0.012 0.013 0.015 0.017 Fixed O&M Costs ($/kW-year) 8 9.05 10.24 11.59 13.11 14.83
Table 5-16
Industrial Capital Costs Natural Gas Reciprocating Engine – Advanced New Equipment(1)
Year 2015 2020 2025 2030 2035 2040
Equipment ($/kW)(2) 991 1,097 1,171 1,273 1,384 1,505 Installation Labor and Materials ($/kW) 377 418 448 488 532 580 Engineering/Construction Management/Contingency (4,5) 374 415 444 484 528 575
Total Installed Cost ($/kW) 1,742 1,931 2,063 2,246 2,444 2,660 (1) Costs presented are in current 2015 dollars (2) Real cost reduction assumed to be 0% due to the mature nature of the technology. (3) Real cost reduction assumed to be 0%/year

Section 5
5-10 Leidos, Inc. File: EIA | 209089
(4) Real cost reduction assumed to be 0 %/ yr (5) Includes engineering, distributable costs, scaffolding, construction management, and start-up.
5.3 Industrial – Natural Gas Turbine (IGT5) 5.3.1 Equipment and Systems The Industrial Natural Gas Turbine System for 5,000 kW (IGT5) produces 5 kW net of electricity. The facility uses a 5 MW natural gas turbine.
Figure 5.1: GT Design Configuration
5.3.2 Technology Specifications The IGT5 facility has one natural gas turbine mechanically coupled to an electric generator. The generator is a 60 Hertz (Hz) machine rated at approximately 6 mega-volt-amperes (MVA) with an output voltage of 13.8 kilovolt (kV). The electric generator is connected to a high-voltage bus in the facility switchyard via a dedicated generator circuit breaker, Generator Step-up (GSU) transformer, high-voltage circuit breaker, and a disconnect switch. The GSU increases the voltage from the electric generator from 13.8 kV to interconnected transmission system high voltage.
The IGT5 facility is controlled using a DCS. The DCS provides centralized control of the facility by integrating the control systems provided with the GT and associated electric generator, and the control of BOP systems and equipment.
The technology specifications for the IGT5 are presented in Table 5-17:

INDUSTRIAL
File: EIA | 209089 Leidos, Inc. 5-11
Table 5-17 Industrial – Natural Gas Turbine – 5,000 kW
Life Cycle 2015
Output Capacity (kW) 5,300 Electric Heat Rate, HHV (Btu/kWh) 12,688 Electric Efficiency, HHV (%) 26.9 Fuel Input (MMBtu/hr) 67.245 Thermal Output (MMBtu/hr) 35.573 Total CHP Efficiency (%) 79.80 Power to Thermal Output Ratio 0.509 Net Heat Rate (Btu/kWh) 4,298
Variable O&M Costs ($/kWh) 0.010 Fixed O&M Costs ($/kW-year) 79.02
5.3.3 Capital Cost Estimate The base Cost Estimate for the IGT5 facility with a nominal capacity of 5 MW is $1,509/kW.
The cost estimate for the IGT5 5,000 kW assumes having a small site located adjacent to the end use. A two-acre site is assumed to be required to be cleared, leveled and conditioned to accept underground utilities such as water, gas, electric, sewage, drainage, just as what is found at any large facility. The combustion turbine price was obtained from Gas Turbine World 2013 TW Handbook Volume 30. The equipment cost for the 5,000 kW machine was obtained from pricing of a 5,245 kW and factored for size using the six-tenths estimating rule, plus freight delivery to the site. Peripheral electrical equipment necessary to complement the peaking power plant needs has been added to the estimate. The cost estimate includes site preparation, gas tapping costs, structures, equipment, electrical, distributable cost, engineering and design and subcontractor fee and budget contingency. All estimated costs are expressed in $/kW. All numbers in these estimates are based on prices and wages for the Gulf Coast Region of the U.S.
Table 5-18 summarizes the Cost Estimate categories for the IGT5 facility.

Section 5
5-12 Leidos, Inc. File: EIA | 209089
Table 5-18 Base Plant Site Capital Cost Estimate for IGT5
Technology: 1GT5 Nominal Capacity (ISO): 5,000 kW
Nominal Heat Rate (ISO): 12,660 Btu/kWh-HHV
Capital Cost Category ($/kW)
(January 1, 2015 $)
Equipment Supply 647 Installation – Labor and Materials 450 Engineering, Construction Management, and Contingency (1) 412 Total Project EPC 1,509 (1) Includes engineering, distributable costs, scaffolding, construction management, and start-up.
5.3.4 O&M Estimate In addition to the general items discussed in the Section of this Report entitled O&M Estimate, the GT facility includes major maintenance on the electric generator (each approximately every six years dependent upon the unit’s capacity factor). O&M cost assumptions include labor, provisions for the completion of scheduled and unscheduled maintenance as well as major maintenance intervals. For the analysis, a CF of 93 percent was assumed. Table 5-19 presents the FOM and VOM expenses for the GT facility.
Table 5-19 O&M Expenses for IGT5
Technology: IGT5
Fixed O&M Expense $79.02/kW-year Variable O&M Expense $0.010/kWh

INDUSTRIAL
File: EIA | 209089 Leidos, Inc. 5-13
5.3.5 Reference Technologies Projections See section 5.2.5 discussion.
Table 5-20 Industrial O&M - Natural Gas Turbine – Reference New Equipment
Year 2015 2020 2025 2030 2035 2040
Output Capacity (kW) 5,300 5,300 5,300 5,300 5,300 5,300 Capacity Factor (%) 93 93 93 93 93 93 Hours of Operation (hrs) 8,147 8,147 8,147 8,147 8,147 8,147 Electric Heat Rate, HHV (Btu/kWh) 12,688 12,562 12,438 12,315 12,193 12,072 Electric Efficiency, HHV (%) 26.90 27.17 27.44 27.71 27.99 28.27 Fuel Input (MMBtu/hr) 67.25 66.58 65.92 65.27 64.62 63.98 Thermal Output (MMBtu/hr) 27.91 27.63 27.36 27.09 26.82 26.55 Total CHP Efficiency (%) 68.40 68.67 68.94 69.21 69.49 69.77 Power to Thermal Output Ratio 0.648 0.655 0.661 0.668 0.674 0.681 Net Heat Rate (Btu/kWh) 6,106 6,045 5,986 5,927 5,868 5,810
Variable O&M Costs ($/kWh) 0.010 0.011 0.013 0.014 0.016 0.018 Fixed O&M Costs ($/kW-year) 79.02 89.40 101.15 114.45 129.48 146.50
(1) Assumptions based on recent projects along with the Solar Turbine data cut sheets for CHP and performance from Solar Turbine’s website.
(2) Assumes new system installed every five years. (3) Heat rate improvement projection assumes 1% every 5 years (4) Variable and Fixed O&M costs represented in current dollars. Assumed to increase 2.5%/year.

Section 5
5-14 Leidos, Inc. File: EIA | 209089
Table 5-21
Industrial O&M - Natural Gas Turbine – 2015 Degraded Equipment
Year 2015 2020 2025 2030 2035 2040
Output Capacity (kW) 5,300 5,038 4,938 4,840 4,743 4,649 Capacity Factor (%) 93 93 93 93 93 93 Hours of Operation (hrs) 8,147 8,147 8,147 8,147 8,147 8,147 Electric Heat Rate, HHV (Btu/kWh) 12,688 13,347 13,618 13,894 14,176 14,464 Electric Efficiency, HHV (%) 26.90 25.57 25.06 24.56 24.08 23.60 Fuel Input (MMBtu/hr) 67.25 67.24 67.25 67.25 67.24 67.24 Thermal Output (MMBtu/hr) 27.907 27.907 27.907 27.907 27.907 27.907 Total CHP Efficiency (%) 68.40 67.07 66.56 66.06 65.58 65.10 Power to Thermal Output Ratio 0.648 0.616 0.604 0.592 0.580 0.569 Net Heat Rate (Btu/kWh) 6,106 6,423 6,554 6,687 6,821 6,961
Variable O&M Costs ($/kWh) 0.01 0.012 0.014 0.015 0.018 0.021 Fixed O&M Costs ($/kW-year) 79.02 94.05 108.57 125.33 144.69 167.01
(1) Assumptions based on recent projects along with the Solar Turbine data cut sheets for CHP and performance from Solar Turbine’s website.
(2) Fixed and variable assume 93% CF. (3) Thermal output assumed constant
Table 5-22 Industrial Capital Costs - Natural Gas Turbine – Reference New Equipment
Year 2015 2020 2025 2030 2035 2040
Equipment ($/kW) 647 711 753 813 877 947 Installation Labor and Materials ($/kW) 450 500 534 583 635 692 Engineering/Construction Management/Contingency (1)
412 457 489 533 581 634
Total Installed Cost ($/kW) 1,509 1,668 1,777 1,929 2,094 2,273
(1) Includes engineering, distributable costs, scaffolding, construction management, and start-up.

INDUSTRIAL
File: EIA | 209089 Leidos, Inc. 5-15
5.3.6 Advanced Technologies Projections See the discussion in Section 4.7.6 – same assumptions apply.
Table 5-23
Industrial O&M - Natural Gas Turbine – Advanced New Equipment
Year 2015 2020 2025 2030 2035 2040
Output Capacity (kW) 5,300 5,300 5,300 5,300 5,300 5,300 Electric Heat Rate, HHV (Btu/kWh) 12,688 12,311 12,189 12,069 11,949 11,831 Electric Efficiency, HHV (%) 26.9 27.72 28.00 28.28 28.56 28.85 Fuel Input (MMBtu/hr) 67.25 65.25 64.60 63.96 63.33 62.70 Thermal Output (MMBtu/hr) 27.91 27.08 26.81 26.55 26.28 26.02 Total CHP Efficiency (%) 68.40 69.22 69.50 69.78 70.06 70.35 Power to Thermal Output Ratio 0.509 0.668 0.675 0.681 0.688 0.695 Net Heat Rate (Btu/kWh) 6,106 5,925 5,866 5,808 5,751 5,693
Variable O&M Costs ($/kWh) 0.01 0.011 0.013 0.014 0.016 0.018 Fixed O&M Costs ($/kW-year) 79.02 89.4 101.15 114.45 129.48 146.5
(1) Assumptions are based on recent projects along with the Solar Turbine data cut sheets for CHP and performance from their website.
(2) Fixed and variable assume 93% CF.
Table 5-24 Industrial Capital Costs - Natural Gas Turbine – Advanced New Equipment(1)
Year 2015 2020 2025 2030 2035 2040
Equipment ($/kW)(2) 647 711 753 813 877 947 Installation Labor and Materials ($/kW)(3) 450 500 534 583 635 692 Engineering/Construction Management/Contingency (4,5) 412 457 489 533 581 634
Total Installed Cost ($/kW) 1,509 1,668 1,777 1,929 2,094 2,273 (1) Costs presented are in current 2015 dollars (2) Real cost reduction assumed to be 0% due to the mature nature of the technology. (3) Real cost reduction assumed to be 0%/year (4) Real cost reduction assumed to be 0 %/ yr (5) Includes engineering, distributable costs, scaffolding, construction management, and start-up.
5.4 Industrial – Natural Gas Turbine – 10,000 kW (IGT10) 5.4.1 Equipment and Systems The industrial natural gas turbine facility (IGT10) produces 10 MW net of electricity. The IGT10 facility consists primarily of one commercially available, factory packaged combustion turbine with 10 MW capacity. The design output of the natural gas turbine is approximately 9,950 kW of net capacity

Section 5
5-16 Leidos, Inc. File: EIA | 209089
Figure 5.2: GT Design Configuration
5.4.2 Technology Specifications There would be one turbine generator at the IGT10 facility. The turbine generator is to be rated for approximately 10 MW. The IGT10 facility has one natural gas turbine mechanically coupled to an electric generator. The generator is a 60 Hz machine rated at approximately 11.5 MVA with an output voltage of 13.8 kV. The electric generator is connected to a high-voltage bus in the facility switchyard via a dedicated generator circuit breaker, GSU, high-voltage circuit breaker and a disconnect switch. The GSU increases the voltage from the electric generator from 13.8 kV to interconnected transmission system high voltage. The IGT10 Facility is controlled using a DCS. The DCS provides centralized control of the facility by integrating the control systems provided with the GT and associated electric generator, and the control of BOP systems and equipment.
The technology specifications for the IGT10 are presented in Table 5-25:

INDUSTRIAL
File: EIA | 209089 Leidos, Inc. 5-17
Table 5-25 Industrial – Natural Gas Turbine – 10,000 kW
Life Cycle 2015
Output Capacity (kW) 9,950.0 Electric Heat Rate, HHV (Btu/kWh) 12,037 Electric Efficiency, HHV (%) 28.4 Fuel Input (MMBtu/hr) 119.765 Thermal Output (MMBtu/hr) 62.571 Total CHP Efficiency (%) 80.60 Power to Thermal Output Ratio 0.543 Net Heat Rate (Btu/kWh) 4,176
Variable O&M Costs ($/kWh) 0.004 Fixed O&M Costs ($/kW-year) 79.02
5.4.3 Capital Cost Estimate The base Cost Estimate for the IGT10 facility with a nominal capacity of 10 MW is $1,281/kW.
The cost estimate for the IGT10 9,950 kW assumes having a small site located adjacent to the end use. A five-acre site is assumed to be required to be cleared, leveled and conditioned to accept underground utilities such as water, gas, electric, sewage, drainage, just as what is found at any large facility. The combustion turbine price was obtained from Gas Turbine World 2013 TW Handbook Volume 30. The equipment cost for the 10,000 kW machine was obtained from pricing of a 11,250 kW and factored for size using the six-tenths estimating rule, plus freight delivery to the site. Peripheral electrical equipment necessary to complement the peaking power plant needs has been added to the estimate. The cost estimate includes site preparation, gas tapping costs, structures, equipment, electrical, distributable cost, engineering and design, and subcontractor fee and budget contingency. All estimated costs are expressed in $/kW. All numbers in these estimates are based on prices and wages for the Gulf Coast Region of the U.S.
Table 5-26 summarizes the Cost Estimate categories for the IGT10 facility.

Section 5
5-18 Leidos, Inc. File: EIA | 209089
Table 5-26 Base Plant Site Capital Cost Estimate for IGT10
Technology: IGT10 Nominal Capacity (ISO): 10,000 kW
Nominal Heat Rate (ISO): 12,037 Btu/kWh-HHV
Capital Cost Category ($/kW)
(January 1, 2015 $)
Equipment Supply 623 Installation – Labor and Materials 370 Engineering, Construction Management, and Contingency (1) 288 Total Project EPC 1,281 (1) Includes engineering, distributable costs, scaffolding, construction management, and start-up.
5.4.4 O&M Estimate In addition to the general items discussed in the Section of this Report entitled O&M Estimate, the IGT10 facility includes major maintenance on the turbines, electric generator (each approximately every six years) maintenance. O&M cost assumptions include labor, provisions for the completion of scheduled and unscheduled maintenance as well as major maintenance intervals. For the analysis, a CF of 93 percent was assumed.
Table 5-27 presents the FOM and VOM expenses for the IGT10 facility.
Table 5-27 O&M Expenses for IGT10
Technology: IGT10
Fixed O&M Expense $79.02/kW-year Variable O&M Expense $0.004/kWh

INDUSTRIAL
File: EIA | 209089 Leidos, Inc. 5-19
5.4.5 Reference Technologies Projections
Table 5-28 Industrial O&M - Natural Gas Turbine – Reference New Equipment
Year 2015 2020 2025 2030 2035 2040
Output Capacity (kW) 9,950 9,950 9,950 9,950 9,950 9,950 Capacity Factor (%) 93 93 93 93 93 93 Hours of Operation (hrs) 8,147 8,147 8,147 8,147 8,147 8,147 Electric Heat Rate, HHV (Btu/kWh) 12,037 11,918 11,800 11,683 11,567 11,452 Electric Efficiency, HHV (%) 28.35 28.64 28.92 29.21 29.51 29.80 Fuel Input (MMBtu/hr) 119.77 118.58 117.41 116.25 115.09 113.95 Thermal Output (MMBtu/hr) 50.30 49.81 49.31 48.82 48.34 47.86 Total CHP Efficiency (%) 70.35 70.64 70.92 71.21 71.51 71.80 Power to Thermal Output Ratio 0.675 0.682 0.689 0.696 0.703 0.710 Net Heat Rate (Btu/kWh) 5,718 5,661 5,605 5,549 5,494 5,440
Variable O&M Costs ($/kWh) 0.004 0.0045 0.0051 0.0058 0.0066 0.0074 Fixed O&M Costs ($/kW-year) 79.02 89.40 101.15 114.45 129.48 146.50
(1) Assumptions based on recent projects along with the Solar Turbine data cut sheets for CHP and performance from Solar Turbine’s website.
(2) Assumes new system installed every five years. (3) Heat rate improvement projection (4) Variable and Fixed O&M costs represented in current dollars. Assumed to increase 2.5%/year.
Table 5-29
Industrial O&M - Natural Gas Turbine – 2015 Degraded Equipment
Year 2015 2020 2025 2030 2035 2040
Output Capacity (kW) 9,950 9,459 9,270 9,086 8,905 8,728 Capacity Factor (%) 93 93 93 93 93 93 Hours of Operation (hrs) 8,147 8,147 8,147 8,147 8,147 8,147 Electric Heat Rate, HHV (Btu/kWh) 12,037 12,662 12,919 13,182 13,449 13,722 Electric Efficiency, HHV (%) 28.35 26.95 26.42 25.89 25.38 24.87 Fuel Input (MMBtu/hr) 119.77 119.77 119.76 119.77 119.76 119.77 Thermal Output (MMBtu/hr) 50.30 50.30 50.30 50.30 50.30 50.30 Total CHP Efficiency (%) 70.35 68.95 68.42 67.89 67.38 66.87 Power to Thermal Output Ratio 0.675 0.642 0.629 0.617 0.604 0.592 Net Heat Rate (Btu/kWh) 5,718 6,015 6,136 6,262 6,388 6,518
Variable O&M Costs ($/kWh) 0.004 0.005 0.005 0.007 0.008 0.009 Fixed O&M Costs ($/kW-year) 79.02 94.04 108.57 125.33 144.67 167.01
(1) Assumptions based on recent projects along with the Solar Turbine data cut sheets for CHP and performance from Solar Turbine’s website.
(2) Fixed and variable assume 93% CF.

Section 5
5-20 Leidos, Inc. File: EIA | 209089
Table 5-30 Industrial Capital Costs - Natural Gas Turbine – Reference New Equipment
Year 2015 2020 2025 2030 2035 2040
Equipment ($/kW) 623 685 725 783 845 912 Installation Labor and Materials ($/kW) 370 411 439 479 522 569 Engineering/Construction Management/Contingency (1)
288 320 342 373 406 443
Total Installed Cost ($/kW) 1,281 1,415 1,507 1,635 1,773 1,924 (1) Costs presented are in current 2015 dollars (2) Real cost reduction assumed to be 0% due to the mature nature of the technology. (3) Real cost reduction assumed to be 0%/year (4) Real cost reduction assumed to be 0 %/ yr (5) Includes engineering, distributable costs, scaffolding, construction management, and start-up.
5.4.6 Advanced Technologies Projections See the discussion in Section 4.7.6 – same assumptions apply.
Table 5-31 Industrial O&M - Natural Gas Turbine – Advanced New Equipment
Year 2015 2020 2025 2030 2035 2040
Output Capacity (kW) 9,950 9,950 9,950 9,950 9,950 9,950 Electric Heat Rate, HHV (Btu/kWh) 12,037 11,680 11,564 11,449 11,336 11,223 Electric Efficiency, HHV (%) 28.35 29.22 29.51 29.81 30.11 30.41 Fuel Input (MMBtu/hr) 119.77 116.21 115.06 113.92 112.79 111.67 Thermal Output (MMBtu/hr) 50.30 48.81 48.33 47.85 47.37 46.90 Total CHP Efficiency (%) 70.35 71.22 71.51 71.81 72.11 72.41 Power to Thermal Output Ratio 0.675 0.696 0.703 0.710 0.717 0.724 Net Heat Rate (Btu/kWh) 5,718 5,548 5,493 5,438 5,384 5,331
Variable O&M Costs ($/kWh) 0.004 0.0045 0.0051 0.0058 0.0066 0.0074 Fixed O&M Costs ($/kW-year) 79.02 89.40 101.15 114.44 129.48 146.50
(1) Assumptions based on recent projects along with the Solar Turbine data cut sheets for CHP and performance from Solar Turbine’s website.
(2) Fixed and variable assume 93% CF.

INDUSTRIAL
File: EIA | 209089 Leidos, Inc. 5-21
Table 5-32 Industrial Capital Costs - Natural Gas Turbine – Advanced New Equipment
Year 2015 2020 2025 2030 2035 2040
Equipment ($/kW) 623 685 725 783 845 912 Installation Labor and Materials ($/kW) 370 411 439 479 522 569 Engineering/Construction Management/Contingency (1) 288 320 342 373 406 443
Total Installed Cost ($/kW) 1,281 1,415 1,507 1,635 1,773 1,924 (1) Costs presented are in current 2015 dollars (2) Real cost reduction assumed to be 0% due to the mature nature of the technology. (3) Real cost reduction assumed to be 0%/year (4) Real cost reduction assumed to be 0 %/ yr (5) Includes engineering, distributable costs, scaffolding, construction management, and start-up.
5.5 Industrial – Natural Gas Turbine – 25,000 kW (IGT25) 5.5.1 Equipment and Systems The industrial natural gas turbine facility with 25 MW capacity (IGT25) generates approximately 25 MW. The IGT25 facility consists of a SwiftPac 25 combustion turbine.
Figure 5.3: GT Design Configuration
5.5.2 Technology Specifications There would be one turbine generator at the IGT25 facility utilizing aeroderivative technology commercially available in the marketplace. The turbine generator is to be rated for approximately 25 MW. The IGT25 facility has one natural gas turbine mechanically coupled to an electric generator. The generator is a 60 Hz machine rated at approximately 28.5 MVA with an output voltage of 13.8 kV. The electric generator

Section 5
5-22 Leidos, Inc. File: EIA | 209089
is connected to a high-voltage bus in the facility switchyard via a dedicated generator circuit breaker, GSU, high-voltage circuit breaker and a disconnect switch. The GSU increases the voltage from the electric generator from 13.8 kV to interconnected transmission system high voltage.
The IGT25 facility is controlled using a DCS. The DCS provides centralized control of the facility by integrating the control systems provided with the GT and associated electric generator, and the control of BOP systems and equipment.
The technology specifications for the IGT25 are presented in Table 5-33:
Table 5-33
Industrial Natural Gas Turbine – 25,000 kW
Year 2015
Output Capacity (kW) 25,210 Electric Heat Rate, HHV (Btu/kWh) 10,189 Electric Efficiency, HHV (%) 33.5 Fuel Input (MMBtu/hr) 256.864 Thermal Output (MMBtu/hr) 105.065 Total CHP Efficiency (%) 70.50 Power to Thermal Output Ratio 0.905 Net Heat Rate (Btu/kWh) 5,477
Variable O&M Costs ($/kWh) 0.006 Fixed O&M Costs ($/kW-year) 18.43
5.5.3 Capital Cost Estimate The base Cost Estimate for the IGT25 facility with a nominal capacity of 25 MW is $999/kW.
The cost estimate for the IGT25 25,000 kW assumes having a small site located adjacent to the end use. A ten-acre site is assumed to be required to be cleared, leveled and conditioned to accept underground utilities such as water, gas, electric, sewage, drainage, just as what is found at any large facility. The combustion turbine price was obtained from Gas Turbine World 2013 TW Handbook Volume 30. The equipment cost for the 25,000 kW machine was obtained from pricing of a 25,455 kW and factored for size using the six-tenths estimating rule, plus freight delivery to the site. Peripheral electrical equipment necessary to complement the peaking power plant needs has been added to the estimate. The cost estimate includes site preparation, gas tapping costs, structures, equipment, electrical, distributable cost, engineering and design and subcontractor fee and budget contingency. All estimated costs are expressed in $/kW. All numbers in these estimates are based on prices and wages for the Gulf Coast Region of the U.S.
Table 5-34 summarizes the Cost Estimate categories for the IGT25 facility.

INDUSTRIAL
File: EIA | 209089 Leidos, Inc. 5-23
Table 5-34 Base Plant Site Capital Cost Estimate for IGT25
Technology: IGT25 Nominal Capacity (ISO): 25,000 kW
Nominal Heat Rate (ISO): 10,189 Btu/kWh-HHV
Capital Cost Category ($/kW)
(January 1, 2015 $)
Equipment Supply 548 Installation – Labor and Materials 224 Engineering, Construction Management, and Contingency (1) 227 Total Project EPC 999 (1) Includes engineering, distributable costs, scaffolding, construction management, and start-up.
5.5.4 O&M Estimate The O&M cost assumptions for the IGT25 facility include labor, provisions for the completion of scheduled and unscheduled maintenance as well as major maintenance intervals. For the analysis, a CF of 93 percent was assumed.
Table 5-35 presents the O&M expenses for the IGT25 facility.
Table 5-35
O&M Expenses for IGT25
Technology: IGT25
Fixed O&M Expense $18.43/kW-year Variable O&M Expense $0.006/kWh

Section 5
5-24 Leidos, Inc. File: EIA | 209089
5.5.5 Reference Technologies Projections
Table 5-36 Industrial O&M - Natural Gas Turbine – Reference New Equipment
Year 2015 2020 2025 2030 2035 2040
Output Capacity (kW) 25,210 25,210 25,210 25,210 25,210 25,210 Capacity Factor (%) 93 93 93 93 93 93 Hours of Operation (hrs) 8,147 8,147 8,147 8,147 8,147 8,147 Electric Heat Rate, HHV (Btu/kWh) 10,189 10,088 9,988 9,889 9,791 9,694 Electric Efficiency, HHV (%) 33.50 33.83 34.17 34.51 34.86 35.21 Fuel Input (MMBtu/hr) 256.86 254.32 251.80 249.30 246.83 244.39 Thermal Output (MMBtu/hr) 95.04 94.10 93.17 92.24 91.33 90.42 Total CHP Efficiency (%) 70.50 70.83 71.17 71.51 71.86 72.21 Power to Thermal Output Ratio 0.905 0.914 0.924 0.933 0.942 0.952 Net Heat Rate (Btu/kWh) 5,477 5,422 5,369 5,315 5,263 5,211
Variable O&M Costs ($/kWh) 0.006 0.0068 0.0077 0.0087 0.0098 0.0111 Fixed O&M Costs ($/kW-year) 18.43 20.85 23.59 26.69 30.20 34.17
(1) LM 2500 + DLE technology at STP. (2) Utilized GE APPS Model for performance results. (5) Assumes new system installed every five years. (6) Heat rate improvement projection (7) Variable and Fixed O&M costs represented in current dollars. Assumed to increase 2.5%/year.
Table 5-37 Industrial O&M - Natural Gas Turbine – 2015 Degraded Equipment
Year 2015 2020 2025 2030 2035 2040
Output Capacity (kW) 25,210 24,860 24,239 24,239 22,722 21,846 Capacity Factor (%) 93 93 93 93 93 93 Hours of Operation (hrs) 8,147 8,147 8,147 8,147 8,147 8,147 Electric Heat Rate, HHV (Btu/kWh) 10,189 10,332 10,597 10,597 11,304 11,757 Electric Efficiency, HHV (%) 33.50 33.03 32.21 32.21 30.19 29.03 Fuel Input (MMBtu/hr) 256.86 256.85 256.86 256.86 256.85 256.84 Thermal Output (MMBtu/hr) 95.04 95.04 95.04 95.04 95.04 95.04 Total CHP Efficiency (%) 70.50 70.03 69.21 69.21 67.20 66.03 Power to Thermal Output Ratio 0.905 0.893 0.870 0.870 0.816 0.785 Net Heat Rate (Btu/kWh) 5,477 5,553 5,696 5,696 6,076 6,319
Variable O&M Costs ($/kWh) 0.006 0.007 0.007 0.008 0.011 0.013 Fixed O&M Costs ($/kW-year) 18.43 21.14 24.54 27.76 33.51 39.43
(1) LM 2500 + DLE technology at STP. (2) Utilized GE APPS Model for performance results. (3) Model Produced Heat Rate (LHV).

INDUSTRIAL
File: EIA | 209089 Leidos, Inc. 5-25
Table 5-38 Industrial Capital Costs - Natural Gas Turbine – Reference New Equipment
Year 2015 2020 2025 2030 2035 2040
Equipment ($/kW) 548 602 638 689 743 802 Installation Labor and Materials ($/kW) 249 266 290 316 345 249 Engineering/Construction Management/Contingency (1)
252 270 294 320 349 252
Total Installed Cost ($/kW) 999 1,103 1,174 1,272 1,379 1,496 (1) Costs presented are in current 2015 dollars (2) Real cost reduction assumed to be 0% due to the mature nature of the technology. (3) Real cost reduction assumed to be 0%/year (4) Real cost reduction assumed to be 0 %/ yr (5) Includes engineering, distributable costs, scaffolding, construction management, and start-up.
5.5.6 Advanced Technologies Projections See the discussion in Section 4.7.6 – same assumptions apply.
Table 5-39 Industrial O&M - Natural Gas Turbine – Advanced New Equipment
Year 2015 2020 2025 2030 2035 2040
Output Capacity (kW) 25,210.0 25,210 25,210 25,210 25,210 25,210 Electric Heat Rate, HHV (Btu/kWh) 10,189 10,189 9,886 9,788 9,691 9,595 Electric Efficiency, HHV (%) 33.5 33.50 34.52 34.87 35.22 35.57 Fuel Input (MMBtu/hr) 256.864 256.86 249.23 246.76 244.32 241.89 Thermal Output (MMBtu/hr) 105.065 95.04 92.22 91.30 90.40 89.50 Total CHP Efficiency (%) 74.40 70.50 71.52 71.87 72.22 72.57 Power to Thermal Output Ratio 0.819 0.905 0.933 0.942 0.952 0.961 Net Heat Rate (Btu/kWh) 4,979 5,477 5,314 5,261 5,209 5,157
Variable O&M Costs ($/kWh) 0.006 0.0068 0.0077 0.0087 0.0098 0.0111 Fixed O&M Costs ($/kW-year) 18.43 20.85 23.59 26.69 30.2 34.17 (1) LM 2500 + DLE technology at STP. (2) Utilized GE APPS Model for performance results. (3) Costs presented are in current 2015 dollars .

Section 5
5-26 Leidos, Inc. File: EIA | 209089
Table 5-40 Industrial Capital Costs - Natural Gas Turbine – Advanced New Equipment(1)
Year 2015 2020 2025 2030 2035 2040
Equipment ($/kW)(2) 548 602 638 689 743 802 Installation Labor and Materials ($/kW)(3) 224 249 266 290 316 345 Engineering/Construction Management/Contingency (4,5) 227 252 270 294 320 349
Total Installed Cost ($/kW) 999 1,103 1,174 1,272 1,379 1,496 (1) Costs presented are in current 2015 dollars (2) Real cost reduction assumed to be 0% due to the mature nature of the technology. (3) Real cost reduction assumed to be 0%/year (4) Real cost reduction assumed to be 0 %/ yr (5) Includes engineering, distributable costs, scaffolding, construction management, and start-up.
5.6 Industrial – Natural Gas Turbine – 40,000 kW (IGT40) 5.6.1 Equipment and Systems There would be one turbine generator at the IGT40 facility utilizing aeroderivative technology commercially available in the marketplace. The turbine generator is to be rated for approximately 40 MW. The IGT40 facility has one natural gas turbine mechanically coupled to an electric generator. The generator is a 60 Hz machine rated at approximately 48.5 MVA with an output voltage of 13.8 kV. The electric generator is connected to a high-voltage bus in the facility switchyard via a dedicated generator circuit breaker, GSU, high-voltage circuit breaker and a disconnect switch. The GSU increases the voltage from the electric generator from 13.8 kV to interconnected transmission system high voltage.
The IGT40 facility is controlled using a DCS. The DCS provides centralized control of the facility by integrating the control systems provided with the GT and associated electric generator, and the control of BOP systems and equipment.
Figure 5.4: Industrial Natural Gas Turbine Configuration

INDUSTRIAL
File: EIA | 209089 Leidos, Inc. 5-27
5.6.2 Technology Specifications The IGT40 facility has one aeroderivative natural gas turbine generator.
The technology specifications for the IGT40 are presented in Table 5-41:
Table 5-41 Industrial – Natural Gas Turbine – 40,000 kW
Year 2015
Output Capacity (kW) 39,986 Electric Heat Rate, HHV (Btu/kWh) 9,305 Electric Efficiency, HHV (%) 36.7 Fuel Input (MMBtu/hr) 372.06 Thermal Output (MMBtu/hr) 121 Total CHP Efficiency (%) 69.20 Power to Thermal Output Ratio 1.128 Net Heat Rate (Btu/kWh) 5,523
Variable O&M Costs ($/kWh) 0.005 Fixed O&M Costs ($/kW-year) 17.88
5.6.3 Capital Cost Estimate The base Cost Estimate for the IGT40 facility with a nominal capacity of 40 MW is $822/kW.
The cost estimate for the IGT40 40,000 kW assumes having a small site located adjacent to the end use. A 15-acre site is assumed to be required to be cleared, leveled and conditioned to accept underground utilities such as water, gas, electric, sewage, and drainage, just as what is found at any large facility. The combustion turbine price was obtained from Gas Turbine World 2013 TW Handbook Volume 30. The equipment cost for the 40,000 kW machine was obtained from pricing of a 42,100 kW and factored for size using the six-tenths estimating rule, plus freight delivery to the site. Peripheral electrical equipment necessary to complement the peaking power plant needs has been added to the estimate. The cost estimate includes site preparation, gas tapping costs, structures, equipment, electrical, distributable cost, engineering and design, and subcontractor fee and budget contingency. All estimated costs are expressed in $/kW. All numbers in the estimate are based on prices and wages for the Gulf Coast Region of the U.S.
Table 5-42 summarizes the Cost Estimate categories for the IGT40.

Section 5
5-28 Leidos, Inc. File: EIA | 209089
Table 5-42 Base Plant Site Capital Cost Estimate for IGT40
Technology: IGT40 Nominal Capacity (ISO): 40,000 kW
Nominal Heat Rate (ISO): 9,305 Btu/kWh – HHV
Capital Cost Category ($/kW)
(January 1, 2015 $)
Equipment Supply 464 Installation – Labor and Materials 177 Engineering, Construction Management, and Contingency (1) 181 Total Project EPC 822 (1) Includes engineering, distributable costs, scaffolding, construction management, and start-up.
5.6.4 O&M Estimate In addition to the general items discussed in the Section 2.4.2 of the Report entitled Operation and Maintenance (O&M) Expenses, O&M cost assumptions include labor, provisions for the completion of scheduled and unscheduled maintenance as well as major maintenance intervals, which are usually conducted approximately every 6 years. For the analysis, a CF of 93 percent was assumed.
Table 5-43 presents the O&M expenses for the IGT40 facility.
Table 5-43 O&M Expenses for IGT40
Technology: IGT40
Fixed O&M Expense $17.88/kW-year Variable O&M Expense $0.005/kWh

INDUSTRIAL
File: EIA | 209089 Leidos, Inc. 5-29
5.6.5 Reference Technologies Projections
Table 5-44 Industrial O&M - Natural Gas Turbine – Reference New Equipment
Year 2015 2020 2025 2030 2035 2040
Output Capacity (kW) 39,986 39,986 39,986 39,986 39,986 39,986 Capacity Factor (%) 93 93 93 93 93 93 Hours of Operation (hrs) 8,147 8,147 8,147 8,147 8,147 8,147 Electric Heat Rate, HHV (Btu/kWh) 9,305 9,213 9,121 9,031 8,942 8,853 Electric Efficiency, HHV (%) 36.68 37.05 37.42 37.79 38.17 38.55 Fuel Input (MMBtu/hr) 372.07 368.39 364.71 361.11 357.55 354.00 Thermal Output (MMBtu/hr) 120.99 119.80 118.60 117.43 116.27 115.12 Total CHP Efficiency (%) 69.20 69.56 69.94 70.31 70.69 71.07 Power to Thermal Output Ratio 1.128 1.139 1.151 1.162 1.174 1.186 Net Heat Rate (Btu/kWh) 5,523 5,468 5,413 5,360 5,307 5,254
Variable O&M Costs ($/kWh) 0.005 0.0057 0.0064 0.0072 0.0082 0.0093 Fixed O&M Costs ($/kW-year) 17.88 20.23 22.89 25.90 29.30 33.15
(1) LM6000 PC Steam Injected at STP. (2) Utilized GE APPS Model for performance results. (3) Assumes new system installed every five years. (4) Heat rate improvement projection assumes 1% every 5 years (5) Variable and Fixed O&M costs represented in current dollars. Assumed to increase 2.5%/year.
Table 5-45 Industrial O&M - Natural Gas Turbine – 2015 Degraded Equipment
Year 2015 2020 2025 2030 2035 2040
Output Capacity (kW) 39,986.0 39,431.0 38,445.0 38,445.0 36,040.0 34,651.0 Capacity Factor (%) 93.0 93.0 93.0 93.0 93.0 93.0 Hours of Operation (hrs) 8,147 8,147 8,147 8,147 8,147 8,147 Electric Heat Rate, HHV (Btu/kWh) 9,305 9,436 9,678 9,678 10,324 10,738 Electric Efficiency, HHV (%) 36.7 36.2 35.3 35.3 33.1 31.8 Fuel Input (MMBtu/hr) 372.062 372.1 372.1 372.1 372.1 372.1 Thermal Output (MMBtu/hr) 120.994 121.0 121.0 121.0 121.0 121.0 Total CHP Efficiency (%) 69.20 68.7 67.8 67.8 65.6 64.3 Power to Thermal Output Ratio 1.128 1.11 1.08 1.08 1.02 0.98 Net Heat Rate (Btu/kWh) 5,523 5,600 5,744 5,744 6,127 6,373
Variable O&M Costs ($/kWh) 0.005 0.006 0.007 0.008 0.009 0.011 Fixed O&M Costs ($/kW-year) 17.88 20.51 23.81 26.93 32.51 38.25 (1) LM6000 PC Steam Injected at STP. (2) Utilized GE APPS Model for performance results. (3) Model Produced Heat Rate (LHV).

Section 5
5-30 Leidos, Inc. File: EIA | 209089
Table 5-46 Industrial Capital Costs - Natural Gas Turbine – Reference New Equipment
Year 2015 2020 2025 2030 2035 2040
Equipment ($/kW) 464 510 540 583 629 679 Installation Labor and Materials ($/kW) 177 196 210 229 250 272 Engineering/Construction Management/Contingency (1) 181 201 215 234 255 278
Total Installed Cost ($/kW) 822 907 965 1,046 1,134 1,230
(1) Includes engineering, distributable costs, scaffolding, construction management, and start-up.
5.6.6 Advanced Technologies Projections See the discussion in Section 4.7.6 – same assumptions apply.
Table 5-47 Industrial O&M - Natural Gas Turbine – Advanced New Equipment
Year 2015 2020 2025 2030 2035 2040
Output Capacity (kW) 39,986 39,986 39,986 39,986 39,986 39,986 Electric Heat Rate, HHV (Btu/kWh) 9,305 9,305 9,029 8,939 8,850 8,763 Electric Efficiency, HHV (%) 36.7 36.68 37.80 38.18 38.56 38.95 Fuel Input (MMBtu/hr) 372.062 372.07 361.02 357.42 353.89 350.40 Thermal Output (MMBtu/hr) 120.994 120.99 117.40 116.23 115.08 113.95 Total CHP Efficiency (%) 69.20 69.20 70.32 70.70 71.08 71.47 Power to Thermal Output Ratio 1.128 1.128 1.162 1.174 1.186 1.198 Net Heat Rate (Btu/kWh) 5,522 5,523 5,359 5,305 5,253 5,201
Variable O&M Costs ($/kWh) 0.005 0.0057 0.0064 0.0072 0.0082 0.0093 Fixed O&M Costs ($/kW-year) 17.88 20.23 22.89 25.90 29.30 33.15 (1) LM6000 PC Steam Injected at STP. (2) Utilized GE APPS Model for performance results. (3) Model Produced Heat Rate (LHV).
Table 5-48 Industrial Capital Costs - Natural Gas Turbine – Advanced New Equipment
Year 2015 2020 2025 2030 2035 2040
Equipment ($/kW) 464 510 540 583 629 679 Installation Labor and Materials ($/kW) 177 196 210 229 250 272 Engineering/Construction Management/Contingency (1) 181 201 215 234 255 278
Total Installed Cost ($/kW) 822 907 965 1,046 1,134 1,230 (1) Costs presented are in current 2015 dollars (2) Real cost reduction assumed to be 0% due to the mature nature of the technology. (3) Real cost reduction assumed to be 0%/year (4) Real cost reduction assumed to be 0 %/ yr

INDUSTRIAL
File: EIA | 209089 Leidos, Inc. 5-31
(5) Includes engineering, distributable costs, scaffolding, construction management, and start-up..
5.7 Industrial – Combined Cycle – 100,000 kW (ICC) 5.7.1 Equipment and Systems The industrial 100-MW combined cycle facility (ICC) is composed of two 40 MW aeroderivative type turbine generator units and one 20-MW steam turbine generator. Figure 5-5 presents the ICC process flow diagram.
Figure 5.5: Industrial Combined Cycle Design Configuration
The ICC facility has two natural gas fired combustion turbines in combined-cycle with a steam turbine generator Each electric generator is connected to a high-voltage bus in the facility switchyard via dedicated generator circuit breakers, GSUs, high-voltage circuit breakers, and one or more disconnect switches. The GSU increases the voltage from the electric generator voltage to the interconnected transmission system high voltage.
The ICC facility is controlled using a DCS. The DCS provides centralized control of the facility by integrating the control systems provided with the turbine and associated electric generator and the control of BOP systems and equipment.

Section 5
5-32 Leidos, Inc. File: EIA | 209089
5.7.2 Technology Specifications There would be two gas turbine generators at the ICC facility utilizing aeroderivative technology commercially available in the marketplace. The turbine generators are to be rated for approximately 48 MW. The ICC facility has two natural gas turbines mechanically coupled to dedicated electric generators along with a nominally rated 20 MW steam turbine generator. For the gas turbines, the packaged generators are 60 Hz machines rated at approximately 68.5 MVA with an output voltage of 13.8 kV. The STG would be mechanically coupled to a dedicated generator with a nominal rating of approximately 22.5 MVA. The electric generators are connected to a high-voltage bus in the facility switchyard via dedicated generator circuit breakers, GSUs, high-voltage circuit breakers, and disconnect switches. The GSUs increase the voltage from the electric generators from 13.8 kV to interconnected transmission system high voltage.
The ICC facility is controlled using a DCS. The DCS provides centralized control of the facility by integrating the control systems provided with the GT and associated electric generator, and the control of BOP systems and equipment.
The technology specifications for the ICC are presented in Table 5-49:
Table 5-49 Industrial – Combine Cycle – 100,000 kW
Year 2015
Output Capacity (kW) 103,128 Electric Heat Rate, HHV (Btu/kWh) 8,353 Electric Efficiency, HHV (%) 40.9 Fuel Input (MMBtu/hr) 861.43 Thermal Output (MMBtu/hr) 65.792 Total CHP Efficiency (%) 48.50 Power to Thermal Output Ratio 5.350 Net Heat Rate (Btu/kWh) 7,556
Variable O&M Costs ($/kWh) 0.0064 Fixed O&M Costs ($/kW-year) 19.88
5.7.3 Capital Cost Estimate The base Cost Estimate for the ICC Facility with a nominal capacity of 100 MW is $1,594/kW.
The cost estimate for the ICC 100,000 kW assumes having a site located within the vicinity of a transmission line and close to the end use. A 40-acre site is assumed to be required to be cleared, leveled and conditioned to accept underground utilities such as water, gas, electric, sewage, and drainage, just as what is found at any large facility. The ICC price was obtained from Gas Turbine World 2013 TW Handbook Volume 30. The equipment cost for the 100,000 kW machine was obtained from pricing of a 111,400 kW and factored for size using the six-tenths estimating rule, plus freight

INDUSTRIAL
File: EIA | 209089 Leidos, Inc. 5-33
delivery to the site. The power arrangement consists of two aeroderivative gas turbines, two heat recovery steam generators, and one steam turbine rated at 20,000 kW. Peripheral electrical equipment necessary to complement the industrial power plant needs has been added to the estimate. The cost estimate includes site preparation, gas tapping costs, structures, equipment, electrical, cooling system, distributable cost, engineering and design and subcontractor fee and budget contingency. All estimated costs are expressed in $/kW. All numbers in these estimates are based on prices and wages for the Gulf Coast region of the U.S.
Table 5-50 summarizes the Cost Estimate categories for the ICC facility. The construction costs of the ICC are impacted by the existing infrastructure that may be leveraged in the development, design, and construction.
Table 5-50 Base Plant Site Capital Cost Estimate for ICC
Technology: ICC Nominal Capacity (ISO): 100,000 kW
Nominal Heat Rate (ISO): 8,353 Btu/kWh-HHV
Capital Cost Category ($/kW)
(January 1, 2015 $)
Equipment Supply 994 Installation – Labor and Materials 320 Engineering, Construction Management, and Contingency (1) 280 Total Project EPC 1,594 (1) Includes engineering, distributable costs, scaffolding, construction management, and start-up.
5.7.4 O&M Estimate Table 5-51 presents the O&M expenses for the ICC facility. O&M cost assumptions include labor, provisions for the completion of scheduled and unscheduled maintenance as well as major maintenance intervals. In addition, provisions have been estimated for maintenance required on the BOP and auxiliary systems. For the analysis, a CF of 93 percent was assumed.
Table 5-51 O&M Expenses for ICC
Technology: ICC
Fixed O&M Expense $19.88/kW-year Variable O&M Expense $0.0064/kWh

Section 5
5-34 Leidos, Inc. File: EIA | 209089
5.7.5 Reference Technologies Projections
Table 5-52 Industrial O&M - Combined Cycle – Reference New Equipment
Year 2015 2020 2025 2030 2035 2040
Output Capacity (kW) 103,128 103,128 103,128 103,128 103,128 103,128 Capacity Factor (%) 93 93 93 93 93 93 Hours of Operation (hrs) 8,147 8,147 8,147 8,147 8,147 8,147 Electric Heat Rate, HHV (Btu/kWh) 8,353 8,270 8,188 8,107 8,027 7,947 Electric Efficiency, HHV (%) 40.86 41.27 41.68 42.10 42.52 42.95 Fuel Input (MMBtu/hr) 861.43 852.87 844.41 836.06 827.81 819.56 Thermal Output (MMBtu/hr) 65.79 65.14 64.49 63.85 63.22 62.59 Total CHP Efficiency (%) 48.50 48.91 49.32 49.74 50.16 50.58 Power to Thermal Output Ratio 5.350 5.404 5.458 5.512 5.567 5.623 Net Heat Rate (Btu/kWh) 7,556 7,480 7,406 7,333 7,261 7,188
Variable O&M Costs ($/kWh) 0.006 0.0072 0.0082 0.0093 0.0105 0.0119 Fixed O&M Costs ($/kW-year) 19.88 22.49 25.45 28.79 32.58 36.86
(1) LM6000 PC Steam Injected at STP. (2) Utilized GE APPS Model for performance results. (3) Model Produced Heat Rate (LHV).
Table 5-53 Industrial O&M - Combined Cycle – 2015 Degraded Equipment
Year 2015 2020 2025 2030 2035 2040
Output Capacity (kW) 103,128 101,696 99,154 99,154 92,950 89,368 Capacity Factor (%) 93 93 93 93 93 93 Hours of Operation (hrs) 8,147 8,147 8,147 8,147 8,147 8,147 Electric Heat Rate, HHV (Btu/kWh) 8,353 8,470 8,688 8,688 9,267 9,639 Electric Efficiency, HHV (%) 40.9 40.30 39.28 39.28 36.83 35.41 Fuel Input (MMBtu/hr) 861.4 861.37 861.45 861.45 861.37 861.42 Thermal Output (MMBtu/hr) 66.00 66.00 66.00 66.00 66.00 66.00 Total CHP Efficiency (%) 48.5 47.96 46.95 46.95 44.49 43.07 Power to Thermal Output Ratio 5.33 5.259 5.127 5.127 4.807 4.621 Net Heat Rate (Btu/kWh) 7,555 7,659 7,856 7,856 8,379 8,716
Variable O&M Costs ($/kWh)(4) 0.0064 0.0073 0.0085 0.0096 0.0116 0.0137 Fixed O&M Costs ($/kW-year)(5) 19.88 22.81 26.47 29.95 36.14 42.53
(1) LM6000 PC Steam Injected at STP. (2) Utilized GE APPS Model for performance results. (3) Model Produced Heat Rate (LHV). (4) VOM adjusted for output capacity post-2015 (5) FOM adjusted for output capacitypost-2015

INDUSTRIAL
File: EIA | 209089 Leidos, Inc. 5-35
Table 5-54 Industrial Capital Costs - Combined Cycle – Reference New Equipment(1)
Year 2015 2020 2025 2030 2035 2040
Equipment ($/kW) 994 1,092 1,157 1,249 1,348 1,455 Installation Labor and Materials ($/kW) 320 352 373 402 434 468 Engineering/Construction Management/Contingency(2)
280 308 326 352 380 410
Total Installed Cost ($/kW) 1,594 1,752 1,856 2,003 2,161 2,332 (1) Costs presented in current dollars. Costs adjusted for output capacity increase post-2015. (2) Includes engineering, distributable costs, scaffolding, construction management, and start-up.
5.7.6 Advanced Technologies Projections Several studies regard NGCC (without carbon capture and storage) as a mature technology without significant cost savings forecast for units in future years.22 However, advances continue to be made in the turbine design. The advanced combined cycle units use G- or H-class turbines to achieve combined cycle efficiencies exceeding 60%. In 2011 Siemens reported that their SGT-8000H turbines would reduce the investment costs per kW. Therefore, any costs cited in 2015 should likely reflect the advanced combined cycle units rather than those consisting solely of F-class turbines (the predominant class in the late 1980s). One 2014 article cites that advances in the combined cycle technologies over the remainder of the decade will include:
• Additive manufacturing (aka 3D printing) • Aerodynamic 3D blading • Use of ceramics • Higher firing temperatures • Better sealing • Improved heat transfer
These advances may lead to a 63% combined cycle efficiency by the end of the decade using air cooling, and beyond that, according to one GE expert, air cooling systems may be able to yield 65% combined cycle efficiencies. The advantage to air-cooled systems is the relatively short start up times compared with steam-cooled systems.
The utility sizes (300-500 MW) now being released commercially have efficiencies above 60%. Three sets of numbers were identified that considered how advanced NGCCs might reduce unit costs in future years: four model runs from Azevedo23 et al. 22 See Original EPRI data in Azevedo, I. P. Jaramillo, E. Rubin, and S. Yeh. Modeling Technology Learning for Electricity Supply Technologies. Phase II Report to Electric Power Research Institute. June 2013. Last accessed from: http://www.cmu.edu/epp/iecm/rubin/PDF%20files/2013/FINAL% 20PHASE%20II%20REPORT%20TO%20EPRI_June%2030.pdf on April 22, 2015. 23 Azevedo, I., P. Jaramillo, E. Rubin, and S. Yeh, 2013. Modeling Technology Learning for Electricity Supply Technologies Phase II Report: Implied Learning Rates from REGEN Scenarios and Comparisons with Literature Values. Report to Electric Power Research Institute. June 2013. Last accessed from: http://www.cmu.edu/epp/iecm/rubin/PDF%20files/2013/FINAL%20PHASE%20II%20 REPORT%20TO%20 EPRI_June %2030.pdf on April 27, 2015.

Section 5
5-36 Leidos, Inc. File: EIA | 209089
2013, expert opinion from Varley24 2014, and the Mini Climate Assessment Model25 (2008). Those costs were normalized to the 2015 year and plotted in Figure 5-1. The variation within Azevedo’s work illustrates how climate change policies and uncertainties in natural gas prices can affect deployment of NGCCs and thus the learning rates and associated relative costs.
Figure 5-1. Projections of Cost Reductions for NGCCs from Three Studies
Siemens and General Electric pushed the advanced NGCCs to the market more rapidly than had been predicted five years ago, and this early adoption explains why the 2008 Mini Climate Assessment Model was the only study that did not predict cost reductions before 2020.
The average multipliers for the six cases (four from Azevedo et al. 2013) are also shown in Figure 5-1. These multipliers were used to derive the capital costs shown in Figure 5-2, relative to the 2015 capital costs in the Reference Technology Case. The figure also uses the MiniCAM estimates for reductions in O&M costs, relative to the 2015 costs from the Reference Technology Case. Costs are presented in constant 2015 dollars.
Figure 5-2. Costs for New Equipment- ICC – Advanced Technology Case Costs/Year 2015 2020 2025 2030 2035 2040
Variable O&M Costs ($/kWh) 0.0064 0.0064 0.0062 0.0060 0.0059 0.0057 Fixed O&M Costs ($/kW-year) 19.88 19.88 19.38 18.69 18.29 17.59 Total Equipment Cost ($/kW) 994 1,563 1,532 1,511 1,495 1,473
24 Varley, J. 2014. “GE’s new all-air-cooled H class turbine.” Modern Power Systems. 10 April 2014. Last accessed from http://www.modernpowersystems.com/features/featureges-new-all-air-cooled-h-class-turbine-4212530/ on April 27, 2015. 25 Mini Climate Assessment Model (2008). Data from MiniCAM model, Pacific Northwest National Laboratory.

INDUSTRIAL
File: EIA | 209089 Leidos, Inc. 5-37
Table 5-55 Industrial - Combined Cycle – Advanced New Equipment
Year 2015 2020 2025 2030 2035 2040
Output Capacity (kW) 103,128 103,128 103,128 103,128 103,128 103,128 Electric Heat Rate, HHV (Btu/kWh) 8,353 7,584 6,826 6,205 5,688 5,688 Electric Efficiency, HHV (%) 40.86 45 50 55 60 60 Fuel Input (MMBtu/hr) 861.43 782.17 703.95 639.91 586.59 586.59 Thermal Output (MMBtu/hr) 65.79 59.74 53.76 48.87 44.80 44.80 Total CHP Efficiency (%) 48.50 52.64 57.64 62.64 67.64 67.64 Power to Thermal Output Ratio 5.35 5.892 6.547 7.202 7.856 7.856 Net Heat Rate (Btu/kWh) 7556 6,860 6,174 5,613 5,145 5,145 Variable O&M Costs ($/kWh) 0.0064 0.0071 0.0074 0.0078 0.0083 0.0087 Fixed O&M Costs ($/kW-year) 19.88 22.07 23.02 24.19 25.81 27.06
(1) LM6000 PC Steam Injected at STP. (2) Utilized GE APPS Model for performance results. (3) Costs represented as current dollars.
Table 5-56 Industrial - Combined Cycle Capital Costs – Advanced New Equipment(1)
Year 2015 2020 2025 2030 2035 2040
Equipment ($/kW)(1) 994 1081 1133 1222 1318 1407 Installation Labor and Materials ($/kW)(2) 320 352 373 402 434 468 Engineering/Construction Management/Contingency (3)
280 308 326 352 380 410
Total Installed Cost ($/kW) 1,594 1741 1832 1976 2132 2284 (1) Costs represented as current dollars (2) Equipment cost of reference case adjusted based on Figures 5-1 and 5-2. (3) Assumes no change in values from reference values. (4) Includes engineering, distributable costs, scaffolding, construction management, and start-up.
Assumes no change in values from reference values


File: EIA | 209089
Appendix A ACRONYMS
AC Alternating Current BOP Balance-of-Plant Btu British Thermal Unit Btu/kWh British Thermal Unit per kilowatt-hour Btu/lb British Thermal Unit per pound Btu/scf British Thermal Unit per standard cubic feet C2H6 Ethane C3H8 Propane C4H10 n-Butane CC Combined Cycle CdTe Cadmium Telluride CF Capacity Factor CFC Commercial Fuel Cell CH4 Methane CHP Combined Heat and Power CIGS Copper Indium Gallium Diselenide CLS Commercial Large Solar Photovoltaic System CNE Commercial – Natural Gas Engine CNM Commercial – Natural Gas Micro-turbine CNT Commercial – Natural Gas Turbine CO Carbon Monoxide CO2 Carbon Dioxide COE Commercial – Oil Reciprocating Engine Cost Estimate Base Capital Cost Estimate CSS Commercial – Small Solar Photovoltaic System CT Combustion Turbine CTG Combustion Turbine and Generator CWS Commercial – Wind System CxHy General Hydrocarbon ° Degree °C Degrees Celsius °F Degrees Fahrenheit DC Direct Current DCS Distributed Control System DG Distributed Generation EIA U.S. Energy Information Administration EPA Environmental Protection Agency EPC Engineering, Procurement and Construction FOM Fixed O&M GSU Generator Step-up Transformer HHV High(er) Heating Value

Appendix A
A-2 Leidos, Inc. File: EIA | 209089
HRSG Heat Recovery Steam Generator Hz Hertz ICC Industrial – Combined Cycle IGT5 Industrial – Natural Gas Turbine IGT10 Industrial – Natural Gas Turbine – 10,000 kW IGT25 Industrial – Natural Gas Turbine – 25,000 kW IGT40 Industrial – Natural Gas Turbine – 40,000 kW IRE1 Industrial – Reciprocating Engine-1 IRE3 Industrial – Reciprocating Engine-3 ISO International Standard Organization kg Kilograms KJ Kilojoules kJ/kg Kilojoules per kilogram kV Kilovolt kW Kilowatt kWh Kilowatt-hour lb Pound Leidos Leidos Engineering, LLC LHV Low(er) Heating Value MCFC Molten Carbonate Fuel Cells MJ Megajoules MJ/scm Megajoules per standard cubic meter MMBtu Million Btu MMRF Major Maintenance Reserve Fund MVA Mega-volt-amperes MW Megawatt MWh Megawatt-hour N2 Nitrogen NEMS National Energy Modeling System NGCC Natural Gas Combined Cycle NH3 Ammonia NOX Nitrogen Oxides O&M Operation and Maintenance PAFC Phosphoric Acid Fuel Cell PEM Proton Exchange Membrane psig Pounds per Square Inch Gauge PV Photovoltaic Report This Report RFC Residential Fuel Cell System RPM Revolutions per Minute RSS Residential Small Solar Photovoltaic RWS Residential Wind System scf Standard Cubic Feet scm Standard Cubic Meters SCR Selective Catalytic Reduction SOFC Solid Oxide Fuel Cell

ACRONYMS
File: EIA | 209089 Leidos, Inc. A-3
ST Steam Turbine STG Steam Turbine and Generator U.S. United States VOM Variable Operating and Maintenance


File: EIA | 209089
Appendix B References
Distributed Generation System Characteristics and Costs in the Buildings Sector, U.S. Energy Information Administration, August 7, 2013, http://www.eia.gov/analysis/studies/distribgen/system/
Combined Heat and Power Database, ICF International, July 25, 2013, http://www.eea-inc.com/chpdata/
2012 Wind Technologies Market Report, Energy Efficiency & Renewable Energy, U.S. Department of Energy, August 2013, https://www1.eere.energy.gov/wind/pdfs/2012_wind_technologies_market_report.pdf
2012 Market Report on Wind Technologies in Distributed Applications, Energy Efficiency & Renewable Energy, U.S. Department of Energy, August 2013, http://www1.eere.energy.gov/wind/pdfs/2012_distributed_wind_technologies_market_report.pdf
Fact Sheet: 2013 Distributed Wind Market Report, Energy Efficiency & Renewable Energy, U.S. Department of Energy, August 2013, http://energy.gov/eere/wind/downloads/fact-sheet-2013-distributed-wind-market-report
Annual Energy Outlook 2014 with projections to 2040, U.S. Energy Information Administration, DOE/EIA-0383(2014), April 2014 http://www.eia.gov/forecasts/aeo/pdf/0383(2014).pdf
Fuel Cell Basics, ©2008 Smithsonian Institution, http://americanhistory.si.edu/fuelcells/basics.htm
State of the States: Fuel Cells in America 2013, Fuel Cells 2000/U.S. Department of Energy, Energy Efficiency and Renewable Energy, October 2013 http://energy.gov/eere/fuelcells/downloads/state-states-fuel-cells-america-2013
http://energy.gov/sites/prod/files/2014/03/f12/state_of_the_states_2013.pdf
Small Wind Electric Systems, An Indiana Consumers Guide, U.S. Department of Energy, Energy Efficiency and Renewable Energy, http://apps2.eere.energy.gov/wind/windexchange/pdfs/small_wind/small_wind_in.pdf
High Efficiency Microturbine with Integral Heat Recovery, U.S. Department of Energy, Energy Efficiency and Renewable Energy, Industrial Technologies Program http://www1.eere.energy.gov/manufacturing/distributedenergy/pdfs/capstone.pdf
2013IRP_CHP-Memo-LCOEexcel_10-04-12.pdf

Appendix C
C-2 Leidos, Inc. File: EIA | 209089
SGIP_CE_Report_Final.pdf Industrial Distributed Energy, U.S. Department of Energy, Energy Efficiency &
Renewable Energy, http://www1.eere.energy.gov/manufacturing/distributedenergy/
2.4 Microturbine/Combined Heat and Power (CHP) Technologies, Environmental
Technology Verification (ETV) Program, Environmental Protection Agency http://www.epa.gov/chp/documents/microturbine_tech.pdf
Microturbines, by Barney L. Capehart, PhD, CEM, College of Engineering, University
of Florida, National Institute of Building Sciences, Whole Building Design Guide (WBDG), August 31, 2010 http://www.wbdg.org/resources/microturbines.php
http://www.epa.gov/ttnchie1/ap42/ch03/final/c03s02.pdf
GE’s Jenbacher Gas Engines, Clarke Energy, http://www.clarke-energy.com/gas-engines/
Solar Energy Industries Association First Quarter Study, Solar Energy Industries Association.
Appendix C

File: EIA | 209089
Appendix D Technology Definitions and Calculations
Key Terms Used in Calculating CHP Efficiency – EPA Guidelines26 Calculating a CHP system’s efficiency requires an understanding of several key terms, described below.
CHP system. The CHP system includes the unit in which fuel is consumed (e.g. turbine, boiler, engine), the electric generator, and the heat recovery unit that transforms otherwise wasted heat to useable thermal energy.
• Total fuel energy input (QFUEL). The thermal energy associated with the total fuel input. Total fuel input is the sum of all the fuel used by the CHP system. The total fuel energy input is often determined by multiplying the quantity of fuel consumed by the heating value of the fuel.
• Net useful power output (WE). Net useful power output is the gross power produced by the electric generator minus any parasitic electric losses―in other words, the electrical power used to support the CHP system. (An example of a parasitic electric loss is the electricity that may be used to compress the natural gas before the gas can be fired in a turbine.)
• Net useful thermal output (ΣQTH). Net useful thermal output is equal to the gross useful thermal output of the CHP system minus the thermal input. An example of thermal input is the energy of the condensate return and makeup water fed to a heat recovery steam generator (HRSG). Net useful thermal output represents the otherwise wasted thermal energy that was recovered by the CHP system.
Calculating Total System Efficiency The most commonly used approach to determining a CHP system’s efficiency is to calculate total system efficiency. Also known as thermal efficiency, the total system efficiency (ηo) of a CHP system is the sum of the net useful power output (WE) and net useful thermal outputs (Σ QTH) divided by the total fuel input (QFUEL), as shown below:
ηO = WE + Σ QTH
QFUEL The calculation of total system efficiency is a simple and useful method that evaluates what is produced (i.e., power and thermal output) compared to what is consumed (i.e., fuel). CHP systems with a relatively high net useful thermal output typically correspond to total system efficiencies in the range of 60 to 85 percent.
Note that this metric does not differentiate between the value of the power output and the thermal output; instead, it treats power output and thermal output as additive 26 U.S. EPA, Catalog of CHP Technologies – Appendix A: Expressing CHP Efficiency, March 2015.

Appendix D
D-2 Leidos, Inc. File: EIA | 209089
properties with the same relative value. In reality and in practice, thermal output and power output are not interchangeable because they cannot be converted easily from one to another. However, typical CHP applications have coincident power and thermal demands that must be met. It is reasonable, therefore, to consider the values of power and thermal output from a CHP system to be equal in many situations.
Calculating Effective Electric Efficiency Effective electric efficiency calculations allow for a direct comparison of CHP to conventional power generation system performance (e.g., electricity produced from central stations, which is how the majority of electricity is produced in the United
States). Effective electric efficiency (εEE) can be calculated using the equation below, where (WE) is the net useful power output, (ΣQTH) is the sum of the net useful thermal outputs, (QFUEL) is the total fuel input, and a equals the efficiency of the conventional technology that otherwise would be used to produce the useful thermal energy output if the CHP system did not exist:
εEE = WE QFUEL – Σ (QTH / α)
For example, if a CHP system is natural gas fired and produces steam, then α represents the efficiency of a conventional natural gas-fired boiler. Typical α values for boilers are: 0.8 for natural gas-fired boiler (used in this report), 0.75 for a biomass-fired boiler, and 0.83 for a coal-fired boiler.
The calculation of effective electric efficiency is essentially the CHP net electric output divided by the additional fuel the CHP system consumes over and above what would have been used by conventional systems to produce the thermal output for the site. In other words, this metric measures how effectively the CHP system generates power once the thermal demand of a site has been met.
Typical effective electrical efficiencies for combustion turbine-based CHP systems are in the range of 51 to 69 percent. Typical effective electrical efficiencies for reciprocating engine-based CHP systems are in the range of 69 to 84 percent.
Many CHP systems are designed to meet a host site’s unique power and thermal demand characteristics. As a result, a truly accurate measure of a CHP system’s efficiency may require additional information and broader examination beyond what is described in this report.
Reciprocating Engine Calculation Basis Electric Heat Rate, HHV (Btu/kWh) = 3413 / efficiency of conversion of fuel energy input to net electrical generation output. There are 3,413 Btu per kWh; this is the conversion factor used.
Thermal Output (MMBtu/hr) = useful thermal output generated by the engine recovered as heat energy from engine jacket water and exhaust gas generating hot water at 120 °C.

File: EIA | 209089 Leidos, Inc. D-3
Total CHP Efficiency (%) = (Thermal Output + Thermal equivalent of Electrical Output) / Fuel Input. Thermal equivalent of Electrical Output = Output Capacity (kW) * 3413 Btu/kWh.
Power to Thermal Output Ratio = Electric Efficiency / Thermal Efficiency. Thermal Efficiency = Total CHP Efficiency – Electric Efficiency.
Net Heat Rate = (total fuel energy input – fuel that would normally be used to generate the equivalent thermal output as the CHP system thermal output) / CHP electric output. In this analysis, displaced boilers are assumed to be 80 percent efficient.
Natural Gas Turbine Calculation Basis Electric Heat Rate = Fuel Input/Electric Capacity
Fuel Input = Calculated based on heat rate and net power output
Thermal Output = useful thermal output generated by the engine recovered as heat energy from engine jacket water and exhaust gas generating hot water at 120 °C.
Total CHP Efficiency (%) = (Thermal Output + Thermal equivalent of Electrical Output) / Fuel Input. Thermal equivalent of Electrical Output = Output Capacity (kW) * 3413 Btu/kWh.
Power to Thermal Output Ratio = Electric Efficiency / Thermal Efficiency. Thermal Efficiency = Total CHP Efficiency – Electric Efficiency.
Net Heat Rate = (total fuel energy input – fuel that would normally be used to generate the equivalent thermal output as the CHP system thermal output) / CHP electric output. In this analysis, displaced boilers are assumed to be 80 percent efficient.