distributed model of hydrological and sediment transport ... · mass balance equations and...
TRANSCRIPT

HESSD12, 6755–6797, 2015
Distributed model ofhydrological and
sediment transport inlarge river basins.
S. Zuliziana et al.
Title Page
Abstract Introduction
Conclusions References
Tables Figures
J I
J I
Back Close
Full Screen / Esc
Printer-friendly Version
Interactive Discussion
Discussion
Paper
|D
iscussionP
aper|
Discussion
Paper
|D
iscussionP
aper|
Hydrol. Earth Syst. Sci. Discuss., 12, 6755–6797, 2015www.hydrol-earth-syst-sci-discuss.net/12/6755/2015/doi:10.5194/hessd-12-6755-2015© Author(s) 2015. CC Attribution 3.0 License.
This discussion paper is/has been under review for the journal Hydrology and Earth SystemSciences (HESS). Please refer to the corresponding final paper in HESS if available.
Distributed model of hydrological andsediment transport processes in largeriver basins in Southeast AsiaS. Zuliziana1,2, K. Tanuma1, C. Yoshimura1, and O. C. Saavedra1
1Department of Civil Engineering, Tokyo Institute of Technology, 2-12-1-M1-4 Ookayama,Meguro-ku, Tokyo 152-8552, Japan2Department of Civil Engineering, Faculty of Engineering, National Defense University ofMalaysia, Sungai Besi Camp, 57000 Kuala Lumpur, Malaysia
Received: 21 April 2015 – Accepted: 29 May 2015 – Published: 16 July 2015
Correspondence to: S. Zuliziana ([email protected])
Published by Copernicus Publications on behalf of the European Geosciences Union.
6755

HESSD12, 6755–6797, 2015
Distributed model ofhydrological and
sediment transport inlarge river basins.
S. Zuliziana et al.
Title Page
Abstract Introduction
Conclusions References
Tables Figures
J I
J I
Back Close
Full Screen / Esc
Printer-friendly Version
Interactive Discussion
Discussion
Paper
|D
iscussionP
aper|
Discussion
Paper
|D
iscussionP
aper|
Abstract
Soil erosion and sediment transport have been modeled at several spatial and temporalscales, yet few models have been reported for large river basins (e.g., drainageareas > 100 000 km2). In this study, we propose a process-based distributed model forassessment of sediment transport at a large basin scale. A distributed hydrological5
model was coupled with a process-based distributed sediment transport modeldescribing soil erosion and sedimentary processes at hillslope units and channels. Themodel was tested on two large river basins: the Chao Phraya River Basin (drainagearea: 160 000 km2) and the Mekong River Basin (795 000 km2). The simulation over10 years showed good agreement with the observed suspended sediment load in10
both basins. The average Nash–Sutcliffe efficiency (NSE) and average correlationcoefficient (r) between the simulated and observed suspended sediment loads were0.62 and 0.61, respectively, in the Chao Phraya River Basin except the lowland section.In the Mekong River Basin, the overall average NSE and r were 0.60 and 0.78,respectively. Sensitivity analysis indicated that suspended sediment load is sensitive15
to detachability by raindrop (k) in the Chao Phraya River Basin and to soil detachabilityover land (Kf) in the Mekong River Basin. Overall, the results suggest that the presentmodel can be used to understand and simulate erosion and sediment transport in largeriver basins.
1 Introduction20
Effective management of sediment in rivers is becoming increasingly important froman economic, environmental, and ecological perspective. A recent study of 145 majorrivers with longer-term records of annual sediment loads showed that approximately50 % of them experienced a statistically significant upward or downward seasonaltrend (Walling and Fang, 2003). The majority of them showed declining sediment25
loads because of dams and other river control structures trapping sediment. Moreover,
6756
HESSD12, 6755–6797, 2015
Distributed model ofhydrological and
sediment transport inlarge river basins.
S. Zuliziana et al.
Title Page
Abstract Introduction
Conclusions References
Tables Figures
J I
J I
Back Close
Full Screen / Esc
Printer-friendly Version
Interactive Discussion
Discussion
Paper
|D
iscussionP
aper|
Discussion
Paper
|D
iscussionP
aper|
human activities such as deforestation and water diversion might cause sedimentationor erosion in coastal regions. Such sediment-related problems could be more seriousin the future because of further dam construction, climate variability, and deforestation(Walling, 2011; Zarfl et al., 2014). Currently, river basins in Southeast Asia haveserious soil erosion potential and excessive sedimentation. They are also experiencing5
dramatic land surface changes, such as forest clearing, reservoir construction, andhydropower construction and water diversion (Tacio, 1993), because of rapid populationand economic growth in the region (Walling, 2009).
A wide range of models exists for simulating erosion and sediment transport. Thesemodels differ in terms of complexity, processes considered, and the data required for10
model calibration and model use (Roberto et al., 2012). In general, there is no “best”model for all applications. The most appropriate model will depend on intended use,spatial scale, and characteristics of the catchment being considered. The Universal SoilLoss Equation (USLE) (Wischmeier and Smith, 1978) and its revised version (RUSLE)(Renard and Freimund, 1994) are widely used as tools for empirical assessment of soil15
erosion. Both USLE and RUSLE account for sediment eroded from the catchment inthe long term (e.g., for 20 years). In these empirical equations, however, the depositionof sediment is not considered to occur in the modeled area.
A number of process-based soil erosion and sediment transport models have alsobeen developed, but those applications are limited to individual storm events and small20
(max. 2.6 km2) catchments (Duna et al., 2009). The Soil and Water Assessment Tool(SWAT) was designed for application to large river basins and long-term simulations(Arnold et al., 1998) and has been implemented in river basins of over 4000 km2 (Santhiet al., 2001). It is a semi-distributed conceptual model, capable of daily simulation usinghydrologic response units as the basic computational unit to group input information25
about combinations of land use and soil land management (Neitsch et al., 2002).However, semi-distributed models like SWAT do not generally incorporated with a fineresolution of spatial information, such as land use and soil information which aredominant factors affecting on soil erosion. Thus, effective river basin management
6757
HESSD12, 6755–6797, 2015
Distributed model ofhydrological and
sediment transport inlarge river basins.
S. Zuliziana et al.
Title Page
Abstract Introduction
Conclusions References
Tables Figures
J I
J I
Back Close
Full Screen / Esc
Printer-friendly Version
Interactive Discussion
Discussion
Paper
|D
iscussionP
aper|
Discussion
Paper
|D
iscussionP
aper|
requires the development of process-based models to estimate the effects of the soilerosion rate, sediment transport, and deposition at specific locations and especially inlarge river basins.
Process-based models are based on the solutions of fundamental physical equationsdescribing stream flow and sediment production in a river basin. They represent the5
physical processes observed in the real world, such as surface runoff, subsurfaceflow, ground flow, and evapotranspiration. Process-based models provide several majoradvantages over empirical and conceptual model, including capabilities for estimatingspatial and temporal distributions of net soil loss (or gain, in the case of deposition)for an entire hillslope or for each point on a hillslope. Further, process-based models10
can estimate sediment simulation on a daily, monthly, or an average annual basis.Since these models are process-based, they can also be seasonally interpolated andextrapolated to some extent to a broad range of conditions, including some conditionsthat might be difficult to measure with field testing. Given the complexity of therelationships affecting sediment dynamics, it is important to develop a robust process-15
based model of sediment dynamics that can be used to predict the consequencesof natural systems as well as human-induced environmental changes and impacts,especially in large catchments.
This study aimed to develop a process-based distributed model that can simulatethe sediment dynamic process at a large basin scale. The feasibility of the model20
was confirmed in large catchments (i.e., > 100 000 km2) of Southeast Asia. Thesediment model continuously simulates the sedimentary process, including erosionand sediment transport. Hydrologic data, soil type, land use, and topography wereused as input data. Soil loss and its transport process were coupled with an existingdistributed hydrological model to create a comprehensive sediment assessment tool25
for large catchments in Southeast Asia. The sediment model separately simulateddeposition and detachment in rivers, which have not been considered in most existingmodels. This paper also describes applications of the sediment model in two large river
6758

HESSD12, 6755–6797, 2015
Distributed model ofhydrological and
sediment transport inlarge river basins.
S. Zuliziana et al.
Title Page
Abstract Introduction
Conclusions References
Tables Figures
J I
J I
Back Close
Full Screen / Esc
Printer-friendly Version
Interactive Discussion
Discussion
Paper
|D
iscussionP
aper|
Discussion
Paper
|D
iscussionP
aper|
basins in Southeast Asia: the Chao Phraya and Mekong River basins. The two basinsare characterized by different soil properties and hydrogeology.
2 Model structure
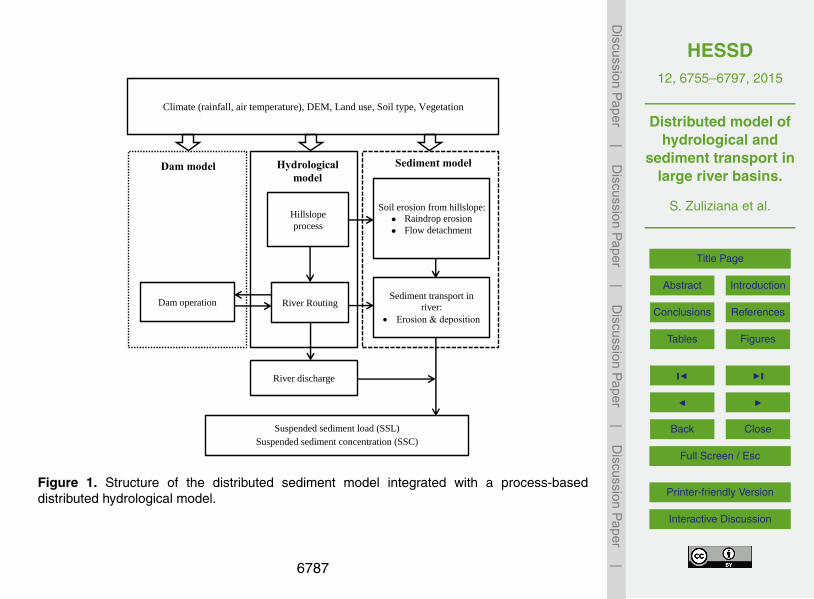
The important processes of sediment dynamics (soil erosion, sediment transport, anddeposition) were modeled and integrated with a process-based distributed hydrological5
model (DHM) (Fig. 1). In the sediment model, sediment dynamics on hillslopes andrivers were separately modeled and systematically linked each other. The sedimentmodel was developed using FORTRAN to create a compatible link to the adopteddistributed hydrological model. The runoff and river routing were incorporated withinthe sediment model. Hydrological and sediment-related processes were calculated10
on a daily time-step. The overall model was designed to target suspended sedimentload (SSL), because suspended sediment (SS) is dominant portion of the transportedsediment in many of the world’s rivers (Ongley, 1996), and it is frequently assumed thatthe suspended load makes up about 90 % of the total load in the world (Milliman andMeade, 1983).15
2.1 Hydrological model
The distributed hydrological model used in this study is a geomorphology-basedhydrological model (GBHM) developed by Yang et al. (2001). It solves the continuity,momentum, and energy equations using two modules: hillslope module and riverrouting module.20
In the GBHM, the target watershed is divided into grids, and a digital elevation model(DEM) is used to determine the flow direction and accumulation pattern that createsthe river network. Each subbasin is divided into a number of flow intervals. In thesubbasins, flow intervals are defined as a function of distance from the subbasin’soutlet. Lateral flow to the main stream estimated by accumulating runoff at each grid25
6759

HESSD12, 6755–6797, 2015
Distributed model ofhydrological and
sediment transport inlarge river basins.
S. Zuliziana et al.
Title Page
Abstract Introduction
Conclusions References
Tables Figures
J I
J I
Back Close
Full Screen / Esc
Printer-friendly Version
Interactive Discussion
Discussion
Paper
|D
iscussionP
aper|
Discussion
Paper
|D
iscussionP
aper|
in one hillslope unit. This means that all hillslopes of a flow interval drain into themain stream in this model. The flow interval–hillslope system enabled the GBHM torealize a fast flow computation even in a large basin. The hillslope unit is viewed asa rectangular inclined plane with a defined length and unit width. The inclination anglegivens by the corresponding surface slope.5
In the hillslope model, each grid is divided into four layers: canopy, soil surface,unsaturated zone, and groundwater. Vegetation covered the surface soil and preventeddirect rainfall onto the land. The deficit of canopy interception is calculated byvegetation coverage and leaf area index. The evapotranspiration module simulated thewater volume that evaporated from the surface soil and transpirated from the canopy,10
where pan observation could also be used. In the module, Priestley–Taylor’s methodwas applied for the canopy water storage, root zone, surface storage, and soil surface.In order to describe the unsaturated zone water flow, a vertical one-dimensionalRichards equation is used with soil infiltration rate and soil moisture contents in theroot zone. Saturated water flow and exchange with the river is described using basic15
mass balance equations and Darcy’s Law. The simulation module of surface water flowestimated the infiltration excess and saturation excess discharging into the river systemas lateral flow.
In the river routing system, the Pfafstetter numbering system is applied to track waterflow efficiently from upper to downstream. The water routing on the river network is20
determined along the river stream using one-dimensional kinematic wave equations.Further details are described by Yang et al. (2001).
2.2 Sediment model
2.2.1 Soil detachment
Soil detachment by raindrop impacts was estimated by Eq. (1) (Torri et al., 1987).25
DR = (1−Cg)kEe−zh, (1)
6760

HESSD12, 6755–6797, 2015
Distributed model ofhydrological and
sediment transport inlarge river basins.
S. Zuliziana et al.
Title Page
Abstract Introduction
Conclusions References
Tables Figures
J I
J I
Back Close
Full Screen / Esc
Printer-friendly Version
Interactive Discussion
Discussion
Paper
|D
iscussionP
aper|
Discussion
Paper
|D
iscussionP
aper|
where DR is soil detachment rate by raindrop impact (gm−2 h−1) estimated for eachtime step, k is an index of the detachability of the soil (gJ−1), E is the total kineticenergy of the rainfall (Jm−2 h−1), e−zh is the correction factor for water ponding wherez depends on soil texture (0.9–3.1), and h is the depth of the surface water layer (mm).Cg is the proportion of soil surface in each grid. Raindrop impacts were categorized5
into direct rainfall and leaf drip, allowing the total kinetic energy (E ) of raindrop to bedescribed by Eq. (2).
E = (1−CC)EDHDT +CCELHLD, (2)
where CC is canopy cover in the model (i.e., in each grid) and was estimated from landuse data on a scale of 0.0 to 1.0 (0 for bare land and 1.0 for highly dense forest area).10
ED is the kinetic energy of direct throughfall drops (Jm−2 mm−1), and HDT is depth ofdirect throughfall drops, for which rain intensity (mmh−1) was used in the model. EL isthe kinetic energy of leaf drip (Jm−2 mm−1), and HLD is the depth of leaf drip (net rain(mmh−1)), which was estimated by deducting the interception loss of water from thedepth of rain intensity (HDT).15
The kinetic energy for direct rainfall ED can be described by Eq. (3) (Brandt, 1989)where I is rain intensity (mmh−1).
ED = 8.95+8.44log(I) (3)
EL is the kinetic energy due to leaf drip, also as proposed by Brandt (1990) and shownin Eq. (4). PH is the effective height of the plant canopy in meters. This study assumed20
that PH is 1 m following Kabir et al. (2011).
EL =(
15.8(PH)0.5)−5.87 (4)
For soil detachment due to overland flow, we used equations derived by Habib-ur-Rehman and Akhtar (2004) and shown as Eqs. (5) and (6). These were used to
6761

HESSD12, 6755–6797, 2015
Distributed model ofhydrological and
sediment transport inlarge river basins.
S. Zuliziana et al.
Title Page
Abstract Introduction
Conclusions References
Tables Figures
J I
J I
Back Close
Full Screen / Esc
Printer-friendly Version
Interactive Discussion
Discussion
Paper
|D
iscussionP
aper|
Discussion
Paper
|D
iscussionP
aper|
compute soil detachment based on comparison of critical shear stress and hydraulicshear stress.
DF = Kf
(ττc−1)
for τ > τc, (5)
DF = 0 for τ < τc, (6)
where DF is an overland flow detachment (kgm−2 s−1), Kf is an overland flow5
detachability coefficient (kgm−2 s−1), τc is critical shear stress for initiation of soilparticle motion as obtained from the Shield’s curve (Nm−2) and τ is hydraulic shearstress (Nm−2) as given in Eq. (7).
τ = γhS, (7)
where γ is a specific weight of water (Nm−3) and h is depth of overland flow (m). In10
this study, the depth of overland flow is assumed to be the corresponding surface waterdepth. S is the slope of the ground surface. In Eq. (5), Kf is subjected to calibration andthe critical shear stress values are obtained by the following equation.
τC = Nsheilds (γs −γ)Ds, (8)
where Nsheilds is the value of the dimensionless shield parameter obtained from the15
Shield’s curve, γs is the specific weight of sediment particles (Nm−3), γ is a specificweight of water (Nm−3) and Ds is sediment particle size (µm).
2.2.2 Transport and deposition of sediment
Soil detachments by flow and sediment deposition in rivers are generally considered tooccur simultaneously. Flow detachment or deposition can be expressed by Eq. (9), as20
described by Morgan et al. (1998).
DFriver = βswvs(TC−Cs), (9)6762

HESSD12, 6755–6797, 2015
Distributed model ofhydrological and
sediment transport inlarge river basins.
S. Zuliziana et al.
Title Page
Abstract Introduction
Conclusions References
Tables Figures
J I
J I
Back Close
Full Screen / Esc
Printer-friendly Version
Interactive Discussion
Discussion
Paper
|D
iscussionP
aper|
Discussion
Paper
|D
iscussionP
aper|
where DFriver is the flow detachment or deposition of sediment (m3 s−1 m−1) forsediment concentration Cs (m3 m−3), TC is the transport capacity (m3 m−3), w is thewidth of the river flow (m) in each subbasin as estimated from the input parameter ofthe hydrological model and vs is particle settling velocity (m−1) calculated with Stokes’sLaw. βs is a correction factor used to calculate cohesive soil erosion as shown in5
Eq. (10) (Kabir et al., 2011).
βs = 0.79e−0.85J , (10)
where J is the soil cohesion (kPa). Several methods have been developed to estimateTC. This study adopted Eq. (11), proposed by Govers (1990), because of its simplestructure and available input parameter database. Equation (11) was only used to10
estimate SSL, not including bed loads.
TC = c(ω−ωcr)η, (11)
whereω is the unit stream power (cm−1),ω = 10V s, V is mean flow velocity (cm−1), s isthe slope in percentage, and ωcr is the critical value of unit stream power (0.40 cms−1).In this study, 2.67 gcm−3 of soil density was used for the conversion unit in both case15
studies. c and η are coefficients that depend on the median particle size of the soil (d50in µm).
c = [(d50 +5)/0.32]−0.6 (12)
η = [(d50 +5)/300]0.25 (13)
The movement of sediment in each grid cell was determined by associating the20
movement with water discharge, based on the principle of conservation of massand momentum similar to the flow simulation in the distributed hydrological model.The one-dimensional kinematic wave and finite difference approximation were appliedto simulate sediment transport both over land and in the river. On the land grids,
6763
HESSD12, 6755–6797, 2015
Distributed model ofhydrological and
sediment transport inlarge river basins.
S. Zuliziana et al.
Title Page
Abstract Introduction
Conclusions References
Tables Figures
J I
J I
Back Close
Full Screen / Esc
Printer-friendly Version
Interactive Discussion
Discussion
Paper
|D
iscussionP
aper|
Discussion
Paper
|D
iscussionP
aper|
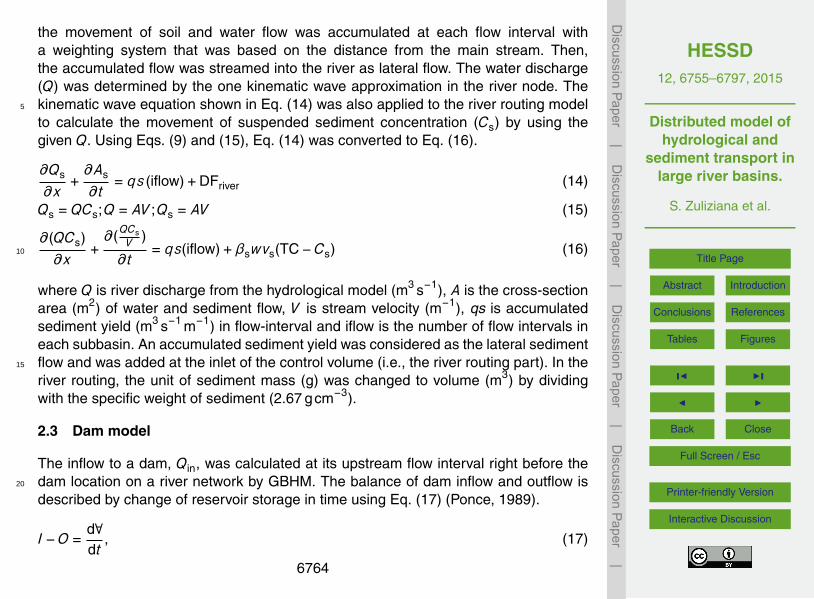
the movement of soil and water flow was accumulated at each flow interval witha weighting system that was based on the distance from the main stream. Then,the accumulated flow was streamed into the river as lateral flow. The water discharge(Q) was determined by the one kinematic wave approximation in the river node. Thekinematic wave equation shown in Eq. (14) was also applied to the river routing model5
to calculate the movement of suspended sediment concentration (Cs) by using thegiven Q. Using Eqs. (9) and (15), Eq. (14) was converted to Eq. (16).
∂Qs
∂x+∂As
∂t= qs (iflow)+DFriver (14)
Qs =QCs;Q = AV ;Qs = AV (15)
∂(QCs)
∂x+∂(QCs
V )
∂t= qs(iflow)+βswvs(TC−Cs) (16)10
where Q is river discharge from the hydrological model (m3 s−1), A is the cross-sectionarea (m2) of water and sediment flow, V is stream velocity (m−1), qs is accumulatedsediment yield (m3 s−1 m−1) in flow-interval and iflow is the number of flow intervals ineach subbasin. An accumulated sediment yield was considered as the lateral sedimentflow and was added at the inlet of the control volume (i.e., the river routing part). In the15
river routing, the unit of sediment mass (g) was changed to volume (m3) by dividingwith the specific weight of sediment (2.67 gcm−3).
2.3 Dam model
The inflow to a dam, Qin, was calculated at its upstream flow interval right before thedam location on a river network by GBHM. The balance of dam inflow and outflow is20
described by change of reservoir storage in time using Eq. (17) (Ponce, 1989).
I −O =d∀dt
, (17)
6764

HESSD12, 6755–6797, 2015
Distributed model ofhydrological and
sediment transport inlarge river basins.
S. Zuliziana et al.
Title Page
Abstract Introduction
Conclusions References
Tables Figures
J I
J I
Back Close
Full Screen / Esc
Printer-friendly Version
Interactive Discussion
Discussion
Paper
|D
iscussionP
aper|
Discussion
Paper
|D
iscussionP
aper|
where I is inflow, O is an outflow, d∀ is change in storage volume within a time interval(dt). Then, the reservoir storage at the current time step ∀2 was obtained per Valerianoet al. (2010),
∀2 = ∀1 +
[(Q1
in +Q2in
2
)−Q2
out
]∆t, (18)
where the subscript 1 refers to the last time step, and the subscript 2 refers to the5
current time step. Q2out is discharge from the dam and is assumed to be constant
between time steps 1 and 2. Both inflows Q1in and Q2
in are discharge flow into thedam and are provided by the simulation using GBHM. The value for the last time stepvolume ∀1 needs to be set as the initial volume condition to read the h–∀ curve data.Then, using the h–∀ curve, the water level can be calculated. In normal conditions, the10
release can be calculated using a dam operational rule. Once the release is defined,the flow can be routed downstream by GBHM.
In the following case studies, the dam operation rule was applied, and releasewas assumed to be equal to observed release from the Bhumibol and Sirikit damsin the Chao Phraya River Basin. In contrast, in the Mekong River Basin, the mean15
annual discharge from the Lancang subbasin (2332.29 m3 s−1) (Kummu et al., 2010)was used as dam release at Manwan Dam, assuming that hydropower stationstabilizes its downstream river discharge. In the Chao Phraya River Basin, the reservoirsedimentation was estimated by Brune’s curve (Brune, 1953). No estimation ofreservoir sedimentation in the Mekong River Basin was made, due to limited availability20
of dam observation data.
6765

HESSD12, 6755–6797, 2015
Distributed model ofhydrological and
sediment transport inlarge river basins.
S. Zuliziana et al.
Title Page
Abstract Introduction
Conclusions References
Tables Figures
J I
J I
Back Close
Full Screen / Esc
Printer-friendly Version
Interactive Discussion
Discussion
Paper
|D
iscussionP
aper|
Discussion
Paper
|D
iscussionP
aper|
3 Model application
3.1 Chao Phraya River Basin
The Chao Phraya River Basin covers about one third of Thailand, which isapproximately 160 000 km2 from head to mouth. In this study, the target basin coveredfrom sources to the Chao Phraya Dam (C13) (the gray area in Fig. 2), which has5
a catchment area of 117 375 km2. The basin is traditionally the center of Thailand’srice production, because the monsoon weather typically brings more rainfall from Mayto October. Land cover in the Chao Phraya River Basin consists of forest (30.2 %,including evergreen, deciduous and mangrove forests), croplands (56.4 %), paddyfields (7.1 %), bodies of water (0.6 %), and areas for which no data is available (5.7 %)10
(UNEP, 1997). The soil in the Chao Phraya River Basin is predominantly sand clay loamand contains 38.2 % sand, 25.2 % silt, and 36.7 % clay on average (Kyuma, 1976). TheChao Phraya River has four major tributaries: the Ping River (36 018 km2), the WangRiver (11 708 km2), the Yom River (24 720 km2), and the Nan River (34 557 km2). Theyconverge at Nakhon Sawan. In the northern mountainous region, there are valleys15
covered by forest and bare soil. These valleys stretch south to north, which is the areaof the headwaters of the Chao Phraya River Basin.
The climate in Thailand is strongly affected by the Southeast Asian monsoon andcharacterized by distinct rainy and dry seasons. Basically, the rainy season starts atthe middle or end of May and lasts until the middle of October. Annual precipitation in20
the Chao Phraya River Basin varies between 1000 and 1500 mm (Thai MeteorologicalDepartment, 2012).
3.1.1 Model set-up and calibration
Geographical information for the Chao Phraya River Basin (e.g., topography, soil type,and land use) was collected for the development of a hydrological model. A DEM was25
obtained from the Shuttle Radar Topography Mission (URL: http://dds.cr.usgs.gov/srtm/
6766
HESSD12, 6755–6797, 2015
Distributed model ofhydrological and
sediment transport inlarge river basins.
S. Zuliziana et al.
Title Page
Abstract Introduction
Conclusions References
Tables Figures
J I
J I
Back Close
Full Screen / Esc
Printer-friendly Version
Interactive Discussion
Discussion
Paper
|D
iscussionP
aper|
Discussion
Paper
|D
iscussionP
aper|
version2_1/SRTM3/). The model has 90 m spatial resolution. In the study area, theresolution was aggregated to 1 km for simulation. Soil type classification relied on theDigital Soil Map of the World (version 3.6) from the Food and Agriculture Organizationof the United Nations (FAO/UN). The dominant soil is clay and sand in the upper regionand sandy silt in the lower region. Land use data (2001) were obtained from the Land5
Development Department of Thailand (http://www.ldd.go.th/). The land use categoriesare paddy field, farm land, forest, grassland, bare land, urban area, and water body.Daily precipitation data were collected from two kinds of rain gauge network systems.The first is open-source rain gauge network data provided by the Hydrology and WaterManagement Center for the upper northern region of the Royal Irrigation Department10
(RID). The other is managed by the Thai Meteorological Department (TMD). Bothdata sources have daily temporal resolution. Daily dam operational data such as waterlevel, storage, inflow, and outflow (release) for the Sirikit Dam and Bhumibol Dam weregathered from RID and the Electricity Generating Authority of Thailand (E-GAT).
River discharge and SSL were calibrated and validated in combination with dam15
operation for the period from 2001 to 2010 at four stream gauges in the upper region(P73-Ping River, W3A-Wang River, Y37-Yom River, and N13A-Nan River) and onestream gauge in the outlet (C2-Chao Phraya River) (Fig. 2). Taking into account theavailability of data, the monthly river discharge and SSL data for 2001 were used forthe calibration model at all five stream gauges, whereas the observation data from20
2002–2010 were used for validation. For the parameter calibration, a semi-automaticcalibration method was used. It was the Shuffled Complex Evolution (SCE) algorithm(Duan et al., 1992). It was implemented in 2001 to identify suitable parameters. Thedominant factors affecting the hydrological process and soil erosion, such as land useand soil characteristics, were considered for parameter calibration, as listed in Table 1.25
As for parameters related to sediment transport and soil erosion, the FAO global soildataset was used to consider spatial distribution of soil properties. The parameters ofsediment detachability from rain drop (k) and from sheet flow (Kf) in the basin werecalibrated respectively based on the observed SSL at Khong Chiam. Soil cohesion
6767
HESSD12, 6755–6797, 2015
Distributed model ofhydrological and
sediment transport inlarge river basins.
S. Zuliziana et al.
Title Page
Abstract Introduction
Conclusions References
Tables Figures
J I
J I
Back Close
Full Screen / Esc
Printer-friendly Version
Interactive Discussion
Discussion
Paper
|D
iscussionP
aper|
Discussion
Paper
|D
iscussionP
aper|
(J) was determined in each subbasin. In the sediment model, the sediment particlesize (d50) was assumed to be 50 µm based on the suspended sediment distributionin a river near Chiang Mai (unpublished data). To demonstrate the applicability of theproposed model, the model was calibrated and validated with two efficiency criteria:the Nash–Sutcliffe efficiency coefficient (NSE) and correlation coefficients (r) for 2001–5
2010. Lastly, the eleven soil types in the Chao Phraya Basin were reclassified into threetypes: clay, sand, and silt.
3.1.2 Results and discussion of model performance
The monthly calibration for the hydrological and sediment process was implementedwith SCE in Chao Phraya in 2001 (Table 1). The parameters for sediment (k, J) were10
calibrated to be larger than the reported values (Morgan et al., 1998), but they arewithin the reasonable range for the Chao Phraya River Basin (Bhattarai and Dutta,2005).
Model evaluation revealed that the river discharge simulation performedsatisfactorily, as shown by NSE and r in Table 2 (refer to Fig. A1 for hydrographs). The15
values of NSE and r at P73 were closer to 1 than in other drainage basins and werethe lowest at C2 among the gauges. The reason for the lowest NSE occurring at thedownstream gauge is related to the flooding situation in the Chao Phraya River Basin.Normally, the river discharge overflows every year during rainy season in the lowerregion because the discharge capacity around C2 is low. Therefore, the overestimated20
discharge is likely to overflow to land in real situations. Moreover, the average slope is1.3 % in the lower basin, whereas it is 3.1 % in the upper mountainous region wheresurface water can inflow smoothly to the river channel. Thus, the condition lengthensretardation time and river discharge gets stuck in the lower regions. In addition, waterwithdrawal for irrigation canals, which was not modeled in this study, also has an effect25
on the lowest hydrological simulation in the lower region.Regarding SSL, NSE for all stream gauges was larger than 0.5 except at C2
(Table 2). The simulation results captured the high peak of SSL during rainy season,6768

HESSD12, 6755–6797, 2015
Distributed model ofhydrological and
sediment transport inlarge river basins.
S. Zuliziana et al.
Title Page
Abstract Introduction
Conclusions References
Tables Figures
J I
J I
Back Close
Full Screen / Esc
Printer-friendly Version
Interactive Discussion
Discussion
Paper
|D
iscussionP
aper|
Discussion
Paper
|D
iscussionP
aper|
as shown in Fig. 3. Overall, the performance of the model in the Chao Phraya RiverBasin indicated sufficient accuracy for long-term simulation (Table 2). The results fromC2, located at the lowest reach, were not as good as in other stream gauges. At C2,the results indicate underestimation, even though the total simulated river dischargeat the lower reach was overestimated and supposedly resulted in higher simulated5
SSL in the lower reach than in the upper reach. However, it appears the simulationerror may have been larger at the lower reach because of accumulating uncertainty.The average total annual SSL was estimated to be 1.28×10⁶ t yr−1 showing a ten-yearincrease from 5.72×10⁶ to 8.10×10⁶ t yr−1. This estimate was slightly lower than thereported estimate of the average total annual SSL in the Chao Phraya River Basin10
(11×106 t yr−1), as reported by FAO/AGL (2005). The different locations of the controlpoints could be a reason for these different estimates of SSL.
It is inferred that the process of soil loss was strongly influenced by rainfall intensity.This was clearly shown by the simulated SSL at the Nan River (Fig. 3), where rainfallis higher (1341.8 mm) than at other tributaries. In contrast, the simulated SSL was15
lowest at the Wang River due to that area having the lowest annual average rainfall(1181.3 mm). Walling (2009) reported that the annual SSL in Chao Phraya declinedfrom around 28×106 t yr−1 in the 1960s and early 1970s to around 6×10⁶ t yr−1 in the1990s. In this study, the average annual SSL was estimated to be 1.28×10⁶ t yr−1
over 10 years based on simulation in the 2000s. In fact, the observed SSL shows20
a decreasing trend with a decline in annual runoff, primarily reflecting the trappingof sediment by a large number of small dams and irrigation structures and also bythe larger Bhumibol and Sirikit dams (Walling, 2009). But for the 10 years targeted inthis study, the observed SSL at C2 shows no decreasing trend. Nevertheless, climatechange, population growth, land clearance, land use change, reservoir construction,25
and other infrastructure development can be expected to cause some changes in theSSL over the longer-time scale of 50 years in large river basins like the Mekong RiverBasin (Walling, 2011).
6769

HESSD12, 6755–6797, 2015
Distributed model ofhydrological and
sediment transport inlarge river basins.
S. Zuliziana et al.
Title Page
Abstract Introduction
Conclusions References
Tables Figures
J I
J I
Back Close
Full Screen / Esc
Printer-friendly Version
Interactive Discussion
Discussion
Paper
|D
iscussionP
aper|
Discussion
Paper
|D
iscussionP
aper|
The simulated SSC also shows good correlations with observed data at all upperstream gauges, indicated by r larger than 0.5 except at the watershed outlet, C2(Table 2). Possible errors in simulated SSC at the outlet could be related to riverdischarge simulation. The overall average relative mean square error (RMSE) betweensimulated and observed SSC ranged from 0.07 to 0.09 kgm−3 in the upper basins (P73,5
W3A, Y37, and N13A) and 0.09 kgm−3 in the outlet, C2. Basically, we confirmed twopeaks every year in both observed and simulated SSC in four stream gauges: P73,W3A, Y37, and N13A (Fig. 4). The first peak occurred in May, which is the beginningof the rainy season. Beginning in June, the concentration fell while river dischargeincreased from the upper stream, due to the starting rainy season. The second peak10
occurred in the main monsoon periods (August, September, and October), which haveheavy rainfall that increases the volume of river discharge.
3.1.3 Sensitivity of SSL to sediment-related parameters
The sensitivity of modeled SSL was also investigated for the reasonable ranges ofthe input parameters. The target parameters for this sensitivity analysis were soil15
detachability from rain drop (k), soil detachability from sheet flow (Kf), and soil cohesion(J). The target period for this analysis was one year 2005 at P73.
First, results were obtained by changing the detachability of soil (k) from 7.0 (forclay and silt) and 9.1 (for sand) (gJ−1) by +50, −50, and −75 % from those calibratedvalues. The theoretical range of this soil detachability index is 0.01–10 gJ−1, where20
the minimum is for clay, and the maximum is for sand (Gumiere et al., 2009; Morganet al., 1998; Morgan, 2001). The peak of SSL increased as the detachability increased(Fig. 5a). The calibrated parameter k for dominant clay soil (7.0 gJ−1) was larger thanone for the dominant sandy soil in the Chao Phraya River Basin (3.5 gJ−1, Bhattaraiand Dutta, 2005) and one for a wide range of soil texture that are commonly used for25
agriculture in Europe (2.0 gJ−1, Morgan et al., 1998). Basically, the soil detachability isassociated with soil texture, showing a higher detachability with a lower clay content.Thus, soils having a high clay content are difficult to detach by raindrops (Sharma
6770
HESSD12, 6755–6797, 2015
Distributed model ofhydrological and
sediment transport inlarge river basins.
S. Zuliziana et al.
Title Page
Abstract Introduction
Conclusions References
Tables Figures
J I
J I
Back Close
Full Screen / Esc
Printer-friendly Version
Interactive Discussion
Discussion
Paper
|D
iscussionP
aper|
Discussion
Paper
|D
iscussionP
aper|
et al., 1994). In the Chao Phraya River Basin, detachability (k) was relatively high,indicating high soil detachment and resulting in high SSL transport into the river. Thepresented results reveal the importance of raindrop detachment for different type ofsoils, especially for clay soil in the Chao Phraya River Basin.
Second, we focused on Kf, which indicates soil detachability from sheet flow (Eq. 5).5
The initial values of Kf (0.6 (clay), 1.0 (silt), and 1.1 mgm−2 s−1 (sand)) were shiftedby the factors 100, 10, 0.1, and 0.01 (Fig. 5b) in each type of soil; clay, silt and sand.The results show that the simulated suspended sediment peaks (August to October)increased slightly as Kf increased, although the changes were small and invisiblein Fig. 5b. Thus, SSL is less sensitive to Kf than k, which is possibly because the10
precipitation is the main agent for sediment yield.Third, soil cohesion (J) was shifted by +25, −25 and −50 % from the calibrated
value (3.0 kPa). Each model output was confirmed to understand the degree of net soildetachment in streams influenced by transport capacity. The peak of SSL in Septemberincreased as J increased (Fig. 5c). In this case, the lateral inflow of sediment was the15
same as the initial results with 3.0 kPa. Equations (10) and (11) infer that soil erosionincreases SSC as higher J under saturated SSC condition (i.e., TC< Cs) contributesto less deposition. Generally, J needs to be adjusted considerably to properly predictthe measured net soil loss, since J is related to erodibility and limits detachment withinriver sediment. The simulated SSL from the LISEM model consistently increased with20
measured SSL and with increasing J (range from 2 to 7 kPa) (Nearing et al., 2005).Sensitivity analysis was conducted for three parameters to evaluate the reliability
of the model for simulating sediment dynamics. Overall, the two input parameters (kand J) that describe soil erodibility showed the significant influence on SSL in the ChaoPhraya River Basin. The range of input parameters used in this model could be a useful25
reference for sediment-related research in the Chao Phraya River Basin.
6771

HESSD12, 6755–6797, 2015
Distributed model ofhydrological and
sediment transport inlarge river basins.
S. Zuliziana et al.
Title Page
Abstract Introduction
Conclusions References
Tables Figures
J I
J I
Back Close
Full Screen / Esc
Printer-friendly Version
Interactive Discussion
Discussion
Paper
|D
iscussionP
aper|
Discussion
Paper
|D
iscussionP
aper|
3.2 Mekong River Basin
The second study area was the Mekong River Basin, covering an area of approximately795 000 km2. The Mekong is the largest trans-boundary river in Asia (Fig. 6). Itoriginates in Tibet and flows down to Southern Vietnam, a distance of more than4600 km. The minimum and maximum annual rainfalls in the basin are 1000 mmyr−1
5
(northeast of Thailand) and 4000 mmyr−1 (west of Vietnam), respectively (Kite, 2001).The wet season lasts from May to October. During the wet season, average rainfallreaches around 80–90 % of the annual total. The dry season starts in November andlasts until April. In this study, the area of the modeled basin is 786 335 km2, not includingthe delta in southern Vietnam.10
In this basin, acrisols were found to be the dominant soil type. These are tropicalsoils that have a high clay accumulation in a horizon and are extremely weatheredand leached. Their characteristics include low fertility and ease of erosion if they areused for arable cultivation. The average textures of soils in the Mekong River Basinare 27.1 % sand, 30.4 % silt, and 42.5 % clay (Kyuma, 1976). The forest coverage in15
the Mekong River Basin is 30.5 %. The agricultural land coverage is 40.7 %. The restof the areas are shrubland (17.2 %), urban (2.1 %), and water bodies (8.7 %) (MRC,2000). This study examined the model outputs (river discharge, SSL, and SSC) at threehydrologic stations; 1-Chiang Sean, 2-Khong Chiam, and 3-Phnom Penh (Fig. 6).
3.2.1 Model set-up and calibration20
The input data for the model include weather data, topography data, soil properties andland cover. In this study, the GTOPO30 global DEM data with a horizontal grid spacingof ∼ 20 km2 (grid area: 2min×2min) resolution was used to delineate the MekongRiver Basin. The land cover and soil type for the basin were obtained from GlobalLand Cover 2000 (http://edc2.usgs.gov/glcc/eadoc2_0.php) and the FAO soil map of25
the world (FAO, 2003), respectively. The elevation data was first converted to 3.6km×3.6km resolution, and land cover and soil data were aggregated by reclassifying the
6772

HESSD12, 6755–6797, 2015
Distributed model ofhydrological and
sediment transport inlarge river basins.
S. Zuliziana et al.
Title Page
Abstract Introduction
Conclusions References
Tables Figures
J I
J I
Back Close
Full Screen / Esc
Printer-friendly Version
Interactive Discussion
Discussion
Paper
|D
iscussionP
aper|
Discussion
Paper
|D
iscussionP
aper|
land use data for nine classes and the soil data for eight classes. Daily precipitation andair temperature data from 65 station weather stations were obtained from the MekongRiver Commission (MRC).
Annual records of river discharge and SSC in the study were extracted from thehistorical record published by the MRC (Mekong River Commission, 2005). The5
historical record tabulated measurements of river discharge, SSC, water quality, andother physical characteristics at gauging stations located along the Mekong River Basinand those of the river’s tributaries. In this study, river discharge and SSC recordsfrom the three targeted stations were identified and used to calibrate and validateSSL simulation. The stations were selected based on their relative locations and the10
completeness of river discharge and sediment records at the station. Unlike riverdischarge, which was measured daily, SSC was monitored monthly. SSC samples werecollected near the surface of the river (0.3 m depth) in the middle of the main stream(MRC, 2000). In this study, monthly observed SSL was computed from the monthlymeasured SSC and the corresponding measured daily river discharge.15
The river discharge and SSL were simulated by considering an existing dam inthe Chinese section of the main stream (Manwan Dam). The model simulated riverdischarge, SSL, and SSC for 10 years from 1991 to 2000, and three stream gaugesalong the main stream were adopted for calibration and validation (Fig. 6). The dailyriver discharge and sediment data for the period from 1991 to 1995 were used for20
calibration, whereas the data from 1996 to 2000 were used for validation. For thesediment particle size (d50), 50 µm were adopted in this study area because allthe sediment is commonly < 62 µm in diameter (i.e., silt and clay), and sedimentsless than 2 µm make up 45 % of the section near Vientiane (Ahlgren and Hessel,1996). The five parameters shown in Table 1 were initialized with empirical values25
and then calibrated according to the observed river discharge and SSL at the threegauges. All the parameters were calibrated by SCE (Duan et al., 1992). Observation atChiang Sean was used for calibration of parameters that reflect only the upper basin,whereas observation at Khong Chiam was used for calibration for the middle basin and
6773

HESSD12, 6755–6797, 2015
Distributed model ofhydrological and
sediment transport inlarge river basins.
S. Zuliziana et al.
Title Page
Abstract Introduction
Conclusions References
Tables Figures
J I
J I
Back Close
Full Screen / Esc
Printer-friendly Version
Interactive Discussion
Discussion
Paper
|D
iscussionP
aper|
Discussion
Paper
|D
iscussionP
aper|
observation at Phnom Penh was used for the lower basin. The fit between simulatedand observed results (river discharge and SSL) was evaluated using the NSE (Nashand Sutcliffe, 1970) and correlation coefficients (r) at monthly intervals from 1991 to2000.
3.2.2 Results and discussion of model performance5
The river discharge of the Mekong was well simulated at all three stations (Table 3)(refer to Fig. B1 for hydrographs). The NSE values for river discharge at Chiang Sean,Khong Chiam and Phnom Penh were larger than 0.7 for calibration and validation from1991 to 2000. The average correlation r between observation and simulation dischargewas equally high (r > 0.8). These indicators imply the GBHM satisfactorily describes10
the seasonal cycle and spatial distribution of the hydrology processes in the MekongRiver Basin, although the simulated discharge showed slightly higher peaks.
For the sediment model, we calibrated the same parameters as in the Chao PhrayaRiver basin. In the Mekong River, wider ranges were determined for k and Kf, whereasthe range of J narrowed slightly due to different physical characteristic such as15
topography (e.g., rill, interill, and gully) and structure of soil (e.g., erodibility and typeof soil content). For example, the range of k for the Mekong (7.0–100.0 kgJ−1) is widerthan that for the Chao Phraya (7.0–9.1 kgJ−1) (Table 1). This is probably because of thesoil structure and content. The Chao Phraya River Basin is mostly covered with sandysoil, which can be easily detached. In contrast, the Mekong River Basin is dominantly20
covered by clay soil. This may be why SSL is not sensitive to k, and k is not importantfor sediment yield in the Mekong River Basin.
Figure 7 shows the simulated results of monthly SSL compared with measurementsat three gauging stations from 1991 to 2000. The simulated results are in goodagreement with observations, as summarized in Table 3. NSE was larger than 0.625
for the upper, middle, and lower stations in the calibration (1991–1995) and validation(1996–2000) periods, except in the case of the validation period for the upper station(Chiang Sean) (NSE= 0.51). The model simulation underestimated at the upper
6774

HESSD12, 6755–6797, 2015
Distributed model ofhydrological and
sediment transport inlarge river basins.
S. Zuliziana et al.
Title Page
Abstract Introduction
Conclusions References
Tables Figures
J I
J I
Back Close
Full Screen / Esc
Printer-friendly Version
Interactive Discussion
Discussion
Paper
|D
iscussionP
aper|
Discussion
Paper
|D
iscussionP
aper|
(Chiang Sean) station (Fig. 7), and this error may have been caused by the effectof the Manwan Dam on the main stream in the upper basin of the Mekong RiverBasin (Lu and Siew, 2006). Nevertheless, the linear correlation coefficient (r) betweensimulated and observed SSL was in the range of 0.80–0.86 for all three stations.Generally, the SSL was fairly well simulated at the three stations (Fig. 7). The simulated5
results describe the seasonal pattern of SSL in the Mekong River Basin, and higherSSL is expected during the rainy season, as described also by Walling (2008). Themodel results reveal that, for the entire period of 1991–2000, the average annual SSLvalues were the highest (8.9×10⁷ t yr−1) at the middle region, whereas the upper andlower regions showed average annual SSL values of 3.4×10⁷ and 5.6×10⁷ t yr−1,10
respectively. Walling (2009) reported that the annual SSL is high in the middle regionbefore increasing further downstream. Our simulated results also showed higher SSLin the middle region (i.e., Khong Chiam station) than in other regions. This is probablydue to the large tributary drainage area. The annual SSL at Lower Mekong (afterthe Chinese boundary, including the middle region) tends to increase as basin area15
increases.The simulated total annual SSL at Phnom Penh fluctuated over the period 1991–
2000 (average = 6.86×10⁷ t yr−1). This study shows a 57 % lower SSL than thereported average annual SSL (16.0×10⁷ t yr−1) (FAO/AGL, 2005). Lu and Siew (2006)reported the average annual SSL for the period 1962–2003 in the Mekong River20
Basin was about 14.5×10⁷ t yr−1 based on rating curve estimation. The differencein SSL between those reports and our estimate here is probably due to the differentlocations of the control stations. In FAO/AGL (2005), SSL was estimated for the wholeMekong River Basin area, including the Mekong delta. This study covered only thearea to Phnom Penh. In addition, different methods for SSL estimation could explain25
the variances.The monthly SSC simulation at the stream gauging stations for the period 1991–2000
is shown in Fig. 8. The correlation coefficient r was larger than 0.5 between monthlyobserved and simulated SSC at the three gauging stations (Table 3). The overall
6775

HESSD12, 6755–6797, 2015
Distributed model ofhydrological and
sediment transport inlarge river basins.
S. Zuliziana et al.
Title Page
Abstract Introduction
Conclusions References
Tables Figures
J I
J I
Back Close
Full Screen / Esc
Printer-friendly Version
Interactive Discussion
Discussion
Paper
|D
iscussionP
aper|
Discussion
Paper
|D
iscussionP
aper|
average RMSE between the observed and simulated SSC was 0.31 at Chiang Sean,0.25 at Khong Chiam and 0.14 kgm−3 at Phnom Penh. The results reveal a decreasingtrend in the SSC along the three regions from upstream to the downstream (Fig. 8).The average monthly SSC was the highest at Chiang Sean station (estimated tobe 0.33 kgm−3). The average SSC was lowest at Phnom Penh (estimated to be5
0.13 kgm−3). The low value at Phnom Penh was due to the sediment deposition inthe lower region. This trend was due to the decrease in the main stream water velocity,which promotes sediment deposition and decreases SSC. In fact, a decreasing trendin mean monthly SSC was observed along the entire length of the Mekong River sincewater quality measurement began in 1985 (Lu and Siew, 2006). The model results also10
show that the SSC was higher in the rainy season (July, August, and September) thanthe dry season at all three stations (Fig. 8). This is due to the intensive soil erosionmainly caused by heavy precipitation in the rainy season. The high simulated SSC inJuly at the upper station showed a good agreement with the observed SSC, whichrecorded the highest concentrations occurring early in rainy season, in mid-July. After15
mid-August, the observed SSC began to decline, continuing to decline through earlySeptember. This trend matches the simulated SSC trend, which showed a decline inAugust and September.
3.2.3 Sensitivity of SSL to sediment-related parameters
A sensitivity analysis was applied for SSL in the Mekong River Basin in the same20
manner as in the Chao Phraya River Basin. First, all the parameters were set tocalibrated values, which were k = 7 gJ−1, Kf = 1 mgm−2 s−1, and J = 3 kPa. The samefactor was used in the Mekong River Basin and Chao Phraya River Basin in order tocompare the sensitivity of the parameters for SSL in the both basins. The SSL wassimulated at Khong Chiam station for all the parameters in 1999.25
The results revealed that SSL increases slightly in September when k decreases by50 % from the initial (Fig. 9a). In addition, the peak SSL kept increasing and showedsmaller changes with further decreases (at a factor of 25 %) from the initial value. Thus,
6776

HESSD12, 6755–6797, 2015
Distributed model ofhydrological and
sediment transport inlarge river basins.
S. Zuliziana et al.
Title Page
Abstract Introduction
Conclusions References
Tables Figures
J I
J I
Back Close
Full Screen / Esc
Printer-friendly Version
Interactive Discussion
Discussion
Paper
|D
iscussionP
aper|
Discussion
Paper
|D
iscussionP
aper|
in the Mekong River Basin, SSL is less sensitive to k than in the Chao Phraya RiverBasin. The subtle response of SSL for different k implies that soil strength and claycontent are not important, although studies of soil strength for the different group soilsof sands, loams, and clays (Sharma, 1999) show that k decreases as soil strengthincreases. Such results from a sensitivity analysis suggest that soil detachment by5
raindrop contributes little to SSL generation in the Mekong River Basin.Regarding Kf, the peaks in SSL in 1999 decreased by 40 % with the multiplying
a factor of 100 % (Fig. 9b) due to the increase of soil detachability from sheet flow. Thesimulated SSL also drastically decreased with decreasing Kf (with factors 0.1 and 0.01).The simulated SSL reveals the opposite trends from that reported by Bhattarai and10
Dutta (2005), who found the simulated SSL peaks from August to October increasedwith increasing Kf values (0.4 to 0.6 mgm−2 s−1). This result implys that soil detachedfrom sheet flow is important input for SSL transport in the river in the Mekong RiverBasin. The literature does not contain conclusive results on the sensitivity range ofKf (Lukey et al., 2000; Bathurst et al., 2002). For example, sediment modeling using15
Kf with a small range from 0.0019 to 0.0045 mgm−2 s−1 in New Zealand (Russell andSandy, 2006) showed the inverse trend of the result shown in Mekong for the samerange, where the simulated SSL increased with increasing Kf.
The analysis of soil cohesion (J) shows that the SSL peak in September increasesby 150 % with a factor of 1.25 for J (Fig. 9c). In contrast, the SSL peak decreases20
by 70 and 80 % by decreasing the soil cohesion factor by 0.75 and 0.5, respectively.The change in SSL is more sensitive to soil cohesion than k and Kf, as soil cohesionindicates soil detachability within rivers. In the equations for net soil detachment inrivers (Eqs. 9 and 10), soil cohesion limits the detachment of sediment. Soil cohesionis recognized to be related to erodibility, and no unique relationship exists even for25
a single size of soil (Govers et al., 1990).The three input parameters that describe soil erodibility have a significant influence
on the output of SSL. Generally, soil cohesion (J) is the most sensitive parameter inboth river basins. The SSL change was sensitive to soil detachability over land (Kf) in
6777
HESSD12, 6755–6797, 2015
Distributed model ofhydrological and
sediment transport inlarge river basins.
S. Zuliziana et al.
Title Page
Abstract Introduction
Conclusions References
Tables Figures
J I
J I
Back Close
Full Screen / Esc
Printer-friendly Version
Interactive Discussion
Discussion
Paper
|D
iscussionP
aper|
Discussion
Paper
|D
iscussionP
aper|
the Mekong, whereas SSL change was more sensitive to detachability by raindrop (k)in the Chao Phraya.
4 Conclusion
In this study, a physically-based model of sediment transport targeting a large basinscale was developed and coupled with a distributed hydrological model. The model5
enables us to simulate rainfall–runoff processes and sediment transport on hillslopeand within a river network. In its application to the Chao Phraya River and Mekong Riverbasins, the sediment dynamics (i.e., yield and erosion) were reasonably simulated inhillslope areas. As it is a grid-based model, it can identify locations of serious sedimentdynamics by a fine grid scale. Moreover, the present model applications estimated10
soil cohesion (J) and detachability (k, Kf) in the Chao Phraya and Mekong rivers, andrevealed the high sensitivity of SSL to soil detachability (k, Kf) in both basins.
However, the present model assumed a single SS size instead of a wide range of SSsizes, due to limited information in both case studies. Thus, insufficient modeling of SSsize distribution might have limited the applicability of the sediment model in the case15
studies. Therefore, the model performance may be further improved by incorporatingmulti-size sediment particles into the model. Uncertainties in terms of model inputs,parameters and structure may also have influenced the simulation results. For example,the estimation of net sediment detachment (Eq. 9) could be improved by revisingthe equations. Currently, this equation (Eq. 9) assumed that the soil particles were20
detached (limitation to deposition) and limited by factors such as soil cohesion. Thus,this equation should be improved by considering the reasonable balance betweenerosion and deposition, especially for river basins. Sediment management in riverbasins is highly affected by both processes.
Nevertheless, the outputs from this model at the basin scale may provide useful25
information to developers, decision makers, and other stakeholders when planningand implementing appropriate basin-wide sediment management strategies, which
6778
HESSD12, 6755–6797, 2015
Distributed model ofhydrological and
sediment transport inlarge river basins.
S. Zuliziana et al.
Title Page
Abstract Introduction
Conclusions References
Tables Figures
J I
J I
Back Close
Full Screen / Esc
Printer-friendly Version
Interactive Discussion
Discussion
Paper
|D
iscussionP
aper|
Discussion
Paper
|D
iscussionP
aper|
can also be integrated with water resource management. The model could also beused also to project the anthropogenic impacts on sediment dynamics under differentscenarios in large river basins.
Author contributions. S. Zuliziana and K. Tanuma made substantial contributions to modeldevelop, simulations, data collection and analysis, and drafting and editing the manuscript.5
C. Yoshimura and O. C. Saavedra developed the research framework and models and helpededit the manuscript.
Acknowledgements. This research for Chao Phraya River was supported by Asian CoreProgram of Japan Society for the Promotion of Science (JSPS). Also, the part of the modelingwork for Mekong River was supported by JSPS Core-to-Core Program (B. Asia–Africa Science10
Platforms) and Collaborative Research Program (CRA) of AUN/SEED-Net.
References
Ahlgren, J. and Hessel, K.: The suspended matter of Mekong. A study of the chemicalconstituents adsorbed to suspended matter of the Mekong River, Lao PDR, Working Paper306, Swedish University of Agricultural Sciences, International Rural Development Centre,15
Uppsala, 1996.Arnold, J. G., Srinivasan, R., Muttiah, R. S., and Williams, J. R.: Large area hydrologic modeling
and assessment, Part I: Model development, J. Am. Water Resour. As., 34, 73–89, 1998.Bathurst, J. C., Sheffield, J., Vicente, C., White, S. M., and Romano, N.: Modelling large
basin hydrology and sediment yield with sparse data: the Agri basin, southern Italy,20
in: Mediterranean Desertification: a Mosaic of Processes and Responses, edited by:Geeson, N. A., Brandt, C. J., and Thornes, J. B., Wiley, Chichester, 397–415, 2002.
Bhattarai, R. and Dutta, D.: Analysis of soil erosion and sediment yield using empirical andprocess based models, in: Proceedings of the MTERM International Conference, AsianInstitute of Technology, Thailand, 6–7 June, 215–226, 2005.25
Brandt, C. J.: The size distribution of throughfall drops under vegetation canopies, Catena, 16,507–524, 1989.
Brandt, C. J.: Simulation of size distribution and erosivity of raindrops and throughfall drops,Earth Surf. Proc. Land., 15, 687–689, 1990.
6779
HESSD12, 6755–6797, 2015
Distributed model ofhydrological and
sediment transport inlarge river basins.
S. Zuliziana et al.
Title Page
Abstract Introduction
Conclusions References
Tables Figures
J I
J I
Back Close
Full Screen / Esc
Printer-friendly Version
Interactive Discussion
Discussion
Paper
|D
iscussionP
aper|
Discussion
Paper
|D
iscussionP
aper|
Brune, G. M.: Trap efficiency of reservoirs, Trans. AGU, 34, 407–418, 1953.Duan, Q., Soorooshian, S., and Gupta, V.: Effective and efficient global optimization for
conceptual rainfall–runoff models, Water Resour. Res., 28, 1015–1031, 1992.Duna, S., Wua, J. Q., Elliot, W. J., Robichaudb, P. R., Flanaganc, D. C., Frankenbergerc, J. R.,
Brownb, R. E., and Xud, A. C.: Adapting the Water Erosion Prediction Project (WEPP) model5
for forest applications, J. Hydrol., 366, 46–54, 2009.FAO: The Digital Soil Map of the World and Derived Soil Properties, version 3.6, FAO/UNESCO,
Rome, Italy, 2003.FAO/AGL: World River Sediment Yields Database, FAO, Rome, 2005.Fu, K. D., He, D. M., and Li, S. J.: Response of downstream sediment to water resource10
development in mainstream of the Lancang River, Chinese Sci. Bull., 51, 119–126, 2006.Govers, G.: Empirical relationships for the transport capacity of overland flow, in erosion,
transport and deposition processes, IAHS Publ., 189, 45–63, 1990.Gumiere, S. J., Le Bissonnais, Y., and Raclot, D.: Soil resistance to interill erosion: model
parameterization and sensitivity, Catena, 77, 274–284, 2009.15
Habib-ur-Rehman, M. and Naeem Akhtar, M.: Development of regional scale soil erosionand sediment transport model; its calibration and validations, in: 69th Annual SessionProceedings of Pakistan Engineering Congress, Lahore, Pakistan, April, 231–245, 2004.
Kabir, M. A., Dutta, D., and Hironaka, S.: Process-based distributed modeling approach foranalysis of sediment dynamics in a river basin, Hydrol. Earth Syst. Sci., 15, 1307–1321,20
doi:10.5194/hess-15-1307-2011, 2011.Kite, G.: Modelling the Mekong: hydrological simulation for environmental impact studies, J.
Hydrol., 253, 1–13, 2001.Kummu, M., Lu, X. X., and Varis, O.: Basin-wide trapping efficiency of emerging reservoirs long
the Mekong, Geomorphology, 119, 181–197, 2010.25
Kyuma, K.: Paddy Soils in the Mekong Delta of Vietnam, discussion paper 85, Center forSoutheast Asian Studies, Kyoto University, Kyoto, 77 pp., 1976.
Lu, X. X. and Siew, R. Y.: Water discharge and sediment flux changes over the past decadesin the Lower Mekong River: possible impacts of the Chinese dams, Hydrol. Earth Syst. Sci.,10, 181–195, doi:10.5194/hess-10-181-2006, 2006.30
Lukey, B. T., Sheffield, J., Bathurst, J. C., Hiley, R. A., and Mathys, N.: Test of the SHETRANtechnology for modeling the impact of reforestation on badlands runoff and sediment yield atDraix, France, J. Hydrol., 235, 44–62, 2000.
6780

HESSD12, 6755–6797, 2015
Distributed model ofhydrological and
sediment transport inlarge river basins.
S. Zuliziana et al.
Title Page
Abstract Introduction
Conclusions References
Tables Figures
J I
J I
Back Close
Full Screen / Esc
Printer-friendly Version
Interactive Discussion
Discussion
Paper
|D
iscussionP
aper|
Discussion
Paper
|D
iscussionP
aper|
MRC: Lower Mekong Hydrologic Yearbook, Mekong River Comm., Phnom Penh, 2000.MRC: Annual report 2005 [CD-ROM], Mekong River Comm., Vientiane, Mekong, 2005.Milliman, J. D. and Meade, R. H.: World-wide delivery of river sediment to the oceans, J. Geol.,
91, 1–21, 1983.Morgan, R. P. C.: A simple approach to soil loss prediction: a revised Morgan–Morgan–Finney5
model, Catena, 44, 305–322, 2001.Morgan, R. P. C., Quinton, J. N., Smith, R. E., Govers, G., Poesen, W. A., Auerswald, K.,
Chisci, G., Torri, D., and Styczen, M. E.: The European Soil Erosion Model (EU-ROSEM):a dynamic approach for predicting sediment transport from fields and small catchments,Earth Surf. Proc. Land., 23, 527–544, 1998.10
Nash, J. E. and Sutcliffe, J. V.: River flow forecasting through, Part I: A conceptual modelsdiscussion of principles, J. Hydrol., 10, 282–290, 1970.
Nearing, M. A., Jetten, V., Baffaut, C., Cerdan, O., Couturier, A., Hernandez, M.,Bissonnais, L. Y., Nichols, M. H., Nunes, J. P., Renschler, C. S., Souchere, V., and Oost, K. V.:Modeling response of soil erosion and runoff to changes in precipitation and cover, Catena,15
61, 131–154, 2005.Neitsch, S. L.: Soil and Water Assessment Tool User’s Manual Version 2000, SWRL Report
202, Texas Water Resources Institute, College Stations, Texas, 02–06, 2002.Ongley, E.: Sediment measurement, in: Water Quality Monitoring, Design and Implementation
of Fresh Water Quality Studies and Monitoring Programmes, chap. 13, World Health20
Organization, Geneva, 301–315, 1996.Ponce, V. M.: Engineering Hydrology: Principles and Practices, vol. 640, Englewood Cliffs,
Prentice Hall, 1989.Rauws, G. and Govers, G.: Hydraulic and soil mechanical aspects of rill generation on
agricultural soils, J. Soil Sci., 39, 111–124, 1988.25
Renard, K. G. and Freimund, J. R.: Using monthly precipitation data to estimate the R-factor inthe revised USLE, J. Hydrol., 157, 287–306, 1994.
Roberto, R., Thanh, H., and Maria, C.: A RUSLE approach to model suspended sediment loadin the Lo river (Vietnam): effects of reservoirs and land use changes, J. Hydrol., 422–423,17–29, 2012.30
Russell, A. and Sandy, E.: Physically based modeling of sediment generation and transportunder a large rainfall simulator, Hydrol. Process., 20, 2253–2270, 2006.
6781

HESSD12, 6755–6797, 2015
Distributed model ofhydrological and
sediment transport inlarge river basins.
S. Zuliziana et al.
Title Page
Abstract Introduction
Conclusions References
Tables Figures
J I
J I
Back Close
Full Screen / Esc
Printer-friendly Version
Interactive Discussion
Discussion
Paper
|D
iscussionP
aper|
Discussion
Paper
|D
iscussionP
aper|
Santhi, C., Arnold, J. G., Williams, J. R., Dugas, W. A., Srinivasan, R., and Hauck, L. M.:Validation of the SWAT model on a large river basin with point and nonpoint sources, J.Am. Water Resour. As., 37, 1169–1188, 2001.
Sharma, P. P., Gupta, S. C., and Foster, G. R.: Raindrop-induced soil detachment and sedimenttransport from interill areas, Soil Sci. Soc. Am. J., 59, 727–734, 1995.5
Tacio, H. D.: Sloping Agricultural Land Technology (SALT): a sustainable agroforestary schemefor uplands, Agroforest. Syst., 22, 145–152, 1993.
Thai Meteorological Department: Weather outlook for Thailand during rainy season (June–October 2012), Thai Meteorological Department, Bangkok, Thailand, 2012.
Torri, D., Sfalanga, M., and Delsette, M.: Splash detachment–runoff depth and soil cohesion,10
Catena, 14, 149–155, 1987.UNEP Environment Asessment Programe for Asia and the Pacific Bangkok: Land Cover
Assessment and Monitoring, Environment Assessment Technical Reports, Volume 8-A,Bangkok, Thailand, 1997.
Valeriano, O. C. S., Koike, T., Yang, K., and Yang, D.: Optimal dam operation during flood15
season using a distributed hydrological model and a heuristic algorithm, J. Hydrol. Eng., 15,580–586, 2010.
Walling, D. E.: Evaluation and Analysis of Sediment Data from the Lower Mekong River, Reportto the Mekong River Commission, Vientiane, 61 pp., 2005.
Walling, D. E.: The changing sediment load of the Mekong river, Ambio, 37, 150–157, 2008.20
Walling, D. E.: The sediment load of the Mekong River, in: The Mekong Biophysical Environmentof an International River Basin, edited by: Campbell, I. C., Elsevier, New York, 113–142,2009.
Walling, D. E.: Human Impact on the sediment load of Asian rivers, sediment problems andsediment management in Asian rivers basin, Walling ford, IAHS Publ., 349, 37–51, 2011.25
Walling, D. E. and Fang, D.: Recent trends in the suspended sediment loads of the world’srivers, Global Planet. Change, 39, 111–126, 2003.
Wang, J. J., Lu, X. X., and Kummu, M.: Sediment load estimates and variations in the LowerMekong River, River Res. Appl., 27, 33–46, 2011.
Wischmeier, W. H. and Smith, D. D.: Predicting rainfall erosion soil losses: a guide to30
conservation planning, in: Agriculture Handbook, No. 282, No. 537, US Department ofAgriculture Research Service, Washington, D.C., 244–252, 1978.
6782

HESSD12, 6755–6797, 2015
Distributed model ofhydrological and
sediment transport inlarge river basins.
S. Zuliziana et al.
Title Page
Abstract Introduction
Conclusions References
Tables Figures
J I
J I
Back Close
Full Screen / Esc
Printer-friendly Version
Interactive Discussion
Discussion
Paper
|D
iscussionP
aper|
Discussion
Paper
|D
iscussionP
aper|
Yang, D., Herath, S., Oki, T., and Musiake, K.: Application of distributed hydrological model inthe Asian monsoon tropic region with a perspective of coupling with atmospheric models, J.Meteorol. Soc. Jpn., 79, 373–385, 2001.
Yang, D., Kanae, S., Oki, T., Koike, T., and Musiake, K.: Global potential soil erosion withreference to land use and climate changes, Hydrol. Process., 17, 2913–2928, 2003.5
Zarfl, C., Lumsdon, A. E., Berlekamp, J., Tydecks, L., and Tockner, K.: A global boom inhydropower dam construction, Aquat. Sci., 77, 161–170, doi:10.1007/s00027-014-0377-0,2014.
6783

HESSD12, 6755–6797, 2015
Distributed model ofhydrological and
sediment transport inlarge river basins.
S. Zuliziana et al.
Title Page
Abstract Introduction
Conclusions References
Tables Figures
J I
J I
Back Close
Full Screen / Esc
Printer-friendly Version
Interactive Discussion
Discussion
Paper
|D
iscussionP
aper|
Discussion
Paper
|D
iscussionP
aper|
Table 1. Model parameters calibrated for Chao Phraya River and Mekong River basins.
Chao Phraya River Mekong River
Hydrological modelSaturated hydraulic conductivity of 89.0–255.6 4.6–30.4surface soil, ksat1 (mmh−1)Residual soil moisture, wrsd (mmh−1) 0.16–0.17 0.16–0.19
Sediment modelRaindrop, k (gJ−1) 7.0–9.1 7.0–100.0Overland flow, Kf (mgm−2 s−1) 0.6–1.1 1.0–10.0Soil cohesion, J (kPa) 3.0–7.5 3.0–5.0
6784

HESSD12, 6755–6797, 2015
Distributed model ofhydrological and
sediment transport inlarge river basins.
S. Zuliziana et al.
Title Page
Abstract Introduction
Conclusions References
Tables Figures
J I
J I
Back Close
Full Screen / Esc
Printer-friendly Version
Interactive Discussion
Discussion
Paper
|D
iscussionP
aper|
Discussion
Paper
|D
iscussionP
aper|
Table 2. Model performance indicators for monthly river discharge, SSL, and SSC in ChaoPhraya River Basin from 2001 to 2010. NSE and r stands for the Nash–Sutcliffe efficiencycoefficient and correlation coefficient, respectively.
Stations Performance indicators
Location Code Calibration Validation(2001) (2002–2010)
NSE r NSE r
River discharge
Ping River P73 0.88 0.94 0.89 0.95Wang River W3A 0.90 0.89 0.91 0.90Yom River Y37 0.81 0.95 0.82 0.96Nan River N13A 0.82 0.93 0.83 0.94Chao Phraya River C2 0.68 0.93 0.69 0.94
Suspended sediment load (SSL)
Ping River P73 0.54 0.70 0.55 0.71Wang River W3A 0.76 0.43 0.78 0.45Yom River Y37 0.49 0.50 0.51 0.51Nan River N13A 0.70 0.80 0.72 0.80Chao Phraya River C2 −0.14 0.29 −0.15 0.31
Suspended sediment concentration (SSC)
Ping River P73 −1.96 0.15 −1.21 0.52Wang River W3A −0.11 0.57 −0.27 0.61Yom River Y37 No observation 0.28 0.57Nan River N13A −0.05 0.68 −1.94 0.62Chao Phraya River C2 0.52 0.45 −3.24 0.10
6785

HESSD12, 6755–6797, 2015
Distributed model ofhydrological and
sediment transport inlarge river basins.
S. Zuliziana et al.
Title Page
Abstract Introduction
Conclusions References
Tables Figures
J I
J I
Back Close
Full Screen / Esc
Printer-friendly Version
Interactive Discussion
Discussion
Paper
|D
iscussionP
aper|
Discussion
Paper
|D
iscussionP
aper|
Table 3. Model performance indicators for monthly river discharge, SSL, and SSC in MekongRiver Basin from 1991 to 2000. NSE and r stands for the Nash–Sutcliffe efficiency coefficientand correlation coefficient, respectively.
Stations Performance indicators
Location Code Calibration Validation(1991–1995) (1996–2000)
NSE r NSE r
River discharge
Chiang Sean 1 0.71 0.81 0.71 0.86Khong Chiam 2 0.77 0.87 0.74 0.86Phnom Penh 3 0.84 0.87 0.85 0.86
Suspended sediment load (SSL)
Chiang Sean 1 0.62 0.85 0.51 0.65Khong Chiam 2 0.62 0.86 0.62 0.83Phnom Penh 3 0.64 0.80 0.64 0.87
Suspended sediment concentration (SSC)
Chiang Sean 1 0.08 0.58 −4.33 0.31Khong Chiam 2 −0.07 0.43 −0.25 0.73Phnom Penh 3 −0.07 0.66 −1.02 0.78
6786
HESSD12, 6755–6797, 2015
Distributed model ofhydrological and
sediment transport inlarge river basins.
S. Zuliziana et al.
Title Page
Abstract Introduction
Conclusions References
Tables Figures
J I
J I
Back Close
Full Screen / Esc
Printer-friendly Version
Interactive Discussion
Discussion
Paper
|D
iscussionP
aper|
Discussion
Paper
|D
iscussionP
aper|
Climate (rainfall, air temperature), DEM, Land use, Soil type, Vegetation
Hydrological
model
Sediment model Dam model
Hillslope
process
River Routing
Soil erosion from hillslope:
Raindrop erosion
Flow detachment
Sediment transport in
river: Erosion & deposition
Suspended sediment load (SSL)
Suspended sediment concentration (SSC)
Dam operation
River discharge
Figure 1. Structure of the distributed sediment model integrated with a process-baseddistributed hydrological model.
6787

HESSD12, 6755–6797, 2015
Distributed model ofhydrological and
sediment transport inlarge river basins.
S. Zuliziana et al.
Title Page
Abstract Introduction
Conclusions References
Tables Figures
J I
J I
Back Close
Full Screen / Esc
Printer-friendly Version
Interactive Discussion
Discussion
Paper
|D
iscussionP
aper|
Discussion
Paper
|D
iscussionP
aper|
Figure 2. The target area of Chao Phraya River Basin.
6788

HESSD12, 6755–6797, 2015
Distributed model ofhydrological and
sediment transport inlarge river basins.
S. Zuliziana et al.
Title Page
Abstract Introduction
Conclusions References
Tables Figures
J I
J I
Back Close
Full Screen / Esc
Printer-friendly Version
Interactive Discussion
Discussion
Paper
|D
iscussionP
aper|
Discussion
Paper
|D
iscussionP
aper|
0
400
800
1200
16000
2
4
6
8
P73-Ping River Precipitation
Simulation
Observation
0
400
800
1200
16000
2
4
6
8
W3A-Wang River
0
400
800
1200
16000
2
4
6
8
Y37-Yom River
0
400
800
1200
16000
5
10
15
20
25
N13A-Nan River
0
400
800
1200
16000
5
10
15
20
Jan-01 Jan-02 Jan-03 Jan-04 Jan-05 Jan-06 Jan-07 Jan-08 Jan-09 Jan-10
C2-Chao Phraya River
Month-Year
SS
L (
10
5 t
mo
nth
-1) P
recipita
tion
(mm
)
Figure 3. Monthly suspended sediment load (SSL) at stream gauge stations in Chao PhrayaRiver Basin for 2001–2010.
6789

HESSD12, 6755–6797, 2015
Distributed model ofhydrological and
sediment transport inlarge river basins.
S. Zuliziana et al.
Title Page
Abstract Introduction
Conclusions References
Tables Figures
J I
J I
Back Close
Full Screen / Esc
Printer-friendly Version
Interactive Discussion
Discussion
Paper
|D
iscussionP
aper|
Discussion
Paper
|D
iscussionP
aper|
0
0.1
0.2
0.3
0.4P73-Ping River Simulation
Observation
0
0.1
0.2
0.3
0.4
0.5
Jan-01 Jan-02 Jan-03 Jan-04 Jan-05 Jan-06 Jan-07 Jan-08 Jan-09 Jan-10
Month-Year
C2-Chao Phraya River
0
0.1
0.2
0.3
0.4W3A-Wang River
0
0.1
0.2
0.3
0.4Y37-Yom River
0
0.5
1
1.5
N13A-Nan River
SS
C (
kg
m-3
)
Figure 4. Average monthly suspended sediment concentration (SSC) at stream gauge stationsin Chao Phraya River Basin for 2001–2010.
6790

HESSD12, 6755–6797, 2015
Distributed model ofhydrological and
sediment transport inlarge river basins.
S. Zuliziana et al.
Title Page
Abstract Introduction
Conclusions References
Tables Figures
J I
J I
Back Close
Full Screen / Esc
Printer-friendly Version
Interactive Discussion
Discussion
Paper
|D
iscussionP
aper|
Discussion
Paper
|D
iscussionP
aper|
SS
L (
10
5 t
mon
th-1
) 0
2
4
6
8
10
Jan Feb Mar Apr May Jun Jul Aug Sep Oct Nov Dec
(a) Observed
Initial k (g/J) (7.0 for clay and silt, 9.1 for sand)
Initial k x 1.5
Initial k x 0.5
Initial k x 0.25
Observation
Initial k (7.0 g J-1 for clay and silt, 9.1 g J-1 for sand)
Initial k 1.5
Initial k 0.5
Initial k 0.25
0
2
4
6
8
10
Jan Feb Mar Apr May Jun Jul Aug Sep Oct Nov Dec
(b) Observed
Initial Kf (mg/m2/s) (0.6 for clay, 1.0 for silt, 1.1 for sand)
Initial Kf x 100
Initial Kf x 10
Initial Kf x 0.1
Initial Kf x 0.01
Observation
Initial Kf (0.6, 1.0, and 1.1 mg m-2 s-1 for clay, silt, and sand, respectively)
Initial Kf 100
Initial Kf 10
Initial Kf 0.1
Initial Kf 0.01
0
2
4
6
8
10
Jan Feb Mar Apr May Jun Jul Aug Sep Oct Nov Dec
Month in 2005
(c) Observed
Initial J (kPa), 3
Initial J x 1.25
Initial J x 0.75
Initial J x 0.50
Observation
Initial J (3.0 kPa)
Initial J 1.25
Initial J 0.75
Initial J 0.50
Figure 5. Sensitivity of suspended sediment load (SSL) at P73 in Chao Phraya River Basin to(a) detachability from rain drop (k), (b) detachability from sheet flow (Kf) and (c) soil cohesion(J). Difference among lines in (b) is invisible due to the minor response of SSL to Kf.
6791
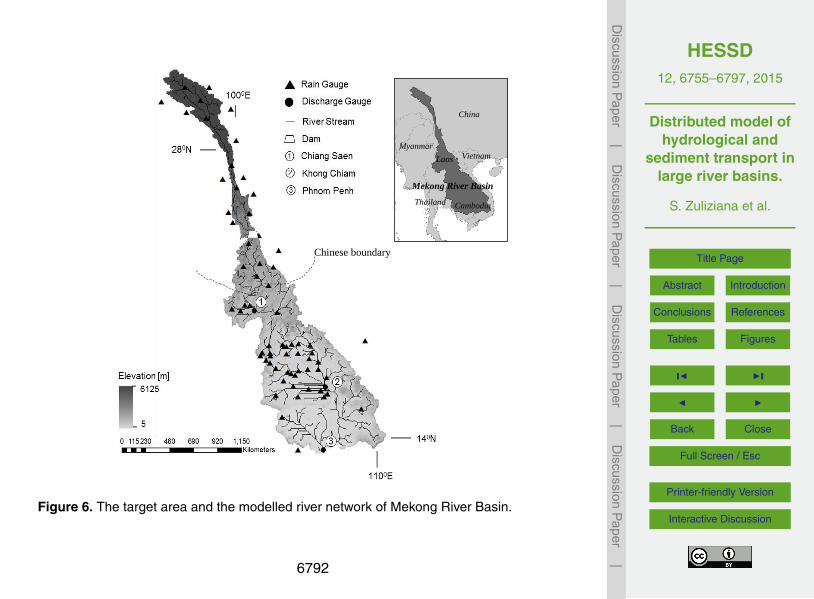
HESSD12, 6755–6797, 2015
Distributed model ofhydrological and
sediment transport inlarge river basins.
S. Zuliziana et al.
Title Page
Abstract Introduction
Conclusions References
Tables Figures
J I
J I
Back Close
Full Screen / Esc
Printer-friendly Version
Interactive Discussion
Discussion
Paper
|D
iscussionP
aper|
Discussion
Paper
|D
iscussionP
aper|
China
Vietnam Laos Myanmar
Cambodia Thailand
Mekong River Basin
Chinese boundary
Figure 6. The target area and the modelled river network of Mekong River Basin.
6792

HESSD12, 6755–6797, 2015
Distributed model ofhydrological and
sediment transport inlarge river basins.
S. Zuliziana et al.
Title Page
Abstract Introduction
Conclusions References
Tables Figures
J I
J I
Back Close
Full Screen / Esc
Printer-friendly Version
Interactive Discussion
Discussion
Paper
|D
iscussionP
aper|
Discussion
Paper
|D
iscussionP
aper|
0
500
1000
1500
20000
2
4
6
8
10
2-Khong Chiam
0
500
1000
1500
20000
2
4
6
1-Chiang Sean PrecipitationSimulationObservation
0
500
1000
1500
20000
2
4
6
8
10
Jan-91 Jan-92 Jan-93 Jan-94 Jan-95 Jan-96 Jan-97 Jan-98 Jan-99 Jan-00
Month-Year
3-Phnom Penh
SS
L (
10
7 t
mo
nth
-1) P
recipita
tion
(mm
)
Figure 7. Monthly suspended sediment load (SSL) at stream gauge stations in the MekongRiver Basin for 1991–2000.
6793

HESSD12, 6755–6797, 2015
Distributed model ofhydrological and
sediment transport inlarge river basins.
S. Zuliziana et al.
Title Page
Abstract Introduction
Conclusions References
Tables Figures
J I
J I
Back Close
Full Screen / Esc
Printer-friendly Version
Interactive Discussion
Discussion
Paper
|D
iscussionP
aper|
Discussion
Paper
|D
iscussionP
aper|
0.0
0.5
1.0
1.5
2.01-Chiang Sean Simulation
Observation
0.0
0.5
1.0
1.5
2.02-Khong Chiam
0.0
0.5
1.0
1.5
2.0
Jan-91 Jan-92 Jan-93 Jan-94 Jan-95 Jan-96 Jan-97 Jan-98 Jan-99 Jan-00
3-Phnom Penh
SS
C (
kg
m-3
)
Month-Year
Figure 8. Monthly suspended sediment concentration (SSC) at stream gauge stations inMekong River Basin for 1991–2000.
6794

HESSD12, 6755–6797, 2015
Distributed model ofhydrological and
sediment transport inlarge river basins.
S. Zuliziana et al.
Title Page
Abstract Introduction
Conclusions References
Tables Figures
J I
J I
Back Close
Full Screen / Esc
Printer-friendly Version
Interactive Discussion
Discussion
Paper
|D
iscussionP
aper|
Discussion
Paper
|D
iscussionP
aper|
SS
L (
10
7 t
mon
th-1
)
0
2
4
6
8
10
12
Jan Feb March April May June July Aug Sept Oct Nov Dec
Month in 1999
(c) Observed
Initial J (kpa), 3.00
Initial J x 1.25
Initial J x 0.50
Initial J x 0.75
Observation
Initial J (3.00 kPa)
Initial J 1.25
Initial J 0.75
Initial J 0.50
0
2
4
6
8
10
12
Jan Feb March April May June July Aug Sept Oct Nov Dec
(b) Observed
Initial Kf (mg/m2/s), 1.00
Initial Kf x 100
Initial Kf x 10
Initial Kf x 0.1
Initial Kf x 0.01
Observation
Initial Kf (1.00 mg m-2
s-1
)
Initial Kf 100
Initial Kf 10
Initial Kf 0.1
Initial Kf 0.01
0
2
4
6
8
10
12
Jan Feb March April May June July Aug Sept Oct Nov Dec
Observed
Initial k(g/J) (7 for clay and silt, 100 for sand)
k x 1.5
k x 0.5
k x 0.25
Observation
Initial k (7.00 g J-1
for clay and silt, 100 g J-1
for sand)
Initial k 1.50
Initial k 0.50
Initial k 0.25
(a)
Figure 9. Sensitivity of suspended sediment load (SSL) at Khong Chiam station in MekongRiver Basin to (a) detachability from rain drop (k), (b) detachability from sheet flow (Kf), (c) soilcohesion (J). Difference among lines in (a) is invisible due to the minor response of SSL to k.
6795

HESSD12, 6755–6797, 2015
Distributed model ofhydrological and
sediment transport inlarge river basins.
S. Zuliziana et al.
Title Page
Abstract Introduction
Conclusions References
Tables Figures
J I
J I
Back Close
Full Screen / Esc
Printer-friendly Version
Interactive Discussion
Discussion
Paper
|D
iscussionP
aper|
Discussion
Paper
|D
iscussionP
aper|
0
400
800
12000
10
20
30
40
50
P73-Ping River PrecipitationSimulationObservation
0
400
800
12000
10
20
30
W3A-Wang River
0
400
800
12000
10
20
30
40
50
Y37-Yom River
0
400
800
12000
20
40
60
80
N13A-Nan River
0
400
800
12000
50
100
150
200
250
Jan-01 Jan-02 Jan-03 Jan-04 Jan-05 Jan-06 Jan-07 Jan-08 Jan-09 Jan-10
Month-Year
C2-Chao Phraya River
Precip
itatio
n (m
m)
Riv
er d
isch
arg
e (1
03 m
3 s
-1)
Figure A1. Monthly average river discharge at stream gauge stations from 2001 to 2010 atChao Phraya River Basin.
6796

HESSD12, 6755–6797, 2015
Distributed model ofhydrological and
sediment transport inlarge river basins.
S. Zuliziana et al.
Title Page
Abstract Introduction
Conclusions References
Tables Figures
J I
J I
Back Close
Full Screen / Esc
Printer-friendly Version
Interactive Discussion
Discussion
Paper
|D
iscussionP
aper|
Discussion
Paper
|D
iscussionP
aper|
0
500
1000
1500
20000
1
2
3
4
1-Chiang Sean PrecipitationSimulationObservation
0
500
1000
1500
20000
10
20
2-Khong Chiam
0
500
1000
1500
20000
10
20
30
Jan-91 Jan-92 Jan-93 Jan-94 Jan-95 Jan-96 Jan-97 Jan-98 Jan-99 Jan-00
3-Phnom Penh
Month-Year
Precip
itatio
n (m
m)
Riv
er d
isch
arg
e (1
05 m
3 s
-1)
Figure B1. Monthly average river discharge at stream gauge stations from 1991 to 2000 atMekong River Basin.
6797