distribution, abundance and composition of …map.seafdec.org/downloads/pdf/collaborative...
TRANSCRIPT

S2/FB3<JUTAMAS>
-288-
Distribution, Abundance and Composition of Zooplankton in the South China Sea,Area II: Sabah, Sarawak and Brunei Darussalam Waters
Jutamas Jivaluk
Department of fisheries/ Thailand
ABSTRACT
The samples of 79 stations in Sarawak, Sabah and Brunei Darusalam waters were collected byM.V.SEAFDEC on 4 July - 9 August 1996 and on 25 April - 31 May 1997. Thirty-eight groups ofzooplankton were found in this study. Copopoda dominated the zooplankton population, followed byOstracoda and Chaetognatha in both period. Biomass vary from 0.11-1.54 ml/m3 (average 0.44±0.25)and 0.09-1.76 ml/m3 (average 0.45±0.33) in July and May respectively. Abundance vary from 72-681no/m3 (average 232±125) and 35-1,383 no/m3 (average 251±216) in July and May respectively. T-test shows no significant difference of biomass and abundance between July and May.
Key words Zooplankton, biomass, abundance, Sarawak, Sabah, Brunei Darussalam
Introduction
It is generally recognized that zooplankton occupy an important role in the economy in the sea,both as consumer of phytoplankton and as contributors to the next higher trophic levels. Numerousstudies have shown that small zooplankton (e.g. copepods, tintinnids, cladocerans, larval molluscs)are important component of larval fish food [Houde & Lovdal (1982)], [Balbontin, et al. (1986)],[Anderson (1994)]. Hence, variation in the availability of these organisms has been hypothesized tobe related to the larval survival and the subsequent recruitment to the adult population of marinefishes [Cushing (1975)].
Few papers are studied in Sarawak, Sabah and Brunei Darusalam waters. Most of them workedon fisheries [Beales (1982)], [Lee (1982)], [Wong (1982)]. Some investigated on heavy metal insediment [Imail (1993)]. Thus the distribution and composition of zooplankton in this areas is poorlyknown. However, there were many papers worked on the seasonal abundance and distribution ofzooplankton in the nearby areas such as the Gulf of Thailand [Brinton (1963), [Suvapepun (1977)],[Suwanrumpha (1980)].
The propose of the present investigation is to describe the zooplankton community in Sarawak,Sabah and Brunei Darusalam waters, and provide an estimation of abundance, composition, biomassand their distribution.
Method
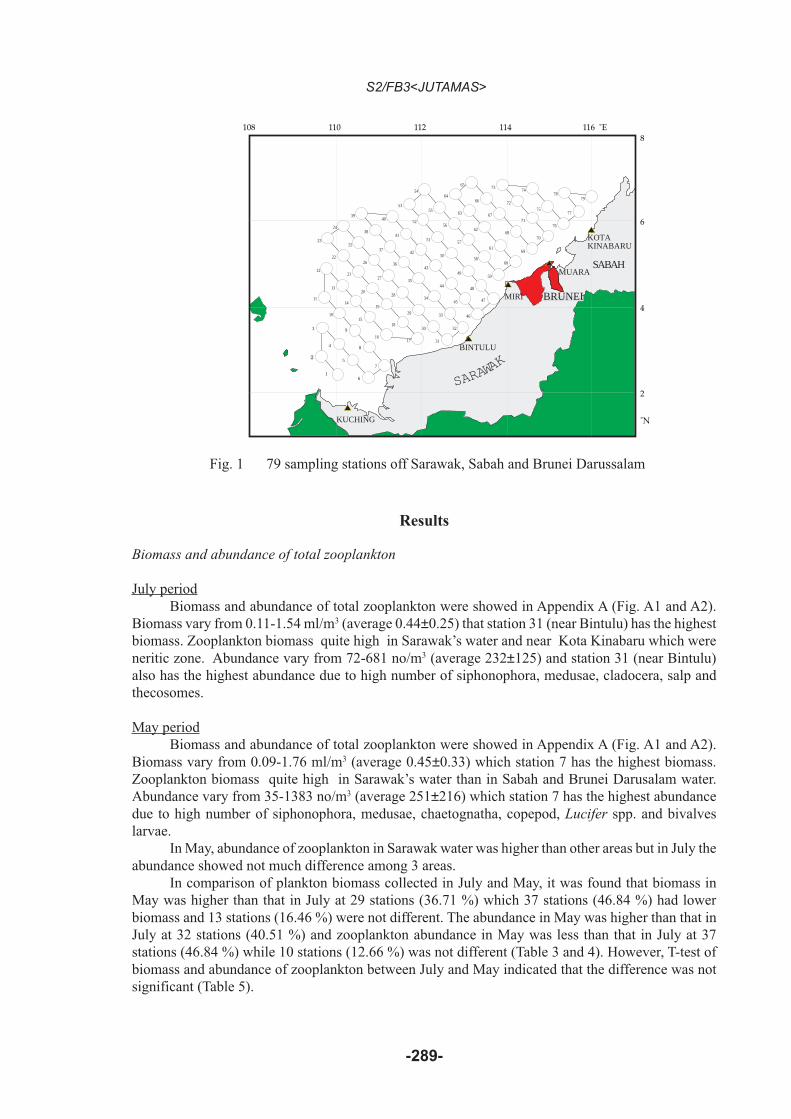
The samples of 79 stations in the Sarawak, Sabah and Brunei Darusalam waters were collectedby M.V.SEAFDEC on 4 July - 9 August 1996 and on 25 April - 31 May 1997 (Table 1 & Fig. 1).Plankton was collected using 0.03 mm mesh net attached to 60 cm. diameter bongo frames. A flow-meter, attached within the aperture of the net, measured the amount of water filtered. At each stationa 30 minutes oblique tow of the bongo net was made with the ship speed was about 2 knots. The depthof the haul was 5 meters above the sea bottom for the station that the depth less than 155 meters and150 meters for the station that the depth over than 155 meters except in the strong current station, thehauling depth was 120 meters.The samples were preserved in 10 % buffered formalin-seawater im-mediately. In the laboratory, the displacement volume of total zooplankton was measured after largegelatinous zooplankton had been removed. The samples were subsampled with Falsom PlanktonSplitter and then count to taxon. Data on biomass and abundance were standardized per cubic metre.
S2/FB3<JUTAMAS>
-289-
Results
Biomass and abundance of total zooplankton
July periodBiomass and abundance of total zooplankton were showed in Appendix A (Fig. A1 and A2).
Biomass vary from 0.11-1.54 ml/m3 (average 0.44±0.25) that station 31 (near Bintulu) has the highestbiomass. Zooplankton biomass quite high in Sarawak’s water and near Kota Kinabaru which wereneritic zone. Abundance vary from 72-681 no/m3 (average 232±125) and station 31 (near Bintulu)also has the highest abundance due to high number of siphonophora, medusae, cladocera, salp andthecosomes.
May periodBiomass and abundance of total zooplankton were showed in Appendix A (Fig. A1 and A2).
Biomass vary from 0.09-1.76 ml/m3 (average 0.45±0.33) which station 7 has the highest biomass.Zooplankton biomass quite high in Sarawak’s water than in Sabah and Brunei Darusalam water.Abundance vary from 35-1383 no/m3 (average 251±216) which station 7 has the highest abundancedue to high number of siphonophora, medusae, chaetognatha, copepod, Lucifer spp. and bivalveslarvae.
In May, abundance of zooplankton in Sarawak water was higher than other areas but in July theabundance showed not much difference among 3 areas.
In comparison of plankton biomass collected in July and May, it was found that biomass inMay was higher than that in July at 29 stations (36.71 %) which 37 stations (46.84 %) had lowerbiomass and 13 stations (16.46 %) were not different. The abundance in May was higher than that inJuly at 32 stations (40.51 %) and zooplankton abundance in May was less than that in July at 37stations (46.84 %) while 10 stations (12.66 %) was not different (Table 3 and 4). However, T-test ofbiomass and abundance of zooplankton between July and May indicated that the difference was notsignificant (Table 5).
8
6
4
2
˚N
SARAWAK
SABAH
108 110 112 114 116 ˚E
KUCHING
BINTULU
MIRI
MUARA
KOTAKINABARU
1
2
3
4
5
6
7
8
9
11
12
13
14
15
1617
18
19
20
21
22
23
24
25
26
27
28
29
30
31
34
33
32
35
36
37
38
3940
41
42
43
44
45
46
49
48
47
50
51
55
56
57
58
59
60
61
62
63
6466
65
67
68
69
71
70
72
7374
75
76
78
77
79
10
52
53
54
BRUNEI
Fig. 1 79 sampling stations off Sarawak, Sabah and Brunei Darussalam

S2/FB3<JUTAMAS>
-290-
Stn. No. Date Time Date Time Depth
Latitude Longitude (m)
1 7/10/96 0606-0638 5/1/97 0555-0625 02-20.0 N 110-00.0 E 36
2 7/10/96 1029-1100 5/1/97 1027-1053 02-42.8 N 109-40.3 E 54
3 7/10/96 1624-1652 5/1/97 1548-1618 03-25.3 N 109-43.3 E 79
4 7/10/96 2040-2108 5/1/97 2035-2100 03-02.5 N 110-03.0 E 66
5 7/11/96 0600-0603 5/2/97 0550-0618 02-39.8 N 110-22.6 E 85
6 7/11/96 1021-1048 5/2/97 1008-1033 02-17.0 N 110-42.3 E 41
7 7/11/96 1447-1506 5/2/97 1404-1432 02-36.8 N 111-04.9 E 35
8 7/11/96 1853-1918 5/2/97 1822-1850 02-59.5 N 110-45.3 E 39
9 7/12/96 0548-0618 5/3/97 0554-0624 03-22.3 N 110-25.6 E 65
10 7/12/96 1013-1043 5/3/97 1015-1045 03-45.1 N 110-05.9 E 85
11 7/12/96 1428-1503 5/3/97 1440-1509 04-07.8 N 109-46.2 E 100
12 7/12/96 2016-2044 5/3/97 2017-2045 04-50.3 N 109-49.2 E 118
13 7/13/96 0539-0607 5/4/97 0550-0616 04-27.6 N 110-08.9 E 115
14 7/13/96 1003-1033 5/4/97 1006-1035 04-04.8 N 110-28.6 E 94
15 7/13/96 1417-1443 5/4/97 1418-1446 03-42.1 N 110-48.3 E 66
16 7/13/96 1836-1901 5/4/97 1837-1906 03-19.3 N 111-07.9 E 62
17 7/14/96 0703-0723 5/5/97 0550-0620 03-16.3 N 111-50.3 E 29
18 7/14/96 1120-1145 5/5/97 1014-1043 03-39.1 N 111-30.6 E 50
19 7/14/96 1559-1626 5/5/97 1420-1448 04-01.8 N 111-10.9 E 70
20 7/14/96 2030-2100 5/5/97 1833-1901 04-24.6 N 110-51.2 E 89
21 7/15/96 0539-0608 5/6/97 0549-0619 04-47.3 N 110-31.5 E 117
22 7/15/96 0957-1025 5/6/97 1006-1034 05-10.1 N 110-11.8 E 145
23 7/15/96 1409-1439 5/6/97 1436-1505 05-32.8 N 109-52.0 E 145
24 7/15/96 1839-1907 5/6/97 1852-1922 05-52.6 N 110-14.8 E 530
25 7/16/96 0537-0605 5/7/97 0545-0615 05-29.9 N 110-34.5 E 207
26 7/16/96 1013-1042 5/7/97 1002-1032 05-07.1 N 110-54.2 E 123
27 7/16/96 1431-1500 5/7/97 1421-1449 04-44.4 N 111-13.9 E 95
28 7/16/96 1852-1921 5/7/97 1835-1905 04-21.6 N 111-33.7 E 80
29 7/17/96 0540-0610 5/8/97 0550-0620 03-58.9 N 111-53.4 E 57
30 7/17/96 1011-1040 5/8/97 1010-1037 03-31.5 N 112-08.0 E 32
31 7/17/96 1910-1936 5/9/97 1924-1950 03-13.4 N 112-32.7 E 22
32 7/19/96 0537-0605 5/10/97 0547-0614 03-33.1 N 112-55.4 E 32
33 7/19/96 1004-1032 5/10/97 0948-1017 03-55.9 N 112-35.7 E 48
34 7/19/96 1423-1451 5/10/97 1410-1440 04-18.6 N 112-16.0 E 71
35 7/19/96 1839-1908 5/10/97 1838-1908 04-41.1 N 111-56.3 E 87
36 7/20/96 0540-0608 5/11/97 0549-0618 05-04.1 N 111-36.6 E 109
37 7/20/96 1018-1047 5/11/97 0957-1027 05-26.9 N 111-16.8 E 446
38 7/20/96 1440-1510 5/11/97 1434-1504 05-49.6 N 110-57.1 E 1063
39 7/20/96 1930-1958 5/11/97 1925-1955 06-12.4 N 110-37.3 E 1234
40 7/21/96 0538-0608 5/12/97 0547-0617 06-09.4 N 111-19.8 E 922
41 7/21/96 1020-1050 5/12/97 1016-1046 05-46.6 N 111-39.6 E 1300
42 7/21/96 1510-1540 5/12/97 1450-1520 05-23.9 N 111-59.3 E 132
43 7/21/96 1923-1953 5/12/97 1857-1925 05-01.1 N 112-19.0 E 105
44 7/22/96 0537-0605 5/13/97 0547-0617 04-38.4 N 112.38.7 E 90
45 7/22/96 1000-1028 5/13/97 0940-1010 04-15.6 N 112-58.5 E 67
46 7/22/96 1422-1442 5/13/97 1344-1412 03-52.9 N 113-18.1 E 22
47 7/22/96 1819-1840 5/13/97 1740-1809 04-12.7 N 113-40.8 E 28
48 7/24/96 0848-0918 5/15/97 1250-1320 04-35.4 N 113-21.1 E 79
49 7/24/96 1258-1328 5/15/97 1705-1734 04-58.2 N 113-01.4 E 105
50 7/24/96 1719-1748 5/15/97 2113-2143 05-20.9 N 112-14.7 E 520
51 7/25/96 0540-0610 5/16/97 0547-0617 05-43.2 N 112-21.0 E 192
52 7/25/96 1002-1032 5/16/97 1004-1034 06-06.4 N 112-02.2 E 1650
53 7/25/96 1519-1592 5/16/97 1504-1534 06-29.2 N 111-42.4 E 1941
54 7/25/96 2054-2123 5/16/97 2021-2051 06-48.9 N 112-05.2 E 2008
55 7/26/96 0542-0612 5/17/97 0546-0616 06-26.2 N 112-24.9 E 1318
56 7/26/96 1026-1056 5/17/97 1030-1100 06-03.4 N 112-44.7 E 1136
57 7/26/96 1500-1529 5/17/97 1504-1534 05-40.7 N 113-04.5 E 2355
58 7/26/96 2009-2038 5/17/97 2047-2117 05-17.9 N 113-24.3 E 1622
59 7/27/96 0538-0607 5/18/97 0549-0619 04-55.2 N 113-43.9 E 95
60 7/27/96 0947-1017 5/18/97 1000-1030 05-15.0 N 114-06.6 E 235
61 7/27/96 1403-1434 5/18/97 1539-1609 05-37.7 N 113-46.9 E 2142
62 7/27/96 1910-1939 5/18/97 2040-2110 06-00.5 N 113-27.1 E 2567
63 7/28/96 0540-0608 5/19/97 0547-0617 06-23.2 N 113-07.4 E 1623
64 7/28/98 1050-1120 5/19/97 1009-1039 06-46.0 N 112-47.6 E 1261
65 7/28/96 1532-1602 5/19/97 1430-1500 07-05.7 N 113-10.4 E 1535
66 7/28/96 2013-2044 5/19/97 1858-1928 06-43.0 N 113-30.1 E 1883
67 7/29/96 0542-0612 5/20/97 0549-0618 06-20.2 N 113-49.9 E 2820
68 7/29/96 1055-1125 5/20/97 1032-1102 05-57.5 N 114-09.7 E 1785
69 7/29/96 1547-1617 5/21/97 2104-2134 05-34.7 N 114-29.4 E 100
70 7/29/96 2014-2044 5/22/97 0548-0618 05-54.5 N 114-52.1 E 125
71 7/31/96 1359-1430 5/22/97 1008-1038 06-17.2 N 114-32.4 E 2078
72 7/31/96 1811-1841 5/22/97 1500-1530 06-40.0 N 114-12.6 E 2867
73 7/31/96 2327-2358 5/22/97 1937-2007 07-02.7 N 113-52.8 E 1836
74 8/1/96 0855-0925 5/23/97 0546-0616 06-59.8 N 114-35.4 E 2893
75 8/1/96 1408-1439 5/23/97 1035-1105 06-37.0 N 114-55.2 E 1751
76 8/1/96 1910-1940 5/23/97 1504-1534 06-14.3 N 115-14.9 E 111
77 8/2/96 0537-0607 5/24/97 0551-0620 06-34.0 N 115-37.7 E 95
78 8/2/96 1006-1037 5/24/97 1006-1036 06-56.8 N 115-17.9 E 1498
79 8/2/96 1616-1647 5/24/97 1545-1612 06-53.8 N 116-00.4 E 42
Position
Table 1 Information of all survey stations in the Area II

S2/FB3<JUTAMAS>
-291-
Station July May Station July May Station July May
1 0.61 0.88 28 0.84 0.71 55 0.44 0.312 0.94 0.65 29 0.91 0.60 56 0.25 0.233 0.57 0.35 30 0.77 0.77 57 0.19 0.294 0.52 0.76 31 1.54 1.38 58 0.24 0.185 0.92 0.52 32 0.71 0.35 59 0.34 0.296 0.93 0.78 33 0.67 0.65 60 0.37 0.147 0.80 1.76 34 0.61 0.73 61 0.40 0.098 0.57 1.35 35 0.48 0.39 62 0.27 0.169 0.38 1.33 36 0.14 0.39 63 0.56 0.16
10 0.59 1.24 37 0.2 0.17 64 0.21 0.1611 0.28 0.52 38 0.25 0.31 65 0.38 0.2012 0.18 0.48 39 0.55 0.29 66 0.34 0.3713 0.24 0.23 40 0.61 0.29 67 0.43 0.2814 0.20 0.24 41 0.22 0.35 68 0.28 0.1515 0.45 0.52 42 0.22 0.27 69 0.46 0.1216 0.85 0.58 43 0.27 0.52 70 0.35 0.1817 0.69 0.83 44 0.53 0.36 71 0.28 0.1418 0.73 0.61 45 0.47 0.81 72 0.30 0.0919 0.33 0.41 46 0.65 0.55 73 0.31 0.1720 0.23 0.46 47 0.32 0.66 74 0.42 0.2021 0.16 0.37 48 0.46 0.41 75 0.26 0.1122 0.14 0.18 49 0.52 0.44 76 0.22 0.5323 0.17 0.25 50 0.31 0.13 77 0.66 0.7424 0.28 0.37 51 0.28 0.14 78 0.74 0.1625 0.15 0.25 52 0.33 0.40 79 0.56 0.2726 0.11 0.47 53 0.22 0.3527 0.24 0.94 54 0.43 0.32
Station July May Station July May Station July May
1 315 378 28 424 533 55 215 1412 363 450 29 408 344 56 148 1253 406 172 30 306 438 57 140 1624 269 360 31 681 888 58 108 1155 623 384 32 391 168 59 228 1776 406 735 33 223 266 60 223 787 415 1,383 34 265 298 61 555 1008 193 513 35 198 230 62 138 709 193 538 36 111 288 63 205 57
10 332 607 37 159 197 64 128 7311 149 280 38 161 114 65 231 7912 157 324 39 256 108 66 187 8813 218 153 40 193 139 67 178 6414 158 134 41 95 162 68 138 5815 384 434 42 168 254 69 269 8716 418 297 43 219 424 70 181 18517 72 552 44 240 193 71 208 8718 341 384 45 273 403 72 164 3919 251 203 46 85 171 73 134 6920 109 255 47 141 219 74 163 8721 92 255 48 117 247 75 145 3522 92 98 49 263 266 76 254 22823 145 155 50 257 114 77 288 20824 175 132 51 197 119 78 80 6625 87 140 52 209 116 79 504 12226 75 405 53 152 12227 219 554 54 242 130
Table 3 Total abundance of zooplankton (no/m3) in Sarawak, Sabah and Brunei Darussalam waters.
Table 2 Biomass of zooplankton (ml./m3) in Sarawak, Sabah and Brunei Darussalam waters
S2/FB3<JUTAMAS>
-292-
Zooplankton AnalysesThirty-eight groups of zooplankton were found in this study. Major groups found in Sarawak,
Sabah and Brunei Darusalam as well as their total numbers and percentages are presented in Table 6.Per cent composition , average abundance and frequency of occurrence of some zooplankton July andMay are shown in Table 7-9. Pattern of distribution of the most common forms are shown in Appen-dix A (Figs. A3 - A18)Coelenterata
This phylum include Medusae and Siphonophora, comprising together 3.8 % of the total zoop-lankton population (Table 6). These plankters are major predators in the planktonic food web. In bothperiod, the Medusae found to be very common but in low number. Large number were observed nearBintulu in July (2 no/m3). While the number increase in May especially in Sarawak water, the highestnumber was 4 no/m3. However, most of the medusae found in neritic stations.
Siphonophora also found to be very common and in fare number in both period. In May, theirnumber was high in sarawak water but in July high number was found both in Sarawak and Bruneiwaters. Furthermore, the number of individual of siphonophora in May was lower than in July. Mostof them distributed in neritic stations.Ctenophora
The ctenophores formed less than 0.1 % of the total zooplankton population. The percent oc-currence was only 5 % in July and 11 % in May. The greatest number was 1 no/m3 in May.Mollusca
Molluscs were the second most abundant group of zooplankton, forming 8.9 % of the totalzooplankton population (Table 6). This group was composed of bivalve and gastropod veligers, theheteropod, the thecosomes (shelled pteropod), the gymnosomes (naked pteropod), nudibranchia (seaslug) and cephalopod larvae. Veliger larvae of gastropod (57.9 %) and bivalve (14.6 %) and thethecosomes (23.4 %) accounted for the majority of the planktonic molluscs.
Bivalve veligers were most abundant in neritic rather than oceanic stations. The amount ofthem was similar in both period. The highest number occurred in Sarawak water (41 no/m3) in May.
Gastropod veliger were most abundant in neritic rather than oceanic stations. In May, the amountof them was quite high in Sarawak water while during July the number was lower in the study areas.
The heteropod were very common in this study. Sarawak water showed higher abundance thanother areas. The highest number was 1 and 10 no/m3 in July and May respectively. Most of themdispersed neritic zone for both period.
The thecosomes (shelled pteropod) found to be very common for both period. The highestabundance was found in May (112 no/m3) which higher than in July especially in Sarawakwater.However, in May the thecosomes distributed neritic rather than oceanic stations while in theJuly the pattern of distribution were similar.
The gymnosomes (naked pteropod) were rare in July (28 % occurrence) but quite common inMay (35 % occurrence). Most of them distributed oceanic in Brunei and Sabah waters. They quiterare in Sarawak water. The highest abundance was only 1 no/m3 in both period.
Nudibranchia were found only in May in low number (1 no/m3) in one station.Cephalopod larvae were occasionally present in zooplankton samples. They formed less than 1
% of zooplankton population. The average number for both period was no differences. However, theycan be found neritic and oceanic stations.Cladocera
Cladocera formed only 1.4 % of the total zooplankton population but they were very commonin both period. Most of cladoceran distributed at neritic zone in Sarawak water for both period. Theaverage abundance was 3 and 6 no/m3 in July and May respectively.Ostracoda
Among the Crustacea, Ostracoda were second to Copepoda in abundance, but they comprised

S2/FB3<JUTAMAS>
-293-
only 10 % of the total zooplankton population. They observed to be very common but not in largenumber. In July showed higher abundance (average 29 no/m3) than in May (average 19 no/m3). Thedistribution pattern were similar for both neritic and oceanic stations in July. But most of them dis-persed neritic in May.Copopoda
Copepods were the most abundant in this study area, comprising 52 % of the total zooplanktonpopulation. The average number of copepod was 118 and 133 no/m3 in July and May respectively.They dispersed throughout the study areas.Cirrepedia
Cirripedia larvae were found to be very common for both period but in low number (average 1no/m3). The great number were found neritic in both season especially in Sarawak water and wererarely present at oceanic stations. Anyway, they can be found in Brunei water and Sabah water ingreat number in July as well. The distribution of larvae reflects that of the adults barnacles which aremostly benthic intertidal animals. This low overall abundance indicates the limited occurrence ofbarnacles along Sarawak, Sabah and Brunei water.Lucifer
Lucifer spp. were very common and formed only 0.5 % of the total zooplankton population.The highest number was 19 no/m3 in May. The average abundance showed no different in both pe-riod. Most of Lucifer spp. distributed neritic rather than oceanic especially in Sarawak water.Brachyura
Brachyura larvae were very common but low in number. They found most abundant at theneritic stations (near Bintulu and Kota Kinabaru) in July and near Miri in May. The average abun-dance of brachyura larvae was similar in both period (1 no/m3).Shrimp larvae
Caridea and Penaeidae larvae were regular component in the zooplankton population, consti-tuting 2.1 % of total zooplankton. The abundance was high at neritic stations for both period espe-cially in Sarawak water (28 and 36 no/m3 in July and May respectively). The average abundant showedno differences between both period.Phyllosoma
Phyllosoma larvae were occasionally present in zooplankton samples especially neritic sta-tions between Miri and Bintulu and the west of Sarawak water. The average abundance in both periodwere not difference.Mysidacea
Mysidacea were very common. They formed 0.4 % of total zooplankton. The most abundantfound in July (13 no/m3) while only 6 no/m3 in May in Sarawak water. Mysidacea distributed neriticand oceanic stations in both period.Euphausiacea
Euphausiacea were very rare in this study. They found only 8 % occurrence in July and 10 %occurrence in May.Anomura larvae
occurred regularly in the zooplankton samples. They found most abundant at neritic stationsespecially in Sarawak water and along the coast. The largest number was found in May (17 no/m3).The average abundance showed no differences between both period.Stomatopod
Stomatopod larvae were very common in July and common in May and occurred in low num-bers, forming 0.1 % of total zooplankton. The largest number was found in July (2 no/m3). Theaverage abundance showed no differences between both period.Other Crustacea
The remaining crustacea consisted of amphipod, isopod and cumercea. Amphipod were verycommon while isopod and cumercea were rare for both season. Amphipod dispersed throughout thewhole area in both season but in July, high number occurred neritic and oceanic stations while only

S2/FB3<JUTAMAS>
-294-
Table 4. Differences of total abundance and biomass of zooplankton from Sarawak, Sabah andBrunei Darussalam waters between July and May.
No. of Station Percentage No. of Station Percentage
Increase 32 40.51 29 36.71
Decrease 37 46.84 37 46.84
Constant 10 12.66 13 16.46
Abundance Biomass
P
Biomass 0.7684
Abundance 0.376
Table 5. Probability (p) of null hypothesis (significant p < 0.0500) from t-test for comparing biom-ass and abundance between July and May.
Taxon Totol Percentage Overall
with in group percentage
I. Coelenterata 1,464 - 3.83 A. Medusae 92 6.3 0.2 B. Siphonophora 1372 93.7 3.6II. Ctenophora 1.41 - <0.1III. Mollusca 3384.2 - 8.9 A. Bivalvia - veliger 492.9 14.6 1.3 B. Gastropoda 1. veliger 1960.9 57.9 5.1 2. Heteropod 122.1 3.6 0.3 3. Thecosomata 791.6 23.4 2.1 4. Gymnosomata 13.6 0.4 <0.1 5. Nudibranchia 0.5 <0.1 <0.1 C. Cephalopoda - larvae 2.8 <0.1 <0.1IV. Arthropoda 27096.8 - 71.1 A. Cladocera 549 2 1.44 B. Ostracoda 3818 14.1 10 C. Copepoda 19816 73.1 52 D. Cirripedia - larvae 123.3 0.5 0.3 E. Amphipoda, Isopoda, 1043 3.8 2.7 Cumercea F. Decapoda 1. Lucifer spp. 207.4 0.7 0.5 2. Brachyuran 53.7 0.2 0.1 3. Caridea and Penaeidae larvae 791.7 2.9 2.1 4. Phyllosoma larvae 6.9 <0.1 <0.1 5. Anomuran 396.8 1.5 1 G. Stomatopod larvae 34 0.1 0.1 H. Mysidacea 156 0.6 0.4 I. Euphausiacea 101 0.4 0.3VI. Chaetognatha 2969.2 - 7.8VII. Chordata 2461.8 - 6.5 A. Thaliacea 914.3 37.1 2.4 B. Lavacea - Oikopleura spp. 1145 46.5 3 C. Pyrosomata 8.8 0.4 <0.1 D. Fish egg and larvae 393.7 16 1VIII. Invertebrate larvae 720.9 - 1.9(Cyphonautes, actinotroch, polychaet larvae, brachiopod, echinodermata, ascidian)IX. Other 20.9 - <0.1(nemertean, platyhelminthes)
Grand total 38119.4 - 100
Table 6. Total number and percentages of major groups of zooplankton in Sarawak, Sabah andBrunei Darussalam waters at 79 stations
S2/FB3<JUTAMAS>
-295-
Rank Taxon Composition (%) Taxon Composition (%)
1 Copepoda 50.8 Copepoda 53.1
2 Ostracoda 12.7 Ostracoda 7.6
3 Chaetognatha 9.1 Chaetognatha 6.6
4 Gastropod larvae 4.4 Gastropod larvae 5.9
5 Siphonophora 4.3 Laevacean 4
6 Amphipoda 3.6 shelled Pteropod 3.3
7 Shrimp larvae 2.2 Siphonophora 3
8 Thaliacea 2.1 Thaliacea 2.7
9 Laevacean 1.9 Echinodermata 2.3
10 Anomura larvae 1.4 Cladocera 1.9
July May
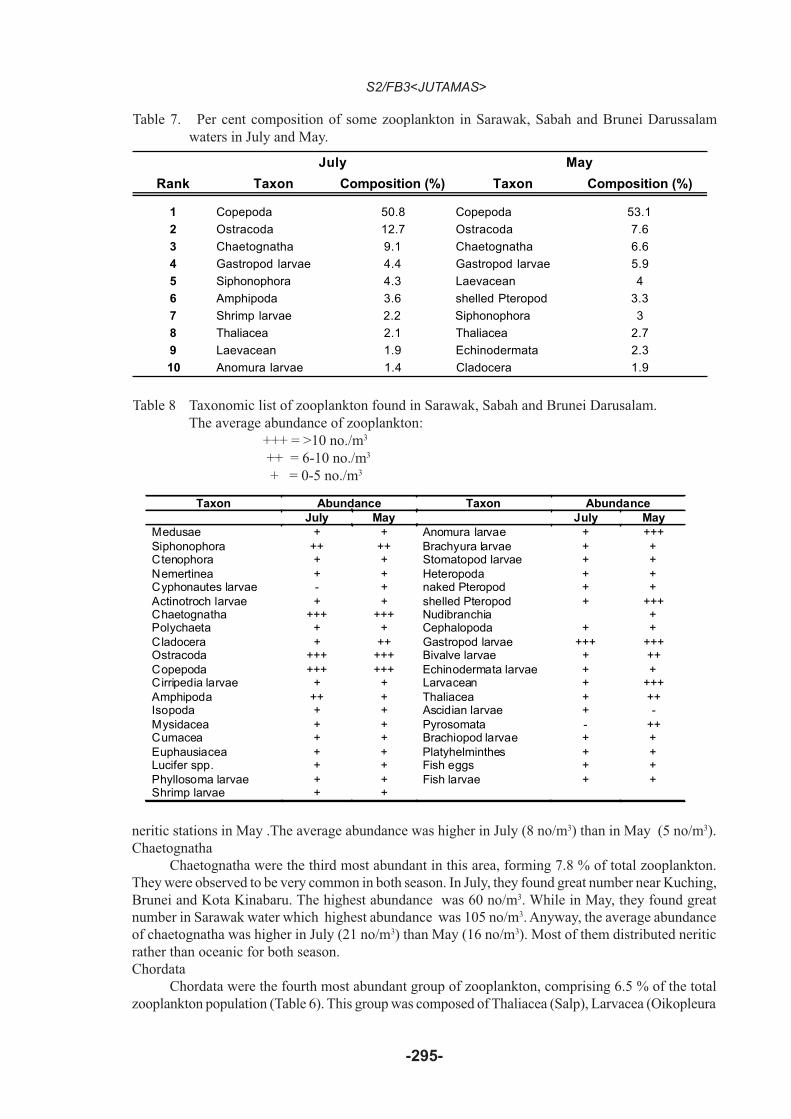
Table 7. Per cent composition of some zooplankton in Sarawak, Sabah and Brunei Darussalamwaters in July and May.
Taxon Abundance Taxon AbundanceJuly May July May
Medusae + + Anomura larvae + +++Siphonophora ++ ++ Brachyura larvae + +Ctenophora + + Stomatopod larvae + +Nemertinea + + Heteropoda + +Cyphonautes larvae - + naked Pteropod + +Actinotroch larvae + + shelled Pteropod + +++Chaetognatha +++ +++ Nudibranchia +Polychaeta + + Cephalopoda + +Cladocera + ++ Gastropod larvae +++ +++Ostracoda +++ +++ Bivalve larvae + ++Copepoda +++ +++ Echinodermata larvae + +Cirripedia larvae + + Larvacean + +++Amphipoda ++ + Thaliacea + ++Isopoda + + Ascidian larvae + -Mysidacea + + Pyrosomata - ++Cumacea + + Brachiopod larvae + +Euphausiacea + + Platyhelminthes + +Lucifer spp. + + Fish eggs + +Phyllosoma larvae + + Fish larvae + +Shrimp larvae + +
Table 8 Taxonomic list of zooplankton found in Sarawak, Sabah and Brunei Darusalam.The average abundance of zooplankton:
+++ = >10 no./m3
++ = 6-10 no./m3
+ = 0-5 no./m3
neritic stations in May .The average abundance was higher in July (8 no/m3) than in May (5 no/m3).Chaetognatha
Chaetognatha were the third most abundant in this area, forming 7.8 % of total zooplankton.They were observed to be very common in both season. In July, they found great number near Kuching,Brunei and Kota Kinabaru. The highest abundance was 60 no/m3. While in May, they found greatnumber in Sarawak water which highest abundance was 105 no/m3. Anyway, the average abundanceof chaetognatha was higher in July (21 no/m3) than May (16 no/m3). Most of them distributed neriticrather than oceanic for both season.Chordata
Chordata were the fourth most abundant group of zooplankton, comprising 6.5 % of the totalzooplankton population (Table 6). This group was composed of Thaliacea (Salp), Larvacea (Oikopleura

S2/FB3<JUTAMAS>
-296-
Taxon Frequency Taxon FrequencyJuly May July May
Medusae VC VC Anomura larvae VC VCSiphonophora VC VC Brachyura larvae VC VCCtenophora R R Stomatopod larvae VC CNemertinea VC R Heteropoda VC VCCyphonautes larvae - R naked Pteropod R CActinotroch larvae R R shelled Pteropod VC VCChaetognatha VC VC Nudibranchia - CPolychaeta VC VC Cephalopoda R RCladocera VC VC Gastropod larvae VC VCOstracoda VC VC Bivalve larvae VC VCCopepoda VC VC Echinodermata
larvaeVC VC
Cirripedia larvae VC VC Larvacean VC VCAmphipoda VC VC Thaliacea VC VCIsopoda R R Ascidian larvae R -Mysidacea VC VC Pyrosomata - CCumacea R R Brachiopod larvae C REuphausiacea R R Platyhelminthes R RLucifer spp. VC VC Fish eggs VC VCPhyllosoma larvae R - Fish larvae VC VCShrimp larvae VC VC
Table 9 Taxonomic list of zooplankton found in Sarawak, Sabah and Brunei Darusalam. Frequencyof occurence: R = Rare , C = Common, VC = Very Common.
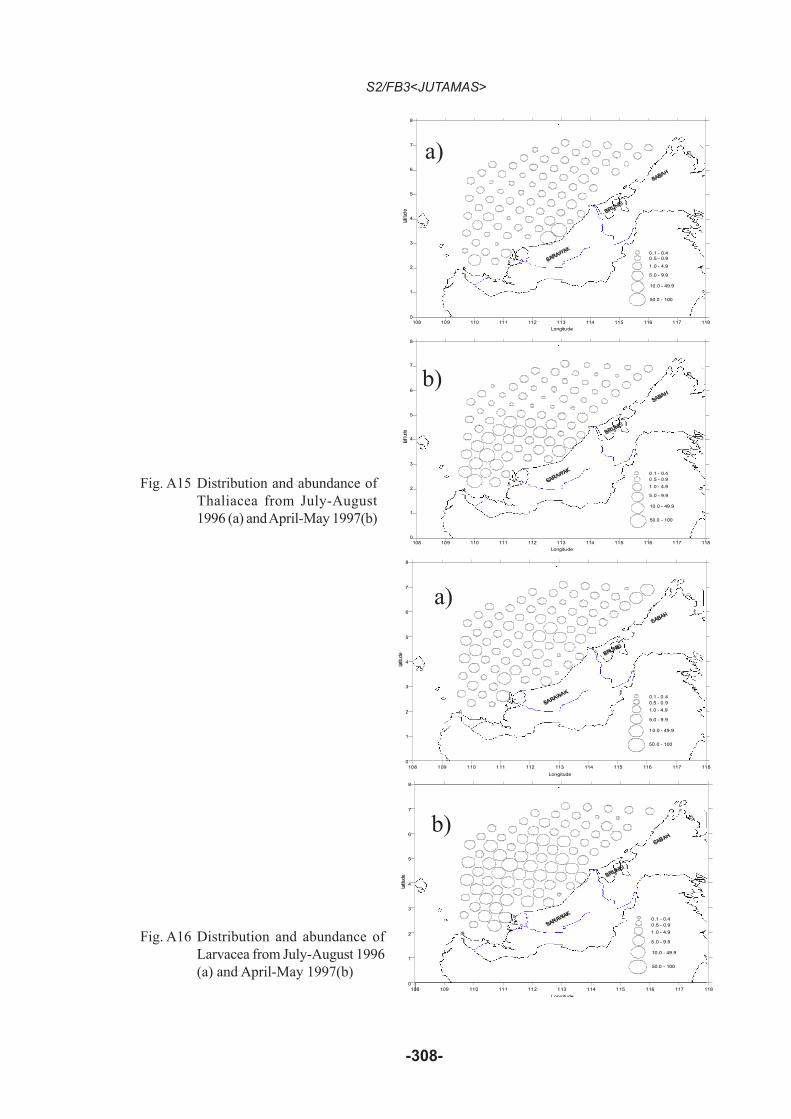
spp.) Pyrosomata and fish eggs and larvae. Thaliacea (Salp) were very common organisms. The highest number was found in July (113
no/m3) near Bintulu (St. 31). Most of them distributed neritic and oceanic. However, the averageabundance in both season showed no differences.
Larvacea (Oikopleura spp.) were the second most abundant group of chordata (46.5 % ) andcomprised 3 % of total zooplankton. They found to be very common for both season. The highest wasfound at St. 27 (51 no/m3) in May. The average abundance of larvacea was higher in May (10 no/m3)than in July (4 no/m3). However, the distribution pattern were similar for both neritic and oceanicstations.
Pyrosomata were seldom in this study. They found only in May in fair number. The distribu-tion was scattered throughout the study area.
Fish eggs and larvae were very common but in low number, forming only 1 % of total zoop-lankton. Except for station 37 which found high number of fish eggs (104 no/m3). The highest numberof fish larvae was 7 no/m3 at St. 16 in July. Fish eggs and larvae found to be more abundant neritic inboth season. The average abundance showed no differences between July and May.Invertebrate larvae
Invertebrate larvae, comprising 1.9 % of zooplankton population, composed of cyphonautes,actinotroch, polychaet, brachiopod, echinodermata and ascidian.
Cyphoneutes were found only in May while ascidian found only in July in low number. Theydistributed neritic rather than oceanic.
Actinotroch found only 1 and 3 stations in July and May in low number. Brachyopod wereoccasionally present but not high in number. Most of them distributed neritic rather than oceanic.
Polychaet larvae were very common organisms but in low number. The highest number was 3no/m3 at station 70 in May. The average abundance in both season showed no difference. The distribu-tion was scattered throughout the study area.
Echinodermata larvae consisted of asteroidea (starfish larvae), holothuroidea (sea cucumberlarvae), echinoidea (sea urchin larvae) and ophiuroidea (brittle star larvae). They were the regularcomponent in the zooplankton samples but in low number. The average abundant in May (7 no/m3)was a little bit higher than in July (2 no/m3). Anyway, the abundance occurred in the neritic stationsin both period.Other

S2/FB3<JUTAMAS>
-297-
The remaining zooplankton found in the samples comprising of nemertean and platyhelminthes.Both of them formed less than 0.1 % of total zooplankton.The relationship between fish larvae and their predators
Large carnivorous zooplankters namely, Medusae, Siphonophora, Ctenophora and Chaetognathaare planktonic predators on fish larvae. In this paper will concern only Medusae, Siphonophora andChaetognatha. The relationship between fish larvae and their predators is shown in Fig. 2-5. Thecorrelation between fish larvae and Medusae, Siphonophora and Chaetognatha was 0.5058, 0.5531and 0.7204 , respectively, at 95 % confidence. Ctenophora present in small number in the samples sothat their relationship with fish larvae was not studied.
The relationship between fish larvae and their preyThe relationship between fish larvae and copepoda is shown in Fig. 6. The correlation of fish
larvae and copeoda which were their prey was 0.7132 at 95 % confidence.
Discussion
The biomass and abundance of zooplankton in Sarawak, Sabah and Brunei Darusalam’s watersin this investigation was lower than in the Gulf of Thailand and the east coast of Malaysia Peninsularin both period (Jivaluk, in print). The higher biomass were in the areas where the water depth less than200 m.(neritic zone), mainly in Sarawak water. This result agreed with Santhankumari (1991) whofound the standing stock of zooplankton was relatively high in the neritic zone of the west coast ofIndia. Abundance of zooplankton also showed the same phenomenon particularly in May. Fallahi(1993) found that zooplankton in the southern part of the Caspian Sea showed decrease in the abun-dance from littoral zone to the pelagic zone . It was concluded that Sarawak water is more productivethan other area in this study. There were no significant difference of biomass and abundance betweenMay and July.
The result of this investigation indicated that Copepods was the most dominant group followedby Ostracoda and Chaetognatha. Although species composition of Copepods and other groups wasnot studied. However, geographical diversity gradients obtained in this study, based on the groups atthe primary sorting level, will serve to give an idea of geographical distributions of animal communi-ties.
It is obvious that collecting-time affect the zooplankton biomass, abundance and their distribu-tion. In May, many organisms were increase in number such as Medusae, Ctenophora, Cladocera,Copepoda, phyllosoma larvae, brachyura larvae, Thecosomata, Heteropoda, Gastropoda larvae,Appendicularia, Thaliacea and fish eggs. Some organisms were decrease such as Siphonophora,Chaetognatha, Ostracoda, Amphipoda, Gymnosomata. Sribyatta (1996) found higher values of zoop-lankton in the northeast monsoon and southwest monsoon in the Gulf of Thailand.
Many papers notes that the samples which contained the highest number of organism such asEuphausiacea (Barange, 1989), Mysidacea (Mathew et al. 1990), phyllosoma larvae (Kathirvel, 1990,Kathirvel and James, 1990), stomatopod larvae (Reddy and Shanbhogue, 1990) and cephalopod lar-vae (Sarvesan and Meiyappan, 1990, Meiyappan et al. 1990) as well as zooplankton biomass(Krishnakumari and Loswami, 1993, Koppelmann and Weikert, 1997) were all collected during night, suggesting that they showed a pronounced diurnal vertical migration(Paulinose and Aravindakshan,1977).
There are many factors both biotic and abiotic which involve the variations in larval fish sur-vival. Predators and preys are one of the most important biotic causes (Lasker and Smith, 1977).Large carnivorous zooplankters namely, Medusae, Siphonophora, Ctenophora and Chaetognatha areplanktonic predators on fish larvae. [Fraser (1969)], [Suwanrunpha (19832)]. The consumption of fishlarvae by each medusae varying from 50 to 15,000. In this investigation, indicated a high correlationbetween fish larvae and their predator, especially chaetognatha. Thus their presence in numbers ofzooplankton could have a serious effect on the recruitment of larval fish and could be very significant

S2/FB3<JUTAMAS>
-298-
for the fish stocks and for the fishing industry.Numerous studies have shown that small zooplankton, particularly copepods, eggs and larval
stages of crustaceans, larval molluscs, ciliates and other unicellular organisms, are important compo-nents of larval fish food [Houde & Lovdal (1982)], [Balbontin et al. (1986)], [Nagasawa (1993)],[Anderson (1994)]. In this investigation found a high correlation between fish larvae and their prey,especially copepods. Positive correlations indicated that fish trend to aggregate where the standingcrop of copepods which were their food is greatest. But Sameoto (1972) found no significant correla-tion between biomass of copepods and the estimated abundance of herring larvae.
Many works point out that zooplankton was influencing on fisheries. Krisshnapillai and Bhat(1981) found that the fish catch/hour was maximum in October which was the most productive monthof the zooplankton. Jacob et al. (1981) noted that the peak periods in the zooplankton biomass werefound to coincide with the peak seasons of pelagic fisheries. Suseelan et al.(1985) also found thatpelagic fish catch, consisting mostly of anchovies and lesser sardines, showed clear peaks, closelyfollowing the primary and secondary peaks of zooplankton. Unfortunately, information about thefisheries in this investigated areas was not available, so that relationship of fish catch and zooplanktonabundance was not studied
Reference
Anderson, J.T.: Feeding ecology and condition of larval and pelagic juvenile redfish, Sebastes spp.Mar. Ecol. Prog. Ser., 104(3), 211-226 (1994).
Balbontin, F., M., Garreton & J. Neuling: Stomach content and prey size of the fish larvae fromBransfield Strait (SIBEX-Phase 2, Chile). Ser. Cient. Inst. Antart. Chil.,35, 125-144 (1986).
Barange, M.: Daily variation of the zooplankton at a mix station off Namibia. Collect. Sci. Pap.,16(2),11-23 (1989).
Beales, R.W.: Brunei fisheries and research. ICLARM NEWSL., 5(1), 20-21 (1982).Cushing, D.H.: Marine ecology and fisheries, Cambridge, 1975, pp.1-278.Fallahi, M.: Plankton survey in the southern part of the Caspian Sea. Iran. Fish Bull., 4, 3-7 (1993).Fraser, J.H.: Experimental feeding of some Medusae and Chaetognatha. J. Fish. Res. Bd. Cand., 26,
1743-1762 (1969).Houde, E. & Lovdal, J.D.: Variability in Ichthyoplankton and microzooplankton abundance and feed-
ing of fish larvae in Biscayne Bay, Florida. Est. Coast. Sh. Sci., 18, 403-419 (1982).Ismail, A.: Heavy metal concentration in sediments off Bintulu, Malaysia. Mar. Pollut. Bull., 27(12),
706-707 (1993).Jacob, R.M., N.K. Ramachandram & K.R. Vasantha.: Zooplankton in relation to hydrography and
pelagic fisheries in the inshore waters of Virhinjam, Trivandrum. J. Mar. Biol. Assoc. India.,23(1-2), 62-76 (1981).
Jivaluk, J.: Distribution, abundance and composition of zooplankton in the Gulf of Thailand and theeast coast of Malaysia Peninsular. inprint.
Kathirvel, M.: On the collections of phyllosoma larvae by Isaacs-Kidd Midwater Trawl from the westcoast of India. Proc. of the First Workshop of Scientific Result of FORV, Sagar Sampada, 5-7June 1989, Cochin. Publish by Central Marine Fisheries Research Institute, Cochin (India),1990,pp. 141-146.
Kathirvel, M. & D.B. James: The phyllosoma larvae from Andaman and Nicobar waters. Proc. of theFirst Workshop of Scientific Result of FORV, Sagar Sampada, 5-7 June 1989, Cochin. Publishby Central Marine Fisheries Research Institute, Cochin (India), 1990, pp. 147-150.
Koppelmann, R & H. Weikert: Deep Arabian Sea mesozooplankton distribution. Intermonsoon, Oc-tober 1995. Mar. Biol., 129(3), 549-560 (1997).
Krishnakumari, L. & L. Loswami: Biomass and biochemical composition from northwest Bay ofBengal during January 1990. Indian J. Mar. Sci., 22(2), 143-145 (1993).
Krisshnapillai, S. & G.J. Subramonia Bhat.: Note on the abundance of zooplankton and trawler catch

S2/FB3<JUTAMAS>
-299-
during the post monsoon months along the northwest coast of India. J. Mar. Biol. Assoc. In-dia., 23(1-2), 208-21 (1981).
Lasker, R., and P. Smith: Estimation of the effects of environmental variations on the eggs and larvaeof the northern anchovy. Calif. Coop. Oceanic Fish. Invest. Rep., 19,128-137, (1977)
Lee, S.B. Country situation paper - Malaysia (Sarawak). The status at the rural coastal fisheries inSarawak. in Report of the Workshop on the Development of the Rural Coastal Fisheries, 15-24March 1982, Manila, Philippines, Publ. by FAO/UNDP, Manila (Philippines),1982, pp. 24-33.
Mathew, K.J., G. Anthony, T.S. Naomi & K. Solomon: On the quantitative abundance of Mysidaceacollected from the eastern Arabian Sea and the Bay of Bengal. Proc. of the First Workshop ofScientific Result of FORV, Sagar Sampada, 5-7 June 1989, Cochin. Publish by Central MarineFisheries Research Institute, Cochin (India), 1990, pp. 109-114.
Meiyappan, M.M., R. Sarvesan & K.P. Nair: Preliminary studies of the distribution and abundance ofplanktonic cephalopod in the India Exclusive Economic Zone and adjacent seas. Proc. of theFirst Workshop of Scientific Result of FORV, Sagar Sampada, 5-7 June 1989, Cochin. Pub-lish by Central Marine Fisheries Research Institute, Cochin (India), 1990, pp. 115-121.
Nagasawa, T.: Planktonic larvae and pelagic juveniles of the rockfish, Sebastes minor (Scorpaenidae).Jap. J. Ichthyol., 40(1), 87-97 (1993).
Paulinose, V.T. and P.N. Aravindakshan: Zooplankton biomass, abundance and distribution in theNorth and Northern Arabian Sea. Proceeding of the Symposium on Warm Water Zooplankton.National Institute of Oceanography, GOA, India, 1977, pp. 132-136.
Reddy, H.R.V. & S.L. Shanbhogue: Distribution and abundance of stomatopod larvae in the EEZ ofIndia. Proc. of the First Workshop of Scientific Result of FORV, Sagar Sampada, 5-7 June1989, Cochin. Publish by Central Marine Fisheries Research Institute, Cochin (India), 1990,pp. 122-130.
Sameoto, D.D.: Distribution of Herring (Cluplea harengus) larvae along the southern coast of NovaScotia with observations on their growth and condition factor. J. Fish. Res. Bd. Cand., 29, 507-515 (1972).
Santhankumari, V.: Zooplankton standing stock and community structure along Karnataka Coast,west coast of India. J. India. Fish Assoc., 21, 21-30 (1991).
Sarvesan, R. & M.M. Meiyappan: Qualitative and quantitative distribution ofplanktonic cephalo-pods in the Exclusive Economic Zone of the west coast of India. Proc. of the First Workshop ofScientific Result of FORV, Sagar Sampada, 5-7 June 1989, Cochin. Publish by Central MarineFisheries Research Institute, Cochin (India), 1990, pp. 101-108.
Sribyatta, P.: Variation of zooplankton in the Gulf of Thailand 1976-1994. Tech.Paper No 4/2539.Mar. Fish. Envi. Group, Mar. Fish. Div., Dept. of Fish., 1996, 58 p.
Suseelan C., P.P. Pillai, M.A. Pillai and K.R. Nair: Some observations on the trend of Zooplanktonand its probable influence on local pelagic fisheries at Colachel during 1973-74. Indian J.Fish., 32(3), 375-386 (1985).
Suwanrumpa, W: Zooplankton in the Inner Gulf of Thailand. I. Seasonal abundance and distributionof zooplankton 1975-1976. Technical Paper No 22/6. Mar. Fish. Envi. Group, Mar. Fish. Div.,Dept. of Fish., 1980, 23 p.
Suwanrumpa, W.: Zooplankton in the western Gulf of Thailand. II. Relation of zooplankton displace-ment volumes and fish eggs, fish larvae abundance collected during January to October, 1981.Tech.Paper No 25/12. Mar. Fish. Envi. Group, Mar. Fish. Div., Dept. of Fish., 19831, 21 p.
Suwanrumpa, W.: Zooplankton in the western Gulf of Thailand. III. Relation between the distribu-tion of zooplankton predators and fish larvae collected during January to October, 1981.Tech.Paper No 25/13. Mar. Fish. Envi. Group, Mar. Fish. Div., Dept. of Fish., 19832, 18 p.
Suvapepun, P.: Variability of plankton quantity in the Inner Gulf of Thailand. Mar. Fish. Lab., Techni-cal Paper No. 7/1977, 1977, 12 p.
Wong, L.M.: Country situation paper - Malaysia (Sabah). The status at the rural fisheries in Sabah. inReport of the Workshop on the Development of the Rural Coastal Fisheries, 15-24 March1982, Manila, Philippines, Publ. by FAO/UNDP, Manila (Philippines), 1982, pp. 24-33.

S2/FB3<JUTAMAS>
-300-
Fig. 2 Relationship between fishlarvae (y) and Medusae(x)at 95% confidence
Fig. 3 Relationship between fishlarvae (y) andSiphonophora (x) at 95%confidence
Fig. 4 Relationship betweenfish larvae (y) andChaetognatha (x) at95% confidence
Fig. 5 Relationship betweenfish larvae (y) andpredators (x) (Medusae+ Siphonophora+Chartognatha at 95%confidence
Fig. 5 Relationship betweenfish larvae (y) andCopepoda (x) at 95%confidence

S2/FB3<JUTAMAS>
-301-
Fig. A1 Biomass of total zooplanktonfrom July-August 1996 andApril-May 1997
108 109 110 11 1 112 11 3 114 115 116 117 118
Lon gitude
0
1
2
3
4
5
6
7
8
Latit
ude
0.01 - 0.190.20 - 0.39
0.40 - 0.59
0.60 - 0.79
>100
0.80 - 0.99
108 10 9 110 111 112 113 114 115 116 117 118
Lon gitude
0
1
2
3
4
5
6
7
8
Latit
ude
0.01 - 0.190.20 - 0.39
0.40 - 0.59
0.60 - 0.79
> 100
0.80 - 0.99
Fig. A2 Abundance of total zoop-lankton from July-August1996 and April-May 1997
10 8 109 110 11 1 112 113 114 115 116 117 118
Longitude
0
1
2
3
4
5
6
7
8
Latit
ude
1 - 99
100 - 249
250 - 499
500 - 749
1000 - 15 00
750 - 999
108 109 11 0 111 112 113 114 115 116 117 118
L ongitude
0
1
2
3
4
5
6
7
8
Latit
ude
1 - 99100 - 24 9
250 - 49 9
500 - 74 9
1000 - 1500
750 - 999

S2/FB3<JUTAMAS>
-302-
108 109 110 111 112 113 114 115 116 117 11
Longitude
0
1
2
3
4
5
6
7
8
Latitu
de
0.01 - 4.95.0 - 9.9
10.0 - 14.9
15.0 - 19.9
25.0 - 80.0
20.0 - 24.9
108 109 110 111 112 113 114 115 116 117 118
Longitude
0
1
2
3
4
5
6
7
8
Latitu
de
0.01 - 4.95.0 - 9.9
10.0 - 14.9
15.0 - 19.9
25.0 - 80.0
20.0 - 24.9
108 109 110 111 112 113 114 115 116 117 118
Longitude
0
1
2
3
4
5
6
7
8
Latitu
de
0.01 - 9.910.0 - 24.9
25.0 - 49.9
50.0 - 99.9
150 - 250
100 - 149.5
108 109 110 111 112 113 114 115 116 117 118
Longitude
0
1
2
3
4
5
6
7
8
Latitu
de
0.01 - 9.910.0 - 24.9
25.0 - 49.9
50.0 - 99.9
150 - 250
100 - 149.5
Fig. A3 Distribution and abundance ofSiphonphora from July-August1996 (a) and April-May 1997(b)
a)
b)
a)
b)
Fig. A4 Distribution and abundance ofGastropod from July-August1996 (a) and April-May 1997(b)

S2/FB3<JUTAMAS>
-303-
108 109 110 111 112 113 114 115 116 117 118
Longitude
0
1
2
3
4
5
6
7
8
Latitu
de
0.1 - 0.40.5 - 0.9
1.0 - 4.9
5.0 - 9.9
50.0 - 120.0
10.0 - 49.9
108 109 110 111 112 113 114 115 116 117 118
Longitude
0
1
2
3
4
5
6
7
8
Latitu
de
0 .1 - 0.40.5 - 0.9
1.0 - 4.9
5.0 - 9.9
50.0 - 120.0
10.0 - 49.9
108 109 110 111 112 113 114 115 116 117 118
Longitude
0
1
2
3
4
5
6
7
8
Latitu
de
0 .01 - 0.040.05 - 0.09
0.10 - 0.14
0.15 - 0.19
> 0.25
0.20 - 0.24
108 109 110 111 112 113 114 115 116 117 118
Longitude
0
1
2
3
4
5
6
7
8
L ati tu
de
S ARAWAK
BRUNEI
S AB AH
0.01 - 0.040.05 - 0.09
0.10 - 0.14
0.15 - 0.19
> 0.25
0.20 - 0.24
Fig. A5 Distribution and abundance ofThecosomata from July-August1996 (a) and April-May 1997(b)
a)
b)
a)
b)
Fig. A6 Distribution and abundance ofCephalopod larvae from July-August 1996 (a) and April-May1997(b)

S2/FB3<JUTAMAS>
-304-
108 109 110 111 112 113 114 115 116 117 118
Longitude
0
1
2
3
4
5
6
7
8
Latitu
de
0.1 - 0.40.5 - 0.9
1.0 - 4.9
5.0 - 9.9
50.0 - 100
10.0 - 49.9
108 109 110 111 112 113 114 115 116 117 118
Longitude
0
1
2
3
4
5
6
7
8
Latitu
de
0.1 - 0.40.5 - 0.9
1.0 - 4.9
5.0 - 9.9
50.0 - 100
10.0 - 49.9
108 109 110 111 112 113 114 115 116 117 118
Longitude
0
1
2
3
4
5
6
7
8
Latitu
de
0.1 - 9.910.0 - 24.9
25.0 - 49.9
50.0 - 99.9
150.0 - 200.0
100.0 - 149.9
108 109 110 111 112 113 114 115 116 117 118
Longitude
0
1
2
3
4
5
6
7
8
Latitu
de
0.1 - 9.9
10.0 - 24.9
25.0 - 49.9
50.0 - 99.9
100.0 - 149.9
150.0 - 200.0
Fig. A7 Distribution and abundance ofCladocera from July-August1996 (a) and April-May 1997(b)
a)
b)
a)
b)
Fig. A8 Distribution and abundance ofOstracoda from July-August1996 (a) and April-May 1997(b)

S2/FB3<JUTAMAS>
-305-
108 109 110 111 112 113 114 115 116 117 118
Longitude
0
1
2
3
4
5
6
7
8
Latitu
de
0 .1 - 4.95.0 - 9.9
10.0 - 49.9
50.0 - 99.9
> 500
100 - 499.9
108 109 110 111 112 113 114 115 116 117 118
Longitude
0
1
2
3
4
5
6
7
8
Latitu
de
0.1 - 4.95.0 - 9.9
10.0 - 49.9
50.0 - 99.9
> 500
100 - 499.9
108 109 110 111 112 113 114 115 116 117 118
Longitude
0
1
2
3
4
5
6
7
8
Latit
ude
0.01 - 0.490.50 - 0.99
1.00 - 2.49
2.50 - 4.99
7.50 - 10.0
5.00 - 7.49
108 109 110 111 112 113 114 115 116 117 118
Longitude
0
1
2
3
4
5
6
7
8
Latit
ude
0.01 - 0.490.50 - 0.99
1.00 - 2.49
2.50 - 4.99
7.50 - 10.0
5.00 - 7.49
Fig. A9 Distribution and abundance ofCopepoda from July-August1996 (a) and April-May 1997(b)
a)
b)
a)
b)
Fig. A10 Distribution and abundance ofbrachyura from July-August1996 (a) and April-May 1997(b)

S2/FB3<JUTAMAS>
-306-
11
108 109 110 111 112 113 114 115 116 117 118
Longitude
0
1
2
3
4
5
6
7
8
Latitu
de
0.1 - 4.95.0 - 9.9
10.0 - 14.9
15.0 - 19.9
25.0 - 80.0
20.0 - 24.9
108 109 110 111 112 113 114 115 116 117 118
Longitude
0
1
2
3
4
5
6
7
8
Latitu
de
S ARAWAK
BRUNEI
S AB AH
0.1 - 4.95.0 - 9.9
10.0 - 14.9
15.0 - 19.9
25.0 - 80.0
20.0 - 24.9
108 109 110 111 112 113 114 115 116 117 118
Longitude
0
1
2
3
4
5
6
7
8
Latitu
de
0.01 - 0.040.05 - 0.09
0.10 - 0.14
0.15 - 0.19
> 0.25
0.20 - 0.24
108 109 110 111 112 113 114 115 116 117 118
Longitude
0
1
2
3
4
5
6
7
8
L ati tu
de
0.01 - 0.040.05 - 0.09
0.10 - 0.14
0.15 t- 0.19
> 0.25
0.20 - 0.24
Fig. A11 Distribution and abundance ofshrimp larvae from July-August1996 (a) and April-May 1997(b)
a)
b)
a)
b)
Fig. A12 Distribution and abundance ofPhyllosoma larvae from July-August 1996 (a) and April-May1997(b)

S2/FB3<JUTAMAS>
-307-
108 109 110 111 112 113 114 115 116 117 118
Longitude
0
1
2
3
4
5
6
7
8
Latit
ude
0.01 - 0.090.10 - 0.49
0.50 - 0.99
1.00 - 1.49
2.00 - 5.00
1.50 - 1.99
108 109 110 111 112 113 114 115 116 117 118
Longitude
0
1
2
3
4
5
6
7
8
Latit
ude
0.01 - 0.090.10 - 0.49
0.50 - 0.99
1.00 - 1.49
2.00 - 5.00
1.50 - 1.99
108 109 110 111 112 113 114 115 116 117 118
Longitude
0
1
2
3
4
5
6
7
8
Latitu
de
0.1 - 9.910.0 - 19.9
20.0 - 29.9
30.0 - 39.9
> 50.0
40.0 - 49.9
108 109 110 111 112 113 114 115 116 117 118
Longitude
0
1
2
3
4
5
6
7
8
Latitu
de
0.1 - 9.910.0 - 19.9
20.0 - 29.9
30.0 - 39.9
> 50.0
40.0 - 49.9
Fig. A13 Distribution and abundance ofStomatopod larvae from July-August 1996 (a) and April-May1997(b)
a)
b)
a)
b)
Fig. A14 Distribution and abundance ofChaetognatha from July-August1996 (a) and April-May 1997(b)
S2/FB3<JUTAMAS>
-308-
108 109 110 111 112 113 114 115 116 117 118
Longitude
0
1
2
3
4
5
6
7
8
Latitu
de
0 .1 - 0.40.5 - 0.9
1.0 - 4.9
5.0 - 9.9
50.0 - 100
10.0 - 49.9
108 109 110 111 112 113 114 115 116 117 118
Longitude
0
1
2
3
4
5
6
7
8
Latitu
de
0 .1 - 0.40.5 - 0.9
1.0 - 4.9
5.0 - 9.9
50.0 - 100
10.0 - 49.9
108 109 110 111 112 113 114 115 116 117 118
Longitude
0
1
2
3
4
5
6
7
8
Latitu
de
0.1 - 0.40.5 - 0.9
1.0 - 4.9
5.0 - 9.9
50.0 - 100
10.0 - 49.9
108 109 110 111 112 113 114 115 116 117 118
Longitude
0
1
2
3
4
5
6
7
8
Latitu
de
0 .1 - 0.40.5 - 0.9
1.0 - 4.9
5.0 - 9.9
50.0 - 100
10.0 - 49.9
Fig. A15 Distribution and abundance ofThaliacea from July-August1996 (a) and April-May 1997(b)
a)
b)
a)
b)
Fig. A16 Distribution and abundance ofLarvacea from July-August 1996(a) and April-May 1997(b)

S2/FB3<JUTAMAS>
-309-
108 109 110 111 112 113 114 115 116 117 118
Longitude
0
1
2
3
4
5
6
7
8
Latitu
de
0 .1 - 0.40.5 - 0.9
1.0 - 1.4
1.5 - 1.9
> 2.5
2.0 - 2.4
108 109 110 111 112 113 114 115 116 117 118
Longitude
0
1
2
3
4
5
6
7
8
Latitu
de
0.1 - 0.40.5 - 0.9
1.0 - 1.4
1.5 - 1.9
> 2.5
2.0 - 2.4
108 109 110 111 112 113 114 115 116 117 118
Longitude
0
1
2
3
4
5
6
7
8
L ati tu
de
0.1 - 0.91.0 - 1.9
2.0 - 2.9
3.0 - 3.9
5.0 - 7.0
4.0 - 4.9
108 109 110 111 112 113 114 115 116 117 118
Longitude
0
1
2
3
4
5
6
7
8
Latitu
de
0.1 - 0.91.0 - 1.9
2.0 - 2.9
3.0 - 3.9
5.0 - 7.0
4.0 - 4.9
Fig. A17 Distribution and abundance offish eggs from July-August1996 (a) and April-May 1997(b)
a)
b)
a)
b)
Fig. A18 Distribution and abundance offish larvae from July-August1996 (a) and April-May 1997(b)