distribution, access and application of agricultural inputs
TRANSCRIPT

DISTRIBUTION, ACCESS AND APPLICATION OF AGRICULTURAL
INPUTS
Final Report
September 2012
STUDY COMMISSIONED BY AGRICULTURAL COUNCIL OF TANZANIA
AND CONDUCTED BY
Match Maker Associates Limited

Access, distribution and application of agricultural inputs
i
TABLE OF CONTENTS
LIST OF FIGURES ................................................................................................................................. II
LIST OF TABLES ................................................................................................................................... II
ABBREVIATIONS AND ACRONYMS ..................................................................................................... II
DEFINITION OF TERMS ..................................................................................................................... VI
ACKNOWLEDGEMENTS AND DISCLAIMER ...................................................................................... VIII
EXECUTIVE SUMMARY ...................................................................................................................... IX
1.0 INTRODUCTION ........................................................................................................................ 1 1.1 BACKGROUND ................................................................................................................................ 1 1.2 STUDY OBJECTIVES .......................................................................................................................... 1 1.3 APPROACH AND METHODOLOGY OF THE STUDY .................................................................................... 1 1.4 LIMITATIONS TO THE STUDY .............................................................................................................. 2 1.5 REPORT LAYOUT ............................................................................................................................. 2
2.0 CONTEXT ANALYSIS OF NATIONAL INPUT SUPPLY SYSTEM ...................................................... 3 2.1 TANZANIA STRATEGIES TO ENHANCE INPUT SYSTEMS .............................................................................. 3 2.2 COUNTRY SITUATION - ACTORS AND FACTORS ..................................................................................... 4
2.1.1 Seeds................................................................................................................................. 4 2.2.2 Improved Livestock Breed .................................................................................................. 8 2.2.3 Fertilizers ......................................................................................................................... 11 2.2.4 Agro-Chemicals ................................................................................................................ 14
2.2 OUTPUT MARKETS ........................................................................................................................ 16
3.0 FINDINGS ............................................................................................................................... 18 3.1 COFFEE ....................................................................................................................................... 18
3.1.1 Coffee agro inputs access, distribution and application ................................................. 24 3.2 CEREALS (MAIZE AND PADDY).......................................................................................................... 33
3.2.1 Cereals agro inputs access, distribution and application ............................................... 43 3.3 CATTLE ....................................................................................................................................... 60
3.3.1 Cattle agro inputs access, distribution and application ................................................. 61 3.4 TOMATOES .................................................................................................................................. 66
3.4.1 Tomatoes agro inputs access, distribution and application ........................................... 66 3.5 CASHEW NUTS ............................................................................................................................. 72
3.5.1 Cashew nuts agro inputs access, distribution and application ....................................... 73 3.6 CASES FROM KENYA AND MALAWI ................................................................................................... 82
3.6.1 Kenya ............................................................................................................................... 82 3.6.2 Malawi ............................................................................................................................. 83 3.6.3 Summary of lessons from Kenya and Malawi .................................................................. 90
4.0 SYNTHESIS OF KEY FINDINGS .................................................................................................. 92
5.0 RECOMMENDATIONS ............................................................................................................. 94 5.1 GENERAL RECOMMENDATIONS ........................................................................................................ 94 5.2 RECOMMENDED SPECIFIC INTERVENTIONS ......................................................................................... 95
6.0 POLICY BRIEFS ........................................................................................................................ 96 6.1 BACKGROUND .............................................................................................................................. 96 6.2 AVAILABILITY, ACCESSIBILITY AND UTILIZATION OF INPUTS IN TANZANIA ................................................... 97 6.3 PROPOSED POLICY BRIEFS ............................................................................................................... 98
6.3.1 Enhancing access to finance by various agro inputs chain actors ................................... 99 6.3.2 Combating counterfeit agro inputs and their supply systems ....................................... 103 6.3.3 Promoting private sector engagement in extension service delivery ............................ 107 6.3.4 Agreed way Forward for ACT policy lobbying and advocacy ......................................... 111
7.0 REFERENCES ......................................................................................................................... 112
8.0 ANNEXES .................................................................................................................................. 114

Access, distribution and application of agricultural inputs
ii
8.1 LESSONS ON “SMART” FERTILIZER SUBSIDY PROGRAMS ...................................................................... 114 8.2 STATUS OF LOBBYING AND ADVOCACY ON INPUT SUPPLY SECTOR IN TANZANIA ........................................ 117 8.3 LISTS AND CONTACTS OF PEOPLE INTERVIEWED ................................................................................. 120
LIST OF FIGURES FIGURE 1: COUNTRIES OF ORIGIN FOR IMPORTED SEEDS ........................................................................................................... 5 FIGURE 2: MAIN IMPORTERS OF FERTILIZERS IN 2011 ............................................................................................................12 FIGURE 3: THE EFFECT OF EXPORT BAN ON MAIZE PRICE IN DAR-ES-SALAAM .........................................................................17 FIGURE 4: CASH FLOWS OF A COFFEE FARMER IN MBINGA .....................................................................................................28 FIGURE 5:TRENDS IN DETERMINING TRANSPORT CHARGES .....................................................................................................30 FIGURE 6: HOUSEHOLD CASH-FLOW DYNAMICS IN THREE VILLAGES (MOROGORO REGION) ..................................................49 FIGURE 7 : CASH-FLOW DYNAMICS FOR SMALL CASHEW FARMERS ..........................................................................................74 FIGURE 8: A COMPARISON OF SOURCES OF CALORIES BETWEEN TANZANIA AND MALAWI. ..................................................84 FIGURE 9: RAINFALL AND MAIZE PRODUCTION IN MALAWI .....................................................................................................85 FIGURE 10: THE PROPOSED THREE POLICY ADVOCACY BRIEFS ..................................................................................................98 FIGURE 11: KEY STAKEHOLDERS FOR INPUTS ACCREDITATION AND MONITORING QUALITY ................................................. 105
LIST OF TABLES TABLE 1: IMPORTANCE OF AND PLANS FOR AGRICULTURE SECTOR OF TANZANIA ..................................................................... 4 TABLE 2: QUANTITY OF SUPPLIED IMPROVED SEEDS IN MT (2005/06 – 20010/11) ........................................................... 4 TABLE 3: APPLICATION OF SEEDS, FERTILIZERS AND CHEMICALS ............................................................................................... 6 TABLE 4: COST FOR AI SERVICES ................................................................................................................................................10 TABLE 5: COFFEE PRODUCTION IN MOSHI RURAL DISTRICT COUNCIL .....................................................................................18 TABLE 6: RELATIVE IMPORTANCE OF COFFEE IN MBINGA ........................................................................................................26 TABLE 7: SUMMARY COFFEE AGRO INPUTS DYNAMICS AND CONSTRAINTS .............................................................................31 TABLE 8: MAIN FOOD CROPS GROWN IN KARATU DISTRICT .....................................................................................................33 TABLE 9: FOOD CROPS PRODUCTION IN TONS FROM 2007/8 UP TO 2009/2010 ................................................................33 TABLE 10: PRODUCTION OF MAIZE AND PADDY IN MVOMERO (2006 – 2011) ....................................................................34 TABLE 11 CROP PRODUCTION IN IRINGA DISTRICT COUNCIL (MT) .........................................................................................34 TABLE 12: MAIZE PRODUCTION IN IRINGA: VOLUME IN MT, AREA IN HECTARES AND YIELD ...............................................35 TABLE 13: MARKET PRICE FOR INPUTS, NAIVS AND FARMER COSTS ......................................................................................36 TABLE 14 ACCESS TO NAIVS VOUCHERS AT IHEMI VILLAGE ...................................................................................................37 TABLE 15: OUTPUT PER ACRE AT IHEMI VILLAGE......................................................................................................................38 TABLE 16:MAIZE PRODUCTION AT KIWERE...............................................................................................................................40 TABLE 17: NUMBER OF VOUCHERS DISTRIBUTED IN MVOMERO DISTRICT ..............................................................................44 TABLE 18: NUMBER OF VOUCHERS DISTRIBUTED IN KILOSA DISTRICT .....................................................................................44 TABLE 19: SUMMARY CEREALS AGRO INPUTS DYNAMICS AND CONSTRAINTS ..........................................................................58 TABLE 20: CATTLE AI, ANIMAL FEEDS, VETERINARY DRUGS AND VACCINES - DYNAMICS AND CONSTRAINTS ........................64 TABLE 21: HECTARES CULTIVATED WITH TOMATOES AND PRODUCTION (MT) ......................................................................66 TABLE 22: DEMANDS AND SUPPLY OF AGRO-CHEMICALS IN IRINGA .......................................................................................67 TABLE 23: COSTS OF INPUTS VS REVENUE FOR AN AVERAGE TOMATO FARMER .....................................................................67 TABLE 24: SUMMARY OF TOMATOES AGRO INPUTS DYNAMICS AND CONSTRAINTS ................................................................70 TABLE 25: AGRO ECOLOGICAL ZONES AND RESPECTIVE CROPS GROWN IN MTWARA .............................................................72 TABLE 26: CASHEW-NUT PRODUCTION STATISTICS (RAW NUTS) .............................................................................................72 TABLE 27: VARIATION OF THE PROFITABILITY ACCORDING TO THE YIELDS (MAYANGA)..........................................................74 TABLE 28: PRICES OF CASHEW NUT INPUT – WITH AND WITHOUT SUBSIDY ............................................................................76 TABLE 29: SOURCES OF FUNDS FOR THE PAYMENT OF INPUTS FOR CASHEW PRODUCTION ....................................................78 TABLE 30: CASHEW NUTS AGRO INPUTS DYNAMICS AND CONSTRAINTS ..................................................................................80 TABLE 31: MALAWI - AGRICULTURE AND GDP GROWTH ........................................................................................................84 TABLE 32: TYPES OF SUBSIDIZED INPUTS AND DEGREE OF GOVERNMENT SUBSIDY ...............................................................86 TABLE 33: COMPARISON OF LEVEL OF SUBSIDY BETWEEN MALAWI AND TANZANIA. ............................................................86 TABLE 34: ROLES OF STAKEHOLDERS IN THE OPERATIONALISATION OF FISP .........................................................................87 TABLE 35: OVERVIEW OF SUBSIDY PROGRAMMES IN TANZANIA, KENYA AND MALAWI .........................................................91
ABBREVIATIONS AND ACRONYMS
ABSAC Agriculture Bio-safety Scientific Advisory Committee

Access, distribution and application of agricultural inputs
iii
ADMARC Agriculture Development Marketing and Market Corporation AEDC Agriculture Extension Development Coordinator AEDO Agriculture Extension Development Officer AFAP Africa Fertilizer Agribusiness Partnership AfDB Africa Development Bank AGITF Agriculture Input Trust Fund AGMARK Agriculture Market Development Trust AGRA Alliance for Green Revolution in Africa AGTIF Australian Government Technical Interoperability Framework AMCOS Agriculture Marketing Cooperative Societies ANSAF Agricultural Non State Actors Forum ASA Agricultural Seed Agency ASDP Agriculture Sector Development Program ASR Agricultural Sector Review AVRDC Asian Vegetable Research and Development Center BOT Bank of Tanzania BRITEN Building Rural Incomes Through Enterprise CAADAP Comprehensive Africa Agriculture Development Program CAN Calcium Ammonium Nitrate CBD Coffee Berry Disease CNFA Citizen Network for Foreign Affairs COMESA Common Market for Eastern and Southern Africa COMRAP COMESA Regional Agro Inputs Program COSTECH Commission for Science and Technology CRDB CRDB Bank Plc DADP District Agriculture Development Plans DALDO District Agriculture and Livestock Development Officer DAP Di-amonium Phosphate DCG Dar es Salaam Corridor Group DCO District Coordinators DVO District Veterinary Officer EAC East African Community ECF East Coast Fever EEC European Economic Community FAO Food and Agriculture Organization FFS Farmer Field School FISP Farm Input Subsidy Program FSDT Financial Sector Deepening Trust GAP Good Agricultural Practices GDP Gross Domestic Product GIS Geographical Information System GM (O) Genetically Modified (Organism) GOT Government of Tanzania GSC Global Services Corps Ha Hectares HORTI Horticulture Training Institute IMF International Monetary Fund JSAN Joint Staff Advisory Board KCBL Kilimanjaro Cooperative Bank Limited kg Kilograms KKKT Kanisa la Kiinjili la Kilutheri Tanzania (Evangelical Lutheran Church of Tanzania) Km Kilometers KNCI-JVE Kilimanjaro New Cooperative Initiative- Joint Venture Enterprise KNCU Kilimanjaro Native Cooperative Union LGA Local Government Authorities MAFC Ministry of Agriculture Food Security and Cooperatives

Access, distribution and application of agricultural inputs
iv
MAIWD Ministry of Agriculture Irrigation and Mater Development MAS Mobile Authentication Service MCB Mbinga Community Bank MDC Meru District Council MEDAFA Meru Dairy Farmer’s Association MFIs Micro Finance Institutions MITM Ministry of Industry, Trade and Marketing MK Malawian Kwacha MKUKUTA (NSGRP)
Mkakati wa kukuza uchumi na kupunguza umaskini Tanzania (National Strategy for Growth and Reduction of Poverty)
MKURABITA Mpango wa Kurasimisha Rasilimali na Biashara za Wanyonge Tanzania MLC Maximum Liability Certificate MLDF Ministry of Livestock and Fisheries Development MMA Match Maker Associates Limited MRAITF Mtwara Regional Agriculture Input Trust Fund MRDC Moshi Rural District Council mt Metric tons MVIWATA Mtandao wa Vikundi vya Wakulima Tanzania NAIC National Artificial Insemination Center NAIVS National Agriculture Input Voucher System NARI National Agriculture Research Institute NBAC National Bio-technology Advisory Committee NEMC National Environmental Management Council NEPAD New Partnership for Africa's Development NFRA National Food Reserve Agency NGO Non Governmental Organization NMB National Microfinance Bank NORAD Norwegian Agency for Development Cooperation NPT-TC Non Performance Trial – Technical Committee NSC National Seed Committee NVRC National Variety Release Committee OPV Open Pollinated Variety PARTS Pesticide Approval and Registration Technical Subcommittee PASS Private Agricultural Sector Support Limited PCB Pesticide Control Body PCS Primary Cooperative Societies PEPQS Post Entry Plant Quarantine Station PFM Public Financial Management PM Prime Minister PMO- RALG Prime Ministers Office - Regional Administration and Local Government POPs Persistent Organic Pollutants PSIM Post Surveillance Inspection Monitoring RAA Regional Agriculture Advisors RADD Rwanda Agro Dealer Development RCO Regional Cooperative Officer REC (s) Regional Economic Communities SACCOS Savings and Credit Cooperative Society SAGCOT Southern Agricultural Growth Corridor of Tanzania SARI Selian Agriculture Research Institute SCCULT Savings and Credit Cooperative Union League Of Tanzania SCP Country Strategy Paper SFFRFM Smallholder Farmer’s Fertilizer Revolving Fund of Malawi SOP Standard Operations Procedure SSA Sub-Saharan Africa STAM Seed Trader Association of Malawi SUA Sokoine University of Agriculture

Access, distribution and application of agricultural inputs
v
TaCRI Tanzania Coffee Research Institute TADB Tanzania Agriculture Development Bank TAEC Tanzania Atomic Energy Commission TAFSIP Tanzania Agriculture and Food Security Investment Plan TAGMARK Tanzania Agriculture Market Development Trust TASP Tanzania Agro Dealer Strengthening Program TASTA Tanzania Seed Traders’ Association TAZARA Tanzania Zambia Railway TCB Tanzania Coffee Board TCCIA Tanzania Chambers of Commerce, Industry and Agriculture TDV Tanzania Development Vision TFC Tanzania Fertilizer Company TFRA Tanzania Fertilizer Regulatory Authority TIB Tanzania Investment Bank TOSCI Tanzania Official Seed Certification Institute TPRI Tanzania Pesticide Research Institute TRA Tanzania Revenue Authority TRIT Tea Research Institute of Tanzania TShs Tanzania Shillings UAE United Arab Emirates UNADA Uganda National Agro Dealer’s Association UNEP United Nations Environment Program USD United States Dollars USD United States Dollars UWAPEKI Umoja wa Wauzaji wa Pembejeo Kilimbero: Kilombero agro dealers association V/ADC Village/Area Development Committee VEO Village Extension Officers VICOBA Village Community Banks WEMA Water Efficient Maize for Africa WHO World Health Organization WRS Warehouse Receipt System ZSGRP Zanzibar Strategy for Growth and Reduction of Poverty

Access, distribution and application of agricultural inputs
vi
DEFINITION OF TERMS This study is focusing on issues around access, distribution and application of agricultural inputs and thus the following definitions of these key research issues is given hereunder: Access: the aim of assessing issues of access is geared towards finding ways of increasing inputs availability and improving farmers’ access to the right (genuine) inputs at affordable prices. In the context of this study therefore, access issues will include discussion on availability, affordability and timing. Availability: composed of carryover stocks, imports and locally manufactured and blended, demand and exports. Factors affecting each of these components influence availability of inputs, these factors includes delayed procurement, inadequate capacity for local manufacture, high cost of transportation, poor access roads and transport infrastructure. Affordability: Major factors constraining farmers’ access to fertilizer include distance to markets, lack of purchasing power and escalating prices. This study explores affordability from the cost-benefit analysis at farm level context aiming at seeing whether the income accrued from application of input give rationale for farmers to see business sense of buying the inputs. Timing: timeliness in delivering inputs is another critical factor, this refers particularly to decision making mechanisms and implementation Vs the crop calendar on one hand, but on the other hand timing refers to relationship between the period that farmers receive cash from sale of produce and the time they need cash to purchase inputs, i.e. smallholder farmers’ cash flow Distribution: the aim of assessing issues of distribution is geared towards finding ways of improving efficiencies and cost effectiveness of delivering inputs to as many farmers as possible. In the context of this study therefore distribution issues will include assessment of aspects related to the flow of physical goods (inputs) and information along the supply chains, it looks at primary and secondary chain actors as well as assessment of basic and secondary infrastructure and operating equipment. Actors: the main actors in the inputs supply chain include manufacturers, importers, primary (wholesalers) and secondary (sub-wholesalers) distributors and agro-dealers. Other secondary actors include NGOs and other non-state actors who promote or influence distribution systems and usage of inputs. The study considers the skills, financial capacity, fairness, law compliance, and readiness to provide associated services of these actors. Inputs and information flows: to see the efficiencies and cost effectiveness of movements of inputs and information from importers/manufacturers through distribution systems until reaching retailers (agro dealers/agro dealers) and essentially farmers. Infrastructure: efficiencies and cost effectiveness is influenced by the quality of basic infrastructure i.e. waterways/ports, railroads and roads: relevant transport operating equipment (haulage/tracks) services and storage capacities and their proximity to farming zones. Application: the aim of assessing issues around application of inputs is geared towards improving utilization levels of fertilizer and related inputs and enhancing the enabling environment for public-private sector partnership in the development of efficient inputs

Access, distribution and application of agricultural inputs
vii
systems. This study therefore, explores the factors influencing the adoption rate of use of inputs: the major ones being of course affordability but also level of technical knowledge of correctly application of inputs and availability and good usage of promotion models to trigger more usage. The study also assesses if farmers are able to get maximum returns (yields) from use of inputs. Other key terms used in this study include efficiency, effectiveness and impact and are defined hereunder: Efficiency: A measure of the degree to which the resources invested in the provision of inputs are appropriate compared to the results achieved. Effectiveness: Effectiveness refers to the extent or degree to which the expected results/output of an action/investment or project have been achieved. Impact: The extent to which measures implemented to address to increase application of inputs have contributed to achieving the intended overarching results and in this context, food security and poverty reduction Other key terms in this study include proprietary, generic, counterfeit and fake product. These terms are also defined hereunder: Defining the difference between generic and proprietary products is not always easy in the world of agro- chemicals. A proprietary product has a granted patent in force but, once the patent has expired, the product can be classified as generic or proprietary off patent. A true generic product is where the generic company has registrations (approvals to sell) products that are independent of the inventor company’s data. A proprietary off-patent product
exists when there is no stand-alone competitor(s) to the inventor’s company1. The simplest way to define a generic pesticide is as one which is manufactured by a company other than the original manufacturer, whilst a generic manufacturer is, “a company, or division of a company, whose major activity consists of manufacturing the active substances of pesticides, the patents for which have expired, and for which it did not hold the original patents” To counterfeit means to illegally imitate something. Counterfeit products are often produced with the intent to take advantage of the superior value of the imitated product. Counterfeit product can also be referred as fake product. Fake product is one that is not authentic or genuine, it is basically a sham.
1 The Enigma Marketing Research website
http://www.enigmamarketingresearch.com/reports/off_patent.pdf (visited on 4th May 2012) gives
detailed technical explanation
Access, distribution and application of agricultural inputs
viii
ACKNOWLEDGEMENTS AND DISCLAIMER Peniel Uliwa, Edmond J. Ringo and Jimmy Ebong, consultants from Match Maker Associates Limited (MMA) in collaboration with Hebron Mwakalinga and Frederick Kilcher - Associate consultants conducted the study on access, distribution and usage of inputs and jointly prepared this report. While it is not possible to acknowledge all individuals who made this study a success, we are particularly grateful to Mrs. Janet F. Bitegeko, the Executive Director of Agriculture Council of Tanzania (ACT) for her effort in sourcing our service, organizing workshops for presentation of our research methods and validation of this study findings, sharing of information and arranging meetings and follow ups of some key informants. Similar gratitude is extended to coordinators of programs of Tanzania Agricultural Partnership (TAP) at the districts visited. TAP Coordinators (DCOs) made appointments with key stakeholders in the respective districts on our behalf, guided field visits and also provided invaluable information and insights concerning access, distribution and usage of inputs in the various districts where the study was conducted. In addition, we equally appreciate; (i) representatives of all stakeholders/institutions in the coffee, maize, paddy, cattle, cashew nut, and tomatoes value chains, (ii) agro dealers, manufacturers and importers of inputs; (iii) Local Government/District staff and staff from the ministries and public sector agencies and (iv) farmers who took time away from their busy schedules to offer valuable time and information that made our tasks feasible. Finally, it must be stressed that opinions expressed in this report are purely of the authors and are based on observations and findings during the study. It is therefore the authors, and not the Agriculture Council of Tanzania (ACT) who holds responsibility for any error of commission or omission, which may be found in this report.
Access, distribution and application of agricultural inputs
ix
EXECUTIVE SUMMARY The government of Tanzania has invested considerable resources since the early-1970s to promote access, distribution and the application of agro inputs by smallholder farmers. The justification for these investments was and continues to be achievement of both national agricultural development and food security objectives. Initially the government, working with the Tanzania Fertilizer Company and government-managed crop marketing institutions, implemented various fertilizer provision schemes through which fertilizer was provided to farmers at sharply subsidized prices. By 2006 subsidy was extended to cover seeds and in the recent past the subsidy has been extended to agro chemicals as well and some non-food, export crops including cotton, cashew, coffee, etc.
Consumption levels of fertiliser nationally increased from about 10,000 MT annually in the late-1960s to 30,000 MT in the late-1970s to 45,000 MT in the late-1980s. As part of broader efforts to reduce the scope of government in the economy and promote private sector investment, the Government gradually withdrew from its monopoly position and liberalized agro input markets. Several private firms quickly entered the market, importing stocks from international fertilizer manufacturers and selling from their wholesale depots in Dar es Salaam or and up-country and retail points. Several of these early entrants have remained important importers and wholesalers of fertilizer to date. Following the opening of input markets to the private sector, the government did not strongly intervene in fertilizer supply for several years. In 1998 there were 13 fertilizer importers undertaking procurement, import and distribution of agricultural inputs.
Although increased awareness of usability of agro inputs has triggered growing demand by smallholder farmers and even without subsidy some progressive farmers could buy inputs, still millions of smallholder farmers in rural areas do not have access to quality, affordable and timely agricultural inputs such as improved seeds, fertilizers and other agro-chemicals needed to help them raise their farm productivity. Poor development and weak performance of rural agricultural input markets partly explain the current low productivity of smallholder farmers.
The use of agro inputs fell considerably in the 1990s due to sharp increases of prices. Therefore, starting in 2003, the government developed a program to offer subsidies to input suppliers on the transport costs, plus some subsidy on part of the fertilizer cost. Price enforcement mechanisms were established for the subsidized fertilizer to ensure pay reduced prices. In 2006/2007 the government introduced the subsidy on seeds as well. The transport subsidy program ran through 2007, but generally was found to be inefficient with many farmers not having access to the subsidized inputs. The system faced a challenge of many agro dealers lacking sufficient financial resources to acquire an inventory of subsidized inputs; they also had limited information and knowledge to guide farmers on how to make profitable and productive use of the subsidized inputs they offered. There were delays in delivery, many incidences of corruption practices and other bureaucratic bottlenecks. In 2008, the government phased out its program of subsidized transportation costs, concluding that it was not cost-effective and failed to reach a large number of farmers or improve their access to fertilizer. Instead, the government introduced the National Agriculture Inputs Voucher Scheme (NAIVS) initiative that uses vouchers to transfer resources directly to farmers, aiming at increasing their purchasing power, stimulating the development of input supply chains, and fostering competition among input suppliers and agro-dealers.
The NAIVS approach was piloted in two districts for one season and thereafter scaled up to 53 districts in the high potential zones for maize and rice production in 2008/09. By 2009/2010 about 1,500,000 farmers from 61 districts in 20 regions benefited and the value of vouchers distributed was equivalent to 150,000MT of fertilizer, 12,500MT of maize hybrid, 2,200MT of maize OPV and 450MT of rice seeds. The number of targeted

Access, distribution and application of agricultural inputs
x
beneficiaries increased to 2,000,000 in 2010/2011 and 200,000MT of fertiliser and 20,000MT of seeds (maize and paddy) were distributed. In the 2011/2012 season the target had been to reach 1,800,000 farmers and to distribute 180,000MT of fertiliser and about 18,000MT of seeds. As part NAIVS, the government deliberately worked with Citizens Network for Foreign Affairs (CNFA) who works in partnership with Agricultural Market Development Trust (AGMARK), Alliance for Green Revolution in Africa (AGRA), Agricultural Council of Tanzania (ACT) and the Finance Sector Deepening Trust (FSDT) to strengthen local agro-dealer networks through training and credit guarantees in an effort to promote and strengthen private sector participation in agricultural input markets. The Government concluded a Memorandum of Understanding with the National Microfinance Bank (NMB) for the redemption of NAIVS vouchers, given that NMB is the only commercial bank with a branch in most districts. Ever since, the subsidy programme has grown to reach 87 districts and covering fertilizer and seeds. Nevertheless, the programme has given mixed results and faced many challenges including limitation it has in inputs market development. Furthermore, these subsidy programmes have proven to be generally costly, lack clear sustainability strategies and benchmarks and are facing various implementation inefficiencies. The government has noted the shortfalls and is reviewing the “modus operandi” for input subsidy management starting 2012/13 agricultural seasons. The details of the new approach were not available at the time of concluding this research.
Other government subsidy arrangements are in place for coffee (seedlings), cashew (agro chemicals) and cotton (seeds and agrochemicals). Other input financing mechanisms include direct funding from government e.g. use of cashew export levy; use of district agricultural development plans (DADPS) e.g. co-funding seedling cost of cashew, sunflower seeds in Singida, to mention but a few.
MAJOR FINDINGS The main research objective for this study was to assess the challenges associated with access, distribution and application of inputs (fertilizer, seeds, and agro-chemicals) for six commodities namely maize, paddy, coffee, cashew, tomatoes and livestock.
Access Inputs access is influenced by infrastructure
Productive areas that are more accessible (with good road infrastructure) tend to attract bigger volumes of business and services and have a more active private sector whereas areas, which are less productive and are not easily accessible tend to have less volume of business, less private sector activities, therefore farmers in such places have difficulty in accessing inputs.
Few subsidies in agro inputs – mixed results – success and failure
Few input subsidy schemes are ongoing in Tanzania through research funds; TaCRI – wide coverage, results very positive. Coffee Board plans Input Subsidy Fund soon. Cashew - subsidy in place, fair results but needs improvement. Subsidy under DADPs – effective but very limited coverage. Livestock subsidy – limited awareness by farmers on the subsidy, need for awareness raising.
“Smart” subsidy can aim to improve access and application
NAIVS increased the number of agro dealers and the availability of inputs in some places. But generally, it has played a limited role to enhancing affordability and usage of inputs.
Value chain financing – the missing middle
SACCOS e.g. Umbwe Ndoo in Moshi, AMCOS in Mbinga and NGOs e.g. KDA in Karatu have demonstrated ability to sustainably improve access to rural credit. However, these

Access, distribution and application of agricultural inputs
xi
initiatives face the problem of limited capital to lend out due to weak linkages to financiers e.g. banks.
Distribution Weak distribution system and porous enough to allow influx of counterfeits
Inputs reach farmers mainly through agro dealers, however, they face three main problems; (i) the financial constraints (ii) inadequate knowledge concerning how to apply inputs they sell (iii) Unscrupulous traders are distributing counterfeit/fake inputs.
This study calls for review of accreditation process of agro dealers, looking at their financial capacities and technical knowledge
Limited promotion of agro dealers’ networks in delivery of extension services
Agro dealers are instrumental for enhancing availability of inputs in the villages. They can also be instrumental in delivering extension service, hence improve outreach and good usage of inputs through effective PPP.
Application Low adoption rate of improved inputs and poor agronomic practices
Some inputs (e.g. improved seeds for maize) are used more than others (e.g. fertilizers and chemicals). Majority of farmers cannot use or apply inputs correctly. Farmers of high value crops like vegetables, which has good output markets, can afford inputs but with limited knowledge to correctly apply inputs, they have been abusing and/or wastefully using inputs.
One size fits all approach
Tanzania is quite diverse in terms of soils and agro ecology. A blanket approach, used in NAIVS of supplying mainly Phosphate and Urea does not address the diversity of soil nutrients.
Inputs market is interrelated to outputs market
Crops with good and stable output markets (e.g. high return crops like vegetables) enable farmers to afford and hence apply more improved inputs. Maize, on the other hand has unpredictable and distorted market as a result farmers barely break-even actually most operate below break-even.
Lessons from Kenya and Malawi Tanzania still has a lot on paper
In Kenya, input supply system is private sector driven and integrated in the Kenya Country Vision 2030, which includes specific strategies and flagship projects geared at improving input supply systems. Unfortunately, Tanzania Development Vision 2025 (since 2000) and Kilimo Kwanza (since 2009) have limited clear flagship projects.
Apply “smart subsidy and improve governance and transparency in implementation
FISP in Malawi includes a strong governance system that is driven by very inclusive and transparent multi-stakeholders process for beneficiaries’ identification and support. In Tanzania, poor governance and lack of transparency negatively affected the performance of the scheme. It is advised that Tanzania should seriously consider ways of improving governance and transparency in the input subsidy schemes.
Regional integration should bring synergies

Access, distribution and application of agricultural inputs
xii
EAC partner states have strong mistrust among each other (TBS/KEBS; TPRI/KEPHIS, etc) that hinders free movement of certified agro inputs in the region. There is need to overcome causes of mistrust and address the bottlenecks to harmonization squarely.
Tanzania should benefit from other Africa initiatives such as AU Abuja Declaration that advocated for enhance fertiliser utilization from average of 8kg/ha to 50kg/ha by 2015 and the newly initiated Africa Fertilizer Agribusiness Partnership (AFAP) – a joint project of NEPAD, AGRA, IFDC, AfDB and AGMARK fostering private sector investment and develop partnerships to build sustainable markets providing smallholder farmers with AFFORDABLE fertilizer.
CROSS CUTTING RECOMMENDATIONS 1. The long-term future and sustainability of funding subsidy input programs and the
possibility of funding such programs of crowding out other private sector led investments in the agriculture should be taken note of. Although Malawi has produced an excellent case of successfully implementing and input program, the financial capacity of the country to sustain the program is questionable.
2. Due to limited knowledge of smallholder farmers, they may not use inputs correctly and cost effectively. Poor mechanism of applying chemicals puts at risk the health of a farmer and the environment. It is recommended to promote extension services that respond to this challenge in terms of training (agronomy, management, marketing) and controls in an efficient way. Innovative PPP extension business models have been tested and should be advocated for. Tools such as demonstration plots, FFS, contract-farming schemes should be promoted considering their good results.
3. Agro input dealers are instrumental for enhancing availability of inputs in the villages and potentially to enhance extension service provision, hence good usage of inputs. However, they have been blamed for selling counterfeit products and suffer from lack of financial muscle and technical knowledge necessary to deliver services. Therefore, accrediting and training them more is necessary.
4. Value Chain financing options for agro-input systems in Tanzania is very weak. Although few systems have been tried in an ad-hoc manner (SACCOS, Banks, NGOs, Government budget allocations, etc.) there is still need for coming up with innovative financial mechanisms including crop financing to attract more financial and non-financial institutions. In addition, a major constraint to the utilization of financial products is the absence of embedded risk management mechanisms and it is therefore strongly recommended that such mechanisms are systematically included in any financial product for agriculture.
5. Inputs alone without proper package of critical services (mechanization, information systems and output marketing, processing, weather forecasting, etc.) will not turn around the output of agricultural investments in agro-inputs to create a long-term, developmental perspective. It is therefore recommended that agricultural strategies should include these additional services within a value chain and geographical framework and with a long-term perspective looking out to make the whole inputs system more sustainable (sourcing, procurement, distribution, financing, etc). Therefore, ACT must work with policy makers and development partners to implement interventions aimed at addressing the underlying policy and structural problems that undermine incentives for farmers to use inputs and for firms to supply inputs.
6. According to lessons learned and good practices guidelines for encouraging input use in African Agriculture, one of the guiding principles for public intervention to encourage input use is for public policies to pursue regional integration to help in two ways:

Access, distribution and application of agricultural inputs
xiii
i) By increasing market size it has a possibility to attain higher prices and demand for commodities. Bigger markets are likely to be less volatile.
ii) EAC Countries should seek regional integration and harmonization of policies on inputs and trade in order to reap from economies of size and scope. Integration of policies and regulations will reduce procedures and improve business environment.
RECOMMENDED SPECIFIC INTERVENTIONS Access, distribution and application can be attained if other concerns mentioned above are addressed. In other words, a myriad of other interventions (at broader levels) are required. However, specific recommendations to enhance areas of focus in this study are as below.
1. ACCESS Improve tailor made rural financing for agricultural value chains by channeling finance through farmer organizations or through strategic intermediate private sector that will enable farmers actually access funds can improve farmer’s affordability of inputs. The case of Agriculture Input Trust Fund lending to Kilimanjaro Cooperative Bank Limited (KCBL) and KCBL lending to SACCOS has proved to be successful, sustainable and is worth learning from. Also CRDB’s lending through SACCOS, especially in Kilimanjaro region and particularly Moshi has worked well and is an interesting case worth learning from. Some upcoming impact funds are financing strategic companies involved in contract farming to be able to buy in time or offer inputs to outgrowers.
2. DISTRIBUTION Distribution can be addressed by improving infrastructure for transporting and handling of inputs and increasing access to finance, especially for the agro dealers and distributors. Ensuring that agro dealers and distributors deliver quality and genuine inputs is another intervention point. Improving infrastructure, enhancing access to finance and instituting an accreditation system for agro dealers are recommended.
3. APPLICATION Using demonstration plots and involving agro dealers in running extension plots have proven to be an effective approach to enhance access, distribution and correct application of inputs. A private sector led extension is recommended to increase application of inputs.
POLICY ADVOCACY BRIEFS Essentially three policy advocacy briefs are recommended to address challenges associated with cross-cutting issue on efficiency of inputs regulatory institutions, access, distribution and application of agro inputs respectively.
POLICY ADVOCACY FOR COORDINATION OF INPUTS REGULATORY INSTITUTIONS: The Government has recognized the importance of regulating agricultural input markets, findings from this study show that laxity has cost farmers and the country enormously. A number of regulatory bodies have been established, e.g. ASA, TPRI, TAFRA, TOSCI, TBS, TEAC, etc. to mention but a few. These institutions have been found to have weak linkages among them, spatially scattered, uncoordinated and lacked candid common agenda and platform. The structures in place are highly lopsided towards headquarters in terms of human capacity and very little is at the functional (district) level. It is recommended that ACT should advocate for a coordination mechanism to harness synergies and ensure cost effectiveness, efficiency and most importantly enhanced interface between farmers and these institutions along the one-stop-shop concept2.
2 This policy issue was prioritized in the second stakeholder’s meeting and has not been analysed at
the Policy Brief level.

Access, distribution and application of agricultural inputs
xiv
POLICY ADVOCACY FOR ENHANCING DISTRIBUTION: ACT should take deliberate action to facilitate the reviewing and forging new rules and regulations that will control and remove distribution systems of counterfeit inputs. Improved safety regulations in transportation and storage and handling need to be revisited and ways to enforce such regulations should be sought. Specifically, this multi-stakeholder process should promote development of a legal accreditation infrastructure for agro input supply chains, increased investment in agro inputs systems’ infrastructure, particularly establishment of a geographical information system (GIS). Promote effective governance and state capacity to monitor market development and
promote setting up of legal and advisory window for agro inputs stakeholders.
POLICY ADVOCACY FOR ENHACING ACCESS: ACT should take deliberate action to influence hastening of the financial services reforms in Tanzania through active involvement in the review of Kilimo Kwanza implementation progress (Pillar 7). A starting point could be to join other agriculture sector lobbying and advocacy bodies such as ANSAF to see next years (2012/13) budget increase in the agricultural sector (up to 10% of total budget as per CAADP Maputo Declaration) targeting provision of input guarantee scheme, fast tracking of crop insurance scheme and reinforcing agriculture window of TIB. POLICY ADVOCACY FOR ENHANCING APPLICATION: ACT should take deliberate action to facilitate advocacy to institutionalize the PPP concept in the provision of agriculture extension services as well as facilitate putting in place guidelines for public and private sector engagement in extension and other service provisions.

1
1.0 INTRODUCTION 1.1 Background ACT has received a grant from Best AC, supporting the private sector, to undertake research programmes on business environment. The aim is to advance advocacy and lobbying for effective implementation of accessibility of farmers to agro-inputs mainly agro chemicals, seeds and fertilizers. ACT floated tender to undertake a study to assess the challenges associates with access, distribution and application of agro inputs in Tanzania. Match Maker Associates Limited (MMA) bid and won the tender and thereafter the firm was awarded the contract to undertake this study. The reminder of this document is the report of outcome of the study.
The Agricultural Council of Tanzania (ACT) is the agricultural private sector apex organization in Tanzania. The fundamental objective of ACT is to unite all the members of the agricultural community in Tanzania, and to act as the instrument of the members in dialogue with the government and other bodies in the formulation and oversight of policies and programs related to the development of agriculture and agribusiness in the country. Currently, ACT has 93 members drawn from farmers, livestock keepers, fisheries associations, and cooperatives, associations of input suppliers, agro processors, transporters and researchers. 1.2 Study objectives The main research objective for this study is:
“To assess the challenges associated with access, distribution and application of inputs (fertilizer, seeds, and agro-chemicals) for a total number of six commodities” … to support ACT political lobbying activities
The study aims at analyzing different commodities and thus the research questions were set to be the same per commodity. Essentially, the commodities selected for this study include: maize, paddy, coffee, cashew, tomatoes and livestock. The two main outputs of this study include advocacy briefs and narrative report. 1.3 Approach and methodology of the study The consultant (MMA) was tasked to develop approach and methodology that will answer the following questions:
1. Who are the main actors in each of the analyzed value chains and how can their constraints be summarized?
2. What is the estimated impact of these constraints on the effectiveness of the chain? 3. What is being undertaken by different actors to alleviate constraints and how
effective are the measures? 4. What suggestions can be made for future interventions to improve the situation?
Combinations of approaches were used to conduct this study. The entry point into the study was an inception meeting with selected stakeholders to get feedback and input into the research framework developed by the research team. Checklists were prepared and presented. The inception meeting helped the team to complement the list of stakeholders who may give useful information on the study (list of people interviewed is shown in annexes section 8.3).
Thereafter a thorough review of literature was conducted. This was a necessary step because there is wealthy of literature written in the recent past regarding agro inputs in Tanzania, the region and sub Saharan Africa. Most of this literature body was found to be useful to the context of Tanzania.

2
The third step was conducting extensive fieldwork in nine districts in seven regions namely Morogoro (Mvomero and Kilosa), Iringa (Kilolo and Iringa Rural), Ruvuma (Mbinga), Mtwara (Mtwara Rural), Kilimanjaro (Moshi Rural), Arusha (Arumeru) and Manyara (Babati). In order to learn what has happened in the neighboring countries brief visits were organized to Kenya and Malawi. Essentially, data was analyzed and compiled by the entire study team in a write-shop.
Focused group discussions were the main tool used when seeking information from smallholder farmers and occasionally with groups of agro dealers. Face to face interviews were conducted to get information from most agro dealers, district council officials, voucher scheme specialists and government policy makers mainly Ministry of Agriculture, Food Security and Cooperatives (MAFSC), representatives of some of National Agricultural Research Institutes (NARI), National Artificial Insemination Centre (NAIC), financial institutions as well as importers, distributors and manufacturers of agro inputs. Other key informant interviewed include professors at Sokoine University of Agriculture (SUA), non state actors active in agro inputs development programmes such as Building Rural Incomes Through Enterprise (BRITEN) and Agricultural Market Development Trust (AGMARK) Kenya.
Analysis and information collected from all agro inputs stakeholders is presented in this report as narrative, mini cases and visualization. Arising from the main findings, three policy briefs for further lobbying and advocacy are proposed each to bring out the main challenging issue in agro inputs access, distribution and application. 1.4 Limitations to the study There is insufficiency and inconsistency in data from various sources and this made it difficult to judge which is more accurate than the others. Consequently the study team had to put much more level of effort to make sense out of these varied data. In the context of high competition between researched and generic agro inputs and few evidences of infiltration of counterfeit agro inputs supply chains, most importers and distributors didn’t feel comfortable to cooperate fully with the research team during interviews. Therefore, important data such as their profit margins, imported volumes and distribution costs were estimated. Some key respondents were skeptical to give true narrative of incidences of supply of counterfeit agro inputs and corruption practices in the implementation of agro inputs subsidy schemes in the country. The research team, however, ensures respondents that their identity will be protected and managed to coin out some useful information. Lastly, time was the biggest challenge in this assignment, because the team was required to cover nine districts in seven regions and include brief visits to Kenya and Malawi in a very short period. The team optimize the time available by working on weekends and for up to twelve hours a day. 1.5 Report layout After this introductory chapter, the Tanzania’s context of agro inputs supply systems is presented in chapter two. The chapter gives a chronological narrative about evolution of agro inputs access, distribution and application in the country. The chapter ends with a short highlight of output markets. Chapter three brings up summary of study findings in relation to the six commodities assessed. This chapter brings also some lessons from Malawi, Kenya and elsewhere based on brief country visits and secondary literature. Chapter four is the synthesis of the key findings and this is followed by recommendations presented as chapter five. Proposed policy advocacy briefs for ACT led advocacy agenda are presented as chapter six and these briefs are also available as a separate document.

3
2.0 CONTEXT ANALYSIS OF NATIONAL INPUT SUPPLY SYSTEM 2.1 Tanzania strategies to enhance input systems Tanzania‘s overall development framework and long-term social and economic development goals are laid out in the National Vision 2025 and Zanzibar Vision 2020. The medium-term objectives for Mainland Tanzania and Zanzibar are guided by the NSGRP II and ZSGRP II, both of which make up the national development strategy approved at the end of 2010, and to be implemented over the period 2010/2011 – 2014/2015. The Mainland development strategy focuses on three broad clusters: (i) growth and reduction of income poverty; (ii) improvement of quality of life and social well being; and (iii) governance and accountability. Similarly, Zanzibar‘s development strategy focuses on three clusters: (i) growth and reduction of income poverty; (ii) improvement of social services and well being; and (iii) good governance and national unity. The strategies are fully linked with the MDGs, and encompass key sectors and cross cutting issues, including private sector development. According to a Joint Staff Advisory Note (JSAN) published by the International Monetary Fund (IMF) and the World Bank in January 2011, the ambitious projections underlying the new national development strategy (8.5% growth annually) will require policy interventions on multiple fronts. Furthermore, whereas the JSAN lauds the strategy‘s focus on agriculture and social sectors, particularly education quality, it also points out that priority should be accorded to infrastructure projects, especially those most pivotal for private sector-led growth. The JSAN also points to the need to accelerate implementation of Public Financial Management (PFM) and anti-corruption reforms. The agricultural sector presents particular challenges with direct linkages to growth, poverty, and competitiveness. In general, yields are low, while productions costs are high and income remains meager. Various price and export controls in the sector risk undermining market conditions and jeopardizing long-term sustainability. The new National Development Strategy emphasizes improvement in technological inputs, rural infrastructure and smallholder financing (including through creation of an Agricultural Bank). There is, however, a need to fully integrate such interventions into a commercial value chain, which is indispensible for attracting large investments in the sector and realizing scale economies. This investment is crucial, especially in transportation, processing and marketing of agricultural produce, a significant proportion of which is currently wasted through post-harvest losses. (AfDB, CSP 2011-2015). Agriculture contributes 28% of GDP, as compared to industry (24%), and services 48%. By 2010, agriculture contributed 25% of the country’s export earnings. Potential land for agriculture constitutes 40% of total land. In spite of the importance of agriculture to Tanzania, agriculture was allocated a paltry 7% of the total budget for 2011/12 financial year. Tanzania has a long-term vision (Vision 2025) but the aspirations of the vision are not translated into coherent actions. In addition, there is no flagship project linking the vision to agro inputs. In Kenya, input supply system is private sector driven and integrated in the Kenya Country Vision 2030 which includes specific strategies to improve input supply system and from the strategy there are clear specific flagship projects on agro-inputs such as fertilizer cost reduction in investment, seed improvement initiatives and livestock breeding programs. Already, input costs and increased access to market is being achieved by 2012 through bulk procurement and through domestic blending and production. Unfortunately, Tanzania Development Vision 2025 (TDV2025) and Kilimo Kwanza (Pillar 7) do not have such clear flagship projects and after more than ten years of the vision

4
Tanzania still doesn’t realize comparable achievements. Table 1 below summarizes the importance of agriculture and government plans for the development of the sector.
Table 1: Importance of and plans for Agriculture sector of Tanzania
Source: Compiled from literature review © MMA April 2012
2.2 Country Situation - actors and factors Low application rate of inputs is one of the main causes of low agricultural productivity in Tanzania and particularly improved seeds, fertilizers and agro-chemicals.
2.1.1 Seeds The Ministry of Agriculture Food Security and Cooperatives (MAFC) estimates that latent demand for an improved seed in the country is 120,000mt3, the actual demand is around 60,000mt while current supply is at 20,000mt. The trend however indicates that supply of improved seeds is increasing as shown in Table 2 below.
Table 2: Quantity of Supplied Improved Seeds in Mt (2005/06 – 20010/11) Source of Improved Seeds 2005/06 2006/07 2007/08 2008/09 2009/10 2010/11
Annual Growth
From Private Companies 8,748 14,870 16,174 10,511 14,536 16,545 29%
From Public Organizations 1,728 1,656 217 545 1,608 5,679
4 119%
Total available seeds 10,476 16,526 16,391 11,056 16,144 22,224
% Private Co. 84% 90% 99% 95% 90% 74%
Source: MAFSC- The seed industry status report, 2011.
It can be noted from the table 1 above that on the overall there has been an increase in the supply of improved seeds from both the private and public sector of about 32% per annum between 2005/6 and 2009/10. The supply from public sector is relatively fluctuating significantly, the jump in 2009/10 from 1,608 to 5,679, which is very positive. The second aspect is the strategic role the private sector is assuming in the supply of
3 There is no well-established data on demand of improved seeds in Tanzania; the last comprehensive survey
was done by FAO in 1990s, which estimated the demand then to be 30,000mt. To address this weakness the
Ministry has engaged a Consultant to conduct a study. 4 The sharp rise of than 230% in 2010/11 is being crosschecked with the Ministry to understand whether is a
permanent increase in the capacity on just transient phenomenon.

5
seeds. Between 2005/06 and 2009/10 the private sector accounted for 91% of the improved seeds, the share decreased in 2010/11 owning to the noted sharp increase in public sector. Actors in the Seeds Supply Chain There are a number of actors and institutions involved in improved seeds supply chain in Tanzania. Pre-basic seed breeding: A number of Agriculture Research Institutes (ARIs) are engaged in production of pre-basic seeds and basic seeds, in 2010/11 they produced 25.92mt of seeds. Between 2001 and 2010 some 171 seeds varieties have been released. The environment for seed sub-sector including human resource, research infrastructure and environment (policy and legal framework) have improved significantly, in 2010/11 alone 21 new varieties where released. For the commodities studied, coffee is taken care of by ARI Lyamungo, cashew at ARI Naliendele, tomatoes at AVRDC and Horti Tengeru, paddy by Katrin, maize by Uyole and Ilonga (Kilosa) ARI’s. Seed Imports: Imports account for a significant amount improved seeds supplied in Tanzania market (MAFC, 2012) the 2000-2009 pattern show a very inconsistent pattern in imported volumes something related to limited capacity to forecast demand due to lack of industry knowledge base as well as spurious donor-funded projects, on the overall however a linear trend line shows a year on year growth of 279%. Major sources of imported seeds by importance are United States, Uganda, Zambia, Malawi, Kenya, South Africa, Zimbabwe and United Arab Emirate (UAE), Figure No. 1(A) indicates originating countries and annual average of imports for the period of 2000 – 2009 while No 1(B) shows a 9-year trend. Source: TRA, Customs Department, 2010
Seeds Multiplication: As part of the strategies to improve domestic seed production the Government has allowed private companies to engage in seeds multiplication and effective 2011 the Government has relaxed conditions for accessing pre-basic seeds from breeders. For coffee, tea and cashew nuts seedlings multiplication functions have been done and coordinated by Tanzania Coffee Research Institute (TaCRI) and Tea Research Institute of Tanzania (TRIT) and ARI Naliendele respectively. The multiplication of seeds for other crops including maize and paddy are left to private sector and to a small extent to farmers for Quality Declared Seeds and to Agriculture Seeds Agency (ASA) for the types of seeds whose market is less attractive to private companies. The private sector contributes about 90% of the improved seeds supplied.
Figure 1: Countries of Origin for Imported Seeds
6
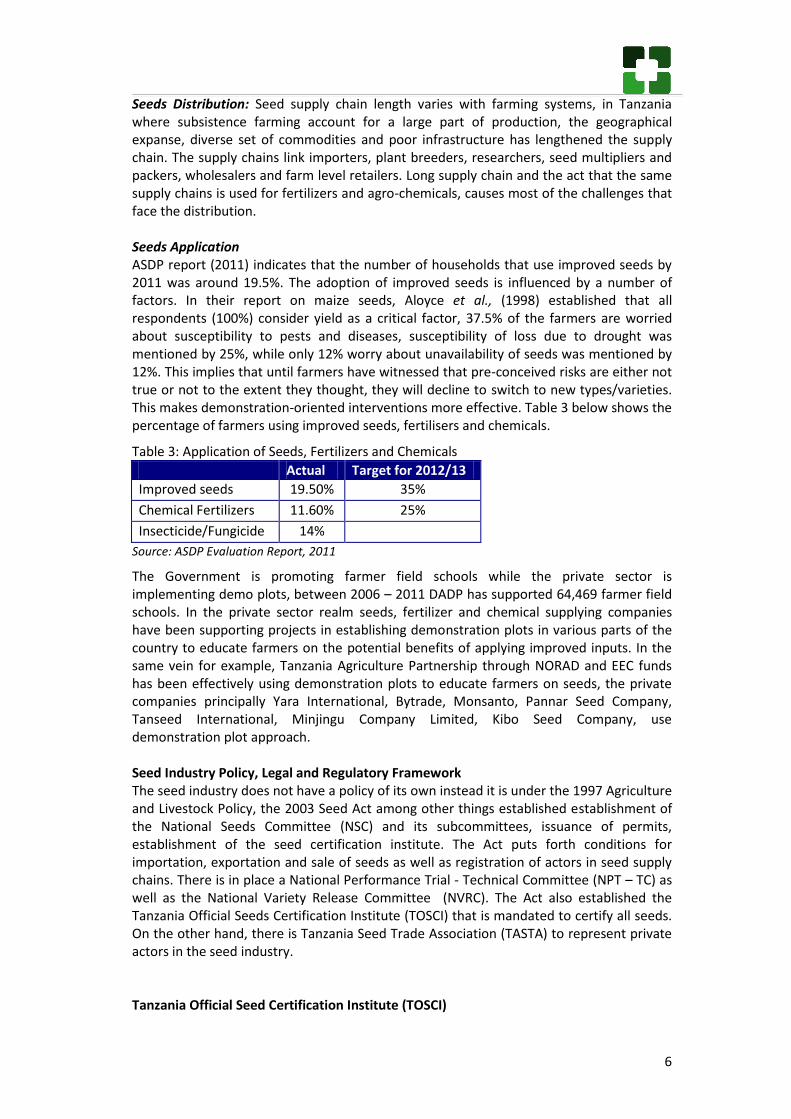
Seeds Distribution: Seed supply chain length varies with farming systems, in Tanzania where subsistence farming account for a large part of production, the geographical expanse, diverse set of commodities and poor infrastructure has lengthened the supply chain. The supply chains link importers, plant breeders, researchers, seed multipliers and packers, wholesalers and farm level retailers. Long supply chain and the act that the same supply chains is used for fertilizers and agro-chemicals, causes most of the challenges that face the distribution. Seeds Application ASDP report (2011) indicates that the number of households that use improved seeds by 2011 was around 19.5%. The adoption of improved seeds is influenced by a number of factors. In their report on maize seeds, Aloyce et al., (1998) established that all respondents (100%) consider yield as a critical factor, 37.5% of the farmers are worried about susceptibility to pests and diseases, susceptibility of loss due to drought was mentioned by 25%, while only 12% worry about unavailability of seeds was mentioned by 12%. This implies that until farmers have witnessed that pre-conceived risks are either not true or not to the extent they thought, they will decline to switch to new types/varieties. This makes demonstration-oriented interventions more effective. Table 3 below shows the percentage of farmers using improved seeds, fertilisers and chemicals.
Table 3: Application of Seeds, Fertilizers and Chemicals
Actual Target for 2012/13
Improved seeds 19.50% 35%
Chemical Fertilizers 11.60% 25%
Insecticide/Fungicide 14%
Source: ASDP Evaluation Report, 2011
The Government is promoting farmer field schools while the private sector is implementing demo plots, between 2006 – 2011 DADP has supported 64,469 farmer field schools. In the private sector realm seeds, fertilizer and chemical supplying companies have been supporting projects in establishing demonstration plots in various parts of the country to educate farmers on the potential benefits of applying improved inputs. In the same vein for example, Tanzania Agriculture Partnership through NORAD and EEC funds has been effectively using demonstration plots to educate farmers on seeds, the private companies principally Yara International, Bytrade, Monsanto, Pannar Seed Company, Tanseed International, Minjingu Company Limited, Kibo Seed Company, use demonstration plot approach. Seed Industry Policy, Legal and Regulatory Framework The seed industry does not have a policy of its own instead it is under the 1997 Agriculture and Livestock Policy, the 2003 Seed Act among other things established establishment of the National Seeds Committee (NSC) and its subcommittees, issuance of permits, establishment of the seed certification institute. The Act puts forth conditions for importation, exportation and sale of seeds as well as registration of actors in seed supply chains. There is in place a National Performance Trial - Technical Committee (NPT – TC) as well as the National Variety Release Committee (NVRC). The Act also established the Tanzania Official Seeds Certification Institute (TOSCI) that is mandated to certify all seeds. On the other hand, there is Tanzania Seed Trade Association (TASTA) to represent private actors in the seed industry. Tanzania Official Seed Certification Institute (TOSCI)

7
The Seed Act of 2003 establishes the Tanzania Official Seed Certification Institute (TOSCI) as a sole seed certification agency in the country. TOSCI is operated under the Management Committee. TOSCI replaces the former Tanzania Official Seed Certification Agency (TOSCA). The new TOSCI is established as a regulatory organ to ensure all seeds that reach the farmers are of the prescribed and approved quality standard. TOSCI works with stakeholders and therefore to succeed, it is required that the other actors in the seed production and supply system also assume their rightful responsibilities. For instance: (i) Extension agents need the right knowledge about seeds to be able to test quality of seeds and train farmers (on testing, utilization, storage, etc.). But the extension workers’ knowledge about seeds is not sufficient to assume this function efficiently. They may also be disconnected from the source of information about seeds. (ii) Many agro-dealers in general have insufficient knowledge about agriculture. They have been chosen for their business skills and they often see the seeds as just another item without understanding the technicality of this item (timing of the utilization, storage, properties under specific agro-climatic conditions, etc.). Agro-dealers are inspected by TOSCI. To monitor the quality of seeds in the market, TOSCI works with seed inspectors located in each District. Seed inspectors are responsible to audit the agro-dealers, monitor their interventions through germination test, collect samples and – if necessary – notify TOSCI of any irregularities. However, they are not all sufficiently trained for their task and some districts do not have seed inspectors. Seed inspectors in the villages are not doing a good enough supervision on QDS producers5. TOSCI has been given a large task but staffing and budget are not sufficient to match the needs. There is a gap between, the responsibilities given to TOSCI and the power that the Institute can utilize to implement its function. For example, while TFDA is allowed to close a food processing unit if the conditions don’t comply with the requirements, TOSCI has to collaborate with police for similar action against agro-dealers or other actors of the seed industry and even then has insufficient power to implement a real survey (e.g. find other fake products in the room next to the shop or at the agro-dealers’ place). It has been widely reported that TOSCI had caught persons responsible for cheating and sent the cases to police but these cases had been difficult to win because of the “lack of evidences” and the difficulty to connect the failure of a crop to the origin/quality of seeds. Defaulters are often caught with small quantities although they have hidden stocks. Post Entry Plant Quarantine Station (PEPQS) PEPQS is a government agency implementing the Plant Protection Act of 1997 and the Plan Protection Regulation of 1998. PEPQS controls importation and exportation of plants and plant products, including seeds, cuttings, bulbs, etc. It is mandatory that a seed breeder who wants to introduce a variety of seed has to get license from PEPQS. Importation of plant product is controlled because each country has its pests and plant products carry pests. Through importing plant products, pests that were not in the country can be brought in. PEPQS aims to regulate entry of plant and products to protect entry of undesirable pests. When importing seeds, an importer writes to PEPQS requesting for a plant import permit. He states where the plant is coming from and the amount being imported. A pest risk analysis is conducted for a new plant variety. Products have to enter the country through a
5 Quoting Tanseed International met on 29/03/2012

8
known entry point where it can be inspected. The import permit states the condition for importation. A phytosanitary certificate is issued from the country of origin of the plant product. The plant inspector at the point of entry checks the two documents for consistency. For new varieties of seeds, seed company imports in small quantities. A test for the properties of the seed is done and when it is acceptable, TOSCI certifies the seed variety and allows it for distribution. The seed unit at the Ministry of Agriculture issues a certificate of registration of the seed. Biotechnology in maize seed and maize production Currently, there is an ongoing initiative called Water Efficient Maize for Africa (WEMA), a PPP project led by African Agricultural Technology Foundation and funded by Bill and Melinda Gates Foundation and Howard G Buffet Foundation. The project is being implemented in five (5) African countries - Uganda, Kenya, Tanzania, Mozambique and South Africa and is working with government agencies in the 5 countries to conduct research and developing a Genetically Modified (GM) maize variety, which is drought tolerant. Monsanto a private seed company is donating proprietary germplasm, breeding tools, expertise and trans-genes and the GMO seeds to be produced will be made available for farmers, royalty free and at an affordable cost. Commission for Science and Technology (COSTECH) is the government agency representing Tanzania in the project and it is also coordinating the initiative in Tanzania. A framework and guideline for national bio-safety spells the responsibilities of the various stakeholders concerned with bio-safety. At the national level, the office of the Vice President, which is also the national bio safety focal point, coordinates regulations of genetically modified products. Agriculture Bio-safety Scientific Advisory Committee (ABSAC) and the National Biotechnology Advisory Committee (NBAC) advise the Office of the Prime Minister (PM), the focal point and coordinator of biotechnology. At TPRI, the Post Entry Plant Quarantine Station (PEPQS), which is concerned with safe entry of plant pathogens and insects, is involved with preparations to put in place procedures and inspection manuals for biotechnology inspection. Departments located at PEPQS (i.e. Phytosanitary and Plant Bio-safety) are the national centers of excellence for plant bio safety issues. The plant Bio-safety Office is the secretariat of Agriculture Bio-safety Scientific Advisory Committee (ABSAC), which is under the ministry of Agriculture and the office of the PM. So far, a framework for inspection of genetically modified plants and plant products has been developed, with support from UNEP and the Office of the Vice President. The Standard Operational Procedure (SOP) for plants and plants and plant products are also in place and it was developed from a manual for inspectors which is also already in place. The SOP spells procedures for transportation, storage, cultivation, harvesting, post harvest monitoring and crop refuse and left over’s disposal. SOP exists for maize and cotton. Other standards for other prospective crops will be developed when needed. At the moment, the plant bio-safety office is developing laboratory guidelines for plant containment when the plant is in the laboratory and when it is in the green house. 2.2.2 Improved Livestock Breed The Livestock Multiplication Units

9
Between 1975 and 1984 the Government with the support of The Netherlands Government and World Food Programme a number of Livestock Multiplication Centres (LMUs) that are intended to ease access to good genetic potential livestock in the country. The LMUs are clustered to represent national geographical zones as follows:-
Farm Region/District Sub- stations
Potential (2011)
Livestock Number (2008)
Type of crossbred produced
Mabuki Misungwi- Mwanza
5 6,000 2,902 Friesian x Boran F1
Sao Hill Mufindi - Iringa 4 3,000 1,800 Ayrshire x Boran F1
Nangaramo Masasi- Mtwara
2 4,000 658 Ayrshire x Boran F1
Kitulo Makete - Iringa 5 3,500 915 Pure bred Friesian
Ngerengere Morogoro 2 3,500 628 Friesianx Boran F1
Source: MLFD
While the LMUs are playing a very useful role, their impact is relatively limited due to the low number of heifers production, standing at about 1.6% of the demand. Artificial insemination had been viewed as a better complement to LMUs. Artificial Insemination The distribution of cow semen from National Artificial Insemination Center (NAIC) is through both Government institutions (the offices of DALDOs) as well as private artificial insemination service providers who have been trained and equipped with Nitrogen to carry out the work. NAIC is the sole institution for production and importation of semen in the country. All Artificial Insemination (AI) activities in the country are supervised by NAIC. NAIC secures semen from reputable sources, collects semen, ensures safe storage, sources equipments and materials for AI, train inseminators, participate in husbandry practices and ensures expansion of the services all over the country. The underlying objective of AI services is to improve the genetic quality of livestock. NAIC works through sub centers and also coordinates its activities through the sub centers. Sub centers are in Lake zone (Mwanza), Central (Dodoma), Southern Highlands zone (Mbeya) and Eastern zone(Dares Salaam) and in Mtwara. The aim of establishing sub centers was to bring AI services closer to the people, reduce operational costs and attract more farmers to use the service. The top leadership of the country emphatically encouraged establishing AI sub centers. Before the establishment of sub centers, NAIC worked through five focal points where they had experts concerned with AI only. Supervised by the local authorities, NAIC has extended AI services to all regional and district towns. NAIC imports bulls, semen, and female animals of the required variety to enhance it produce the semen needed. Also NAIC can support individuals to import bulls or semen. NAIC imports semen on the request of customers mainly ranches. One of the limitations for using AI services is the price for semen. One insemination can cost up to TShs 10,000 depending on the location of the farmer. To reduce insemination costs, NAIC supports

10
farmers to form groups (Cooperatives), sometimes in collaboration with other partners (e.g. Land o’ lakes). Formerly, to improve effectiveness of AI, NAIC would do pregnancy tests by checking progesterone in milk. However, that is not being done these days. Generally, demand for AI services has remained low in most areas, partly because of cost issues. Semen and AI technicians are locally available but demand for services have remained low because; (i) AI is not 100% accurate, one insemination does not guarantee that the animal will conceive, sometimes insemination has to be repeated (ii) some farmers have has a negative attitude to AI and have generally convinced other that it is not effective, (iii) underdeveloped communication and transport infrastructure makes insemination less effective, sometimes the semen dies before the insemination. Table 4 below presents a summary of costs for AI services.
Table 4: Cost for AI Services
Item Cost -TShs
Liquid nitrogen 450
Gloves 300
Sheath 160
Transport 2000
Cost of Semen 2500
Total 5410
Source: Interview at NAIC, © MMA, April 2012
Costs for AI services can come down if there are more animals to inseminate (i.e. scale). Cost can be higher than the above if a farmer has few animals. AI services used to be free in the 1970 s and 80s. In the late 80s, a small fee of TShs 200 was charged. Currently, AI service costs TShs 8,000 to more than TShs 10,000. A comparatively higher demand of AI is for dairy animals. Most common breeds demanded are Ayrshire, Freians and Jersey. Fresians are demanded most. In 2010/2011, demand (orders) for AI services was 5,304, 442 per month. The figure is of dosage requested. In Meru, 1,859 AI orders were made in the same period 2010/2011 and about 342 of them were repeated inseminations; meaning that 18% of doses ordered were for repeat inseminations. Repeats can be done more than once. Considering the case of Meru, success rates for AI are high. However, this does not represent the situation in the whole country. There are factors that make farmers demand and use AI services. In Meru where demand for AI services are high; (i) there is assured market for milk, (ii) the distance to AI facility is near, (iii) the AI technician lives in the same village, knows the village well and keeps a good record of the animals in the village (iv) the success rate of AI higher, partly because farmers get good semen because of being near NAIC. Because of the limitations of AI most farmers prefer to buy and use bulls for getting good breeds. Because of the demand for live animals (i.e. bulls and heifers) Arumeru is the main supplier of improved animals in the country. To increase access and use of AI services costs can be brought down if farmers are I groups. The starting point to increase success of AI is good husbandry. Farmers need to be trained on good husbandry practices. Improving the extension service especially AI extension can increase use of AI services if there is a market for farm outputs. Currently, the main challenge for NAIC is low staffing, for example two key members of staff have retired and they have not been replaced. Also the sub center in Dodoma has been down and has not been working. The plant for liquid nitrogen has not been working. There are only two members of staff who are skilled in fixing the plant for liquid nitrogen.

11
The Ministry of Livestock and Fisheries Development has over time implemented various programmes to address the problem of low genetic potential livestock in Tanzania, they include the Bull Centre strategy in early 1970s, the Livestock Multiplication Units (LMUs) from 1970s todate and National Artificial Insemination Centre (NAIC). 2.2.3 Fertilizers Fertilizer Accessibility: Tanzania is among countries with lowest fertilizer application rate of fertilizer nutrients of between 7 and 9 Kgs per arable acre per year (Zhe Guo, Jawoo Koo and Stanley Wood, 2009). By comparison, in the application per acre per season in Asia >100Kgs, in Latin America it is >70Kgs and in South East Asia it is 135Kgs (FAO, in Gou et al., 2009). Fertilizers have quick response to increased production and hence access to fertilizer has been used a tool for improving food security in many countries. Currently the MAFC estimates that annual demand of fertilizer after the year 2004/05 is 385,000mt, supply however has averaged at around 70% of this demand. Annual usage of fertilizers is below the supply, between 1995/96 and 2009/10 consumption has averaged at 70% of the supplied fertilizers and about 43% of the perceived 385,000mt demand. If the country is to reach the Latin America level of 70Kgs/acre/season, with 10.1million hectares under cultivation [ASDP, 2011] the country will need more than 707,000mt and if it is to reach the Asian rate of more than 100kgs/hectare/annum the quantity increases to around 1 million mt of fertilizers. Between 1996 and 2010 the annual growth of the supply of fertilizers has averaged at 7.8%, between 2006 and 2010 the growth improved to an annual average of 11.5% largely response to demand for the NAIVS. This growth in fertilizer supply however, has managed to support a growth in the agriculture sector of around 3% – 4% per annum, which falls short MKUKUTA and CAADP targets, CAADP envisages a sustained 6% annual growth. Studies have established some reasons for low uptake of fertilizers, a survey by Minot found that 63% of farmers won’t purchase fertilizers because the price was “too high”, non-availability was reported by 20% while 10% thought fertilizers are of no use. Guo, et.al., (2009) report that constraints on the demand side include i) inconsistent yield after application of fertilizers; ii) high fertilizer price; iii) limited access to market information to help assess least-cost and maximum return options; iv) limited access to credit tailored to fertilizer, and v) limited knowledge on how to use fertilizer. There are many issues around low fertilizer demand and uptake some issues to go beyond economics and are centered on lack of appropriate messages to farmers hence a need for more education on GAP. (Refer to proposed policy advocacy brief No. 3 in chapter six below). Efforts to Promote the Access of Fertilizer in Tanzania through Subsidy Before Arusha Declaration the supply of fertilizers were under free markets, after the Arusha declaration in 1967 the procurement and distribution of fertilizers were under the Tanzania Fertilizer Company that like many parastatals were mismanaged, the economic reforms in early 1990s phased out subsidy (in 1994) and allowed private companies to import and distribute the inputs. The Government re-introduced the subsidy this time 2003-2007 on transport assuming the subsidy would be passed over to the farmers. The transport subsidy failed, in place the National Agricultural Input Voucher Scheme (NAIVS) started in 2008/09 in 57 Districts after successful outcome of the two pilot districts. The Government of Tanzania and World Bank funded the budget for the NAIVS.

12
The MAFC is yet to carry out an impact assessment on the overall impact of NAIVS, however, looking at macro-economic data and evidence from the field there has been notable increase in output during the period
of implementation of NAIVS, farmers in Iringa for example, have indicated that the NAIVS pack has elevated output per acre from about 4 bags without inputs to 8 to 10 bags with inputs. Distribution on Fertilizers Fertilizers change many hands before finally getting to the end user. Actors in the chain of fertilizer distribution include; national importers, wholesalers, sub-wholesalers and retailers. Together with price fluctuations in the World Market, this long supply chain does partly explain why fertilizers are more expensive in Tanzania and more often reach farmers at the wrong time. There is limited capacity of the dock and off-port hauling and as a result in 2011 the average cargo per vessel was only 12,000mt. To overcome this, Yara has invested some US$20m to develop a terminal for off-loading fertilizers at the port. Another company, Dar es Salaam Corridor Group (DCG) has constructed a bulk fertilizer off-loading system using a conveyer mechanism reducing ships turn-around time and therefore reducing wharfage costs and very likely farm-gate price. In the inland, the fertilizer is transported to zonal/regional distribution centers including Makambako for Southern Highlands by heavy trucks (>30mt) and Tanzania Zambia Railway (TAZARA) railway line. From Zonal hubs the fertilizer is distributed to regional wholesaler, district wholesaler or association/group of users, small-scale farmers access fertilizers through district and ward selling points. A study by IFDC (Bumb, B.L. 2009) indicates that in most Sub Saharan Africa inland transport costs amount to 32% of the retail price of fertilizer. Bumb outlines challenges facing distribution of fertilizers in Sub Saharan African countries to include; unfavorable policy environment; ineffective regulatory regime; limited access to credit finance; inadequate human capital’ restricted multi-country trade; inadequate market transparency and linkages and infrastructure including port handling facilities and road and rail systems. Other constraints in the distribution system include weak quality control and enforcement of regulations, instability in world market prices, fuel costs and Tanzania currency exchange rate. In Tanzania, limited infrastructure for handling fertilizer, especially at the port increases time for offloading fertilizer causing unnecessary increases in costs for the importer, which is passed on
The Dar Corridor Group (DCG) Bulk terminal is the only purpose built bulk terminal in Sub-Saharan Africa for the specification of fertilizers. The terminal can handle all free flowing non- liquid commodities. Demand for fertilizers is continuing to grow rapidly and the DCG Terminal offers a secure, reliable and cost effective means of handling of commodities primarily for Tanzania but also for the demands of East Africa.
Following improved ship turnaround times and the ability to use bigger vessels, customers can save in freight charges and port cost. Cargo is always handled safely and delivered to client in prime condition. Terminal has a capacity of 25,000 cubic meters and bagging can be made according to customer needs in 25kg up to 1,500 kg bags. The DCG Bulk terminal was nominated for Africa Investor Agribusiness Investment Initiative of the Year 2010
Figure 2: Main Importers of fertilizers in 2011

13
inform of high fertilizer prices for the farmer. Fertilizers Application Awareness on the usefulness of chemical fertilizers is relatively high in some agricultural systems especially in commercial products e.g. tea, coffee, horticulture products, etc. Large scale/estate are among intensive users of fertilizers, application in subsistence food
farming systems is very limited and in some instances the very farmer who uses fertilizers in cash crops don’t apply in food crops. The MAFC (in TAFSIP, 2011) estimates that between 11.6% and 13% of households in Tanzania use chemical fertilizers against a target of 25%. Jessica Henson Cagley, J. H. and Plotnick, R (2009) attribute this low usage to, among other things; i) Higher price attributed to transportation costs; ii) Low knowledge level of farmers and agro-dealers, iii) costs, and iv) failure of improved seed to
respond to fertilizers due to a number of factors including poor quality fertilizers (refer to proposed policy advocacy brief No 2 in chapter six below). Kilimo Kwanza aspires to improve the supply of fertilizers through developing domestic capacity to produce fertilizers including support to Minjingu plant to increase production to 300,000 tons and to link natural gas deposits with establishment of a fertilizer plant. On the demand side Kilimo Kwanza advocates for enhance extension services to create demand and to ensure appropriate application of fertilizers (see also the proposed policy advocacy brief No. 3 in chapter six below).
Fertilizer Legal and Regulatory Framework Tanzania Fertilizers Act of 2009 guides the fertilizers industry, outlines the establishment of the Tanzania Fertilizer Regulatory Authority (TFRA), and it stipulates requirements for registration of fertilizer production and distribution companies. The Act also sets terms on importation of fertilizers as well as inspection, sampling analysis. The TFRA is mandated to regulate all matters relating to quality, supplements and sterilizing plants; it is responsible for registration of all dealers and their premises, issuance of licenses to agro-dealers and permits for imports and exportation of fertilizers. The Authority that became operational in 2012 is also required to educate farmers and other stakeholders on the application and management of fertilizers.
Challenges i. Institutional capacity to man the 12 official borders posts with neighbouring countries
– Part IV Sect. 21 (3)/ Part IV Sect. 30 (2) c ii. Packaging and labelling of imported fertilizers is in English while target users (farmers)
comprehend Swahili Part IV Sect. 30 (2) b. iii. Ownership changes as the fertilizer move along the supply chain. Who owns
counterfeit fertilizer? - Part V Sect. 34 (7)

14
iv. Working with other agencies – e.g. TPRI, TBS, TOSCI, Weight and Measures Agency, etc.
v. Penalties – TZS >5million, not more than 10million or and imprisonment of >6 months, not more than 3 years. Is it deterrent enough, what if the consignment is worth much more? Part VIII Sect. 40 (2)
The Abuja Declaration on fertilizer for an African Green Revolution The first resolution of the Abuja Declaration prompts AU member states to increase fertilizer use from the current average of 8 kg of fertilizer nutrients per hectare to 50 kg by 2015. Although no country in Sub-Saharan Africa (SSA) seems to have achieved this resolution by 2007, there are some signs of improvement in the implementation of the Declaration by the countries and by the Regional Economic Communities (RECs) since 2006. However, some progress has been made among member states to develop and upscale input dealers and agro dealers’ networks and capacity building initiatives. Each REC still have a challenge to take concrete steps to translate their programs into substantive changes on the ground in terms of policy and regulatory reforms, lower fertilizer prices and ultimately increased fertilizer consumption.
2.2.4 Agro-Chemicals Access and Distribution of Agro-Chemicals As noted in the introduction part, there is limited knowledge base on agro-chemicals as compared to fertilizers and seeds. Traditionally, chemicals supplied in Tanzania are on-farm pesticides, fungicides, herbicides and post-harvest pesticides, recently however there is an increase in the supply and use of micronutrients. There is limited capacity to produce agro-chemicals in Tanzania; the bulk of it is imported from outside the country. Following trade liberalization NEMC (2010) reported a sharp growth in the supply of agro-chemicals between 2000 and 2003 from about 500mt to 2,500mt respectively, a fivefold increase. In the survey, NEMC established that there are about 57 types of active chemicals in the agro-chemicals sold. Application of Agro-chemicals Part of the causes of low yield is high on-farm and post harvest losses due to diseases and pests, the TAFSIP report estimates that between 14% and 17% of households use agro-chemicals in one way or the other. Again well-coordinated value chains like tea cashew, coffee, horticultural products for exports are well served in terms of chemical applications. Challenges are more with commodities that don’t have coordinating authorities, maize for example used to face a serious problem of ineffective Actellic Super, despite that the problem is less intense nowadays, it is however still prevalent. Fake and counterfeit chemicals affect farmers very much, challenges related to use of agro-chemicals by smallholder farmers are overwhelming and call for more efforts, and these challenges include use of obsolete pesticide stocks and unsafe handling and waste disposal. Legal Framework for Agro-Chemicals Agro-chemicals cut across many elements of economic activities. Acts that address issues relevant to agro-chemicals include the Plant Protection Act, No. 13 of 1997, which has provisions for safe handling and use of pesticides. The same Act gives powers to the Minister to put in place a Code of Conduct for the proper use of plant protection substances. The National Environmental Management Act, No. 20 of 2004 that has a broad mandate on environment protection is also applicable to agro-chemicals especially provisions that regulate Persistent Organic Pollutants (POPs). Plant Protection Regulations of 1999 governs the procedures for importation of pesticides. Tanzania Pesticide Research Institute (TPRI)

15
TPRI was established by Section 18 of the TPRI Act of 1979; TPRI is the competent authority, which undertakes the regulatory function of pesticides in the country. The Plant Protection Act of 1997 Number 13, Section 32 provides for the role of TPRI. According to the provisions of the Act, the Minister of Agriculture appoints the registrar of the plant protection substance. Registration of a product goes through seven distinct steps. (a) A businessperson applies for the registration of his chemical. He submits a dossier, a document, which contains among others, a description of chemical composition of the substance to be registered. (b) TPRI conducts a chemical verification of the active ingredients in the substance. (c) The dossier is evaluated to find out if what is described in it matches the findings by TPRI. (d) There after, the product is registered under an experimental category, meaning it should not be sold commercially. (e) The businessperson provides 10 kilos (for solid substances) or 10 liters (for liquid substances) for efficacy testing. One the efficacy testing is successful, the researcher who conducted the test writes a technical report, which states the efficacy of the product and can also recommend the product for the purpose of which it is being registered. (f) The technical report is submitted to the Pesticide Approval and Registration Technical Subcommittee (PARTS), where three (3) different people read it. Findings are harmonized and verdict is reviewed. (g) The product can then be approved under; (i) provisional category – if some information about the product is missing; (ii) full registration – if no information is missing; (iii) restricted registration – if the product is delicate and requires high expertise to handle. Licensing follows the approval of the product. Fees for licensing are stipulated in section 16 of the Plant Protection Act. TPRI also does Post Surveillance Inspection Monitoring (PSIM) of the products to check if the product is being used as per the law. The minister appoints inspectors and the law gives the inspector powers to enter any premise, which is suspected to be holding a plant protection substance (chemical). Depending on the product and the crop in which it will be used, it takes three cropping seasons from the time the application is made to the certification of the product. The maximum length of time for the process is three years, especially for perennial/annual crops. For vegetables, a certificate can be issued within a year. The efficiency or pro-activeness of the researcher is also a variable that can delay the registration and licensing process. In addition, TPRI have internal constraints and challenges such as low staffing (few researchers and inspectors) and limited working equipments and facilitation. Currently, there are no measures in place to assess the demand and supply for chemicals in the country and the resulting gap (i.e. deficit or surplus). No national assessment for the needs for chemicals has been done. TPRI issues import permits but the import permits do not show quantity of chemicals that eventually imported in the country. A combination of stakeholders should be involved or should play their respective roles towards conducting the assessment of the demand and supply for chemicals. The extension, local governments (DALDOs), regional authority, and the Prime Minister’s Office (PMO) are relevant stakeholders and can be involved in the assessment of demand and supply of chemicals.
Agriculture Chemicals should be safe, effective and efficient. It should be safe in the sense that it should not cause harm to health of the user and to the environment. Effectiveness means it should be able to clear the plant disease or pest it is intended to clear and efficiency means that fees charged for registering and licensing it should ensure sustainability of its delivery system and its use should be enforceable (i.e. the finance and human capacity to enforce its use should be available).

16
A key challenge with the distribution and sale of chemicals is the country is the sale of unlicensed products. Some products being sold in the country are fake, duplicates of licensed ones, and in some cases ineffective (less efficacious) when used, while other chemicals in circulation were banned internationally. The main challenge with regard to agro-chemicals has been wide abuse of applications, high prevalence of fake or poor quality products, limited information on products use and disposals. Weak enforcement capacity is another serious problem facing the agro-chemical industry in Tanzania.
Regional initiatives for harmonization of registration of chemicals The East African Community (EAC) committee on agriculture and food security has been having meetings and deliberations concerning harmonization of laws and policies related to agriculture and food production. There has been an ongoing discussion on harmonization of registration and licensing of plant protection materials. It is noted that the discussions are moving at a slow pace. However, some successes have been made. In principle, all parties are in favor of the harmonization. So far, the wording of the application forms have been harmonized, and so is labeling of packages and containers of plant protection materials. Procedures for efficacy testing is not yet concluded but have been discussed and methodologies developed. Discussions on new (under patent) and generic (non patented) molecule have also been ongoing and focus has been on the length of time to be given to new molecules to remain patented. Discussions have also featured collaborative work on testing and also the need for a referral laboratory in East Africa. It should be noted that TPRI was registering pesticides in the region before the collapse of the EAC in the 1970s.
One of the challenges towards harmonization is that individual countries generate income from the registration and licensing process and therefore, there is fear of loss of income by individual member states due to harmonization. Also, no partner state is willing to take the lead to put up for discussion the issue in question because of fear of being labeled a money monger. So far, the issue is being kept silent, but is generally considered to be one of the concerns dragging the harmonization process.
For deepening harmonization, EAC partner states have to overcome their fears and concerns and address the bottlenecks to harmonization squarely. There is an opportunity for Tanzania to take the lead towards deepening harmonization on policies on plant protection and advocate for TPRI to once again be the host institution for testing and certification of plant protection materials or advocate for TPRI to host the referral laboratory.
2.2 Output markets Managing price risk is instrumental in increasing usage of inputs in two ways. First, when output prices fluctuate widely across seasons and years, farmers have difficulty assessing the potential benefit of using inputs, which may result in sub optimal use. Extreme price fluctuations can also increase the severity of losses in years of surplus production, when prices drop precipitously and risk-averse farmers reduce purchase and use of inputs to limit their exposure to possible losses. Secondly, the relationship between output price and input price (i.e. absolute costs and advantage of using inputs), affects input use. Input prices, as well as output prices can vary significantly across space and through time even within the same country. Where the cost for inputs is higher than the advantage of using inputs, farmers will not use inputs.
If farmers are able to get best prices, which covers the input prices and give a farmer a profit margin, it makes economic sense for them to use inputs. Cases from cash crops (e.g. Tobacco,) and horticultural crops (e.g. tomatoes, onions for local markets) and for export has shown that farmers are demanding inputs and are looking for it and buying it by

17
themselves, because the net gain from sale of output cancels out the cost for inputs and leaves the farmer with more income to spare. The conflict between food security and fully blown export trade in maize is limiting the growth of the maize sector in general and is also limiting the adoption of best agronomic practices where inputs are used. A number of times Government of Tanzania has intervened in the maize market by banning export with the excuse of enhancing food security (MMA 2010 p 2). Export markets (mainly export to Kenya market) offers higher domestic prices for maize. Each time the export ban is announced, prices in the domestic market (e.g. Kibaigwa and Dar es salaam) falls dramatically. When export ban are lifted prices in the export market pulls prices in the domestic market, leading to higher domestic prices.
MMA 2010 study cited a case of export ban in March 2005. Prices declined from $184/tone to $131/tone (29%) while maize production had increased only by 4.5%. A study done by MMA for NAFAKA6 Project in May 2011 showed that in Kibaigwa market, prices fell from TShs. 400/kg to TShs. 320/kg within days from the date when the export ban was announced, a 20% fall in maize price.
Using maize price data from Ratin a comparison of Dar-es-Salaam and Nairobi prices during the period of 2005 shows that Dar es Salaam maize prices were depressed relative to Nairobi prior to the ban but eventually rose to parity. That suggests that the ban was effectively put in place before March 2005. The price decline due to the ban appears to be about 20% in Dar-es-Salaam as compared to Nairobi, but probably was much larger in producing areas, although data is not available in Ratin to confirm. Figure 4 below shows the effect of export ban on the maize price in Dar-es-Salaam.
Figure 3: The effect of export ban on maize price in Dar-es-Salaam Storage has demonstrated potential to enable farmer access better prices, even when a farmer sells maize to the domestic or export market. Inter-temporal gains in prices due to storage are dramatic. This is because prices appreciate as the season progresses. During harvest prices are low and prices
are higher later in the season, four to six months after harvest. Good storage facilities and capacity for storage is still low in Tanzania. Source: Maize prices from www.ratin.net and stored on SERA\Export Bans\Maize Prices
6 http://www.ifdc.org/Projects/Current/NAFAKA

18
3.0 FINDINGS
3.1 Coffee Coffee is one of Tanzania’s primary agricultural export commodities accounting for about 5% of total exports value, and generating export earnings averaging USD 100 million per annum over the last 30 years (Tanzania Coffee Industry Development Strategy 2011/2021). In international market, Tanzania coffee falls in the category of Columbian mild’s group, a valuable category, securing premium prices. The coffee sector provides income to some 4 million Tanzanians, farmers inclusive. Rising coffee prices in the world market, coupled with new high yielding and disease resistant varieties have recently provided higher incentives for framers to grow coffee. National coffee production was 43,443 mt in 2007/8, 68,300 mt in 2008/9 and 35,501 mt in 2009/10. This year’s production (i.e. 2011/12) is expected to increase above last year’s and is estimated to reach 60,575 mt (TCB Annual Report 2009/10). Although Tanzania’s coffee production accounts for only 0.8% of the global output, Tanzania produces some of the world’s finest coffee. Tanzanian premium coffee is 35% of what is produced nationally.
According to statistics obtained from the office of the District Agriculture and Livestock Development Officer (DALDO), Moshi Rural district council, 14,048 farmers grow coffee. Area planted with coffee is 18,779 Hectares. Averagely, each farmer grows coffee on 1.3 Ha of land. Coffee acreages owned by most smallholder farmers range from a quarter of an acre to about one acre although it is typical to see some coffee farms sizes varying from 0.5 to 3 Ha. Yield per coffee tree is between 1 kg and 1.5 kg of coffee cherries. Yield under best practice can reach 5 kilos per tree. Table 5 below presents coffee production in Moshi Rural District Council.
Table 5: Coffee production in Moshi Rural District Council
Year Production (Tons)
2007/8 1,508
2008/9 1,941
2009/10 2,221
2010/2011 1,165 Source: Moshi Rural District Council, © MMA April 2012
In the last four years, coffee production increased steadily, reaching a climax in 2009/10 and last year 2010/2011, coffee production declined. One of the causes to low yield is the age of the trees. Coffee plants may live for more than 100 years but productive for up to 50 years. Although farmers can always rejuvenate their coffee plantations, the age of the tree limits yield. Interviews with farmers revealed that most coffee trees are older than 50 years. Crop management (i.e. use of pesticides, insecticides, mulching, regular weeding etc) also affects yields, with proper management leading to higher yields. Levels of knowledge in coffee agronomy and crop management vary from farmer to farmer and from locality to locality within Moshi Rural. Three input supply systems were observed. The first system of input supply is organized along specific value chains through which farmers sell coffee. The second is the input supply system driven primarily by the private actors - the agro dealers. The third is a subsidized input supply system, which is working under public sector, either through Tanzania Coffee Research Institute (TaCRI) or the District Council, targeting mainly supply of seedlings and related extension services. It should be noted that the three systems are complimentary and a farmer can access inputs through a combination of two or all the systems.

19
Four coffee value chains are identifiable. They include; (i) Kilimanjaro Native Cooperative Union (KNCU) value chain for conventional coffee; (ii) An emerging value chain for organic coffee; (iii) Kilicafe value chain for specialty coffee (iv) Kilimanjaro New Cooperative Initiatives – Joint Venture Enterprise (G32 KNCI – JVE) value chain for conventional coffee and (v) Large estates value chains producing mainly conventional coffee. Issues of access, distribution and application of inputs vary in each value chain and different value chains have different mechanisms of enhancing the three issues in question. Fertilizer and chemicals supply through specific value chains Kilimanjaro Native Cooperative Union (KNCU) value chain for conventional coffee In the past KNCU provided inputs through its Primary Cooperative Societies (PCS) structures. Farmers would access inputs from the PCS and payments for inputs would be deducted at source from farmers’ sale of coffee. The system worked well for a long time until when the economy was liberalized. Liberalization paved way for private buyers of coffee, who do not provide inputs but offer farmers higher prices (usually about TShs 500) above the price the Cooperative Unions is offering. Many farmers opted to sell coffee to private buyers, and defaulted paying for the inputs given to them by KNCU, through PCS. Defaults in the past, made KNCU incur a debt worth TShs 776, 000,000 mainly on inputs provided to farmers. As a result KNCU stopped providing farmers inputs for a long time. Recently, the system of providing inputs is slowly being revived. Having learnt from the past experience, KNCU has revised modalities of providing farmers inputs. The PCS have to guarantee that farmers will payback inputs loaned to them before KNCU advances inputs. Last season/year, KNCU entered an agreement with Balton Tanzania. Balton supplied KNCU inputs (i.e. chemicals and farm implements) worth TShs 100,000,000. Inputs procured from Balton were supplied to farmers through KNCU networks of 68 PCS in Kilimanjaro region. Most chemicals were sold. KNCU estimates the value for demand for inputs to surpass the figure (i.e. TShs 100,000,000) above. Kilicafe value chain for specialty coffee Kilicafe is a brand name for Association of Kilimanjaro Specialty Coffee Growers. Its mission is to help coffee farmers increase their incomes by producing special coffee. In its value chain, Kilicafe provides inputs to its farmer members, links farmers to central pulperies and to markets. Kilicafe is working with about 12,000 farmers in the country. Kilicafe piloted input voucher policy whereby for every kilo of coffee cherry, TShs 50 would be reserved (withheld) to enable a farmer access inputs. Few farmers accepted the policy, but most farmers opposed it, arguing that they should be paid the full amounts due to them so that they would source inputs on their own. When paid all their money, they hardly bought any inputs. Kilicafe entered a contract with Yara to become an agent to supply fertilizers to coffee farmers in Mbinga. An estimate of demand for fertilizers was done and Kilicafe was planning to supply 4,000 bags of fertilizers. However, farmers ordered only 2,000 bags, a half of the volume estimated. Demand increased and now 3,000 bags have already been bought. Kilicafe buys fertilizer from Yara at TShs. 51,000 per bag. Additional TShs 4,000 and 7,000 is added during dry season and rainy season respectively, to take care of costs of transporting fertilizer to Mbinga. Kilicafe adds a small margin to sustain the input fund but private dealers would add another TShs 5,000 on top of the transportation costs as their profit margins.

20
A number of farmers used the fertilizer bought from Kilicafe to grow other crops. Farmers hardly use inputs in coffee because they do not see the incentive in using inputs as all the coffee produced by a farmer gets sold. Few farmers use farmyard manure, meaning that they know the concept of plant nutrition and maintaining soil fertility. G32 KNCI – JVE value chain for conventional coffee Kilimanjaro New Cooperative Initiatives – Joint Venture Enterprise abbreviated as G32 KNCI – JVE is a joint venture enterprise with registration No. 5570 and direct export No. TCB/DE/11/043. The group was started by thirty-two (32) Primary Cooperative Societies (PCS) formerly members of KNCU, because of the discontent that KNCU has failed to meet its obligations. The objective of G32 KNCI – JVE is to help members sell coffee at better prices. Since 2002/3 season, the group has been collecting and selling coffee as a separate entity. Currently, G32 KNCI – JVE has 20 active members located in Rombo, Moshi Rural, Hai and Siha Districts. So far, most of the coffee collected is sold through the Moshi coffee auction conducted by the TCB. In 2006, G32 KNCI – JVE exported one container (18 tons) of coffee to Japan and now has increased export to averagely 6 to 8 containers each year. It is targeting entry into European and American markets. G32 KNCI – JVE is not directly involved in inputs provision but it links it members (PCS) with other bodies/institutions which can facilitate farm activities of members. Working with other organizations it has facilitated training of farmers in coffee agronomy, offers technical/advisory services and empowers PCS to be self-reliant. It has trained PCS to be financially viable and bankable and linked them to borrow from the cooperative bank. G32 KNCI – JVE facilitates PCS to access finance through the WRS approach and has succeeded to linking members to finance, partly because of its influence at the Cooperative Bank. Key strength of G32 KNCI – JVE is that it has been able to pay members higher prices for coffee and on time. This is primarily because it sells member’s coffee in foreign currencies, and thereby enabling members to get higher pay due to fluctuations in exchange rates and depreciation of the local currencies and also because it incurs lower overhead costs due to its small size. Because of low overheads minimal deductions are made from sales of coffee to run the enterprise. It deducts TShs 15 to TShs 20 from a kilo of coffee sold and 40% of the gain in the exchange rate from the price of coffee. KNCU deducts more that TShs 20 from a kilo of coffee sold. In the last auction, the enterprise sold a kilo of coffee at USD$ 6.5. It is now advocating for PCS to start accounts for self-reliance and through this account, farmers can also access funds for purchasing inputs. An emerging value chain for organic coffee KNCU and G32 KNCI – JVE have PCS which are growing organic coffee. However, no PCS holds organic certification. Under G32 KNCI – JVE, four PCS in Rombo are to get certification for growing organic coffee. Certain chemicals are not used in the production of organic coffee. However, seedlings and fertilizers are used. TaCRI, KNCU and Moshi Rural District council sell seedlings. Farmers who would like to buy fertilizers can purchase it from the private dealers. Large estates value chains producing mainly conventional coffee. There are 17 estates in the district, owning up to about 3,000 hectares of land. Estates have own mechanisms of procuring and using inputs, usually through private businesses.

21
Fertilizer and chemicals supply through agro dealers Fertilizers and chemicals are mainly supplied by the private sector (the agro dealers) and to a lesser extent through specific value chains, such as that of KNCU and Kilicafe. Fertilizers and chemicals are more easily available in rural areas but most especially in Moshi town and in trading centers along highways and feeder roads. Most agro dealers especially those stocking inputs for the input voucher system stock chemicals and fertilizers. The input subsidy is credited for increasing availability of fertilizers and chemicals. However, availability of fertilizers and chemicals in very rural areas is still limited. Seedlings supply TaCRI, Moshi Rural District Council, KNCU and organized farmer groups have nurseries where seedlings are produced. Quality seedlings for improved varieties are fairly available although some farmers still find problems accessing. Availability of seedlings varies from location to location. Factors influencing availability of seedling include; (i) distance to TaCRI, District Council or KNCU nurseries, (ii) road network and linkage to sources of seedlings, and (iii) farmers interests and own demand initiatives. Improved varieties of seedlings are on high demand. TaCRI produces 15 million seedlings every year but it is not enough to meet the current demand. In the recent past demand for seedlings have nearly tripled. In alliance with TaCRI, farmer groups produce sixty percent of the seedlings. The main technology applied has been clonal multiplication. Tissue culture technology is expensive and is skills intensive. From a total of 260,000 Ha of coffee, 19,000 (i.e. 7.3%) have been replaced with the new improved varieties. Farmer groups located in places, which can be accessed easily (e.g. in Mwika) have mother plots and nurseries of the improved varieties and are doing on -site multiplication. They receive frequent visits by extension staff and TaCRI. On the other hand, other farmers (e.g. Kwampare Wakati Farmer Group) still find it hard to access seedlings of improved variety, partly because they are isolated from services (i.e. have poor road networks linking them to District and TaCRI) but also partly because they have not been proactively looking for or demanding services. In is important to take note of the various effective means of financing production that have dramatically increased farmers access to finance for inputs and other innovative pipeline approaches targeting the coffee value chains. Kilimanjaro Cooperative Bank Limited (KCBL) KCBL have two main products; coffee trade financing and input financing. Details of how both products have been managed are presented below. Trade financing was launched in 2002. Through trade financing, KCBL extends loans to AMCOS and Rural Cooperative Societies (RCS). Minutes of management meetings of local cooperative society are sent to the Regional Cooperative Officer (RCO). Upon receipt of such minutes, the RCO issues a Maximum Liability Certificate (MLC), which guarantees farmers to access loans from KCBL. The cooperative presents minutes of management meeting, MLC, audited accounts, a projection of crop collection and an application letter, which states an amount they would like to acquire from the bank. The bank prepares and overdraft agreement, which is signed between the bank and the AMCOS/RCS. AMCOS collects crops from members and brings it to the warehouse. The warehouse issues a

22
receipt (three copies), which acts as security for the crop. Copies of receipts are circulated between the warehouse, AMCOS and the bank. The bank issues money to AMCOS and AMCOS pay farmers at farm gate prices. AMCOS are tasked to collect loans and return it to the bank. Under the Agriculture Input Trust Fund (AGITF), government deposited 200,000,000 to KCBL in 2007. Since then, KCBL has been loaning the amount to farmers, through SACCOS and AMCOS at an interest rate of 10% per annum at a reducing balance. Loans are strictly provided for inputs. Proceeds accruing from the loan are appropriated between the bank and AGITF at 8% and 2% respectively. Umbwe Ndoo SACCOS, which is one of the success cases for SACCOS and input financing in Moshi rural have benefitted from KCBL loan facility. In input finance, farmer organizations do not need a guarantee as the AGITF deposit is in one way, a guarantee for farmers. However, farmer organizations are tasked with monitoring that farmers pay their loans. So far, 18 farmer organizations (i.e. 15 SACCOS and 3 AMCOS) have benefitted from the input finance facility. The experience of KCBL is that the 2008/9 world economic meltdown affected coffee prices internationally and subsequently, national prices as well. Low domestic prices for coffee affected demand for credit because the demand for inputs went down. In addition, one farmer organization mismanaged the loan. The loan was not used for buying inputs - the main purpose for which it was borrowed. On a positive note, there is a high demand for inputs and the inputs loan is not enough. The high demand is also due to the low interest charged on the loan. It is however not clear if the bank is making profits by lending at a low interest rate of 10% per annum, given the high rates of inflation of 19% observed in the first quarter of 2012 and the last quarter of 2011. In 2003, KCBL introduced the system to maize and paddy. However, it did not work well as there was no suitable storage facility for maize, which affects the willingness to store. Storage is a very important factor in maize marketing as output price variations across the seasons are reasonably high. Farmers who have facilities and interest to store fetch higher prices when maize is scarce. CRDB CRDB and Kilimanjaro Cooperative Bank Limited (KCBL) have been providing financing for coffee production and marketing. CRDB extends credit to coffee traders directly but extends microfinance credit to farmers through CRDB Microfinance Limited, a microfinance company under CRDB. Microfinance credit is lent to farmers SACCOS and the SACCOS lends to members, many of them farmers. Currently CRDB is lending to 34 SACCOS in Kilimanjaro, many of them are repeat clients for more than five years now. Repayment rates are more than 97%. Although members of SACCOS borrow money for various reasons (i.e. farming, trading, etc.) SACCOS have given a number of coffee farmers access to credit to finance production (i.e. inputs and labor). Umbwe Ndoo SACCOS Started in November 2006 with 84 members. Currently Umbwe Ndoo SACCOS has 1,149 members, 519 of them men and 517 females. The SACCOS has about five types of loans i.e. farm (crop) loan, building loan, business loan, education loan and loans for rearing animals. Farm loans are for viable crops such as coffee, bananas and sometimes, horticultural crops. About 519 members growing coffee got input loans from the SACCOS. Occasionally, the SACCOS brought inputs closer to the members and at other times, members got loans and purchased inputs on their own.

23
Amounts of loans lent to members range from TShs 100,000 and can reach TShs 10, 000,000. Lending is charged interest rates of 1.75% per month or 21% per annum. Repayment has to start in the next month but special repayment terms can be arranged through a consensus between the loan officers, the loan committee and the borrower. Longest grace period is one year. A borrower has to get guarantees from four members who have accounts with the SACCOS. The amount lent is equated to the savings of the four members guaranteeing the borrower. Currently, members’ savings totals TShs 172,480,622 and this constitutes most of what is lent to members. An annual budget of 10% is set aside for capacity building and trainings of members. So far members have got trainings in entrepreneurship and business management and livestock keeping. Constraints have been the small size of the working capital and 98% of funds loaned to members are from member’s savings. In addition, there have been cases of delayed payments, which often attract a penalty. Also, there is limited infrastructure, for instance, the SACCOS own only one computer, in which all the data and records are stored. The SACCOS have not been paying members any dividends, but plans are underway to do so and payments will depend on the number of shares a member owns. The ambition of the members is evident. The management would like the SACCOS to become a bank in the future. Umbwe Ndoo SACCOS owes its strength to the self-selection process and the sound and devoted administration it has got. The founder and chairperson of the SACCOS is a well-educated businessman in Arusha town. Also the products make it able to meet the diverse needs of its clients and members. The interest rate it charges has made it able to generate internal revenues and profits. However, the SACCOS cannot give an individual borrower a loan of more than TShs 10,000,000 because it is limited by the size of the amount it can offer as loans. National Micro Finance Bank (NMB) – Moshi NMB is the bank where agro dealers go to get reimbursement for input voucher they received from farmers through the National Agricultural Input Voucher Scheme (NAIVS). Local Government Authorities (LGA), through the office of the District Agriculture Livestock Development Officer (DALDO) is responsible to issue voucher to farmers. The central government deposits to the bank a sum of money, which matches the number of voucher issued to agro dealers in a particular location. NMB’s role is only to verify if an agro dealer presented the right voucher and cashed it. In the second half of 2011, agro-dealers encountered delays in getting reimbursements for voucher received from farmers. The delay was because the central government did not deposit money to NMB on time. There are also other delays in providing the voucher and in a number of cases, farmers got vouchers in the middle of the farming season when they do not need the inputs. In the 2011/12 season the process of issuing vouchers to farmers had again been behind schedule. By March when it was the beginning of the farming season and a number of farmers had already planted maize without any inputs. Delays as those mentioned above serve to raise even more concern about the poor and uncoordinated manner in which the general administration of the voucher system is being done. NMB is coming up with a product called Kilimo loan, which is targeting the agriculture sector. A farmer should have a Kilimo account with the bank. Proceeds from sale of farm

24
products should be deposited in the Kilimo account. After a period of six (6) month, the farmer can access up to three times the balance in his account. The Kilimo account has been piloted in Mtwara and Lindi and was successful. It is not known when the product will be launched but currently, discussions are under way to roll it out. In addition to the balance in the farmer’s account, the bank also values produce when it is still in the farm. In Mtwara and Lindi, cashew nut trees were counted and estimates were made of the value of the crop in the field. Coupled with taking the track record, history and credibility of the farmer, the two innovative approaches mentioned aims to take care of the question of collaterals and security of the loan, which in many cases hinders farmers from accessing bank loans. Because of a push by the Rabobank for NMB to lend to farmers but also following the successes of KCBL and CRDB in Kilimanjaro region, National Microfinance Bank (NMB) will also start providing warehouse financing. NMB is looking at increasing returns to farmers and as such it is striving to address other obstacles to increases of returns to farmers by advising farmers to choose best sales options that maximize returns. NMB has been holding sensitization meetings with leaderships of Agriculture Marketing Cooperative Societies (AMCOS) to advise them on the inter-temporal advantage of storage of coffee; and to sell coffee directly through the auction, where they will gain more by avoiding management costs imposed by the regional cooperative - KNCU and from being paid in foreign currencies. When paid in foreign currency, farmers can gain more from the appreciation of exchange rates. The experience of CRDB and KCBL is that the strength of management of farmer organizations (i.e. SACCOS or AMCOS) makes or breaks the success of the business of lending money. A careful pre-selection AMCOS to work with is critical. Common criteria for selection of farmer organization include; number of members, strength and stability in leadership, trends of increases or decreases in deposits, etc. The bank does due diligence prior to lending to the farmer organization. Also, personal knowledge of and rapport with leadership of the farmer organization is important.
3.1.1 Coffee agro inputs access, distribution and application Access A quick analysis of cost for seedlings of improved variety revealed that it is affordable. Farmers can attract extension support and also lower costs for seedlings by forming a group. TACRI sells improved seedlings to farmers at subsidized prices (i.e. TShs 50/seedling to farmer groups and TShs 500 to individual farmers). Through funding from District Agriculture Development Plans (DADPS), the district council also subsidizes prices of seedlings. It sells seedlings of improved variety for TShs 500. KNCU sells seedlings of improved variety at TShs 200. The market price for seedlings of improved variety is TShs 1,000. The benefit from planting improved variety (i.e. higher yields and disease resistance of the crop) is higher in the long run, starting from the second and third year as yields continues to increase up to about the fifth year when a farmer does stamping. The cost for transporting seedlings is averagely TShs 500 per seedling depending on the distance over which it is to be transported. Seedlings are available at all times, although farmers usually prefer to plant new seedlings at the onset of the main rainy season. Common practices have also been for farmers to replace the old coffee plants progressively as costs for replacing the whole plot at once is high and also farmers need to have some source of income during the time when the new varieties of seedlings planted is not producing.

25
Fertilizers are less affordable and farmers consider it to be expensive (urea is about TShs 75,000). In addition, the scale of production (i.e. small farm sizes, sometimes a quarter of a acre) leads to low expected yields, making use of fertilizer uneconomical. The generic farm risks of dependence on nature makes perceived risks of using fertilizer substantial. Although the market for coffee is less volatile, farmers may not obtain the returns in crop yields or revenues from crop sales necessary to pay for the fertilizer used. Chemicals and fertilizers are more available during the main rainy and cropping season because that is the time when it is most needed. Farmer groups (SACCOS, AMCOS or PCS) are very instrumental to make inputs affordable by providing credit (i.e. cash or input on credit). When financial institutions deal with an organized group of farmers instead of individual borrowers, the information and administrative costs of processing and collecting loans are reduced. Also, the group guarantee system helps reduce the security requirements (collaterals) for the loans, making loans more affordable by farmers, thereby increasing farmers’ ability to afford inputs. Distribution In the case of KNCU conventional coffee, and Kilicafe specialty coffee, distribution systems for chemicals, farm implements and fertilizers are replicas of the respective value chains. The two chain leaders are responsible to source, transport and deliver inputs to farmers. TaCRI is the sole supplier of coffee seedlings for mother plots and the technology for multiplication. KNCU, Moshi Rural District Council and farmer groups are involved in multiplication and distribution of seedlings. Individual farmers get seedlings for planting through the three institutions mentioned later. These distribution systems have been effective to supply seedlings and extension information to farmers.
Application Coffee farmers most commonly use pesticides (Dursban and Celeron) because farmers consider that adverse risks of not using pesticides and perceived loss due to pest damage to be very high. In addition, the cost of pesticides is relatively low (i.e. about TShs 25,000 to TShs 30,000 per bottle, which can be used more than once). However, most farmers do not have the skills to correctly apply chemicals. Access to technology (i.e. availability) and the accompanying inputs and its costs (affordability) affects adoption. Also the technical knowledge requirement of a technology or usage of inputs affects its adoption. TaCRI and the district council have collaborated in disseminating technology for production and dissemination of new varieties of seedlings, which are disease resistant. There has been good adoption of technologies among a number of farmer groups and individual farmers. Many farmers can graft coffee, and a number of farmers have been trained to do and can do vegetative propagation (i.e. prepare seedlings from cuttings). Although a number of farmers are planting improved seedlings and also although coffee is not a new crop in Moshi, a number of farmers do not know best practices for coffee agronomy. A number of farmers do not know the recommended spacing of coffee, preparing holes for planting, application of fertilizers/manure; stumping and application of chemicals.

26
Farmers rarely use organic fertilizers in coffee production. A few use farmyard manure. Farmers use chemicals (insecticides) the common brand being Dursban. Coffee in Mbinga Coffee is the dominant cash crop in Mbinga, in fact Mbinga is the second largest producer of coffee in Tanzania and leads in production of Robusta coffee7. The District also produces tobacco, cashew and sesame, timber though not listed under crops but provides significant source of income to farmers. Table 6 shows relative importance of coffee in Mbinga.
Table 6: Relative Importance of Coffee in Mbinga
2005/06 2006/07 2007/08 2008/09
Ha Mt Ha Mt Ha Mt Ha Mt
Coffee 35,430 8,244 36,453 12,935 35,479 9,292 38,679 17,563
Tobacco 456 264 41.69 72.3 118 22 153 114
Cashew nuts 2,813
29 40,428 33
2,820
19
2,840 20
Sesame 192 192 96 11,484 103 170 84 82 Source: DALDO – Mbinga, data during interview with MMA, March 2012
Coffee support the livelihood of 58,652 farmers in Mbinga found in 35 wards out of the total 418, it is the main source of revenue for District Council. The crop however faces many challenges including that of low productivity, on average a farmer produces 250gms of parchment coffee per tree that is about 135kgms/acre or 350kgs/ha using the traditional tree density of 540trees/acre. This contrasts sharply with the recommended output of 3kgs/tree and a density of 1,000 tree/acre, which gives a potential output of 3,000Kgs/acre. The low output reported by District Coffee Subject Matter Specialist was also confirmed at the focus group discussion where the highest producer in the group produced 25% of the recommended yield, the minimum was at 7% and the group’s average was at 14.4%9. This is one strong evidence that if farmers would have access to appropriate skills and inputs there ample room to improve their income and livelihoods even within the existing acreage. Access, Distribution and Application of Clonal Seedlings in Mbinga Coffee production requires significant amount of chemical fertilisers and agro-chemicals, being a perennial crop the nature of access, distribution and application differ from annual crops. Here the concern has been the appropriateness of old varieties because most trees
7 Kagera region specialises in Arabica coffee
8 Before the separation of Mbinga into Mbinga and Mbamba Bay Districts
9 The focus group was done at Mhekela Village
Investment Opportunities in Coffee Seedlings Nguvumpya Farmer Group running a clonal coffee nursery was formed in 2007 with the support from TaCRI aiming at producing 24,000 seedlings/annum under good practices. The group however managed to produce 540 seedlings only in 2008, 1,700 in 2009 and 3,500 in 2010. Low production was due to low number of parent stock and the drop in 2011 to 1,800 was due to lack of water for irrigating the nursery. The nursery supplies trees at TShs 500 for non-members, hence a potential to earn TShs 12,000,000 per annum from a half an acre plot.
27
in Mbinga are more than 20 years hence we discussed the adoption of new varieties being promoted by TaCRI. Starting 2002 Tanzania Coffee Research Institute (TaCRI) has been working to disseminate new clonal (Colombian mild) coffee trees that have 2-3 times more output per tree and are resistant to coffee berry disease (CBD) and coffee leaf rust. European Union and Coffee Research Cess fund the Programme. Apart from Mbinga in Ruvuma, TaCRI is also active in Mbeya (Mbozi), Kigoma, and Mara. The dissemination arrangement has two strands; strand one is supplying seedlings to farmers directly from TaCRI nurseries while the second approach is through development of village group and individual nurseries. Some 160 farmers were sensitized to establish clonal coffee nurseries in the District, however at the time of the study only 20 were active. The private nurseries failed to pick up because of a directive that lowered the price from TShs 200 to TShs 50 per tree by the District Authorities hence most farmers gave up. Following successful performance of the new types, subsidy by Local Government and sensitization initiatives demand rose significantly. A private investor is developing a 5,000 acre coffee farm also helped to push the demand further up, by March 2012 the price initially planned at TShs 200 rose to TShs 1,000. Many farmers reported unplanted holes for two consecutive years due to lack of seedlings. In order to serve the growing market, some groups and individual farmers take this opportunity by operating nurseries. However, emphasis on groups at the expense of individual entrepreneurs and a subsidy that is not well targeted by the government has affected the good intention of improving availability and affordability. The Case of KIMULI Agricultural Marketing Cooperative Society (AMCOS) Part of the reasons for low coffee output per tree is limited access and application of fertilisers and chemicals in coffee farms. Farmers interviewed have fair knowledge on what a typical coffee farm needs, they were able to mention the following set of inputs; widely used fertilisers are Urea and NPK and chemicals used are Suba, celecron, Novathion and Mocron. In most coffee producing areas the crop was organised under cooperative marketing arrangement, the benefits of marketing structures cascaded down into supply of inputs. Below is a case of KIMULI AMCOS, which shows advantages of collective procurement. Kimuli AMCOS was established in 1993, its name KIMULI represents the villages of Kitandu, Mtama, Uturi and Lipumba in Utiri ward. It has 326 members though on average the cooperative serves around 700 – 1,500nfarmers in a season. KIMULI has been engaged in input supply since 1994/95 by linking with buyers of coffee cum input suppliers with farmers in the ward. Soon after the collapse of the Mbinga Cooperative Union, the AMCOS received expressions of interest from various coffee trading companies, they included Suchak, Dorman, Olam, Taylor Winch and Tropex. Suchak was selected and worked with KIMULI between 1994/5 to 2000 because he offered better business terms including taking the risk of supplying inputs on credit. The inputs were principally fertilisers of Urea, SA and CAN while chemicals included Thionex, Dursban, Smithion and Selecron. The AMCOS has a warehouse with a capacity of 5,000 bags and in 2011/12 it served 1,500 farmers.
The increased demand for clonal coffee seedlings confirms that intrinsically farmers have a relatively higher adoption rate; they however have to be convinced after assessing the potentials and risks through demonstration.

28
The AMCOS and Suchak made arrangement that reduced the costs and minimized risks of default, Suchak used to deliver inputs during the months that farmers are selling coffee i.e. September and October, recovery was through deductions from parchment delivered to the warehouse in October and November. The synchronisation of input delivery and selling of coffee had several advantages: -
The opportunity cost of Suchak tying working capital (implicit interest on loan) was reduced to about 3 months i.e. repayments were effected in November and December.
The farmers did not just use the inputs for coffee but also for maize that is sowed towards the end of November and early December, hence timely access.
In the months of September – October roads are dry hence more passable than in January through March for both Songea – Mbinga and Mbinga – Kimuli segments10.
This arrangement helped the AMCOS not to contract loans from banks hence avoided paying interest, this cost effectiveness and member contributions helped the AMCOS to accumulate its own working capital. The AMCOS is currently purchasing its inputs directly from Makambako benefitting from the margin that agro-dealers make. The ex-warehouse prices of inputs has always been below or equal to prices in Mbinga town, farmers in the ward don’t have to incur costs associated with transport purchase of inputs from Mbinga town that averages at TShs 3,000 per bag. Following successful operations, KIMULI has been used as input supply hub for research activities in the area, it is providing inputs to farmers being supported under AGRA and farmer groups under Uyole – ARI. The direct supply link between AMCOS and national suppliers has led to very few cases of ineffective chemicals or inputs. From the producer cash flow analysis, the farmer should be able to afford the inputs. Under current traditional farming system a farmer earns TShs 1.515million, farm management and input costs is at 0.711 million leaving a gross profit of TShs 0.804. The major cost component is labour which in this case stand at 0.341 million or 23% of the revenue. The constraints to purchase of chemicals is the cash flow, inflows from coffee come in October, November and to small extent in December, costs are however spread throughout the year as the Figure 4 below indicates. Figure 4: Cash Flows of a Coffee farmer in Mbinga
10
The 80 kms of the 100kms Songea – Mbinga road is under construction to the level of tarmac and to be
completed in 2013.

29
Attempt to Distort Inputs Market: KIMULI offers a good case where Government Programmes/Projects disturbed an efficient supply chain that is based in market forces. AGRA is piloting on farming systems that will ensure sustainability of soil nutrients by promoting nitrogen-fixing crops (Soya) for alternating with maize. AGRA recruited 60 farmers who were to be assisted with a TShs 75,000 subsidy on inputs package worth 225,000. The remaining TShs 150,000 was to be taken as a loan from a SACCOS. At a later stage AGRA complained that the 24% interest on the input loan was too high and stopped the agreement in favour of Mbinga Community Bank (MCB) that came with a 10% interest rate offer. However, MCB failed to provide the cheap loans it promised and AGRA had to get back to KIMULI though they had left a scar by impressing farmers that the 24% interest was “too high” and that there was a cheaper alternative elsewhere. AMCOS Involvement in NAIVS: In what seem to be a paradox, the primary cooperatives of KIMULI and LUWAITA11 have attempted to get involved in NAIVS, however their due diligence on NAIVS process led them to decline District authority’s request wanting the AMCOS to handle inputs under NAIVS. The AMCOS cited unreliability of the Government with respect to honouring payment for redeemed vouchers as the main reason for the refusal to take part in NAIVS. The Executive Secretary at KIMULI changed his mind at eleventh hour. Had they participated, they would have seriously disrupted the AMCOS cash flows leading deep resentment by members undermining cohesion of the society. Transport of Fertilizers in Mbinga Transport is a major factor in the setting of final fertiliser price, as indicated in the introduction section background, between Songea and Dar es Salaam transport add 15 – 16% of the cost. Charges per bag of fertiliser between Makambako and Mbinga has increased from TShs 1,500 in 2009 to TShs 2,500 and 3,000 in the current fertiliser supply season (October 2011 –March 2012). This 100% increase has been caused by increase in operating costs that include diesel which during the same period rose from TShs 1,200 per litre to TShs 2,290 by March
an increase of 91%, good quality tyres from TShs 1.2 per piece to TShs 1.68, an increase by 40%. The same trend has been noted for truck spares whose prices tend to change with exchange rate. Major business driver cargo for these large truck owners has been transport of parchment coffee from Mbinga to Makambako whereby the District production has fluctuated around 7,500 - 14,000 an equivalent of 250 – 500 truck trips. There is significant outbound cargo of timber, beans, and maize. It should be noted that in order for transporters to make money there has to
11
LUWAITA AMCOS was registered in 1983 and had operated under MBICU until 2000, under the supervision
of the District Government, LUWAITA was advised to consolidate activities of other AMCOS that were being
served by Mbinga Co-operative Union (MBICU), it services a network of 29 AMCOS that operate in 62 villages.
Figure 5:Trends in Determining Transport Charges

30
be a return cargo hence the inflow of fertiliser is very dependent on the timing of these outbound cargo and particularly coffee that has a well-defined transport period i.e. September – November. Without these outbound cargo transport charges for these cargo would increase from TShs 50,000 to TShs 100,000 per mt. While the cost of transport is highly correlated to fuel price, the completion of a Songea-Mbinga road will improve competition so as to check increases in transport charges that are due to inefficiency in the supply system.
Lessons on Access, Distribution and Applications of Inputs by Coffee Farmers in Mbinga There are a number of lessons that can be drawn from Mbinga with respect to access, distribution and application of inputs, however, for major lessons evolve around strategy for improving adoption of modern farming technologies. (i) Investment in inputs has higher returns, instead of subsidy being an agenda,
access to finance and extension skills are paramount. We have seen that even with current farming systems coffee farmers can afford to purchase and use inputs. Skills on household budgeting and cash flow management are necessary and this is completed with financial services.
(ii) It can be learned from TaCRI, coffee model that intervention in promotion of seeds requires organized and well-funded and targeted interventions. Furthermore, the private nurseries augment public sources of seedlings. However, a caveat is noted in the fact that support to seedlings business did focus more on farmer groups; individual agro-entrepreneurs were not being supported. Most groups disbanded the nursery business because of limited benefit per member at the prevailing market prices. While the District provided subsidy for the seedlings from the groups and the TaCRI farm, inability of groups to carry out marketing impaired Programme results. As it will be noted later in the policy brief, it is imperative that public offices recognize the presence and roles a private sector12 can play in the development of agriculture. While it is understood that public resources should be directed to the needy, efforts should be made to balance between spurring growth and welfare maintenance.
(iii) AMCOs in Mbinga indicate that availability of robust, actor-owned structures and systems help in improving access, distribution and hence utilisation of inputs. The strength of the AMCOS emanates from (a) long experience in the business, (b) ability to provide its members with better priced (affordable) inputs due to economies of scale (c) access to working capital from the financial institutions that is readily available to AMCOS is another important strength in improving access and distribution of inputs. The CNFA/TAGMARK training were backed by credit guarantee that enabled agro-dealers to beef up their working capital which in turn improved availability, affordability and timeliness. The expiry of input credit guarantee has shaken the fertilizer distribution system to a large extent, the full impact of the move can be understood during the close of 2011/12 farming season.
(iv) Failure by AMCOS to take up NAIVS opportunity is strong evidence that the scheme lacks business incentives something that raises curiosity as to how those inside the NAIVS make money.
The summary of coffee agro inputs dynamics and constraints are depicted in table 7 below.
12
In the business context, the private sector is defined by the World Bank as persons or organizations that are
not public undertaking an economic activities with an objective of making profit.

31
Table 7: Summary Coffee agro inputs dynamics and constraints COFFEE SEEDS/SEEDLINGS FERTILISER AGRO CHEMICALS
ACCESS Status
Affordable/Highly subsidised (TaCRI, LGAs) Insignificant use of industrial fertilisers
Extensive use by all farmers
Main constraints
Very old trees – North 50+years, South 40+ years
Inadequate number of clonal coffee seedlings
Misuse (poor knowledge, unethical marketing practice)
Infiltration and use of counterfeit
DISTRIBUTION Status
Good distribution system of seedlings by TaCRI
Private sector led
Good distribution system in the North
Distribution system in the South is fair (mixed scenarios)
Main constraints
Demand is high than supply (unmet demand)
Long distances from farms to nurseries and TaCRI
Long supply chain
Poor infrastructure (storage facilities)
Weak agro dealers (technical knowledge, finance, business skills)
Presence of counterfeits
APPLICATION Status
Farmers are very well informed on use and benefits of improved seedlings
Insignificant use of industrial fertilisers (North manure is popular)
Farmers are very well informed on use ad benefits of appropriate application
Main constraints
Low application of fertiliser/manure in the South
Limited knowledge on benefits, use, handling and storage
Misuse and application of counterfeit
Health hazards and environmental degradation
COFFEE Impact of constraints
Low yield (North: 1-1.5Kg/tree/season) Low yield (North: 1-1.5Kg/tree/season)
Low yield (North: 1-1.5Kg/tree/season)
Ongoing mitigation strategies
Public sector Public sector Public sector

32
Policy development and reforms: Kilimo Kwanza, Seed Act 2003, Coffee Act, TCB Act 1984/2009, Tanzania Coffee Industry Act 2001, Cooperative Act 2003, TaCRI
Private Sector
Individual entrepreneurs, Coffee Cooperative Societies, SACCOS, AMCOS, Private companies
Civil Society
TechnoServe,
Policy development and reforms: Kilimo Kwanza, Fertiliser Act 2009, TFRA Act 2009 (not operational), NAIVS, Abuja Declaration, NARI, Merchandise Marks Regulations Act, 2002/2008, The Penal Code 2002, FCC Act 2003, PPP Act 2010, etc
Private Sector
NA Civil Society
TechnoServe
Policy development and reforms: Kilimo Kwanza, Pesticides Control Act 1984, Plant Protection Act 1997, TPRI Act 1979, NARI, Merchandise Marks Regulations Act, 2002/2008, The Penal Code 2002, FCC Act 2003, PPP Act 2010, etc
Private Sector
CropLife Tanzania (12), Coffee Cooperative Societies, SACCOS, AMCOS,
Civil Society
TechnoServe

33
3.2 Cereals (maize and paddy) Maize is the most important food subsector in Tanzania, in 20010/11 MAFC estimated that 3.3 million tons were produced and that maize is grown by over 90% of smallholder farmers on 4.9 million Ha of land, with average land holdings of 0.67 Ha or 1.65 acres. The production levels are just meeting local demand with very limited exports of approximately 90,000 tons per annum and small irregular imports of mostly seeds or for food security. Being the most important staple crop in the food security policy, it has been subject to regular export bans. For a long time the food security strategy of the Government of Tanzania (GOT) has been to guarantee food availability by restricting exportation of maize. The strategy has had several criticisms ranging from distortion of the market, crowding out incentive for production and input use and that it has not actually been effective in enhancing food security. Below is an account of access, distribution and application of inputs in cereals drawing lessons from Karatu, Mvomero, Kilosa and Iringa rural. Karatu District Maize is the leading food crop and also a cash crop in Karatu District and no more than 80% of farmers in Karatu grow maize. Most times maize is intercropped with pigeon pea, and beans. Wheat and barley is also grown on high altitudes like in Rotia, Mbulumbulu and Oldeani wards. Finger millet, sunflower, safflower, chickpea, and coffee are grown is small quantities. Table 8 shows main food crops grown in Karatu.
Table 8: Main food crops grown in Karatu District
Food Crops
2006/2007 2007/2008 2008/2009 2009/2010
Ha. Tons Ha. Tons Ha. Tons Ha. Tons
Maize 28,400 48,280 26,004 75,412 27,632 51,672 44,429 102,851
Beans 5,842 2,749 6,263 752 5,876 8,814 6,117 7,340
Wheat 5,504 4,662 2,707 3,384 4,980 13,695 4,320 8,640
Miller 758 531 723 814 1,020 981 1,934 289
Paddy 678 3,390 638 3,384 807 2,825 1,103 6,342
Sorghum 606 606 1,273 1,750 875 1,838 1,210 1,210
Sub Total 41,788 60,216 37,608 85,496 41,190 79,762 59,113 126,672
Source: Office of the DALDO; Karatu District extracted during fieldwork MMA April 2012
The above table shows that in the last four years, yield of maize in Karatu was highest in 2007/8 (i.e. 3 tons per hectare). Between 2008 and 2010, yield has stabilized at about 2 tons per hectare, as was in 2006/7 season. Kilosa District Main food crops grown in Kilosa District include maize, paddy, sweet potatoes, cassava, beans, and bananas. Maize is the chief food crop in the district. Table 9 below indicates the production of the main food crops in Kilosa District from 2007/08 to 2009/10.
Table 9: Food crops production in tons from 2007/8 up to 2009/2010 CROP 2007/2008 2008/2009 2009/2010
Maize 128,801 116,960 153,938.58
Rice 42,465 47,213 43,059.72
Sorghum 3,820 6,567 4,613.75
Cassava 60,690 116,949 55,543.18
Sweet potato 34,450 30,000 14,799.3
Banana 18,500 14,680 27,705
34
Wheat 78 328 0
Round potato 200 347 27,705
Beans 8,998 12,800 13,332.05
Cowpeas 924 924 958.65
Pigeon pea 1,313 1.313 3,386.8
Garden pea 405 425 107.5
301,124 348,420 505,748
Source: Kilosa District socio-economic profile
Mvomero District For Mvomero District the table 10 below shows the production trend for maize and paddy over the five last years. It indicates for maize that, although the production has slightly increased (from 43,770 Tons in 2006/07 to 46,776 Tons in 2010/11) the trend is rather irregular although the areas planted are constant. The situation for paddy reveals the same characteristic with a production passing from 18,153 tons in 2006/07 to 32,465 tons in 2010/11 but with a maximum and minimum peak in the meanwhile.
Table 10: Production of maize and paddy in Mvomero (2006 – 2011)
Season 2006/07 2007/08 2008/09 2009/10 2010/11
Crop Ha Tons Ha Tons Ha Tons Ha Tons Ha Tons
Maize 24,320 43,770 24,368 43,862 24,870 39,792 25,859 25,600 25,987 46,776
Paddy 7,261 18,153 12,434 31,085 9,768 21,490 11,896 16,357 12,986 32,465
Source: Mvomero District Council, extracted during interview field visit, MMA April 2012
Iringa Rural District The district produces a number of crops and livestock, for food maize is the most important accounting for 59.42% of the volume food crops. Paddy accounts for 18.9% of the total 262,989 mt produced in 2010/11. Sweet potatoes, peas and Irish potatoes are also important. Table 11 shows type of crop and trend of production in Iringa District. Table 11 Crop Production in Iringa District Council (Mt)
Crop 2006/07 2007/08 2008/09 2009/10 2010/11
Maize 142,203 149,484 152,424 156,718 156,278
Paddy 30,258 38,363 28,230 32,171 49,695
Sweet potatoes 18,410 19,191 12,356 13,912 14,732
Peas 3,640 2,597 2,785 5,419 13,755
Irish potato 16,716 16,539, 6,832 9,683 13,374
Beans 11,670 17,822 8,453 14,568 10,083
Cassava 8,232 7,884 6,251 6,608 8,776
Sorghum 10,990 12,314 9,573 13,448 4,143
Tobacco 1,542 2,891 1,726 1,608 1,322
Tomatoes 13,136 13,625 16,339 16,246 27,566
Sunflower 6,085 12,138 12,368 14,535 12,199
Fruits 8,576 9,035 3,290 3,546 3,457 Source: Iringa District Council Socio-Economic Profile
In 2006/07 i.e. before the extended subsidy the District produced a total 142,203mt from 86,275 hectares giving a yield of 6.67 bags of 100kgs per acre, in 2010/11 production increased to 156,278mt from 89,295 hectares which means an acre produced 7.08 bags of 100kgs/acre. Expert suggest that it is possible to harvest more than 3,000kgs per acre if

35
farmers would follow GAP other natural factors (rains, plant disease, etc) being constant. In the North rainfall is unreliable and the District Authority is encouraging introduction of drought resistant crops. Paddy is mainly cultivated along the Ruaha River. Table 12 shows
maize production in Iringa District.
Table 12: Maize Production in Iringa: Volume in Mt, Area in Hectares and Yield 2006/07 2007/08 2008/09 2009/10 2010/11 Average
Production in mt 142,203 149,484 152,424 156,718 156,278 151,421
Change in Production 5.12% 1.97% 2.82% -0.28% 2.41%
Area in Hectares 86,275 82,248 73,796 91,082 89,295 84,539
Changes in hectares -4.67% -10.28% 23.42% -1.96% 1.63%
Average Yield (Kgs/ha) 1,648 1,817 2,065 1,721 1,750 1,800
Average Yield 100kgs - bags/acre 6.67 7.35 8.36 6.96 7.08 7.28
Change in Yield 10.19% 13.74% -16.75% 1.72% 2.23%
Source: Iringa District Council, District Social Economic Profile
Access, distribution and Application of Inputs Karatu Two systems of input distribution exist in Karatu, Mvomero and Kilosa; (i) the NAIVAS and (ii) private suppliers of inputs. It is generally difficult to distinguish the specific importance of the two systems in the different districts because the extension services focused their attention almost exclusively on NAIVS. In Mvomero and Kilosa for example, there were no official statistics about the volumes of inputs that entered in these districts apart from NAIVS activities, agro-dealers sell 70 to 80% of their volumes through NAIVS. National Agriculture Input Voucher Scheme (NAIVS) Since the early 1970s, the GOT has invested considerable resources to promote use of inputs (initially mainly fertilizer) by smallholder farmers. First, investments was mainly through the public sector but later after structural adjustments, deregulations and privatization, which took place in 1990’s, government relinquished it roles and activities in the inputs provision to the private sector. Apart from playing only regulatory roles, the government did not actively intervene in the input supply until 2003, when the government developed a program to offer subsidies to input suppliers on the transport costs that they faced, plus some subsidy on fertilizers (Msolla & Masagasi 2012 and Todd et al 2011). Price enforcement was established for the subsidized fertilizer. The transport subsidy ran through 2007 but was later found be inefficient. In 2007/08 the Government implemented a pilot of NAIVS, a scaled up program was launched in 2008/9 targeting 75,000 farmers in 53 districts in high agricultural potential areas (i.e. Southern Highlands, and Northern Highlands) and in a few districts of Tabora and Kigoma Regions (World Bank 2009, Todd et al., 2011). During the implementation, actual expansion was faster than planned, it expanded to cover 65 districts and 2.5 million farmers over a 6-year time horizon. NAIVS expanded to 74 districts in 2009/10 (World Bank 2010a, Todd et al 2011) and 87 districts in 2010/11. It was planned that targeted farmers will receive vouchers for up to three years, after which they are expected to have attained productivity that will afford them access to commercial sources of fertilizer and improved seed. However, in Moshi rural conflicts arouse because some farmers would like to continuously received voucher beyond three years. This is mainly because farmers do not know or they misunderstood the whole procedure of how

36
the system works, mainly because they were not properly enlightened. Farmers targeting and criteria for selection are conflicting. The wrong farmers benefited. Farmers are selected for the voucher scheme by a Village Voucher Committee using a set of criteria that include, among others, the recipient being a full-time farmer with a maize or rice cropping area of under one hectare and able to co-finance the subsidized inputs. In essence the program is targeting SHF but given the significant cash outlay required from beneficiaries, SHF who are dependent on production from an acre may not qualify. At the end, it is the middle-income farmers who meet the criteria. Farmers’ inability to raise about 70% of the cost coupled with other household cash needs explains the rampant voucher trading around the country. Selected farmers are provided with vouchers for inputs sufficient for 0.4 ha (one acre) of maize or rice that they redeem with local private input dealers (Msolla & Masagasi 2010, Todd et al., 2011). The vouchers enable farmers to acquire at a 50 percent subsidy either one 50-kg bag of DAP or two 50-kg bags of the Minjingu mazao blend of MRP for a basal dressing, one 50-kg bag of urea for top-dressing, and either 10 kg of improved maize seed (open pollinated variety or hybrid) or 16 kg of rice seed. Farmers take the vouchers to local input dealers to acquire the inputs. The input dealers then take the redeemed vouchers for reimbursement to a branch of the National Microfinance Bank (NMB), which was contracted to manage voucher redemptions. Access, Distribution and Applications in Karatu In Karatu, a kilo of seeds costs TShs 2500 to TShs 3500 depending on the variety of the seed and the company supplying it. Consider an average price of seeds to be TShs 3,000. A bag of phosphate fertilizer (Minjingu) costs TShs 32,000 and a farmer needs two bags for an acre of maize, meaning he/she has to pay for the second bag. One bag of urea costs about TShs 75,000. The government subsidy for urea fertilizer is only TShs 20,000. NAIVS covers nearly 1/3 of the market value for inputs needed for an acre. Table 13 shows amount of production costs that NAIVS covered in Karatu District.
Table 13: Market price for inputs, NAIVS and farmer costs
Market price NAIVS Farmer Seeds 3000 2000 1000 Phosphate fertilizer (Minjingu 100 kg) 64000 28000 36000 Urea (50 kg) 75,000 20,000 55000 Total 142,000 50,000 92,000
Source: Interview with LGA staff in Karatu © MMA April 2012
In many cases, farmers did not get all the inputs, cases abound where farmers take seeds and get small payments from agro dealers for the fertilizers. Agro dealers sell the fertilizers to farmers of vegetables who buy and use for growing vegetables.
Payments for vouchers submitted by agro dealers were often late, some payments made after almost a year. Small agro-dealers closed shops and others who borrowed money from the bank lost their properties i.e. securities they had pledged for the loans. In a few cases, the district had to intervene to guarantee some agro dealers who are politically more connected. The case of Minjingu The government through the NAIVS secretariat, the Agricultural Inputs Section of the Crop Development Department of the Ministry of Agriculture, Food Security, and Cooperatives,

37
informed the producer of fertilizer (Minjingu) and key importers of fertilizer into Tanzania of the expected demand at district-level for fertilizer under the NAIVS program for the following season, so that importers would obtain the stocks required and position them accordingly in a timely fashion. However, Estimates of quantities of fertilizers to be produced or imported (i.e. estimated expected demand) did not match actual demand. Minjingu was asked to produce 300,000 tons of fertilizer. The company sold a mere 20,000 tons of fertilizer and is currently stuck with 280,000 tons of fertilizer.
It is assumed that a maximum of 2 million farmer benefited in a program year, 100,000 mt of urea and some combination of up to 100,000 mt of DAP or up to 200,000 mt of the Minjingu mazao blend - Minjingu Rock Phosphate (MRP) would be required. While actual sales (using evidence from Minjingu) are below estimates, the fertilizer usage in Tanzania did increase although the increase was less than the estimated increase. Findings from Karatu District are that demand for seeds has increased and most farmers buy and plant improved seeds. Farmers hardly use chemicals. NAIVS in Iringa District Council: The case of Ihemi Village The village has an area of 3,470 hectares and a population of 3,878 people giving a population density of 7.49 hectares per household or about 0.96 people per ha or 0.42 people per acre. Commodities produced at village by importance are maize, Irish potatoes, sunflower, peas, beans and tomatoes. Other crops are cabbage, carrot and groundnuts. At the village it is estimated that all households cultivate maize primarily to cater for household food needs, even salaried people grow maize. Using a sample of participants at the focus group meeting, maize consumption per capita in the area is 85.41Kgs per annum. Comparing the number of households and the number of vouchers received, Ihemi might have received more than its fair share as the table below suggests. On answering a cross-examination question as what percent of people are “resource poor” to use the Malawi FISP parlance such that they could not afford to contribute 30% of the NAIVS input pack value, the group estimated that about 40% of the 377 households fell into that category. Table 14 shows access to voucher in Ihemi Village.
Table 14 Access to NAIVS Vouchers at Ihemi Village Year 2008/09 2009/10 2010/11 20011/12
Number Vouchers Availed 400 1,000 800 700
Percent of Vouchers to total No. of Households 80% 200% 160% 140%
No. of Households unable to contribute 151 151 151 151
No. of Households able to contribute to NAIVS 349 349 349 349
Percent of Number Vouchers to No. of Households capable of contributing
115% 286% 229% 200%
Source: From Interview with village © MMA April 2012
Due to limited number of target farmers who could afford the NAIVS voucher, many households opted for a split-family trick whereby a father, mother and sometime children will register their names separately this access more inputs than others, it was not necessarily the poor that benefitted. Impact of NAIVS Production of maize at Ihemi, according the focus group meeting, has improved following introduction of NAIVS, however absolute data suggest that the impact is not very significant as shown in Table 15 below.

38
Table 15: Output per Acre at Ihemi Village Participant Number Average
1 2 3 4 5 6 7 8 9 10
Acres> 2 2 1.5 1 1.5 2 3 2 2 2 1.9
Reported Bags
14 19 11 15 10 15 36 15 10 22 16.7
20Kgs debes/ bag
8 8 8 8 7 8 7 7 7 9 7.7
100Kgs bags
18.67
25.33
14.67
20.00 11.67 20.00 42.00 17.50 11.67 33.00 21.45
100Kgs bags/ acre
9.33
12.67
9.78
20.00 7.78
10.00 14.00
8.75
5.83
16.50
11.46
Value per acre in TShs ‘000
326 443 342 700 272 350 490 306 204 577 401
Value per farm ‘000
653 886 513 700 408 700 1,470 612 408 1,155 750,
Source: Field Survey © MMA April 2012
On average a household has a surplus of 11 bags (1,100) kgs of maize after they have deducted the 7.8 bags for household use, the 11 bags were worth TShs 275,000 at July 2011 price of TShs 250/Kg, in March the price had appreciated slightly to 320 – 350 per Kgs that gives a revenue of 320,000 – 350,000 while the input pack per acre is worth TShs 168,000 (DAP TShs 75,000, CAN TShs 45,000 and Seeds TShs 25,000) which is 26% of the reported average revenue. The general feeling is that affordability will decline after the 30% subsidy is removed; the answer to this question comes from the need for higher productivity to surpass break-even production level. An exemplary farmer at Ihemi harvests 30bags per acre, she adheres to GAP of proper land tilling, planting using recommended space, weeding 3 times instead of two, weeding using herbicides 3 times, using 200Kgs of fertilizers instead of 100Kgs and better seed selection. This input regime gives output that is 300% higher, this levels of achievement have been reported by farmers elsewhere in Iringa. The above farmer allocates 10 bags for household needs; the 20 surplus bags have a value of TShs 500,000 during peak supply season and TShs 1,050,000 during off-peak supply season. The cost of inputs is TShs 255,000 (excluding labour), which is 51% at the peak supply season and 24.2% at off-peak season price. Ihemi farmers have been receiving adequate extension services but have been slow to adopt new production technology, they have been trained under various programmes and currently they are with Uyole ARI, Tumaini University (Faculty of Agriculture), TAP and indeed the Government. The exemplary farmer indicated above is an extension officer right at the village, farmers can’t explain clearly as to why even after seeing and hearing from a neighbour they can’t emulate. It is recommended that frequent reminders can send a stronger message.
Benefits of NAIVS Farmers contend that NAIVS has helped them improve output and hence food security, before they used to get 300Kgs per acre, now they get more than 700Kgs. Challenges facing NAIVS

39
Delays: NAIVS is not implemented properly because preparations are not synchronized with farm calendar, for example in the 2011/12 there were delays in the process because there were no agro dealers who had lodged an application to supply inputs in area, this fact reduced the village Government’s moral authority to control the agro-dealers since it had to beg local agro-dealers to get into the scheme. Seed Selection: Farmers at Ihemi were used to seeds from Uyole ARI, the Uyole 6303 and they proposed it to be included in the subsidy pack, Uyole 6303 was introduced in the area since 2004. The seed had also been used in a project supported by Tumaini University (Department of Agriculture) that is working to improve soil fertility through recycling of soil nutrients. However, NAIVS brought another type of seeds against the recommendations of farmers and the DALDO office. Village Input Committee Meetings: Village Input Committee members are volunteering for the work and sometime the cooperation has been not cordial, they are required to attend seminars on guidelines for the NAIVS process around November and forms are filled right in November. The Committees have no allowance for supervising the NAIVS activities it has been claimed that in some villages committee members demand payment from Agro-dealers on the ground that they are facilitating his/her business. Lack of Maize Market: Maize prices of between TShs 250 and 350 at the village were rated by farmers as very low compared to the price they heard in the media that Kenya market offered TShs 800 per Kg at the Horohoro boarder. Even if the impact on final price would have not been such big farmers say the Government arbitrary ban without guaranteeing them an alternative market sets a bad precedence. NAIVS in Iringa District Council: The Case of Kiwere Village Kiwere ward is famous for maize production and farmers, the average acreage is 4.71 acres per household and almost all farmers produce maize. The village has a population of 3,183 organized under 479 households (2010 data). The village produces among others maize, tobacco; paddy, beans, sunflower and groundnuts, cattle, pigs and donkeys are common in the area. Tobacco in the area was introduced in the 1960’s and has continued to contribute to the economy at the village. Each tobacco farmer is given a loan of one 50kg bag of urea for use in maize field, while there is good tobacco extension services, maize is not covered by tobacco experts. Even market infrastructure created for tobacco is not availed for maize e.g. the AMCOS service unlike in Mbinga where the coffee AMCOS supports inputs for maize and other crops as well. Farmers at Kiwere don’t use any chemicals on the farm though they are aware of chemical herbicides for suppressing weeds. They however they use Actellic Supper for protection of maize in stores against grain borers and therefore have limited comments. Access to Financial Services Access to financial services is an important factor in support of access to inputs, none of the participants at the group discussion was a member to the village SACCOS, the main reason had been that the SACCOS was very weak to make any meaningful impact to farmers. It has failed to grow and there had been some mismanagement in the past. The major source of credit is from VICOBA, there are 3 of them at the village each with about 20-30 members. This internal saving and lending scheme caters loans for social and non-farm income

40
generating activities. They are however very limited in terms of working capital as shares and weekly deposits are limited due to low earning capacity of farmers.
Farmers are aware that maize production and selling at the current yield and market prices is not able to sustain access and application of inputs at rates recommended by experts, further investigation shows that farmers themselves are subsidizing maize crop using income from other sources notably remittances from relative who are in town, income from small businesses and income from other agricultural commodities like tomatoes, tobacco, groundnuts, etc. Table 16 shows maize production in Kiwere Village.
Just like Ihemi village, Kiwere had better access to inputs through NAIVS because the ratio of the member of households to the number of households is good, between 2009/10 and 2011/12 the number of vouchers supplied was 600 per year throughout against 479 households. The ratio of voucher to household is 125%. Farmers indicated that NAIVS has helped them to improve food security by allowing some to expand their maize fields, it can be noted that in Kiwere the average acreage per farmer is 4.7 acres while at Ihemi it is 1.9 acres.
Table 16:Maize Production at Kiwere 1 2 3 4 5 6 7 Average
Acres 6 8 3 7 2 5 2 4.71
Bags 30 40 25 35 11 45 15 28.71
Debes/bag 8 7 8 7 7 8 7.50
100Kgs bags 40.00 29.17 46.67 12.83 52.50 20 33.53
100Kgs bags/acre 6.67 9.72 6.67 6.42 10.50 10.00 8.33
Value per acre in TShs
233,333 340,278 233,333 224,583 367,500 350,000 291,504
Value per farm 1,400,000 1,020,833 1,633,333 449,167 1,837,500 700,000 1,173,472
Source: Field Survey © MMA April 2012
Access to NAIVS inputs at Kiwere had several challenges but most are on access and application of fertilizers and seeds. (i) Late delivery of NAIVS inputs is a major challenge; a good example is the 2011/12
season when subsidy inputs arrived first week of January instead of October – November. Use of fertilizers after January can have adverse effects due to emetic rainfall pastern and varied soil properties in area. This was partly attributed to poor planning, due to weak participation of agro-dealers in planning the process of input supply. The second challenge facing access is poor cash flows from maize production business that make farmers subsidizing the crop from other sources.
(ii) The changes in the documentation process i.e. use of forms instead of the commonly known voucher for transacting inputs and later requesting farmers to come forward to sign the voucher was a very time consuming exercise. Farmers had to be coerced to sign the vouchers; village government leaders spent most of their time chasing farmers who were avoiding signing the vouchers for more than a month.
(iii) The supply of one type of seeds to farmers without consideration of specific climatic condition was mentioned as another challenge at Kiwere, the village is on the dividing line between Northern semi – arid part of Iringa District and whether South Eastern part. Rainfall is very erratic; soils are sandy in many areas such that delays in one week can lead to total loss of crops. Farmers have sometime not trusted seeds from NAIVS for fear of lack of tolerance to dry conditions.
General Comments on Challenges of NAIVs in Iringa Region

41
Discussing on the challenges facing NAIVS in Iringa, the Regional Authority noted that the objective of subsidy of ensuring household food security is not yet to be achieved for a number of reasons. Weaknesses noted in NAIVS include: - (i) Late delivery of inputs particularly fertilizers and seeds brings into question the
seriousness of the programme (ii) Regular price fluctuations especially price increases tends to annual the effect of
promoting affordability. (iii) Higher prevalence of poor quality inputs in the NAIVS system due to the fact that
agro-dealers (who are many) are not well controlled to ensure they operate in a transparent supply chain
(iv) Limited working capital especially for ward/village level agro dealers, this limits their participation in NAIVS
(v) Poor targeting of the NAIVS, there is a need for balancing between targeting the households that are poor and prove to food shortage, the rural poor have failed to raise the 70% contribution which in 2011/12 was about TShs. 130,000/=
(vi) Unscrupulous agro-dealers have been involved in a number of malpractices that include non-delivery of inputs but paying farmers TShs. 10,000 for a voucher worth about TShs 50,000. Also agro dealers have been found to divert inputs from allocated areas to non-allocated.
(vii) Weak supervision systems and disorganized stakeholders allow for weaknesses in f) above taking place
(viii) Inadequate volume of inputs to support profitable output, the 50kgs bag for basal and top dress have increased output to about 8-10 bags per acre which is closer to household food needs therefore leaving little surplus for the market to generate cash that can be used to purchase inputs.
Private Agro-dealer led channel of input distribution Out of 38 agro dealers registered at the district, 23 applied to supply input under NAIVS. Only 10 were awarded the opportunity to supply inputs. More than 28 agro dealers (i.e. registered and un registered) continued to supply inputs. Scales or operations and volumes of business handled vary from one agro dealer to another. Agro dealers with premises in town tend to have bigger volumes of stock than those in the ward and country areas. During the cropping season, agro dealers stock certified seeds (i.e. hybrid seeds and composite seeds) and fertilizers. The case of Ramadan Skimobile below is of new promise and presents problems for Tanzanian Agro-dealers.
The case of Ramadan Skimobile: New Promise and Problems for Tanzanian Agro-dealers13 Five years ago when Ramadan Skimobile was raising vegetables on a small plot near the central Tanzanian town of Ifakara, he took a bus to Dar es Salaam, the country’s commercial capital 450 kilometers (270 miles) to the east on the Indian Ocean, to attend an agricultural trade fair. While there he learned that the price of the pesticide he used on his produce was five times higher back home. “The difference in the price was so high that it encouraged me to open my own shop,” the 32-year-old farmer-turned-agro-dealer said. Today he has two successful shops that sell improved seeds, fertilizer, pesticides and herbicides to hundreds of small-scale farmers. One is in Ifakara, and the other, opened just last year, is
13
Case extracted from AGRA website http://www.agra-alliance.org/content/story/detail/923

42
in the rice-farming village of Kula, 50 kilometers (30 miles) north on a dirt road that resembles a washboard. Initially, Ramadan had hoped to attend university after completing secondary school, but his father, a sugar cane farmer, died, and his mother had no money to pay the school fees so he grew vegetables for sale while struggling to get a loan to open his first shop. Banks in Tanzania have been reluctant to grant loans to small-scale farmers, who operate at the subsistence level and are not considered businessmen. Their one-to-two acre plots are not accepted as collateral, and most lack the education, skills and money to advance. But Ramadan Skimobile is not a man who gives up easily. And, the Kilombero district chairman of the 35-member UWAPEKI, an association of agro-dealers in Kilombero district, is always eager to seize new opportunities. Such an opportunity arrived about a year and a half ago, and Ramadan became one of 15 agro-dealers to receive intensive training in business skills. The program was set up by the Tanzania Agro-dealers Strengthening Program (TASP), which seeks to build a robust and efficient system of distributing agricultural inputs to smallholder farmers. TASP also prepares the agro-dealers for certification to obtain overdraft loans from the National Micro-Finance Bank (NMB) of up to 15 million Tanzanian shillings ($12,000), which they can use to buy supplies for their shops. The arrangement was made possible by an innovative financing program spearheaded and partly financed by the Alliance for a Green Revolution in Africa (AGRA). By December 31, 2008, the NMB had approved the applications of 114 agro-dealers valued at 1,491,200,000 Tanzanian shillings ($1,192,960).“Before the training, I sold products without keeping proper records,” Ramadan said. He and his colleagues made no distinctions between sales and profits and did not factor in their expenses or labour. Initially he only dealt in seasonal products—what was needed at a particular moment in the farming cycle and moved fast off the shelves. He was advised to sell all products, but it was impossible to obtain the capital to purchase them. The overdraft facility, and a related voucher program—were designed to resolve that issue. Funded by the Government of Tanzania, the National Agricultural Input Voucher Scheme (NAIVS) discounts the cost of agricultural inputs to smallholder farmers through vouchers. Farmers turn the vouchers in to the agro-dealers, in exchange for their farm inputs. Agro-dealers are then set to exchange the vouchers for cash at the local branch of the NMB—obtaining vital working capital, which can also be used to pay off the overdraft loans. But it doesn’t always work that way. Ramadan opened his shop in Kula in 2008 as the voucher system was being introduced through a pilot project for small-scale rice farmers; his sales went up by 80 per cent, but he has had problems cashing in the vouchers. Back in Ifakara, Ramadhani and five other agro-dealers met to discuss the teething problems of the program designed to make them more efficient—and prosperous. Salum Bohari, Hiyari Mwinyimvua, Elizabeth Bakari, Sudi Mindu and Sylvester Kasunga Idete, a former clinical officer at a local mission hospital, were all enthusiastic about the benefits of the intensive training. But they had misgivings about the overdraft system, and how it would affect them if they had difficulty cashing in the vouchers: they are charged 15 per cent interest on the overdraft, which is compounded daily—whether or not the bank is willing or able to honor the vouchers. As of the second week in February, Ramadhani was holding 32 million shillings ($25,600) in unredeemed vouchers that he had accepted in just one week from farmers in five villages as the rice-planting season moved into full swing. Parliament needed to approve the release of

43
billions of shillings to fund the overdraft and voucher programs. “I can’t take the vouchers if there is no money,” the young businessman said. AGRA program officer Fred Muhhuku later explained the underlying problems, and the efforts to solve them. According to Muhhuku, at the start of the program, there was a delay in releasing funds to the bank for voucher redemption. This was brought to the attention of government, and rectified.
The second problem causing delays was the need to manually input thousands of vouchers into the bank’s computers before they could be cashed. “This is an operational problem within the bank,” Muhhuku said. One solution being considered is for the government to design “master vouchers” which could be issued to agro-dealers in exchange for perhaps one thousand single vouchers. That would cut back considerably on the time needed to enter vouchers into the computer, but could cause other delays in the exchange process. The pros and cons of this approach are now being weighed. In the meantime, Muhhuku emphasizes “there is a strong desire by the government and all partners to ensure the success of the voucher program.”
3.2.1 Cereals agro inputs access, distribution and application Availability Availability of inputs depends on demand and the network of agro dealers. In Karatu the sample village of Mangola tends to have more agro input dealers because the demand for input there is higher. Also in Mangola, where majority of farmers grow vegetables, farmers get higher incomes that afford them inputs.
A number of farmers identified to be eligible for NAIVS have not been able to top up the subsidy. It is common that inputs are not available on time, untimely availability of NAIVS inputs due to delay in the processes of selecting farmers also many agro dealers have limited financial capacity to stock sufficient inputs. Negotiating for credit with their suppliers/distributors and sometimes bank takes. In some cases the local government tried to ensure input is available on time by giving deadlines for agro dealers to supply inputs.
In Mvomero District, subsidized inputs correspond to 75 – 80% of the quantities utilized and only 25% to self-funded purchases14. Urea is the main input that farmers look for. NAIVS targets only a part of the farmers and only one Acre for each of them (although farmers farm on at least 4 acres15). In Mvomero the population that had asked for inputs reaches 120,000 persons but only about 30,000 persons were attended16. This represents only 6% of the needs. This generates frustration from the other persons and worries about the accuracy of the selection system.
The survey estimates that for Kilosa District 30% of inputs sold on free market and 70% subsidized). There is a lack of continuity in the subsidy schemes. In Mvomero, farmers can plant twice a year but the voucher scheme only considers one season.
For paddy farmers, availability of seeds is not a major issue because they can easily store paddy and use some for sowing. Sowing own seeds also helps farmers limit the problems of fake seeds. The Extension officers are not sufficiently involved in the identification of the needs of inputs (NAIVS). The process is much based on village, ward and district leaders. It is a constraint because extension officers could help identifying the exact needs (quantities, qualities, timing, etc.).
14
Quoting Dakawa Agro-Dealer and Mvomero DC 15
Even when they farm on 2 acres, they tend to use this area twice a year. 16
300 persons received vouchers out of 900 who had asked in Milama (5 to 600 persons “really” cannot afford
the inputs on the free market).

44
In Mvomero District, subsidized fertilizers correspond to 75 – 80% of the quantities utilized. The rest corresponds to self-funded purchases but the District Councils could not provide information about the exact inflows of non-subsidized inputs17. Eligible farmers represent 70 to 80% of the total number of farmers. Only a quarter of those who fit with the criteria defined by NAIVS managed to obtain vouchers (see table 17 and 18) and in the best case they manage inputs only to cover a part of their needs (1 Acres out of 2 to 1018). This means that NAIVS covers less than 10% of the total needs. The picture is globally the same in Kilosa District. Table 17 and 18 below show the number farmers who received vouchers through NAIVS in Mvomero and Kilosa Districts. It puts in perspective the fact that the entry has been progressive with successive new groups. It also shows that the number of farmers who received subsidized inputs seems to have been surpassed. For NAIVS to support effectively all involved farmers during three successive years, the program would have to continue until 2013/14. The loss of momentum at local level is not only due a continuous extension of the targeted area but also seems to result from structural constraints. Farmers and other local actors speculate that such loss of momentum is due to the withdrawal of donors, decreased resources at national level (due to inflation, global crisis and reduced tax collection) and re-attribution of the available resources to other needs. However, the consultants could not get a confirmation about these admitted causes.
Table 17: Number of vouchers distributed in Mvomero District
Year Group 1 Group 2 Group 3 Group 4 Total 2008/09 11000 11000 2009/10 11000 11000 22000 2010/11 11000 11000 12384 34384 2011/12 11000 12384 6612 29996 (1)
2012/13 12384 6612 18996 (2)
2013/14 6612 6612 (2) Source: Mvomero District Council / DALDO office - interview extract © MMA March 2012
(1) The farmers had not received the inputs at the date of the survey (21/03/2012) (2) This is the number of vouchers that would allow finalizing a cycle of three years with all
farmers already involved.
Table 18: Number of vouchers distributed in Kilosa District
Year Group 1 Group 2 Total Comments 2009/10 32,000 32,000 2010/11 21,111 0 21,111 2011/12 32,000 4,042 36,042 (1) 2012/13 4,042 (2)
2013/14 4,042 (2) Source: Kilosa District Council / DALDO office – interview extract © MMA March 2012
(1) The farmers had not received the inputs at the date of the survey (21/03/2012) (2) Number of vouchers that would allow finalizing a cycle of three years with farmers already
involved.
17
Quoting Dakawa Agro-Dealer and Mvomero and Kilosa Extension Officers met during the survey. 18
Even when they farm on 2 acres, they tend to use this area twice a year.

45
The overall availability of seeds is not a problem in a context of limited demand but it could become one in the case of awakening of the farmers on the question of seeds. Indeed, officials at ASA report that the agency faces several challenges to be able to produce more: (i) Insufficient supply of pre-basic seeds by research centres due to drought or
insufficient budgets. (ii) Under-equipment of the seed farmers handed over by the government. ASA
possesses only 200 Ha with irrigation (Kilangali) and all the other production areas are rainfall dependent. Investments in irrigation started through supports from WB (through the MAFC), National Irrigation Fund. Infrastructures were handed over by the government (when ASA was created in 2006) in poor conditions and ASA doesn’t have resources to improve them (farms, houses, drainage systems, roads, contours, etc).
(iii) The ASA capacity of seed processing is too small (1 Ton/hour for the whole country) and the private companies don’t have facilities. ASA ordered a new facility through WB support (2 units with a capacity of 4 Tons/hour). Optimally, there should be a processing facility in each agro-ecological zone.
(iv) Storage facilities are insufficient. When sales got disturbed due to problems in NAIVS (in 2011/12) ASA had to rent go-downs to spend much money to store un-sold seeds. ASA / the seed industry should have proper storage facilities in each agro-ecological zone.
(v) ASA has a mixed status: ASA is a government agency; and this implies that the government pays some of its costs and salaries (the salaries are less than in private companies and employees tend to flee to TOSCI, CTAs or research centres). Production costs have to be paid by the product of the sales. ASA is under-staffed. The scheme of service implies the present of 205 persons but ASA has 70 persons in place. When ASA asks the central government scheme to hire 10 persons they may get 5.
(vi) When the market develops in a hectic way ASA has to carry over stocks (with special storage facilities and additional costs).
(vii) The Voucher scheme helped to increase the market for seeds (at least +50%) but it also caused the entry in the sector of some clients who are bad payers (some invoices of 2010/11 season are still not settled).
(viii) The voucher system has been implemented with insufficient follow-up and when problems happened, responses have been significantly slow. For seed producers, it increased the instability of the sector and therefore risks of losses (un-paid invoices, stocks to carry forward, un-predicted demand).
(ix) Many new agro-dealers started operating in the rural areas but their skills and working capital are insufficient.
(x) Fake/counterfeit seeds cause a number of problems but a background research is needed to quantify it. It is for instance difficult to know if germination was bad due to climatic or agronomic problems or then, due to the quality of seeds (counterfeit/fake).
Affordability Prices NAIVS plays an important role in the affordability of fertilizers through the subsidy itself but also through the concerted definition of indicative prices that help avoiding speculation under cover of transportation, distribution and other costs. NAIVS village and district committees do consider the variations in the costs of fertilizer in different locations due to transport costs. Yet, because of the inherent limitations in the distribution systems (especially rural feeder roads) and lack of an efficient courier system), agro dealers tend to

46
increase prices of inputs to factor in transport costs. In some cases reported in Karatu District, unscrupulous agro dealers have unreasonably hiked prices of inputs. In addition, purchasing in bulk is not the most common practice of agro-dealers and even importers seem to sometimes order sub-optimal volumes. Some large companies (importers) provide transport services for bulk purchases and a few importers distribute their own products to agro dealers (in Karatu). The overall increase of price of fertilizers (in cause, inflation, global economic crisis and probably insufficient anticipation in organizing the supply) resulted into reduced impact of the subsidy below the planned 50%. For instance Urea was sold at 36,000 TZS per bag in 2010 while in 2012 it was sold – after deduction of the subsidy – at ~ 50,000 TZS per bag. The amount of subsidy didn’t change (17,500 per bag) but the farmers’ contribution increased from 17,500 TZS to 32,500 TZS per bag, which generated a severe frustration feeling about subsidies. Not more than 10% of the farmers can buy fertilizers with their own money. With fertilizers at TShs 75,000/bag many farmers consider it not profitable to use fertilizers. Besides, many farmers do not know the amount they are supposed to pay as a top up onto the subsidy (quoting Dakawa agro-dealers). With the decreased percentage of the subsidy in the total price, farmers complain about the trader although they know the price of the product on the open market and the value of the voucher. This is caused by little transparency and lack of farmer sensitization in the whole input subsidy system. This partly explains the farmers’ increasing tendency to sell the vouchers or refuse them and the resulting corruption. With the exception of Minjingu products, all fertilizers are currently imported. Prices of inputs are high because of the conditions of import. The local agro-dealers have no real influence on prices. Imports require appropriate timing of supply in order to get supplies at lower prices (and decrease the capital intensity of the activity). If importers wait to get the certainty that the Government will subsidize these inputs they may lose opportunities of getting better prices on the international market, which is guaranteed by ordering early. Knowing that farmers will obtain a subsidy, the importers may be less motivated to get better supply prices. The volume of inputs supported by the subsidy scheme gives guaranteed market for the importers of inputs. Importers know the number of vouchers that has been distributed the previous year and they base on that to guess the new volumes accordingly. They know that at least a certain percentage of the farmers who will have received vouchers will utilize them to buy inputs although the price decreases the profitability of their farming activities (because they consider that they owe subsidized inputs). However, it is not known to what extent late procurement of fertilizers contributed to the increasing of prices, worsening of the situation for farmers and decreasing of the impact of the subsidy program. Hybrid seeds are not appreciated because of their price (two to three times more than OPV seeds and five to ten times the price of farmers’ seeds). Although prices for inputs may be high, large farmers know that they can only make profit if they utilize inputs and they therefore organize themselves to get inputs. Weaknesses of the output markets and profitability limitations Market for farm outputs exerts greater influence on of inputs. Farmers miss reliable and financially interesting markets. Eventually, all farm produce is consumed or sold but usually in small quantities. Paddy is marketable but farm-gate prices are too low and are defined by middlemen. Farmers don’t use their production costs to define their selling prices. By
47
defining maize or paddy as food crops (and denying these crops the status of cash-crop) the whole concept of economic sustainability of the use of inputs is being distorted. If maize would be systematically marketed and thus produced for the market, inputs could be supplied through an organized arrangement and input costs would be cut from the selling price. In the subsidy system, indicative prices for different inputs in different locations are used to calculate the amount covered by the subsidy and the amount a farmer have to pay. This method of calculating and apportioning costs is never accurate or not respected and many times the actual retail price of inputs tends to be higher than the indicative prices. Retailers of inputs include their overhead costs and a profit margin to arrive at a price different from the price the government used.
Farmers are simultaneously used to subsidies (and expecting to continue getting subsidies) and aware of the market, climate, technical limitations. They will only buy inputs if the incentives are high enough (importance of the subsidy, attractiveness of the market, profitability of the crop) or if the market is supportive enough.
Data from the survey indicate that profitability evolve with subsidies. In the case of maize farmers in Kimamba (Kilosa District), the Simplified Gross Profit (SGP) passed from 299,335 TZS/Ha to 407,996 TZS/Ha (+26.6%) at the same time that Simplified Gross Margin (SGM) increased from 18 to 24% (+ 25%). Similarly, the profitability of paddy farmers in Milama (Mvomero District) increased from 1,559,609 TZS/Ha to 1,633,359 TZS/Ha (+4.5%) while SGM increased from 55 to 58% (+5.2). Subsidies are therefore useful for farmers, with a bigger impact for maize than for paddy. However, the measurement of the impact of subsidies should not be limited to the differential between profitability of farmers having reached high yields. It should be extended to the measurement of the differential between low yields (due to the non utilization of inputs) and high yields for farmers utilizing inputs. The improvement of SGP in the case of the same maize farmers in Kimamba reaches 181.8% (from -333,750 to + 407,996 TZS/Ha) and the improvement of the SGM is of 312.5% (from -51% to + 24%). In the case of paddy farmers in Milama, the difference is important too with a growth of the SGP of + 1.100% (from -165,391 to 1,559,609 TZS/Ha) and a growth of the SGM of + 143% (from -24% to +55%). This shows that the subsidy scheme, if attractive enough could take farmers to levels of profitability where they would be able to capitalize at household level and that the duration of three years of support could be sufficient. However, as it is analyzed earlier in this report, the level of subsidization has decreased with a negative psychological impact on farmers and therefore this jump in terms of profitability and sustainability might be seriously compromised. Timing There have been several delays in the processes of implementing the subsidy program, for instance, by the time of this study (i.e. towards end of March), the farming season had already started but the prices of the inputs and the value of the voucher had not yet been defined in Kilosa District. Vouchers had not been spread to farmers in Mvomero and some agro-dealers had not yet finalized their arrangements to get supply of inputs.

48
Many actors19 complain that the inputs are not availed on time. In Kilosa, the vouchers had not been distributed to farmers on 26th of March although normally at that time of the year, maize or paddy should already have been planted20. In addition, Kilosa possesses different agro-climatic areas and some areas need inputs earlier than others but the Input supply scheme considers only one planting period (and not necessarily the earliest). Vouchers had not been spread to farmers in Mvomero and some agro-dealers had not yet finalized their arrangements to get supply of inputs. Late provision of seeds cause delays of plantation and – with most of farmers practicing rain-fed agriculture – causes the farmer to invest money into farming with higher risks of losses. Weak organization of the subsidy program is responsible of a significant part of these delays (for seeds and fertilizers). It gives the subsidy program a harmful dimension, as farmers would have worked timely if not for the matter of waiting for subsidized inputs. Farmers Cash flow dynamics and financial services Inputs are needed when farmers have utilized their financial reserves and not when they still have cash (period of high price before the stocks are too low ~ October – November)21. Figure 6 below illustrates the annual cash-flow trend of three households of smallholder farmers (4 to 10 Acres) in Morogoro region (Kilosa and Mvomero Districts). It is based on farmers’ high hypothesis of production (higher yields) and therefore, to farmers who are –theoretically – eligible in the voucher programme (as they are able to mobilize the contribution without being amongst the “well-off” farmers). Figure 6 shows that for these farmers, incomes tend to be higher from July to January but then, most of them face a financial shortfall. Farmers claim that inputs should be available from September onwards so that they can use their stocks of commodities to finance the purchasing of inputs, optimally in November when prices of paddy and maize are better. However, to access the subsidized inputs, farmers have to pay about TShs 119,500 (season 2011/12) from February to April at a moment when many do not have the cash anymore. Indeed, most farmers’ maize and paddy harvested between May and September and sell from the time of harvest to around April if they manage to produce enough and keep stocks long enough. Most farmers sell their last “reserves” in December to pay school fees and prepare the next season (land preparation, supply of seeds). Unfortunately, the availability of inputs follows the opposite trend, as there are more inputs available after the end of the year when farmers already finished most of their crop/cash reserves. Most farmers don’t have reserves (crop or finance) from January onwards to buy fertilizers, pay labour for weeding and harvesting. This appears as a major weakness of NAIVS and of the whole input supply system. Presence/absence of reserves is central but the utilization of these reserves is also instrumental. However, the survey showed that farmers don’t use management methods and tools (profitability analysis, cash-flow management) with decreased capacity of assessment, anticipation, planning, etc.
19
Mvomero, Mtwara and Kilosa District Councils, Cashew Board of Tanzania, Dakawa and Kilosa AD, CHOLIMA,
ARI Ilonga, Yara, farmers, 20
Quoting, farmers in Kimamba and Ilonga met on 27 and 28/03/2012 21
According to farmers in Milama; Mvomero District

49
Figure 6: Household cash-flow dynamics in three villages (Morogoro region)
Note: These households combine several activities to complete their annual budget: crops (paddy, maize, horticulture, sunflower), livestock (chicken) and casual labour in neighbours’ farms. In our example, we illustrated the case of a farmer who starts the year with only the remaining crops from the previous year (and no cash)22.
Financial services Farmers have limited access to financial service and they therefore have the choice between low input and loans from traditional lenders who charge very high interest rates. For instance, a farmer who needs TShs 150,000 (e.g. to buy fertilisers in February - March) may have to take a loan in exchange for 7.5 bags at TShs. 20,000 each, when the period of the loan in longer, it is admitted that the trader is entitled to ask even more paddy as payment of the loan interest. With such agreement, the interest rate reaches 100% because these bags could be sold at TShs 40,000 after some months. In this context, farmers are reluctant to use loans (even if they are accessible to them) because regular delays in the supply of inputs contribute to a drastic increasing in the level of uncertainty for the repayment of the loan23. Financial institutions are cautious to lend to farmers because of their little knowledge of agricultural ventures, levels of risks (climatic, commercial) and also partly because of the high political interferences in agriculture, particularly in maize subsector. However, the financial sector is slowly evolving. Together with banks and SACCOS, some local agro-dealers tend to give large farmers payment facilities when their relationship is long established and by getting positioned on the output market to decrease the level of risk24. Some projects (NAFAKA in Mvomero) work to increase of farmers’ level of market integration (storage, milling and wholesale of paddy) as a way to increase their share of added value but also to ease the level of risk through a stronger linkage between input and output activities. Purchases of inputs and provision of loans are eased/turned more secure
22
Cash-flow balances appear negative at the beginning of the year for two locations when households didn’t sell
some of their stocks at this time although they had expenses. In reality, they would sell some crops to cover
these expenses. 23
Milama FGD 21/03/2012 24
Quoting Mr. Lyanzile, Kilosa 26/03/2012

50
by the availability of stocks. However, this is only possible where sufficient storage facilities exist or can be built in a short while. Banks Farmers usually don’t utilize financial services offered by banks because they cannot meet the conditions: collaterals, guarantees, etc. However, banks are trying to change their approaches.
NMB is keenly following up developments in the construction of WRS as it considers it to be the low risk entry point. NMB offers loans to other crops than paddy or maize (Ifakara / sugar cane). In Kilosa, large scale irrigated farming could be interesting but there are not many farmers of this kind. In Mtwara, NMB is also involved in the management of WRS for cashew nuts together with new attempts such as the development / piloting of a “saving-based loan” for agriculture but it is still at a pilot stage. SACCOS It is not easy for many SACCOS to start offering agricultural loans with their current level of capitalization either because it is too low, or because it is being utilized for other activities or because the interest rates are not adapted to agriculture. New financial institutions penetrate rural areas but they rather target easy and safe clients like government workers and traders rather than farmers. The MAFC is supporting SACCOS to improve the farmers’ access to financial services. The Milama SACCOS had up to 480 members but currently, it is out of fund. It is willing to replenish its fund through members’ contributions and a support from TIB in order to be able to provide loans of TShs 300,000 to 1million at 10% for agricultural projects (paddy and maize). SACCOS are also emerging in Karatu district although when compared to the SACCOS in Moshi, the ones in Karatu are generally young, have weak and unstable management and are still grappling with managing credit and finding profitable enterprise to fund. Mangora and Mbulumbulu SACCOS were assessed. Mangora SACCOS Registered in Arusha in January 2007 with registration number AR/493, Mangora SACCOS has 182 members. Got input loans from Nata investment Company Limited of value equivalent to 6,000 bags of maize seeds and bought seeds (Seedco 513) from Nnko, a wholesale and retail shop for inputs in Karatu. It is still paying the loan acquired from Nata. They later got another loan of TShs. 60 million from National Microfinance Bank (NMB) and another 15 million from the Savings and Credit Cooperative Union League of Tanzania (SCCULT). Mangora SACCOS has been lending business, farming and emergency (i.e. education and health) loans to its members. Farming loans are used to finance purchase of inputs. Repayments for business loans are done monthly, farming loans are repaid at the end of the cropping season. An interested member takes and fills a loan request form and submits to a loan committee who scrutinizes the application. One of the requirements for getting a loan is that the savings of a member should be 1/3 of the amount he/she is requesting. A loan applicant gets guarantee from members. KKKT Mbulumbulu SACCOS

51
The SACCOS started lending money to farmers in 2009. Members are farmers many of them coming from four villages of Kambi ya Simba, Slahhamo, Kitete and upper Kitte. Currently it has 439 members. The SACCOS was started with the aim to help smallholder farmer to invest in agriculture and entrepreneurship. To become a member, farmers pay entry fee of TShs 5,000, buy five shares each at 10,000 (TShs 50,000), and deposit in a savings account with the SACCOS. Savings start from TShs 50,000 to a maximum of TShs. 5 million. Uchumi Commercial Bank, which belongs to Kanisa la Kiinjili la Kilutheri Tanzania (KKKT) in Moshi gave credit to the SACCOS. In 2009 the SACCOS got TShs 203 million and in 2010, after successfully refunding the first loan the SACCOS was granted TShs 261 million. Since inception, KKKT Mbulumbulu SACCOS has lent to farmers twice. Repayment for the second loan has not been successful. The reason given to explain this is that Uchumi Commercial Bank did not issue the loan on time and hence production was affected. The second loan was obtained in May instead of February. Also bad weather affected production. Currently, 125 million is returned and the SACCOS is struggling to have farmers repay the remaining 78 million. Part of the reason for the poor performance of the SACCOS is related to the limited management capacity that the SACCOS have. Karatu Development Association (KDA) Unlike in Moshi, where SACCOS are stronger and no NGOs involved in rural credit, in Karatu, an NGO known as Karatu Development Association (KDA) is a leading non banking credit provider and is actively extending rural microfinance services to farmers of paddy, onions and maize in Karatu with more customers in Mangola. It started lending in the year 2000. Since then KDA has accumulated a portfolio of TShs 500 million. Most clients of KDA’s financial services are smallholder farmers owning 1 to 2 acres of land. KDA is providing them loans for buying inputs. Input loans have grace period of 6 months and attract an interest rate of 12% per 6 months, 24% per annum. Minimum amount one can borrow is TShs 500,000 and maximum amount is TShs. 3 million. Demand for loan and repayment rates are both showing high. Last season repayment rate reached 95% and this season, so far 85% of borrowers have repaid. KDA has innovative approaches to support farmers repay loans. In cases of default, KDA investigates reasons for not repaying the loans. Once ascertained that the reason the farmer failed to repay the loan is genuine (e.g. bad weather, under estimation of harvest etc), the loan repayment is rescheduled. Also the farmers’ saving with KDA can be considered. Sometimes KDA advises the farmer to top up the savings and additional loan is advanced to the farmer. The farm, farm size and crop planted are considered as collaterals for loans. Viable crops (e.g. vegetables) are given high priority. It is important to note that 96% of borrowers from KDA who have been timely servicing their loans are women. Inputs Distribution The main channel of distribution is through the importers, distributors and agro dealers. There are examples of vertical integration with (i) importers assuming as well the role of distribution and sometimes retailing (Export Trading), (ii) distributors looking for extended retail networks but also possibilities of importing directly (TFA) and local agro-dealers who try to get engaged into wholesale either individually (Mr. Ngaula) or through associations, unions or regional multi-stakeholders’ companies and many others (Morogoro Union on agro-dealers). Agro dealers are usually the ones in touch with farmers and they link farmers to inputs. Agro-dealers are either specialized or pluri-active. Many combine trade (hardware), sale of inputs, farming, etc.
52
There is a fairly good network of agro dealers, hence a reasonably good coverage and outreach (i.e. area covered and number of farmers). A number of agro dealers in Karatu town have also opened shops in the villages. In some villages there are village based agro dealers. Out of 38 agro dealers registered at the district, 23 applied to supply input under NAIVS. Only 10 were awarded. More than 28 agro dealers (i.e. registered and un registered) continued to supply inputs. A number of vegetable farmers continue to buy and use seeds, fertilizers (urea), and pesticides. Agro dealers with premises in town tend to have bigger volumes of stock than those in the ward and country areas. During the cropping season, agro dealers stock certified seeds (i.e. hybrid seeds and composite seeds) and fertilizers. NAIVS increased the number of agro-dealers in Morogoro Rural District, there were 3 agro-dealers in 2007/2008 and up to 50 in 2011/2012. In Mvomero, the same scale of increase happened and there is currently at least one agro-dealer for each ward25. In Kilosa, in 2008/09 NAIVS had helped to get 54 agro-dealers operating and 19 additional agents were selected in 2009/10. Farmers acknowledge the fact that the agro-dealers are now (as a result of NAIVS) located much closer to their villages than before. Farmers in Mvomero and Kilosa Districts estimate that agro-dealers are now in a radius of 15Km. Previously they had to travel 55 Km (Mvomero to Morogoro), 90 Km (Ngerengere – Morogoro) or up to 150 Km (Kisaki – Morogoro). However, problems that happened during the implementation of NAIVS led to a reduction of the number of agro-dealers. For instance in Kilosa, the coverage fall from 33 wards / 46 villages (2009/10) to 16 wards in 2011/12 (18 A-D) due to the repression engaged by the DC in reaction to cheating. Such drop is also related to the change in agro dealers’ access to finance. With the end of the loan guarantees by CNFA, agro-dealers started struggling to get stocks when farmers need them and to stock the diversity of inputs that farmers need. The end between season 2010/11 and 2011/12 of the CNFA-guaranteed loans from NMB for the supply of inputs obliged the agro-dealers to look for other sources of funds or trading arrangements: (i) Advances from suppliers, e.g. TFC (to up to 40% of the annual needs), (ii) Loans or overdrafts from banks (NMB), (iii) Own capital, The decline in the number of agro-dealers in the supply chain is the result of:- (i) The agro-dealers chosen to take part to NAIVS had not initially enough working
capital or, (ii) Have not been able to build it up during the period when CNFA was guaranteeing
loans, (iii) The agro-dealers don’t have sufficient collaterals and trade records to get into
contracts with suppliers or with banks, (iv) Not all the banks or companies accept the type collaterals pledged by agro-dealers, (v) Banks are reluctant to spend time to value the collaterals, (vi) In some districts, the authorities blocked the payment to agro-dealers until cases of
cheating by some agro-dealers will have been sorted out, causing other agro-dealers (not suspected) to wait for their payments / to get their working capital replenished (Kilosa),
25
Doma: 1, Melela: 1, Mlali: 2, Mzumbe: 1, Langali: 1: Mgeta: 1, Tchenzema: 1, Nyandira: 1, Kikeo: 1, Luale: 1,
Maskat: 1, Kinda: 1, Mvomero: 1, Dakawa: 1: Kibati: 1, Pemba: 1, Embeti: 2, Kanga: 1: Muhonda: 1: Songaji: 1,
Mtibwa: 1, Diongoya: 1.

53
In Morogoro, the Regional Union of Agro-Dealers (status of company) created a SACCOS aimed at facilitating the access to loans to compensate the end of the CNFA-guaranteed loans by NMB. However, this system is not yet operating. Tanzanian Investment Bank is considered, as a potential source of funds but the Regional Union of Agro-dealers still has to clarify the possibilities of collaboration with this bank. To maintain their volume of activity, the agro-dealers who don’t have sufficient working capital need to get into agreements with their suppliers to receive specified quantities of inputs with determined payment facilities. Good track records of the Agro-Dealers for the period of CNFA-guaranteed loans ease obtaining such services. Large input suppliers can increase the agro-dealer’s ceiling if the conditions of collaboration continue to be good and the agro-dealer manages to get more markets. In some cases, suppliers help the agro-dealers to get access to bank loans by “guaranteeing” the agro-dealer (statement about a specified volume of business over a certain period). Banks or SACCOS borrow money to agro-dealers if they have collaterals but the interest rates are harmful. Mr. Ngaula could purchase a truck (to transport the inputs) through a loan of the Kinole SACCOS (Morogoro Rural). While NAIVS did a good job to promote a network of agro-dealers, some traditional trades of inputs were sidelined in NAIVS process who handled the bulk of fertilizers and seeds thus reducing their business flows. Under this context NAIVS has distorted the market. Input suppliers’ performances The NAIVS agro-dealers selection process was much focused on the capacity to assume a commercial function and tended to neglect the need of agronomic knowledge although the legislation mentions that, to become an agro dealer, one must have attended a training done by TPRI and that even sales-persons should have at least a diploma in agriculture and/or veterinary science. NAIVS got the support from CNFA and other institutions for the training of Agro-Dealers to help them reach competency even if some actors (agro-dealers, seed companies, district agents) consider that the training sessions were not sufficiently technical. Consequently, many agro-dealers failed and still fail to understand how seeds should be handled, stored, to which agro-climatic conditions they are adapted / not adapted. In addition, the effect of the training given is reduced by the agro-dealers’ tendency to hire sales persons without checking their skills and competencies. By doing so, they spoil the profession and function by being unable to give farmers information on usage and application of the inputs they sell. At this stage, many agro-dealers could theoretically be punished as they frequently go against the law (see above) on one or both of the mentioned requirements for agro-dealers to operate. In addition to the training provided by NAIVS, some distributors gave information concerning their products, the usage, etc. to the agro dealers, directly, through leaflets and brochures. This helps to fill the knowledge gap somehow. Distributors, seed companies (e.g. Tanseed International) and fertilizer suppliers in some cases teamed up with large farmers to set up large farms with higher expected productivity (e.g. Morogoro Rural). Regional agro-dealers (Morogoro) in some cases managed to establish trust and get input from importers (Yara) or producers (Minjingu) to local retailers and even institutions or programs (District Councils, TAP, NAFAKA, etc.). Local agro-dealers’ cooperation with farmers is very uneven, there are cases where they nicely collaborate through the participation to / support to / financing of FFS, demonstration plots with NAIVS or even on their own initiative.

54
Sales of fake seeds According to TOSCI26, there have been many evidences collected about fake/counterfeit seeds in 2011/12 season. This study collected many statements about fake/counterfeit seeds (Morogoro Rural, Mvomero, Kilosa) in some cases, two years in a row27. E.g. seeds from Tropical Seeds EA Limited, Highland Seeds (Mbeya) and ASA28 that don’t germinate at all (germination rate after official test = 0%). According to TOSCI, there are three types of counterfeiting case: (i) Outdated seeds: few cases (ii) Sale of seeds un-allowed in the country (varieties from Malawi, Mozambique,
Zambia) that occurred mostly in the Southern regions: few cases
(iii) Conditioning of whatever looking like seeds in bags with labels of the companies (bags stolen from the companies or copied). Major occurrence.
It is difficult for farmers and other actors to assess whether seeds are “fake/counterfeit” or if the cause of bad germination is due to the conditions of storage, the age of seeds, etc29. Farmers have limited knowledge on how to keep seeds, test them before utilization, send claims in case of insufficient quality, seek legal assistance to claim compensation if valid, etc. Even when they are sufficiently aware, it is difficult to take action because the problem appears only after the seeds have already been planted (the evidence / responsibility is not easy to establish). As a mitigation strategy, farmers use their own seeds. A background research is needed to really define the nature of the problem and therefore, to be able to quantify it. At this stage, it is estimated that fake seeds correspond to about 30% of the market. Traceability of seeds should – according to the law – be possible, as each lot of seeds is supposed to be stamped and numbered by TOSCI, by the seed producer and should be sold with proper receipts. But in fact, many actors don’t pay much attention to the procedures either by ignorance, carelessness or intention. The length of the supply chain, absence of traceability system and the potential profit of counterfeiting leave much space and create a high incentive for unethical actors at all levels to cheat. As a result, ethical actors along the chain believe that the only way to avoid fake seeds is to purchase them directly at the producers’ or wholesalers’ selling point (ASA or seed companies). Middlemen are sometimes accused of being the main source of adulteration of the inputs (cf. Dakawa agro-dealer). This is difficult to assess because local authorities don’t control their activities. The system of certification and regulation is reasonably well designed with a clear role given to TOSCI. It has in the last years been improving its presence in the field to increasingly guarantee the quality, collect and control samples, survey about problems mentioned by farmers, agro-dealers and other stakeholders. Although district agents were trained on the testing of seeds this function is not systematically implemented, as NAIVS doesn’t require a systematic testing of the seeds by Districts, research or agro-dealers. Extension agents also leave a gap in the process by being insufficiently supporting farmers in knowing the procedures to claim for their rights in case of sale of fake/counterfeit seeds. The consultants had the sensation (in Mvomero and Kilosa) that the context was not supportive for extension agents to play this role at all. Only a handful of farmers already put official claims (police, tribunal, etc.) that in some cases resulted with the identification of the
26
Meeting at TOSCI on 30/03/2012 27
Dakawa FGD (22/03/2012), Mvomero DC, Kilosa DC, Morogoro Rural DC, 28
Even in some case bought directly from the ASA farms (Msimba / Ilonga). 29
Quoting Mr. Lyanzile, Kilosa 26/03/2012

55
responsibilities. As a result, much of the burden returns to TOSCI whose budgets are still insufficient to allow a presence to a level that would leave less room for cheaters to introduce fake seeds. Even then, additional training is needed to tackle the lack of knowledge about the rights and procedures to claim for rights, especially at farmers’ level. While TFDA is allowed to close a food processing unit on the spot if the conditions don’t comply with the requirements, TOSCI has to collaborate with police for similar action against agro-dealers or other actors of the seed industry and even then has insufficient resources to carry out effective surveillance on (e.g. find other fake/counterfeit products, In addition, even when TOSCI manage to catch persons responsible of cheating and send the cases to police, the cases are difficult to win because of the lack of evidences (seed germination takes about a week or two, it is difficult to prove that the seed tested is the same than the seed planted and in fact it isn’t) it is therefore difficult to connect the failure of a crop to the origin / quality of seeds. Moreover, defaulters are often caught with small quantities that don’t motivate policemen or courts to take action (although they might be hidden stocks). On the up-stream side of the chain, large margin of fake seeds creates a fertile ground to corruption to the point that that even seed companies have been suspected of selling fake
seeds30, there have been cases where rose a facts have been threatened when they start prosecuting culprits. More efforts / means; however, should be applied to prevent sales of fake products. Legal steps need to be taken considering the fact that some persons are steeling government’s resources (subsidies) and threatening farmers’ lives. Application Appropriate and effective demand-pull and supply-push models for enhancing increased use of inputs are lacking, in the country as a whole. Extension services have been strengthened in recent years, objective is 10,000 extension officers, 7,000 already recruited or to be recruited compared to the initial situation). However, their presence to promote improvement of yields is still insufficient from different points of view: number of agents, number of crops that receive their attention, depth of their technical, financial and commercial knowledge, etc. Farmers regularly complain about the fact that communication about the inputs sold to them is insufficient: they miss information about the utilization and effects of the products that they are told to utilize. For instance, the voucher scheme introduced DAP to farmers who didn’t know about this fertilizer and who may fail to utilize it properly. Farmers complain of limited access to extension services while extension workers are not well-facilitated to deliver the services, sometime the two sides are at odd. The connection between, the research and the extension services is also not optimal. Many extension services don’t get/ask for updates of knowledge, research centres don’t get/ask
30
Quoting Tanseed International (28/03/2012) and Dr. Komba, MAFC seed unit (19/04/2012)
Sale of fake chemicals In Mvomero and Kilosa District, the survey identified one case of complaint about “2-4-D” herbicide of bad quality. After receiving complaints from local farmers saying that some herbicides didn’t work as expected the agro-dealer tested the product and verified the labels just to reach the same conclusion of the farmer. The agro-dealer contacted his supplier who accused intermediaries. The agro-dealer’s effort to trace the source of bad quality inputs ended there but the agro-dealer still decided to stop buying from that supplier who didn’t seem to pay much attention about the problem.

56
for feedback on seeds and practices. These structural weaknesses contribute to slow adoption of inputs and practices. In addition, farmers’ access to mechanization is insufficient which affects and threatens the productivity and the outcomes of their work. Manual labour can only reach limited levels of productivity and limitations of labour can put the crop at risk (timing and quality of land preparation, plantation, weeding, crop protection, harvest, transport, etc.). Utilizing important financial resources for inputs in the context of insufficient labour capacity is nonsense because too many parameters are not controlled. If the investment fails, there is no insuring system to help farmers recover at least a part of their investment. Finally, application of inputs is indirectly hindered by the fact that farmers’ production is under threat of many risks (army worms, birds) and financial availability to pay for the production costs are hectic (Mvomero). Farmers miss improved services such as crop surveillance, intervention units against pests (army worms threaten, monkeys, rats, elephants) with appropriate equipment (air-plane, etc.). In the case they lose a crop, they get no compensation or support to deal with debts and so on. NAIVS concept of “inputs package” (2 fertilizers and seeds) is based on improved agricultural practices but by obliging the farmers to acquire the whole package although they might need or be able to pay only a part of it, the system obliges the farmers to increase their risk taking or increases the temptation to sell some of the inputs (under-performing and encourages the corruption schemes). Fertilizers Urea is more widely used amongst all the crops. Phosphate fertilizers (TSP or MRP) are used in paddy and maize growing but un-evenly, preferentially by farmers getting vouchers and – again – pioneer farmers. In the Districts visited for the survey, utilization of fertilizers for growing maize is restricted to the beneficiaries of vouchers and to some pioneer and capitalized farmers. The consultants didn’t come across a farmer utilizing more than 50 Kg of Urea and 50 Kg of phosphate fertilizer per Acre. When fertilizer is part of the reasons why farmers do not use much fertilizer in 2011/12 Urea costs about TShs 75000 per 50 kg bag) and also partly because some of them are aware of previous soil analysis done. E.g. in Karatu previous studies by FAO Fertilizer Program, Selian Agricultural Research Institute (SARI) and former Mbulu District31 found that Karatu is located on a belt, with medium to high concentrations of plant nutrients (phosphate and other micro nutrients), hence the soils do not need additional application of phosphate fertilizers. In Kilosa and Mvomero Districts, similar studies are available (with different results in terms of natural levels of fertility). However, farmers justify their limited use of fertilizers by their belief that natural fertility is still sufficient and that chemical fertilizers are harmful for soils. In fact, for maize, yields without use of chemical fertilizers can reach 2.1 Tons/Ha. Unfortunately, the non-use of fertilizer in maize growing is also – too often – purely financial, leading to low yields that generally restricts the production to the mere satisfaction of the household needs of food. In these cases, profitability is low and returns to family labour are compensated by food self-sufficiency although it wouldn’t be compensated by sufficient financial returns. It shows the amplitude of the opportunity cost of labour that farmers face when their farming systems are oriented to food security.
31
Copies of the research done by Mbulu District are available at the district agriculture office.

57
Use of fertilizers for growing paddy is more frequent although it also varies much. In irrigation schemes most farmers use fertilizers because the soils are more intensively utilized and fertility needs to be maintained through artificial means. In addition in irrigation schemes levels of profitability are higher whereas risk management is improved, with the consequence of enhanced solvability of the farmers. Within irrigation schemes, farmers met for this survey mentioned a utilization of inputs of as much as 100 Kg/Acre either Urea only or a mix 50/50 of Urea and Phosphate fertilizer that corresponds to the prescription by NAIVS. Nevertheless, for farmers working in plots located outside of irrigation schemes, use of fertilizers drastically drops especially when farmers use broadcasting and traditional varieties of seeds. Fertilizers seem to be sent randomly to the different villages without considering the soil requirements. MRP was sent to Ilonga although soils there don’t require this input. If farmers would know this, they could become even more fearful (rightfully or not) about possible negative effects of fertilizers on their soils. Farmers frequently indicate that they feel/believe/know that by starting utilizing chemical fertilizers, they will cause the soils to get exhausted earlier). This can also be understood as a fear that when the subsidization system stops and they have to stop using fertilizers, their yields will be affected. Seeds In Karatu District, most farmers plant open pollinated variety (OPV) of seeds because it is relatively more affordable and because they have seen yields increases resulting from planting improved seeds. Anecdotal information from KDA, agro dealers and the DALDOs office estimates that over 90% of farmers in Karatu plant improved seeds. At national level, the 2011 Seed Industry report (MAFC, 2012) indicates that farmers still mostly (close to 90%) use their own seeds. Seeds are sometimes sold in areas in which they are not necessarily adapted. Agro-dealers don’t have sufficient knowledge about the qualities of seeds required for the places where they supply seeds (altitude, temperatures, rain regime, soil conditions, etc.) but still they sell their products. Conjectural shortages of specific varieties of seeds lead some seed companies to send whatever available variety to the villages (“bad supply is better than no supply…”). Mitigation solutions In Morogoro Region, the NAFAKA project is much based on the improvement of the relationship / business-linkages between the large input suppliers, the regional and local agro-dealers and the farmers. On the farmers’ side, the effort is put on technical and organizational training to improve their capacity to utilize input in a profitable and sustainable way and their capacity to access the inputs through groups (cooperatives, AMCOS, SACCOS, etc). The project expects to achieve the strengthening of Agro-Dealers through training, mobilization of innovation grants and close supervision by both up and down-stream actors (large agro-dealers and farmers’ groups). In addition, NAFAKA intends to improve farmers’ solvability by improving their market integration (processing, storage/warehousing and market linkage). The whole action is being implemented within geographically limited clusters in order to allow momentum creation. Summary of cereals agro inputs dynamics and constraints are depicted in table 19 below.

58
Table 19: Summary cereals agro inputs dynamics and constraints
MAIZE + PADDY SEEDS/SEEDLINGS FERTILISER AGRO CHEMICALS ACCESS Status
NAIVS is the main catalyst NAIVS is the main catalyst Absence of subsidy
Main constraints
Late delivery
Inappropriate variety
Infiltration of counterfeit
Late delivery
Inappropriate variety
Infiltration of counterfeit
Cheating by packing underweight
Price fluctuation/affordability
Late delivery
Inappropriate type
Infiltration of counterfeit
DISTRIBUTION Status
Inefficient distribution system
NAIVS is the main catalyst (agro dealers)
Inefficient distribution system
NAIVS is the main catalyst (agro dealers)
Inefficient distribution system
Main constraints
Long supply chain
Poor infrastructure (storage facilities, road)
Poor governance of subsidy (NAIVS)
High transportation costs (fuel, inflation, exchange rate, poor roads)
Weak agro dealers (technical knowledge, finance, business skills)
Long supply chain
Poor infrastructure (storage facilities, road)
Poor governance of subsidy (NAIVS)
High transportation costs (fuel, inflation, exchange rate, poor roads)
Weak agro dealers (technical knowledge, finance, business skills)
Long supply chain
Poor infrastructure (storage facilities)
Weak agro dealers (technical knowledge, finance, business skills)
Many varieties of patented, generics and counterfeit agro chemicals
APPLICATION Status
Fair awareness of use and benefits (maize)
Limited awareness on improved rice seeds
Fair awareness of use and benefits (maize)
Limited application (paddy)
Very limited use in Iringa, Karatu and Kilosa (maize – on farm chemicals)
Very high use everywhere (maize – post harvest chemicals)
Limited use (herbicide) in paddy everywhere
Main constraints
Late delivery
Inappropriate variety
Late delivery
Inappropriate type + infiltration of
Too many varieties and varied qualities confuses most smallholder farmers

59
Infiltration of counterfeit counterfeit, cheating by packing underweight
Price fluctuation (DAP)
Limited knowledge on benefits, use, handling and storage
MAIZE + PADDY Impact of constraints
Low yield or total loss of crop
Limited incentive to invest on inputs
Low yield or total loss of crop
Limited incentive to invest on inputs
No serious impact for limited use of on farm chemicals
Significant post harvest losses (maize)
Ongoing mitigation strategies
Public sector
Policy development and reforms: Kilimo Kwanza, Seed Act 2003, ASA, Cereal & Other Produce Act 2009, NSC, NPT-TC, NVRC, TOSCI, PEPQS, COSTECH (GMO), ABSAC, NBAC, WEMA, NARI, Merchandise Marks Regulations Act, 2002/2008, The Penal Code 2002, FCC Act 2003, PPP Act 2010, Tanzania membership in ISTA 2012, etc
Private Sector
TASTA (53), TANADA, agro dealers (3,000?), ACT/TAP (93), SAGCOT, TAHA,
Civil Society
AGRA, TAGMARK, BRITEN, AVRDC
Public sector
Policy development and reforms: Kilimo Kwanza, Fertiliser Act 2009, TFRA Act 2009 (not operational), NAIVS, Abuja Declaration, NARI, Merchandise Marks Regulations Act, 2002/2008, The Penal Code 2002, FCC Act 2003, PPP Act 2010, etc
Private Sector
FST, TANADA, agro dealers, ACT/TAP (93), YARA, SAGCOT, TAHA,
Civil Society
AGRA, CNFA/AGMARK, BRITEN,
Public sector
Policy development and reforms: Kilimo Kwanza, Pesticides Control Act 1984, Plant Protection Act 1997, TPRI Act 1979, NARI, Merchandise Marks Regulations Act, 2002/2008, The Penal Code 2002, FCC Act 2003, PPP Act 2010, etc
Private Sector
CropLife Tanzania (12), agro dealers, ACT/TAP (93), SACGOT, TAHA,
Civil Society
AGRA, CNFA/AGMARK, BRITEN, USAID/TAPP

60
3.3 Cattle In 2011 MLFD reported that Tanzania had an estimated 21.3 million cattle; ranking 3rd in Africa after Ethiopia and Sudan32. Most of these are indigenous, raised for multipurpose objectives and only a few are dairy cattle consisting of Friesian, Jersey, Ayrshire breeds and their crosses to the East African Zebu (predominant within the commercial sector). The contribution of the livestock sector to GDP is estimated to be 4% (MAFC, 2011) and livestock keeping offers livelihood to 1.3 households (average households in Tanzania has 5 people). The average lactation yield is 524 litres per Zebu cow over 239 days (of which 45% is off take for human consumption while 55% is sucked by the calf). The total annual milk production in Tanzania is estimated to be over 1.4 billion litres per annum; smallholder farmers produce 70%of the total milk and 30% is produced through intensive dairy production with improved cattle breeds. The milk production has doubled since 2000 but has grown relatively slowly in the last year (below 1%). Most of this growth can be attributed to increase in the number of dairy cows and not due to changes in production in the existing herd. Meru has a long history of dairy farming. Settler farmers introduced dairy farming and AI in Meru before independence. The establishment of the National Artificial Insemination Centre (NAIC) located in Usa River, which became operational in 1982, played a big role in increasing the number of dairy cattle in Meru. NAIC was established using funding from Swedish Government. In addition, the collapse of the coffee industry in the 1990s motivated a number of farmers to revert to dairy farming. Songoro Ward in Meru is currently the leading supplier of dairy animal to other parts of Tanzania. Most farmers in Meru rear cattle through zero grazing, a system, which is harmonious with the farming practice where majority of farmers own only one acre of land. On a negative note, zero grazing is criticized for being labor intensive and that it also limits expansion of the dairy industry in Meru. Nearly all farmers in Meru have cattle of exotic origin. Friesian breeds are predominant although some farmers also have Ayrshire and a few have Jersey and cross breeds of Friesian and local Zebu cattle. Each household has averagely 2 dairy animals, each produce about 16 liters of milk daily (i.e. 32 liters of milk per household per day). Some progressive farmers own up to 12 dairy animals. Seventy five percent (75%) of farmers are using AI services. Inputs for cattle value chains (i.e. dairy and meat) include veterinary medicines, vaccines, feed additives (feed supplements), Artificial Insemination (AI) and extension services. In Meru District Council, the study focused on analysis of access, distribution, and usage of AI services, veterinary medicine, vaccines and feeds additives. Most dealers of veterinary medicine in Meru District Council (MDC) buy inputs from wholesalers, mostly located in Arusha. Unlike in the crop sector, where government subsidy is much higher, in the livestock sector, government subsidizes only acaricides. Most farmers do not know of the government subsidy on acaricides. Also in the past, government used to organize and conduct vaccination of animals. Provision of vaccination services has been privatized and now is being done by the private sector and Non Governmental Organizations (NGOs.
32
With the split of South and Northern Sudan, Tanzania may be second from Ethiopia.

61
Interesting model for promoting access, distribution and utilization of inputs is in place in Meru. This inclusive model brings together farmers who are organized in an association (Meru Dairy Farmers Association - MEDAFA), a milk processor (Mountain Green) and an inbuilt system for supply of inputs, where farmers acquire input and is deducted from sale of milk at the end of the month. The system is working so well, with the only limitation being that the processor cannot buy all the milk farmers produce and farmers are looking for market outside the arrangement. An alternative market exists with itinerant milk mongers, many of them young men, who buy milk in Meru and supply to Hotels, food kiosks and homes in Arusha. Meru Dairy Farmers Association (MEDAFA) MEDAFA is an association of Dairy Farmers based in Meru District Council. In the past MEDAFA got support from Land O Lakes, an American international Non Governmental Organization (NGO). MEDAFA was supported to establish collection centers and currently the association has got four milk collection centers with cooling facilities. Management and other members of MEDAFA were supported to acquire training in milk handling and processing. Mountain Green Is a private company, started in 1989 then was formally registered in 1998. It is currently employing four members of staff: production manager, sales and marketing staff and 2 staff doing production. Currently actively engaged in two lines of business; (i) milk processing and (ii) supply of agriculture inputs for both crops and livestock but specializing mainly in livestock inputs. The company has a capacity to process 700 liters of milk but it is currently processing only 500 liters because it is a low season for sale of cheese. The Meru milk industry, particularly the market for processed milk and milk products is partly linked to the tourist and its trends. Many consumers of cheese – one of the main products of Mountain Green, are mainly tourists and Mountain Green sells cheese mainly to tourist hotels. Other products of mountain Green are sour milk (cultured milk), butter and yoghurt. Data and statistics concerning quantity of inputs supplied by Mountain Green were not readily available. However, discussions with farmers revealed that many farmers are using de-wormers, feeds supplements and artificial insemination. AI services are easily accessible from NAIC, through an extension staff that reside in the same village.
3.3.1 Cattle agro inputs access, distribution and application Access A number of agro dealers located along the Arusha- Moshi highway (e.g. in Tengeru, Usa River, Maji ya chai etc) stock veterinary drugs and sometimes, animal feeds. However, the penetration of veterinary drug dealers into villages is limited hence posing a limitation to the supply and eventually availability of veterinary drugs by farmers who are located away from the highway. Most farmers in the village stock feeds e.g. cotton cake, sunflower seed cake, maize bran, salt leaks etc. Some grow special grass (elephant grass) for feeding cattle. A number of farmers also use stalks/stems of previous harvest (e.g. stem of maize, beans etc) to feed cattle. Feed additives (e.g. vitamins and salt leaks) are available in the villages. Domestic production of fodder is very limited to farmers doing zero grazing. Meru District Council estimates that there are close to fifty-eight (58) shops selling veterinary drugs and food supplements (mainly vitamins) in the district. Although the

62
distribution of vet shops across the district is uneven, there is at least, one veterinary shop in every ward. However, pastoralists and even some isolated non-pastoralist farmers still find drugs unavailable in their localities. Vaccines, especially for East Cost Fever (ECF) have limited availability, and are much less accessible by individual smallholder cattle farmers. This is because handling vaccines requires special skills, expertise and additional costs, which pose a limitation for the veterinary shops in the rural parts of the district. The private veterinary practitioner needs a commercial threshold (of at least 200 cattle) if he is to travel to the villages to vaccinate. In the past, government undertook vaccination. However, the government has currently left the vaccination of livestock to the market (private sector). Twenty (20) companies have been licensed to deal in vaccines. NGOs such GSC have in the recent past had projects, which supported vaccination. Affordability of vaccines and veterinary drugs is seen to be a highly relative concept. Although most farmers say the drugs are unaffordable, district extension staffs argue that farmers get adequate money from sales of livestock products and other agricultural commodities, which could enable them, afford the drugs if they were interested. Low usage of inputs is because cattle are reared mainly for subsistence, with little emphasis on improving production and productivity. In relation to the above, farmers weigh opportunity cost and benefit of using inputs against comparative importance or relevance of other constraints that they face. There are other economic and rural livelihood issues such as need for school fees and hospital bills that are sometimes more pressing and are considered more important. Therefore farmers allocate their money on such issues. This point is even compounded by the common belief among farmers that even with minimal care, cattle will survive. On the other hand, farmers attribute their low usage of input to low purchasing power. Farmers consider veterinary inputs to be costly and less affordable. According to the experience of Global Services Corps (GSC), an NGO, which supported vaccination of indigenous chickens and cattle in Meru District council, low demand and usage of veterinary medicines are related to traditional beliefs among farmers. Many farmers have a negative belief that inorganic (modern) medicine kills livestock. This reason partly explains the resistance to vaccination of animals common among many farmers. Because of such beliefs a number of farmers use traditional, treatments for animals.
Distribution Mountain Green is the leading supplier of veterinary drugs and feeds to mainly members of MADEFA but he is not alone. Besides Mountain Green, there are three (3) additional agro veterinary dealers in the same ward, who also stock feeds and veterinary medicines. In all it can be said that there is a good penetration and outreach of veterinary drugs and services into the villages. This is because of a good network of agro veterinary service providers and drug dealers. It can be said that Meru attracted more agro dealers because the demand of inputs there is also high. Usually, the stockiest get supplies from Arusha town, which is hardly 30 kilometers away. Some stockist get supplies directly from Dar es Salaam where they can get inputs and lower prices. Weather they get inputs from Arusha of Dar es Salaam, inputs are always available.

63
Application Usage of veterinary medicine is affected by knowledge of its application. Few farmers know how to treat animals. There is a slight deficit of extension staff as there are 57 extension staff for 74 villages. Although the number of extension staff falls short of the number of villages to be covered, the district considers itself to be moderately served by the available extension staff. Access to veterinary services is rated to be average. Maintaining a cold chain for vaccines is considered to be a main constraint to storage, transportation and usage of vaccines and vaccination services. The death of animals after vaccination can be partly attributed to use of vaccines, which lost qualities and effectiveness because of poor storage and handling. Also unstable electricity poses a problem of maintaining a cold chain. The dynamics and constraints of cattle AI, feed regime, veterinary drugs and vaccines are summarized in table 20 below.

64
Table 20: Cattle AI, animal feeds, veterinary drugs and vaccines - dynamics and constraints
LIVESTOCK ARTIFICIAL INSEMINATION ANIMAL FEEDS VETERINARY DRUGS AND VACCINES ACCESS Status
No subsidy on AI. AI services are solely provided by government but is demand driven
Private dealers sell animal feeds (i.e. seed cakes, minerals and salt).
A few farmers can make hay.
Majority feed animals on wet (fresh) fodder
Private dealers sell drugs. A few companies are selling acaricides subsidised by government.
Farmers are not aware of subsidy on acaricides
Government privatised vaccination services and a few companies (e.g. Vet Agro) are authorised to distribute vaccines and also vaccinate animals
Main constraints
Limited supply of semen
Most available semen is for dairy animals
Costly for an average farmer
AI can be inaccurate and hence low success rates discourage farmers
Poor quality feeds (especially the seed cakes)
Limited supply and hence access of vaccines
Handling and transporting vaccines and vaccinating animals requires special skills
Infiltration of counterfeit drugs
DISTRIBUTION Status
Inefficient distribution system
NAIC and NGOs trained inseminators but they are not properly equipped
NAIC substation in Dodoma is not currently working
In Meru, the distribution system is efficient but nationally, it is inefficient
Inefficient distribution system, nationally
Main constraints
There are only 2 NAIC staff who can fix the equipment for liquid nitrogen which is located at the 5 substations
Poor facilitation of NAIC personnel
Long supply chain
Poor infrastructure (storage facilities, road)
Weak agro dealers (technical knowledge, finance, business skills)
Long supply chain
Poor infrastructure (storage facilities)
Weak agro vets (technical knowledge, finance, business skills)
APPLICATION Status
Fair awareness of use and benefits of AI Awareness of the advantages of feeding Animals are hardly vaccinated

65
animals well e.g. more milk, etc.
Fair awareness of alternative ways of feeding livestock – e.g. using other plant stalks (maize and beans stalks)
Limited use of other acaricides but fairly more use of de-wormers and antibiotics
Main constraints
Farmers do not have knowledge to tell if the animal is ready for insemination, which is one reason for the low success of insemination
Limited knowledge in formulating feeds
Limited knowledge in preserving feeds (i.e. making hay)
Limited/few community animal health workers and extension staff
Limited supply of especially vaccines because of the problems associated with handling it.
LIVESTOCK Impact of constraints
Limited/low use of AI services
Limited incentive to invest in using AI mainly because of its low rate of success
Low milk and beef production
Risk of loss of herds in case of outbreak of diseases
Ongoing mitigation strategies
Public sector
Policy development and reforms: Kilimo Kwanza, PPP Act 2010, The Veterinary Act 2003, Dairy Industry Act 2004, Meat Industry Act 2006, TMB, TDB, etc
Private Sector
Ranches to produce semen, Private inseminators etc.
Civil Society
Heifer International, Land O’ Lakes etc.
Public sector
Policy development and reforms: Kilimo Kwanza, PPP Act 2010, Dairy Industry Act 2004, Meat Industry Act 2006, TMB, TDB, etc
Private Sector
A number of private investments in making animal feeds
Public sector
Policy development and reforms: Kilimo Kwanza, PPP Act 2010, Dairy Industry Act 2004, Meat Industry Act 2006, TMB, TDB, etc
Private Sector
Vet Agro, Travetis, Coopers, Farm Base, Farmer Centre, Tan Veterina
Civil Society
Heifer International, Land O’ Lakes etc.

66
3.4 Tomatoes Kilolo District is one of the districts in Iringa Region; others are Iringa Rural, Iringa Municipal and Mufindi. It has a total of 902,500 hectares of which 450,017 are arable and only 121,636 or 44% is under cultivation. The District produces a variety of crops including; maize, beans, paddy, Irish potatoes, wheat, sorghum, finger millet, sweet potatoes, peas, cassava and legumes. Maize is the main staple food which account for 69% of the land cultivated in 2010/11. Other crops categorized as cash earning crops are: sunflower, tomatoes, onions, cabbage, tea, groundnuts, fruits, barley and pyrethrum. These crops occupied 13,636 hectares or 11.26%. It can be noted that Kilolo has a variety horticultural products and therefore demands significant agro inputs. In 2010/11 Kilolo District produced 68,508mt of tomatoes which is about 20% of the tomatoes produced in the country, the tomatoes are cultivated in 3,287 hectares (8,119acres) giving an output of 20.8mt/ha or 8.4mt/acre. On average a farmer cultivates a quarter an acre that suggests that about 32,440 farmers are involved in tomato production in the wards of Tomato in Kilolo is produced in the wards of Ilula, Uhambingeto, Image, Irole, Mahenge, Mtitu and Ukumbi. Table 21 shows hectares cultivated with tomatoes. Table 21: Hectares Cultivated with Tomatoes and Production (Mt)
2006/07 2007/08 2008/09 2009/10 2010/11
Hectares 3,549 2,662 2,671 3,142 3,287
Production in Mt 59,444 66,560 71,123 69,124 68,508
Yield (Mt/acre) 16.75 25.00 26.63 22.00 20.84 Source: DALDO – Kilolo
The productivity of 8.5 mt/acre is very low, it is about 40% of the recommended outputs of between 20 - 40mt/acre if Good Agricultural Practices (GAP) are observed. The 68,000mt produced in the region are worth about TShs 9.714 billion assuming an average farm gate price of TShs 6,000 per crate of 42 Kgs or TShs 142 per Kg. The major challenge according to extension officers has been inability of farmers to adhere to GAP that in a number of ways promote spread of plant diseases, pests and vectors.
3.4.1 Tomatoes agro inputs access, distribution and application Access Given the diverse farming systems in Kilolo and high prevalence of horticultural produce that demands a lot of inputs, and particularly chemicals. The District authority has taken keen interest in monitoring the supply of inputs and maintains information about the demand and supply of the recommended inputs. The District Agricultural Office estimates that there is 73% availability of agro-chemicals in the district, which is an important achievement. During the interview with tomato producers, they all (100%) indicated to use improved seeds, fertilisers and agro-chemicals. Table 22 shows demand and supply of chemicals in Iringa. At Ilula town (the hub of tomato distribution) in Kilolo District there are about 15 agro-dealers some of whom are producers of tomatoes which helps them to assess performance of seeds on their farms which improves the value of advice they provide to farmers buying seeds and agro-chemicals.

67
Table 22: Demands and Supply of Agro-Chemicals in Iringa
Demand in Kgs
Supplied in Kgs
(Supplied/Demand) X
100
Distributed in Kgs
(Distributed /Supplied) X
100
(Distributed /Demand) X
100
Thionex 90,243 70,853 78.5% 45,241 63.9% 50.1%
Selecron 12,854 2945 22.9% 1544 52.4% 12.0%
Actellic Super EC
212 150 70.8% 85 56.7% 40.1%
Actellic Super Dust
12,975 12,033 92.7% 11,985 99.6% 92.4%
Shumba Super Dust
13,657 12,324 90.2% 11,545 93.7% 84.5%
Marathion 9,889 6,543 66.2% 6123 93.6% 61.9%
Dusbarn 522 178 34.1% 132 74.2% 25.3%
Decis 357 210 58.8% 156 74.3% 43.7%
Karate 20,32 14,35 12,09
Total/Average 140,761 105,285 74.8% 76,832 73.0% 54.6%
Source: DALDO Kilolo
Access to Agro-Chemicals Tomato is one of the crops that consume a lot of chemicals, availability in Ilula rated as good as farmers are able to purchase the chemicals from agro-dealers who are accessible (refer to seeds). Just as with seeds farmers complain of higher price of chemicals but industry experts show that Tanzania being a low income market for many global chemical companies, segmentation makes Tanzania get some chemicals at lower price compared to developed markets. Farmers have managed to afford chemicals due to positive return on investment that characterize tomato production and markets. The perishability of tomatoes leads to higher price volatility and therefore different profitability levels even within one season which impacts working capital for the coming season. Gross-margin computations indicate that inputs account for 46% of the farm gate value, seeds account for 6.3%, fertilizers at 22.% and chemicals at 18.4% as shown in the table below. Table 23 shows costs of inputs and revenue for a tomato farmer.
Table 23: Costs of Inputs Vs Revenue for an average tomato farmer
Revenue (TShs) 1,902,000 Percent
Seeds 120,000 6%
Fertilisers 420,000 22%
Chemicals 350,000 18%
Wear & tear equipments 54,500 3%
Other costs 325,000 17%
Gross Profit 632,500 33%
Source: Fieldwork calculations © MMA April 2012
Distribution of Inputs Tomato seeds are not bulky and therefore the impact of distribution cost on the overall/final price is not significant as compared to fertilizers and some chemicals, agro-dealers have not indicated that distribution cost is a major factor. Further, introduction of motorcycle transport has eased access to agro dealers particularly for farmers who are in a perimeter of
68
about 20kms. Affordability is a challenge as many farmers fail to relate costs and revenue; farmers have always been advancing the argument that tomato seeds are expensive. Both global and domestic manufacturers of chemicals distribute chemicals through a network of suppliers, who in turn supply to agro-dealers. Iringa is estimated to have more than 300 registered agro-dealers; as noted during this study Ilula Ward has about 15 of them. Most chemicals come in smaller containers that are easy to transport. The most preferred/efficient transport system between Dar es Salaam and Iringa is by cargo trucks. There is no established costing structure for transporting the chemicals; there are times when some chemicals are transported in passenger buses irrespective of warning signs and in some cases mixed with food items. The major challenge in distribution of chemicals has been disposal of expired products and used containers. There are no established structures and systems to monitor effectiveness of chemicals and safe disposal of wastes and containers. While this aspect has nothing to do with increased application of chemicals it just indicate the deliberate need for the industry to get organised and coordinated. There had been different initiatives to address safe use of chemicals in the country by various stakeholders, CropLife Tanzania has trained about 50,000 farmers on safe use chemicals, MAFC (Department of Plant Health Protection) in collaboration with Ministry of Health and Social Welfare, TPRI, Occupational Safety and Health World Health Organisation have provided training to 31 representatives of wards who in turn selected 22 trainers for a Training Of Trainers (TOT) on safe use of chemicals. The initiative has setup a system for monitoring health problems likely to be caused by application of chemicals.
Application of Inputs Seeds Application: Farmers reported seeds application rates of 100gms per quarter an acre or 400gms per acre, about 75% of farmers at Imalutwa and 70% at Ilawa village source seeds by squeezing filial two and three (F2 and F3) fruits. The second source of seeds is Hybrid seeds from agro-dealers shops where there are a number of seed names including; Onex, Tanya, Tengeru, African Best, Nuru, Nyanya Mwanga, Rio Grand, Oxylin, Eden, Mkulima, etc. The decision of what type of seeds to plant is highly influenced by the agro-dealer’s advice and to a small extent farmers are reported to ask from a neighbour who seem to have good fruits.
Agro-Chemical Application: Application rate for agro-chemicals in tomato production is very high, farmers are faced with a challenge of making decision which chemical to apply for what, during the discussions farmers were able to recall 28 names of chemicals and their intended generic use. In tomato producing areas the problem has not been much with access and distribution, but over application of pesticides, which apart from increasing costs threatens the health of farm workers, consumers and the environment. The Law requires that all chemical containers be labelled in Swahili and English for the safe application. It has been widely reported that farmers do not always follow the instructions; the tendency now has been that as the efficacy of the chemicals decline farmers resort to increase dosage or blend it with other chemicals. Limited knowledge base on the dynamics of the pests and diseases in tomato and lack of mechanisms to share such knowledge has weakened the relationship between extension officers and farmers and knowledge transfer. Farmers trust their own intuition more than the advice from extension officers due to the degree of the risk inherent is such a decision.
Challenges in the Accessibility, Distribution and Application of Inputs in Horticulture Prevalence of Inefficacious (Fake) Products: Farmers interviewed reported several incidences associated with inefficacious inputs particularly seeds. The trend had been so common with well-known types i.e. Tanya, Tengeru 97 and Onexy. In one case (2010) a farmer had bought

69
Onex seeds adequate for half an acre plot; the farmer started noticing abnormal growth right in the nursery bed but thought the plants will improve after transplanting. On fruition the tomatoes were darker and more round. The tomatoes could not fetch any market so the farmer had to uproot the crop after significant investment. Efforts to follow up with supplier proved expensive and the supplier failed to cooperate. Thereafter the farmer prefers to buy seeds from well-reputed suppliers. In another case a farmer had purchased seeds from a reputed agro-dealer, the crop foliage at the transplanting stage was so irregular and resembled some local leaf vegetables (Mgagani). The problem was also noted with some neighbours who might have bought similar seeds. Another farmer narrated how he had bought seeds labelled Tengeru just to end up with Roma fruits. Farmers attributed high prevalence of poor seeds to lack of monitoring and enforcement mechanism in the industry, none of the farmers knew where to report such problems apart from the supplier and village/ward extension officers. Even the extension officers are not well equipped to report upstream in such cases. On part of agro-chemicals farmers reported that inefficacious products were so rampant soon after trade liberalization because anyone was allowed to import and the capacity of TPRI was very limited to monitor every part of the country. Though the problem of fake chemicals has declined compared to the past it is still serious compared with other countries. Apart from chemicals that became known after poor results, there are some that farmers could tell with naked eye that they are suspicious. There are so many trade names, farmers were able to mention 28 at the meeting but estimate they could be more than 50. Farmers complain of inadequate information on the containers that by law have to be in at least Kiswahili and English. Farmers have not been adequately told how to keep records of inputs for purpose of traceability which is very crucial in sanctioning actors in the supply chain that produce fake products. Key Lessons from Tomato in Kilolo Lack of mechanism or ineffectiveness of existing systems call for more innovative and creative measures to safeguard farmers against greedy traders. In this respect the role of Iringa in tomato production is quite significant and the volumes of both chemicals and seeds consumed is significant. The Government on its part need to strengthen the monitoring and enforcement of existing laws and regulations. On the other hand the private sector need to get more organised and active, CropLife Tanzania needs to be strengthened including putting a secretariat that will offer a window for referral in case of business malpractices. It is important that the private sector assumes a more pro-active role of self-regulating and make the law of the land a referral stage where intra-industry regulations have failed. Dynamics and constraints on tomatoes agro inputs are summarized in table 24 below.

70
Table 24: Summary of tomatoes agro inputs dynamics and constraints
TOMATOES SEEDS/SEEDLINGS FERTILISER AGRO CHEMICALS ACCESS Status
Due to high margin on tomato seeds are readily available at agro-dealer shops.
The crop uses significant amount of fertilizers – farmers can afford due to better returns on tomato production business
Chemicals readily available in shops farmers identified >50 names of chemicals.
Main constraints
Presence of many varieties with little information on suitability
High prevalence of fake seeds
Prevalence of poor quality fertilizers
Limited information on types of chemicals to guide farmers
High presence of fake products in the market
DISTRIBUTION Status
Seeds are low volume distribution cost not a problem,
Major seed suppliers have networks of agent.
Fertilizer obtained in about 10Kms radius Chemicals are obtained in about 10Kms radius
Main constraints
No serious constraint on distribution of improved seeds
No serious constraint on distribution There is no serious constraint on distribution of chemicals
APPLICATION Status
Still high rate of recycled seeds – beyond recommended age
Fair use of fertilizers – critical for plant growth
Fairly high use of chemicals
Main constraints
Limited information on seeds selection criteria
Low level of GAP among farmers
No serious constraints Low chemical efficacy hence higher on farm losses
Limited advice from Government extension officers.
Limited use of protective gear
71
TOMATOES Impact of constraints
Low output per unit area <50 of the recommended rate.
acre yield hence return on investment.
Low yield sometime poor quality hence limited market attractiveness
High cost of production due to overuse of chemicals
High prevalence of diseases due to resistance developed from misuse of chemicals
Health risks on farmers spraying crops
Ongoing mitigation strategies
Public sector
Policy development and reforms: Kilimo Kwanza, Seed Act 2003, Cereal & Other Produce Act 2009, NSC, NPT-TC, NVRC, TOSCI, PEPQS, COSTECH (GMO), ABSAC, NBAC, WEMA, NARI, Merchandise Marks Regulations Act, 2002/2008, The Penal Code 2002, FCC Act 2003, PPP Act 2010, Tanzania membership in ISTA 2012, etc
Private Sector
TASTA (53), TANADA, agro dealers (3,000?), ACT/TAP (93), SAGCOT, TAHA,
Civil Society
AGRA, CNFA/AGMARK, BRITEN, AVRDC
Public sector
Policy development and reforms: Kilimo Kwanza, Fertiliser Act 2009, TFRA Act 2009 (operational from May 2012), , Abuja Declaration, Merchandise Marks Regulations Act, 2002/2008, The Penal Code 2002, FCC Act 2003, PPP Act 2010, etc
Private Sector
FST, TANADA, agro dealers, ACT/TAP (93), YARA, SAGCOT, TAHA,
Civil Society
AGRA, CNFA/AGMARK, BRITEN,
Public sector
WHO/MAFC – project on monitoring health, Rural Business Support Services Programme in Iringa, Policy development and reforms: Kilimo Kwanza, Pesticides Control Act 1984, Plant Protection Act 1997, TPRI Act 1979, Merchandise Marks Regulations Act, 2002/2008, The Penal Code 2002, FCC Act 2003, PPP Act 2010, etc
Private Sector
CropLife Tanzania (12), agro dealers, , TAHA,
Civil Society
AGRA, CNFA/AGMARK, BRITEN, USAID/TAPP
72
3.5 Cashew Nuts Export of Cashew nuts generates an average of USD 74m per year in foreign exchange earnings, meaning that cashew is the most important agricultural export crop of Tanzania in value terms. Export earnings from cashew nut industry as a percentage of total export earnings is estimated at 5-10%. Number of cashew farmers was estimated at 300,000 in 200333. To date it is expected to have grown past this estimate. Average farm size for smallholder farmer ranges from between 2 - 4 ha. Average yield per tree (kg /pa) is noted to be low as 5 Kgs if the tree is not maintained and about 20 - 30 Kgs for well maintained trees. Cashew trees are present in the whole Mtwara Region associated with crops such as cassava, sorghum, paddy, maize, sesame, coconut and pulses. Crops grown are diversely shared across different agro-ecological zones. Table 25 below shows crop grown in the four agro-ecological zones.
Table 25: Agro ecological zones and respective crops grown in Mtwara
Makonde Plateau Kitele Ruvuma River Valley Coastal plain
Cassava, pulses, cashew
Paddy, sorghum, sesame, maize, cashew, coconuts
Cashew, paddy, cow peas, maize
Cashew, groundnuts, cow peas, chicken peas, coconut
Little population density
High density (5 acres and less per HH)
Less than 5 acres per HH
Less than 5 acres and large scale farmers
Main concentration of new cashew plantations
There is an irrigation scheme, hence paddy production
Large commercial coconut plantations
Most trees in the region are old (2.2 million), some over 50 years and not equally maintained (591,000 of the oldest trees are abandoned). However, new trees of varieties resistant to powdery mildew (created by ARI Naliendele) were planted in the 10 last years (1.3 million). Spacing vary from place to place, ranging from 28 to 70 trees per acre. Reasons for difference in spacing are difference in information from extension and farmers’ decision, and the non-replacement of trees in old plantations. It is therefore difficult to quantify the crop with an area. In Mtwara region, cashew is the main cash crop and most farmers derive their livelihood from producing it. It is estimated that about 30,000 farmers are involved in production of cashew. Table 26 shows cashew nut production statistics.
Table 26: Cashew-nut Production statistics (raw nuts)
Year Quantity (Kg)
2006/07 5,096,000
2007/08 5,906,489
2008/09 5,077,299
2009/10 5,141,071
2010/11 11,430,000
2011/12 17,739,139 Source: Mtwara Rural, DALDO office
33
According to the Tanzanian Cashew nut Board reported in http://www.bloomberg.com/news/2011-03-
09/tanzania-s-cashew-nut-production-jumped-60-last-season-on-favorable-rains.html

73
3.5.1 Cashew nuts agro inputs access, distribution and application Availability Availability of seedlings has improved in the recent years through the set up of village nurseries through DADPs funds (or other District Funds34). Through nurseries, 1.3 million seedlings were produced. However, from 18 nurseries, which were initiated, only three are operating on a commercial basis, indicating a low sustainability. This is because initially, Mtwara District was subsidizing the cost of trees on behalf of farmers. Now farmers have to buy trees on their own ingenuity, a reality that only a few farmers have understood. In addition, many new plantations have been set up and the plantation momentum may have been lost. Most inputs are available in Mtwara. Sulfur can be bought in bulk from large input companies (i.e. Abbasi and Export Trading). Local agro-dealers get supply from these large companies in Mtwara and send to their shops. The large inputs suppliers do a large part of the sales of subsidized inputs. Other chemicals can also be purchased (retail) from large companies. There was a shortage of Bayfidan in 2010/11 but input suppliers brought substitute products (e.g. powershot, defender, mupafidan, movil, etc.). These products are registered in Tanzania (TPRI) and there is no evidence that the products that came to Mtwara / Mayanga were faked or adulterated. Even with the subsidy system with funds raised from the export levy and from government coffers, the prices of inputs are still high (25,000 for a bag of 25 Kg of sulfur with subsidy). In fact, it doubled during the last years. Equally, subsidy systems that are supposed to guarantee availability of inputs for small farmers have often failed to meet the objective. Large input companies have been chosen through tender (with the noble aim of widening the market) to supply specified quantities at specified prices. But in the last years, a number of companies failed to perform. The reasons of this under-performance are not known. Reasons such as insufficient working capital, shortage on the world market, and competition in Tanzania with the fruit producers in Coast regions are advanced. But these companies are also suspected to have created artificial shortages to get increased incomes with sales on the free market. To avoid the scarcity, government introduced in 2011/12 a new tendering system aimed at ensuring that the companies have sufficient cash-flow to buy stocks corresponding to the demand. This increases the capital intensity of the business. Affordability Cashew nut is sold through auctions. However, the Government also decided to establish an indicative price (TShs 1,200/Kg for 2011/12 season) at the condition that farmers sell through WRS as a way to avoid unscrupulous traders and allow farmers to benefit from seasonal price fluctuations. For the 2011/12 season, the indicative price was based on the price trend observed in 2010/1135 but unfortunately, the real prices on the market evolved differently. Government directives obliged WRS to pay an advance of 70% of the TShs 1,200 (i.e. TShs 850/kg) of cashew sold. However, WRS holders failed to sell more than a half of the cashew in the warehouses36) pay the difference to the farmers causing unrest. There is no better example of the danger of practicing WRS without sufficient market intelligence and of letting political interests interfere with commercial practices. The Government sent the
34
Quoting Eng. Lekule, Input Fund, met on 05/04/2012 35
A peak due to bad harvests in other countries (quoting Tanzanian Cashew Board, 04/04/2012) 36
i.e. in Mtwara Rural District, 9,192 tons were still stored out of the 17,739 tons produced

74
balance of the money to the region to be used to pay the farmers second payment from sale of cashew nut but payments had not yet been finalized on 26/04/2012. Prices of inputs have increased (e.g. sulfur sold for TShs 50,000 / 25 Kg instead of TShs 25,000 TZS). Although incomes increased concomitantly – due to the increasing of prices and the introduction of WRS – with the increasing of costs farmers still feel that it is affecting their incomes. In fact, farmers with low yields are short of resources to pay for the inputs (see table 27 and figure 7 below). But farmers with average and high production are potentially able to afford the inputs (preferably subsidized) with their own resources. Data collected during our survey (see table 23 below) indicate that a farmer with high production (4,500 Kg/Ha) can reach high level of profitability (SGP=TShs 3.88 m / SGM=72%) by utilizing inputs as indicated by best practices. When farmers get low yields with the same use of inputs, the profitability of their activity is much lower (SGP=TShs 38,198 / SGM=3%).
Table 27: Variation of the profitability according to the yields (Mayanga)
Inputs High quantity (1) High quantity (1)
Yields (Kg/Ha)
Low yields (10 Kg/tree) High Yields (40 Kg/Tree)
SGP SGM SGP SGM
1125 38 198 3%
4500 3 877 332 72%
(1) 3 x sulfur, 1 x Bayfidan, 2 x weeding, 1 x Karate Source: Fieldwork and analysis © MMA April 2012
According to the farmers met in Mayanga (Mtwara Rural District), the incomes from cashew nuts represent between 39% and 72% of the farmers total incomes37. The three cash-flow trends presented in figure 7 below corresponds to a single modality of utilization of inputs (as advised by research centres) and (i) high yields with subsidized inputs, (ii) high yields with non subsidized inputs and (iii) low yields with subsidized inputs38.
Figure 7 : Cash-flow dynamics for small cashew farmers
37
Assumption: farmers combining cashew (3 Acres), cassava (2 Acres), sorghum (3 Acres), casual labour and
small businesses. The lowest contribution in the total incomes corresponds to the lowest hypothesis of
production (10 Kg/tree ~ 1,125 Kg/Ha) mentioned by farmers. The highest contribution in the total incomes
corresponds to a high hypothesis (40 Kg/tree ~ 4,500 Kg/Ha). 38
Note that for the purpose of this analysis, the consultant asked the farmers to describe a “random” household
and that comparisons are based on variations in the use of inputs and the yields described by the farmers
themselves.

75
Figure 7 above logically indicates that cash-flow dynamics of farmers with low yields using inputs is characterized by a cash-flow trend low and with a very slow progression than for farmers with higher yields (40 Kg/Tree) whose level of capitalization increases substantially along a year. Yet, it is to be expected that farmers who maintain high level of effort in their plantation progressively reach the higher level of production. This indicates the importance of the utilization of inputs and – to a certain extent – of the subsidization of these inputs. However, the figure also shows that for farmers who already reached high yields, the relative impact of subsidies is very limited (the two highest lines are almost merged) which indicates that these farmers need AVAILABILITY of inputs but not NECESSARILY subsidizing of inputs and that this should be reserved for farmers with low yields for a specified number of years at the condition that they use this opportunity to upgrade their plantation. It also shows that political mothering sustains a very costly and un-sustainable mentality amongst farmers. Rather than encouraging mothering claims local leaders should call for farmers’ training on cash-flow management to help these farmers to become autonomous and increasingly to the contribute Cashew Trust Fund so that new needs can be addressed (roads, infrastructures, finance, etc.). The intervention of the Mtwara District Council is equally interesting. After realizing a cost-benefit analysis of the cashew production and marketing that showed that farmers were getting little profit compared to processors Mtwara District Council started promoting processing units (capacity of 200 Kg/day) with DADPs funds. Such initiative can contribute in improving farmers’ level of cash flow at the condition that farmers adopt a pro-active attitude and take the lead of the development of their sector with systematic investment in the production. The WRS introduced also offers an interesting potential. A task force has been created to improve the market intelligence in the sector and avoid definition of excessive indicative prices. It involves NMB (and other banks), the Cashew Board of Tanzania and the Warehouse Licensing Board. It is also aimed at helping farmers’ groups to get engaged into auctions by getting sufficient information about prices. Financial services As for most farmers, financial services are scarce for cashew producers. However, this situation is tempered by the intervention of primary cooperative societies that have been helping the farmers to timely mobilize contributions for the purchase of inputs and – more recently – by the introduction of the WRS aimed at allowing farmers to get access to higher prices (cf. seasonal fluctuations), encouraging them to put savings and allowing them to have financial resources timely to buy inputs (subsidized or not). In addition, NMB created a loan product called “Kilimo Loan” in 2010/11 and is now being piloted in cashew nut sub sector in Mtwara. It is aimed at creating a behavior of saving and investing. To be eligible, a farmer must open a “Kilimo Saving Account” with NMB. A borrower can obtain up to three times the amount of their savings, repayment should not take more than 40% of the production of the previous year (to avoid having farmers investing their whole income into a loan) and a borrower have to belong to a Primary Cooperative Society (PCS), and should get guarantees from fellow members of the PCS. Development of NMB’s pilot product (Kilimo Loan) is negatively affected and sometimes is not possible due to delayed payment and increasing prices of inputs. The objective of the pilot product is to work with 6 PCS in 2011/12 and then to scale out to other PCS. CRDB is

76
also present in Mtwara but is mostly working with Cooperative Unions. Table 28 below shows prices of cashew nut inputs when it has subsidy and when without subsidy.
Table 28: Prices of cashew nut input – with and without subsidy
Input Subsidized Full price (1) Not subsidized (2)
Sulfur powder 13,000 TZS/bag (25 Kg) 26,000 TZS/bag 30 to 50,000 TZS/bag
Bayfidan 13,500 TZS/litre 27,000 TZS/litre 30,000 TZS/litre
Karate 15,100 TZS/litre 30,200 TZS/litre 30,000 TZS/litre Source: Interviews and field data © MMA April 2012
(1) Official full price for subsidized inputs (2) Prices of non-subsidized inputs sold on the open market when there is no subsidized product
available
Timing of inputs In April-May, farmers must apply sulfur powder to protect cashew nut trees from powdery mildew. Inputs should be available in the production area as early as March. For the season 2011/12, subsidized inputs are not expected to arrive in time and the inputs sold privately usually also delay. Late arrival of subsidized inputs is due to delays in the tendering process, late payment of suppliers, which is caused by poor budget management. Delays in crop protection can result to total loss crop. Adequacy / quality Farmers complain that new products with lower quality are sometimes introduced by substitutes and that these products have – in some cases – proven to be harmful to their trees (Bayfidan replaced by Powershot, Defender, Mupafidan or Movil). However, it was not possible to ascertain if the products were harmful because they were not genuine, or because the farmers had not utilized them properly. Distribution There are several input suppliers in Mtwara (MoCrop, Mukpa, Export Trading, ByTrade, MRAITF). Mtwara Region Agricultural Input Trust Fund (MRAITF) is one of them. It was created in 1993 when the input supply function was being liberalized to take over the distribution of inputs. MRAITF deals in input trade and also offers extension services (advises to clients in collaboration with the public extension services). MRAITF sells inputs for almost all crops but inputs for cashew nuts (e.g. sulfur dust and dilution, insecticides, fungicides and herbicides) take a larger part of the inputs sold. The introduction of the tendering system diverted cooperatives from buying much at MRAITF because it has not been selected so sell subsidized inputs39. Large farmers buy at MRAITF as well as small farmers who need additional quantities of inputs. Government institutions, research centres, Foundations (Aga Khan), secondary schools and other input retailers also get supply at MRAITF. Normally, clients don’t put orders; they just come and get what they need (if it is available). The presence of primary cooperative societies (2 to 3 per ward) in the villages and their contribution in the ordering and input distribution process is a disincentive for the agro-dealers to extend their distribution network in the village. Successive input subsidy systems
39 The Secretary of the Trust Fund explained that in 2003 the Government asked agri-input dealers to provide
government-guaranteed loans to primary societies. But a large part of these loans has not been reimbursed
(2002/03) due to a drop in prices (confirmed by CBT statistics) and the government withdrew from its
guaranteeing engagement. This is – according to MRAITF Secretary (met on 02/04) the reason why the Trust
Fund has limited working capital and is unable to take part in tenders.

77
At the same time that private input suppliers were encouraged to launch a market led input supply system in the region (from 1994 to date), the Government went on supporting the sector through subsidies. Different systems have been tried over the years. In the late nineties, the Government guaranteed input loans by agro-dealers to ease the access to inputs by farmers (through primary cooperative societies). The system collapsed around 2002/04 due to a fall in prices that led farmers to deny reimbursing loans. Concomitantly the government failed to guarantee the mentioned loans. Later, the government subsidized wholesale prices and transportation of inputs but this system also failed to ease the small farmers’ access to inputs (that didn’t reach the targeted persons). Until 2010/11 the government has been subsidizing inputs through a system based on wholesale suppliers / private companies chosen through tenders, primary cooperative societies and district authorities. The subsidy was initially amounting 30% and was only applied to sulfur powder. After several years, the subsidy also included chemicals (fungicides, insecticides) and passed to 50% of the price of the inputs. Farmers were identifying their needs and collecting money corresponding to the part that they have to pay for the inputs through the Primary Cooperative Societies / AMCOS. The latter would then get an authorization from DALDO officer (to allow tracing the quantity and destination of the subsidized inputs), transfer of the money to the input suppliers and distribute the inputs to the farmers. DALDO’s office was sending a copy of that letter to the input supplier and one to the entity in charge of payment. The DALDO office was collecting information from farmers through the extension officers to check on the occurrence of diseases and pests, production and therefore on the need of inputs. Undefined number of corruptible primary cooperative societies’ leaders accepted bribes from input suppliers leave the inputs with the agro-dealers to be sold on the open market at full price instead of supplying them to farmers. Other inefficiencies were observed such as: creation of monopolies through tenders (one company for one package of inputs), delays in payments and insufficient budgeting or insufficient incomes to pay for the planned expenses. For the season 2011/12, the input subsidy system has been revised to try to avoid the inefficiencies and loopholes observed in the previous systems. As per the new system, there is still a tendering process but tenders are only awarded to the companies possessing certified financial statements showing that they are able to effectively supply inputs. If they win a tender, their contract entitles / obliges them to import specific quantities of inputs and send them to warehouses in Mtwara. Each company is limited to supply only one or two inputs (e.g. sulfur) as defined through the contract to avoid that they take undue advantage of their “quasi-monopolistic” positions. The Regional administration is in charge of this process and of the Cashew Input Fund (Mfuko wa Korosho) and the Cashew Board will remain only with the regulatory functions. Farmers will express needs for inputs and input fund will allocate subsidies to the different primary societies according to their past production. Farmers will be informed to contribute only within the limit of their past productions. They will be given a permit to get subsidized inputs according to the production of the previous year. Agro-dealers will be contracted to deliver inputs in the production areas. They will be given a commission according to the volume of inputs sent to a specific place. The Input Fund will organize and pay for the transportation of the inputs. The Village Executive Officers (VEO) will have to ascertain that the inputs reached the village (and to allow the agro-dealers to be paid for their service). By

78
doing so, the authorities expect that the costs for inputs will be kept under control, the inputs to effectively reach the farmers and hence, the utilization of the inputs improved. The current subsidies are funded through the Cashew nut Board of Tanzania with funds originated from farmer’s contribution, from an export levy and a contribution from the central budget. Table 29 below shows the contribution input subsidy fund.
Table 29: Sources of funds for the payment of inputs for cashew production
Year Farmer’ contribution
Subsidy Export Levy Total % of subsidy
2006/07 227,358,940 145,571,960 NA 372,930,900 39%
2007/08 339,910,274 182,705,874 NA 522,616,148 35%
2008/09 415,592,500 390,303,675 NA 805,896,175 48%
2009/10 345,454,575 318,303,675 NA 663,758,250 48%
2010/11 654,881,190 163,748,470 530784610 1,349,414,270 51%
Source: Mtwara District Council, 2012 NA: Non available
It appears that the export levy is contributing for a larger part than the Government in the subsidization of the inputs. For 2010/11, the stakeholders of the cashew sector (farmers, processors, etc.) paid almost 90% of the cost of the inputs in Mtwara Rural District (farmers’ direct contribution and export levy) but still, the little direct contribution of the government seems to lead the input attribution schedule and to be able to delay the process (tendering, payment, etc). This needs to be solved. It should also be verified if large traders haven’t implemented a strategy to get back this money on the sale of inputs and/or buying price of cashew on auctions (agreement to systematically depress the prices by 5%). Farmers are concerned about the fact that this will channel fewer subsidies to the farmers facing more problems. There are also worries about the implementation of the new input system as its resources come – in large proportion – from the export levies. However, a large part of the cashew produced has not yet been sold. It is difficult for the input companies to assess whether the Government will be able to respect its part of the agreement. Past experience feed the fear that the government may fail to respects its commitments. Some officials argue that the production of cashew increased in the last two years as a result of the subsidization of inputs. However, it is difficult to assess whether production increased due to the inputs or just because of a very favorable weather and favorable market price. Physical flows of inputs and flow of information Transportation by road to Mtwara is hectic and expensive. But the Mtwara port can receive big boats. Shipping companies say that their activity is more profitable in Mtwara than in Dar es Salaam because it is easier / faster to board. Local roads represent a constraint for the distribution of inputs. Transportation of a bag of sulfur (25 Kg) can amount 1,000 TZS for a distance of 190 Km equivalent to 20 cents per Kg/Km (in comparison the cost of transportation from Kibaigwa to Dar es Salaam is only 5 cents per Kg/Km = one quarter of this price in Mtwara region). Application Application of inputs has been evolving in the last years in large part as a result of research efforts. Naliendele Agricultural Research Institute is working on; (i) testing of agro-chemicals required for the protection of the crop (insects, fungi, weeds, etc.) and for the release

79
procedures of new molecules, (ii) selection and diffusion of new cashew varieties40 with increased production potential, resistance to pests and profitability, (iii) Identification and diffusion of improved agricultural practices based on the new varieties, chemicals and tools, within the framework of an “Integrated Cashew Management”, and (iv) Monitoring and evaluation of cashew plantations managed under the ICM. Planting new and improved seedlings is important because they are resistant to mildew. However, farmers have no knowledge about existing and new varieties of seedlings. New varieties are in place but farmers have not been sensitized. Also new chemicals have been introduced but farmers are not informed about how to handle and use them. Improved agricultural practices such as; pruning after harvest, weeding to avoid competition for water and soil nutrients and facilitate circulation in the plantation (while spraying, harvesting) and crop protection with insecticide, herbicides and fungicide are know but still, farmers need to understand their importance in a business oriented agriculture. Researchers are concerned that – if the link between research and extension is not strengthened – the outcomes of their efforts may not help farmers. Constraints, consequences and mitigation Farmers need to upgrade their skills so that they know to utilize the inputs and manage their farms in a sustainable / profitable way. Extension officers have limited skills to lead farmers on this track. In addition, effective application of inputs requires utilizing equipments (e.g. blowers, water pumps, means of transport to carry the inputs and water, etc.). Such equipments are scarce and expensive. In addition, usages of a number of inputs require the utilization of water. Water resources are very un-evenly distributed and water infrastructures are inadequate. It must be verified if the new financial products that banks are in the process of piloting are adapted to these needs and a close follow up is needed to see if they will be efficient, sufficient and timely. Dynamics and constraints of cashew nuts agro inputs are summarized in table 30 below.
40
Thanks to ARI Naliendele, Tanzania became the first country with elite clones of cashew able to produce after 7
– 8 years 20 Kg/tree and later 40 Kg per tree (if weeding is done timely and insecticide is sprayed when the tree is
flashing).

80
Table 30: Cashew nuts agro inputs dynamics and constraints
CASHEWNUTS SEEDS/SEEDLINGS FERTILISER AGRO CHEMICALS ACCESS Status
DADPs is the main catalyst Not used / subsidized
The Export Levy is the main catalyst
Contribution by the central budget is secondary
Main constraints
Limited number of private nurseries
Planting requires an additional investment that many cannot or don’t want to do.
Late delivery
Introduction of new types with insufficient training
Shortage of subsidized chemicals (artificially created?) while prices of products on free market are sky-rocketing
DISTRIBUTION Status
Insufficient private distribution system (high transportation cost)
Free market system under-developed due to the distortion by subsidized and government imposed systems
High level of inefficiencies in the subsidized and “institutional” system
Main constraints
Transportation costs of trees
Diffusion of bad varieties must be avoided but the system through which good varieties could be spread (trained private nurseries) is not sufficiently developed
Tenders give some importers quasi-monopoles but delivery is not up t the engagements and loopholes are suspected
APPLICATION Status
Important plantation dynamics in the past 5 years although they have been supported by public funds (DADPs mainly)
Use generalized
Necessary to allow good yields, good quality and financial return
Main constraints
Cost of a new plantation or the replacement of the previous one
Application costs also high (equivalent to the cost of the agro-chemicals)
Application requires water and equipments that are un-evenly available
CASHEWNUTS Impact of constraints
A large part of the trees in place is still of the Tendency to insufficiently apply treatments with negative impact on

81
CASHEWNUTS SEEDS/SEEDLINGS FERTILISER AGRO CHEMICALS varieties sensitive to diseases and requires more inputs / contributes to the spread of the diseases
cash-flows and investment capacity
Ongoing mitigation strategies
Public sector
Smart utilisation of DADPs although transition to the private sector still has to happen
Important efforts from ARI Naliendele and DALDOs
Private Sector
Installation of some private nurseries run commercially,
Civil Society
Public sector
Smart move to collect and use export levy to fund subsidies
Pro-activeness of the Regional Administration to improve the subsidy scheme
Private Sector
CropLife Tanzania, Importers, Local agro-dealers,
Civil Society
, CBT, Primary Cooperative Societies

82
3.6 Cases from Kenya and Malawi 3.6.1 Kenya Agro dealer support - Lessons learned from Kenya, Malawi and Uganda Kenya agricultural input supply system is predominantly private sector driven. There are few seed companies, agro chemicals and fertiliser importers and distributors. Between 2008 and 2012 Equity Bank implemented a US$2,500,000 project that aimed at facilitating access to credit by smallholder farmers, agro-dealers and others in Kenya's farm value chain.
Kenya subsidy programmes have targeted resource poor farmers only reaching at most 100,000 smallholder farmers in low rainfall areas. The country didn’t try to reach out to cover the whole country because it was not realistic to do so with limited resources. Other development initiatives including AGRA, KARI have implemented a number of input supply systems projects and research studies that have targeted and benefited resource poor farmers.
The Agro-dealer Development Programme (ADDP) was launched in 2006 by AGRA providing training, capital and credit towards the establishment of certified agro-dealers. ADDP aims to build and develop networks of certified agro-dealers in an effort to enhance quality, volume and range of seeds offered to farmers, especially improved crop varieties. Since then, it has gone through several important stages. Although the project is still ongoing, and some districts have yet to be covered, preliminary documented results indicate that agro-dealers based in high potential areas have benefited more than targeted group (those in low rainfall areas).
In the recent past, the Rockefeller Foundation41 supported three institutions to develop agricultural input supply pipelines in rural Kenya, Malawi, and Uganda with an emphasis on three key factors: (a) affordability; (b) accessibility; and (c) incentives. Key lessons include: 1. Development of rural agro dealers is critical for accelerating smallholders’ access to
quality agricultural inputs in Africa. 2. There is a strong positive correlation between availability of credit and the volume of
trade in fertilizers and other agricultural inputs in rural areas. 3. Distribution/sale of appropriate small packs of agricultural inputs increases their
affordability, safety, and quality. Specific lessons learned from Kenya, Malawi and Uganda include: (i) The development of rural agro dealers is critical for accelerating the access of the
rural poor to quality agricultural inputs in Africa: Their development significantly reduces search costs faced by farmers; making much needed production inputs available in rural areas at the right time and in appropriate volumes, sizes, and affordable prices. A new form of private sector driven extension system is emerging in these countries as the major agricultural input supply companies are increasingly conducting commercial demonstrations of new technologies in rural areas with rural agro dealers.
(ii) There is a strong positive correlation between availability of credit and the volume of
trade in fertilizers and other agricultural inputs in rural areas: The use of credit
41
The program name is “Developing rural agricultural input supply systems for farmers in Africa (Malawi, Kenya, and Uganda)”. The projects were implemented by the Citizens Network for Foreign Affairs (CNFA)/Agricultural Market Development Trust (AGMARK) for work in Kenya; and AT-Uganda, for work in Uganda; and CNFA/RAISE project in Malawi. http://www.worldbank.org/html/extdr/fertilizeruse/documentspdf/RockefellerAgroDealerSupport.pdf

83
guarantees in Kenya, Malawi, and Uganda is showing impressive results. It is helping to relax the high capital constraints faced by rural agro dealers, allowing them to significantly expand the range and volume of fertilizers and other inputs supplied to rural areas. The experience with the credit guarantees in Malawi shows that every dollar of credit guarantee provided to the agricultural input supply companies generated sixteen dollars worth of supply of fertilizers and hybrid maize seeds from the companies into rural areas -- a leveraging ratio of 1:16. Efforts are needed now to scale-up training and establishment of rural agro dealers across sub-Saharan Africa. Governments could consider the establishment of national agricultural input credit guarantee facilities to be implemented by commercial banks to link rural agro dealers to agricultural input manufacturers, importers, and suppliers, and accelerate the access of the rural poor to productivity enhancing inputs.
(iii) To improve affordability of agricultural inputs, it is important that suppliers of
agricultural inputs be encouraged to package their products in smaller sizes that are affordable to the rural poor: This helps improve effective demand. Agro-dealers are already selling seeds and fertilizers in small affordable sizes to the rural poor. Although the possibility for adulteration exists when agro dealers try to sell unpackaged and re-bagged fertilizers, such cases are becoming increasingly less likely as the government regulatory agencies become closely involved in quality control, training, and certification of agro dealers (see proposed policy advocacy brief No 2 in chapter six below). However, if agricultural input supply companies higher up in the supply chain can develop appropriate small packs for the poor, it will go a long way to facilitate affordability, safety, and quality of agricultural inputs.
(iv) Although these rural agro dealers are becoming important sources of agricultural
inputs in rural areas, government subsidy programs continue to create uncertainties capable of undermining their operations: For example in Malawi, the country’s recent program offering large quantities of subsidized fertilizer distributed only through government channels (ADMARK) negatively affected the operations of the rural agro dealers, with many going out of business in a single season due to displaced demand. Efforts to promote subsidies of fertilizers for farmers should be done in ways that do not distort or displace these emerging rural input markets. To ensure this, fertilizer subsidies could be provided to poor and vulnerable households in the form of vouchers. If the vouchers are specified as redeemable from certified rural agro dealers, then such “smart fertilizer subsidies” could be used to further develop, rather than undermine, rural agricultural input markets that serve the poor.
3.6.2 Malawi Agriculture sector of Malawi and the strategic position of maize The country has an area of 118,000 sq km (about 12% of Tanzania) bordering Tanzania and Zambia to the North, Tanzania and Mozambique to the East and Zambia to the West. The 2008 Population and Housing Census put the population at 13,066,320 growing at 2.8% per annum hence the population in 2011 was estimated at 14,194,910. Agriculture in Malawi accounts for 33% (2010) of the GDP, it generates 84% of the foreign exchange largely from export of tobacco, sugar and tea. Food crops are dominated by maize; others are cassava, potato, paddy, wheat and sorghum. Malawi agriculture sector is visibly divided into two parts, the estate (commercial) agriculture dominated by tobacco, sugar and tea on one hand and on the other, subsistence smallholder agriculture mainly engaged in food production. The estate/commercial sub-

84
sector had experienced significant growth over time, for example between 1964 and 1977 this sub sector maintained an annual growth that averaged at 17% per annum as against a 3% for subsistence sub-sector. Challenges facing agriculture include42 i) Low productivity; ii) Nature of farming system and adverse climatic conditions; iii) Ever declining land-holding sizes due to population growth and degradation; iv) Erosion of agriculture development services (especially extension services); and v) Limited value addition to agricultural produce. Due to the weight of subsistence production, on the overall agriculture GDP lagged behind other sectors of the economy except for the period between 1995 and 1999 when there was a spike in growth due to introduction and popularization of potatoes as table 26 below shows.
Table 31: Malawi - Agriculture and GDP growth
Indicator 1970-79 1980-84 1985-89 1990-94 1995-99 2000-05 2006-09
GDP 5.9 1 3.03 0.61 6.4 1.55 7.28 Agricultural GDP
5.35 0.36 1.28 2.15 15.06 2.16 3.63
Source: Malawi Agricultural Sector Wide Approach Programme citing Chirwa et al; 2006 - 2009 Updated using data from Annual Economic reports, IMF, Resakss
It can be understood why Malawi is more compelled to prioritize and invest in maize subsidy programmes than Tanzania because the maize is more correlated to food security in Malawi than it is in Tanzania. In 1998 the country initiated a subsidy Project that issued to 2.8 million farmers smaller packs of fertilizers and seeds to address the food crisis facing the country at the time. The subsidy managed to increase food supply up to 62% above the 20-year average43. Figure 8 below shows a comparison of source of calories between Malawi and Tanzania.
Figure 8: A Comparison of Sources of Calories between Tanzania and Malawi.
Around 2001-2003 the country faced another food crisis, which some analysts indicate were not caused by weather changes but were rather caused by socio-economic structural factors hence were not transitory44. Commenting on the situation, Lawrence Rubey (2003) noted that
42
According to Malawi Agriculture Sector Wide Approach 2011-2015 document. 43
Colin Poulton, Jonathan Kydd, Andrew Dorward. 2006. Increasing Fertilizer Use in Africa: What Have We Learned? Agriculture and Rural Development Discussion Paper 25.WB 44
Rubey [20030 attributed the food crisis to the impact of HIV/AIDS on household productive capacity, the ripple
effect of the fall in income from tobacco by 50%, decline in off-farm income generating opportunities and
apparent sharp rise in price signaling shortages

85
“... the Malawi food crisis is a continuing, structural problem, not a transitory event caused by unusual weather or corrupt management of the national grain reserve. Thus, without efforts to attack the structural causes of the decline in rural purchasing power, food crises will be a recurrent phenomenon in Malawi”.
Figure 9 illustrates how maize production in Malawi is not strongly related to rainfall; unlike in Tanzania where the correlation between rainfall and output is very strong in Malawi it is not that much.
The Farm Input Subsidy Programme (FISP) The philosophy behind maize subsidy in Malawi hinges on the fact that maize is a critical food security factor in the country and growth models indicate also that maize has significant impact on poverty level. Malawi ASWap document notes that
“There is, therefore, a critical link between food security, and maize inputs availability and the relevance of a policy focus on these key areas in addressing poverty in Malawi. The underlying fact is that unless Malawi farmers have access to improved inputs for both food production and diversification, unacceptably large numbers of the poor will be exposed to hunger. It is in recognition of this fact that the Malawi Government has added a significant emphasis to investment in agriculture as a prerequisite for economic growth and resulted in the successful implementation of the fertilizer subsidy programme FISP”
In 2004/05 Malawi faced serious food shortage, which left about a third of the population (more than 4 million) facing famine, this prompted the Government to look for longer-term solutions to national food insecurity. In 2005 the Government re-introduced input subsidy, in response to the fact noted by Rubey broadened the subsidy programme. The Farm Inputs Subsidy Programme (FSIP) targeted between 1.6-2.0 million farmers who are “resource poor Malawians” and subsidized inputs at about 90%. The Programme budget ran at $120million equivalent to 75% of the Ministry’s budget. The subsidy programme had been responsible for an increase in maize production of between 700,000 to 1,000,000mt. By 2011/12 FISP had entered its 6th year (started in 2005/06) and had explicitly targeted maize fertilisers and seeds, legume seeds and maize storage pesticides. Farmers eligible for FISP are “resource poor” Malawians who are resident in respective villages, who have cultivated the land in the previous season. The fact that that the Government subsidizes more than 90% of the input costs it is very attractive to corruption hence a need for water tight targeting and delivery input mechanism are necessary to ensure the objective of the Programme is met. The criteria are a resource poor:-
Elderly household heads;
HIV positive household head with proof of status;
Figure 9: Rainfall and maize production in Malawi

86
Female headed household head;
Child headed household head;
Orphan headed household head;
Physically challenged household head;
Household head looking after elderly and physically challenged.
In 2010/11 the subsidy targeted 1.6 million farmers out of 3.5 million farmers i.e. about 46%, the identification is done through a village Open Forum after a series of sensitization sessions. Attending at the forum farmers, traditional heads, representatives of Government institutions e.g. school teachers, churches, mosques, non-Government Organizations, police, anti-corruption bureau, etc. The same forum is used later in the handing over of the coupons to target farmers. The degree of openness is intended to safeguard the interests of the targeted resource poor farmers. The Subsidy Package The FISP subsidy package in Malawi is more diversified because the national food security objective has been extended beyond calories to include nutrition. The pack contains 50Kg of basal (usually NPK) and 50Kgs of top dressing fertilisers, 200gms of maize storage Actellic pesticide, maize seeds and legumes as the table 32 below indicates. Table 32: Types of Subsidized Inputs and Degree of Government Subsidy
Source: Interviews at MAIWD © MMA April 2012
The Government invests an average of Malawian Kwacha (MK) 17,700 per household would translate to a total direct investment of MK 28,320 or USD 168mln for 1.6 million farmers and MK 35,400mln or about USD 210.7mln for 2.0million farmers. As it can be noted in the above, simple mean of the degree of subsidy is at 91%, in comparison as Table 33 below shows, the subsidy in Tanzania is at around 30%.
Table 33: Comparison of Level of Subsidy between Malawi and Tanzania.
Input
Government Subsidy
Malawi Tanzania
Basal fertilizer (Urea) 92.3% 29.2%
Top dress (NPK Malawi, DAP- Tanzania) 93.8% 35.0%
Actellic 75.0% -
Maize seeds 94.6% 50.0%
Input Type Descriptions Market Price during 2010/11
Farmer Contribution
Government Subsidy
Farmer
Urea 50Kgs 6,500 500 92.3% 7.7%
NPK 50Kgs 8,000 500 93.8% 6.3%
Actellic 200gms 400 100 75.0% 25.0%
Maize seeds
7.5 Kgs for open pollinated varieties and 5Kgs for Hybrid seeds 1,850 100 94.6% 5.4%
Legume seeds
2Kgs of phaseolus beans, groundnuts, pigeon peas and soya.
950 - 100.0% 0.0%
Total 17,700 1,200 91.14% 6.8%

87
Legume seeds 100.0% -
Simple mean 91.1% 38.1% Source: Interviews at MAIWD in Malawi © MMA April 2012
Going by the figures from secondary sources, Tanzania invested USD 75 million for increment of 500,000 mt while Malawi invested USD 120 million for 700,000 mt to 1,000,000 mt, meaning that a metric ton cost Malawi between USD 120 - 171 while in Tanzania it cost USD150. Lack of candid data on the number of farmers reached and incremental outputs achieved renders the comparison of the effectiveness of investment less reliable. Institutional and Stakeholder Arrangement in the Management of the FISP FISP has an elaborate institutional and stakeholder arrangement that to a large extent equals that of Tanzania, exceptions are noted in the mode of procurement of fertilisers, roles in stocking and distribution to final user as well as the process of identification target beneficiaries at village level. The stakeholders involved and their roles are outlined in the table 34 below.
Table 34: Roles of Stakeholders in the Operationalisation of FISP
Stakeholder Roles
MoAIWD (Logistics Unit)
Policy and technical guideline
Communication strategy
Packing coupons according respective areas for delivery and approval for redeeming
Monitoring and evaluation
District Commissioners Ensure adequate security and police during identification, transport, keeping and handing over of coupons
Chair district FISP meetings
Monitor and address irregularities of the Programme
District Agriculture Development Officers
Establish teams to supervise sensitization, beneficiary identification, pre- registration and coupon distribution
Safekeeping and recording of coupons
Ensuring proper utilization of inputs
Monitoring and reporting on Programme performance
Agricultural Extension Development Coordinator (AEDC)
Publicize FISP
Supervise identification and distribution coupons to beneficiaries
Ensure proper utilization of inputs
Monitoring and reporting
Agricultural Extension Development Officer (AEDO)
Sensitizing farmers on FISP
Mobilization of the community for beneficiary identification, pre-registration screening and coupon distribution including ensuring one beneficiary is supported per household;
Facilitate the beneficiary identification process and pre-registration;
Village/Area Development Committee (VDC/ADC)
Members include village development committee members, community policing members and area stakeholders’ panels. Their roles include: -
Facilitation of identification of beneficiaries and pre-

88
registration
Discourage sale of coupons by beneficiaries within the community
Publicize markets for purchase of inputs
VDC/ADC ADMARC and SFFRFM markets
Monitor the sale of inputs at the designated selling points
Check and report irregularities/fraud at selling points
Monitoring stocks at retail outlets
Traditional Authorities and Village Headmen
Support farmer sensitization, identification and registration
Check and report irregularities
Monitor implementation of FISP
Agriculture Development Division
Monitor input availability in markets and movements between SFFRFM and ADMARC markets in the District
Ensuring transporters deliver inputs to designated points
Ensure timely delivery of inputs
Civic Education, political, faith groups leaders (pastors, sheikhs, bishops, etc.
Support sensitization and identification of beneficiaries
Discourage sale of coupons by beneficiaries
Monitor implementation of FISP
Source: Interviews at MAIWD in Malawi, © MMA April 2012
Quality control is done by taking samples at border posts of Mwanza and Dedza on part of Mozambique and Songwe on the side of Tanzania. Where the fertiliser stocks to be delivered are from internal depots, Ministry officials conduct inspection of the fertiliser at the suppliers’ warehouse. According to Ministry officials there had been no serious incidence of poor quality of fertilisers because of close monitoring and the fact that stakes are very high for the supplying company in case of poor quality inputs. The FISP has a comprehensive sensitization arrangement for stakeholders at different levels and beneficiaries of the Programme. The sensitization covers issues around objectives of FISP, contents of the input package, targeting of beneficiaries and coupon distribution and redeeming system. The sensitization emphasizes the Government’s efforts to improve food security. Access to Seeds and Chemicals Farmers access seeds under the FSIP primarily from private companies namely SeedCo, Monsanto, Pannar Seed and Demetar. The companies are members of the Seed Trader Association of Malawi (STAM) and have to ensure that seeds are available at village level. Farmers have a choice as to which type of seeds to purchase, the role of the Government is to advice farmers on the suitability of seeds based on areas. Using laboratories at agriculture research institutes where seed germination rate, viability and purity are tested; the Government checks the quality of seeds through its Department of Agriculture Research Services – Seed Unit, Actellic is procured by the Government and distributed along the fertiliser distribution channel. Before the chemicals are purchased, the Malawi Pesticides Control Body (PCB), which is under the Department of Agriculture Research Services of the Ministry of Agriculture do quality test. Access of Fertilisers
The success of Malawi input subsidy Programme has its root in the adage that “necessity is the mother of invention”, the country had experienced incessant and growing food

89
crises whilst it has limited resources to finance imports. Over reliance on maize as a national food security lifeline compelled the country to be creative in addressing food crises. Consequent to the above, food security became the top most agenda, this is noted in terms of allocation of both financial and manpower resources.
The FISP guideline has set time for delivery of fertilisers into the warehouses to be before the onset of rainfall around October, this allows adequate time for distribution to rural outlets. Given the fact that it is the Government that purchases the fertiliser through its budget it is able to manage the process to ensure timely delivery of inputs.
De-politicization of the subsidy programme is another important success factor on part of the FISP that has helped the country make successive surplus for 5 running years. The input distribution system has upheld transparency and participation. The spirit of openness demonstrated in Malawi is not strongly evident in villages surveyed in Tanzania. It has been cited in some places that wards led by opposition were undermined in subsidy programme.
Distribution of Fertilizers
The role of public sector in the distribution of fertilisers in Malawi is “decisive”. Two parastatals i.e. the Agriculture Development Marketing and Market Corporation (ADMARC) and Smallholder Farmers Fertiliser Revolving Fund of Malawi (SFFRFM) have a network of warehouses that stock both farm inputs and outputs. ADMARC has 912 outlets while SFFRFM has 60 making a total of 972 inputs outlets in the Government hands. It is strongly believed that the investment in marketing and storage facilities coupled with close supervision have helped to improve efficiency in the distribution of inputs in Malawi. Tanzania on the other hand has liberalized most of its infrastructure, Tanzania Fertiliser Company is under-capitalised and lacks the extensive network of outlets that affords Malawian counterparts.
There is therefore a need for a balance between the scope and role of the private sector and public sector in the delivery of inputs. The message coming out of Malawi is that there are critical aspects of welfare that need the government. It should not be left to the market to address the national food security. The central and local Governments should be involved, especially on coordinating logistics, quality and distribution. While it is debatable whether government machinery is more efficient and effective in delivering inputs than the private sector, there could be more fundamental issues beyond the PPP relationships. It is about status and effectiveness of governance systems. Despite the fact that an input coupon in Malawi is worth about three times that of a farmer in Tanzania, Malawi has managed to minimize leakages.
Application of Inputs
Certainly Malawi has focused on limited set of commodities than Tanzania, which helps the system to develop knowledge and learning that helps it to improve itself. Focus on fewer commodities (maize and legumes only) may have helped the intervention to be more focused, as opposed to a number of commodities in the case of Tanzania.
Marketing of Outputs
The National Food Reserve Agency (NFRA) is also active in stabilising maize supply through absorbing surpluses, which sometimes goes up to 35% of the national demand. Quite significant is that there is a constellation of strategic maize storage facilities in the country with hubs located at Lilongwe for the central Malawi, Blantyre for Southern Region and Mzuzu for Northern Zone. Apart from NFRA silos that could have more than 300,000mt storage capacity, ADMARC is estimated to have a combined storage capacity of 270,000mt. NFRA Malawi has been very instrumental in stabilizing supply of maize in

90
the domestic market and exports to neighboring countries including Zimbabwe and Lesotho. It is important therefore to understand that for an input programme to work sustainably well it has to be linked to a functioning market system.
Challenges Facing FISP FISP major challenge has been sustainability of funding of the Programme, FISP implementation costs 50% of the Ministry of Agriculture, Irrigation and Water Development (MAIWD) budget. The annual bill of USD 120million is a tall order for a country whose foreign exchange earning base is limited to tobacco, sugar and tea whose combined exports between 2006 and 2009 average at a meager USD 101million. Lately the country had been facing shortage of foreign exchange. Other challenges facing FISP include incidences of leakages in fertilizer coupons that has called for an elaborate control mechanism. Concluding observation on lessons from Malawi’s FISP As a result of FISP maize output has increased from around 0.8 to 2.0 metric tons per hectare between 2004/05 and 2009/10 and tobacco production has increased at an average annual growth of 13.1%. And as a result, there had been a decline in poverty incidence from 52 to 39 percent. Much of this is attributed to FISP45. Food and Agriculture Organization (FAO) estimated that only 28% of the population (i.e. 3.9 million Malawians) suffers from hunger and undernourishment.
3.6.3 Summary of lessons from Kenya and Malawi In Kenya, input supply system is private sector driven and integrated in the Kenya Country Vision 2030 which includes specific strategies to improve input supply system and from the strategy there are clear specific flagship projects on agro-inputs such as fertilizer cost reduction in investment, seed improvement initiatives and livestock breeding programs. Already, input costs and increased access to market is being achieved by 2012 through bulk procurement and through domestic blending and production. Unfortunately, Tanzania Development Vision 2025 (TDV2025) and Kilimo Kwanza (Pillar 7) do not have such clear flagship projects and after more than ten years of the vision Tanzania still doesn’t realize comparable achievements. The farm subsidy system in (FISP) Malawi includes a strong governance system that is driven by very inclusive and transparent multi-stakeholder pool of actors (civil society, local and regional authorities) for beneficiaries’ identification and support. In Tanzania, poor governance and lack of transparency negatively affected the performance of the scheme. It is advised that Tanzania should seriously consider ways of improving governance and transparency in the input subsidy schemes. Summary of overview of subsidy programmes in Tanzania, Kenya and Malawi is depicted in table 35 below.
45
Richard Musa and Paul Kauw. 2011. Poverty in Malawi: Current status and knowledge gaps: IFPRI Policy Note 9
/ December 2011

91
Table 35: Overview of subsidy programmes in Tanzania, Kenya and Malawi
Issue Tanzania Kenya Malawi
Inputs (Subsidy) Focus Food security – maize, paddy and livestock; and export competitiveness - cashew, cotton, coffee (!)
Food security – maize and sorghum Food Security - maize and legumes; Export competitiveness –cotton.
Key Players Private sector with limited public sector, non-coherent strategy.
Private sector – well organised and pro-active. Stronger public sector, guided by national food security agenda.
Distribution in the Districts Approved agro-dealers (5-60) per district Kenya National Federation of Agricultural Producers KENFAP (equiv. of MVIWATA)
Agriculture Development and Marketing Corporation (ADMARC) and Smallholder Farmers Fertiliser Revolving Fund of Malawi (SFFRFM)
Agro-dealers development Programmes
CNFA/TAGMARK trained >3,000 agro-dealers
ADDP, KASP, AGMARK, CNFA/AGMARK trained >.2,000 agro-dealers
CNFA/RUMARK trained more than > 300? agro-dealers
Input subsidy target households (maize) as percent of farmers
1.5 – 2.0 million farmers. Approx. 18.75% of potential beneficiaries
Graduated 80,000 – 100,000 farmers: Subsidy to resource poor farmers - 100%; to resource poor 70 – 80%. Approx. 2 – 3% of population.
Resource poor Malawians. 1.6 – 2.0 million farmers. Approx. 40-50% of the farmers
Degree of Subsidy by % of costs
≈ 30%
·100% for resource poor, ·70 – 80% to less resource poor
>90%
National Key Strengths ·Less vulnerable to food shortages, ·Ability to mobilize subsidy resources both domestic and foreign
·Participation of farmers network in the schemes ·Pro-active and innovative private sector and agriculture value chains
·High government commitment to agriculture development (ref. to resource committed).
Key Weaknesses ·Weak governance of the system ·Limited in scope to make national impact ·Sustainability (funding) is an issue
Source: Developed by study team © MMA May 2012

92
4.0 SYNTHESIS OF KEY FINDINGS Access Inputs access is influenced by infrastructure
Productive areas that are more accessible (with good road infrastructure, good feed regime for cattle) tend to attract bigger volumes of business and services and have a more active private sector whereas areas, which are not easily accessible (poor roads, rely heavily on wet fodder for cattle feed) tend to have less volume of business, less private sector activities and farmers in such places have difficulty in accessing inputs.
Few subsidies in agro inputs – mixed results – success and failure
Few input subsidy schemes are ongoing in Tanzania through research funds; TaCRI – wide coverage, results very positive. Coffee Board plans Input Subsidy Fund soon. Cashew - subsidy in place, fair results but needs improvement. Subsidy under DADPs – effective but very limited coverage. Livestock subsidy – limited awareness by farmers on the subsidy, need for awareness raising.
“Smart” subsidy can aim to improve access and application
NAIVS increased the number of agro dealers and the availability of inputs in some places. But generally, it has played a limited role to enhancing affordability and usage of inputs.
Value chain financing – the missing middle
SACCOS e.g. Umbwe Ndoo in Moshi, AMCOS in Mbinga and NGOs e.g. KDA in Karatu have demonstrated ability to sustainably improve access to rural credit. However, these initiatives face the problem of limited capital to lend out due to weak linkages to financiers e.g. banks.
Distribution Weak distribution system and porous enough to allow influx of counterfeits
Inputs reach farmers mainly through agro dealers, however, they face three main problems; (i) the financial constraints (ii) inadequate knowledge concerning how to apply inputs they sell (iii) Unscrupulous traders are distributing counterfeit/fake inputs.
This study calls for review of accreditation process of agro dealers, looking at their financial capacities and technical knowledge
Limited promotion of agro dealers’ networks in delivery of extension services
Agro dealers are instrumental for enhancing availability of inputs in the villages. They can also be instrumental in delivering extension service, hence improve outreach and good usage of inputs through effective PPP.
Application Low adoption rate of improved inputs and poor agronomic practices
Some inputs (e.g. improved seeds for maize) are used more than others (e.g. fertilizers and chemicals). Majority of farmers cannot use inputs/apply correctly. Farmers of high value crops like vegetables, which have good output markets, can afford inputs but with limited knowledge to correctly apply inputs, they have been abusing and/or wastefully using inputs.
One size fits all approach
Tanzania is quite diverse in terms of soils and agro ecology. A blanket approach, used in NAIVS of supplying mainly Phosphate and Urea does not address the diversity of soil nutrients.

93
Inputs market is interrelated to outputs market
Crops with good and stable output markets (e.g. high return crops like vegetables) enable farmers to afford and hence apply more improved inputs. Maize, on the other hand has unpredictable and distorted market as a result farmers barely break-even actually most operate below break-even.
Lessons from Kenya and Malawi Tanzania still has a lot on paper
In Kenya, input supply system is private sector driven and integrated in the Kenya Country Vision 2030, which includes specific strategies and flagship projects geared at improving input supply systems. Unfortunately, Tanzania Development Vision 2025 (since 2000) and Kilimo Kwanza (since 2009) have limited clear flagship projects.
Apply “smart subsidy and improve governance and transparency in implementation
FISP in Malawi includes a strong governance system that is driven by very inclusive and transparent multi-stakeholders process for beneficiaries’ identification and support. In Tanzania, poor governance and lack of transparency negatively affected the performance of the scheme. It is advised that Tanzania should seriously consider ways of improving governance and transparency in the input subsidy schemes.
Regional integration should bring synergies
EAC partner states have strong mistrust among each other (TBS/KEBS; TPRI/KEPHIS, etc) that hinders free movement of certified agro inputs in the region. There is need to overcome causes of mistrust and address the bottlenecks to harmonization squarely.
Tanzania should benefit from other Africa initiatives such as AU Abuja Declaration that advocated for enhance fertiliser utilisation from average of 8kg/ha to 50kg/ha by 2015 and the newly initiated Africa Fertilizer Agribusiness Partnership (AFAP) – a joint project of NEPAD, AGRA, IFDC, AfDB and AGMARK fostering private sector investment and develop partnerships to build sustainable markets providing smallholder farmers with AFFORDABLE fertilizer.

94
5.0 RECOMMENDATIONS 5.1 General recommendations
a. The long-term future and sustainability of funding subsidy input programs and the possibility of funding such programs of crowding out other private sector led investments in the agriculture should be taken note of. Although Malawi has produced an excellent case of successfully implementing and input program, the financial capacity of the country to sustain the program is questionable.
b. Due to limited knowledge of smallholder farmers, they may not use inputs correctly and cost effectively. Poor mechanism of applying chemicals puts at risk the health of a farmer and the environment. It is recommended to promote extension services that respond to this challenge in terms of training (agronomy, management, marketing) and controls in an efficient way. Innovative PPP extension business models have been tested and should be advocated for. Tools such as demonstration plots, FFS, contract-farming schemes should be promoted considering their good results.
c. Agro input dealers are instrumental for enhancing availability of inputs in the villages and potentially to enhance extension service provision, hence good usage of inputs. However, they have been blamed for selling counterfeit products and suffer from lack of financial muscle and technical knowledge necessary to deliver services. Therefore, accrediting and training them more is necessary. However, many rural-based agro-dealers are seasonal, they close their shops when the season ends.
d. Value Chain financing options for agro-input systems in Tanzania is very weak. Although few systems have been tried in an ad-hoc manner (SACCOS, Banks, NGOs, Government budget allocations, etc.) there is still need for coming up with innovative financial mechanisms including crop financing to attract more financial and non-financial institutions. In addition, a major constraint to the utilization of financial products is the absence of embedded risk management mechanisms and it is therefore strongly recommended that such mechanisms are systematically included in any financial product for agriculture.
e. Inputs alone without proper package of critical services (mechanization, information systems and output marketing, processing, weather forecasting, etc.) will not turn around the output of agricultural investments in agro-inputs to create a long-term, developmental perspective. It is therefore recommended that agricultural strategies should include these additional services within a value chain and geographical framework and with a long-term perspective looking out to make the whole inputs system more sustainable (sourcing, procurement, distribution, financing, etc). Therefore, ACT must work with policy makers and development partners to implement interventions aimed at addressing the underlying policy and structural problems that undermine incentives for farmers to use inputs and for firms to supply inputs.
f. According to lessons learned and good practices guidelines for encouraging input use in African Agriculture, one of the guiding principles for public intervention to encourage input use is for public policies to pursue regional integration to help in two ways: (i) By increasing market size it has a possibility to attain higher prices and demand
for commodities. Bigger markets are likely to be less volatile. (ii) EAC Countries should seek regional integration and harmonization of policies on
inputs and trade in order to reap from economies of size and scope. Integration

95
of policies and regulations will reduce procedures and improve business environment.
5.2 Recommended specific interventions Access, distribution and application can be attained if other concerns mentioned above are addressed. In other words, a myriad of other interventions (at broader levels) are required. However, specific recommendations to enhance areas of focus in this study are as below.
1. ACCESS Improve tailor made rural financing for agricultural value chains by channeling finance through farmer organizations or through strategic intermediate private sector that will enable farmers actually access funds can improve farmer’s affordability of inputs. The case of Agriculture Input Trust Fund lending to Kilimanjaro Cooperative Bank Limited (KCBL) and KCBL lending to SACCOS has proved to be successful, sustainable and is worth learning from. Also CRDB’s lending through SACCOS, especially in Kilimanjaro region and particularly Moshi has worked well and is an interesting case worth learning from. Some upcoming impact funds are financing strategic companies involved in contract farming to be able to buy in time or offer inputs to outgrowers.
2. DISTRIBUTION Distribution can be addressed by improving infrastructure for transporting and handling of inputs and increasing access to finance, especially for the agro dealers and distributors. Ensuring that agro dealers and distributors deliver quality and genuine inputs is another intervention point. Improving infrastructure, enhancing access to finance and instituting an accreditation system for agro dealers are recommended
3. APPLICATION Using demonstration plots and involving agro dealers in running extension plots have proven to be an effective approach to enhance access, distribution and correct application of inputs. A private sector led extension is recommended to increase application of inputs. Apparently two issues divide the private sector and the government, one in the scope of the intervention where private sector is usually available for a very limited period of time, any loss in business warrants closure of services. The second issue is “buying of farmers”, many Projects that are private sector based court farmers with allowances, meals, etc.to meet their project/business goals hence the “allowance syndrome”. The conflicting approaches are among the things that the PPP has to resolve.
96
6.0 POLICY BRIEFS 6.1 Background The government of Tanzania has invested considerable resources since the early-1970s to promote the use of agro inputs by smallholder farmers. The justification for these investments was and continues to be to achieve both national agricultural development and food security objectives. Government established a parastatal corporation, the Tanzania Fertilizer Company, to manage fertilizer procurement, distribution, and, after building a fertilizer factory in Tanga (now defunct), production was done in Tanga (IFPRI, 2011). The government, working with the Tanzania Fertilizer Company and government-managed crop marketing institutions, implemented various fertilizer provision schemes through which fertilizer was provided to farmers at sharply subsidized prices and by 2006 subsidy was extended to cover seeds as well. In recent past, subsidy has been extended to agro chemicals as well. Consumption levels of fertiliser nationally increased from about 10,000 MT annually in the late-1960s to 30,000 MT in the late-1970s to 45,000 MT in the late-1980s (FAO 2011). As part of broader efforts to reduce the scope of government in the economy and promote private sector investment, the Tanzanian government gradually withdrew from its monopoly position and liberalized input markets. Several private firms quickly entered the market, importing stocks from international fertilizer manufacturers and selling from their wholesale depots in Dar es Salaam or through their own up-country depots. Some developed their own retail networks. Several of these early entrants remained important importers and wholesalers of fertilizer to date. Notably, the Tanzania Fertilizer Company, still government owned, has stayed in business in this competitive market environment. Following the opening of input markets to the private sector, the government did not strongly intervene in fertilizer supply for several years, and by 1998 there were 13 fertiliser importers. The use of agro inputs fell considerably in the 1990s and therefore, starting in 2003, the government developed a program to offer subsidies to input suppliers on the transport costs that they faced, plus some subsidy on part of the fertilizer cost (Msolla & Masagasi 2010). As this was done to ensure that the prices farmers paid for their fertilizer was reduced, price enforcement mechanisms were established for the subsidized fertilizer. By 2006/2007 the government introduced the subsidy on seeds as well. The transport subsidy program ran through 2007, but generally was found to be inefficient with many farmers not having access to the subsidized fertilizer. Many agro dealers not having sufficient financial resources to acquire an inventory of subsidized fertilizer or, if they had fertilizer, possessing little information to guide farmers on how to make profitable and productive use of the subsidized fertilizer they offered. There were delays, corruption practices and other bureaucratic bottlenecks occurring (World Bank 2009) therefore, in 2008, the government phased out its program to subsidize transportation costs for fertilizer for private input suppliers, concluding that it was not cost-effective and failed to reach a large number of farmers or improve their access to fertilizer. Instead, the government introduced the National Agriculture Inputs Voucher Scheme (NAIVS) initiative that uses vouchers to transfer resources directly to farmers, aiming at increasing their purchasing power, stimulating the development of input supply chains, and fostering competition among input suppliers and agro-dealers. The NAIVS approach was piloted in two districts for one season and thereafter scaled up to 53 districts in the high potential zones for maize and rice production in 2008/09. By 2009/2010 1,500,000 farmers from 61 districts in 20 regions benefited and the value of vouchers distributed was equivalent to 150,000MT of fertiliser, 12,500MT of maize hybrid,

97
2,200MT of maize OPV and 450MT of rice seeds. Number of beneficiaries increased to 2,000,000 in 2010/2011 and 200,000MT of fertiliser and 20,000MT of seeds (maize and paddy) were distributed. This season 2011/2012 the target is to reach 1,800,000 farmers and to distribute 180,000MT of fertiliser and about 18,000MT of seeds (MAFC, 2011). As part of this NAIVS, the government deliberately worked with CNFA/AGMARK, AGRA, ACT, and the Finance Sector Deepening Trust (FSDT) to strengthen local agro-dealer networks through training and credit guarantees in an effort to promote and strengthen private sector participation in agricultural input markets. The Government concluded a Memorandum of Understanding with the National Microfinance Bank (NMB) for the redemption of NAIVS vouchers, given that NMB is the only commercial bank with a branch in most districts. Ever since the subsidy programme has grown to reach 87 districts and covering fertilizer and seeds. Nevertheless, the programme has given mixed results and posed many challenges including limitation it has in inputs market development. Furthermore, these subsidy programmes have proven to be generally costly, lack sustainability strategies and are facing various implementation inefficiencies. Other government subsidy arrangements are in place for coffee (seedlings), cashew (agro chemicals) and cotton (seeds and agrochemicals). Other input financing mechanisms include direct funding from government e.g. use of cashew export levy; use of district agricultural development plans (DADPS) e.g. co-funding seedling cost of cashew, sunflower seeds in Singida, etc. 6.2 Availability, accessibility and utilization of inputs in Tanzania Systems of distribution of agro inputs and various agricultural technologies to smallholder farmers in Tanzania have evolved in the last three decades. Up until 1988/89, the government was the principal importer and supplier of most of the inputs through parastatal agencies and co-operative unions (ESRF, 2003). It is important to note that even prior to liberalization, only a few Tanzanian farmers were using inputs. Taking the case of fertilizers, at the height of its importation in 2000, only one Tanzanian farmer in seven was using imported fertilizer (IFPRI, 2000). There is also evidence that the supply of inputs on credit through cooperative unions was under stress even before liberalization. In the late 1980s, the Cooperative and Rural Development Bank was withdrawing credit from cooperatives that were not paying back their loans (Havenevik and Harsmar, 1999). Nevertheless, important changes have occurred in the pattern of importation, demand and consumption of inputs within the country as a result of liberalization. Following market liberalization, the private sector moved in to undertake the functions performed previously by the public sector on the import, procurement, and distribution of agricultural inputs. In the post liberalization period, fertilizer for instance was imported by TFC, competing at an equal footing with private traders. While TFC has its own network of outlets, private traders sold directly to the farmers. Furthermore, the majority of the farm input supply companies remains concentrated in urban areas or rural zones with large concentrations of commercial farmers. Currently there are a handful of inputs importers and millions of smallholder farmers in rural areas without large commercial farms do not have access to quality, affordable and timely agricultural inputs such as improved seeds, fertilizers and other agro-chemicals needed to help them raise their farm productivity. Poor development and weak performance of rural agricultural input markets partly explain the current low productivity of smallholder farmers. Increased awareness of usability of agro inputs has triggered growing demand by smallholder farmers and even without subsidy some progressive farmers could buy inputs.

98
6.3 Proposed policy briefs In this context there are several policy issues and dialogue at different levels of implementation regarding agro inputs access, distribution and application. Of these during this study three key interrelated policy issues are selected for further dialogue with key stakeholders. These are visualized in figure 10 below and include 1. Enhancing access of finance by various agro input chain actors (AGRO INPUT ACCESS
ISSUE) 2. Promote accreditation of suppliers to control quality and reduce tendencies of supply
of counterfeit inputs (AGRO INPUT DISTRIBUTION ISSUE) 3. Promote agro input uptake through private sector engagement in agricultural
extension service delivery (AGRO INPUT APPLICATION ISSUE)
Figure 10: The proposed three policy advocacy briefs

99
6.3.1 Enhancing access to finance by various agro inputs chain actors Introduction Access to financial services is limited and skewed to informal lending mechanisms. According to Finscope Survey (Finscope, 2009), nearly one third of Tanzanians (over 10 million) have no access at all to financial services; while 29% use monetary means to transact and 28% use informal financial service providers. Only 4% use semi-formal providers (SACCOs, other MFIs) and merely 8% have access to a bank account or insurance policy. In fact, in the agriculture sector the issue of access to credit is even worse. Most farmers using input purchase chemical fertilizers and improved seeds and other agro chemicals from private retailers, while some farmers also use locally produced manure. Farmers mostly use proceeds of crop sales to finance fertilizer purchase, with less than 1–2% using bank loans as a source of finance. Farmers who are able to secure supply contracts with large clients can predict earnings and afford to use inputs. However most smallholder farmers grow staples such as maize and face a high-degree of output price uncertainty in addition to weather related risks, which make forecasting income and therefore access to credit and input use difficult. Constraints of access to finance especially for agricultural inputs from this study (ACT 2012) can be summarized as follows from the main chain actors’ perspective: i) Farmers and their organizations Farmers seem to be trapped in a vicious circle: “without credit, they cannot increase their investments in improved seeds and fertilizers to obtain higher yields and incomes. Without increased earnings they cannot acquire assets that can be used as collateral to access credit”. Farmers also have cited financing cost as a second chief factor limiting their access to financing. They find financial products too costly: collateral requirements are stringent; interest rates are prohibitive; bank's charges and fees are high; loan processing bureaucracy is discouraging, loan repayment begins from the time it is issued and installments are too large because of the short- repayment period. Overall, lending terms are unattractive and non-adapted to the business of agriculture, characterized by seasonality, small land sizes, and limited collateral. Private moneylenders offer alternative source of finance to fill the gap but at a very exorbitant cost blocking farmers further in the poverty trap. There is strong evidence that if they could acquire medium-term or long-term credit to add value through appropriate storage units or warehouses, future access to credit would be considerably improved.
Source of Finance for Chemical Fertilizers and Improved Seeds
Source of finance for… Fertilizer Seeds
Sale of Farm Produce 69.5% 68.9%
Other Income generating activities
23.7% 24.8%
Remittances 2.7% 2.9%
Bank Loan 1.7% 0.7%
Other 2.4% 2.7%
Total 100% 100%
Source: FAO/Country Stat Tanzania, Agric Census 2002-03

100
Analysis of cash-flow dynamics shows the importance of financial services as potential agricultural household stabilizers / promoters. The current survey collected data about cumulated cash-flow dynamics in several localities. Below, we represented a household representative in Dakawa whose incomes result from a combination of maize / 2.5 Acres, paddy / 1.5 Acres, casual labour, horticulture, sale of chicken whereas expenses refer to agricultural (inputs, labour, equipments renting, etc.) and to household needs (food, health care, housing, transport, communication, social events, etc. ). Household expenses are the same for both cases but agricultural expenses are specific to the practices that determine the yields. The graph show the trend of the household cumulated cash-flow balance over three years that start – in both cases – with the remaining stocks of agricultural products as only opening balance. The growing trend (1) represents farmers who achieve high yields (maize and paddy) by utilizing inputs. If such household starts a cycle only with the crops stored during the previous year, it suffers a cash shortfall from March to October that culminates at TShs 725,000 (B). If such cash shortfall is not covered it can send these farmers into a downward trend (2) that represents the same household obtaining low yields. The figure also shows that in trend (1) households manage to generate a positive cash-flow balance from September to March that culminates in January and that would allow them to pay for the inputs the second year. It is therefore obvious that (i) inputs should be made available from September onwards or (ii) that farmers must be offered special saving products to be able to budget for these expenses when they possess sufficient resources (alternatively, secured systems of advances to suppliers). The downwards trend (2) shows that a family with systematic low yields is trapped in a poverty cycle. The figure represents a continuously decreasing cash-flow balance. In reality, no increasing financial debt is observed but instead, farmers have to reduce farming and family expenses (inputs, equipments, labour, school, health, communication, clothes and food). Financial services could allow a transition into a growing trend. Private money lenders don’t offer proper services because they take a large part of the resources that the farmers need to save from one season to the other in order to be able to sustain an investment and growth dynamic.
ii) Input suppliers (including agro dealers and importers plus local manufacturers) Agricultural input suppliers view the strict collateral requirements, high interest rates, and high bank charges as the most limiting factors for their businesses. They find that collateral requirements are very difficult to meet given the capital-intensiveness of input trading business. Inadequate and unreliable data on demand of inputs results in uneconomic orders and high input procurement costs are directly transferred to farmers. Even where subsidy system is in place input suppliers have been victims of late redemption of vouchers which affects their cash-flow and costs of servicing their debts. While the margin on inputs business is around 5%, interest rates on loans are around 18%. Similar to farmers, farmers' organizations, agro dealers and large input suppliers find financial institutions' lending terms and conditions to be non-adapted to the specifications of their business. Many are aware of the NAIVS scheme as a public initiatives targeted towards increasing the supply of agricultural inputs to farmers but the system has had several inherent weaknesses and not likely to provide a sustainable business solution.

101
iii) Financial services providers (Banks and non-banks) Though this study did not carry out intensive interviews with Financial Institutions, the few contacts indicated that limited supply of credit to the agricultural sector is arising from a combination of issues within and without their institutions. Ascertaining Creditworthiness and financial profitability of farmers and agro dealers’ investments is quite costly. Information asymmetries make the assessment of viable agricultural projects difficult. Furthermore, lenders are highly concerned with uncertainty about expected repayment given that agricultural profitability is subject to the vagaries of the weather, output and price. Weak technical and managerial expertise of farmers and their organizations’ is also a key issue. Most SHFs and some agro-dealers are not financial literate and have not been running their business with proper cash flow and profitability planning and management. Various projects and subsidy schemes distorts access to private sector led credit. There is the whole issue of Poor Governance whereby some financial services under SACCOS or cooperatives have not been so successful. The weak contract enforcement, especially for defaulters, deters lending to farmers and farmers' organizations. Legal systems are evolving (commercial courts, contract-farming legislation, MKURABITA, etc) with lengthy statutorily based processes despite efforts by financial sector reforms in Tanzania to address them. In a nutshell, the landowning issue (as farmers lack collateral for formal lending), the BOT regulations regarding minimum capital requirements and collateral, the stalled process of transforming microfinance institutions in microfinance companies are some of the burning issues that require speedy reforms. The banks and non-bank financial institutions just do not yet have innovative and viable business models to – within this context – move into the rural areas and provide loans for agricultural activities. Government response In the Kilimo Kwanza resolution, pillar no. 2 (financing Kilimo Kwanza) deals extensively on what reforms and interventions need to be initiated and sustained in Tanzania. A total of 15 action points covering policy to operational issues have been highlighted and were to take effect from 2009. The establishment of the Tanzania Agricultural Development Bank (TADB) is one of the major components of this pillar. The action plan indicated that the TADB preparations would be started from December 2009. By April 2012, only a window is operating at Tanzania Investment Bank (TIB) and what is lacking is capital for starting up of the independent Bank. TADB is not envisaged to be taking deposits in the initial years and will not fall under strict BOT regulations. It will be a special bank tasked with refinancing the lending facilities for agricultural projects in the Commercial and Community Banks, SACCOS and MFIs. It will administer lines of credit on behalf of government and other international sources. The government is also in favour of reviving and strengthening SACCOS. It will institute policy measures to facilitate insurance companies to extend cover and lending for agricultural production. Non State Actors response Various commercial banks (NMB, CRDB, TIB, Exim) have initiated agribusiness loans. PASS Trust is managing guarantee fund to a number of banks for agribusiness loans. Financial Sector Deeping Trust (FSDT) has been promoting innovative projects that could lead into systemic changes in the financial services sector. SACCOS networks (e.g. DUNDULIZA & USAWA) manage agricultural finance products. Agricultural Inputs Trust Fund does equipment leasing, storage and offers other inputs loans. Some MFIs are developing tailor-made products for agriculture (e.g. PRIDE Tanzania). There are also many other value chain financing projects by donors and investors providing loans and grants such as Africa Enterprise Challenge Fund, Kilimo Trust, Africa Agricultural Capital Fund, Seed Investment

102
Fund, Ashoka Changemakers, Africa Agribusiness Investment Fund, etc. SAGCOT Catalyst Fund is expected to expedite this project implementation. Proposed policy discussion points 1. Follow up on the pace of implementing the financial sector reforms and Kilimo Kwanza
(pillar 2) implementation. The issue of inadequate access to financial services for input supply actors and farmers in Tanzania is well underscored in the financial sector reform and KK resolution. It has been confirmed during this recent study that the implementation is not yet yielding results and constraints still persist. It would therefore seem that what is now needed is to demand that implementation takes place. In the KK action plan actors that would take a lead on different issues are highlighted and this is a good starting point for calling for action. ACT as dialogue of actors in agriculture has the right to demand information on the status and implementation of planned actions. 2. Revisit mechanisms for public-private interface in input supply. From the study it seems that public-private interface on seeds is well structured with TASTA playing an important role of organizing the private sector voice. This is not the case with Fertilizer (FST) and Agro Chemicals (CropLife Tanzania). Their bodies are still weak. The Ministry of Agriculture, Food Security and Cooperatives is having a fully-fledged Directorate for Agricultural Inputs, which prepares government plans and does follow-up on the implementation of the public sector roles. Implementation of NAIVS seem to have preoccupied the public sector programs since 2006, but it became clear that new and more effective ways of administering subsidy system that would involve private commercial banks are under discussion. It has become clear also that issues of input supply would require participation of other line relevant ministries. This would underscore the need for more effective mechanisms of coordination and dialogue to ensure that private sector is actively involved in the implementation of policy reforms, and particular financial sector reforms. 3. Profiling successful impact financing initiatives that have reached actors in the input
supply value chain and lobbying and advocate for up scaling. In response to the inadequate financing to agricultural investments, several interventions are under implementation. It is anticipated that Tanzania should now be able to draw good practice lessons from experience and profile and promote best-fit financial services approaches and products. ACT should take a lead in profiling the best cases worth replication.
Proposed process flow: ACT could influence through its network that those proposed policy actions are taken on board to hasten the financial services reforms in Tanzania through active involvement in the review of KK implementation progress. A starting point is joining other agriculture sector lobbying and advocacy bodies such as ANSAF to see next years (2012/13) budget increase in the agricultural sector (up to 10% of total budget as per CAADP Maputo Declaration) targeting provision of input guarantee scheme, fast tracking of crop insurance scheme and reinforcing agriculture window of TIB.

103
6.3.2 Combating counterfeit agro inputs and their supply systems
Can Tanzania combat counterfeit agro inputs and their supply systems? Introduction There are tendencies of unscrupulous traders in collusion with importers/distributors selling fake fertilisers to farmers. In a reported case in Sumbawanga and neighbouring districts in December 2010, the ‘Daily News’ revealed that over 10,000 bags of 50kgs of fake fertiliser were sold to farmers in Sumbawanga Urban and Sumbawanga Rural districts in Rukwa Region. It was noted that traders in collusion with distributors were repacking Minjingu fetiliser into DAP bags (DAP fertiliser commanded high demand in the area and fetched better prices). The practice is not only dangerous to agricultural production in the country but also unethical and a threat to innocent farmers. In Rukwa a bag of subsidized DAP fertiliser was selling at between TZS 63,000 and TZS 70,000 while a bag of Minjingu fertiliser which had already been proved to be unsuitable for the soil was sold at TZS 14,000. In March 2011, the “Guardian” newspaper revealed that there are incidents of fake seeds and agro chemicals in Marangu ward in Moshi Rural district in Kilimanjaro region. In 2012, agro dealer in Arusha reported that packaging material worth TZS 23mil were stolen and are being used to repack fake seeds (maize grain bought from the market). The culprit was caught but the case is pending. In Mbinga district in Ruvuma region some agro dealers were reported mixing DAP and Minjingu in order to make huge profit. In Mbinga Minjingu is sold at TZS 22,000 while DAP is sold at TZS 85,000. Interviewed agro dealers in Mbinga estimated that about 30% of agro chemicals distributed in the district are fake, expired and/or sub standard. In Morogoro region TOSCI in collaboration with Morogoro Rural, Kilosa and Mvomero district councils tested samples and recognize three companies were distributing sub standard seeds. TOSCI emphasizes that poor seeds are those that are fake, not allowed (not registered in the country or expired/out dated. CropLife Tanzania estimates that about 35% of agro inputs in the market are counterfeit products. Consequently, farmers loose by spending much more on inputs and getting low yields or losing the entirely on the crop. Furthermore, credibility of brand holders and reputable importers and manufacturers is lost. Furthermore, brand holders businesses are lost. This seems to be a common problem in the region; in May last year it was estimated that 40% of the agricultural inputs on the market in Uganda are fake including seeds, fertilisers and agro-chemicals (The Monitor newspaper, May 4th 2011) and as a way to reverse the trend the Uganda National Agro Dealers Association (UNADA) resolved to train all certified agro dealers countrywide to detect fake inputs through funding from COMESA under the COMESA Regional Agro Inputs programme (COMRAP). In 2012, Croplife Uganda, Croplife Middle East Africa and IFDC are going to pilot the Use of a Mobile Authentication Service (MAS) to counter fake agro inputs in Uganda. The pilot has been segmented into four zones covering Uganda and carried out in partnership with UNADA, Ministry of Agriculture, Grameen Foundation and other private sector actors.
Why counterfeit agro inputs?
Unknown demand: what is produced/imported does not respond to actual demand, there is limited quantification of demand. In case demand is higher than supply and this give room for counterfeit supply chains to emerge. In case the supply is higher than demand, the expired inputs continue to circulate in the market.
Distribution through ineffective network with limited technical skills: some of traders who handle agro inputs especially agro dealers have limited technical knowhow on handling, storage and proper usage of agro inputs and thus through ignorance of dealers and hence farmers, suppliers of counterfeit find it easy to penetrate up to farm levels.

104
Farmers are price-sensitive and have limited knowledge: smallholder farmers have limited financial capacity and hence price sensitive. Lack of technical knowledge on the usefulness of genuine input is also a problem. Essentially, scrupulous traders who supply counterfeit product capitalize on price led marketing and false promotion of the efficiency of the counterfeit.
Low enforcement of culprits: the enforcement of the low, incidences of corruption practices and how severe the penalties are do not make people refrain from engagement in counterfeit trade practices. Culprit find their way out of the law easily and most continue with their practice
Increased demand by subsidy: the NAIVS has inflated demand of fertiliser and seeds. Some distributors and agro dealers have taken advantage of subsidized inputs scheme by putting counterfeit products using subsidy packages.
Stakeholder response Few stakeholders have come up with initiatives aiming at reducing supply of counterfeit inputs. Some of these include
Review of Seed Act 2003 (2011): now is internationally compliant by Tanzania subscribing to International Seed Testing Association March 2012. Remove ASA monopoly by allowing private companies to interact with research institutions and are allowed to produce basic seeds on royalty basis.
Formation of Committee to intervene in counterfeit agro inputs: a joint committee of members from across several ministries (MAFC, MIT, Ministry of Finance, Ministry of Home Affairs, PMO-RALG) and TASTA: designing measures to deal with counterfeit products – aim at having enforcing different country laws
Strengthening of TOSCI and TPRI: there is deliberate effort to strengthen TOSCI and TPRI so that they can function better and more efficient.
CropLife Tanzania: CorpLife Tanzania with support from CropLife International has attempted to train agro dealers on handling, storage and responsible use of agro chemicals.
CNFA/TAGMARK: over 30 agro input companies received training on proper handling, storage and usage of agro inputs.
MAFC: The MAFC in partnership with World Health Organisation (WHO) is piloting monitoring system on impact of agro chemicals on health in areas with intensive use of chemicals.
Approach and instruments of promoting availability and usage of genuine inputs Importers, manufacturers, distributors and agro dealers and customers alike are faced with challenges of controlling each other and avoiding creating network of suppliers of counterfeit products. There should be deliberate efforts to review and forge new rules and regulations that will control and remove distribution systems of counterfeit inputs. Improved safety regulations impact transportation and storage and handling of agricultural inputs need to be revisited and seek ways to enforce.
Many of the agricultural technologies available, as well as the concepts and approaches in strategic control and monitoring all inputs supply chains, are directly applicable to agro-input supply and marketing in developing and developed country environments. There should be collective and deliberate effort to set up accreditation system coupled with enforcement mechanisms that will see airtight control of rampant production, importation and distribution of counterfeit inputs. This may require involvement of wider body of agro inputs stakeholders beyond importers, manufacturers, distributors and agro dealers. These include organizations of importers,

105
manufacturers and distributors (Crop Life, TASTA, FST) and agro dealers (TANADA), government agencies mainly MAFC, MIT, MLDF, PMO-RALG, Ministry of Finance, Ministry of Home Affairs, TPRI, TBS, Tanzania Police, TRA, financial institutions (FIs) such as FSDT, commercial banks, AGTIF and NGOs such as BRITEN, AGMARK and international development partners including IFDC, AGRA, CNFA, Crop Life International to mention but a few. ACT can take the role of spearheading the review accreditation process by bringing all key stakeholders together and facilitate the discussions and dialogue as visualized in the figure 11 below.
Figure 11: Key stakeholders for inputs accreditation and monitoring quality Proposed Policy Discussion Issues
1. Promote development of a legal accreditation infrastructure for agro input supply chains: from importers to agro dealers, there should be a collective effort of all key stakeholders to review and enhanced the current accreditation systems clarifying certified agent, agro dealer rights, enforcing contracts, ensuring quality control, and reviewing penalties and rules of market conduct, among other legal concerns. Some national legislation requiring review to improve penalties against counterfeiters may include but not limited to
(i) The Merchandise Marks Regulation Act (R.E, 2002) as amended in 2008 and The Zanzibar Industrial Property Act No 4 of 2008; the Acts stressed on establishing a task force to combat counterfeiting (good coordination) and establishment of zones and ranked officers to monitor border posts with powers to seize and detain any goods reasonably suspected to be counterfeit
(ii) The Penal Code Cap16 (R.E, 2002): stipulates that applying counterfeit trade mark to articles intended to be sold, contrary to section 368(b) and (d) of the Penal Code Cap 16 volume 1 of the law Re 2002 will result in penalty of being jailed for a maximum sentence 3 years

106
(iii) The Fair Competition Commission Act (R.E, 2003): the FCC operates under the Ministry of Industries and Trade (MIT) and is responsible for combating counterfeit products in the country.
2. Promote increased investment in agro inputs systems’ infrastructure: Higher productivity and effective agro inputs markets require investment in research and development on tools that will assist in the enforcement of accreditation rules, access to market information, and efficient transportation and communication networks. Particularly establishment of a geographical Information system (GIS) to map all primary chain actors is a prerequisite for the accreditation system to work. This system has been tried in Kenya, Rwanda46, Mali and Nigeria and positive outcomes are seen.
3. Promote effective governance and state capacity to monitor market development: Proper governance will prevent investment from being channeled to rent- seeking groups and will ensure that enforcement of regulations, rules and penalties are in use. Improved state capacity to monitor market development would allow governments to anticipate undesirable filtration of counterfeit agro inputs in the market and devise appropriate responses to eventual short-term difficulties in a timely and effective manner. Although the government has set up a task force to respond to counterfeit seeds penetrating the market, there is a deliberate need to build on this initiative to cover all agro inputs in a much more holistic approach.
4. Promote set up of legal and advisory window for agro inputs stakeholders: this service will be geared to help farmers and other agro input stakeholders to get technical and legal support on issues pertaining to counterfeit inputs. This service could possibly be hosted by TASTA, CropLife Tanzania and FST.
The proposed process ACT is strategically position to facilitate multi stakeholder process of reviewing and developing an accreditation system that will improve distribution efficiencies and reduce incidences of supply of counterfeit agro inputs. It is proposed here that the joint accreditation development process to follow the following steps: (i) Step 1: gain commitment and ownership of key stakeholders taking into account
that there are few ongoing initiatives – analyzing pros and cons of all these initiatives
(ii) Step 2: introduce GIS mapping system (iii) Step 3: review current accreditation, monitoring and penalties and secure
recommendations from key stakeholders on how to harmonize accreditation based on good practice e.g. The Rwanda Agro-Dealer Development (RADD) project47
(iv) Step 4: incorporate key stakeholders’ comments and inputs (v) Step 5: establish mechanisms of monitoring enforcement of penalties and control
for accreditation and de-registering agro inputs suppliers who default or supply fake/counterfeit inputs
(vi) Step 6: communicate to the general public through effective and efficient media network.
46
http://www.ifdc.org/Projects/Current/RADD 47
ibid

107
6.3.3 Promoting private sector engagement in extension service delivery How Can Private Agro-Companies be effective Partners in Providing Viable Solution to Low Adoption of technology and use of Improved Inputs? Background Agriculture is an important sector employing 77.5% of the population, contributing to 95% of the food requirements and accounting for about 24.6% of the GDP in 2010. The sector plays a major role in household income, food security and poverty reduction. However the sector is constrained by a number of factors, the main one being low yields, caused by low technology adoption and low use of recommended agricultural inputs. Improved seeds, fertilizers and agro-chemicals are not adequately used. Low agricultural productivity is the fundamental cause for poverty among the 80% of Tanzanians who are in rural areas. The poor performance of the sector means limited foreign exchange from the sector and less competitive agro-industrial sector. The current status of input use, major challenges affecting input use and how the stakeholders have responded to such challenges are presented below.
i) Seeds ASDP report (2011) indicates that by 2011, the number of households that use improved seeds was around 19.5%. The Ministry of Agriculture estimates that latent demand for improved seeds in the country is 120,000mt48, it however projects that the accessible market (in 3-5years) is around 60,000mt while current supply is at 20,000mt, which is about 33%. There has been an increase in the supply of improved seeds from both the private and public sector of about 32% per annum between 2005/6 and 2009/10. Most of the changes happened between 2004/05 when supply increased by 119%, the supply of improved seeds from public sector however has been fluctuating significantly with a minimum of 217mt in 2009/10 and a maximum of 1,728mt. The private sector is assuming strategic role in the supply of seeds; between 2005/06 and 2009/10 it accounted for 91% of the improved seeds.
Adoption and use of improved seeds by farmers is influenced by a number of factors, Kaliba et al., (1998) established that:
100% of farmers think low yield is a critical risk in using new seeds
37.5% of farmers are worried about susceptibility to pests and diseases of new crop varieties;
25% of farmers considered susceptibility of loss due to drought as important factor and
12% of farmers are more worried by unavailability of seeds in subsequent seasons
This implies that until farmers have verified that pre-conceived risks are either not true or not to the extent they thought, they would decline to apply new seeds, hence there has been a need for demonstration oriented extension services. Input suppliers (importers, manufacturers and agro dealers) have taken interest to support demonstration plots partly as Corporate Social Responsibility but also as a way of promoting markets for their products. The companies found in the field supporting demonstration approach include ByTrade, Tanseed International, Southern Highlands Seed Company, Monsanto, etc.
ii) Fertilizers
48
There is no well-established data on demand of improved seeds in Tanzania; the last comprehensive survey was done by FAO in 1990s, which estimated the demand then to be 30,000mt. To address this weakness the Ministry has engaged a Consultant to conduct a study.

108
Tanzania is among the countries with lowest fertilizer application rate at between 7 to 9 Kgs per arable acre per year (FAO, 2004 in Guo et al, 2009). In Asia the average consumption is >100Kgs and in Latin America >70 while South Asia >135 (FAO, 2004 in Guo et al, 2009). Fertilizers have quick impact to increasing production and hence access to fertilizer has been used as a tool for improving food security in many countries. Low application of fertilizer is one of the main causes of low agricultural productivity in Tanzania.
Currently the MAFC estimates that annual demand of fertiliser after the year 2004/05 is 385,000mt, supply however has averaged at around 70% of this demand. Moreover, YARA estimates the demand to be about 600,000mt per season. Tanzania has 10.1 hectares under cultivation (ASDP, 2011), if the country is to reach the Latin America usage level of 70Kgs/acre/season the country will need more than 707,000mt and if it is to reach the Asian rate of more than 100kgs/hectare/annum the quantity should increase to around 1 million mt. Between 1996 and 2010 the annual growth in supply of fertilisers has averaged at 7.8%. Between 2006 and 2010 the growth improved to an annual average of 11.5%. This growth in fertiliser supply has managed to support a growth in the agriculture sector at around 3 – 4% per annum, which falls short of CAADP target of 6%. iii) Chemicals There is limited knowledge base on use of agro-chemicals as compared to fertilizers and seeds because the industry is not well organized and the list of items being handled it very wide. TAFSIP (2011) however reports that between 14% and 17% of households use agro-chemicals and part of the reasons is limited capacity to produce agro-chemicals in Tanzania; the bulk of it is imported. Envirocare (2010) reported a sharp growth in the supply of agro-chemicals between 2000 and 2003 from about 500mt to 2,500mt respectively, a fivefold increase. Most of the importation of chemicals is done by private businesses and the chemicals have to be tested and approved by TPRI and the Tanzania Atomic Energy Commission (TAEC). While there is a constraint in availability of agro-chemicals, there is a challenge of misuse of these agro-chemicals both on the farm and at post harvest. Most farmers have limited knowledge on proper application of agro-chemicals particularly in horticulture area (including tomatoes in Iringa), they can’t read and comprehend messages on containers, they don’t put on protective gear, there is over use and increased exposure to environment pollution including water sources.
Extension service provision and use of inputs According to (ASDP 2011) report, there has been an increase in the number of advisory services delivered to farmers, while thirty three percent (33%) of farmers received advisory services from public extension services in 2002/03 and the number increased to 60% by 2007/08. In the same period, there was also growth in the number of households receiving extension service from NGOs/development projects from 5.3 % to 7.9 %. Cooperatives and large-scale farmers provided extension to 3.7% and 3.2% of farmers respectively.
The increase in access to extension services reported in ASDP are in absolute number an achievement, however, they have not resulted in increased use of inputs. The public extension system has not been very effective in enhancing use of inputs by smallholder farmers. Although, ASDP acknowledges that the private sector has not been adequately engaged in the provision of extension services, it is relatively quiet on strategies to engage the private sector despite existence of working frameworks, e.g. the Public Private

109
Partnership Act (2010), Kilimo Kwanza Resolution, CAADP, SAGCOT, the District Agriculture Development Plans (DADPs), etc.
Lessons from horticulture and tobacco sector where the private sector is fully engaged there is higher intensity of extension services and input use. In fact tobacco tops the list of crops that have higher adoption rate of inputs (fertiliser in this case). High adoption of use of inputs is also cited in TAP-facilitated projects, through using demonstration plots in Kiroka village, Morogoro Rural district in Morogoro region a model farmer managed a record of 9mt/ha because he got access to good extension services and inputs. Cases have been reported (from Songea, Iringa Rural and Kilosa) where farmers are able to harvest up to 3,000mt per against an average of 1,000 in the same areas per acre.
In collaboration with local government, private sector actors are supporting implementation of demonstration plots and there have been tangible outcomes of increased use of inputs and yields. Input companies have been educating farmers using demo plots and through supporting farmer field schools (FFS) under LGAs. Tanzania Agriculture Partnership (TAP) through NORAD and EEC funds has been effectively using demonstration plots to educate farmers on proper usage of inputs. The private companies working with TAP include YARA International, Bytrade, Monsanto, Pannar Seed Company, Tanseed International, Minjingu Company Limited and Kibo Seed Company. Private sector initiatives have shown positive effects in enhancing use of inputs and increasing productivity.
The Case for Private Sector led PPP in Extension Service Provision The current set up where extension services are the domain of the government and the thinking that the solution to extension services focuses more in increasing the number of extension staff need to be radically reviewed. It has been demonstrated that the current public led extension services delivery system cannot meet the need to accelerate agricultural growth to a sustainable 6% per annum. The public way of providing extension services is partly responsible for the prevailing situation of low uptake of inputs. Government extension officers have limited budget to work, their skills are not continuously updated and at times are overstretched in coverage and types of commodities. Furthermore, they have limited linkage with private sector agro chain actors. In private sector led crop value chains, extension services have been more efficient in raising adoption of good practices and use of inputs. However, it is understood that the provision of extension services should be the responsibility of both the public and private sector hence the need for an effective partnership. It is important therefore that innovative approaches that have demonstrated effectiveness should first be recognized, institutionalized and scaled up.

110
The government has put in place policy frameworks for engaging the private sector but can still do more. Even when the role of the private sector in the overall agriculture sector development, and particularly promoting use of inputs through effective extension is vivid, government strategies, legal and regulatory framework have fallen short of actively engaging the private sector. A good practice for promoting use of inputs identifies one entry point towards overcoming weak and effective demand for inputs as being strengthening agriculture research and extension. The private sector can fill the gap in government finance and support investment in extension provision. In Tanzania this is already happening (i.e. direct provision of extension through establishing demonstration plots). Private companies can also undertake innovative approaches for providing extension and market information e.g. through mobile telephone.
Public efforts to support the sector are being complimented by a number of local and international NGOs that are working in agriculture implementing innovative projects targeted mainly smallholder farmers. Farmers’ organizations are also increasingly becoming important players in supporting efforts to improve the situation of small-scale farmers. Apart from cooperatives there is a growing presence of farmer organizations that serve as advocacy groups. These include the Agricultural Council of Tanzania (ACT), National Network of Farmers Groups (MVIWATA), and Tanzania Chamber of Commerce, Industry and Agriculture (TCCIA). But also experiences in the coffee sector (TaCRI and farmer group model of production and dissemination of improved seedlings and technologies) has shown that when farmers are selected and trained, they can be an efficient and effective way of providing numerous extension services and disseminating technologies to groups they are actively involved in. Initiative by CNFA/TAGMARK through which about 3,000 agro dealers were empowered to operate their businesses efficiently and trigger usage by setting up demonstration plots could be replicated elsewhere in the country. Proposed Policy Discussion Issues 1. Advocate for institutionalize the PPP concept in the Provision of Agriculture Extension
Services: A number of statements concerning the role of the private sector are made but there is mindset, especially from the public sector undermining partnering with the private sector. The private sector is perceived as having parochial interests of reaping-off citizens and the state should protect the citizens. In addition, there is also need to clarify or have an agreed modality for harmonizing basis and objectives for joint intervention; Government is concerned with food security and welfare while private sector is concerned with economic growth and hence there are strong interdependencies between government and private sector objectives.
The Case of Monsanto in Tomatoes The Government is implementing a Programme called Muunganisho wa Ujasiriamali Vijijini (MUVI) aimed at promoting rural incomes through value chain development. Since tomato (and other horticultural products) require close extension services, the Programme implementing organization has invited a global seed company, Monsanto to participate in the provision of extension services. Monsanto has already trained more than 800 farmers in the Districts of Iringa Rural and Njombe and plans to increase the number to 3,000 in 2013, a task that would be difficult to achieve if the Government was to do it alone. Farmers are testing new varieties of tomatoes that have higher yield and are resistant to some of the diseases that lower productivity.

111
2. Promote guidelines for public and private sector engagement in extension and other service provisions: although extensive legal and policy frameworks exist, there are no clear guidelines and clear performance indicators on how to engage in a PPP extension service delivery. The guideline should clearly spell out; (i) how to initiate PPP engagements (ii) coordination of activities of actors (iii) Budgeting for collective activities (iii) roles and responsibilities for each actor (e.g. in establishing demonstration plots, local government can mobilise farmers and private sector provides inputs for demonstration plots) and (iv) monitoring and evaluation framework of the PPP activities and generating learning processes for all actors, public and private.
The proposed process ACT should initiate the discussion on the institutionalization of the PPP process and guidelines for public and private sector engagement through a forum with all key stakeholders. The key stakeholders should include from representation of public sector (MAFC, PMO-RALG, TOSCI, TPRI, LGAs, RAAs) and private sector (Leading seed companies, fertiliser companies an, agro-chemical companies, TANADA, TASTA, FST, CropLife Tanzania). It is proposed here that the process should follow the following steps: Step 1: Gain consensus and commitment and ownership of the process by key stakeholders Step 2: Review existing policies/programs and pinpoint specific policy reforms/program reviews needed, discuss the institutionalization of the PPP process and formulation of guidelines for public and private sector engagement. Step 3: Adopt recommendations for; (i) Specific policy reforms/program review needed, (ii) institutionalization of the PPP process and (iii) formulation of guidelines for public and private sector engagement. Step 4: Lobby for the same; i.e. (i) Specific policy reforms/programme review needed, (ii) institutionalization of the PPP process and (iii) formulation of guidelines for public and private sector engagement. 6.3.4 Agreed way Forward for ACT policy lobbying and advocacy After validation of the final draft of this report, it was agreed by all key stakeholders that ACT should spearhead process of lobbying for these policy briefs according to priority and importance as follows:
1. Policy brief 2: Promote accreditation of input suppliers 2. Policy brief 1: Enhance inputs value chain financing mechanisms 3. Policy brief 3: Promote private sector engagement in extension service delivery 4. New policy brief: resolving the maze – see how to lobby for
simplification/harmonization of the accreditation process and creating synergies rather than multiple licenses and procedures as is the case now as depicted in figure 11 above.

112
7.0 REFERENCES Aloyce R.M. Kaliba, Hugo Verkuijl, Wilfred Mwangi, D.A. Byamungu, P.
Anandajayasekeram, and Alfred J. Moshi. Aloyce R.M. Kaliba, Hugo Verkuijl, Wilfred Mwangi, D.A. Byamungu, P. Anandajayasekeram, and Alfred J. Moshi. (2008). Adoption of Maize Production Technologies in Western Tanzania
Andrew Dorward (2009) Rethinking Agricultural Inputs Subsidy Programmes in Chainging World. Paper prepared for the Trade and Markets Division, Food and Agriculture Organization of the United Nations.
Envirocare (Undated). Pesticides Inventory Verification on Farms and Small Scale Farmers FAO (2011) Food and Agriculture Organization of the United Nations FAO Stat Rome FAO (2011). Food and Agriculture Organization of the United Nations FAO Stat Rome.
“Experience of the Inputs Subsidy Programme in Tanzania”, Presentation at International Training Program on Developing Private Sector Agro Input Markets –
Finscope (2009) Survey of the demand for, and barriers to accessing financial services in Tanzania, jointly undertaken by the Economic and Social Research Foundation (ESRF) and Development Pioneer Consultants Limited (DPC)
IFPRI (2011): The supply of inorganic fertilizers to smallholder farmers in Tanzania: Evidence for fertilizer policy development
Iringa District Council. (2012). Draft Socio-Economic Profile Kilolo District Council (2012) Draft Socio-Economic Profile MAFC (2011) The seed industry status report – Ministry of Agriculture Food Security and
Cooperatives, Dar es Salaam Tanzania Michael Morris, Valerie A. Kelly, Ron J. Kopicki and Derek Byerlee (2007) “Fertilizer use in
African Agriculture, lessons learned and good practice guidelines”, World Bank, Washington DC.
Msolla, M. M. and S.M. Masagasi (2010) “Experience of the Inputs Subsidy Programme in Tanzania”, Presentation at International Training Program on Developing Private Sector Agro Input Markets – Designing And Implementing Targeted Subsidy Programs, Yankari, Nigeria, Dar es Salaam: Ministry of Agriculture, Food Security, and Cooperatives.
NEMC. (Undated). Pesticides Inventory Verification on Farms and Small Scale Farmers Nicholas Minot. IFPRI. (2009). Fertilizer Policy and use in Tanzania: A Presentation at the
Fertilizer Policy Symposium of the COMESA African Agricultural Markets Programme (AAMP). Livingstone, Zambia.
Republic of Malawi. (September 2011). Malawi Agricultural Sector Wide Approach: A prioritized and harmonized Agricultural Development Agenda: 2011-2015
Tanzania Coffee Board (2010) Annual Report - 2009/10. United Republic of Tanzania (2011) Agriculture Sector Development Programme Evaluation
Report United Republic of Tanzania (2011) Tanzania Agriculture And Food Security Investment Plan
(TAFSIP) 2011-12 To 2020-21 United Republic of Tanzania. 2010. Bill Supplement. The Pubiic Private Partnership United Republic of Tanzania. The Fertlizer Act, 2009. United Republic of Tanzania. The Pesticides Control Act, 1984 United Republic of Tanzania. The Plant Protection Act, 1997

113
United Republic of Tanzania. The Seeds Act, 2003. United Republic of Tanzania. The Tropical Pesticide Research Institute Act, 1979 World Bank (2009) United Republic of Tanzania – Accelerated Food Security Program;
Emergency Program Paper, Report No. 48549-TZ, Washington, DC: World Bank
World Bank. (July 26, 2006). Malawi Country Assistance Evaluation Malawi Country Assistance Evaluation
Zhe Guo, Jawoo Koo and Stanley Wood (2009) Fertilizer profitability in East Africa: A Spatially Explicit Policy Analysis. Paper prepared for presentation at the International Association of Agricultural Economists Conference, Beijing, China, August 16-22, 2009

114
8.0 ANNEXES 8.1 Lessons on “Smart” fertilizer subsidy programs Input subsidy programs may have various objectives, including increasing agricultural productivity, improving food security, or providing income support for poor farmers. National and household food security objectives may be especially urgent in times of crisis, such as the current environment of rapid and major increases in fertilizer and food grain prices. Regardless of their objectives, the design and implementation of input subsidies should be “smart” in the sense that (a) Their benefits in terms of agricultural productivity and food security exceed what
could be achieved by investing the resources in other areas; and (b) They encourage farmers‘ purchases of fertilizer on commercial terms, or at least do
not impede it, which could result if government input subsidy programs crowd out commercial transactions or undermine investment in fertilizer distribution by suppliers and agro-dealers.
Minde and Ndlovu49 (2007) describe “smart” subsidies as those involving (S)pecific targeting to farmers who would not otherwise use purchased inputs (or to areas where added fertilizer can contribute most to yield improvement), (M)easurable impacts, (A)chievable goals, a (R)esults orientation, and a (T)imely duration of implementation, i.e., being time-bound or having a feasible exit strategy.
Morris et al50. (2007, 103-105) identify ten guiding principles for subsidies to be “market smart”: (1) Promote the factor or product as part of a wider strategy that includes
complementary (2) Inputs and strengthening of markets (3) Favor market-based solutions that do not undermine incentives for private investment (4) Promote competition and cost reductions by reducing barriers to entry (5) Recognize that effective demand from farmers is critical for long-run sustainability (6) Insist on economic efficiency as the basis for fertilizer promotion efforts (7) Empower farmers to make the decisions about soil fertility management (8) Devise an exit strategy to limit the time period of public interventions (9) Pursue regional integration in order to benefit from the economies of market size (10) Emphasize sustainability as a goal when designing interventions, and, (11) Promote pro-poor growth, in recognition of the importance of equity considerations. While the concept of “smart” fertilizer subsidies is very appealing, they can be difficult to design and complex in evaluating impact. Also, unanticipated implementation problems can cause even well designed programs to fall short of being “smart” in practice. To illustrate these points, and to identify lessons for future programs, we review below the experience with input subsidy programs in Malawi and Zambia. What factors determine the costs and benefits of fertilizer subsidies? The main cost factors are:
49 Minde, I. J., and P. Ndlovu (2007) How to make agricultural subsidies smart. Paper Prepared for Contribution to the Ministerial Seminar, Maputo, Mozambique, 8 June 2007, Regional Strategic Analysis and Knowledge Support System for Southern Africa (ReSAKSS-SA). Mimeo. 50 Morris, M., V. A. Kelly, R. Kopicki, and D. Byerlee (2007) Promoting increased fertilizer use in Africa: Lessons learned and good practice guidelines. Washington, D.C.: World Bank.

115
1. The cost of acquiring the fertilizer: World fertilizer prices have more than doubled over the past year and ocean freight and transport costs have also increased, reducing the potential returns to fertilizer subsidy programs. The subsidies needed to bring farm-gate fertilizer prices down to levels considered affordable to low-income farmers will require greater outlays from national budgets than in prior years.
2. The full economic cost of implementing the fertilizer subsidy program: These costs include not only the economic costs of distributing and applying the fertilizer but also the opportunity costs of the resources used in the program, e.g., the flow of benefits that otherwise could have been achieved with the resources used for the subsidy program. If subsidies are too high, there is also a risk of over application of fertilizer leading to huge environmental costs.
3. The price of output: World food grain prices have increased dramatically in the recent past. To the extent that these increases are transmitted to domestic prices, they will boost the potential returns to fertilizer subsidy programs. In an extreme case where needed grain could not be obtained from regional or world markets, the benefits of additional domestic food production generated from a subsidy program would include saved lives and malnutrition averted.
4. Agronomic response rates: Improving the aggregate crop yield response rates to fertilizer application could enhance the payoffs to fertilizer subsidy programs. This requires making complementary investments in training for farmers on agronomic practices, soil fertility and water management and efficient use of fertilizer, and investing in crop science to generate more fertilizer-responsive seeds.4 Survey data commonly indicate that the contribution of fertilizer to food grain yields varies tremendously across farms even within the same villages. Simply bringing fertilizer response rates among the bottom half of the distribution up to the mean would contribute substantially to household and national food security (Nyoro et al51, 2004).
5. The degree to which subsidized fertilizer adds to total fertilizer use, rather than crowding out or displacing commercial fertilizer sales: This concept may be best understood in a “with/without” framework. Assume, for example, that in the absence of a subsidy program a given farm would purchase 2 bags of fertilizer. If this farmer is allocated 4 bags of subsidized fertilizer, then she may no longer purchase the 2 bags from the trader. In this case, the additional fertilizer use as a result of the program would be only 2 bags instead of 4, i.e., 50% not 100% of the amount supplied. The two bags that she would have purchased from the trader now remain in the trader‘s inventory. This displacement of commercial sales will be low or zero if subsidized fertilizer is sold to households who otherwise would not have access to fertilizer or could not afford to buy it. Findings from Malawi and Zambia indicate that an additional kg of fertilizer distributed under the subsidy program adds only 0.5 to 0.8 kg to the amount of fertilizer used by farmers (implying a displacement rate of 20-50%), and that crowding out is lower when the subsidy is targeted to relatively poor households than when targeted to non-poor farmers (Dorward et a52l., 2008; Ricker-Gilbert and Jayne53, 2008; Weber54, 2008).
6. Timely arrival and utilization of the fertilizer by farmers: Crop yields may fall if fertilizer is applied significantly later than the optimal time in the crop growth cycle. Yet late arrival of fertilizer is a common feature of fertilizer promotion programs. For example, a recent study of
51 Nyoro, J. L. Kirimi, and T.S. Jayne (2004) Competitiveness of Kenyan and Ugandan Maize Production: Challenges for the Future. Working Paper 10, Egerton University, Tegemeo Institute, Nairobi, Kenya. 52 Dorward, A., E. Chirwa, V. Kelly, T. Jayne (2008) Evaluation of the 2006/7 Agricultural Input Supply Programme, Malawi, Final report, School of Oriental and African Studies (SOAS), Wadonda Consult, Michigan State University, and Overseas Development Institute (ODI), undertaken for the Ministry of Agriculture and Food Security Government of Malawi. 53 Ricker-Gilbert, J. and T.S. Jayne (2008) The Impact of Fertilizer Subsidies on National Fertilizer Use: The Case of Malawi. Paper prepared for the 2008 summer meetings of the American Agricultural Economics Association, Long Beach, California 54 Weber, M (2008) Empirical Information on Smallholder Maize Production and Fertilizer Use in Zambia, Presentation at Fertilizer Support Programme Evaluation Kick-Off Workshop, Protea Safari Lodge

116
fertilizer transport subsidies in Tanzania (MAFC, 2007)55 reported that fertilizer arrived late in almost all regions visited. Late arrival and application of fertilizer were noted in the 2006/07 input subsidy program in Malawi (described below and reported in Dorward et al., 2008), and described for Zambia in Xu (2008, p. 68)56.
55 MAFC (2007) Report on the Effectiveness of Fertilizer Transport Subsidies in Agricultural Production; Consultancy Report by Unique Consultancy Services Ltd, Dar es Salaam. 56 Xu, Z (2008) Profitability of Applying Fertilizer on Maize for Smallholder Farmers in Zambia, Essay 2 of Ph.D. dissertation, Department of Agricultural, Food, and Resource Economics, Michigan State University, East Lansing.
117
8.2 Status of lobbying and advocacy on input supply sector in Tanzania Input theme
Lobby & Advocacy Issues Already Implemented Still under dialogue Unclear A
gric
ult
ura
l Se
ed
s
Reduce hybrid seed import dependency (70%) by promoting local entrepreneurs to produce own varieties, or commercialization of released vegetable seed varieties
TASTA & MAFC have convinced AGRA to support with grants a number of local producers of seeds.
AVRDC is now producing breeding vegetable seed varieties for multiplication.
In Nov 2011 a gov’t circular was issued allowing private companies to access gov’t protected varieties for multiplication on royalty basis.
Subsidize high quality and certified seeds to small-scale farmers (KK resolution pillar 7)
From 2006/07 the government agreed to add seeds on the list of agricultural subsidy scheme. In 2008/09 added through the voucher scheme,
Enforce the Seed Act to eliminate the rampant sale of fake seeds (KK resolution pillar 7)
A National Seeds Committee meets annually to guide and advice in seed industry matters.
A multi Sectoral / disciplinary committee recently formed (MAFC, MOF, MOHA, MIT, PMO, TASTA etc to institute measures to curb fake inputs (to be included in the budget of 2012/13)
Empower and strengthen Tanzania Official Seed Certification Institute (TOSCI) to become a regulator by 2009 (KK resolution pillar 7).
Not enough human resources and support of other law enforcement structures. Enforcement powers to TOSCI still vague.
EAC & SADC harmonization of seeds initiatives shall exert more pressure on capacity of TOSCI.
Patent results of seed research to protect locally developed seed varieties.
Plant Breeder Rights Act 2002 and amendments proposed in 2012.
Waiver of taxes on seeds: cess on local produce, taxes on packaging materials, excise duty & VAT on transporters of
A seed movement order is in place but often not used.
A policy paper of taxes is under preparations with USAID support.

118
seeds.
Review the Seed Act such that it is internationally compatible
By March 2012, Tanzania became a member of International Seed Testing Association (ISTA)
Revisit seed subsidy mechanism to make it effective
Ministry is currently reviewing a new proposal for subsidy management.
Live
sto
ck In
pu
ts
Strengthen the National Artificial Insemination Centre (NAIC) in Arusha and introduce semen storage and distribution centres in all regions (KK).
So far only 6 centres are operational in the Country including, Arusha, Dodoma, Mwanza, Mbeya
Revive and establish livestock multiplication and heifer breeding units (KK)
Arusha & Mpwapwa heifer breeding units are operational.
Ensure adequate local production of veterinary drugs and animal feeds
Fert
ilize
r
Enhance and improve production and quality of fertilizer from the current Phosphates and NPK production at Minjingu to 300,000 tons and above per annum by 2010 (KK).
Minjingu has a capacity of 100,000 t /a and only utilizes 20% . In April 2012, Minjingu has been allowed to export fertliser that have no effective demand in Tanzania. (2012). Recently Minjingu has been allowed to export piled stocks that have no market in Tanzania.
Explore large scale production of Nitrogen based fertilizers using the available natural gas deposits (KK)
Investors from Russia and RSA have shown interest. Implementation is yet to take off.
Facilitate availability of fertilizers (KK).
Input Subsidy system is under implementation from 2003/2004 and has stepped up availability of

119
fertilizer (e.g. In 2010/11 200,000 MT)
Port infrastructure upgrading to facilitate bulk procurement of fertilizers
Among main interventions was to offer space for Dar Corridor Group and Yara for bulk procurement and storage near the port.
Agr
o c
he
mic
als
Establish local agrochemical production industries (KK).
Twiga Chemicals is ogro-chemical industries in Tanzania. Tanzania still relies mostly on imported chemicals.
Promote integrated pests and disease management (KK).
R & D Institutions / ARI are researching and disseminating IPM technologies.
Train farmers on the requirements and proper application of agrochemicals (KK).
Some private companies are actively training farmers and agro dealers on their brands.

120
8.3 Lists and contacts of people interviewed Date Location Name Institution Contact
03/20 Morogoro William Jasseda Morogoro Rural TAP DCo +255 756 489 449
03/20 Meru Sanga Amari Vet Officer, Meru DC +255 713 977 887
03/20 Arusha Anania Bansimbile Assistant Project Manager, Food Facility Project, OIKOS
+255 784 588 223
03/20 Arusha Chrispin Mirambo Zonal Coordinator, GSC +255 785 555 040
03/21 Dakawa Hezeniel Foya Mvomero TAP DCo +255 784 322 411 +255 719 816 695
03/21 Dakawa Mr Mehayo Mvomero NAIVS supervisor
03/21 Dakawa Mr. Moshi NMB Mvomero Branch +255 788 666 639
03/21 Dakawa Yusuf Makunja Agro-dealer / Ward Councilor +255 655 820 724
03/22 Dakawa Mr. Mahengera UWAWAKUDA +255 787 776 042
03/22 Dakawa Mr. Nyemele UWAWAKUDA +255 755 522 729
03/22 Dakawa Mr. Mazola UWAWAKUDA +255 714 634 981
03/22 Dakawa Demetria Nyambo CHOLIMA +255 754 441 168
03/22 Milama Milama farmers (FGD)
03/22 Arusha Epiphania E. Kimaro Director General, TPRI +255 754 892 678
03/22 Arusha Bakari Kaoneka Registrar of Pesticides - Tanzania
+255 754 476 346
03/23 Dakawa Dakawa farmers (FGD)
03/23 Mbinga Benard Ernest Semwaiko DALDO -Mbinga +255 752 202 410
03/23 Mbinga Sina Sanga Agro-dealer - Mbinga 0784 701832/0759 542362
03/23 Mbinga Alanus Komba Agro-dealer - Mbinga 0762 753955/0786 753955
03/23 Mbinga Ilomo Danga Agro-dealer - Mbinga 0752 456642/0782 862297
03/23 Mbinga Janeth Mhagama Agro-dealer - Mbinga +255 767 290 333
03/24 Morogoro Prof. Luis Mtenga SUA Livestock +255 784 348 278
03/24 Morogoro Mohamed Ngaula Regional Agro-dealer, Member of the Morogoro Union of agro-dealers, leader of the local association
+255 654 114 444 +255 755 004 444
03/24 Mbinga Aaron Komba Assistant Secretary, KIMULI AMCOS +255 754 211 378
03/24 Mbinga Conrad Nchimbi
Vice Chairman - KIMULI AMCOS +255 763 344 827
03/24 Mbinga Stanley Komba
Clerk - Inputs Section KIMULI AMCOS +255 756 019 149
03/24 Mbinga Leodgard Chapaka
Board Member - KIMULI AMCOS +255 752 182 115
03/24 Mbinga
Ana-Maria Benjamini Komba
Member-Faida Group - Mhekela Village +255 755 069 394
03/24 Mbinga
Andrea Yunus Komba
Chairman - Village Government +255 752 632 589
03/24 Mbinga Cyprian Hyera Member-Mhekela Village +255 753 510 301
03/24 Mbinga
Aleus Elnelius Lupogo Member-Mhekela Village +255 753 506 448
03/24 Mbinga Disla Mbungu Member-Mhekela Village +255 762 243 236
03/24 Mbinga Dismas Kumburu Member-Mhekela Village +255 786 660 001
03/24 Mbinga January Nchimbi
Assistant Manager- LUWAITA AMCOS +255 784 608 803
03/24 Mbinga Gerald Ndunguru Manager - LUWAITA AMCOS

121
03/24 Mbinga Victor Akulumka Extension Officer TaCRI
03/25 Mbinga Philbert Ambrose Mbele
Coffee farmer - Mhekela Village +255 755 797 918
03/25 Mbinga Simbert Pius Hyera
Chairman - Village Government +255 757 938 587
03/25 Mbinga Hilda Simon Haule School teacher +255 764 712 735
03/25 Mbinga Philipo F. Mbelle
Coffee farmer - Mhekela Village +255 762 614 625
03/25 Mbinga Innocensia Mbunda
Coffee farmer - Mhekela Village
03/25 Mbinga Thomas Mbele
Coffee farmer - Mhekela Village +255 684760 955
03/25 Mbinga Luciana Nombo
Coffee farmer - Mhekela Village +255 758 543 494
03/25 Mbinga Venant Nchimbi
Coffee farmer - Mhekela Village +255 765 502 753
03/26 Kilosa Diones Mboya DC Agricultural Officer +255 784 229 821
03/26 Kilosa Mr. Kiango Cooperative officer +255 784 841 929
03/26 Kilosa Mr. Bruno Farmer + hardware shop +255 784 851 595
03/26 Mbinga Deodadis Kisima
District Food Crops SMS/Subsidy coordinator
0756 3365/658/0787 827400
03/26 Mbinga Selemani Mwamba
Mbinga District Planning Officer (Actg)
0719 232875/0788 505040
03/26 Mbinga Shaibu Mnunduma
District Executive Director-Mbinga
+255 25 2640005/2640718
03/26 Mbinga Godfrey Malila Transporter - Mbinga +255 784 481 777
03/26 Moshi Felician B. Olomi Vice Chairman; Umbwe Ndoo SACCOS
+255 755 445 620
03/26 Moshi Goncesa P. Munishi Member +255 755 033 931
03/26 Moshi Aloyce L. Massawe Member +255 755 203 837
03/26 Moshi Baltazar D. Chami Member 0755874747; 0653807706
03/26 Moshi Longinin S. Olomi Member +255 754 649 937
03/26 Moshi Emmanuel Ngoia Asistant TAP DCO
03/26 Moshi Mr. Willa NMB – Branch Manager +255 755 374 767
03/26 Moshi Ombeni Masaidi Credit Manager, KCBL
03/27 Kilosa Mr. Macha Agro-Vet shop owner +255 784 658 035
03/27 Kilosa Mr. Mohamed Maje District Executive Director +255 784 209 840
03/27 Kilosa Mr. Mchome Extension officer +255 787 127 313
03/27 Ilonga Msimba Farm (ASA)
03/27 Ilonga ABC Mbiza ARI Ilonga – Zonal research coordinator
+255 784 914 422
03/27 Ilonga Village Executive officer +255 788 943 631
03/27 Ilonga Extension officer
03/27 Ilonga Ilonga farmers (FGD)
03/27 Iringa Municipl
Dickson Mwalubandu
Director - TAGRODE/TAP DCo for Kilolo +255 755 397 742
03/27 Moshi John J. Maembe Chairman, Kwampare Wakati Farmer Group
+255 759 645 410
03/27 Moshi Lukas Kessy Secretary, Kwampare Wakati Farmer Group
03/27 Moshi Eustach R. Maembe Member
03/27 Moshi Magdalena H. Temba
0755742133; 0785742133
03/27 Moshi Aloyce J. Kessy Member

122
03/27 Moshi Kornel Msacky Member
03/27 Moshi Augustino Msacky Member
03/27 Moshi Theofil R. Maembe Member
03/27 Moshi John Nyambo Member
03/27 Moshi Michael F. Assey Member
03/27 Moshi Tadeus P. Mtey Member
03/27 Moshi Anna Mosha Member
03/27 Moshi Clemence B. Maembe
Member
03/27 Moshi Christian A. Shoo KNCU 0782851745;0713334373
03/27 Moshi Philipo P. Mwakipesile
Production Manager, KILICAFE
0787070904; 0658070904; 0754070904
03/27 Moshi Grace Murungi Project Manager Coffee Project, Envirocare
+255 787 298 641
03/27 Moshi Deusdedit Kilambo TaCRI – Coffee Researcher +255 754 377 181
03/28 Kilosa Mr. Tarimu District Resp. of NAIVS +255 784 691 878
03/28 Kilosa Martina Milinga Bayport Kilsa
03/28 Kilosa Mr.Lameek Matemba
NMB Kilosa Branch +255 784 466 872 +255 655 466 872
03/28 Kimamba Extension officer +255 784 780 632 +255 714 525 985
03/28 Kimamba Mr. Kayala Maendeleo SACCOS +255 715 236 813
03/28 Kimamba Kimamba Farmers (FGD)
03/28 Kilolo Aloyce Kipalu
Chairman - Imalutwa Village Government- Kilolo
03/28 Kilolo Mikidadi Ngando
Farmer - Imalutwa Village-Kilolo
0784 744051/0762 186350
03/28 Kilolo Naftali Kipaloi
Farmer - Imalutwa Village-Kilolo 0786 142953
03/28 Kilolo Aghata Chang'a
Farmer - Imalutwa Village-Kilolo 0782 553131
03/28 Kilolo Kalubanga Ngando
Farmer - Imalutwa Village-Kilolo 0787 051900
03/28 Kilolo Elias Mfugwa
Farmer - Imalutwa Village-Kilolo 0786 123776
03/28 Kilolo Francis Chusi
Farmer - Imalutwa Village-Kilolo 0685 608460
03/28 Kilolo Vicent Lihawa
Chairman - Ilawa Village - Kilolo 0752 544400
03/28 Kilolo Patson Kihongole Farmer - Ilawa Village - Kilolo 0768 073224
03/28 Kilolo Eliudi Mbinda Farmer - Ilawa Village - Kilolo 0769 504874
03/28 Kilolo
Brown Magowa+B24 Farmer - Ilawa Village - Kilolo
03/28 Kilolo Rosina Kalamba Farmer - Ilawa Village - Kilolo 0763 419557
03/28 Kilolo Neema Msumula Farmer - Ilawa Village - Kilolo 0756 704700
03/28 Kilolo Pius Lihawa Ex. VAEO 0767 898358
03/28 Kilolo Angeltrade Kamala
Village Agriculture Extension Officer 0786 912608
03/28 Kilolo Josephat Kihongole Farmer - Ilawa Village - Kilolo 0768 182689
03/28 Moshi Meck Shao Chairman; Mrimbo Uuwo Best Coffee Growers Group
0762746670
03/28 Moshi Edwin Kaale Manager of CPU 0755665828
03/28 Moshi Crisanta Lyimo Secretary 0755276268

123
03/28 Moshi John Masawe 0755757884
03/28 Moshi Charles Urio
03/28 Moshi Eunice Shao
03/28 Moshi Geofrey Mghase
03/28 Moshi Rogathe Minja
03/28 Moshi Julius P. Towo Managing Director, Rafiki Kilimo
0754 309745
03/28 Moshi Rose Mamuya Secretary, Moshi Agro Dealers’ Association
0755082537
03/29 Morogoro Martin Mason NAFAKA +255756487190
03/29 Morogoro Mashauri Saka Tanseed International +255784352412
03/29 Kilolo Henry Kajwanga Economist - Kilolo District 0754 422990
03/29 Kilolo Mr. Benson Kilangi DALDO - Kilolo 0787 416811
03/30 Morogoro Prof. Faustin Lekule SUA Livestock +255754690023
03/30 Morogoro Tasiana Mhingu TOSCI Acting Chief Seed certification office
+255784832321
03/30 Morogoro Andrew Kunda ASA Production Manager +255784556680
03/30 Iringa Rural Ms Tina Sekambo
District Executive Diector - Iringa Rural
03/30 Iringa Rural David Chillagane
Inputs and Plant Protecion Officer 0784 798881
03/30 Iringa Rural
Ramadhani Musa Nanguli
Village Chairman - Kiwere Iringa (R ) 0752 543632
03/30 Iringa Rural Amosi Luvanda Farmer - Kiwere Village 0769 119095
03/30 Iringa Rural Saada Nyavili Farmer - Kiwere Village 0756 253270
03/30 Iringa Rural
Kassim Issa Mpagama Farmer - Kiwere Village 0753 244830
03/30 Iringa Rural Aloyce Mdude
VEO - Ihemi Village - Iringa Rural 0758 033305
03/30 Iringa Rural Zawadi Ilomo
Farmer - Ihemi Village - Iringa Rural 0763 449754
03/30 Iringa Rural Devota Chungu
Farmer - Ihemi Village - Iringa Rural 0764 697093
03/30 Iringa Rural Maria Chusi
Farmer - Ihemi Village - Iringa Rural 0752 736030
03/30 Iringa Rural Anania Kadege
Farmer - Ihemi Village - Iringa Rural 0759 398049
03/30 Iringa Rural Sikuilage Sanga
Farmer - Ihemi Village - Iringa Rural 0782 305152
03/30 Iringa Rural Anzamile Mtisi
Farmer - Ihemi Village - Iringa Rural 0764 240442
03/30 Iringa Rural Maria Mahuvi
Farmer - Ihemi Village - Iringa Rural 0756 554533
03/30 Iringa Rural Ester Mwanga
Farmer - Ihemi Village - Iringa Rural 0757 795145
03/30 Iringa Rural Anatalia Kalolo
Farmer - Ihemi Village - Iringa Rural 0753 929334
03/30 Iringa Rural Lydia Cheula
VAEO - Ihemi Village - Iringa Rural 0787 097210
03/30 Iringa Rural Jackson J. Owimbe Farmer - Ilawa Village - Kilolo 0763 299919
03/30 Arusha Issuja, RJ Incharge; Marketing and Records
0755906449
04/02 Mtwara Mr. Henjewele Regional Cooperative Officer +255784340438 +255754340438
04/02 Mtwara RAS

124
04/02 Mtwara Peter Lunguyu Acting DALDO
04/02 Mtwara Mr. Jaffari Nmuko Mtwara Rural Cashew Crop Specialist
+255787466225
04/02 Mtwara Mr. Ephraim Lema NMB Mtwara Branch +255782224767 +255767224764
04/02 Mtwara Mr. Shabir Abbassi Export +255784640190
04/02 Mtwara Said Menga, Sharifa Mohamed,
MRAITF
04/02 Lilongwe - Malawi Erica Maganga
Principal Secretary - MAIWD -Malawi +265 1789033/1788461
04/02 Karatu Malamsha Fraterin District Agriculture Officer; in charge NAIVS
0784 592164; 0654130061
04/02 Karatu Suleiman Lema Financial Administrator and Manager Microfinance; KDA
0754 882164
04/02 Karatu Mr. Tipe KKKT Mbulumbulu SACCOS
04/03 Naliendele Zachary Mbunda ARI Naliendele +255784443742
04/03 Namguruwe Informal discussion with farmers
+255787928041 +255778477574
04/03 Mtwara DED Introduction of the survey
04/03 Mtwara MAMCO
04/03 Mtwara Mr. Kasoyaga CRDB Mtwara Branch +255755948650
04/03 Lilongwe - Malawi Jeffrey Luhanga
Principal Secretary II MAIWD - Malawi
+265088623353/88882353
04/03 Karatu David Hhando Yarot Agro Dealer, Karatu Town 0754 578452; 0785 700039
04/03 Karatu Tarsila Massawe Agro Dealer, Karatu Town 0753985594
04/03 Karatu Nehemia Tlatlaa Chairperson, Rotian Farmer Group
04/03 Karatu Deogratias Mao Rotian Farmer Group
04/03 Karatu Hemedi Okasha Rotian Farmer Group
04/03 Karatu Asteria Slaa Rotian Farmer Group
04/03 Karatu Fabiola Delli Rotian Farmer Group
04/03 Karatu Lucia John Rotian Farmer Group
04/03 Karatu Virjiana Yona Rotian Farmer Group
04/03 Karatu Imbori Gamung Rotian Farmer Group
04/03 Karatu Julius Sippu Rotian Farmer Group
04/03 Karatu Boay Tlatlaa Rotian Farmer Group
04/04 Mtwara Jaffari Ramadhani Matata
Input specialist Cashew Nut Board
+255786264499
04/04 Mayanga FGD with primary society +255784919794
04/04 Mtwara Mukpa Input supplier
04/04 Lilongwe - Malawi Daisi Kachingwe
Principal Economist - MAIWD - Malawi +265 0993 937962
04/04 Lilongwe - Malawi Phiku Kavinyu Economist - MAWID - Malawi +265 0999 399310
04/04 Lilongwe - Malawi Michael Makina
Trade Officer - MAIWD - Malawi +265 0999 895947
04/04 Lilongwe - Malawi Osborne Tsoka
Officer-Inputs Subsidy Department, Coordinating Unit
04/05 Mtwara MoCrops
04/05 Mtwara Eng. Lusake Cashew Input Fund +255718581807
04/05 Mtwara Yassin Mwakalinga Regional Cooperative Officer +255766058575 +255718700660
04/05 Arusha Mrs. Asnath B. Head PEPQS 0754372631

125
Uronu
04/05 Arusha Ben Ngowi
Plant Biosafety Inspector, PEPQS
0754399000; 0716254211
04/05 Arusha Oshingi Shilla
Plant Biosafety Inspector, PEPQS
0787229344; 0652269344
04/10 Arusha Mr Anup Modha GM Minjingu Mines & Fertilizer Ltd
+255 784 655000
04/10 Meru Aichi Maeda Veterinary Input Trader 0784319991
04/10 Meru Edwin Wilson Agro Input Dealer 0764526798
04/10 Arusha
Wycliff Mukangai
Sales and Marketing Manager, East African Seeds (T) Limited
0787 558864
04/10 Arusha
Roland Kileo
Kibo Trading and Services Limited
0754316956
04/10 Arusha
Muschi B. Casmir
Dekalb Hybrid Seeds (Monsanto) Sales and Marketing Officer,
0754 370480
04/11 Nairobi Kenya
Mr James Mutonyi Mr Hezbourne Ong’elleh
CEO AGMARK Kenya MD Breinscope Consultants
+254 721 653250 +254 733 602678 +254 725 710 409 +254 733 774 768
04/11 Machakos Kenya
Mr Philip K. Tonde Managing Director Nduki Agrovet
+254 723 743 936 +254 710 863 279
04/11 Arusha Mrs Blandina Mushi Purchasing Manager- TFA Arusha
04/11 Arusha Jerome Maimu M.D TFA +255 784 860 484
04/11 Meru Hezekiel J. Mwenda Manager, Milk Collection MEDAFA
0762399138
04/11 Meru Kundaeli M. Nnko Member - MEDAFA 0765184878
04/11 Meru Ndeta M. Urio Member - MEDAFA 0784605797
04/12 Nairobi Kenya
Mr Patrick Kimani Mr Isaac K. Mwihia
CEO KLPA CEO Lari Dairies Alliance Limited
+254 722 310 996 +254 721 302 589 +254 735 469 746
04/12 Arusha Chacha W. G Managing Director, Meru Agro Tours and Consulting Co. lTD
+255 754 688642 +255 784 688642
04/12 Arusha Deatus Agro Vet & ABCD Consultants +255 786427017
04/12 Arusha Gesso H. Bajuta Managing Director, Bajuta International (T) Ltd
+255 754 266810 +255 784 484825
04/13 Nairobi Kenya
Ms Lucy Mwangi + Members of staff
KENFAP +254 722 851433
04/13 Arusha Mr Bob Shuma Executive Secretary - TASTA +255 713563320
04/13 Moshi Francis L. Mollel
Branch Director, CRDB Bank Limited, Moshi Branch 0784428000
04/13 Moshi
Adolph A. Kumburu
Director General, Tanzania Coffee Board
0756444099; 0786444599
04/13 Moshi
Gabriel E. Ulomi
Manager, G32 KNCI-JVE Ltd
0754603876
04/19 Dar es salaam
Josefynn Miingi-Kaiza
CEO BRITEN +255 788 650 103 +255 753 876 351
04/19 Dar es salaam
Mr Komba Canuth Director of Seed Unit, MAFSC +255 784 509420
04/19 Dar es Ms Msabaha +255 754372531

126
salaam
04/19 Dar es salaam
Mr Allen Tanzania Investment Bank +255 786322449
04/20 Dar es salaam
Dr Mr. Salum Diwani
By-Trade – Executive Director +255783424905