distribution of grain - census · thiseport r on the distribution of grain is one of a series of...
TRANSCRIPT

U.S. DEPARTMENT OF COMMERCE
Daniel C. Roper, Secretary
BUREAU OF THE CENSUS
William Lane Austin, Director
FIFTEENTH CENSUS OF THE UNITED STATES
CENSUS OF DISTRIBUTION
AGRICULTURAL
COMMODITY SERIES
DISTRIBUTION OF GRAIN
UNITED STATES
GOVERNMENT PRINTING OFFICE
WASHINGTON : 1934
For sale by the Superintendent of Documents, Washington, D.C---------- Price 5 cents

CONTENTS
Page.
Introduction----------------------------------------------------------------------------------------- 3.
Scope of the Census of Distribution-------------------------------------------------------------- 3.
Purpose of the series----------------------------------------------------------------------------- 3.
Scope and purpose of this report------------------------------------------------------------------ 3.
Method of taking Census of Distribution--------------------------------------------------------- 4
Schedules used.----------------------------------------------------------------------------------- 4
Classification of elevators------------------------------------------------------------------------- 4
Economic Importance of Grain Production-------------------------------------- ---------- ----- - - - 5
United States production of grain-------------------------------------- - -- --- -- ------------ -- - - - - 6
Harvesting methods------------------------------------------------------------------------------ 7.
Winter wheat------------------------------------------------------------------------------------ 8.
Spring wheat------------------------------------------------------------------------------------- 9.
Corn--------------------------------------------------------------------------------------------- 9.
Oats--------------------------------------------------------------------------------------------- 9.
| Rye---------------------------------------------------------------------------------------------- 9.
Barley-------------------------------------------------------------------------------------------- 9.
: Production point marketing of grain------------------------------------------------------------- 10:
Elevators and Other Grain Assemblers--------------------------------------------------------------- 11:
- Wheat------------------------------------------------------------------------------------------- 11
Corn--------------------------------------------------------------------------------------------- 11.
i Oats--------------------------------------------------------------------------------------------- 12.
Rye---------------------------------------------------------------------------------------------- 12:
Grain elevators------------------------------------- S------------------------------------------ 12,
Summary of the data on grain assemblers----------. QQ ------------------------------------------ 13:
Elevators by type of control------------------------. ------------------------------------------ 15.
Retail sales by elevators----------------------------- ------------------------------------------- 16
t Leading elevator States------------------------------------------------------------------------- 16
| Cooperative elevators---------------------------- ------------------------------------------------ 18,
Size distribution by type------------------------------------------->*----------------------------- 19
Relation of expense to Sales by size and type----------------------------------------------------- 20.
Data on the wholesale trade in grain------------------------------------------------------------- 20.
Milling or Processing of Grain------------------------------------------------------------------------ 22
'Tables:
1.-Assemblers of grain-United States Summary------------------------------------------------- 24
2.-Grain elevators-Number, total volume of business, sales, and expenses, 1929----------------- 26
3.-Elevators—Number, by type, total volume of business and retail sales, 1929, by States and
counties------------------------------------------------------------------------------------ 28
4.-Grain elevators-Number, sales to dealers and expenses, by size of business, 1929-------------- 41
| 5.-Cooperative elevators reporting grain sales separately, 1929-Number, sales, and expenses, by
i size of business----------------------------------------------------------------------------- 42
6.-Grain cooperatives-Number, membership, and Sales, 1929, by States------------------------- 43
7.-Wholesale trade in grain, 1929, by States------------------------------------------------------ 44
2

THE DISTRIBUTION OF GRAIN
By CHARLES D. BOHANNAN, In charge of Agricultural and Rural Distribution
INTRODUCTION
This report on the Distribution of Grain is one of a series of reports on the
distribution of agricultural commodities issued by the Bureau of the Census.
These reports represent one phase of the work of the first Census of Distribution,
taken in 1930, and cover the operations of assemblers and distributors of agri
cultural commodities for the year 1929 or the crop year most closely corresponding
thereto. This report has been prepared under the supervision of Robert J. McFall,
chief statistician for distribution, by Charles D. Bohannan, in charge of agricul
tural and rural distribution.
Scope of the Census of Distribution.—The Census of Distribution is based on a
canvass of establishments made by enumerators early in 1930 as a part of the
Fifteenth Decennial Census of the United States. This CENSUS covered all types
of assemblers and dealers where such persons and firms had established places
of business; but did not cover storage or warehouse concerns, the transportation
business, or strictly service business.
Purpose of the series.-The purpose of the series of reports on the distribution
of agricultural commodities is to present a unified picture of the distribution of
the major agricultural products, such as will be of the greatest value to individuals,
firms, and organizations concerned with any phase of the industry including
producers, buyers, dealers, manufacturers, and consumers, as well as to students
of the economics of Agriculture in its relation to the broader problems of our
national economic life. To that end the reports include not only the tabular
presentation of the data from the Census of Distribution and the other related
economic data, but also incorporate such analytic and descriptive material as is
felt will aid in the interpretation of the problems arising in connection with the
distribution of the various products. In addition to this report on the Distribution
of Grain, the series includes the following reports: The Assembling of Butterfat
Through Cream Stations; City Distribution of Fluid Milk and Cream; Distribution
of Butter, Cheese, Evaporated and Condensed Milk, and Ice Cream; Distribu
tion of Livestock (including the earlier reports on Direct Receipts of Livestock
and Retail Slaughter of Meat Animals); Assembling of Agricultural Commodities
by Retailers; and Cooperatives as a Factor in the Distribution of Agricultural
Commodities. -
The reports in this series present the distribution data as gathered on the
Census of Distribution schedules and as obtained by certain supplementary
inquiries addressed to various classes of buyers, assemblers, dealers, and other
distributors of the various agricultural commodities at wholesale and also at
retail in cases where the agricultural product concerned is sold at retail to con
sumers in practically its original form or after a preliminary processing form.
Scope and purpose of this report.-The chief purpose of this report is to present
the data on the assembling and distribution of grain, secured by the Census of
Distribution. However, in order that these data May be better interpreted and
analyzed in relation to the problems of the grain situation in their entirety, certain
additional data also from official sources are included. Naturally it is not possible
within the scope of such a report as this to cover clearly and in detail each phase
of the very important business, or rather group of businesses, engaged in the
process of assembling, storing, transporting, selling, and milling grain, and in
storing, transporting, and distributing the mill products-foodstuffs and feed
stuffs, and the many other products made therefrom. The transportation and
storage industries, as such, were not covered by the Census of Distribution nor
were Mills, bakeries, and like industries, although the latter are covered by the
Census of Manufactures. On some other phases of what one might call the grain
and grain products industries and the allied services of storage, transportation,
finance, and communication, neither the Bureau of the Census nor any other
Government agency at present secures reports which would make possible, even
if space permitted, the presentation of a complete picture of this extremely
important economic activity.
3

4 CENSUS OF DISTRIBUTION
As already noted, this report covers principally the data on assemblers of and
dealers in grain. It thus presents data on grain elevators (independent, line, and
cooperative), and on grain commission firms, grain brokers, and other dealers in
grain. The Census of Distribution did not cover, either in the case of grain or
other commodities, the brokerage houses whose function it is to execute buying
and selling orders on the commodity exchanges.
Method of taking the Census of Distribution.—The business data were reported
on schedules by enumerators who called at the place of business or office of the
individual, firm, or organization. The CENSUS, perforce, had to be taken on the
establishment basis and hence it is not to be expected that reports were secured
from a rather large group of individuals who, while they play a considerable part
both in the assembling of agricultural commodities and in retailing, have no
established place of business. Thus it is not to be expected that Census of
Distribution reports were received covering the 1929 business of track buyers
and-or truck buyers of grain who maintain no regular place of business.
Schedules used.-In securing the reports on the grain business in places under
10,000 population the schedules used were the same as those used for all kinds
of assemblers, wholesalers, and retailers in the smaller places. A general omnibus
schedule was used for all kinds, types, and classes of assemblers, wholesalers and
retailers. This schedule did not provide place for reporting either the amounts
or the value of commodities sold, by kind.
In cities of over 10,000 population differentiated schedules were used for the
wholesale and retail trades. These schedules did provide for the break-down of
sales by commodities.
While it is thus apparent that the schedules were not especially designed for
securing reports on the grain business they did nevertheless cover the essential
business data for assemblers of and dealers in grain with the exception of the
commodity break-down of sales. That is, the schedules used provided for
securing the name; address; kind of business; number of establishments; data
organized; number of employees (full-time and part-time); salaries and wages;
rent paid, if any; interest on any money borrowed for the conduct of the business;
total sales, subitemized as to cash and credit Sales; Sales to other dealers; sales to
retailers; and a list of the principal commodities handled.
Under the general inquiry as to character of organization, provision was made
for reporting whether or not the business was operated by an individual, partner
ship, incorporated company, or cooperative. Further, where a cooperative was
a branch or unit of another cooperative, space was provided to give the name and
address of such other cooperative.
In the case of line elevators many of the reports were secured by the enum
erators from the central office, that is, from the office of the company operating
the line. Some few line-elevator reports were received from enumerators who
had secured them from the local line-elevator managers. However, since the
schedule itself provided a place for reporting the name and address of the line
company it was readily possible to check these against the reports received direct
from the offices to avoid duplication. In most cases the enumerator, or other
person filling out the report, was quite careful to write, under the general descrip
tion of the business, the words “grain elevator” wherever the country buyer of
grain was reported as actually operating an elevator. Although this was not
done in all cases it was possible to check a considerable number of these to other
authentic sources of information.
Classification of elevators.—However, it is possible that in the tables presenting
the data on elevators some actual elevators May have been omitted due to lack of
sufficient information on the schedule to permit their classification as such. It
will be noted that these tables present data for three types, namely, independent,
line, and cooperative. The term “independent elevator”, of course, refers to the
individually owned elevator. Those included under “cooperative elevator’’ are
those which were thus reported, but it should be specifically noted that the
Census of Distribution made no inquiry as to the degree of farmer control of these
elevators. It is also probable that a number of farmer cooperative elevators are
not here classed as cooperatives, because on the schedules they were simply
designated as “farmers’ elevator” without indicating that they were cooperatives.
Since it is well known that many privately owned elevators bear the name
“farmers’ elevator” it was impossible to classify an elevator as a cooperative
simply because the report was returned as “farmers’ elevator”.
The term “line elevator” refers to one of a group or chain of elevators operated
by a firm of grain dealers, or by a mill or milling company. There is considerable
variation in the number of elevators operated by different elevator companies
ranging from only a few in some cases to several hundred in others.

DISTRIBUTION OF GRAIN 5
Strictly speaking, the use of the term “line elevator” should be confined to
those elevators whose operations are directed from a central office. But it
is conceivable that an independent elevator company May own 2, 3, 4, 5,
or more elevators, each of which operates to all intents and purposes as a
single elevator. For CENSUS purposes, however, it was necessary to classify any
group of three or more elevators as a line elevator company; hence independent
elevator companies operating more than two units were thus automatically
designated as line elevators.
ECONOMIC IMPORTANCE OF GRAIN PRODUCTION
The production, distribution, and utilization of grain, expecially of wheat, the
great breadstuff, have been matters of vital concern to public administrators, as
well as to producers and consumers, since the early dawn of history. As regards
Wheat the problems relating to its source of supply, the amount of production,
and its storage, from times of plenty to those of shortage, have given rise to whole
schemes of colonization, taxation, governmental regulation, and in fact, to wars,
both actual military wars and class, social, and economic wars. Some of the
earliest contentions between Greece and her neighbors were over the wheat
situation. Undoubtedly the development of an armed merchant marine and of
agricultural colonies by Greece were the direct outgrowth of the need for increasing
the supply of this important foodstuff for her increasing population.
One of the earliest government attempts at wheat control is related in the
familiar Bible narrative of the food administration of Joseph in the land of
Egypt. The wheat plains of southeastern Europe have been the bone of con
tention between numerous powers, ancient and modern.
Within our own country wheat and the problems incident to its production,
transportation, and sale have given rise not only to numerous inventions but also
to legislation and regulation. Drastic increases in production with equally
drastic declines in price have brought with them social and economic legislation of
vast importance. Wheat being a necessity or what amounts to the same thing
being thought a necessity in our national diet, became one of the chief cash-crops
of a large section of our farm population.
Its ready sale led to the opening up of NEW wheat lands and revolutionary
improvements in harvesting methods. On the other hand the distribution of this
highly important and necessary commodity and its manufacture into various
products have absorbed the attention and activities of many individuals, firms,
and corporations—which have not always been above exploiting, or taking
advantage of the producer on the one hand and the consumer on the other.
Hence, conditions have at times arisen which occasioned much controversy
and have resulted in a mass of State and National restrictive or regulatory
legislation. Naturally too, the importance of wheat to producers and consumers
has not escaped the attention of the practical and not alwaysscrupulous politician.
Just as in Rome, men and parties stayed in power or rose to power on the basis of
grants of free wheat and other foodstuffs, so in this country there have been many
men and several great political movements which in the last analysis are seen to
rest on this question of the importance of wheat.
While data are not available to show all the details the following summary
table, taken from the Census of Manufacture, will at least serve to indicate in a
general way the importance of the grain and grain products industries in our
national economic life.
SUMMARY—GRAIN AND GRAIN PRODUCTS INDUSTRIES, 1929
Number * -
* Total volume of Employ-Salaries andINDUSTRY #£ business ees wages
Assemblers of grain------------------------------------ 11,603 || $1,660, 155,521 24,605 || $27,804, 753
Dealers, agents, and brokers in grain------------------- 1, 174 2, 573,823, 162 12,099 26,659,217
Flour and other grain-mill products--------------------- 4,022 | 1,060,269, 418 35,792 || 55,667, 341
Feeds, prepared, for animals and fowls------------------ 750 402, 752, 534 14,384 22,400, 452
Cereal preparations------------------------------------ 121 175,223, 126 8, 158 12,230,685
Bread and other bakery products---------------------- 20,785 | 1,526, 110,811 222,482 324, 446, 346
Macaroni, spaghetti, vermicelli, and noodles----------- 353 47,074, 230 5,964 7,687, 109
Malt--------------------------------------------------- 28 23,602,938 741 1,670, 441
Corn sirup, corn sugar, corn oil, and starch 1------------- 35 165,983,739 8, 218 | 14,009, 167
1Includes a small quantity of potatoes and other starches in addition to cornstarch.

6 CENSUS OF DISTRIBUTION
United States production of grain.—The following brief summary of grain
production figures for 1929, serves to give some idea of the size of the job of
assembling and shipping of grain to market or mill. It also shows something of
the significance of grain and its proper and economical marketing, not only to the
producers thereof, who form a large section of our agricultural population, but
also to the entire community in which grain forms a large and important element
of the cash farm-income, the size and stability of which, in turn, vitally affect the
life and trade of both the nearby towns and the larger cities, not only as reflected
in farm purchases, but also in the wage rolls of factories making goods needed by
farmers and in the city cost of living. Not only are grain production and prices
intricately related to those of flour and other foodstuffs made of grain, but also
those of meats, dairy products, poultry products, and the like, into whose produc
tion much grain enters, either as feed in the original form or as mill feeds or other
commercial feedstuffs.
The table shows for each of 5 important grains the number of farms reporting,
production, and the estimated farm value, together with the percentage which the
value of each kind was of the total. The data presented are taken from the
Census of Agriculture, 1930.
PRODUCTION OF GRAIN, 1929
VALU"E
Farms re- -
GRAIN # '"(number) Total Percent
of total
|
-
Total----------------------------------------- ------------ 4, 222,040,438 $3,054, 908, 337 100.0
1, 208,368 800,648,955 838, 506,124 27.4
4, 148,791 2, 130,751, 782 1,635,909, 664 53. 6
1, 518, 893 992, 746,912 410, 167,331 13.4
542,710 263, 589,965 140,982, 106 4.6
175, 184 34, 302, 824 29, 343, 112 1.0
From this table it will be noted that corn, which is extremely important
from the feed standpoint, is produced on a greater number of farms than is wheat,
and the value is greater. Wheat, however, is much more important in com
merce than is corn, only about 16 or 17 percent of the latter being shipped out of
the county where grown as compared to about 70 percent for wheat, according to
estimates of the United States Department of Agriculture.
The acreage devoted to wheat production, the total production of wheat of all
kinds over a period of years as recorded by the decennial censuses 1850–1930,
together with population data are given in the following summary which also
shows the percentage of increase from decade to decade and also the total increase
from 1850 to 1930.
PRODUCTION OF WHEAT As COMPARED WITH POPULATION BY DECADES
|
WHEAT 1
– | Per
CENSUS YEAR Product Per- Population ''
roduction cent - -
Acreage (bushels) in- crease
crease 2
-
Total 1850-1930---------------------------------------------------------- | 696.8 |-------------- 429.4
(3) 100,485,944 -------- 23, 191,876 --------
(3) 173, 104,924 72.3 31,443, 321 35.6
(3) 287,745,626 66.2 38, 558,371 22.6
35,430, 333 || 459,483, 137 59.7 50, 155,783 30.1
33,579,514 468,373,968 1.9 62,947,714 25.5
52, 588, 574 658, 534, 252 40.6 75,994, 575 20.7
44, 262,592 | 683, 379,259 3. 8 91, 972,266 21.0
73,099,421 945,403, 215 38. 3 105,710,620 14.9
61,999,908 800,648,955 | –15.3 122,775,046 16, 1
* Covers crop year preceding the CENSUS. * Not reported.
* A minus sign (-) denotes decrease.

DISTRIBUTION OF GRAIN 7
From this table it is seen that from 1850 to 1930 the population increased
by 429.4 percent, while the production of wheat in 1930 was 696.8 percent greater
than in 1850. The story told by the increase of wheat production from decade to
decade presents one of the most interesting pictures of economic development
and change due to changed methods of production and harvesting.
The exceptionally heavy production of wheat during the World War years
in certain States is of course a direct reflection of that event. The relatively
low production during 1919 in Minnesota, North Dakota and South Dakota was
due to especially poor crop conditions. In fact, examination of data for individual
years shows a considerable fluctuation in wheat production even from year to
year with the same, or approximately the same, acreage on account of favorable
or unfavorable crop conditions. Wheat is a very good illustration of the risks
the farmer encounters in his business undertakings as contrasted with the manu
facturer or other business man, and also illustrates the difficulties of crop pro
duction control. With an acreage smaller than usual, extremely favorable crop
conditions and harvesting conditions May give a decidedly larger than average
production, or the reverse May occur.
The rapid expansion of wheat production during and especially immediately
after the Civil War brought with it tremendous changes in the economic life of
various States, in fact of the entire Nation itself. As already noted in the intro
duction this has had profound effects on social conditions, politics, and legislation.
The most important factors underlying this rapid expansion of wheat acreage and
production were: The greatly improved harvesting methods; the opening up of
the Western farm lands, largely under the Civil War veteran homestead act;
the development of transportation which made it possible to transport fuel to
the colder sections of the Northwest, and the wheat produced there, back to the
consuming centers and the export markets; and the rapid growth in the popula
tion, due to immigration.
Harvesting methods.—Prior to the development of the reaper (1831), and the
binder (1870), the implements of wheat harvesting were practically the same as
those used by the ancient Egyptians and the Grecians and their subject or allied
nations—the sickle, scythe, and cradle, with the flail or flocks of goats and sheep
as the available means of threshing out the grain. The amount of wheat one
man could produce was pretty well limited by the amount he could harvest.
SHIFT IN WHEAT PRODUCTION—5 LEADING STATES IN PRODUCTION OF WHEAT
AT EACH CENSUS, 1840–1930
[Bushels expressed in thousands]
[5 leading States in each year, in italics]
1840 1850 1860 1870 1880
STATE
Bushels | Rank Bushels | Rank Bushels | Rank Bushels | Rank Bushels | Rank
Ohio---------------- 16, 572 1 14,487 2 15, 119 4 27,882 3 46,015 3
Pennsylvania------- 13, 213 2 15, 368 1 13,042 6 19,673 6 19.462 10
New York---------- 12,286 3 13, 121 3 8,681 7 12, 178 11 11,588 13
Virginia------------- 10, 110 4 11,213 4 || 1 13, 131 5 * 12 7, 826 16
Kentucky----------- 4,803 5 2, 143 11 7,395 10 5, 15 11,356 14
Indiana------------- 4,049 7 6, 214 6 16, 848 2 27, 747 4 47, 285 2
Illinois-------------- 3,335 9 9, 415 5 23, 837 1 30, 128 1 51, 111 1
Michigan----------- 2, 157 10 4,926 7 8,336 9 16, 266 9 35, 533 4
Missouri------------ 1,037 13 2,982 10 4, 228 15 14, 316 10 24,967 8
Wisconsin----------- 212 21 4, 286 9 15,657 3 25,606 5 ,885 9
Iowa---------------- 155 24 1,531 15 8,449 8 29, 436 2 31, 154 6
Minnesota-------------------------- 1 33 2, 187 17 18, 866 7 34,601 5
California---------------------|------ 17 32 5,928 12 16,677 8 29,018 7
North Dakota ?-----|----------|------|---------------- 1 41 171 38 2,830 22
South Dakota”-----|----------|------|----------------|----------------|----------------|----------|------
|Kansas------------------------------|---------------- 194 31 2,391 18 7, 324 11
Nebraska------------------------------------------- 148 32 2, 125 22 13,847 12
Oklahoma-------------------------------------|------|----------------|----------|----------------------
Texas---------------|---------------- 42 29 1,478 19 415 29 2,568 23
1 Includes West Virginia.
T. North Dakota and South Dakota admitted as States in 1889; figures for 1880, 1870, and 1860 are for Dakota
erritory.

8 CENSUS OF DISTRIBUTION
SHIFT IN WHEAT PRODUCTION—5 LEADING STATES IN PRODUCTION OF WHEAT
AT EACH CENSUS, 1840–1930–Continued
[Bushels expressed in thousands]
[5 leading States in each year, in italics]
1890 1900 1910 - 1920 1930
STATE
Bushels | Rank Bushels | Rank Bushels | Rank Bushels | Rank Bushels | Rank
Ohio---------------- 35, 559 5 50, 377 3 30,664 9 58,124 6 30, 290 9
Pennsylvania------- 21,595 10 20,633 12 21,564 11 23,454 13 17,411 15
New York---------- 8,305 17 10,413 20 6,664 21 9, 136 23 3, 818 26
Virginia------------- 7,904 | 20 8,908 || 23 8,077 | 18 11,446 - 20 8,575 21
Kentucky----------- 10,707 13 14, 265 17 8,739 17 10,375 21 2,483 28
37,319 4 34,986 7 33,936 8 45,208 8 25, 190 12
37,389 3 19,796 15 37,831 7 70, 891 2 30, 151 10
24,771 9 20, 535 13 16,026 12 20.412 15 13,711 18
30, 114 7 * 9 29,837 10 65. 210 4 15, 117 17
Wisconsin----------- 11,699 12 9,005 22 2,641 27 7,328 25 1,836 31
Iowa---------------- 8, 250 19 22,769 10 8,056 19 21, 592 14 7,990 22
Minnesota---------- 52, 300 1 95,279 1 57,094 3 37,616 10 19,760 14
California----------- 40, 869 2 36,534 6 6,203 24 16,867 19 || 10, 958 19
North Dakota ?----- 26,403 8 59,889 2 | 116,782 1 61, 540 5 95, 574 2
South Dakota ?----- 16, 541 11 41, 889 4 47,060 5 31,087 12 34,045 8
Kansas-------------- 30,400 6 || 38,778 5 | 77,577 2 148,476 1 | 1.48, 483 1
Nebraska-----------| 10,571 || 14 24,925 8 47,686 4 57,844 7 | 53,868 3
Oklahoma----------- 30 42 | 3 20,328 14 14,008 13 65,762 3 51, 184 4
Texas--------------- 4, 283 23 12, 266 18 2,561 29 36,427 11 44,078 5
2 North Dakota and South Dakota admitted as States in 1889; figures for 1880, 1870, and 1860 are for
Dakota Territory.
3Includes Indian Territory.
The great increase in production possibilities through improved methods of
harvesting, the opening up of western lands, and the increase of farm population,
not only increased the amount of wheat available for consumption in this country
and for export, but also caused radical shifts of farm production in some of the
older States. This is well brought out by the table on page - showing the
leading wheat States and their total production of wheat at different periods.
It should also be noted that not only did wheat production expand rapidly in the
Ohio Valley States and a bit later in Wisconsin and Michigan, but the movement
did not stop there. With the railroad and coal transportation developments
wheat production expanded by leaps and bounds beyond the Mississippi. Ohio,
Indiana, Illinois, and even Wisconsin, once the leaders, declined rapidly in
relative importance. These States could not compete with those further to the
West and Northwest.
Great hardships were endured by many of the farmers in these wheat States
and they were forced, as had been farmers further east at an earlier date, into
other lines of production. The great dairy industry of Wisconsin was one out
come of this situation, as was still later on a similar development in dairying in
Minnesota and Iowa, and to a lesser, but still quite important extent in certain
sections of North Dakota, South Dakota, and Nebraska.
The shifting of wheat to Minnesota and the Dakotas gave rise to the great
milling industry and general grain trade of Minneapolis. Later the production
of winter wheat extended further South and West to Kansas and Oklahoma and
was accompanied by the development of still other important mill centers.
Winter wheat.—Winter wheat, which in 1929 formed slightly over 71 percent
of the total wheat production of the United States, is of several kinds, the prin
cipal ones of which are the hard red winter wheat, the soft red winter wheat,
common white wheat, and the so-called white club wheat.
The 5 leading winter wheat States in 1929 were as follows: Kansas, 147,957,561
bushels; Nebraska, 51,115,355; Oklahoma, 50,829,240; Texas, 43,979,208; and
Ohio, 29,962,671. These 5 States produced 56.8 percent of the total production
of winter wheat in the United States.
The principal Winter Wheat Belt extends from the northern part of Texas up
through Oklahoma (which has within recent years greatly increased its wheat
production), through Kansas and Nebraska, with some raised in South Dakota.
Throughout this region the chief kind of winter Wheat is the hard red winter
wheat which from the standpoint of milling quality is next in importance to the

DISTRIBUTION OF GRAIN 9
hard red spring wheat. In eastern Kansas, northeastern Oklahoma, Missouri,
Illinois, Indiana, and Ohio the chief kind of wheat is the soft red winter wheat
and this is also true of most of the other eastern and southern States where wheat
raising is of any importance, although in some of them common white wheat
predominates.
The common white wheat and white club wheat are raised chiefly in the great
wheat producing areas lying in central and southeastern Washington, central
and southern Idaho, and the northernmost counties of Oregon. These two
wheats being relatively low in protein content are especially adapted to the
making of pastry and cake flour.
Spring wheat.—Although considerably less in total production than the
different kinds of winter wheat, spring wheat is of great value in flour manufac
ture on account of the higher protein content. In fact, in some of the spring
wheat areas especially high protein-content wheats are raised which generally
command a substantial market premium.
The most important parts of the Spring Wheat Belt are southern and western
Minnesota, the eastern half of South Dakota, North Dakota, with a considerable
extension into Montana. Some spring wheat is, of course, raised in other
States with the principal regions being in Colorado, Nebraska, Iowa, northern
Illinois, and Wisconsin, as well as some in New Mexico, Wyoming, Washington,
and Oregon. The principal kind of spring wheat is the hard red type. A
special kind of spring wheat is durum, which is exceptionally high in protein
content, being used for the making of semolina flour, the manufacture of maca
roni, spaghetti, and the like.
Corn.—Corn, the most commonly produced of all the grains, according to the
Census of Agriculture was reported by 4,148,791 farms in 1929 as compared
with 1,208,368 reporting the production of wheat, and 1,518,893 reporting the
production of oats. While some corn for grain is produced in every State in the
Union, the great Corn Belt lies on each side of the Mississippi, including on the
east, Tennessee, Kentucky, Illinois, and Indiana, and on the west, Missouri,
Kansas, Nebraska, Iowa, and certain sections of Minnesota.
The 5 leading States in total production in 1929 were: Iowa, 389,000,414
bushels; Illinois, 275,850,367 bushels; Nebraska, 216,020,274 bushels; Indiana,
114,871,320 bushels; and Missouri, 112,348,071 bushels. The total production
in these 5 States was 1,108,090,446 bushels, and represented slightly over one
half of the total United States production. Some of the other States important
in corn production in addition to those mentioned are Minnesota, Ohio, Kansas,
South Dakota, and Texas in the order given. As previously noted under the
discussion of changes in wheat production there has been, within recent years, a
considerable increase in production of corn, both for grain and for silage, in
Minnesota, South Dakota, and certain other States.
Oats.—This grain, like corn, is a great feed crop, and as noted later in the
discussion of local marketing, by far the greater part of the total production of
oats is used for that purpose either on the farm where raised or on nearby farms,
or in commercial feedstuffs. The United States production of oats in 1929 was
992,746,912 bushels. With certain exceptions the chief producing regions for
this grain are the same as those for corn, as that is the great general farming and
livestock finishing region. There are certain kinds of oats which can be raised
in colder regions than the ordinary corn, so that a relatively heavier production
of oats than of corn is found in Minnesota. The 5 leading oats States in order
of their importance in 1929 are: Iowa, Illinois, Minnesota, Nebraska, and Wis
consin. There are a considerable number of other States, each of which pro
duced 25,000,000 bushels or more; and in addition there are sections in certain
States which are heavy oats producing regions such as the Snohomish and
Skagit county sections of the State of Washington and certain counties in
Oregon. The cool damp climate of these Pacific coast counties is especially
adapted to heavy oats yields. -
Rye.—The total 1929 production of rye amounted to 34,302,824 bushels.
This production was less than one half of the 1919 production which was
75,992,223 bushels. While rye is produced throughout the entire United States,
there are only a few States in which it assumes large proportions. The chief
rye producing States based on 1929 figures are North Dakota, Minnesota,
Nebraska, South Dakota, and Wisconsin; these 5 States produced about two
thirds of the total crop.
Barley.—The total production of barley considerably exceeds that of rye
because of its variety of uses. The 1929 production of this grain was 263,589,965
27222–34–2

10 CENSUS OF DISTRIBUTION
bushels. The principal barley States are Minnesota, North Dakota, South
Dakota, California, and Wisconsin; although Iowa, Nebraska, and Colorado are
also quite important in barley production.
Production point marketing of grain.—As shown in the table, page 6, the
total 1929 production of the principal grains as reported to the Bureau of Census
was 4,222,040,438 bushels. Of these, wheat is the most important from the
standpoint of commerce and distribution. According to the estimates of the
United States Department of Agriculture, 69.6 percent of the 1929 wheat crop
was shipped out of the county where grown, which would mean that 558,052,322
bushels were marketed elsewhere.
The annual harvesting of wheat starts well to the South and moves northward
slowly for a while and then advances rapidly to the northern part of the great
Wheat Belt. The date and length of harvest, of course, depend to a considerable
extent on weather conditions. Wheat harvest in its rapid conversion of the crop
into cash is of great importance not only to the wheat farmer but to the economic
life of the region in general, affecting as it does the small-town merchants, Banks,
and railroads. Good prices for wheat mean prosperity not only for the wheat
farmer but, in many counties and States, prosperity for the small-towns and cities,
as well as for cities farther east which in turn supply goods to the merchants and
farmers. On the other hand, drastically reduced prices slow down business not
only in the Wheat Belt, but their effects are felt quite sharply elsewhere. One
illustration of this will suffice at this point, namely, that of a small town in the
Wheat Belt in Nebraska at the time of the decreased market wheat prices in
1921. A local farm-implement dealer in this small town stated to the writer that
for a period of years at wheat-harvesting time his average sale of wheat binders
had been 30; while that year he had sold but 1. Multiplying the effects felt in
this very small place in the great wheat region by similar situations throughout
its entirety, we get a very fine illustration of the importance of Agriculture to our
entire economic welfare.
By June wheat harvest is well under way in some of the great wheat States;
and from that time on until its close in the northern wheat States there is a
very heavy movement of wheat to market. In some counties wheat is marketed
at the local mill, for which the farmer receives cash or flour and feedstuffs, or
credit to be used for such purchases later. However, by far the greater part
of wheat is handled by the local elevators or other assemblers, who ship the
wheat to Mills or grain dealers at various milling or market centers.
According to estimates of the United States Department of Agriculture the
disposition of the 1929 wheat crop was as follows: 10.2 percent used for seed;
6.9 percent fed to livestock; 0.8 percent loss, waste and shrinkage; 1.1 percent
ground for home use or exchanged for flour; and 81 percent marketed. As shown
by their estimates, by far the greater part of the wheat marketed leaves the farm
during or shortly after harvest. In fact, during the 2 months of July and August
it is estimated that 50 percent of the total wheat crop moves to market, and by
the end of October, slightly over 70 percent.
Additional light on the rate of marketing wheat crops is shown in the following
table by months. This table shows the inspected receipts of wheat at all inspec
tion points in the United States by months for the 1929–30 crop year, as reported
by the United States Department of Agriculture, and for comparative purposes
shows for the same year the monthly grindings of wheat as reported by the De
partment of Commerce. The table not only shows monthly receipts and grind
ings but the percentage which each represents of the total for the year. This
table shows quite clearly that the flour-mill consumption of wheat is much more
uniform throughout the year than are the market receipts. This means the
development in the large market centers of tremendous wheat-storage elevators.
1 Crops and Markets, March 1930, U.S. Department of Agriculture.

DISTRIBUTION OF GRAIN 11
MONTHLY INSPECTED RECEIPTS AND GRINDINGS of WHEAT, 1929–30
[Amounts expressed in thousands]
RECEIPTS INSPECTED GRINDINGS 1
MONTH P t P t -
ercen ercen
Bushels 0f total Bushels of total
Total-------------------------------------------------- 775, 527 100.0 527, 343 100.0
July-------------------------------------------------------- 209,371 27.0 42,895 8.1
August----------------------------------------------------- 152,871 19.7 50, 725 9.6
September------------------------------------------------- 82,242 10.6 47, 583 9.0
October---------------------------------------------------- 57, 525 7.4 50,445 9.6
November-------------------------------------------------- 32,495 4.2 43,912 8.3
December-------------------------------------------------- 40,912 5.3 41,062 7.8
January---------------------------------------------------- 29,461 3. 8 43,812 8.3
February--------------------------------------------------- 35,931 4.6 40, 506 7.7
March------------------------------------------------------ 25,663 3.3 43,083 8.2
April------------------------------- - 22,629 2.9 41, $54 7. 9
30, 615 4.0 | 41, 329 7.8
55,812 7.2. 40, 137 7.6
1 Represents approximately 94 percent of the total output of wheat flour.
ELEVATORS AND OTHER GRAIN ASSEMBLERS
The following summary shows the number, kind, and total business of elevators
and other country assemblers of grain as reported to the Census of Distribution.
Assemblers of grain are of various types including track buyers; truck buyers,
who buy at the farm and truck the grain to market; warehouses; and elevators.
Wheat.—As noted in this summary table and in the more detailed tables,
by far the most important class of local market outlet throughout most of the
Wheat Belt is the grain elevator. In the Pacific Northwest the elevator is not
so common as the warehouse, since most of the wheat raised on large wheat
farms is sacked and either stored on the farms (often in the open), bought and
stored by warehouse companies, or stored in the warehouse by the farmer. This,
of course, eliminated the necessity for the elevator, as it is known, throughout the
great middle western wheat country.
ELEVATORS AND OTHER ASSEMBLERS OF GRAIN IN THE UNITED STATES
TOTAL ASSEMBLERS ELEVATORS OTHER ASSEMBLERS
ITEM
Num- || Total volume || Num- || Total volume Num- |Total volume
ber of business 1 ber 0f business 1 ber of business 1
Total--------------------------- 11,603 || $1,660, 155, 521 9,457 $1,076,635,298 2, 146 $583,520, 223
1 Includes sales of grain, retail sales, and receipts (if any) from storage.
Corn.—Only about 17 percent of the total corn crop is shipped out of the
county where grown, according to United States Department of Agriculture esti
mates. Corn is the great feed crop just as wheat is the great foodstuff crop.
With the exception of certain areas quite favorably located as regards transporta
tion rates to market or Mills which grind corn for meal and the like, it is, through
out most of the great Corn Belt, cheaper to feed corn to swine or cattle than to
ship the corn to market. The principal corn markets from the standpoint of
# receipts, are Chicago, Kansas City, Omaha, Indianapolis, St. Louis, and
eorla.
The heavy movement of corn from the farms takes place in the 4 months,
November to February. Based on the estimates of the United States Depart
ment of Agriculture, it would appear that in the 1929–30 crop year 44.2 percent
of the corn marketed from the farms moved in these 4 months; and if October
is included, the total movement of corn in the 5 months was 51.1 percent of the
total corn marketed.

12 CENSUS OF DISTRIBUTION
Oats.-The major part of oats sold off the farm, like wheat, is marketed during
the first few months of the crop year. Thus, for the 1929–30 crop year, accordin
to the United States Department of Agriculture, nearly one third (30.9#of the total marketings moved in August; 13 percent in September; and 8.2
percent in October. If these estimates be applied to the entire supply of oats
marketed from the farms that year, it would mean that 52.1 percent, or slightly
over one half, moved to market these first 3 months of the season.
Rye.-Rye, unlike corn and oats, is produced principally for the market rather
than for use on the farm. This is indicated by the fact that market receipts of
rye in 1929 amounted to almost 80 percent of the amount produced. In 1929 the
rye production, according to the Census of Agriculture, was slightly over 34,000,
000 bushels; while total market receipts, according to the 1932 Annual Supple
ment of the Survey of Current Business, United States Department of Commerce,
amounted to 27,500,000 bushels.
Grain elevators.—When the first elevator was built does not seem to be a matter
of record. The elevator is so called because of the mechanical device used to
elevate the grain to bins from which it can be loaded into freight cars by gravity.
Accordingly the elevator must be located close to a railroad sidetrack or close
enough to a railroad line so that a switching spur can be run to it in order that
grain cars can be “spotted” on the track close enough to enable direct loading
from the elevator. This matter of a railroad siding and also that of having a car
at hand at the proper time for loading became matters of vital importance during
periods of contention between line elevators and farmer elevators (cooperative)
as well as between line elevators and independents. In some instances, because
of working relations between the railroad and the line-elevator companies, it
£ next to impossible for other elevators to obtain a site close enough to the
Tallroad.
The elevator ordinarily receives the farmers' grain by weighing the wagon or
truck load on a platform dump scale. The grain is then dumped into the pit
for elevation and the empty wagon or truck weighed. In most instances the farmer
is given a check for his wheat as soon as he has completed hauling. In many
parts of the Wheat Belt the grain is threshed in the field and immediately hauled
to the elevator and sold. In some instances, some of the larger elevators hold or
store grain on the farmer's account for later sale. The farmer selling to the
cooperative May, in some cases, receive only a partial advance on his wheat, the
Balance being settled later.
Country grain buying is frequently done on the card-price basis, according to
instructions or information sent out from the head office in the case of line eleva
tors, or price-card information from a market-news service, in the case of inde
pendents or cooperatives. The local price ordinarily represents the price at the
large market centers of the area, minus freight charges, handling charges, and the
like. There is generally a similar price difference between the primary market
and the terminal market.
Grain buying is done on grades established by the United States Department
of Agriculture as nearly as the local elevator manager can determine the grades.
These grades take into consideration kinds and varieties, the freedom from mixed
varieties, freedom from seeds and other foreign matter, weight, moisture,
brightness, odor, and the like. -
The grains were one of the first group of agricultural commodities for which
definite trading grades were established and they had been in existence years
before the setting up of Government standards and grades for agricultural com
modities. The very physical nature of grains, of course, lends itself to the estab
lishment of such grades as would facilitate trading by sample. This whole matter
of grades and standards is an extremely significant one in the selling of any kind
of commodity, agricultural or otherwise.
A standard grade, that is, a grade accepted by a majority of traders in a given
commodity, establishes, as it were, a common denominator. Whenever a crop
wheat, Cotton, tobacco, or what not—can be sold not merely as so much wheat,
Cotton, or tobacco, but as wheat, Cotton, or tobacco of a certain commonly
understood grade; it facilitates in a remarkable degree the sale thereof, as well as
simplifying the matters of storage, physical handling, finance, etc. Other things
being equal, the nearer the point of production the grading can be done, the less
expensive is the whole process of marketing.
Well graded representative lots can be safely handled on a narrower operating
margin than mixed ungraded lots. Ordinarily the total quantity of a produtc
contained in a mixed grade lot brings a smaller price than if the commodity firts
be sorted into standard grades. The reasons for this are obvious, since in exam
ining the mixed lot the buyer has no practical means, other than guessing, of

DISTRIBUTION OF GRAIN 13
knowing how much of each grade such a mixed grade lot contains. Hence,
the guesses and the prices offered always have to be very well on the safe side.
In short, it is not too much to say that the established system of the practically
universally accepted grain grades, plus the fact that the grain, if properly cared
for, will not deteriorate rapidly, form the basis which has made possible the
present rapidity with which grain can be sold, even by wire, cable, or radiogram,
and also largely accounts for the fact that the various grains can be handled on
probably the narrowest margin of any agricultural commodity. It also largely
underlies the whole matter of future trading.
While this is true, it is also true that the local elevator manager cannot always
determine grades with the highest degree of exactitude. Hence, the necessity for
greater leeway on the local buying price and hence, also the opportunity for the
development of suspicions among the growers to the effect that a particular
elevator manager or all of them at a given station are taking advantage of this
fact. Many bitter discussions and contentions have arisen over this matter of
grades, dockage, etc., at country buying points. An extreme case of the inability
to accurately determine grades at the local elevator is found in the important
matter of protein content, which it is practically impossible for the local elevator
manager to determine as it requires laboratory processes.
The handling by elevators of the other grains where grown and marketed is
similar to that of wheat.
Summary of the data on grain assemblers.—The Census of Distribution data
on all kinds of assemblers of grain for which reports were received are given in
table 1. This table presents data for the United States by States. Additional
details on elevators of various kinds are contained in table 2. Table 3 presents
detailed data by counties showing separately all counties from which reportswere received for more than two elevators.
According to table 1 there were 11,603 assemblers of grain in 1929 who had a
total business of $1,660,155,521, reporting 24,605 employees, full time and-or
part time, and payments in salaries and wages of $27,804,753. The total expenses
including salaries and wages, but not including cost of grain or other commodities,
were $55,599,798.
As noted in the introduction the Census of Distribution was taken on the
establishment basis and since some country buyers and other assemblers of grain
have no established places of business they are not here included.
The total volume of business figure May, and undoubtedly does, include some
business in the handling of other agricultural commodities than grain. However,
since the schedule used in all places of less than 10,000 population did not provide
for reporting a break-down of the sales of commodities it is impossible to show
separately the data for grain handled and for such other commodities as May
have been handled. “Total volume of business” includes the value of sales
made at retail. The schedule, however, did provide a place for reporting such
sales separately and the totals thereof are accordingly placed in the column
headed “Retail sales.” . By subtracting the total retail sales of $154,457,816 from
the total volume of business we find that total sales, by these grain assemblers, of
grain and other agricultural commodities and receipts, if any, from storage were
$1,505,697,705. This represents 90.7 percent of the total volume of business
while the retail sales represent 9.3 percent. For the United States, as a whole,
the average volume of business was $143,080; sales of agricultural commodities
averaged $129,768; and retail sales $13,312.
The ordinary average size local elevator does not require a large number of
employees. The average number, including both full-time and part-time, was
2, while the average of the salaries and wages paid was $1,130. The peak of
the employment load naturally comes during the heavy movement of grain
from the farm, especially that of wheat. Typical employee reports selected at
random show that in many cases the only regular employee is the manager,
and in others, depending on the size of the business in other agricultural com
modities and the retail trade, there are one or two full-time employees in addition
to the manager, assisted as the occasion demands by part-time help. On the
other hand, there are some elevators which do not remain open during what May
be called the “off” season. Since the taking of the Census of Distribution was
begun in the spring of 1930 it May be that for this reason some of these elevators
were not covered.
The expense figure May, it is felt, be safely considered as covering all expenses
incident to running the elevator business other than the cost of commodities
handled. This figure includes salaries and wages; rent paid, if any, for the use
of the premises; interest paid on money borrowed for the business; insurance;

14 CENSUS OF DISTRIBUTION
telephone rental; and the like. It should be noted here that the expenses include
both those for the handling of grain and for conducting the retail end of the busi
ness, if any. The expenses of all these assemblers of grain formed 3.4 percent
of the total volume of business.
Table 1 presents separately the totals for elevators and for other assemblers
of grain. The other assemblers include the grain warehouses of the Pacific
northwest, some grain warehouses in other States, and the country buyers of
grain who have facilities for the purchasing, loading, and shipping of grain at the
time of the great grain movement, but who do not operate elevators. As noted
in the introduction some of these other assemblers May actually operate elevators
but unless that fact was specifically stated on the schedule they could not be so
classed. It might also be well to point out here that the headquarters offices
of the line elevator companies and of the line warehouse companies are not
included in these totals.
The average business of the 9,457 elevators, that is, total “volume of busi
ness” divided by the total number reporting, was $113,845. Of the other assem
blers the average was $271,911. The larger average sales of the latter group are
undoubtedly largely due to the large-scale wheat business of the grain ware
houses of the Pacific Northwest. This is borne out by the fact that in the States
of Washington, Oregon, and Idaho the average business of the other assemblers
group is very much larger than the average for elevators. -
Data for the 5 States reporting the greatest number of assemblers of grain are
summarized in the table following:
ASSEMBLERS OF GRAIN, 1929
- Num- Total volume - Em- | Salaries and Total exSTATE ber of business Retail Sales ployees wages penses 1
North Dakota.----------------- 1,543 || $142,657,968 $8,956, 586 2,212 $2,924, 441 $6,233,733
Kansas------------------------ 1, 356 210, 131, 111 17, 583, 505 2, 581 3,001,030 5, 534, 153
Illinois------------------------ 1, 213 160,671,009 19, 535,410 2,618 2,937, 571 5,860,746
Minnesota-------------------- 938 77,152,001 11,393,701 | 1, 527 1,882,859 3,687,772
Iowa-------------------------- 924 136,640,268 19,917,939 1,852 2,077,231 4, 169,045
1 Includes salaries and Wages.
It should be noted that while these are the 5 leading States in the total number
of grain assemblers, the State of Washington, with 262 grain assemblers, led in
total volume of business of $237,305,747, and also that the State of Nebraska,
which ranked sixth in total number of assemblers, reported total volume of busi
ness of $133,347,497, thus exceeding in this particular the State of Minnesota,
which ranked fourth in total number of assemblers.
Examination of the interrelations of these business data totals for these 5
leading States presents some interesting variations from the national totals and
percentages previously discussed. The United States averages and percentages
for these 5 States are presented in the table which follows. It will be noted that
in Kansas and Iowa the average volume of business per assembler, considerably
exceeded the national average; while in Illinois the average was about $10,000
less, and in Minnesota and North Dakota they were approximately $60,000 and
$50,000 less, respectively. In like manner there is considerable variation in the
percentages which retail sales formed of the total business, ranging from 6.3
percent in North Dakota to 14.6 and 14.8 percent in Iowa and Minnesota, respec
tively. Total expenses form a smaller percentage of total volume of business
in Kansas, 2.6 percent, as compared with the national of 3.4 percent, but in North
Dakota they were 4.4 percent of the total business.
DISTRIBUTION OF GRAIN 15
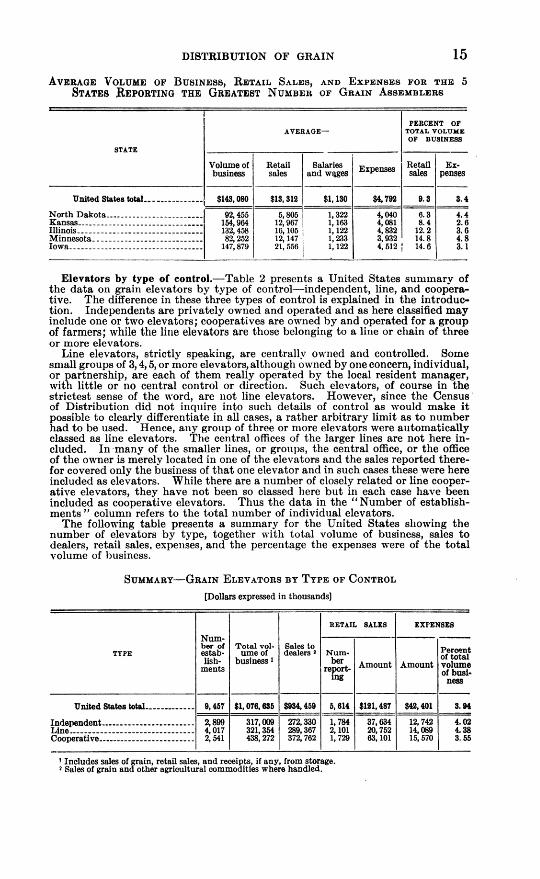
AVERAGE VOLUME OF BUSINESS, RETAIL SALES, AND EXPENSES FOR THE 5
STATES REPORTING THE GREATEST NUMBER or GRAIN ASSEMBLERS
PERCENT OF
AVERAGE- TOTAL VOLUME
OF BUSINESS
STATE
Volume of Retail Salaries Retail Ex
busineSS Sales and wages | *penses sales | penses
United States total--------------- $143,080 $13,312 $1,130 $4,792 9.3 3.4
North Dakota------------------------- 92,455 5,805 1,322 4,040 6.3 4.4
Kansas-------------------------------- 154,964 12,967 1, 163 4,081 8.4 2.6
Illinois-------------------------------- 132,458 16, 105 1, 122 4,832 12.2 3.6
Minnesota---------------------------- 82,252 12, 147 1,233 3,932 14.8 4.8
Iowa---------------------------------- 147,879 21, 556 1, 122 4, 512 14.6 3.1
Elevators by type of control.—Table 2 presents a United States summary of
the data on grain elevators by type of control—independent, line, and coopera
tive. The difference in these three types of control is explained in the introduc
tion. Independents are privately owned and operated and as here classified May
include one or two elevators; cooperatives are owned by and operated for a group
of farmers; while the line elevators are those belonging to a line or chain of three
or more elevators.
Line elevators, strictly speaking, are centrally owned and controlled. Some
small groups of 3,4, 5, or more elevators, although owned by one concern, individual,
or partnership, are each of them really operated by the local resident manager,
with little or no central control or direction. Such elevators, of course in the
strictest sense of the word, are not line elevators. However, since the Census
of Distribution did not inquire into such details of control as would make it
possible to clearly differentiate in all cases, a rather arbitrary limit as to number
had to be used. Hence, any group of three or more elevators were automatically
classed as line elevators. The central offices of the larger lines are not here in
cluded. In many of the smaller lines, or groups, the central office, or the office
of the owner is merely located in one of the elevators and the sales reported there
for covered only the business of that one elevator and in such cases these were here
included as elevators. While there are a number of closely related or line cooper
ative elevators, they have not been so classed here but in each case have been
included as cooperative elevators. Thus the data in the “Number of establish
ments” column refers to the total number of individual elevators.
The following table presents a summary for the United States showing the
number of elevators by type, together with total volume of business, sales to
dealers, retail sales, expenses, and the percentage the expenses were of the total
volume of business.
SUMMARY—GRAIN ELEVATORS BY TYPE OF CONTROL
[Dollars expressed in thousands]
RETAIL SALES EXPENSES
#| Total vall sm"- es to
TYPE £ £e of 1 à' | Num- #
#S business ": Amount Amount | volume
in of busi
g ness
United States total.------------- 9,457 $1,076,635 | $934,459 5, 614 $121,487 || $42,401 3.94
Independent------------------------ 2,899 317,009 | 272,330 1,784 37,634 12,742 4.02
Line-------------------------------- 4,017 321, 354 289, 367 2, 101 20,752 14,089 4.38
Cooperative------------------------- 2, 541 438,272 | 372, 762 | 1, 729 63, 101 15, 570 3.55
! Includes sales of grain, retail sales, and receipts, if any, from storage.
2 Sales of grain and other agricultural commodities where handled.

16 CENSUS OF DISTRIBUTION
From this table it will be noted that 4,017, or 42.5 percent, of the 9,457 ele
vators are line elevators; 2,541, or 26.9 percent, are cooperatives; and 2,899, or
30.7 percent, are independents. The total volume of business including sales of
grain, and-or other agricultural commodities, here handled, together with retail
sales and receipts, if any, from storage, amounted to $1,076,635,298. Of this total
elevator business, $438,272,569, or 40.7 percent, was done by the cooperatives,
as compared to $321,353,703, or 29.8 percent, by the line elevators, and
$317,009,026, or 29.4 percent, by the independents.
The average sales of cooperatives to dealers, including the sales of grain and
other agricultural commodities, but exclusive of retail sales, amounted to $146,699
as contrasted with $93,939 for independent elevators, and $72,036 for line eleva
tors. The total operating expenses for the 9,457 elevators represented 3.94
percent of total volume of business. Of the three types the operating expenses
for cooperatives, 3.55 percent, are slightly lower than the national percentage,
and also slightly lower than for the independents, 4.02 percent, and the line
elevators, 4.38 percent.
Retail sales by elevators.—Of the entire number of elevators, 5,614, or 59.4
percent, not only reported the making of sales at retail, but also reported the
amount thereof. Such sales totaled $121,486,555, or 11.3 percent of the total
elevator sales.
While the total sales of all elevators are not large as compared to the total sales
made by all kinds of retail stores in the small city and rural area (that is, all places
under 10,000 population), which in 1929 amounted to $14,813,786,942; it is,
nevertheless, true that in some of these smaller places and for the lines of mer
chandise which they handle, elevators do represent an important kind of retail
outlet.
While the Census of Distribution schedule used for elevators called only for retail
sales rather than for retail sales by kind, some elevators did report kind of mer
chandise handled at retail, although not the sales of each kind. It was apparent
from some of these replies and from other studies of retail sales of elevators that
the commodities most commonly handled were coal, feed, and other farm sup
plies such as fencing and fence posts, roofing, and the like. However, some ele
vators handled a much more diversified list of merchandise at retail. This is
probably true to a greater degree in the case of independents and cooperatives
than in the case of line elevators. Many line elevators reported that their entire
retail sales consisted of coal and feed.
In some of the older grain States, such as Ohio, Illinois, Indiana, and Iowa, the
retail sales of elevators form a much larger percentage of their total business
than the national average (see table 2). Thus, in Ohio, 323 out of 438 elevators
definitely reported their retail sales, which amounted to 27.1 percent of the total
volume of business. In Illinois 642 out of 939 reported retail sales, which repre
sented 12.3 percent of the total volume of business of all elevators. In Iowa the
figures and percentages are as follows: 418 out of 692 reported retail sales, which
equalled 14.7 percent; and in Indiana, 255 out of 388 elevators reported retail
sales, which equalled 18.9 percent of the entire sales. In the retail summary for
the United States there are included 221 elevators whose retail sales exceeded
50 percent of their total volume of business.
For all cooperative elevators retail sales formed 14.4 percent of the total vol
ume of business as contrasted with 11.9 percent for independents, and 6.5 per
cent for line elevators. Not only have some cooperatives developed a well diver
sified retail branch including, in addition to the well-known farm supplies, farm
implements and machinery, flour, sugar, and other staple commodities, but in
some cases the retail business has been so acceptable to the members, it has re
sulted in the establishing of separate cooperative stores. The retail sales of these
cooperative stores are not included in this report.
Leading elevator States.-The 6 leading States in the number of elevators are
North Dakota, 1,491; Kansas, 1, 187; Illinois, 939; Minnesota, 860; South Dakota,
733; and Nebraska, 698. The following table summarizes the business data on
the elevators in these 6 States, which together contain a total of 5,908, or 62.5
percent of the entire number reporting. The total volume of business of the
elevators in these 6 States amounted to $670,791,234, or 62.3 percent of the total
for all elevators.

DISTRIBUTION OF GRAIN 17
SUMMARY-6 LEADING ELEVATOR STATES
[Dollars expressed in thousands]
i
RETAIL SALES EXPENSES
#| vo -er 0 Olume
* | Sales to Percent
STATE '. ": dealers 2 | Num- of total
I's | ber re-| Amount Amount volumeporting of busi
| ness
North Dakota------------------------- 1,491 $136,311 || $126,802 | 938 $8,428 $5,777 || 4.24Kansas------------------------------- 1,187 | 181,556 | 166,360 588 14, 162 4,659 2.57
Illinois------------------------------- 939 119,011 104,324 642 14,615 4,293 3. 61
Minnesota---------------------------- 860 67,785 57,269 547 10, 158 3,322 4.90
South Dakota------------------------ 733 63,831 56,997 460 6,364 2, 540 3.98
Nebraska----------------------------- 698 || 102,299 92, 504 466 9, 149 2,565 2.51
1Includes Sales of grain, retail Sales, and receipts, if any, from storage.
2 Sales of grain and other agricultural commodities where handled.
Examination of the data by type as given in table 2 reveals some very inter
esting facts. For the 6 leading elevator States, the following table shows the
percentage distribution by type of the total number of elevators, and of the total
volume of business; also by type, the percentage of the total reporting retail sales,
and the percentage that these retail sales are of the total volume of business; and
lastly, the percentage which expenses formed of the total volume of business:
COMPARISON BY TYPES FOR THE 6 LEADING ELEVATOR STATES
[Percentage relationship]
EX
RETAIL SALES PENSES
Percent ofPercent
STATE AND TYPE of all ele- # Percent | Percent
vators ness Percent of total of total
reportin volume | volume
P0"D8 of busi. of busi.
ness ness
North Dakota:
Independent------------------------------------- 17.4 18.9 49.0 4.7 4.0
Line--------------------------------------------- 54.9 36.7 67.2 5.5 4.6
Cooperative------------------------------------- 27.7 44.4 63.2 7.3 4.0
Kansas:
Independent------------------------------------- 31.3 25.9 63. 1 7.6 2.7
Line--------------------------------------------- 42.2 31.4 29.1 2.2 2.9
Cooperative------------------------------------- 26.5 42.7 66.0 12.1 2.2
Illinois:
Independent------------------------------------- 44.1 40.8 63.8 12.3 3.5
Line--------------------------------------------- 24.7 17.2 78.0 5.1 4. 1
Cooperative------------------------------------- 31.2 42.0 67.2 15.2 3.5
Minnesota:
Independent------------------------------------- 74. 2 15.1 4.8
Line--------------------------------------------- 46. 1 26.3 54.0 11.5 5.7
Cooperative------------------------------------- 30.9 50.8 : 69.9 16.7 4.5
South Dakota: *
Independent------------------------------------- 26.9 24.4 52.8 8.5 ! 3.5
Line--------------------------------------------- 40.7 23.2 56.7 7.6 5.1
Cooperative------------------------------------- 32.4 52.4 78.6 11.7 3.7
Nebraska:
Independent------------------------------------- 32.7 28.0 61.8 7.4 2.4
Line--------------------------------------------- 29.2 20.4 65.2 6.7 2.9
Cooperative------------------------------------- 38. 1 51.6 7.2.2 10. 7 2.4
27222–34–3

18 CENSUS OF DISTRIBUTION
The data in this table for the 6 leading elevator States show a situation as
regards the importance of the different types of elevators somewhat similar to
that presented in the United States summary in table 2. That is, while in some
of these States the cooperative elevators do not form as large a percentage of all
elevators as do the other types, in each of the 6 States the total volume of busi
ness by the cooperatives forms a greater percentage of the total volume of busi
ness of all elevators in the State than do the sales of either of the other two
types. Thus, in North Dakota cooperatives do 44.4 percent of the total eleva
tor business as contrasted with 18.9 percent for independents and 36.7 percent
for line elevators, while in Nebraska cooperatives do 51.6 percent of the volume
of business as contrasted with 28 percent for independents, and 20.4 percent for
line elevators.
It will also be noted that in Kansas, South Dakota, and Nebraska a greater
percentage of cooperative elevators reported retail sales than did either of the
other two types. Further, in each of these 6 States the retail sales of coopera
tives formed a greater percentage of their total business than was true of either
of the other two types.
The column showing the percent which total operating expenses were of total
sales would seem to indicate that cooperative elevators are able to operate quite
as efficiently as do the independent and line elevators.
Cooperative elevators.-This whole matter of the cooperative elevator forms
a most interesting picture of cooperative endeavor among farmers in an attempt
to improve the situation surrounding the marketing of one of their major prod
ucts. Without doubt they have served to stabilize the marketing of grain, espe
cially wheat, if for no other reason than that the presence of a strong, well-con
ducted cooperative serves to relieve the minds of the farmers of any idea that
they are not getting proper service from the other elevators. This, of course
is not to be construed as a statement to the effect that cooperative elevators are
always more efficiently managed than privately owned elevators, nor that the
latter always try to take advantage of the farmer when buying his grain. That
would be far from the truth. Cooperative elevators are, however, firmly estab
lished in the country handling of grain and, although at first opposed by some
of the other elevators, it is now, apparently, the consensus of opinion in the
grain trade that the cooperatives are a decidedly worthwhile part of it.
Because of the importance of this type of elevator the following brief sketch of
its development is here included.
The first cooperative elevator, or at least one of the first, to be organized in
this country was that in Blairstown, Benton county, Iowa, which was started in
1868. Farmers in certain counties in Iowa as well as those in other States largely
stimulated by economic and social conditions, took up the idea of cooperative
elevators which, as was pointed out in the introduction, were incident to the rapid
expansion of the total farm area and especially the expansion of wheat acreage
and production in the years shortly following the Civil War.
While the farmers in the older grain States encountered serious problems at
this time due to the competition of the newer regions, the farmers in the Western
States also were not without their problems. With the greatly increased wheat
production, lower prices per bushel, along with relatively high freight rates to
market and to export points, and what were felt to be unreasonably high prices
of farm machinery, many of the farmers of Iowa, Nebraska, and the other western
wheat States joined the Grange, the first national farmers’ organization which is
still in existence and quite active.
Many, if not most of the cooperative elevators organized at that time were
under the auspices of the Grange. Thus, in 1874 the Iowa State Grange reported
that there were 53 farmers’ elevators. This development of cooperative elevators
began in 1868 and reached its culmination about 1880. Following that time
there was a lull in the grain cooperative movement which probably resulted in
an actual net decrease in the number of cooperative elevators.
Another development in the cooperative elevator movement began about 1902.
Here, again, the reason underlying the cooperative development was a feeling of
dissatisfaction among farmers over the existing wheat-market situation. This
discontent revolved about or was occasioned, principally, by the following facts.
First, a farm price of wheat at 63 cents per bushel as contrasted with 81 cents
in 1897; second, dissatisfaction with the grading and dockage practice of the
privately owned elevators; and, third, the degree to which local elevators other
than cooperative had come to be operated by the so-called line-elevator com
panies. This line-elevator development, getting under way about 1885, had devel
oped until in 1902 thousands of grain elevators throughout the grain States were
in the hands of one or another of the line-elevator companies, the members of

DISTRIBUTION OF GRAIN 19
whose boards of directors were also in many cases members of the directorate of
the railroads over which the grain was shipped. Rightfully or wrongfully the
grain farmers naturally attributed at least part of their economic ills to this cen
tralized control of the country market outlets for one of their chief cash crops
and determined to go into the elevator business for themselves.
The cooperative elevator movement beginning at this time May be said to have
Continued down to the present. Many of the first of this group of cooperative
elevators were patterned after the one started in Rockwell, Iowa in 1889. When
this elevator opened, it immediately announced higher prices for wheat than the
other local elevators were paying. The latter countered by raising the price an
additional 5 cents and began to receive much of the wheat of the cooperative
members. The board of managers of the cooperative finally worked out a plan
whereby members were permitted to sell their grain to the other elevators when
ever they offered a higher price than the cooperative could afford to pay, but with
the understanding that a certain amount of this increased price was to be paid
by the member into the treasury of the cooperative-elevator company. This,
of course, made it impossible for the independent and line elevators to drive a
cooperative out of business by the simple expedient of paying a higher price for
a brief period of time.
That the farmers have succeeded in establishing themselves in a firm position
in cooperative handling of grain at country points is amply brought out by the
table on the 6 leading elevator States already discussed, page 18, as well as the
data by States in table 2. While there have, also, been a series of attempts at
cooperative marketing of grain on a larger scale, either through regional or State
wheat pools or through the maintaining of cooperative Sales agencies on the large
grain markets, this phase of cooperative marketing of wheat does not, so far,
seem to have been nearly as successful as local cooperative elevators.
Doubtless one of the limiting factors here has been the great extent of the wheat
growing territory of the United States and the large number of farmers raising it.
Another factor is undoubtedly the fact that numerous cooperative elevators have
been organized under different auspices, that is, by different farmers’ organiza
tions, some of them national or sectional in scope and some of them by entirely
local groups. Further, not all wheat, and wheat is the chief commercial grain, is
of the same kind and there May be some competition on this basis, as well as a
competitive feeling between growers located in different States. It is also true
that the management of a single local cooperative elevator, or, as in some cases, a
group of several such elevators is a far simpler matter than participation in grain
dealing in the large grain markets.
This, of course, should not be interpreted as meaning that it is felt that such
centralized cooperative selling of grain cannot be developed. Several attempts
have been made. Given the proper type of managerial ability with adequately
developed plans backed up by adequate statistical and market information service
there would seem to be no reason why large numbers of grain growers might not
market their grain through central sales agencies, if they feel that such selling
would result in sufficient savings or other material benefits such as strengthening
their strategic position in the market.
The Census of Distribution received schedules covering 14 sales agencies, and
(or) sales offices, maintained by grain cooperatives in 1929, with total sales of
$40,628,632. Of the 14 selling agencies, 4 were organized between 1914 and 1919;
7 between 1920 and 1924; 1 in 1925; 1 in 1926; and 1 in the last half of 1929.
Size distribution by type.—Table 4 presents a distribution of the three types
of elevators (independent, line, and cooperative) by size of business. For each
type by size group is shown the number, total and average sales to dealers, total
# average expenses, and the percentage which expenses are of total sales to
ea.IERS.
This table shows that 875 of the 9,457 elevators had total sales of $20,000 and
under. Of these 287 are independent, 527, line; and 61, cooperative. At the
other extreme there are 10 elevators, each doing a business over $1,000,000, of
which 4 are independent; 2, line; and 4, cooperative. The total sales to dealers
of the 875 elevators in the smallest size group, that is $20,000 and under, amounted
to only $9,500,114, as contrasted with $18,577,123 of the 10 elevators having
sales of over $1,000,000.
The predominating size group for all elevators is the $50,001 to $100,000 group,
which contains 2,741 elevators. The second group from the standpoint of num
ber is the $1,001 to $200,000 group with 2,404 elevators; and the third is
$20,001 to $50,000 group, with 2,130 elevators. The two groups from $50,001
to $200,000 contain 5,145 elevators, or over 50 percent of the total number of

20 CENSUS OF DISTRIBUTION
elevators. If we include the three groups, $20,001 to $200,000, the percentage is
about 77 percent.
There is, of course, a vast difference between an elevator doing slightly over
$20,000, or, as here shown, on the average of $31,644 worth of business (of grain
and other agricultural commodities), and one doing over $100,000 worth of
business. For example, for the $20,001 to $50,000 group expenses form 7.57
percent of the total sales as compared with only 4.30 percentage in the group
doing from $100,001 to $200,000 worth of business. On the type basis, we find
the greatest number of independent elevators are also in the $50,001 to $100,000
group; line elevators, in the $20,001 to $50,000 group; and cooperatives, in the
$100,001 to $200,000 group. This size distribution by type is perhaps better
brought out in the following summary:
TYPE OF ELEVATOR BY SIZE OF BUSINESS, 1929
$20,000 $20,001 $50,001 || $100,001 || $200,001
TYPE and to to to to
under $50,000 || $100,000 $200,000 || $300,000
Number Number Number Number Number
Independent---------------------------------------- 287 594 918 761 217
Line------------------------------------------------- 527 1,315 1,238 694 142
Cooperative----------------------------------------- 61 221 585 949 391
$300,001 || $400,001 || $500,001 || $750,001 overTYPE t0 to to to $1 000. 000
$400,000 $500,000 || $750,000 $1,000,000”"
|
Number Number Number Number Number
Independent---------------------------------------- - 60 22 30 6 4
Line------------------------------------------------- 54 21 | 17 7 2
Cooperative-- --- - 191 77 | 52 10 4
Relation of expenses to sales by size and type.-For the entire group of 9,457
elevators operating expenses formed 4.54 percent of sales to dealers; and there
was not a great deal of difference between the three types—4.68 percent, for all
independents; 4.87 percent, for all line elevators; and 4.18 percent, for all cooper
atives. Note, however, that as before stated (page 16), on the basis of total
volume of business, including sales to dealers, and retail sales, the percent ex
penses formed for each of these three types was: Independents, 4.02 percent;
line, 4.38 percent; and cooperatives, 3.55 percent. -
The 875 small elevators, in the $20,000 and under value group, had expenses
which were 12.91 percent of sales to dealers; while for the $50,001 to $100,000,
the largest group from the standpoint of number of elevators, the operating
expenses formed only 5.64 percent of sales. The 10 elevators doing over $1,000,
000 each, had expenses which were 3.35 percent of sales.
Data on the wholesale trade in grain.—The Census of Distribution data on the
wholesale trade in grain, as differentiated from elevators and other country
assemblers, are given in table 7. This table shows reports were received from
1,174 wholesalers of all kinds and types, with a total business in 1929 of $2,573,
823,162. In the last four columns of the table “dealers” are distinguished from
“agents and brokers.” In considering the data in this table the following
explanation should be kept in mind.
The Census of Distribution did not cover the storage or warehouse business,
either in the case of grain or in the case of any other commodity. Thus, a concern
whose chief business was that of storing grain would not be included in this table,
even though it might perhaps buy and sell or sell for others considerable quanti
ties of grain. Neither did the Census of Distribution cover brokerage houses,
whose chief function is the execution of orders for the purchase and (or) sale of
grain for appliance on the grain exchanges. Milling companies in the aggregate
sell considerable quantities of grain, either because they have secured through
their country buying activities more than they need or too much of certain grades
and kinds. Such business is not here included since Mills were covered by the
Census of Manufactures and not by the Census of Distribution.
Further, the schedule used for dealers in the larger cities, while a more highly
differentiated one than that used in the samller places, was not especially designed
for securing reports on the grain trade. This has not made it possible to present

DISTRIBUTION OF GEAIN 21
the data here in as much detail by different classes or types of grain dealers as
perhaps, from certain standpoints, might be desirable. The schedule, it is true,
made provisions for the reporting of the amount of grain sold by kind, together
with the value of each kind, but there was not a sufficient consistency in reporting
on this basis to make it feasible to tabulate the data separately.
The kind of business classification, that is, as a dealer in grain, was, wherever
possible based on the 50 percent plan, i.e., some dealers in grain also deal in other
commodities; but no dealer was classified as a grain dealer unless 50 percent or
more of his total business consisted in the handling of grain, where such informa
tion was available on the schedule. In other cases where the break-down was not
completely given the style of the firm name was the deciding factor in the classifi
cation.
There are, of course, a number of different types of grain dealers: Commission
firms, brokers, exporters, importers, wholesalers (that is, those who buy and sell
grain outright), as well as some special types of agents. While the schedule used
provided a place for the firm to check itself either as a commission firm, whole
saler, or broker, the reports of various firms were not consistent enough to justify
the making of a clear cut classification between straight commission firms, that is,
those who operate on a strictly commission basis, and those who buy and sell
outright. Some firms, which in their firm names style themselves grain com
mission companies, checked merely the designation “wholesaler”; while others
who merely called themselves grain dealers checked the words “commission
dealer” under the type classification. Accordingly the “dealer” classification as
presented in table 7 includes grain commission firms, wholesalers, exporters, and
importers; while the “broker” and “agent” classifications include brokers, both
buying and selling, and a few branch sales offices of grain firms, and the co
operative sales agencies.
Since the Census of Distribution schedule made no inquiry either as to the
type of dealer from which grain was bought or the type of dealer to which grain
in turn was sold, and because of the difficulties in making a clear-cut type classifi
cation, the total sales figures as here given undoubtedly include some duplication
of sales, that is, from one type of dealer to another dealer, either of the same or a
different type.
Minneapolis, Chicago, and St. Louis are the leading domestic wheat markets;
although Omaha, Kansas City, and Indianapolis are also very important. The
leading export markets are New York, Portland, Tacoma, Galveston, San
Francisco, and New Orleans. The relative importance of the wheat markets
from the standpoint of total receipts is to a certain extent indicated by the follow
ing data from the United States Department of Agriculture showing the total
number of bushels inspected, compiled through the district offices of the Federal
grain supervision.
WHEAT RECEIPTS INSPECTED
: :thou- Oll
MARKET Sands of MARKET Sands of
bushels) bushels)
Total------------------------------ 775, 527 || Wichita--------------------------------- 28,985
=| Portland, Oreg-------------------------- 26,332
Minneapolis---------------------------- 83,291 || New York------------------------------ 11,939
Duluth--------------------------------- 41,822 || Philadelphia---------------------------- 1, 525
Kansas City---------------------------- 83, 123 || Baltimore------------------------------- 8,862
Qhicago--------------------------------- 28,492 || New Orleans---------------------------- 10,035
St. Louis-------------------------------- 27, 769 || Galveston------------------------------- 22,991
Omaha---------------------------------- 31,673 || All other inspection points-------------- 368, 688
As previously explained under the discussion of “production point marketing
of grain,” the rapid movement of wheat from farm to market made necessary the
development of large storage elevators at various market centers. While, as
noted in the introduction, the Census of Distribution did not cover these, the
following data taken from the Fiftieth Annual Report of the Minneapolis Cham
ber of Commerce May be of interest. This summary shows for a number of cities
the number of storage elevators and their capacity in bushels.

22 CENSUS OF DISTRIBUTION
STORAGE ELEVATOR CAPACITY IN VARIOUS CITIES, 1932
#| came #|cor 0 apacity er 0 apacitCITIES eleva- | (bushels) CITIES eleva- #
tors tors
Minneapolis------------------ 65 91,020,050 || Cincinnati-------------------- 13 | 2,300, 850
Chicago.------.---------------- 62 53,979,000 || Galveston 3 7,500,000
Duluth-Superior-------------- 33 50,375,000 || Omaha----------------------- 18 26,410,000
Buffalo---------------------- 38 || 49, 543,000 || St. Joseph-------------------- 13 | 10,352,000
St. Louis and East St. Louis-- 39 15, 314,500 || Indianapolis------------------ 9 5, 500,000
Baltimore-------------------- 5 | 12,750,000 || Portland.--------------------- 14 | 10,096, 170
Milwaukee------------------- 24 17, 740,000
The 10 leading markets for other grains—corn, oats, barley, and rye-based
on the total receipts, according to the Fiftieth Annual Report of the Minneapolis
Chamber of Commerce, are shown in the following table. For comparative pur
poses the table shows the receipts of these grains and the corresponding Rank
therein of each of these markets. Thus it will be noted that while Chicago leads
in the receipt of corn, oats, and rye, it ranks sixth in total receipts of barley,
Duluth ranking second in receipts of barley and rye, but eighth in oats, and only
sixteenth in corn. Indianapolis ranks fifth in receipts of both corn and oats, but
fourteenth in rye, and sixteenth in barley.
RECEIPTS OF SPECIFIED GRAINS AT WARIOUS MARKETS, 1929
[Ten leading markets are shown in italics)
CORN OATS BARLEY RYE
MARKET -
Rank | Receipts ||Rank | Receipts ||Rank | Receipts ||Rank | Receipts
Bushels Bushels Bushels Bushels
Minneapolis------------------- 8 12,609, 950 2 25,042, 190 1 | 20, 205,830 3 7,620,390
Chicago------------------------ 1 | 81, 581,000 1 37,605,000 6 | 8,553,000 1 | 8,591,000
Duluth------------------------ 16 | 1,962,858 9 5, 450, 372 2 15, 258,634 2 7,636, 138
Milwaukee--------------------- 7 | 13,750,335 4 || 13, 204,670 4 | 12,237,850 6 694,960
Omaha------------------------ 6 | 18, 761, 400 6 | 8,290,000 10 | 1,779,200 4 1, 904,
Kansas City------------------- 3 || 32, 416, 500 11 5, 156,000 9| 2,676,800 1 204,
St. Louis----------------------- 2 33, 869,000 3 21, 804,000 11 1,764,000 9 359, 200
Peoria------------------------- 4 26,093, 850 7 | 7,692, 100 3,380,600 16 50,200
Toledo------------------------- 20 | 1,396,250 10 || 5, 400,280 21 116,400 13 121, 200
Detroit------------------------ 22 421, 500 19 866,000 18 232, 500 10 235, 500
Buffalo------------------------ 10 || 9, 990, 561 8 5,538, 932 3 | 15, 154, 821 5 1,328,896
New York--------------------- 19 | 1,559,500 12 || 4,949,000 5 11, 437, 400 7 606,000
St. Joseph--------------------- 9 | 10,323,000 17 970,000 19 210,000 22 6,000
Sioux City--------------------- 11 | 8, 149,000 13 || 4,490,000 22 75,000 8 385,000
Indianapolis------------------- 5 23,301,000 5 | 11, 990,000 16 576,000 14 97, 500
Baltimore---------------------- 17 | 1,961,839 21 796, 871 7 || 4, 153, 181 15 55, 398
MILLING OR PROCESSING OF GRAIN
While data are not available to show in complete detail the utilization of each
of the grains in manufacturing or processing and the further utilization of the
milled or ground products by other plants, the following summary data from the
Census of Manufactures does probably cover the more important phases of
this matter.
The total amount of each of specified kinds of grain ground or milled during
1929 in the flour and other grain-mill-products industry is given in the following
table. This table shows the 10 leading States in the milling and grinding of each
of the grains and for comparative purposes there are also shown the amounts of
other grain ground or milled in the same States and their Rank therein. ...Thus,
it will be noted that Minnesota leads in the milling of wheat and rye; Missouri
is the leader in the milling and grinding of corn; New York of oats; and Cali
fornia in barley. Indiana ranking second in corn is eleventh in flour milling, while
Kansas, second in flour milling, is fourteenth in the grinding of corn.
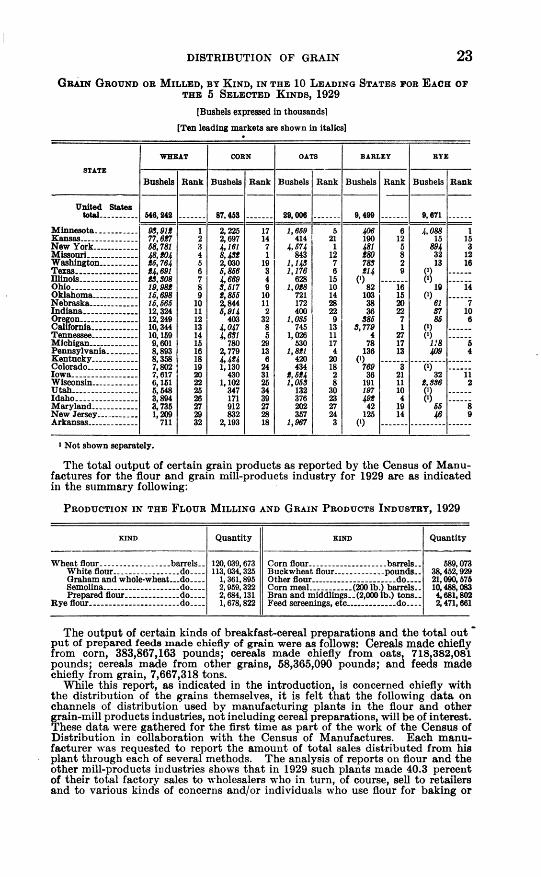
DISTRIBUTION OF GRAIN 23
GRAIN GROUND OR MILLED, BY KIND, IN THE 10 LEADING STATES FOR EACH of
THE 5 SELECTED KINDS, 1929
[Bushels expressed in thousands]
[Ten leading markets are shown in italics]
WHEAT CORN OATS BARLEY RYE
STATE
Bushels | Rank | Bushels | Rank | Bushels | Rank | Bushels | Rank | Bushels | Rank
United States
total---------- | 546,242 ||------- 87,453 |------- 29,006 ||------- 9,499 ||------- 9,671 ||------
Minnesota----------- 93, 912 1 2,225 17 1,659 5 406 6 4,088 1
Kansas--------------- 77,627 2 2,697 14 414 21 190 12 15 15
New York------------| 58,781 3 4, 161 7 4, 574 1 481 5 894 3
Missouri------------- 48, 204 4 8,432 1 843 12 280 8 32 12
Washington---------- 25,764 5 2,030 19 1, 143 7 783 2 13 16
Texas---------------- 24,691 6 5,856 3 1, 176 6 214 9 () ------
Illinois--------------- 23, 308 7 4,669 4 628 15 () ------- () ------
Ohio----------------- 19,982 8 3, 517 9 1,028 10 82 16 19 14
Oklahoma------------ 15,698 9 2,855 10 721 14 103 15 () ------
Nebraska------------- 15, 565 10 2,844 11 172 28 38 20 61 7
Indiana-------------- 12, 324 11 5,914 2 400 22 36 22 57 10
Oregon--------------- 12,249 12 403 32 1,035 9 385 7 85 6
California------------ 10,344 13 4,047 8 745 13 3,779 1 (*) ------
Tennessee------------ 10, 159 14 || 4,631 5 | 1,026 11 4 27 () ------
Michigan------------- 9,601 15 780 29 530 17 78 17 118 5
Pennsylvania-------- 8,893 16 2,779 13 1,821 4 136 13 409 4
Kentucky------------ 8, 358 18 4,424 6 420 20 () ----------------------
Colorado------------- 7,802 19 1, 130 24 434 18 769 3 (*) ------
Iowa----------------- 7,617 20 430 31 2, 524 2 36 21 32 11
Wisconsin------------ 6, 151 22 1, 102 25 1,053 8 191 11 2,336 2
Utah----------------- 5, 548 25 347 34 132 30 197 10 # -----
Idaho---------------- 3,894 26 171 39 376 23 492 4 () ------
Maryland------------ 3,735 27 912 27 202 27 42 19 65 8
New Jersey----------- 1,209 29 832 28 357 24 125 14 46 9
Arkansas------------- 711 32 2, 193 18 1,967 3 () -------|---------|------
1 Not shown separately.
The total output of certain grain products as reported by the Census of Manu
factures for the flour and grain mill-products industry for 1929 are as indicated
in the summary following:
PRODUCTION IN THE FLOUR MILLING AND GRAIN PRODUCTS INDUSTRY, 1929
KIND Quantity KIND Quantity
Wheat flour------------------barrels-- 120,039, 673 || Corn flour--------------------barrels-- 589,073
White flour-----------------do----| 113,034, 325 || Buckwheat flour-------------pounds--| 38,452, 929
Graham and whole-wheat---do----| 1,361,895 || Other flour----------------------do----| 21,090, 575
Semolina--------------------do----| 2,959,322 || Corn meal----------- (200 lb.) barrels--| 10,488,083
Prepared flour--------------do----| 2,684, 131 || Bran and middlingS--(2,000 lb.) tons--| 4,681, 802
Rye flour-----------------------do----| 1,678, 822 || Feed Screenings, etc.-------------do----| 2,471,661
The output of certain kinds of breakfast-cereal preparations and the total out
put of prepared feeds made chiefly of grain were as follows: Cereals made chiefly
from corn, 383,867,163 pounds; cereals made chiefly from oats, 718,382,081
pounds; cereals made from other grains, 58,365,090 pounds; and feeds made
chiefly from grain, 7,667,318 tons.
While this report, as indicated in the introduction, is concerned chiefly with
the distribution of the grains themselves, it is felt that the following data on
channels of distribution used by manufacturing plants in the flour and other
grain-mill products industries, not including cereal preparations, will be of interest.
These data were gathered for the first time as part of the work of the Census of
Distribution in collaboration with the Census of Manufactures. Each manu
facturer was requested to report the amount of total sales distributed from his
plant through each of several methods. The analysis of reports on flour and the
other mill-products industries shows that in 1929 such plants made 40.3 percent
of their total factory sales to wholesalers who in turn, of course, sell to retailers
and to various kinds of concerns and-or individuals who use flour for baking or

24 CENSUS OF DISTRIBUTION
other purposes. The direct sales to retailers amounted to 27.1 percent of the
total sales; sales to bakeries, other manufacturers, and retail customers were 23.5
percent; while 7.7 percent was sold to, or through the manufacturers own Whole
sale branches; and 1.4 percent to the manufacturers retail branches.
TABLE 1.—AssEMBLERs OF GRAIN-UNITED STATES AND STATE SUMMARY
[(x) is used to prevent disclosure of individual operations]
DIVISION OR STATE
United States----------------
NEW ENGLAND:
Maine------------------------
New Hampshire.--------------
Vermont----------------------
Massachusetts----------------
Rhode Island------------------
Connecticut-------------------
MIDDLE ATLANTIC:
New York--------------------
New Jersey-------------------
Pennsylvania-----------------
EAST NORTH CENTRAL:
Ohio--------------------------
Indiana-----------------------
Illinois------------------------
Michigan---------------------
Wisconsin---------------------
WEST NORTH CENTRAL:
Minnesota--------------------
Iowa--------------------------
Missouri----------------------
North Dakota-----------------
South Dakota-----------------
Nebraska---------------------
Kansas------------------------
SOUTH ATLANTIC:
Delaware---------------------
Maryland---------------------
District of Columbia----------
Virginia-----------------------
West Virginia-----------------
North Carolina---------------
South Carolina-------
Georgia-----------------------
Florida------------------------
EAST SOUTH CENTRAL:
Kentucky---------------------
Tennessee---------------------
Alabama----------------------
Mississippi--------------------
WEST SOUTH CENTRAL:
Arkansas----------------------
Louisiana---------------------
Oklahoma---------------------
Texas------------------- --- - - -
MOUNTAIN:
Montana-------------------- --
Idaho-------------------------
Wyoming---------------------
Colorado------------------ ----
New Mexico.------------------
Arizona-----------------------
"tah--------------------------
Nevada-----------------------
PACIFIC:
Washington-------------------
Oregon------------------------
California---------------------
ALL TYPES OF ASSEMBLERS
Num
Num- || Total volume Retail ber of | Salaries Total
ber 0f business 1 Sales employ- and wages expenses
ees
11,603 || $1,660, 155,521 |$154,457,816 24,605 |$27,804, 753 $55,599,798
-- - - - -1 (s) || @
------IT-----(x) ||III.
30 3, 198,650 265,104 173, 102
5 2, 175, 564 82,627 104,931
22 1,006,299 310, 144 102,084
530 57, 473,336 || 14, 266,388 1,476 1, 723,014 3,290, 522
456 39,388, 519 7,640,030 1,080 1, 126, 211 2,315,248
1, 213 160,671,009 | 19, 535,410 2,618 2,937, 571 5,860, 746
328 47,963,254 11,043,393 1,814 1,677, 131 3,266,335
35 3,448, 423 661,367 114 126,388 302,172
938 77,152,001 | 11,393,701 | 1, 527 | 1,882,859 3, 687,772
924 136,640,268 || 19,917,939 1,852 2,077,231 4, 169,045
234 35,952, 886 3,845,958 799 993, 147 2, 604, 366
1,543 142,657,968 8,956, 586 2,212 2,924, 441 6,233, 733
799 72, 188, 314 7,081, 815 1,275 1,454,753 2,831, 779
860 133,347,497 | 11,423,941 1,611 1, 786, 592 3,370,950
1,356 210, 131, 111 || 17, 583, 505 2, 581 3,001,030 5, 534, 153
10 1,487, 576 247,650 37 28, 357 78, 560
24 17,813,054 484,095 76 80, 584 154, 203
- - --- -5' 209,198 || 9,000 || 9 || 7,825 | 15, 1986 282, 520 57,000 14 8,600 23, 540
8 226,485 ||------------ 16 7, 160 29, 331
3 193,065 -------------------------------- 4,982
4 189,500 80,000 10 6,620 15,040
3 0,000 ||------------ 7 4,680 16, 260
11 282, 343 2, 340 19 11, 586 12,574
31 4,979, 700 74, 123 91 98, 359 218,482
3 417,450 22,700 24 ,600 *
5 824, 733 ||------------ 6 3,350 11, 155
7 679,727 66,000 38 32,914 115,094
3 1,291, 117 ------------ 19 21, 32,430
542 52, 363,080 4,850, 128 | 1,080 1, 120, 166 2,046, 590
3.18 53,216,629 1,899, 116 1,023 907, 490 1,774, 226
529 46, 945,636 2,005, 252 653 1,011, 498 1,865, 272
161 44,055,672 1,875,021 432 573, 871 1, 146,023
22 2,566, 503 507,293 53 99,905 211,082
218 33, 756,776 4,027,907 452 638,666 1,307,284
12 4, 493, 198 51,754 52 57, 134 164,399
1 ) --------------------|------------|------------
17 1,417,626 36,055 4 58,838 122, 129
2 (x) ------------ (X) (X) (X)
262 237, 305, 747 2,310, 841 793 675, 193 1,292,769
67 14,663, 395 1,063, 525 211 179,425 570, 509
54 16,630,445 770, 308 184 240,992 481,744

DISTRIBUTION OF GRAIN 25
TABLE 1.—AsSEMBLERs of GRAIN—UNITED STATES AND STATE SUMMARY
Continued
[(x) is used to prevent disclosure of individual operations]
DIVISION OR STATE
ELEVATORS OTHER ASSEMBLERS
Total volume Total volume
Number of £siness' | Number of business i
United States----------------------------------- 9,457 $1,076,635,298 2, 146 $583,520,223
NEW ENGLAND:
Maine------------------------------------------------------|--------------------------|--------------
New Hampshire ---------------------------------|----------|----------------|----------|--------------
Vermont---------------------------------------------------|---------------- 1 (x)
Massachusetts-----------------------------------|----------|----------------|----------|--------------
Rhode Island.------------------------------------|----------|---------------- 1 (x)
Connecticut--------------------------------------|----------|--------------------------|--------------
MIDDLE ATLANTIC:
New York --------------------------------------- 12 835,374 18 2,363,276
New Jersey--------------------------------------|----------|---------------- 5 2, 175,564
Pennsylvania------------------------------------ 6 456,985 16 549, 314
EAST NORTH CENTRAL:
hio--------------------------------------------- 438 46,661,724 92 10,811,612
Indiana------------------------------------------ 388 32,287,912 68 . 100, 607
Illinois------------------------------------------- 939 119,010,783 274 41,660,226
Michigan --------------------------- 297 41,995,776 31 5,967,478
Wisconsin---------------------------------------- 18 1,493, 567 17 1,954,856
WEST NORTH CENTRAL:
Minnesota--------------------------------------- 860 67,784, 688 78 9,367, 313
Iowa--------------------------------------------- 692 97, 279,294 232 39,360,974
Missouri----------------------------------------- 158 11,993,238 76 23,959,648
North Dakota------------------------------------ 1,491 136,310,504 52 6,347, 464
South Dakota------------------------------------ 733 63,830,788 66 8,357, 526
Nebraska ---------------------------------------- 698 102,298,558 162 31,048,939
Kansas------------------------------------------- 1, 187 181,555,913 169 28,575, 198
SOUTH ATLANTIC:
Delaware-----------------------------------------|----------|---------------- 10 1,487,576
Maryland---------------------------------------- 9 2,240,284 15 15,572, 770
District of Columbia-----------------------------|----------|--------------------------|--------------
Virginia------------------------------------------ 2 (x) 3 (x)
West Virginia------------------------------------ 5 (x) 1 (x)
North Carolina-----------------------------------|----------|---------------- 8 226,485
South Carolina----------------------------------- 1 (x) 2 (x)
Georgia------------------------------------------ 1 (x) 3 (x)
Florida-----------------------------------------------------|---------------- 3 130,000
EAST SOUTH CENTRAL:
Kentucky---------------------------------------- 2 (x) 9 (x)
Tennessee----------------------------------------|-- -- ----- - - ------------- 31 4,979,700
Alabama-----------------------------------------|----------|---------------- 3 417,450
Mississippi---------------------------------------|----------|---------------- 5 824,733
WEST SOUTH CENTRAL;
Arkansas---------------------------- 1 (x) 6 (x)
Louisiana------------------------- 1 (x) 2 (X)
Oklahoma---------------------------------------- 437 41,459,374 105 10, 903,706
Texas-------------------------------------------- 218 35,688,384 100 17, 528, 245
MOUNTAIN:
Montana----------------------------------------- 512 45,343,283 17 1,602,353
Idaho-------------------------------------------- 101 13,453, 715 60 30, 601,957
Wyoming---------------------------------------- 18 ,039,728 4 526,775
Colorado----------------------------------------- 181 23,055,265 37 10,701, 511
New Mexico.------------------------------------- 8 3,067,053 4 1,426, 145
Arizona-------------------------------------------------------------------- 1 (x)
tah--------------------------------------------- 6 1, 162,749 11 254,877
Nevada------------------------------------------ 1 (x) 1 (x)
PACIFIC:
Washington-------------------------------------- 6 944,069 256 236, 361,678
Oregon------------------------------------------- 29 2,272, 575 38 12,390, 820
California---------------------------------------- 1 (x) 53 (x)
1 Includes sales of grain, retail sales, and receipts (if any) from storage.

26 CENSUS OF DISTRIBUTION
TABLE 2.-GRAIN ELEVATORs—NUMBER, TOTAL WolUME of BUSINESS, SALES,
AND EXPENSES, 1929, BY TYPE AND BY STATES
[(x) is used to prevent disclosure of individual operations]
RETAIL SALES EXPENSES
''er 0
Total volume Sales to PercentSTATE AND TYPE ' [ofbusin' dealers' Num: of total
Inents ber re- Amount Amount volume
porting of busi
neSS
United States total----- 9,457|31,076,635,298,3934,458,920, 5,614|$121,486,555 $42,401, 398 3.94
Independent------- 2,899 317,009,026. 272,330,297 1,784 37,634, 193| 12,742,050 4.02
Line---------------- 4,017 321, 353,703] 289, 367,225 2, 101| 20, 751,881. 14,089, 345 4.38
Cooperative-------- 2, 541 438,272, 569| 372, 761,398 1,729. 63, 100,481 15, 570, 003 3. 55
Arkansas------------------- 1 # (x) 1 (x) (X) #Independent----------- 1 (X (x) 1 (x) (x) (X
*----------------------------|----------------------------------------------------------|--------
Cooperative--------
California------------------ 1 (X) (3) (3) (3) (x) (x)
!"dependent-----------|--------|--------------|------------|--------|------------|------------|--------
#ine-------------------- 1 (x) (3) (3) (3) (x) (X)
°ooperative--------------------|--------------------------|--------------------------------|--------
Colorado-------------------- 181 23,055,265. 20, 595,794 111| 2,386, 210 1,001, 542 . 34
Independent----------- 34 3,815,056 3, 176, 748 23 629, 82,008, 4.77
Line.------------------- 119 14,409,619 13,262,577 66 1, 115, 229 607, 605 4.22
Cooperative------------ 28 4, 830, 590 4, 156,469 22 641,981 211,929 4.39
(X) (X) 1 # (X) (X)
(x) (X) 1 (X (X) (X)
13,453,715 11,212, 126 69 1, 515, 985 683, 980 5.08
1,046, 200 857,369 7 174, 947 76,027 7.27
*-------------------- 12,407, 515, 10,354,757 62. 1,341,038 607, 953 4.90
°ooperative----------------------------------------------|--------------------------------|--------
inois--------------------- 939 119,010, 783| 104,324, 358 642| 14,615, 129 4, 293,432 3. 81
Independent-------- 414 48, 532,750. 42, 574, 578 264 5,958, 172 1,703,882 3.51
Line-------------------- 232 20,486,438. 19,443, 534 181 1,039,884 841, 535 4. 11
Cooperative------------ 293 49,991, 595 42,306, 246 197 7,617,073 1, 748,015 3.50
Indiana--------------------- 388 32,287,912| 16, 130, 155 255 6, 115,914, 1,840, 654 5. 70
Independent----------- 210 18,285,862 11,835,210 138 3,596,593 1,080, 352 5.91
Line-------------------- 123 7, 204, 896 355, 355 74 1,224, 512 402,924 5.59
Cooperative------------ 55 6, 797, 154 3,939, 590 43 1,294,809 357, 378 5.26
*wa------------------------ 692 97, 279,294 82,585,645 418 14,273,928 3,087,932 3.17
Independent----------- 246 28,494,003 25, 102,296 147 2,999, 407 809, 376 2.84
Line-------------------- 172 14, 343, 116 13,071,965 108 1,271, 151 548, 718 3. 83
Cooperative- -------- 274 54,442, 175 44, 411,384 163| 10,003, 370 1,729,838 3.18
*S*S--------------------- 1, 187 181, 555,913| 166, 359,707 588 14, 161, 559 4,659,253 2.57
Independent---------- 371 47,014,821 43,385, 778 234 3, 567,715 1, 275, 974 2.71
|Line-------------------- 501 57,004, 104 55, 111,012 146| 1,249, 718 1,654,858 2.90
Cooperative------------ 315 77, 536,988 67,862,917 208 9,344, 126 1,728,421 2.23
Kentucky------------------ 2 (X) (x) --------|------------ (x) (x)
Independent----------- 1 (X) (x) -------------------- (X) (x)
line------------------- 1 (x) (x) --------|------------ (x) (X)
Cooperative------------|------------------------------------------|------------------------|--------
Cooperative------------
Maryland------------------
Independent-----------
Line--------------------
Cooperative------------
Michigan-------------------
Independent----------.
Line--------------------
Cooperative------------
41,995,776
15,787,287
14, 746, 171
11,462,318
2,014,938
2,014,938
31, 841, 301
12,437, 553
11, 545, 539
7,858,209
1Includes sales of grain, retail sales, and receipts (if any) from storage.
* Sales of grain and other agricultural commodities where handled.
* Not Separately reported.
225, 301
225, 301
9,863,432
3, 127, 701
3, 161,241
3, 574,490
2,930, 922
1, 147, 667
981, 948
801, 307

DISTRIBUTION OF GRAIN 27
TABLE 2.-GRAIN ELEVATORs—NUMBER, TOTAL VOLUME OF BUSINESS, SALES,
AND EXPENSES, 1929, BY TYPE AND BY STATES-Continued
[(x) is used to prevent disclosure of individual operations]
RETAIL SALES EXPENSES
£
-
r 0
Total volumel Sales to Percent
STATE AND TYPE '. of business dealers | Num- of total
t ber re- Amount Amount volumeInentS porting 0f busi
neSS
Minnesota------------------- 860 $67,784,688 $57,268,905 547 $10, 157, 605 $3,322, 320 4.90
Independent----------- 198 15, 513, 630 13, 170,345 147 2,343,285 44,671 4.80
Line-------------------- 396 17,799, 379 15,395,682 214 2,045,519 1,015, 179 5. 70
Cooperative------------ 266 34,471,679| 28,702, 878 186 5, 768,801 1, 562,470 4. 53
Missouri-------------------- 158 11,993,238 8,702,055 94; 2,707, 362. 1,299,727 10.84
Independent----------- 80 5,414, 510, 3,920, 130 43 969,290 373, 6.89
Line-------------------- 31 1,654,444 1, 503, 588 20 92, 125 660,052 39.90
Cooperative------------ 47 4,924,284 3,278,337 31 1,645,947 266,482 5.41
Montana-------------------- 512 45, 343,283 41, 587,044 191 1,956,672 1,773, 902 3.91
Independent----------- 41 , 509,012 3,621, 302 14 270,305 198, 176 4. 40
Line-------------------- 422 29,313,843. 27,326,962 151 804, 719 1, 136,038 3. 88
Cooperative------------ 49 11,520, 428, 10,638,780 26 881,648 39, 3.82
Nebraska------------------- 698. 102,298,558 92,504,081 466 9, 148,957 2,564,652 2.51
Independent----------- 228 28,688,714 26, 551,967 141, 2, 136, 747 685, 110 2. 39
Line-------------------- 204 20,849,946 18, 732,267 133 1,387,947 601,614 2.89
Cooperative------------ 266 52,759,898 47,219,847 192 5,624, 263 1,277,928 2.42
Nevada--------------------- 1 (x) (x) --------|------------ (X) (X)
Independent----------- 1 (x) (x) --------|------------ (x) (X)
*----------------------------|--------------|------------|--------|--------------------------------
Cooperative--------------------|--------------|------------|--------|------------|------------|--------
New Mexico.----------------- 8 3,067,053| 2,998,739 l # 117,965 3.85
Independent----------- 5 2,327,648 2,295,334 1 (x ,093 4.04
Line-------------------- 3 739,405 703, 405--------|------------ 23,872. 3.23
Cooperative--------------------|--------------|------------|--------|------------|------------|--------
New York------------------- 12 835, 374 813,387 2 # 44, 392 5.31
Independent- 3 74,874 52,887 2 (X 5,777 7.72
Line-------------------- 9 760, 500 * ***i-------- 38,615 5.08
Cooperative------------|--------|--------------|------------|--------|------------|------------|--------
North Dakota---------------- 1,491 136, 310, 504 126,801, 843 938 8,428, 272 5,776,516 4.24
Independent----------- 259 25,839, 132 23,936, 592 127 1,217,756 1,033,966 4.00
Line-----:-------- - 819 49,975, 583 47, 175,607 550 2,771, 540) 2,298,968 4.60
Cooperative------- - 413 60,495, 789, 55,689,644 261 4,438,976 2,443, 582 4.04
Ohio------------------------ 438 46, 661, 724, 33,770,083 323| 12,643,075 2,861, 507 6.13
Independent----------- 235 23,416, 145 17,367, 462 184 6,048, 1,495,077 6.38
Line-------------------- 74 4, 597, 797 3,735,966 48 651,438 * 6.35
Cooperative------------ 129 18, 647,782. 12,666,655 91 5,942,954 1,074,408 5, 76
Oklahoma------------------- 437 41,459, 374 37,517, 345 190 3,702,015 1, 590,463 3.84
Independent---- 102 8,485,772 7,367,390 56] 1,021,293 336, 166 3.96
Line-------------------- 274 23,351,547. 22, 143,785 86 1,072, 701 903, 594 3.87
Cooperative------------ 61 9,622,055 8,006, 170 48. 1,608,021 350,703| 3.64
ors' ----------------- 29 2,272, 575 1, 926,995 4 343, 357 152,282 6.66ndependent----------- 2 Y X 1 X) (x) (x)
#ine-------------------- 22 1,071,200 1,063, 301 1 X) 66, 136 6.17
Cooperative------------ 5 (X) (x) 2 (x) (X) (x)
Pennsylvania---------------- 6 456, 895 232,488 4 224,497 40, 151 8.79
#pendent---- 6 456,985 232,488 4 224,497 40, 151 8. 79*----------------------------|--------------|------------|----------------------------------------
Cooperative------------|--------|--------------------------|--------------------|------------|--------
South Carolina--------------- 1 (x) (x) --------|------------ (X) (x)
Independent-----------|--------|--------------------------|--------|------------|------------|--------
Line------------------------------------------------------|--------|------------|--------------------
Cooperative------------ 1 (x) (x) --------|------------ (X) (x)
South Dakota---------------- 733 63, 830,788 56,997,462 460 6,363,849| 2,540, 320 3. 98
Independent----------- 197| 15, 538,521 14, 215,640 104. 1,322,881 39,765 3.47
Line-------------------- 298 14,835, 598 13,265, 559 169 1, 132, 102 749,445 5.05
Cooperative------------ 238 33,456,669| 29, 516,263 187 3,908, 8661 1,251, 110 3.74

28 CENSUS OF DISTRIBUTION
TABLE 2.—GRAIN ELEvATORs—NUMBER, TOTAL VOLUME of BUSINESS, SALES,
AND EXPENSES, 1929, BY TYPE AND BY STATEs—Continued
[(x) is used to prevent disclosure of individual 0perations)
STATE AND TYPE
exas-----------------------
Independent--
Cooperative------------
Utah------------------------
Independent-----------
Line--------------------
Cooperative------------
Virginia---------------------
Independent-----------
Line--------------------
Cooperative------------
Washington-----------------
Independent-----------
Line--------------------
Cooperative------------
West Virginia----------------
Independent-----------
Line--------------------
Cooperative------------
Wisconsin-------------------
Independent-----------
Line--------------------
Cooperative------------
Wyoming--------------------
ndependent--I
Line----------------
Cooperative------------
Num
ber of
estab
lish
ments
218
115
82
RETAIL SALES EXPENSES
Total Volume Sales to Percent
of business dealers Num- of total
ber re-| Amount Amount | volume
porting of busi
neSS
$35,688, 384 $33,581,830 49 $1,286,608 $1,170,096 3.28
18,029,746 16,381,767 30 926,667 * 2.97
13, 579,817 13,231,737 13 249,446 509, 307 3.75
4,078,821 3,968, 326 6 110,495 124,896 3.06
1, 162,749 369,048 3 10,840 80,639 6.94
(x) (3) (3) (3) (X) (x)
(X) (x) 3 (x) (x) (X)
(X (X 1 (x (x) (X)
# # 1 & (x) (x)
944,069 754,453 4 189, 616 53, 185 5.63
-344,069 "754,453 "4"| 189, 616 53,185. 5.63
263,665 152, 750 2 (x) (x) (X)
X) X) I--------|------------ (X) (x)
-------|--#--------3. "&;"|"(x)"|"(x)
1,493, 567| 1,095,789 8 397,778 118,278 7. 92
906, 117 606, 732 6 * 76,491 8.44
-587, 150 180,057"2" (#) ii. 78; 7.ii
2,039,728. 1,525,535 13 507,293 178,453 8.75
911,876 545, 515 8 359, 461 118, 595 13.01
X) (X) 4 (X) X (X)
X) (X) 1 (x) (x) (x)
* Not separately reported.
TABLE 3.—ELEVATORs—NUMBER BY TYPE, TOTAL volume of BUSINESS, AND
RETAIL SALES, 1929, BY STATES AND COUNTIES
NUMBER
Total volume -
STATE AND COUNTY Inde- Coop- of business Retail sales
Total pend- || Line era
ent tive
United States total----------------- 9,457 2,899 || 4,017 | 2,541 || $1,076,635,298 $121,486, 555
MIDDLE ATLANTIC
New York total----------------------- 12 3 9 -------- 835, 374 21,987
Livingston------------------------------ 9 -------- 9|-------- 760,500 --------------
Balance of State------------------------- 3 3 --------|-------- 74,874 21,987
Pennsylvania total------------------- 6 6 --------|-------- 456,985 224,497
EAST NORTH CENTRAL
Ohio total---------------------------- 438 235 74 129 46,661,724 12,643,075
Allen------------------------------------ 5 3 -------- 2 321,580 107,068
Ashland--------------------------------- 7 5 -------- 2 634,000 5,000
Auglaize-------------------------------- 5 4 -------- 1 325,019 149,642
Butler---------------------------------- 3 3|---------------- 358, 134,700
Champaign----------------------------- 11 9|-------- 2 862,737 327,551
Clark----------------------------------- 4 3 1 -------- 425,735 151,315
Clinton--------------------------------- 4 4 ---------------- 154,925 69,248
Crawford------------------------------- 10 6 -------- 893, 790 387, 745
Parke----------------------------------- 17 16 1 -------- 1, 175,637 322,538
Defiance-------------------------------- 7 3 -------- 718, 170, 801

DISTRIBUTION OF GRAIN 29
TABLE 3.-ELEVATORS-NUMBER BY TYPE, TOTAL VOI.UME of BUSINESS, AND
RETAIL SALES, 1929, BY STATES AND Count'IES—Continued
NUMBER
Total volume -
STATE AND COUNTY Inde- Coop- of business Retail Sales
Total | pend- | Line era
ent tive
EAST NORTH CENTRAL–Continued
Ohio–Continued.
Erie------------------------------------- 4 -------- 1 3 $603,486 $173,910
Fairfield-------------------------------- 8 7 -------- 1 466,331 119,831
Franklin-------------------------------- 7 6 -------- l 1,047,629 406,424
Fulton---------------------------------- 9 8|-------- 1 1, 117,979 460,468
Greene---------------------------------- 7 5 -------- 2 426, 156 184, 774
Hancock-------------------------------- 12 4 -------- 8 1,911,967 683,742
Hardin---------------------------------- 12 5 5 2 72, 585 116, 189
Henry---------------------------------- 13 3 -------- 10 2,259,727 419,428
Holmes--------------------------------- 4 4 --------|-------- 213,881 44, 889
Huron---------------------------------- 13 3 5 5 1,239,858 403,452
3 21-------- 1 247,263 164,958
3 2|-------- 1 141, 576 5,000
Logan----------------------------------- 4 4 --------|-------- 396, 519 197,331
Lorain---------------------------------- 5 1'-------- 4 408, 143 73,800
Madison-------------------------------- 11 10 1 -------- 1,842, 543 395, 125
Marion---------------------------------- 8 3 -------- 5 531,917 221, 307
Medina--------------------------------- 5 2 -------- 3 1,005,432 768,646
Mercer---------------------------------- 10 9 1 -------- 595,875 180,971
Miami---------------------------------- 17 11 5 1 1,748, 747 69,
Montgomery---------------------------- 6 4 -------- 2 878,414 349, 572
Ottawa--------------------------------- 7 ---------------- 7 1, 272,931 600, 515
Paulding-------------------------------- 14 3 5 6 1,788,703 203,418
Pickaway------------------------------- 10 7 -------- 3 993, 222 219, 229
Preble---------------------------------- 6 4 1 1 575,957 157, 127
Putnam--------------------------------- 14 3 9 2 1,493,832 347, 312
Richland-------------------------------- 4 2 -------- 2 299,646 81,626
Ross------------------------------------ 7 6 1 -------- 1,008,205 106, 120
Sandusky------------------------------- 13 7 2 4 1,985,796 294,040
Senaca---------------------------------- 23 1 15 7 1,789,927 326,474
Shelby---------------------------------- 18 12 -------- 6 1,394, 224 402, 724
Union----- 6 2 2 2 367,637 114, 136
Van Wert- 17 10 2 5 1,894, 149 474, 558
Wayne---------------------------------- 10 4 4 2 1,549, 115 209,077
Williams-------------------------------- 8 6 1 1 1,789,839 379,689
Wood----------------------------------- 23 6 7 10 2,877, 192 374,726
Wyandot------------------------------- 9 5 2 2 561, 539 201, 385
Balance of State------------------------- 15 8 3 4 1, 593, 853 405,994
Indiana total------------------------- 388 210 123 55 32,287,912 6, 115,914
Adams---------------------------------- 6 3 2 1 348,418 39,226
Allen------------------------------------ 5 3 1 1 281,863 32, 139
Bartholomew--------------------------- 10 7 2 1 629, 170 80, 617
Benton - 14 7 3 4 1,881,476 24,030
B0one - 5 2 31-------- 68,245 41,614
Carroll---------------------------------- 9 3 4 2 762,237 86,892
Cass------------------------------------ 11 3|-------- 8 1,275,000 232, 100
Clinton--------------------------------- 15 14 1 -------- 1,419,605 452, 274
Daviess--------------------------------- 3 2 1 -------- 6, 545 62, 545
Decatur--------------------------------- 5 1 4 |-------- 317,786 123, 104
DeKalb-------------------------------- 3 3 --------|-------- 162, 103 , 105
Delaware--------------- 7 2 l 4 434,060 221,018
Fayette------- 4 4 --------|-------- 253,058 38, 126
Fountain 10 6 2 2 1,035, 118 218,593
Fulton-------------- 6 4 1. 1 720, 212 280, 565
Gibson---------------- 5 2 3|-------- 205, 307 12,751
Grant----------------- 5 3 1 1 359, 458 31, 809
Greene-------------- 5 5 --------|-------- 5,684 54,646
Hamilton------------- 3 1 1 1 301,473 114,513
Hancock-------------------------------- 7 6 1 -------- 401, 290 149,374
Hendricks------------------------------- 4 2 2|-------- 112, 119 |--------------
Henry---------------------------------- 3 l 1 1 310,732 98,203
Howard--------------------------------- 4 4 ---------------- 264, 500 69, 750
Huntington----------------------------- 4 2 1 1 406,121 91,057
Jay------------------------------------- 5 1 4 |-------- 235,000 66,310
Jasper----------------------------------- 16 4 10 2 992, 782 --------------
Johnson--------------------------------- 6 5 1 -------- 795,429 306, 359
6 5 -------- 1 535,058 1, 8
6 2 2 2 715,792 130,596
6 4 -------- 2 716,433 155,919
5 3 2 -------- 210,019 34,549
4 1 3 -------- 165,086 38,478
9 7 1 1 666,022 172,547

30 CENSUS OF DISTRIBUTION
TABLE 3.-ELEVATORS-NUMBER BY TYPE, TOTAL WolUME of BUSINESS, AND
RETAIL SALES, 1929, BY STATES AND Count'IEs—Continued
NUMBER
STATE AND COUNTY Inde- - Coop
Total pend- | Line era
ent TIVE
EAST NORTH CENTRAL–Continued
Indiana—Continued.
Montgomery---------------------------- 9 3 5 1
Newton--------------------------------- 7 3 3 1
Noble----------------------------------- 3 2 1 --------
Porter----------------------------------- 4 2 1 1
9 4 5 --------
5 2 -------- 3
12 6 5 1
10 2 8|--------
3 3 ----------------
13 5 6 2
5 5 ----------------
3 3 ----------------
15 6 8 1
7 4 2 1
4 4 --------|--------
Vanderburg----------------------------- 5 -------- 5 --------
Vermillion------------------------------ 3 2 1 --------
Wabash--------------------------------- 8 5 1 2
Warren--------------------------------- 13 9 4 --------
Wayne---------------------------------- 3 2 -------- 1
White----------------------------------- 7 5 2 --------
Whitley--------------------------------- 3 1 1 1
Balance of State------------------------- 21 10 7 4
Illinois total-------------------------- 939 414 232 293
8 6 -------- 2
7 4 -------- 3
3 1 -------- 2
6 1 3 2
19 8 2 9
3 3 ----------------
7 -------- 2 5
36 19 5 12
18 9 4 5
Clinton--------------------------------- 6 2 -------- 4
Coles----------------------------------- 12 7 4 1
Crawford------------------------------- 5 5 ----------------
DeKalb-------------------------------- 10 4 3 3
DeWitt-------------------------------- 11 l 8 2
Douglas--------------------------------- 15 8 4 3
Edgar----------------------------------- 31 7 24 --------
Edwards-------------------------------- 4 4 ----------------
Ford------------------------------------ 9 3 -------- 6
Fulton---------------------------------- 13 3 5 5
Gallatin--------------------------------- 4 4 --------|--------
Greene---------------------------------- 10 4 2 4
Hancock-------------------------------- 19 11 l 7
Henderson------------------------------ 6 6 ----------------
Henry---------------------------------- 12 6 -------- 6
Iroquois--------------------------------- 13 2 3 8
Jackson--------------------------------- 3 -------- 2 1
Jo Daviess------------------------------ 3 3 ----------------
Kankakee------------------------------- 21 6 5 10
Kendall--------------------------------- 8 3 -------- 5
Knox----------------------------------- 15 4 4 7
La Salle--------------------------------- 22 9 -------- 13
Lawrence------------------------------- 3 1 -------- 2
Lee------------------------------------- 15 7 -------- 8
Livingston------------------------------ 36 22 6 8
Logan----------------------------------- 27 13 7 7
McDonough---------------------------- 13 4 5 4
McLean-------------------------------- 49 27 5 17
Macon---------------------------------- 26 13 8 5
Macoupin------------------------------- 13 7 -------- 6
Madison-------------------------------- 5 2 -------- 3
Total volume
of businessRetail Sales
$480,093 $85,457
172,848
414,695
1, 559, 959
119,010,783
605, 527
153,612
1,739,732
25,985
1,315, 509
1,585,254
2, 110,443
2,509,852
317,062
1,623,463
1,629, 153
232, 518
881, 977
1,395, 209
554, 186
1,828, 263
1,341, 320
5, 237, 565
1,064,943
343, 104
49, 588
55,936
53,390
330,270
411, 555
14,615, 129
108,379
184, 375
291,943
184, 176
1,005,737
72, 211
92,080
34,624
314,990
129,239
89, 705
95, 256
101, 501
107,335
420, 333
27, 341
146,983
362,043
50,925
445,957
211, 136
9, 164
251,469
273,741
179, 283
186,863

DISTRIBUTION OF GRAIN 31
TABLE 3.-ELEVATORs—NUMBER BY TYPE, TOTAL VOLUME OF BUSINESS, AND
RETAIL SALES, 1929, BY STATES AND COUNTIES—Continued
NUMBER
Total volume -
STATE AND COUNTY Inde- Coop- of business Retail sales
Total | pend- || Line era
ent tive
EAST NORTH CENTRAL–Continued
Illinois–Continued.
Marshall-------------------------------- 10 3 7 -------- $1,345,819 $177,958
Mason---------------------------------- 24 1 18. 5 1,933,291 ,958
Menard--------------------------------- 11 -------- 7 4 1, 203,765 8,364
Monroe--------------------------------- 4 -------- 4 -------- 306, 102 27, 173
Montgomery---------------------------- 7 3 -------- 4 559, 611 123,611
Morgan--------------------------------- 23 6 7 10 1,960,832 225,771
Moultrie-------------------------------- 22 15 4 3 2,897,713 105,564
Ogle------------------------------------ 22 17 3 2 1,725, 221 611,471
Peoria---------------------------------- 10 3 2 5 1,305,770 188,042
Piatt------------------------------------ 8 4 3 1 876,499 54,752
Pike------------------------------------ 7 1 5 1 467, 645 138,976
Putnam--------------------------------- 6 2 1 3 924, 415 102, 125
Randolph------------------------------- 3 2 1 -------- 65, 645 7,983
Rock Island----------------------------- 3 1 -------- 2 562,270 241,300
Sangamon------------------------------- 36 16 15 5 3,086, 403 198,001
Scott------------------------------------ 8 3 3 2 1,043,425 171, 161
Shelby---------------------------------- 5 5 --------|-------- 536,872 23,312
Stark----------------------------------- 5 2 1 2 732,725 45,943
Stephenson----------------------------- 4 3 1 -------- 136, 357 115,754
Tazewell-------------------------------- 50 14 10 26 3,931, 234 316,466
Vermilion------------------------------- 26 17 8 1 2,967,440 140,097
abash--------------------------------- 7 4 3|-------- 439,800 ,099
Warren--------------------------------- 7 -------- 5 2 661,374 85,641
Washington----------------------------- 9 8 -------- l 435, 158 177,876
White----------------------------------- 10 3 7 -------- 449,624 43,715
Whiteside------ 6 2 l 3 1,216,082 324, 411
ill-------------- 17 10 -------- 7 2, 383,692 495,238
Winnebago------------------------------ 3 2 1 !-------- 215,468 126,805
Woodford------------------------------- 16 9 2 5 3, 585, 520 312, 723
Balance of State------------------------- 24 9 1 14 3,012,806 995, 316
Michigan total------------------------ 297 133 99 65 41,995,776 9, 863,432
Alcona---------------------------------- 4 4 ---------------- 323,670 153,896
Barry----------------------------------- 8 1 3 4 1,039,385 515,332
Bay------------------------------------- 6 3 3 -------- 554, 225 38, 818
Calhoun-------------------------------- 6 4 -------- 2 697, 352 112,919
Clare------------------------------------ 3 1 2 -------- 279,822 57,877
Clinton--------------------------------- 10 4 5 1 2, 150,049 485,237
Eaton----------------------------------- 12 5 4 3 1,973,260 620,710
Genesee--------------------------------- 7 4 2 1 1,401,952 256, 110
Gratiot---------------------------------- 17 5 9 3 3,292,656 411, 192
Huron---------------------------------- 21 2 12 7 3,681,963 401,001
Ingham--------------------------------- 10 6 2 2 1,535, 461 466,899
Ionia------------------------------------ 12 9 1 2 1,953,255 622,062
Iosco------------------------------------ 3 1 -------- 2 143,263 45,756
Isabella--------------------------------- 8 5 2 1 1,303,232 195,538
Jackson--------------------------------- 5 3 -------- 2 417,305 100, 897
Kent------------------------------------ 10 5 -------- 5 1,053,776 548,360
Lapeer---------------------------------- 7 5 2|-------- 717,664 177,731
Livingston------------------------------ 5 4 1 581,320 97, 377
Mason.----- 4 1 3 69,963 20, 507
Monroe---- 6 2 3 1,070,661 281,687
Montcalm------------------------------ 16 9 7 -------- 1, 766,087 330, 843
Oakland-------------------------------- 4 1 354,456 92,115
Osceola----------------------------- 3 3 156,278 40,
Ottawa----------------------------- 3 1 1 693,812 608,886
St. Clair-------------------------------- 9 5 4 876,493 184,637
St. Joseph------------------------------- 7 5 1 379,371 96,080
Saginaw--------------------------------- 15 2 10 3 3, 122,874 831,926
Sanilac---------------------------------- 14 7 4 3 999, 330 186,051
Shiawassee------------------------------ 15 7 5 3 3,084,706 402, 739
Tuscola--------------------------------- 23 5 14 4 3,461,784 821,860
Balance of State------------------------- 24 13 3 8 2,860,351 658, 389
Wisconsin total----------------------- 18 13 -------- 5 1,493, 567 397,778
Calumet-------------------------------- 3 3 ---------------- 393, 922 111, 508
Manitowoc------------------------------ 3 2 -------- 1 209,821 63,671
Balance of State------------------------- 12 8 -------- 4 889, 824 222, 599
... -

32 CENSUS OF DISTRIBUTION
TABLE 3.—ELEVATORs—NUMBER BY TYPE, TOTAL VOLUME OF BUSINESS, AND
RETAIL SALES, 1929, BY STATES AND Count'IEs—Continued
NUMBER
STATE AND COUNTY Inde- Coop- "' Retail Sales
Total pend- | Line era
ent tive
WEST NORTH CENTRAL
Minnesota total.----------- - 860 198 396 286 $67,784, 688 $10,157,605
Becker---------------------- 7 2 3 ,891 277, 167
Benton---------------------------------- 3 2 1 -------- 356,028 114,850
Big Stone------------------------------- 22 5 14 3 1,018,631 115,983
Blue Earth------------------------------ 19 4 13 2 1,340,655 142,097
Brown---------------------------------- 16 5 7 4 1,406,211 124, 144
Carver---------------------------------- 6 1 2 3 204,982 92,674
Chippewa------------------------------- 18 3 9 6 1,314,591 184,929
Clay------------------------------------ 29 5 16 8 1,962,686 280,649
Cottonwood----------------------------- 10 3 2 5 1,527, 560 362,338
Dakota--------------------------------- 7 2 3 2 442,643 43, 565
Dodge---------------------------------- 5 3 -------- 2 486,804 49,343
Douglas--------------------------------- 10 5 3 2 427, 206 101,535
Faribault------------------------------- 15 2 3 10 2, 199,857 446,734
Fillmore-------------------------------- 9 5 -------- 4 673,482 117,606
Freeborn-------------------------------- 13 3 8 2 614,405 149,115
Goodhue-------------------------------- 7 3 1 3 1,227,255 266,647
Grant----------------------------------- 19 5 9 5 1,097, 181 172,487
Hennepin------------------------------- 3|-------- 3 -------- 677,366 6, 218
Jackson--------------------------------- 10 4 -------- 6 1,840,497 264,305
Kandiyohi------------------------------ 18 6 7 5 ,098,009 161,130
Kittson----------------------- - ----- 16 4 3 9 1, 104,689 131,810
Lacqui Parle--------------------------- 21 1 12 8 1,714,567 187, 523
9 2 6 1 677,750 72,653
12 1 7 4 942,743 193,187
28 8 10 10 2,989,045 182,064
13 1 7 5 836,970 260,470
23 4 10 9 1,890, 142 184,914
20 4 7 9 2,099, 370 410,904
13 4 4 5 711, 342 85,443
Morrison-------------------------------- 4 1 3 -------- 243,355 47,956
Mower---------------------------------- 16 7 5 4 779,083 227,783
Murray--------------------------------- 10 3 2 5 1, 176,554 129,896
Nicollet--------------------------------- 4 -------- 3 1 1,826 53,995
Nobles---------------------------------- 17 1 11 5 2,026,577 196,235
Norman--------------------------------- 26 2 17 7 1,629,662 145,823
Olmsted.-------------------------------- 3 1 1 1 387,425 ||--------------
Otter Tail------------------------------- 18 8 4 6 1, 124,074 179,756
Pennington----------------------------- 6 2 3 1 348,839 17,012
Pipestone------------------------------- 14 1 7 6 675,636 137,265
Polk------------------------------------ 44 1 35 8 2,004,045 214,232
ODe------------------------------------ 10 6 1 3 603, 550 91,430
Red Lake------------------------------- 10 1 5 4 418,379 38,360
Redwood-------------------------------- 29 8 12 9 3,453,477 346,456
Renville-------------------------------- 24 3 13 8 2, 163,671 378,573
Rice------------------------------------ 5 l 1 3 470,374 133,890
Rock------------------------------------ 23 3 11 9 1,923,804 264,792
Roseau---------------------------------- 5 -------- 4 1 26,380 24,503
Scott------------------------------------ 8 4 2 2 886,917 130,529
Sherburne------------------------------- 3 3|--------|-------- 227,965 10,863
- 7 3 2 2 791, 119 179,317
16 9 6 1 666, 108 124,771
4 -------- 2 2 218,807 59, 947
13 7 3 3 1,229,685 120,756
21 6 11 4 1,496,441 143,911
5 2 3 -------- 139,458 7,730
Traverse-------------------------------- 18 3 13 2 816,345 51, 184
Wabasha-------------------------------- 8 1 6 1 1,316,394 411,714
Wadena--------------------------------- 4 -------- 3 1 180,745 29, 308
Waseca.--------------------------------- 6 1 1 4 472,336 82,243
Watonwan------------------------------ 14 1 8 5 1,357, 316 185, 134
Wilkin---------------------------------- 20 4 8 8 1, 544,225 67,780
Winona--------------------------------- 9 2 4 3 596,613 158,671
Wright--------------------------------- 9 2 5 2 331,460 145,944
Yellow Medicine------------------------ 16 1 6 9 1,730,008 234,766
10 3 5 2 648,477 202,596Balance of State-------------------------

DISTRIBUTION OF GRAIN 33
TABLE 3.—ELEVATORs—NUMBER BY TYPE, TOTAL VOLUME OF BUSINESS, AND
RETAIL SALES, 1929, BY STATES AND CoUnt,IEs-Continued
NUMBER,
STATE AND COUNTY Inde- Coop- "' Retail sales
Total pend- || Line era
ent tive
WEST NORTH CENTRAL–Continued
Iowa total---------------------------- 692 246 172 274 $97,279,294 $14,273,928
Audubon------------------------------- 3 1 2 -------- ,797 10,050
Benton---------------------------------- 12 5 2 5 1,575,391 261,947
Black Hawk---------------------------- 6 5 -------- 1 722,371 144,695
Boone----------------------------------- 12 6 2 4 2,518,083 212,538
Buchanan------------------------------- 10 6 1 3 ,233 99,938
Buena Vista---------------------------- 11 3 4 4 1,566,635 243,045
Butler---------------------------------- 8 5 -------- 3 693, 122 259,971
Calhoun-------------------------------- 14 3 3 8 2,487,644 135,294
Carroll---------------------------------- 11 5 2 4 1,964,891 196,859
Cass------------------------------------ 6 l 3 2 923,930 50,445
Cedar----------------------------------- 6 2 3 1 547, 139 233, 360
Cerro Gordo---------------------------- 4 1 2 1 267,173 56,990
Cherokee-------------------------------- 6 2 -------- 4 850,044 , 260
Clay------------------------------------ 11 5 2 4 1,617,676 313,238
Clinton--------------------------------- 4 2 -------- 2 514, 142 94, 105
Crawford------------------------------- 4 2 1 1 1,642, 146,116
Dallas----------------------------------- 5 -------- 3 2 844,095 20,627
Decatur--------------------------------- 4 -------- 4 -------- 91, 764 14,500
Dickinson------------------------------- 4 -------- 3 1 314,802 22, 185
Emmet--------------------------------- 11 3 5 3 904,360 72,292
Floyd----------------------------------- 4 1 -------- 3 582, 537 127, 119
Franklin-------------------------------- 7 2 1 4 1, 201,862 328,993
Fremont-------------------------------- 15 6 5 4 2,682,386 110,873
Greene---------------------------------- 12 2 7 3 2,360,763 302,852
Grundy--------------------------------- 12 4 -------- 8 1,461,484 424,695
Guthrie--------------------------------- 10 4 2 4 1,905,613 219,839
Hamilton------------------------------- 15 4 1 10 3,205, 315 650,651
Hancock-------------------------------- 16 7 1 8 2, 138,408 545,967
Hardin---------------------------------- 19 7 -------- 12 2,811, 287 405, 168
Harrison-------------------------------- 4 3 -------- l 570,800 95,974
Henry---------------------------------- 10 1 4 5 1,311,251 439, 185
Howard--------------------------------- 5 -------- 5 -------- 141, 570 34,466
Humboldt------------------------------ 11 2 3 6 1,819,262 339,411
5 1 2 2 469,719 68,234
7 2 3 2 564, 283 39,848
7 -------- 2 5 1,392,058 251,816
6 3 3 -------- 406,157 , 244
3 l 2 -------- 47, 209 18, 159
3 2 -------- 1 146,400 *
4 1 1 2 249,317 89, 182
17 4 5 8 3,254, 147 91,093
5 3 l 1 538,451 144, Š9
4 ---------------- 4 300,959 105,743
13 3 5 5 1,382,853 245, 147
Mahaska-------------------------------- 3 1 -------- 2 * 49,601
Marshall-------------------------------- 12 7 -------- 5 1,352,644 316, 240
Mills------------------------------------ 7 6 -------- 1 1,773,479 149,555
Mitchell-------------------------------- 9 3 3 3 793, 939 248,562
Monona--------------------------------- 13 7 1 5 2,640,087 56,077
Muscatine------------------------------ 4 3 1 -------- 450, 940 69,747
O'Brien--------------------------------- 17 6 4 7 2,406,006 398, 589
Osceola--------------------------------- 14 2 7 5 1,521,704 40, 553
Page------------------------------------ 4 ---------------- 4 866, 354 65,354
Palo Alto------------------------------- 10 3 2 5 2,281,724 251,873
Plymouth------------------------------- 14 5 4 5 1,775,248 409, 122
Pocahontas----------------------------- 12 5 1 6 2,017,773 147,704
Polk------------------------------------ 10 2 6 2 868, 414 ,044
Pottawattamie-------------------------- 7 -------- 6 1 489,685 ||--------------
PoweShiek------------------------------ 4 1 2 1 661,213 207,730
Ringgold-------------------------------- 6 5 1 -------- 134, 581 26,000
Sac-------------------------------------- 7 2 1 4 1,880, 461 318,767
Scott------------------------------------ 6 3 -------- 3 674,611 211,963
Shelby-------------- ---- - --- - ---- - - - - - - - 7 -------- 5 2 1,015, 489 24,710
Sioux----------------------------------- 18 6 4 8 3,018,007 543,670
Story----------------------------------- 21 8 6 7 3, 187,755 532,822
Tama----------------------------------- | 12 8 2 2 7,028 223,093

34 CENSUS OF DISTRIBUTION
TABLE 3.-ELEVATORS-NUMBER BY TYPE, TOTAL VOLUME OF BUSINESS, AND
RETAIL SALES, 1929, BY STATES AND COUNTIES—Continued
NUMBER
STATE AND COUNTY Inde- Coop- "' Retail sales
Total pend- || Line era
ent tive
WEST NORTH CENTRAL–Continued
Iowa—Continued.
Taylor---------------------------------- 3 21-------- 1 $232,900 $42,692
Union----------------------------------- 3 li-------- 2 597,039 43,536
Wapello--------------------------------- 3 2 1 -------- 181,249 21,249
Warren--------------------------------- 3 1 1 1 271,576 1, 274
Washington----------------------------- 4 4 ---------------- 114,019 23,972
Webster--------------------------------- 29 11 4 14 5, 285, 152 384, 504
Winnebago.------------------------------ 8 -------- 1 7 1,074,468 199,516
Woodbury------------------------------ 19 10 3 6 2, 199, 431 184,203
Worth---------------------------------- 5 3 2 -------- 331, 210 59, 701
Wright----------- 14 -------- | 5 9 2,459,225 483,486
Balance of State-- 18 9 | 4 5 1,870,410 347,046
Missouri total- 158 80 31 47 11,993,238 2,707, 362
Barton------------ 5 l 4 -------- 383,954 65,8
Bates---------------------------------- 7 6 -------- l 714, 548 --------------
Buchanan------------------------------- : : --- -------- #*# I##àSS------------------------ - - - - - - -- - -- - 3 | 3 |--------|-------- * 30, 400
Chariton-------------------------------- 7 3 l 3 417,438 19,961
Cooper---------------------------------- # : --- 2 ## 84,963
Dade------------------------------------ 3 --------|-------- ,624 17, 527
Henry---------------------------------- 3 1 -------- 2 229, 667 160,834
Holt------------------------------------ 6 5 -------- 1 374,267 106,267
Howard--------------------------------- 3 2 -------- 1 255,357 95,263
Jasper----------------------------------- 7 3 2 2 268, 524 18,000
Lafayette------------------------------- 9 6 -------- 3 920, 483 ,023
Lincoln--------------------------------- d 1 -------- 5 368, 156,355
Moniteau------------------------------- 5 2 -------- 3 281,794 87,028
New Madrid---------------------------- 4 |-------- 4 -------- 67, 447 --------------
Pike------------------------------------ 4 1 -------- 3 345,370 219, 124
Platte----------------------------------- : - - -- - -3 || III 3 ## #.'.Rav------------------------------------- - * ---------------- * *
St. Clair-------------------------------- 3 2 1 -------- 110,208 14,785
St. Louis-------------------------------- 3 ---------------- 3 153,962 50,210
Saline----------------------------------- 4 1 2 1 153,980 41,568
Scott------------------------------------ 5 1 4 -------- 284,697 17, 500
Texas----------------------------------- 11 ------ -- 11 -------- 814,938 --------------
Vernon---------------------------------- 3 2 -------- 1 77,079 1,079
Balance of State------------------------- 43 28 2 13 4,485, 517 1, 185,281
North Dakota total------------------- 1,# 259 819 413 136, 310,504 8,428, 272
5 3 7 5 2,454, 434 216, 232
49 10 25 14 4,768, 574 661, 473
47 6 30 11 2,970, 847 167,608
59 6 42 11 4, 524,979 304, 201
#| | | #| #| ### #* * 104, 510
18 4 10 4 1,902,430 78,681
45 10 14 21 4, 559,218 323, 545
Cavalier-------------------------------- 55 10 35 10 3,990, 350 262,208
Dickey---------------------------------- 15 2 7 6 606, 935 81, 593
Divide---------------------------------- 23 3 12 8 1,882,644 79,499
Dunn----------------------------------- 13 1 8 4 1,714,722 50, 168
Eddy----------------------------------- 11 1 7 3 1,046,355 67,034
Emmons-------------------------------- 21 8 5 8 2,334,415 150,021
Foster----------------------------------- 15 3 9 3 862,012 57,996
Golden Valley---------------- - - - - - --- 9 -------- 5 4 1,862,398 48,415
Grand Forks---------------------------- 44 8 26 10 3,092, 536 191,087
Grant----------------------------------- 18 4 12 2 1, 155,358 4,091
Griggs---------------------------------- 27 2 17 8 1, 588, 572 211,263
Hettinger------------------------------- 18 -------- 11 7 , 282, 36,888
Kidder---------------------------------- 16 1 9 6 1, 342, 402 195,954
La Moure------------------------------- 37 11 18 8 2,645,068 233, 541
Logan----------------------------------- 20 12 3 5 1,677,942 67, 120
McHenry------------------------------- 47 10 24 13 4, 225, 522 191, 531
McIntosh------------------------------- 19 17 1 1 1,547, 435 27, 281
McKenzie------------------------------- 14 -------- 11 3 1,980, 817 7,824
McLean-------------------------------- 31 7 16 8 3,929,847 98,432
Mercer---------------------------------- 14 2 7 5 1,777, 617 56,484
Morton--------------------------- -- 24 5 12 7 3,080, 848 305,390
Mountrail------------------------------- 38 6 20 12 4,697, 634 96, 489

DISTRIBUTION OF GRAIN 35
TABLE 3.—ELEVATORS-NUMBER BY TYPE, TOTAL WOLUME OF BUSINESS, AND
RETAIL SALES, 1929, BY STATES AND COUNTIES-Continued
NUMBER
STATE AND COUNTY Inde- Coop- "' Retail sales
Total pend- || Line era
ent tive
WEST NORTH CENTRAL–Continued
North Dakota—Continued.
Nelson---------------------------------- 30 6 19 5 $1,683, 198 $101, 203
Oliver----------------------------------- 4 1 3 -------- 175,538 1,445
Pembina-------------------------------- 46 3 35 8 2,804, 116 163, 175
Pierce----------------------------------- 25 5 17 3 1,847, 016 63,374
Ramsey--------------------------------- 47 4 20 23 3,609, 212 334,476
Ransom--------------------------------- 20 4 9 7 1, 294,952 201, 897
Renville-------------------------------- 34 3 22 9 3,693, 140 100,075
Richland-------------------------------- 34 4 20 10 2, 182,002 125, 365
Rolette---------------------------------- 28 2 20 6 1,677, 560 75,384
Sargent--------------------------------- 28 2 16 10 1,964, 529 201,044
Sheridan-------------------------------- 14 8 2 4 1, 545, 470 69,253
Sioux----------------------------------- 5 -------- 3 2 436,423 18, 773
Stark----------------------------------- 22 5 12 5 4, 115,497 52, 580
Steele----------------------------------- 17 3 13 1 1, 280,573 57,456
Stutsman------------------------------- 50 11 26 13 4,298, 423 280,819
Towner--------------------------------- 31 8 17 6 2,399, 665 173,032
Traill----------------------------------- 33 3 20 10 3,732,774 379,499
Walsh----------------------------------- 49 5 31 13 3,307,705 462, 610
Ward----------------------------------- 59 7 33 19 6,792,628 218, 462
Wells----------------------------------- 41 10 23 8 3, 547,615 164, 586
Williams-------------------------------- 44 6 26 12 5,609, 230 216,982
Balance of State------------------------- 27 2 1 24 3, 116,008 333, 147
733 197 298 238 63,830,788 6,363, 849
5 4 1 -------- 248,759 17, 121
18 3 13 2 1, 157,073 75,002
Bon Homme---------------------------- 12 4 5 3 1,024, 108 18,480
Brookings------------------------------- 15 5 6 4 1,034, 127 211, 214
Brown---------------------------------- 51 6 20 25 3, 243,419 352,362
Brule----------------------------------- 3 1 1 1 327,710 3, 401
Butte----------------------------------- 5 1 4 |-------- 291,817 29,850
Campbell------------------------------- 9 5 1 3 978,250 102,292
Charles Mix---------------------------- 18 7 8 3 2,275,302 101,131
Clark----------------------------------- 20 4 9 7 1,089,744 185, 992
Clay------------------------------------ 7 3 2 2 841,744 43,384
Codington.------------------------------ 20 2 12 6 959,077 117,346
Corson---------------------------------- 12 1 5 6 1, 539, 745 157, 390
Davison-------------------------------- 8 2 4 2 , 548 51,601
Day------------------------------------ 33 6 17 10 1,673, 107 206,626
Deuel----------------------------------- 16 8 5 3 1,034,428 157,817
Dewey---------------------------------- 12 3 5 4 84,672 59, 716
Douglas--------------------------------- 9 4 2 3 1, 557,090 34,731
Edmunds------------------------------- 17 8 4 5 1,616, 161 78, 504
Faulk----------------------------------- 18 3 6 9 1,662, 479 435,073
Grant----------------------------------- 18 3 10 5 713,780 78,949
Gregory--------------------------------- 5 1 -------- 4 1, 277, 802 101,737
Hamlin--------------------------------- 14 2 5 7 1,034,765 176, 101
Hand----------------------------------- 11 -------- 7 4 736,089 129,412
Hans0n 9 4 3 2 676,370 2,
Hughes---- 6 1 4 1 508,017 23, 111
Hutchinso 14 4 3 7 1, 873, 978 214,201
Hyde-------------------- 4 -------- 3 l 320, 28,703
Jerauld------------------ 8 3|-------- 5 1,036, 557 52, 165
Kingsbury----------- 28 12 10 6 1,671,409 190,008
6------------------- 14 3 6 5 1,502,940 278,706
Lincoln--------------------------------- 15 6 5 4 1, 558,285 66,635
Lyman--------------------------------- 8 2 6 -------- 309, 357 5,850
McCook-------------------------------- 19 4 8 7 1,681, 137 '40,270
McPherson----------------------------- 18 9 5 4 1,422, 246 131,274
Marshall-------------------------------- 20 6 9 5 1, 109,698 135, 123
Meade---------------------------------- 3 2 1 -------- 399,345 21,516
Miner---------------------------------- 12 5 5 2 479, 539 106,459
Minnehaha----------------------------- 20 4 7 9 1,969,045 257,308
Moody--------------------------------- 6 2 3 1 839, 566 122,771
Pennington----------------------------- 5 1 3 1 695, 532 71,561
Perkins--------------------------------- 6 1 3 2 990,319 26,277
Potter---------------------------------- 13 6 5 2 906, 421 94,743
Roberts--------------------------------- 32 6 15 11 1,950,867 196, 389

36 CENSUS OF DISTRIBUTION
TABLE 3.—ELEVATORS-NUMBER BY TYPE, TOTAL VOLUME OF BUSINESS, AND
RETAIL SALES, 1929, BY STATES AND Count'IEs—Continued
NUMBER
Total volume : I <
STATE AND COUNTY Inde- Coop- of business Retail Sales
Total | pend- || Line era
ent tive
WEST NORTH CENTRAL–Continued
South Dakota—Continued.
Sanborn-------------------------------- 7 1 3 3 $782,959 $116,854
Spink----------------------------------- 31 6 9 16 2,012,948 238,525
Sully----------------------------------- 4 2 2 -------- , 706 35,962
Tripp----------------------------------- 7 5 !-------- 2 1,706,430 168,398
Turner---------------------------------- 20 6 8 6 1,886,034 200,202
Union---------------------------------- 11 4 4 3 1,857,739 75, 169
Walworth------------------------------- 12 -------- 6 6 2, 180,556 106,045
Yankton-------------------------------- 12 4 4 4 89, 303 132,336
Ziebach--------------------------------- 3 -------- 2 1 203, 718 19,927
Balance of State------------------------ 10 2 4 4 1,943,765 279,833
Nebraska total----------------------- 698 228 204 266 102,298,558 9, 148,957
Adams---------------------------------- 18 2 3 13 1,586, 671 109,230
Antelope-------------------------------- 6 1 1 4 38, 520 348,892
00Ile---------------------------------- 16 4 8 4 967,863 193, 585
0yC1----------------------------------- 4 -------- 2 2 520,042 81,042
Buffalo--------------------------------- 10 2 8 -------- 635,096 43,867
Burt------------------------------------ 6 1 2 3 1,057,557 39,213
Butler---------------------------------- 21 4 7 10 2,924, 257 225,866
Cass------------------------------------ 17 7 2 8 2,816,363 133,833
Cedar----------------------------------- 12 2 9 1 1,226, 373 79,554
Chase----------------------------------- 3 1 -------- 2 1,302,907 221,883
Cherry---------------------------------- 5 1 3 1 1,246,950 291, 729
Cheyenne------------------------------- 16 11 -------- 5 2, 861, 272 216, 293
Clay------------------------------------ 20 4 7 9 2,601,660 161,067
Colfax---------------------------------- 3 1 1 1 50, 423 --------------
Custer---------------------------------- 18 6 7 5 2,845, 123 164, 764
Dakota--------------------------------- 6 3 2 1 30, 260 11, 635
Dawes---------------------------------- 3 3 --------|-------- 225,828 --------------
Dawson--------------------------------- 9 3 3 3 802,095 64, 215
Deuel----------------------------------- 5 2 1 2 2, 176,970 113,969
Dixon----------------------------------- 14 6 6 2 881.887 46, 330
Dodge---------------------------------- 5 -------- 2 3 687, 866 99, 114
Douglas--------------------------------- 5 4 1 -------- 1,481, 808 42,000
Dundy--------------------------------- 6 1 3 2 1, 283,002 67,885
Fillmore-------------------------------- 16 6 6 4 2,445, 173 233,266
Franklin-------------------------------- 7 4 -------- 3 893, 347 135,757
Frontier-------------------------------- 7 1 3 3 1, 181, 849 131,387
Furnas---------------------------------- 16 8 2 6 2,035, 312 124,615
Gage------------------------------------ 19 5 3 11 3, 107,998 119,299
Gosper---------------------------------- 3 1 -------- 2 , 045 181,651
Hall------------------------------------ 7 4 -------- 3 937,872 14,410
Hamilton------------------------------- 12|------- 6 6 4,089,689 170,102
arlan---------------------------------- 6 3 1 2 593,748 48, 166
Hitchcock-------------- 6 4 1 1 1,647, 368 *
Howard-------------- 6 1 -------- 5 832,973 248,384
Jefferson-- 13 5 2 6 1,441,297 56,226
Johnson-------------- 9 4 1 4 1, 224,527 179, 125
Kearney------------------ 11 4 3 4 1,055, 612 52,645
eith----------------------------------- 6 3'-------- 3 1, 517,803 54,483
Kimball---------- ---------------- --- 5 3 1 1 1,412, 735 50,000
Knox----------------------------------- 13 5 5 3 2,046, 897 68,230
Lancaster------------------------------- 32 14 2 16 4, 133,029 247,786
Lincoln--------------------------------- 3|-------- 1 2 585, 575 --------------
Madison-------------------------------- 4 -------- 3 1 725,040 50,000
Merrick--------------------------------- 9 1 5 3 837, 920 139, 517
Morrill--------------------------------- 4 3 1 -------- 496, 504 108,669
6 1 2 3 486,067 138, 200
5 1 2 2 361,663 ,995
11 4 2 5 1,092, 109 137,251
23 3 10 10 2, 471,943 143,686
6 3 -------- 3 68, 106 30, 242
7 3 1 3 1,950, 387 56, 185
11 3 4 4 1, 204, 635 219,058
5 3 2 -------- 252,470 62, 536
9 1 4 4 2, 135,678 64, 236
- 5 -------- 3 2 443,945 13,378
Redwillow- - - ------------------- --- 11 6 -------- 5 2,410, 222 341,807
Richardson----------------------------- 7 4 1 2 869, 626 35,027
Saline----------------------------------- 10 3 4 3 1,601, 771 177,900
Sarpy----------------------------------- 5 3 2 -------- , 160 39,653
Saunders------------------------------- 19 3 3 13 3,440,993 457,320
Seward--------------------------------- 20 6 5 9 3,477,269 347,931

DISTRIBUTION OF GRAIN 37
TABLE 3. ELEVATORs—NUMBER BY TYPE, TOTAL VOLUME OF BUSINESS, AND
RETAIL SALES, 1929, BY STATES AND Count'IEs—Continued
NUMBER
Total volume -
STATE AND COUNTY Inde- Coop- of business Retail Sales
Total pend- || Line era
ent tive
WEST NORTH CENTRAL–Continued
Nebraska—Continued.
Sheridan-------------------------------- 8 6 1 1 $1,796,487 $31,815
Sherman-------------------------------- 3 1 -------- 2 162,940 7,757
Thayer--------------------------------- 11 2 5 4 1,291,763 53,988
Thurston------------------------------- 7 1 6 -------- 543, 548 81,560
Valley---------------- ----------- 4 2 -------- 2 2, 104,072 393,070
Washington---------------------------- 7 2 5 |-------- 717, 163 201, 197
Wayne--------------------------------- 4 3 1 -------- 87,856 10,356
Webster-------------------------------- 11 4 2 5 1,601,002 134,424
York----------------------------------- 20 8 5 7 2,282,662 270,988
Balance of State------------------------ 21 4 10 7 2,679,915 9, 148,957
371 501 315 181, 555,913 14, 161, 559
2 2 1 540,000 62,000
Atchison-------------------------------- 21-------- 3 2,232,392 81,092
Barber---------------------------------- 19 3 11 5 1, 584,563 196,076
Barton---------------------------------- 31 15 11 5 3,952,052 282,999
Brown---------------------------------- 15 7 1-------- 8 1,620,991 200,676
Butler---------------------------------- 8 6 1 1 375, 163 36,857
Cherokee------------------------------- 8 1 2 5 840, 878 56,918
Cheyenne------------------------------- 4 3 -------- 1 1,026,763 2,310
lark----------------------------------- 9 -------- 6 3 2,334, 143 296,739
Clay------------------------------------ 15 8 2 5 1,988, 171 200,037
Cloud---------------------------------- 16 7 6 3 1,765,036 226,082
Coffey---------------------------------- 5 3|-------- 2 ,820 23,000
Comanche------------------------------ 5 -------- 3 2 1,642,667 10,403
Crawford------------------------------- 10 31-------- 7 5,446 264, 536
Decatur--------------------------------- 10 7 1 2 1,849, 502 108,831
Dickinson------------------------------- 22 6 7 9 2, 479,434 259, 117
Doniphan------------------------------- 11 10 -------- 1 796, 579 173,797
6 3 1 2 150,978 45,624
20 5 12 3 3,006, 562 66,731
Pllis------------------------------------ 12 1 7 4 2,857,093 235,840
Pllsworth------------------------------- 18 1 13 4 2, 137,399 168,801
Finney--------------------------------- 6 1 4 1 10, 567, 129 83, 450
*ord----------------------------------- 26 5 14 7 ,289, 142 702,981
Franklin-------------------------------- 3 2|-------- 1 162,975 30,000
Gove----------------------------------- 10 -------- 7 3 2, 120,249 114, 414
Graham-------------------------------- 11 1 7 3 1,497, 550 16,578
Grant----------------------------------- 9 1 8|-------- 3,463,321 |--------------
Gray------------------------------------ 17 2 11 4 6,456, 151 1, 251,233
Hamilton------------------------------- 5 2 3 -------- 29,951 57, 316
Harper---------------------------------- 15 4 6 5 1,302,731 *
Harvey--------------------------------- 15 3 9 3 951,428 44,467
Haskell--------------------------------- 9 3 5 1 2,676,046 98,216
Hodgeman------------------------------ 8 4 2 2 1,832, 559 142,937
Jackson--------------------------------- 10 4 -------- 6 742,622 73,487
Jefferson-------------------------------- 10 8 1 1 525,537 86,831
Jewell---------------------------------- 12 8 1 3 1,393,693 137,863
9 5 I-------- 4 75, 517 246,226
4 2 1 1 613,982 18, 507
15 5 8 2 2, 196, 101 89,095
25 8 15 2 2,782,335 143, 154
8 1 5 2 373,680 79,700
9 1 4 4 2,712,663 101,430
Leavenworth --------------------------- 3 2 1 -------- 138,475 , 300
Lincoln--------------------------------- 14 -------- 12 2 1,254, 244 35,848
Logan---------------------------------- 9 1 6 2 1,465,962 116,269
Lyon----------------------------------- 3 31--------|-------- 59, 20,392
McPherson----------------------------- 22 6 9 7 2, 111, 243 263,932
Marion---------------------------- 13 4 2 7 2,017,781 207,039
Marshall-------------------------------- 29 13 4 12 2,810, 404 239,015
Meade---------------------------------- 9 1 5 3 3,460, 344 139,249

38 CENSUS OF DISTRIBUTION
TABLE 3.—ELEvAToRs—NUMBER BY TYPE, TOTAL VOLUME of BUSINESS, AND
RETAIL SALES, 1929, BY STATES AND Count'IES-Continued
[(x) is used to prevent disclosure of individual operation]
NUMBER
STATE AND COUNTY Tokal Volume | Retail salesInde- Coop- of business
Total | pend- || Line era
ent tive
WEST NORTH CENTRAL–Continued
Kansas-Continued.
Miami---------------------------------- 4 3 -------- 1 $261,458 $111,926
Mitchell-------------------------------- 15 4 3 8 2,827,600 *
Morris---------------------------------- 7 * -------- 3 679,651 177, 350
Morton--------------------------------- 9 1 6 2 2,500,332 92,000
Nemaha-------------------------------- 9 5 1 3 812,041 125,909
Neosho--------------------------------- 6 * -------- 3 457, 521 179,940
Ness------------------------------------ 24 6 12 6 4,492,263 234,377
Norton--------------------------------- 12 7 2 3 2,299,207 28, 521
Osage----------------------------------- 5 * !-------- 2 321,875 65, 197
Osborne-------------------------------- 17 6 3 8 2, 385, 206 369,102
Ottawa--------------------------------- 19 6 10 3 2, 295, 544 216, 135
Pawnee--------------------------------- 23 2 14 7 4,631 391 785,075
Phillips--------------------------------- 13 9 -------- 4 2,423,790 160,840
Pottawatomie--------------------------- 6 " ---------------- 797,397 285,022
Pratt----------------------------------- 20 3 12 5 3,012, 382 219,244
Rawlins-------------------------------- 5 1 1 3 1,023,000 4,
Reno----------------------------------- 26 2 17 7 2,844, 520 166,401
Republic-------------------------------- 16 10 3 3 1,063,436 43,757
ice------------------------------------ 26 7 13 6 2,474,273 348,029
Riley----------------------------------- 3 1 -------- 2 488,864 128,706
Rooks---------------------------------- 19 6 9 4 2,858,949 74, 889
Rush----------------------------------- 14 1-------- 9 5 2,705,916 82, 104
Russell---------------------------------- 19 5 10 4 1, 732,850 125,650
Saline----------------------------------- 25 5 15 5 1,681,229 165,004
Scott----------------------------------- 5 2 2 1 396,258 48,745
Sedgwick------------------------------- 40 15 13 12 5,284, 872 483,867
Seward--------------------------------- 10 1 7 2 2,952,435 135, 525
Shawnee-------------------------------- 10 5 3 2 811,930 128,330
Sheridan-------------------------------- 7 3 3 l 822, 579 17,905
Sherman-------------------------------- 5 -------- 3 2 1,407, 358 43,002
Snith----------------------------------- 16 8 6 2 2, 177,822 270,345
Stafford--------------------------------- 17 -------- 11 6 2,835, 313 169,546.
Stanton--------------------------------- 8 4 4 -------- 1,876,604 3,500
Stevens--------------------------------- 10 3 4 3 2,213,948 12,008
Summer-------------------------------- 42 5 33 4 2,024, 552 106,816
Thomas-------------------------------- 24 8 12 4 4,292,848 122,017
Trego----------------------------------- 11 -------- 7 4 1,443,696 71,721
Wabaunsee----------------------------- 4 3 -------- 1 112,484 12, 245
Wallace--------------------------------- 3 1. 2 -------- 375, 473 69, 738
Washington---------------------------- 17 10 “) 5 2, 225,983 92,890
Wichita--------------------------------- 5 2 3|-------- 3, 112 125,000
Balance of State------------------------ 19 3 11 5 5,092, 621 210,894
SOUTH ATLANTIC
Maryland total----------------------- 9 9 ---------------- 2,240,284 225, 301
Queen Annes--------------------------- 3 * ---------------- 1,288,944 82, 802
Washington----------------------------- 3 3 ---------------- 139,000 28,000
Balance of State------------------------- | 3 3 ---------------- 812, 340 114,499
West Virginia total------------------- 5 3 -------- 2 (x) 57,000
Jefferson--------------------------------- 5 3 -------- 2 (x) 57,000
WEST SOUTH CENTRAL
Oklahoma total---------------------- 437 102 274 61 41,459, 374 3,702,015
f 36 10 21 5 2,518,958 249,872
18 3 15 -------- 2,267, 352 15,561
4 1 1 2 355,326 204,479
24 6 12 6 2,244, 748 224,879
15 4 6 5 1,655,063 417,528
Canadian------------------------------- 12 5 4 3 3,078,594 370,664
Cimarron------------------------------- 10 -------- 10 -------- 1, 107,281 2,000
Cleveland------------------------------- 3 2 1 -------- 118, 101 36,073
Comanche------------------------------ 8 2 6 -------- 718,286 163,680
Cotton---------------------------------- 6 3 2 1 474,221 109,891

DISTRIBUTION OF GRAIN 39
TABLE 3.—ELEVATORs—NUMBER BY TYPE, TOTAL VOLUME OF BUSINESS, AND
RETAIL SALES, 1929, BY STATES AND COUNTIEs—Continued
Total volume
of businessRetail Sales
NUMBER
STATE AND COUNTY Inde- Coop
Total pend- || Line era
ent tive
WEST SOUTH CENTRAL–Continued | |
Oklahoma—Continued.
Craig----------------------------------- 4 4 ----------------
Custer---------------------------------- 5 -------- 3 2
Dewey---------------------------------- 9 1 7 1
Ellis------------------------------------ 6 -------- 6 --------
Garfield--------------------------------- 34 4 22 8
Grady---------------------------------- 7 1 5 1
Grant----------------------------------- 24 3 18 3
Greer----------------------------------- 3 -------- 3|--------
Harper---------------------------------- 12 2 7 3
Jackson--------------------------------- 4 1 2 1
Kay------------------------------------- 21 4 13 4
Kingfisher------------------------------ 11 -------- 10 1
Kiowa---------------------------------- 11 3 7 1
6 1 3 2
15 2 11 2
5 2 3 --------
8 1 6 1
4 3 1 --------
Ottawa--------------------------------- 5 2 3 --------
Roger Mills----------------------------- 5 1 2 2
Rogers---------------------------------- 3 1 2 --------
Texas----------------------------------- 29 2 26 1
Tillman--------------------------------- 14 3 10 1
Tulsa----------------------------------- 6 4 2 --------
Washita--------------------------------- 7 2 4 1
Woods---------------------------------- 14 2 11 1
Woodward------------------------------ 11 4 5 2
Balance of State------------------------- 18 13 4 1
Texas total--------------------------- 218 82 115 21
Armstrong------------------------------ 4 1 3|--------
Bailey---------------------------------- 4 2 2 --------
Baylor---------------------------------- 4 2 2 --------
Carson---------------------------------- 13 3 8 2
5 2 3 --------
4 3 1 --------
8 2 6
6 2 4
4 2 2
Dallas----------------------------------- 3|-------- 3
Deaf Smith----------------------------- 5 1 3 1
Denton--------------------------------- 8 -------- 8 --------
Donley---------------------------------- 4 1 3 |--------
Floyd----------------------------------- 10 7 3|--------
Gray------------------------------------ 9 -------- 7 2
Grayson-------------------------------- 4 2 2 --------
Hale------------------------------------ 10 5 3 2
Hansford-------------------------------- 11 7 4 --------
Hardeman------------------------------ 3 1 : 2 --------
Hartley--------------------------------- 3 2 1 --------
Hemphill------------------------------- 3 1 2 --------
Lamb----------------------------------- 4 2 2 --------
Lipscomb------------------------------- 10 -------- 8 2
Ochiltree-------------------------------- 6 4 2 --------
Oldham--------------------------------- 9 5 1 3
Parmer--------------------------------- 11 3 : 6 2
Roberts--------------------------------- 3 -------- * 1 2
Sherman-------------------------------- 4 2 -------- 2
Swisher--------------------------------- 5 4|-------- 1
Balance of State------------------------- 41 16 23 2
$197, 591
1,058, 114
420,676
979,879
08
402,769
1,813, 106
58, 11
1,46i,756328, 575
1,546,644
1, 587,040
742, 178
512, 169
1,044,894
1,000, 373
179, 803
659, 161
230, 236
106,382
4,491, 179
1, 132,464
35,688, 384
738,479
731,452
496,277
201,766
1,583, 313
1,684,096
1,809, 122
1,454,852
34,022
2,082,303
4,984, 210
58,768
271, 180
1, 286,608
30,000
216,591
- --------
------

40 CENSUS OF DISTRIBUTION
TABLE 3.—ELEVATORs—NUMBER BY TYPE, TOTAL VOLUME OF BUSINESS, AND
RETAIL SALES, 1929, BY STATES AND Count'IEs—Continued
NUMBER
STATE AND COUNTY Total Volume | Retail salesInde- Coop- of business
Total | pend- | Line era
ent tive
MOUNTAIN
Montana total------------------------ 512 41 422 49 $45,343,283 $1,956,672
Blaine---------------------------------- 12 2 8 2 965,705 *
Broadwater----------------------------- 3 1 2 -------- 260,776 42
Carbon--------------------------------- 11 -------- 11 -------- 469,754 44, 655
Cascade--------------------------------- 24 |-------- 22 2 1,428,793 21,084
Chouteau------------------------------- 33 1 30 2 , 586,726 46,061
Custer---------------------------------- 4 1 3|-------- 292,279 22,271
Daniels--------------------------------- 17 1 12 4 2,039,827 152,319
Dawson--------------------------------- 15 -------- 14 1 1,351,247 52, 108
Pallon---------------------------------- 10 2 6 2 887,413 15,800
Fergus---------------------------------- 48 4 43 1 3,284, 150 187,004
Gallatin------------------- 17 2 15 1,565, 133 55,429
Glacier---------------------------------- 4 -------- 4 -------- 344, 282 16, 898
Golden Valley-------------------------- 7 1 5 1 227,293 39, 109
Hill:----------------------------------- 25 1 22 2 2,854, 135 58,425
Judith Basin---------------------------- 20 3 926, 156 34,930
Lak 4 -------- 193,679 18,071
7 1 876,955 19,057
6 -------- 495, 691 15,777
3 -------- 143,368 31, 736
Musselshell----------------------------- 8|-------- 334, 153 31,388
£ark:----------------------------------- 3|-------- 160,250 7,824
Phillips--------------------------------- 14 -------- 1,701,060 303,337
Pondera--------------------------------- 16 2 2,625,656 47,059
Prairie---------------------------------- 7 1 640,356 11,090
Richland-------------------------------- 14 1 10 3 1,498,633 17, 241
Roosevelt------------------------------- 23 1 17 5 3,016,651 48,631
Rosebud-------------------------------- 5 2 3|-------- 235, 545 5, 103
Sheridan-------------------------------- 30 4 20 6 3,239,364 85,917
Stillwater------------------------------- 15 1 12 2 823, 524 61,486
Teton----------------------------------- 32 1 27 4 2,796,297 44, 710
Toole----------------------------------- 6 -------- 6 -------- 625,238 11,296
Valley---------------------------------- 27 2 21 4 1,917,251 63,037
Wheatland------------------------------ 3|-------- 3 -------- 85,871 850
Wibaux--------------------------------- 5 2 2 1 787,174 21,646
Yellowstone----------------------------- 17 -------- 16 1 913,342 61,289
Balance of State------------------------- 17 4 12 1 1,749, 556 272,822
Idaho total--------------------------- 101 10 91 -------- 13,453, 715 1, 515,985
Bannock-------------------------------- 10 -------- 10 -------- , 191 58, 574
Bingham-------------------------------- 3|-------- 3|-------- 359,045 89,405
Bonneville------------------------------ 6 -------- 6 -------- 942,946 233,704
3|-------- 3 -------- 387,968 24,787
4 -------- 4 -------- 545,022 99,942
6 1 5 -------- 401, 266 36,573
3|-------- 31-------- 268,814 39,562
10 1 9|-------- 992, 464 109, 529
8|-------- 8|-------- 478,040 63,967
Jerome---------------------------------- 4 -------- 4 -------- 632,291 112,643
Latah----------------------------------- 3 1 2 -------- 1,546,838 ,944
Madison-------------------------------- 4 -------- 4 -------- 663,261 71,431
Nez Perce------------------------------- 3 -------- 3|-------- 192,023 16,570
Power----------------------------------- 6 -------- 6 -------- 877,042 57, 729
Teton----------------------------------- 4 -------- 4 -------- 347, 118 27,593
Twin Falls------------------------------ 8 1 7 -------- 2,347,820 212, 509
Washington----------------------------- 3 -------- 3|-------- ,902 34, 196
Balance of State------------------------- 13 6 7 -------- 1,425,664 222,327
Wyoming total------------------------ 18 9 7 2 2,039,728 507,293
Laramie--------------------------------- 7 1 4 2 874,020 139, 528
Balance of State------------------------- 11 8 3|-------- 1, 165,708 367,765
Colorado total------------------------- 181 34 119 28 23,055,265 2,386,210
Adams---------------------------------- 4 -------- 2 317, 106 6,381
Arapahoe-------------------------------- 5 -------- 5 -------- 681,472 21, 592
Baca------------------------------------ 11 3 8 -------- 2,376,537 132,500
Bent------------------------------------ 5 -------- 5 -------- 1,365,294 74,047
Boulder--------------------------------- 8 1 7 1-------- 713,025 70, 461
Cheyenne------------------------------- 6 2 4 -------- 629,053 46,968
Elbert---------------------------------- 4 -------- 3 1 329,693 28, 217
El Paso.--------------------------------- 4 2 1 1 454,122 145,110
Kit Carson------------------------------ 14 3 7 4 1,449, 238 144, 372
Larimer------------------------------- 9 4 5 -------- 1,063, 878 153,303

DISTRIBUTION OF GRAIN 41
TABLE 3.-ELEVATORS-NUMBER BY TYPE, TOTAL WOLUME of BUSINESS, AND
RETAIL SALES, 1929, BY STATES AND COUNTIES—Continued
NUMBER
STATE AND COUNTY Total Volume Retail sal- Inde- Coop- of business etall Sales
Total pend- | Line era- |
ent tive
MoUNTAIN–Continued
Colorado—Continued.
Lincoln--------------------------------- 4 3 1 -------- $289, 128 $44,498
Logan----------------------------------- 18 -------- 13 5 2,363,662 50,145
Morgan--------------------------------- 6 -------- 3 3 ,668 145,694
Phillips--------------------------------- 9 1 4 4 1,856,048 190,
Prowers--------------------------------- 8 1 1 ,331 167,902
Sedgwick--------------------- - 4 l 3 -------- 729,825 43, 500
Washington---------- - 4 -------- 3 1 384, 176 13,023
Weld--------------- - 29 7 19 3 3,497,204 484,482
Yuma------------------ - 6 -------- 4 2 1,016,974 81, 167
Balance of State------------------------- 23 6 16 1 1,999,831 312,565
New Mexico total--------------------- 8 5 8 -------- 3,067,053 32,314
Curry----------------------------------- 5 4 1 -------- 2,216, 231 32,314
Balance of State------------------------- 3 1 2 -------- 850, 822 --------------
Utah total---------------------------- 6 2 4 -------- 1, 162,749 10,840
PACIFIC
Washington total--------------------- 6 ---------------- 6 944,069 189, 616
Spokane--------------------------------- 3 --------|-------- 3 635,566 153,445
Balance of State------------------------- 3 ---------------- 3 308,503 36, 171
Oregon total-------------------------- 29 2 22 5 2,272, 575 343, 357
Morrow--------------------------------- 3|-------- 1 2 1,056, 148 224, 152
Umatilla-------------------------------- 20 l 18 1 840,390 i11,306
Balance of State------------------------- 6 1 3 2 376,037 7,899
All other States-------------------------- 10 7 2 1 1,850,050 150,000
TABLE 4.—GRAIN ELEVATORS-NUMBER, SALES TO DEALERS, AND EXPENSES,
BY SIZE OF BUSINESS, 1929
SALES To DEALERS 1 EXPENSES
SIZE OF BUSINESS N: - A '''Ver.- cent O
Total Average Total age | Sales to
dealers
Total----------------------------- 9,457 $934,458, 920 $98,811 || $42,401, 398 || $4,484 4.54
Independent------------------ 2,899 || 272,330,297 93, 939 12,742,050 4,395 4.68
Line-------------------------- 4,017 | 289,367,225 72,036 14,089, 345 3,507 4.87
Cooperative------------------- 2,541 372,761,398 | 146,699 15, 570,003 || 6, 128 4.18
$20,000 and under-------------------- 875 9,500, 114 10,857 1,226,459 1,402 12.91
Independent---------------------- 287 3, 153,393 10, 987 387,209 | 1,349 12. 28
Line------------------------------ 527 5,769, 106 10, 947 687, 541 | 1,305 11, 92
Cooperative----------------------- 61 577, 615 9,469 151, 709 2,487 26, 20
$20,001–$50,000------------------------- 2, 130 67,401,696 31,644 5, 104,901 | 2,397 7. 57
Independent---------------------- 594 18, 505, 318 31, 154 1, 506, 150 2,536 8. 14
Line------------------------------ 1,315 42, 115,009 32,027 2,900, 141 2,205 6.89
Cooperative----------------------- 221 6,781,369 30,685 698,610 3, 161 10.30
$50,001–$100,000---------------- -- 2,741 173,693,233 63,369 9,804,356 3, 577 5.64
Independent--------------- - 918 57,791, 679 62,954 3, 256,099 3,547 5.63
Line------------------------------ 1,238 79,678,204 64, 360 3,858,926 3, 117 4.84
Cooperative----------------------- 585 36,223,350 61,920 2,689, 331 4,597 7.42
$100,001-$200,000----------------------- 2,404 297,592,792 123,791 12,803,414 5,326 4.30
Independent---------------------- 761 92, 593,894 121,674 4, 156,743 5,462 4. 49
ine------------------------------ 694 89, 308,518 128,687 3,087,034 4,448 3.46
Cooperative----------------------- 949 115,690,380 121,908 5,559,637 5,858 4. 81
1#: not include Sales at retail or purchases of feed, fertilizer, implements, coal, and other supplies for
iileiiloers.

42 CENSUS OF DISTRIBUTION
TABLE 4.—GRAIN ELEVATORS-NUMBER, SALES TO DEALERS, AND EXPENSES,
BY SIZE OF BUSINESS, 1929–Continued
SALES To DEALERS EXPENSES
SIZE OF BUSINESS N: - A. #. f
- Ver.- cent O
Total Average Total age | Sales to
dealers
$200,001-$300,000----------------------- 750 $158,540,614 $211,387 $5,773,792 $7,698 3.64
Independent---------------------- 217 45,945, 787 211, 732 1,678,842 7,737 3.65
Line------------------------------ 142 31, 219, 141 219,853 1,083,048 7,627 3.47
Cooperative----------------------- 391 81,375,686 208, 122 3,011,902 || 7,703 3. 70
$300,001–$400,000----------------------- 305 91,482, 185 299,942 2,901, 313 9,513 3.17
Independent---------------------- 60 17,983,089 299,718 558,618 || 9,310 3.11
Line------------------------------ 54 16,820,791 311,496 631,721 | 11,699 3.76
Cooperative----------------------- 191 56,678,305 296,745 1, 710,974 8,958 3.02
$400,001–$500,000---------------------- 120 46,967,974 391,400 1, 524,940 | 12,708 3.25
Independent---------------------- 22 ,001,823 409, 174 239,808 || 10,900 2.66
Line------------------------------ 21 7,936,773 377,942 414,991 | 19,761 5.23
Cooperative----------------------- 77 30,029,378 389,992 870, 141 11,301 2.90
$500,001–$750,000----------------------- 99 52, 942,968 534, 777 1,931,329 19,508 3.65
Independent---------------------- 30 18, 179,269 605,976 363, 721 | 12, 124 2.00
ine------------------------------ 17 7,941, 607 467, 153 916,696 || 53,923 11.54
Cooperative----------------------- 52 26,822,092 515, 809 650,912 | 12,518 2.43
$750,001–$1,000,000--------------------- 23 17, 760,221 772, 184 708,875 30,821 3.99
Independent---------------------- 6 5,098,896 849,816 138,399 || 23,067 2.71
Line------------------------------ 7 5,650, 579 807, 226 407,595 58,228 7.21
Cooperative----------------------- 10 7,010,746 701,075 162,881 | 16,288 2.32
Over $1,000,000------------------------ 10 18, 577, 123 1,857,712 622,019 62,202 - 3.35
Independent---------------------- 4 4,077, 149 | 1,019, 287 456, 461 |114, 115 11.20
Line------------------------------ 2 2,927,497 | 1,463,749 | 101,652 50,826 3.47
Cooperative----------------------- 4 11, 572, 477 2,893, 119 63,906 | 15,977 . 55
TABLE 5.—CooFERATIVE ELEVATORS 1 REPORTING GRAIN SALES SEPARATELY,
1929–BY SIZE OF BUSINESS, NUMBER, SALES, AND EXPENSES
SALES OF GRAIN 2 EXPENSES
£er 0
SIZE OF BUSINESS C00per- Average Average Percent
atives amount per COOP Total Per COOP of sales
erative erative
Total----------------------------- 1, 389 $202,698,464 $145,931 $7,897,639 $5,686 3.90
$20,000 and under--------------------- 37 341, 130 9, 220 81,413 2,200 28.87
$20,001–$50,000------------------------- 134 4, 103,007 30,619 424, 108 3, 165 10.34
,001-$100,000------------------------ 315 19, 574,977 62, 143 1,384, 157 4,394 7. 07
$100,001–$200,000----------------------- 533 64,775,993 121,531 2,877, 151 5,398 4. 44
,001-$300,000----------------------- 206 43,083,651 209,144 1, 532,404 7,439 3.56
,001-$400,000----------------------- 98 29,822,364 304,310 877,215 8,951 2.94
$400,001–$500,000----------------------- 33 13,216,790 400, 509 287, 125 8,701 2.17
$500,001–$750,000----------------------- 25 13,398,072 535,923 320,795 12,832 2. 39
$750,001–$1,000,000--------------------- 4 2,810, 003 702,501 49, 365 12,341 1.76
Over $1,000,000------------------------ 4 11,572,477 2,893, 119 63,906 15,977 . 55
1Includes only those grain cooperatives which definitely reported operating an elevator and which either
sold only grain or reported retail sales separately.
* Does not include sales at retail or purchases of feed, fertilizer, implements, coal, and other supplies for
members.

TABLE6.–GRAINCoopFRATIVEs—NUMBER,MEMBERSHIP,ANDSALES,1929,BYSTATES
[(x)isusedtopreventdisclosureofindividualoperations]
*#MEMBERSHIPREPORTEDs',SALESTODEALERS
Members--Cooperativesselling STATE-Esti-'#grainandother
Num-Num:matedgrain,exclusivelycommodities
Total|Eleva|Other|berofAver-||berofnumber-torsCoopageDerCoop-ofmem
eratives.Number|'eratives"'"|Num.Num-saleserativeberSalesberales
UnitedStates-------------------------------------------3,0082,5414671,882264,8711411,126158,7661,615$254,058,02121,393||$215,174,432
Arkānsas-----------------------------------------------------1--------11245--------|--------|----------|----------------------1(x)California----------------------------------------------------1--------11150l--------|--------|------------------|--------------1(X)
Colorado-----------------------------------------------------36288213,323158152,370183,056,005183,492,287
!daho--------------------------------------------------------6--------64361453485--------|--------------61,829,106
!llinois-------------------------------------------------------3632937181|19,96811018220,020257|40,321,957:10614,823,669Indiana------------------------------------------------------75518414,947121323,872454,512,5862,986,853
Iowa---------------------------------------------------------336276223131,54913710514,38522632,119,42111024,509,718
£ansas-------------------------------------------------------35131536280|60,924218715,47828664,008,00911,533,167
Louisiana----------------------------------------------------2--------211818118|----------------------2X)|Maryland----------------------------------------------------21--------2--------|----------|--------2----------1(x)1(X)
Michigan----------------------------------------------------80651560|10,261171203,42014622,029669,279,996
Minnesota---------------------------------------------------3022663618222,24112212014,640857,768,20321724,517,910
Missouri-----------------------------------------------------744727374,27116374,292261,812,510484,527,199 Montana----------57498395,144132182,376192,685,835388,260,007Nebraska------3112664523526,139111768,43623136,272,1618019,795,951
NorthDakota------------------------------------------------4294131622324,12510820622,248859,618,34534448,946,771
Ohio---------------------------------------------------------147129186813,593200715,800836,423,3327,916,231
Oklahoma---------------------------------------------------9261316811,519169|244,056809,056,038123,265,446
Oregon-------------------------------------------------------75231073641444573,5733279,000
SouthCarolina----------------------------------------------11----------------|------------------1----------|--------|--------------1(x)
SouthDakota------------------------------------------------2662382818223,2531288410,75210110,602,00816521,602,562
Texas--------------------------------------------------------3521141291476231,748255,588,512104,848,980
Washington--------------------------------------------------2261681,085136141,224,296,646--------|--------------
WestVirginia------------------------------------------------221--------|--------|------------------2----------2x)--------|--------------
Wisconsin----------------------------------------------------1055565213056505637,8515409,427
Wyoming----------------------------------------------------22--------------------------|--------2--------------------------------|2(X)
|
-
1“Total”includesallgraincooperativesforwhichreportswerereceived.“Elevators”includeonlythosedefinitelyreportinganelevator.Anumberofthoselistedunder
“Other”nodoubtalsooperatedelevators.--
2Includes179cooperativessellinggrainandlivestockexclusively,withsalesamountingto$41,733,241.
$

TABLE
7.—WHOLESALE
TRADE
INGRAIN,
1929,
BY
STATES
ALL
TYPES
DEALERS
AGENTS
AND
BROKERS
STATE
lEmploy-
Salaries
and
Num
Number
Sales
ees
Wages
Expenses
Number
Sales
ber
Sales
United
States
total----------------------------------------
1,174
$2,573,
823,
162
12,099
$26,659,217
|$58,627,813
972
$2,165,413,
128
202
|| $408,410,034
Alabama------------------------------------------------------
24
8,090,312
173
270,791
505,
149
15
6,027,733
9 2,062,
579
Arizona-------------------------------------------------------
5
*
21
24,
108
51,412
4621,258
1 21, Arkansas------------------------------------------------------
41,108,624
32
36,803
71,050
2716,061
2392,563
California-----------------------------------------------------
55
62,351,056
282
605,733
1,458,
311
40
50,628,403
15
11,722,653
Colorado------------------------------------------------------
16
23,056,624
120
210,394
55,870
15
23,000,624
156,000
Connecticut---------------------------------------------------
10
2,404,
655
112
138,612
263,470
92,388,655
1 16,000
District
of
Columbia------------------------------------------
2,000
13
17,
150
26,868
2,000
--------|--------------
Florida--------------------------------------------------------
11
4,362,997
83
122,492
246,959
83,145,366
3 1,217,631
Georgia-------------------------------------------------------
1390,
1 1,140
||----------|----------------
1390,800
Idaho---------------------------------------------------------
24,371,054
73
101,
161
268,465
24,371,054
--------|--------------
Illinois--------------------------------------------------------
92
280,
106,894
1,621
3,647,048
9,270,994
67
219,554,497
25
60,552,
397
Indiana-------------------------------------------------------
47
64,400,045
98,
7,142
42
56,253,122
5 8,146,923
Iowa----------------------------------------------------------
34
45,907,
500
326
602,273
1,354,
272
28
42,185,291
63,722,
209 Kansas--------------------------------------------------------
68
220,008,986
396
964,549
2,305,334
62
202,918,291
617,090,695
Kentucky-----------------------------------------------------
14
5,776,030
131
177,426
411,898
14
5,776,030
--------|--------------
Louisiana-----
629,946,765
47
157,
593
1,615,827
6,946,765
--------|--------------
Maine------
84,941,
837
68
123,947
225,536
73,438,087
11,503,
750
Maryland-------
20
15,
383,510
85
163,066
304,
134
15
10,
103,612
55,279,
898
Massachusetts------------------------------------------------
27
27,
288,867
256
418,749
901,
582
21
21,054,205
66,234,662
Michigan-----------------------------------------------------
11
7,694,
115
150
179,651
298,246
11
7,694,115
--------|--------------
Minnesota----------------------------------------------------
121
371,441,715
1,585
3,947,593
9,614,354
114
362,068,732
7 9,372,983
Mississippi----------------------------------------------------
2 136,294
----------|--------------
19,751
||----------|----------------
2,294
Missouri------------------------------------------------------
105
381,
540,
567
1,140
2,695,742
7,375,821
85
312,916,668
20
68,623,899
Montana------------------------------------------------------
11
7,451,
109
80
136,
131
12,034
11
7,451,
109
--------|--------------
Nebraska-----------------------------------------------------
45
121,912,935
436
1,026,749
2,913,
544
39
100,457,307
621,455,628
Nevada-------------------------------------------------------
298,646
13
28,697
51,208
298,646
--------|--------------
New
Hampshire----------------------------------------------
41,597,
598
34
41,323
98,622
41,597,
598
|--------|--------------
New
Jersey---------------------------------------------------
93,287,267
89
172,998
278,051
9 3,287,267
--------|--------------
New
Mexico.--------------------------------------------------
1872,957
12
11,629
31,569
1872,957
--------|--------------
New
York----------------------------------------------------
82
459,449,
172
515
1,618,451
4,521,
107
64
313,
191,013
18
146,258,
159
North
Carolina-----------------------------------------------
15
,005,
53
74,855
138,563
73,377,205
8 1,628,628
North
Dakota------------------------------------------------
1 544,
134
13,000
8,192
1 ,134
----------------------
Ohio----------------------------------------------------------
37
39,
513,355
1,394
961,
586
2,229,978
30
35,667,469
73,845,886
Oklahoma-----------------------------------------------------
28
24,982,612
174
252,828
694,
141
26
24,
170,
152
2812,460
Oregon-------------------------------------------------------
25
52,
182,995
390
438,684
1,188,722
21
48,747,195
43,435,800
Pennsylvania-------------------------------------------------
32
23,
151,849
136
241,706
511,222
|| 25
||14,
537,318
78,614,
531
#

Rhode
Island-----------------------------------
-------------
22,344,010
42
59,667
94,543
||22,344,010
--------|--------------
South
Carolina------------------------------------------------
8 1,155,788
26
28,756
85,598
6715,288
2440,
500
South
Dakota-----
---
74,340,900
69
129,768
271,558
63,195,765
11,145,
135
Tennessee-----------------------------------------------------
18
12,
130,
221
297,517
800,588
16
11,405,298
2,106
Texas---------------------------------------------------------
77
115,430,024
650
4,498,763
2,525,840
65
106,292,869
12
9,137,
155
Utah----------------------------------------------------------
62,564,174
38
57,958
127,257
51,484,
174
11,080,000
Vermont------------------------------------------------------
2,920
12
19,516
33,641
2745,920
--------|--------------
Virginia-------------------------------------------------------
24
5,172,145
108
173,
136
391,767
15
2,753,080
92,419,065
Washington---------------------------------------------------
27
68,608,000
170
455,648
865,447
22
58,752,477
59,855,
523 West
Virginia-------------------------------------------------
31,341,465
58
90,429
238,679
31,341,465
--------|--------------
Wisconsin-----------------------------------------------------
23
57,782,565
383
735,897
2,162,357
21
56,769,843
21,012,722
O
&